kpi report for retail chain stores in china - fung group · kpi report for retail chain stores in...
TRANSCRIPT
Li & Fung Research Centre China Chain Store & Franchise Association Member of the Li & Fung Group
1
2011 Q1
LI & FUNG RESEARCH CENTRE
CHINA CHAIN STORE & FRANCHISE ASSOCIATION
KPI report for retail chain stores in China
Foreword
About the KPI report
The China Chain Store & Franchise Association and the Li & Fung Research Centre have collaborated and established
the Key Performance Index System (hereafter the “KPI system”) for retail chain operators in China since 2007 and
published reports on a quarterly basis. The system aims to collect key performance indices of different format retail
stores in China.
In 2009, the data collection system are further upgraded and revised, and more store samples have been added. The
revised KPI report covers over 100 retail stores in China of 5 major formats, including convenience stores, supermarkets,
hypermarkets, department stores and home electronics appliance chains, of which supermarkets and hypermarkets are
further divided into several categories by operating area for easier references. We hope this report can shed some light
on the key development trends of China's retail chain stores.
About the indicators
Data of the following is collected in the KPI system –
1. Monthly sales (月度銷售額) – Pre-tax monthly sales value
2. Total operating area (總營業面積) – Including self-operating area and leasing area
3. Leasing area (對外租賃面積) – Area leased to other operators
4. Total staff number (員工總數) – Total number of staff including dispatched employees hired by labor agents (勞務派遣人員)
5. Total number of contract staff (正式員工數) – Total number of staff hired directly by the retailers
6. Total operating cost (成本及費用總額)
7. Total salaries and wages (工資總額)
8. Total number of SKUs (單品總數)
9. Number of SKUs distributing directly through the distribution centre (統一配送單品數)
10. Average daily number of transactions (平均日交易數)
11. Inventory turnover days (庫存周轉天數)
12. Non-operating income (營業外收入) – Income derived from activities other than sales of goods
Li & Fung Research Centre China Chain Store & Franchise Association Member of the Li & Fung Group
2
2011 Q1
LI & FUNG RESEARCH CENTRE
CHINA CHAIN STORE & FRANCHISE ASSOCIATION
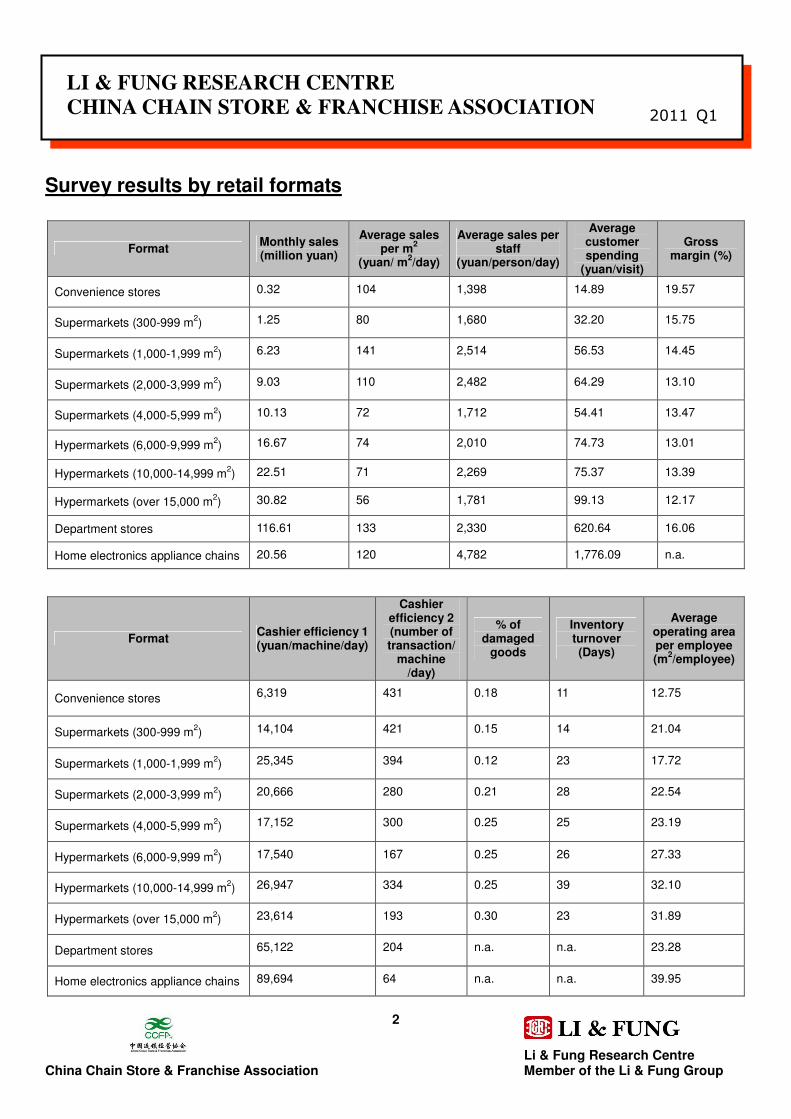
Survey results by retail formats
Format Monthly sales (million yuan)
Average sales per m
2
(yuan/ m2/day)
Average sales per staff
(yuan/person/day)
Average customer spending
(yuan/visit)
Gross margin (%)
Convenience stores 0.32 104 1,398 14.89 19.57
Supermarkets (300-999 m2) 1.25 80 1,680 32.20 15.75
Supermarkets (1,000-1,999 m2) 6.23 141 2,514 56.53 14.45
Supermarkets (2,000-3,999 m2) 9.03 110 2,482 64.29 13.10
Supermarkets (4,000-5,999 m2) 10.13 72 1,712 54.41 13.47
Hypermarkets (6,000-9,999 m2) 16.67 74 2,010 74.73 13.01
Hypermarkets (10,000-14,999 m2) 22.51 71 2,269 75.37 13.39
Hypermarkets (over 15,000 m2) 30.82 56 1,781 99.13 12.17
Department stores 116.61 133 2,330 620.64 16.06
Home electronics appliance chains 20.56 120 4,782 1,776.09 n.a.
Format Cashier efficiency 1 (yuan/machine/day)
Cashier efficiency 2 (number of transaction/
machine /day)
% of damaged
goods
Inventory turnover (Days)
Average operating area per employee (m
2/employee)
Convenience stores 6,319 431 0.18 11 12.75
Supermarkets (300-999 m2) 14,104 421 0.15 14 21.04
Supermarkets (1,000-1,999 m2) 25,345 394 0.12 23 17.72
Supermarkets (2,000-3,999 m2) 20,666 280 0.21 28 22.54
Supermarkets (4,000-5,999 m2) 17,152 300 0.25 25 23.19
Hypermarkets (6,000-9,999 m2) 17,540 167 0.25 26 27.33
Hypermarkets (10,000-14,999 m2) 26,947 334 0.25 39 32.10
Hypermarkets (over 15,000 m2) 23,614 193 0.30 23 31.89
Department stores 65,122 204 n.a. n.a. 23.28
Home electronics appliance chains 89,694 64 n.a. n.a. 39.95
Li & Fung Research Centre China Chain Store & Franchise Association Member of the Li & Fung Group
3
2011 Q1
LI & FUNG RESEARCH CENTRE
CHINA CHAIN STORE & FRANCHISE ASSOCIATION
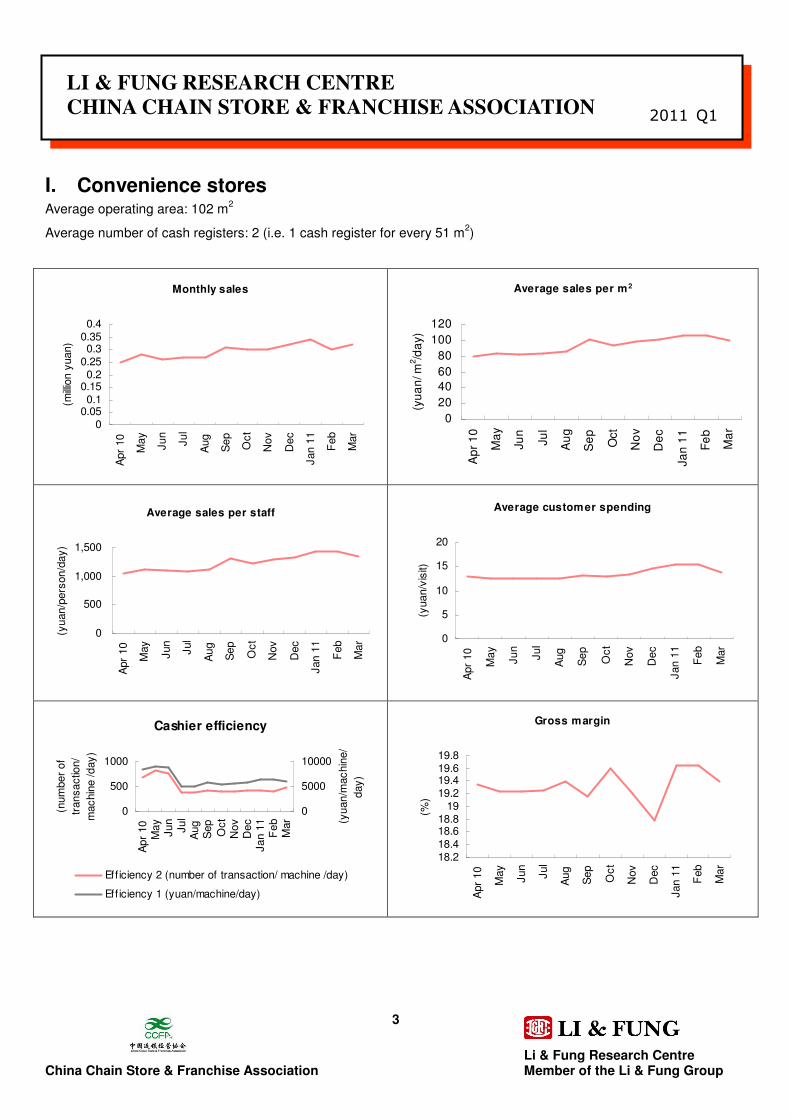
I. Convenience stores Average operating area: 102 m
2
Average number of cash registers: 2 (i.e. 1 cash register for every 51 m2)
Monthly sales
00.050.1
0.150.2
0.250.3
0.350.4
Apr
10
May
Jun
Jul
Aug
Sep
Oct
Nov
Dec
Jan 1
1
Feb
Mar
(millio
n y
uan)
Average sales per m2
0
20
40
60
80
100
120
Ap
r 1
0
Ma
y
Ju
n
Ju
l
Au
g
Se
p
Oct
No
v
De
c
Ja
n 1
1
Fe
b
Ma
r
(yu
an
/ m2/d
ay)
Average sales per staff
0
500
1,000
1,500
Apr
10
May
Jun
Jul
Aug
Sep
Oct
Nov
Dec
Jan 1
1
Feb
Mar
(yuan/p
ers
on/d
ay)
Average customer spending
0
5
10
15
20
Apr
10
May
Jun
Jul
Aug
Sep
Oct
Nov
Dec
Jan 1
1
Feb
Mar
(yuan/v
isit)
Cashier efficiency
0
500
1000
Apr
10
May
Jun
Jul
Aug
Sep
Oct
Nov
Dec
Jan 1
1F
eb
Mar
(num
ber
of
transactio
n/
machin
e /day)
0
5000
10000
(yuan/m
achin
e/
day)
Eff iciency 2 (number of transaction/ machine /day)
Eff iciency 1 (yuan/machine/day)
Gross margin
18.218.418.618.8
1919.219.419.619.8
Apr
10
May
Jun
Jul
Aug
Sep
Oct
Nov
Dec
Jan 1
1
Feb
Mar
(%)
Li & Fung Research Centre China Chain Store & Franchise Association Member of the Li & Fung Group
4
2011 Q1
LI & FUNG RESEARCH CENTRE
CHINA CHAIN STORE & FRANCHISE ASSOCIATION
Jan 11 Feb 11 Mar 11 Average yoy %
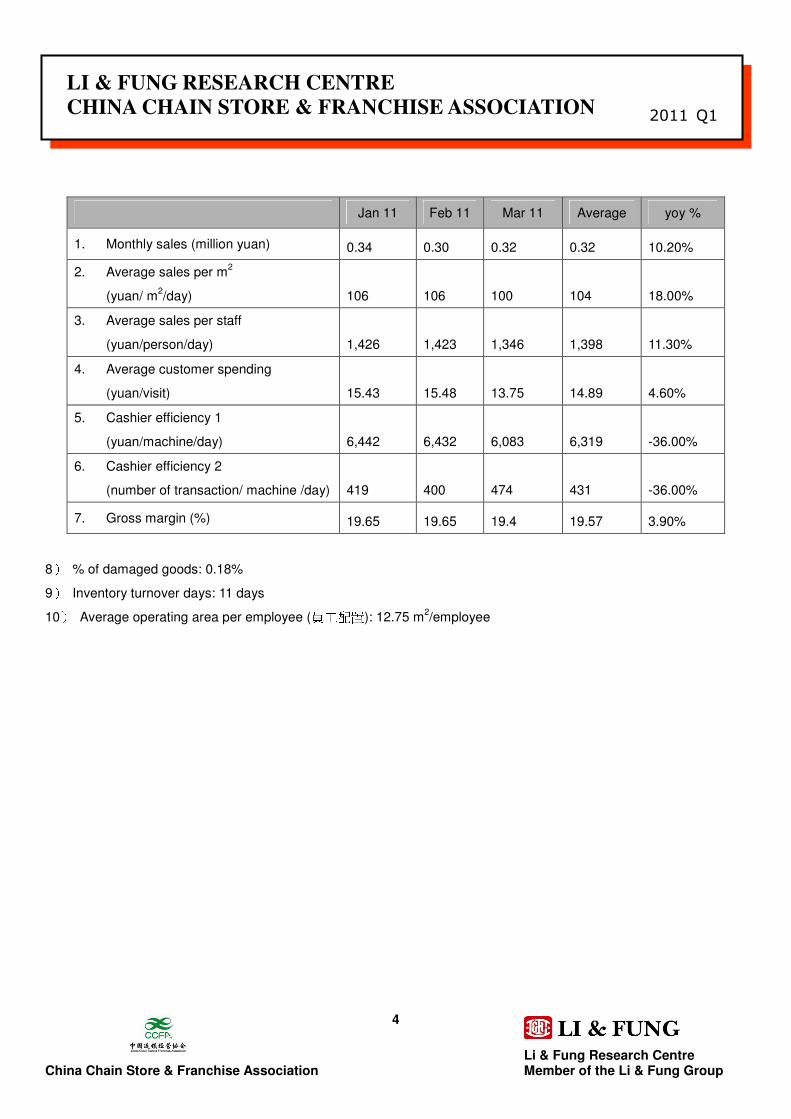
1. Monthly sales (million yuan) 0.34 0.30 0.32 0.32 10.20%
2. Average sales per m2
(yuan/ m2/day) 106 106 100 104 18.00%
3. Average sales per staff
(yuan/person/day) 1,426 1,423 1,346 1,398 11.30%
4. Average customer spending
(yuan/visit) 15.43 15.48 13.75 14.89 4.60%
5. Cashier efficiency 1
(yuan/machine/day) 6,442 6,432 6,083 6,319 -36.00%
6. Cashier efficiency 2
(number of transaction/ machine /day) 419 400 474 431 -36.00%
7. Gross margin (%) 19.65 19.65 19.4 19.57 3.90%
8) % of damaged goods: 0.18%
9) Inventory turnover days: 11 days
10) Average operating area per employee (員工配置): 12.75 m2/employee
Li & Fung Research Centre China Chain Store & Franchise Association Member of the Li & Fung Group
5
2011 Q1
LI & FUNG RESEARCH CENTRE
CHINA CHAIN STORE & FRANCHISE ASSOCIATION
II. Supermarkets (divided into 4 groups according to operating area)
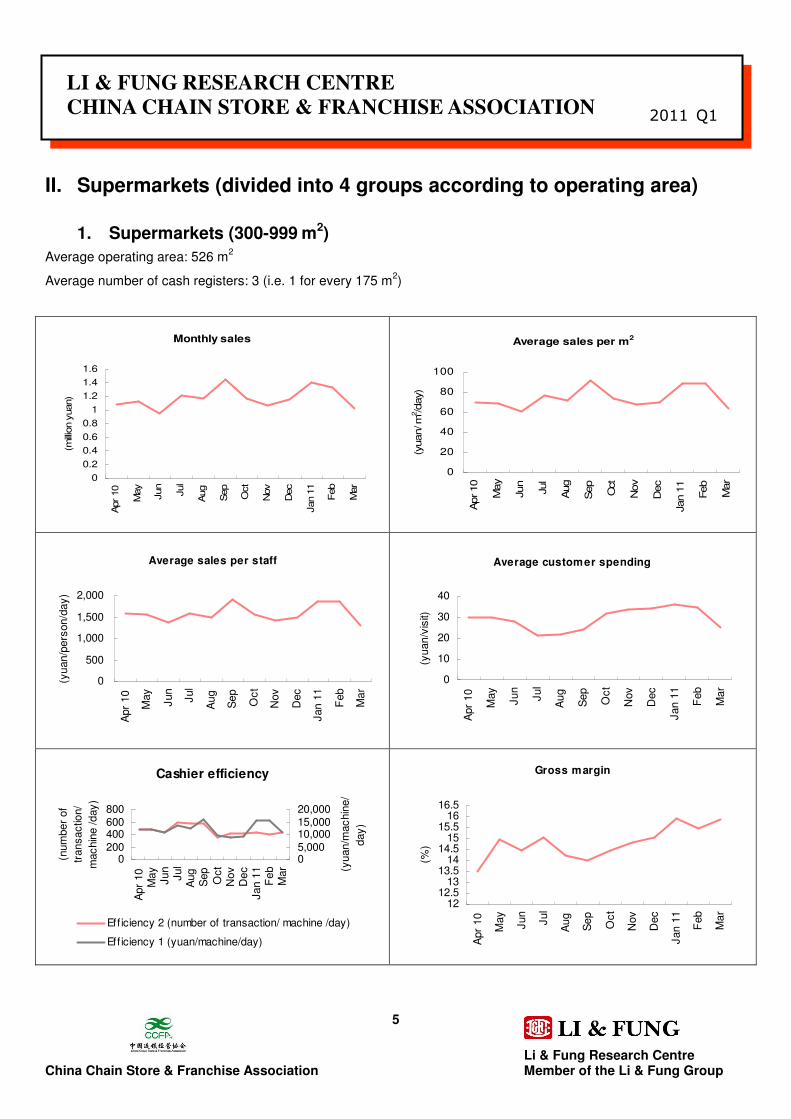
1. Supermarkets (300-999 m2)
Average operating area: 526 m2
Average number of cash registers: 3 (i.e. 1 for every 175 m2)
Monthly sales
0
0.2
0.4
0.6
0.8
1
1.2
1.4
1.6
Apr 10
May
Jun
Jul
Aug
Sep
Oct
Nov
Dec
Jan 1
1
Feb
Mar
(millio
n y
uan)
Average sales per m2
0
20
40
60
80
100
Apr 10
May
Jun
Jul
Aug
Sep
Oct
Nov
Dec
Jan 1
1
Feb
Mar
(yuan/ m
2/d
ay)
Average sales per staff
0
500
1,000
1,500
2,000
Apr
10
May
Jun
Jul
Aug
Sep
Oct
Nov
Dec
Jan 1
1
Feb
Mar
(yuan/p
ers
on/d
ay)
Average customer spending
0
10
20
30
40
Apr
10
May
Jun
Jul
Aug
Sep
Oct
Nov
Dec
Jan 1
1
Feb
Mar
(yuan/v
isit)
Cashier efficiency
0200400600800
Apr
10
May
Jun
Jul
Aug
Sep
Oct
Nov
Dec
Jan 1
1F
eb
Mar
(num
ber
of
transactio
n/
machin
e /day)
05,00010,00015,00020,000
(yuan/m
achin
e/
day)
Eff iciency 2 (number of transaction/ machine /day)
Eff iciency 1 (yuan/machine/day)
Gross margin
1212.5
1313.5
1414.5
1515.5
1616.5
Apr
10
May
Jun
Jul
Aug
Sep
Oct
Nov
Dec
Jan 1
1
Feb
Mar
(%)
Li & Fung Research Centre China Chain Store & Franchise Association Member of the Li & Fung Group
6
2011 Q1
LI & FUNG RESEARCH CENTRE
CHINA CHAIN STORE & FRANCHISE ASSOCIATION
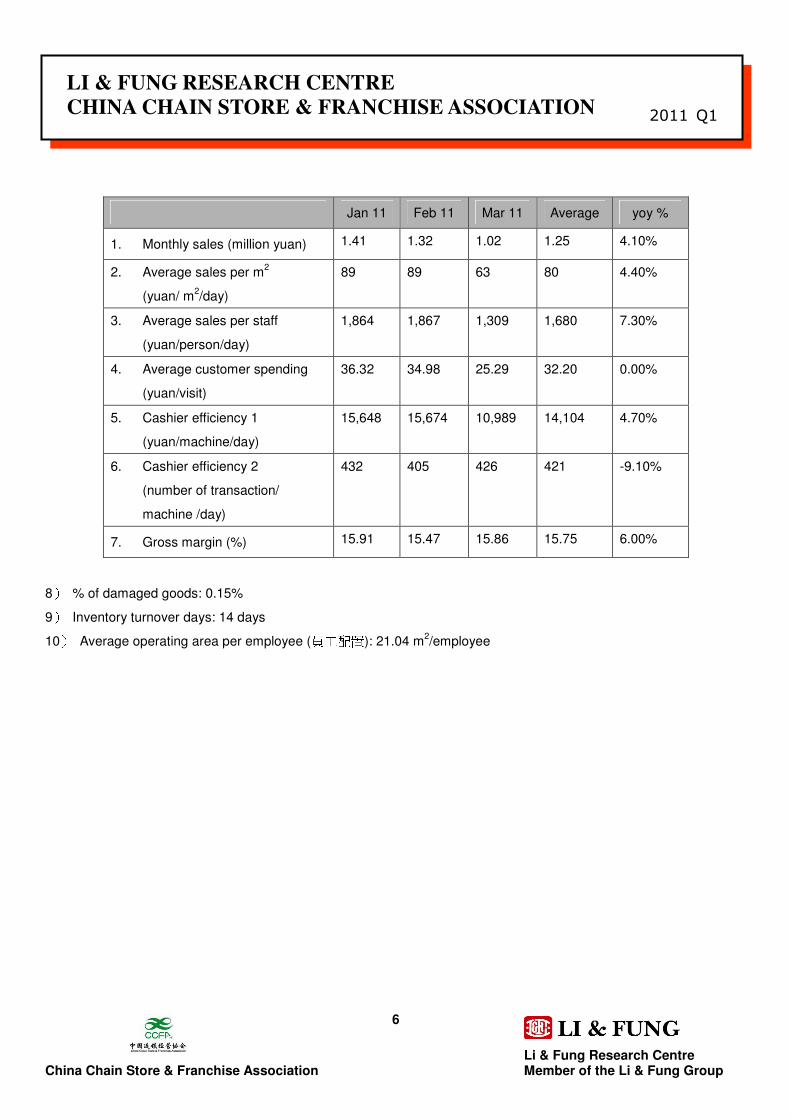
Jan 11 Feb 11 Mar 11 Average yoy %
1. Monthly sales (million yuan) 1.41 1.32 1.02 1.25 4.10%
2. Average sales per m2
(yuan/ m2/day)
89 89 63 80 4.40%
3. Average sales per staff
(yuan/person/day)
1,864 1,867 1,309 1,680 7.30%
4. Average customer spending
(yuan/visit)
36.32 34.98 25.29 32.20 0.00%
5. Cashier efficiency 1
(yuan/machine/day)
15,648 15,674 10,989 14,104 4.70%
6. Cashier efficiency 2
(number of transaction/
machine /day)
432 405 426 421 -9.10%
7. Gross margin (%) 15.91 15.47 15.86 15.75 6.00%
8) % of damaged goods: 0.15%
9) Inventory turnover days: 14 days
10) Average operating area per employee (員工配置): 21.04 m2/employee
Li & Fung Research Centre China Chain Store & Franchise Association Member of the Li & Fung Group
7
2011 Q1
LI & FUNG RESEARCH CENTRE
CHINA CHAIN STORE & FRANCHISE ASSOCIATION
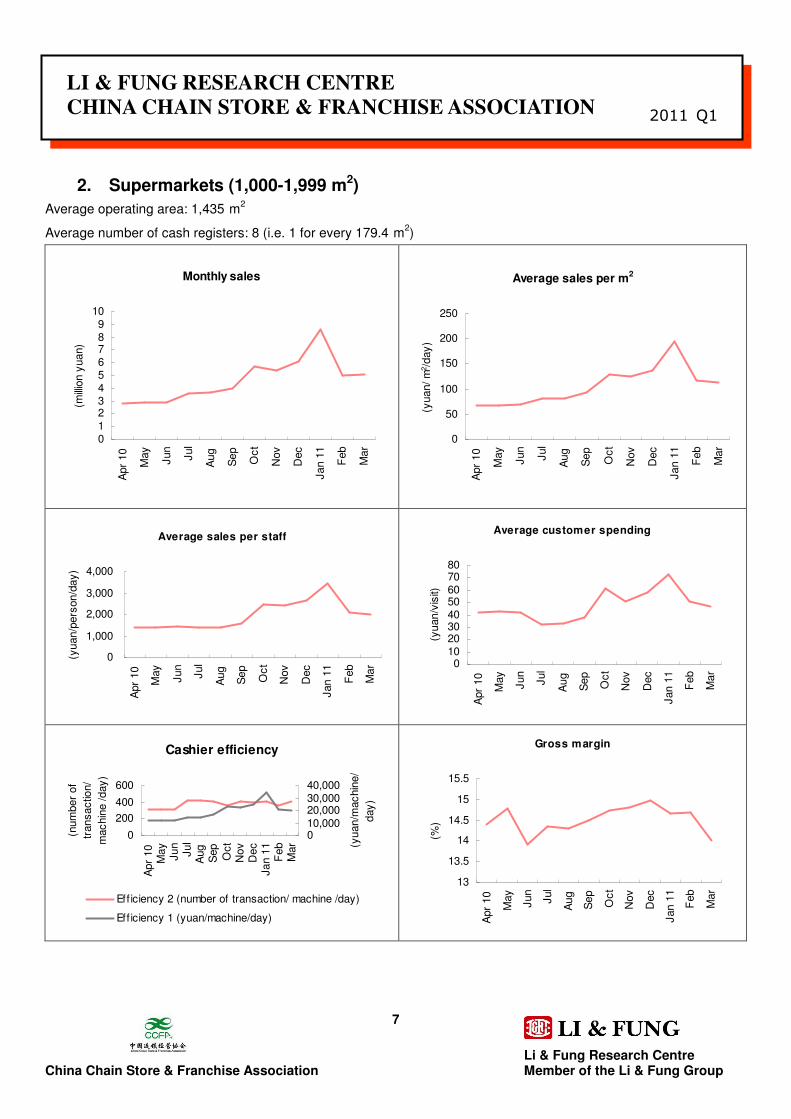
2. Supermarkets (1,000-1,999 m2)
Average operating area: 1,435 m2
Average number of cash registers: 8 (i.e. 1 for every 179.4 m2)
Monthly sales
0123456789
10
Apr
10
May
Jun
Jul
Aug
Sep
Oct
Nov
Dec
Jan 1
1
Feb
Mar
(millio
n y
uan)
Average sales per m2
0
50
100
150
200
250
Apr
10
May
Jun
Jul
Aug
Sep
Oct
Nov
Dec
Jan 1
1
Feb
Mar
(yuan/ m
2/d
ay)
Average sales per staff
0
1,000
2,000
3,000
4,000
Apr
10
May
Jun
Jul
Aug
Sep
Oct
Nov
Dec
Jan 1
1
Feb
Mar
(yuan/p
ers
on/d
ay)
Average customer spending
01020304050607080
Apr
10
May
Jun
Jul
Aug
Sep
Oct
Nov
Dec
Jan 1
1
Feb
Mar
(yuan/v
isit)
Cashier efficiency
0
200
400
600
Apr
10
May
Jun
Jul
Aug
Sep
Oct
Nov
Dec
Jan 1
1F
eb
Mar
(num
ber
of
transactio
n/
machin
e /day)
010,00020,00030,00040,000
(yuan/m
achin
e/
day)
Eff iciency 2 (number of transaction/ machine /day)
Eff iciency 1 (yuan/machine/day)
Gross margin
13
13.5
14
14.5
15
15.5
Apr
10
May
Jun
Jul
Aug
Sep
Oct
Nov
Dec
Jan 1
1
Feb
Mar
(%)
Li & Fung Research Centre China Chain Store & Franchise Association Member of the Li & Fung Group
8
2011 Q1
LI & FUNG RESEARCH CENTRE
CHINA CHAIN STORE & FRANCHISE ASSOCIATION
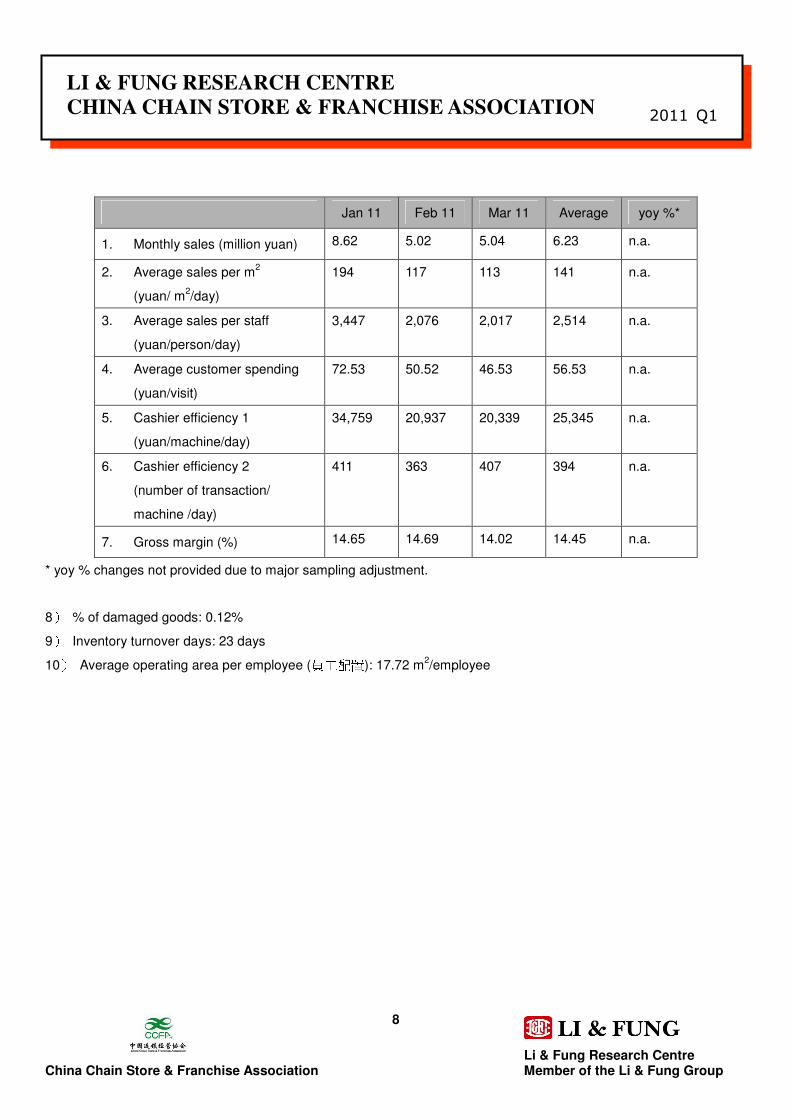
Jan 11 Feb 11 Mar 11 Average yoy %*
1. Monthly sales (million yuan) 8.62 5.02 5.04 6.23 n.a.
2. Average sales per m2
(yuan/ m2/day)
194 117 113 141 n.a.
3. Average sales per staff
(yuan/person/day)
3,447 2,076 2,017 2,514 n.a.
4. Average customer spending
(yuan/visit)
72.53 50.52 46.53 56.53 n.a.
5. Cashier efficiency 1
(yuan/machine/day)
34,759 20,937 20,339 25,345 n.a.
6. Cashier efficiency 2
(number of transaction/
machine /day)
411 363 407 394 n.a.
7. Gross margin (%) 14.65 14.69 14.02 14.45 n.a.
* yoy % changes not provided due to major sampling adjustment.
8) % of damaged goods: 0.12%
9) Inventory turnover days: 23 days
10) Average operating area per employee (員工配置): 17.72 m2/employee
Li & Fung Research Centre China Chain Store & Franchise Association Member of the Li & Fung Group
9
2011 Q1
LI & FUNG RESEARCH CENTRE
CHINA CHAIN STORE & FRANCHISE ASSOCIATION
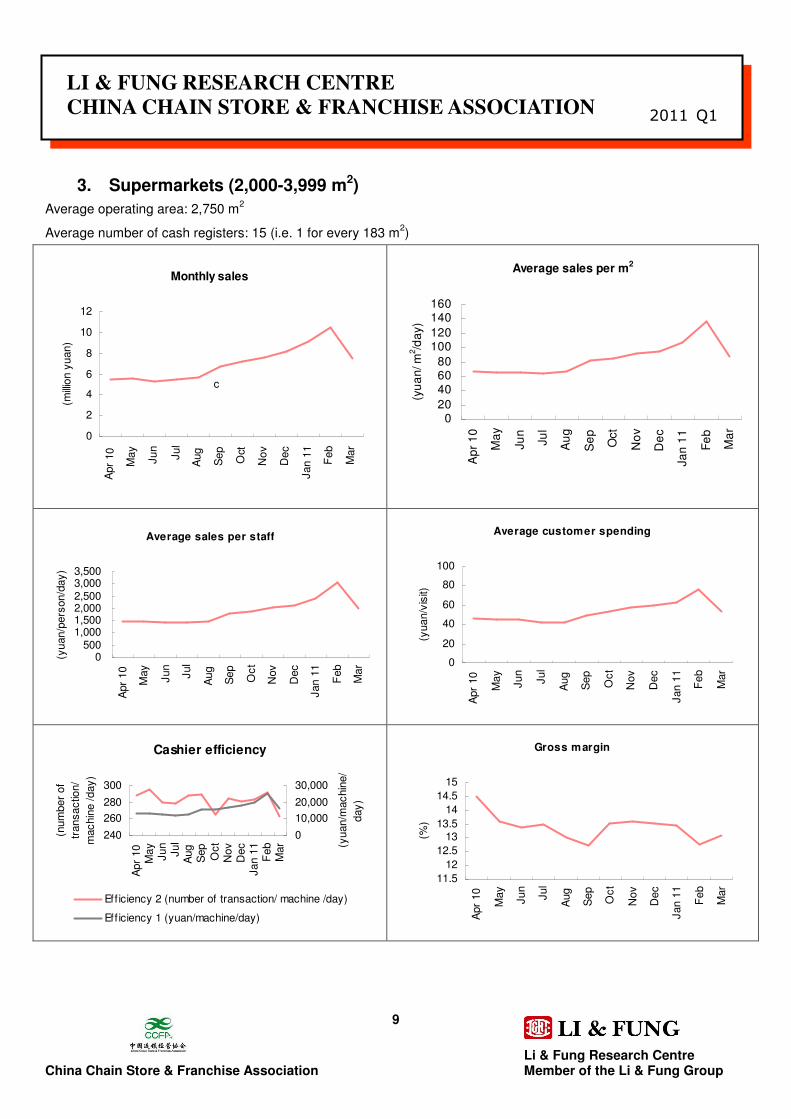
3. Supermarkets (2,000-3,999 m2)
Average operating area: 2,750 m2
Average number of cash registers: 15 (i.e. 1 for every 183 m2)
Monthly sales
0
2
4
6
8
10
12
Apr
10
May
Jun
Jul
Aug
Sep
Oct
Nov
Dec
Jan 1
1
Feb
Mar
(millio
n y
uan)
c
Average sales per m2
020
406080
100120
140160
Ap
r 1
0
Ma
y
Ju
n
Ju
l
Au
g
Se
p
Oct
No
v
De
c
Ja
n 1
1
Fe
b
Ma
r
(yu
an
/ m
2/d
ay)
Average sales per staff
0500
1,0001,5002,0002,5003,0003,500
Apr
10
May
Jun
Jul
Aug
Sep
Oct
Nov
Dec
Jan 1
1
Feb
Mar
(yuan/p
ers
on/d
ay)
Average customer spending
0
20
40
60
80
100
Apr
10
May
Jun
Jul
Aug
Sep
Oct
Nov
Dec
Jan 1
1
Feb
Mar
(yuan/v
isit)
Cashier efficiency
240
260
280
300
Apr
10
May
Jun
Jul
Aug
Sep
Oct
Nov
Dec
Jan 1
1F
eb
Mar
(num
ber
of
transactio
n/
machin
e /day)
0
10,000
20,000
30,000
(yuan/m
achin
e/
day)
Eff iciency 2 (number of transaction/ machine /day)
Eff iciency 1 (yuan/machine/day)
Gross margin
11.5
12
12.5
1313.5
14
14.5
15
Apr
10
May
Jun
Jul
Aug
Sep
Oct
Nov
Dec
Jan 1
1
Feb
Mar
(%)

Li & Fung Research Centre China Chain Store & Franchise Association Member of the Li & Fung Group
10
2011 Q1
LI & FUNG RESEARCH CENTRE
CHINA CHAIN STORE & FRANCHISE ASSOCIATION
Jan 11 Feb 11 Mar 11 Average yoy %
1. Monthly sales (million yuan) 9.11 10.47 7.50 9.03 14.70%
2. Average sales per m2
(yuan/ m2/day)
107 136 88 110 13.70%
3. Average sales per staff
(yuan/person/day)
2,405 3,061 1,979 2,482 23.30%
4. Average customer spending
(yuan/visit)
62.44 76.57 53.87 64.29 12.30%
5. Cashier efficiency 1
(yuan/machine/day)
20,027 25,489 16,481 20,666 4.30%
6. Cashier efficiency 2
(number of transaction/
machine /day)
283 292 263 280 -14.70%
7. Gross margin (%) 13.45 12.75 13.10 13.10 -9.20%
8) % of damaged goods: 0.21%
9) Inventory turnover days: 28 days
10) Average operating area per employee (員工配置): 22.54 m2/employee
Li & Fung Research Centre China Chain Store & Franchise Association Member of the Li & Fung Group
11
2011 Q1
LI & FUNG RESEARCH CENTRE
CHINA CHAIN STORE & FRANCHISE ASSOCIATION
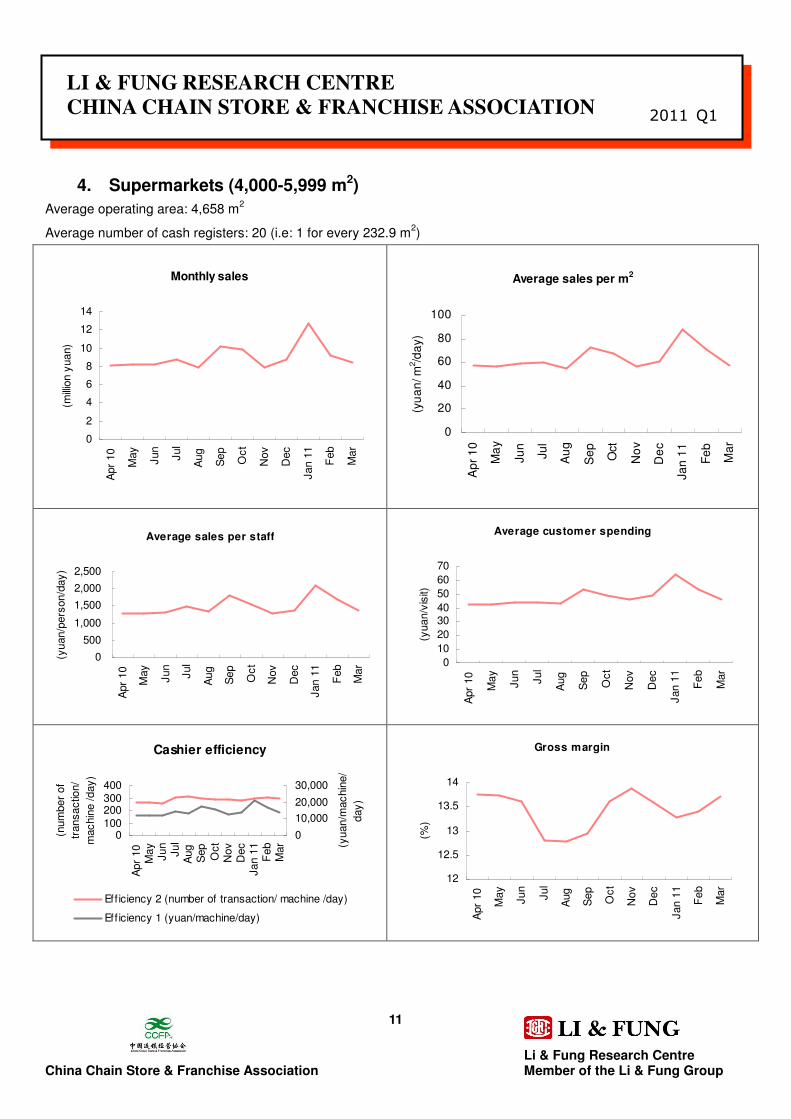
4. Supermarkets (4,000-5,999 m2)
Average operating area: 4,658 m2
Average number of cash registers: 20 (i.e: 1 for every 232.9 m2)
Monthly sales
0
2
4
6
8
10
12
14
Apr
10
May
Jun
Jul
Aug
Sep
Oct
Nov
Dec
Jan 1
1
Feb
Mar
(millio
n y
uan)
Average sales per m2
0
20
40
60
80
100
Ap
r 1
0
Ma
y
Ju
n
Ju
l
Au
g
Se
p
Oct
No
v
De
c
Ja
n 1
1
Fe
b
Ma
r
(yu
an
/ m
2/d
ay)
Average sales per staff
0
500
1,000
1,500
2,000
2,500
Apr
10
May
Jun
Jul
Aug
Sep
Oct
Nov
Dec
Jan 1
1
Feb
Mar
(yuan/p
ers
on/d
ay)
Average customer spending
0
10
20
3040
50
60
70
Apr
10
May
Jun
Jul
Aug
Sep
Oct
Nov
Dec
Jan 1
1
Feb
Mar
(yuan/v
isit)
Cashier efficiency
0100200300400
Apr
10
May
Jun
Jul
Aug
Sep
Oct
Nov
Dec
Jan 1
1F
eb
Mar
(num
ber
of
transactio
n/
machin
e /day)
0
10,000
20,000
30,000
(yuan/m
achin
e/
day)
Eff iciency 2 (number of transaction/ machine /day)
Eff iciency 1 (yuan/machine/day)
Gross margin
12
12.5
13
13.5
14
Apr
10
May
Jun
Jul
Aug
Sep
Oct
Nov
Dec
Jan 1
1
Feb
Mar
(%)

Li & Fung Research Centre China Chain Store & Franchise Association Member of the Li & Fung Group
12
2011 Q1
LI & FUNG RESEARCH CENTRE
CHINA CHAIN STORE & FRANCHISE ASSOCIATION
Jan 11 Feb 11 Mar 11 Average yoy %
1. Monthly sales (million yuan) 12.71 9.24 8.42 10.13 -25.60%
2. Average sales per m2
(yuan/ m2/day)
88 71 58 72 -26.80%
3. Average sales per staff
(yuan/person/day)
2,082 1,676 1,379 1,712 -18.70%
4. Average customer spending
(yuan/visit)
64.11 53.24 45.88 54.41 -11.40%
5. Cashier efficiency 1
(yuan/machine/day)
20,853 16,786 13,817 17,152 -9.80%
6. Cashier efficiency 2
(number of transaction/
machine /day)
300 304 295 300 22.90%
7. Gross margin (%) 13.28 13.40 13.72 13.47 7.20%
8) % of damaged goods: 0.25%
9) Inventory turnover days: 25 days
10) Average operating area per employee (員工配置): 23.19 m2/employee
Li & Fung Research Centre China Chain Store & Franchise Association Member of the Li & Fung Group
13
2011 Q1
LI & FUNG RESEARCH CENTRE
CHINA CHAIN STORE & FRANCHISE ASSOCIATION
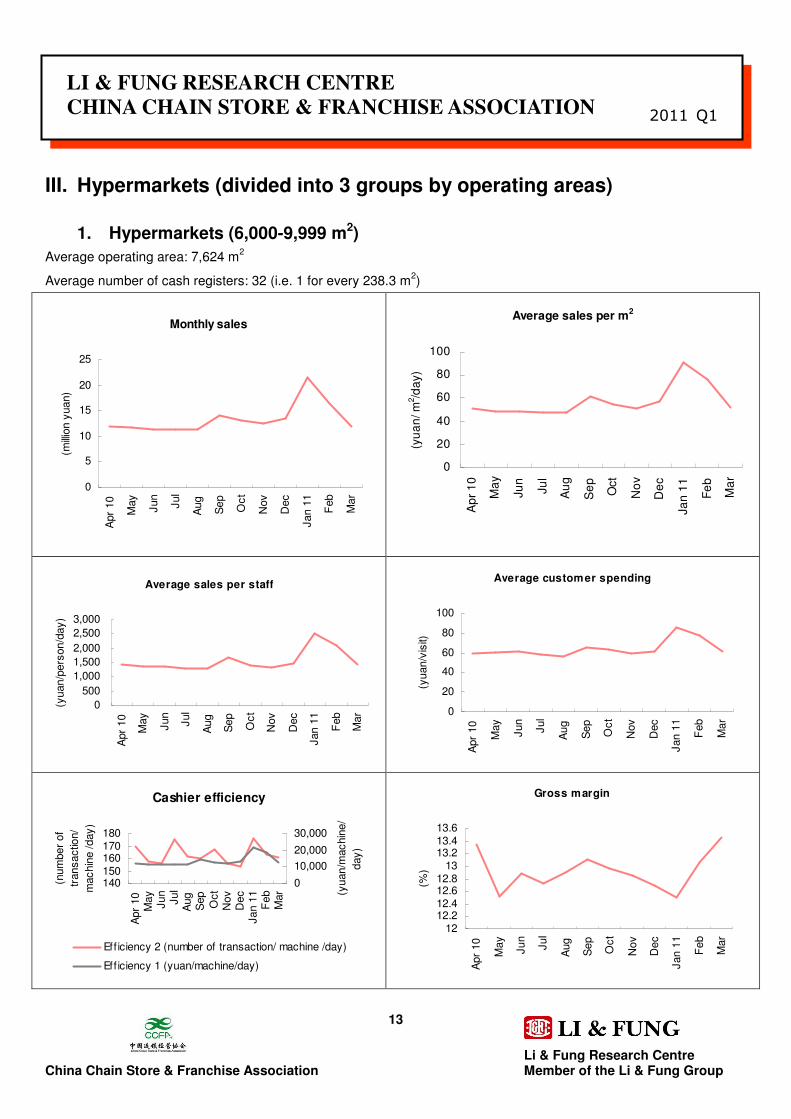
III. Hypermarkets (divided into 3 groups by operating areas)
1. Hypermarkets (6,000-9,999 m2)
Average operating area: 7,624 m2
Average number of cash registers: 32 (i.e. 1 for every 238.3 m2)
Monthly sales
0
5
10
15
20
25
Apr
10
May
Jun
Jul
Aug
Sep
Oct
Nov
Dec
Jan 1
1
Feb
Mar
(millio
n y
uan)
Average sales per m2
0
20
40
60
80
100
Ap
r 1
0
Ma
y
Ju
n
Ju
l
Au
g
Se
p
Oct
No
v
De
c
Ja
n 1
1
Fe
b
Ma
r
(yu
an
/ m
2/d
ay)
Average sales per staff
0
500
1,000
1,500
2,000
2,500
3,000
Apr
10
May
Jun
Jul
Aug
Sep
Oct
Nov
Dec
Jan 1
1
Feb
Mar
(yuan/p
ers
on/d
ay)
Average customer spending
0
20
40
60
80
100
Apr
10
May
Jun
Jul
Aug
Sep
Oct
Nov
Dec
Jan 1
1
Feb
Mar
(yuan/v
isit)
Cashier efficiency
140150160170180
Apr
10
May
Jun
Jul
Aug
Sep
Oct
Nov
Dec
Jan 1
1F
eb
Mar
(num
ber
of
transactio
n/
machin
e /day)
0
10,000
20,000
30,000
(yuan/m
achin
e/
day)
Eff iciency 2 (number of transaction/ machine /day)
Eff iciency 1 (yuan/machine/day)
Gross margin
1212.212.412.612.8
1313.213.413.6
Apr
10
May
Jun
Jul
Aug
Sep
Oct
Nov
Dec
Jan 1
1
Feb
Mar
(%)

Li & Fung Research Centre China Chain Store & Franchise Association Member of the Li & Fung Group
14
2011 Q1
LI & FUNG RESEARCH CENTRE
CHINA CHAIN STORE & FRANCHISE ASSOCIATION
Jan 11 Feb 11 Mar 11 Average yoy %
1. Monthly sales (million yuan) 21.58 16.41 12.01 16.67 -1.90%
2. Average sales per m2
(yuan/m2/day)
91 77 53 74 -1.90%
3. Average sales per staff
(yuan/person/day)
2,495 2,101 1,435 2,010 1.70%
4. Average customer spending
(yuan/visit)
85.48 77.50 61.21 74.73 -0.30%
5. Cashier efficiency 1
(yuan/machine/day)
21,772 18,328 12,521 17,540 5.30%
6. Cashier efficiency 2
(number of transaction/
machine /day)
176 163 161 167 8.40%
7. Gross margin (%) 12.5 13.06 13.46 13.01 -2.90%
8) % of damaged goods: 0.25%
9) Inventory turnover days: 26 days
10) Average operating area per employee (員工配置): 27.33m2/employee
Li & Fung Research Centre China Chain Store & Franchise Association Member of the Li & Fung Group
15
2011 Q1
LI & FUNG RESEARCH CENTRE
CHINA CHAIN STORE & FRANCHISE ASSOCIATION
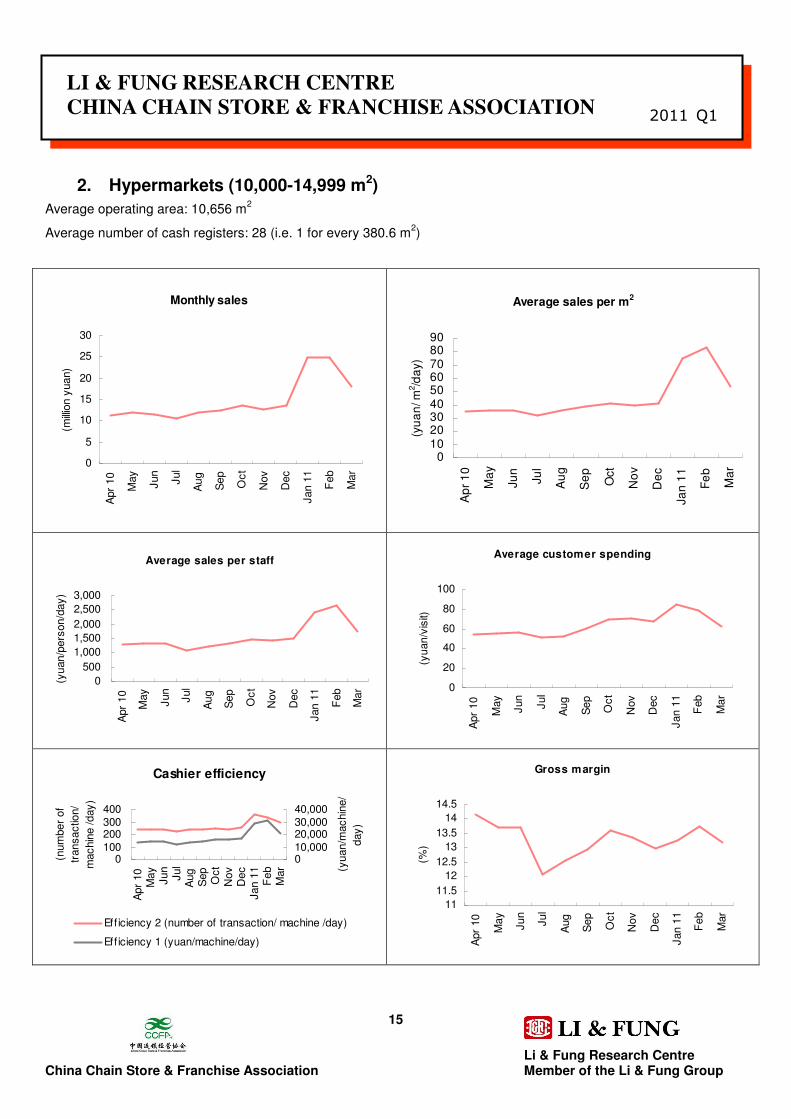
2. Hypermarkets (10,000-14,999 m2)
Average operating area: 10,656 m2
Average number of cash registers: 28 (i.e. 1 for every 380.6 m2)
Monthly sales
0
5
10
15
20
25
30
Apr
10
May
Jun
Jul
Aug
Sep
Oct
Nov
Dec
Jan 1
1
Feb
Mar
(millio
n y
uan)
Average sales per m2
0102030405060708090
Ap
r 1
0
Ma
y
Ju
n
Ju
l
Au
g
Se
p
Oct
No
v
De
c
Ja
n 1
1
Fe
b
Ma
r
(yu
an
/ m2/d
ay)
Average sales per staff
0
500
1,000
1,500
2,000
2,500
3,000
Apr
10
May
Jun
Jul
Aug
Sep
Oct
Nov
Dec
Jan 1
1
Feb
Mar
(yuan/p
ers
on/d
ay)
Average customer spending
0
20
40
60
80
100
Apr
10
May
Jun
Jul
Aug
Sep
Oct
Nov
Dec
Jan 1
1
Feb
Mar
(yuan/v
isit)
Cashier efficiency
0100200300400
Apr
10
May
Jun
Jul
Aug
Sep
Oct
Nov
Dec
Jan 1
1F
eb
Mar
(num
ber
of
transactio
n/
machin
e /day)
010,00020,00030,00040,000
(yuan/m
achin
e/
day)
Eff iciency 2 (number of transaction/ machine /day)
Eff iciency 1 (yuan/machine/day)
Gross margin
11
11.5
12
12.5
13
13.5
14
14.5
Apr
10
May
Jun
Jul
Aug
Sep
Oct
Nov
Dec
Jan 1
1
Feb
Mar
(%)

Li & Fung Research Centre China Chain Store & Franchise Association Member of the Li & Fung Group
16
2011 Q1
LI & FUNG RESEARCH CENTRE
CHINA CHAIN STORE & FRANCHISE ASSOCIATION
Jan 11 Feb 11 Mar 11 Average yoy %
1. Monthly sales (million yuan) 24.80 24.74 17.98 22.51 46.20%
2. Average sales per m2
(yuan/ m2/day)
75 83 54 71 44.50%
3. Average sales per staff
(yuan/person/day)
2,406 2,658 1,744 2,269 33.10%
4. Average customer spending
(yuan/visit)
85.24 78.42 62.43 75.37 17.50%
5. Cashier efficiency 1
(yuan/machine/day)
28,573 31,560 20,709 26,947 49.80%
6. Cashier efficiency 2
(number of transaction/
machine /day)
364 339 300 334 22.00%
7. Gross margin (%) 13.26 13.74 13.17 13.39 -8.10%
8) % of damaged goods: 0.25%
9) Inventory turnover days: 39 days
10) Average operating area per employee (員工配置): 32.10 m2/employee
Li & Fung Research Centre China Chain Store & Franchise Association Member of the Li & Fung Group
17
2011 Q1
LI & FUNG RESEARCH CENTRE
CHINA CHAIN STORE & FRANCHISE ASSOCIATION
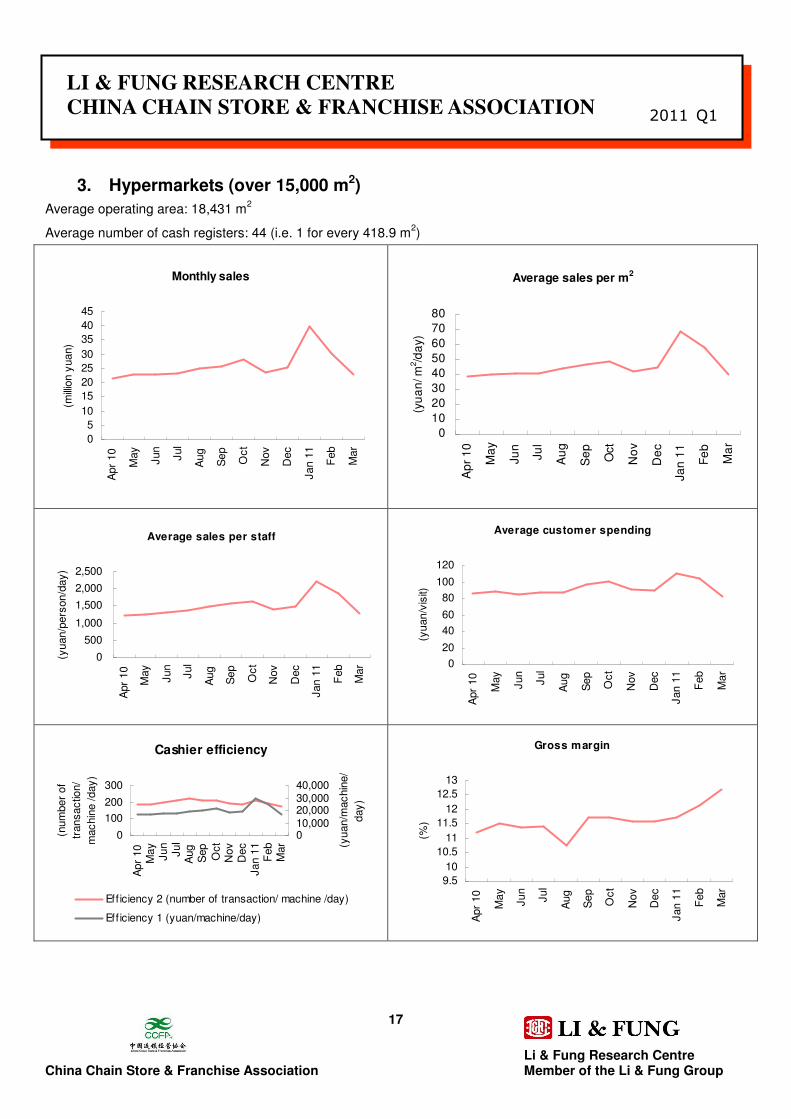
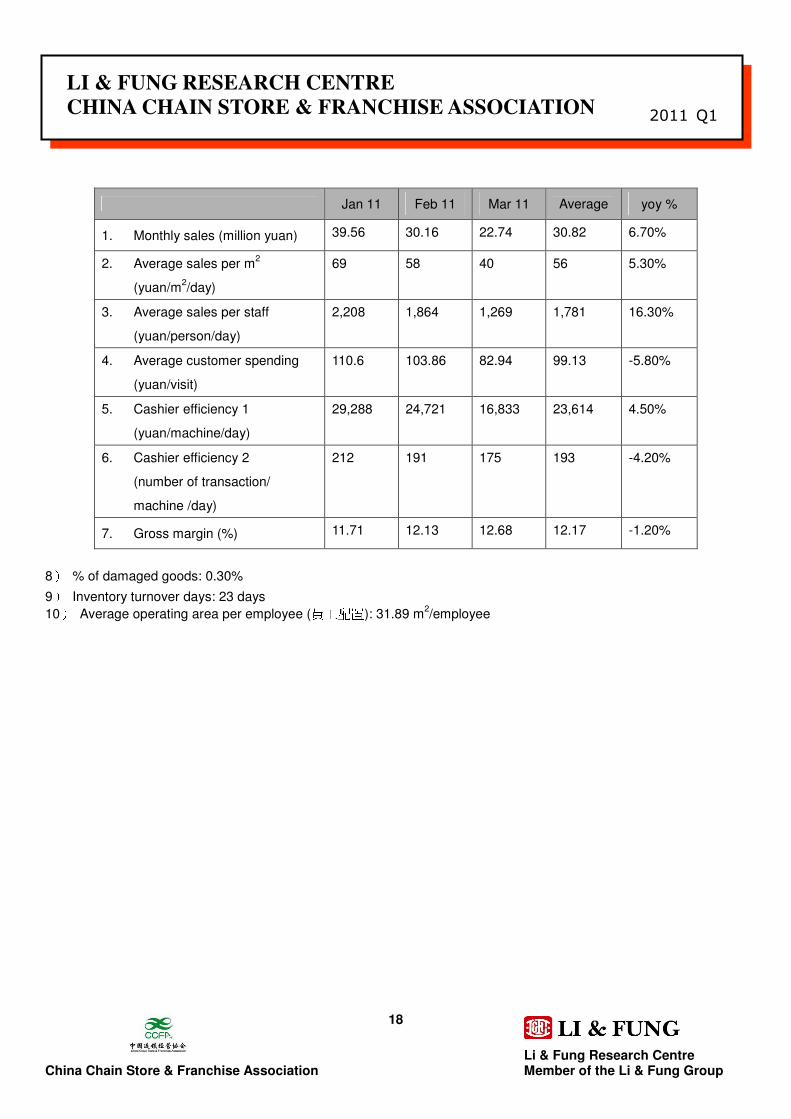
3. Hypermarkets (over 15,000 m2)
Average operating area: 18,431 m2
Average number of cash registers: 44 (i.e. 1 for every 418.9 m2)
Monthly sales
0
5
10
15
20
25
30
35
40
45
Apr
10
May
Jun
Jul
Aug
Sep
Oct
Nov
Dec
Jan 1
1
Feb
Mar
(millio
n y
uan)
Average sales per m2
0
10
20
30
40
50
60
70
80
Ap
r 1
0
Ma
y
Ju
n
Ju
l
Au
g
Se
p
Oct
No
v
De
c
Ja
n 1
1
Fe
b
Ma
r
(yu
an
/ m2/d
ay)
Average sales per staff
0
500
1,000
1,500
2,000
2,500
Apr
10
May
Jun
Jul
Aug
Sep
Oct
Nov
Dec
Jan 1
1
Feb
Mar
(yuan/p
ers
on/d
ay)
Average customer spending
0
20
40
60
80
100
120
Apr
10
May
Jun
Jul
Aug
Sep
Oct
Nov
Dec
Jan 1
1
Feb
Mar
(yuan/v
isit)
Cashier efficiency
0
100
200
300
Apr
10
May
Jun
Jul
Aug
Sep
Oct
Nov
Dec
Jan 1
1F
eb
Mar
(num
ber
of
transactio
n/
machin
e /day)
010,00020,00030,00040,000
(yuan/m
achin
e/
day)
Eff iciency 2 (number of transaction/ machine /day)
Eff iciency 1 (yuan/machine/day)
Gross margin
9.5
10
10.5
11
11.5
12
12.5
13
Apr
10
May
Jun
Jul
Aug
Sep
Oct
Nov
Dec
Jan 1
1
Feb
Mar
(%)
Li & Fung Research Centre China Chain Store & Franchise Association Member of the Li & Fung Group
18
2011 Q1
LI & FUNG RESEARCH CENTRE
CHINA CHAIN STORE & FRANCHISE ASSOCIATION
Jan 11 Feb 11 Mar 11 Average yoy %
1. Monthly sales (million yuan) 39.56 30.16 22.74 30.82 6.70%
2. Average sales per m2
(yuan/m2/day)
69 58 40 56 5.30%
3. Average sales per staff
(yuan/person/day)
2,208 1,864 1,269 1,781 16.30%
4. Average customer spending
(yuan/visit)
110.6 103.86 82.94 99.13 -5.80%
5. Cashier efficiency 1
(yuan/machine/day)
29,288 24,721 16,833 23,614 4.50%
6. Cashier efficiency 2
(number of transaction/
machine /day)
212 191 175 193 -4.20%
7. Gross margin (%) 11.71 12.13 12.68 12.17 -1.20%
8) % of damaged goods: 0.30%
9) Inventory turnover days: 23 days
10) Average operating area per employee (員工配置): 31.89 m2/employee
Li & Fung Research Centre China Chain Store & Franchise Association Member of the Li & Fung Group
19
2011 Q1
LI & FUNG RESEARCH CENTRE
CHINA CHAIN STORE & FRANCHISE ASSOCIATION
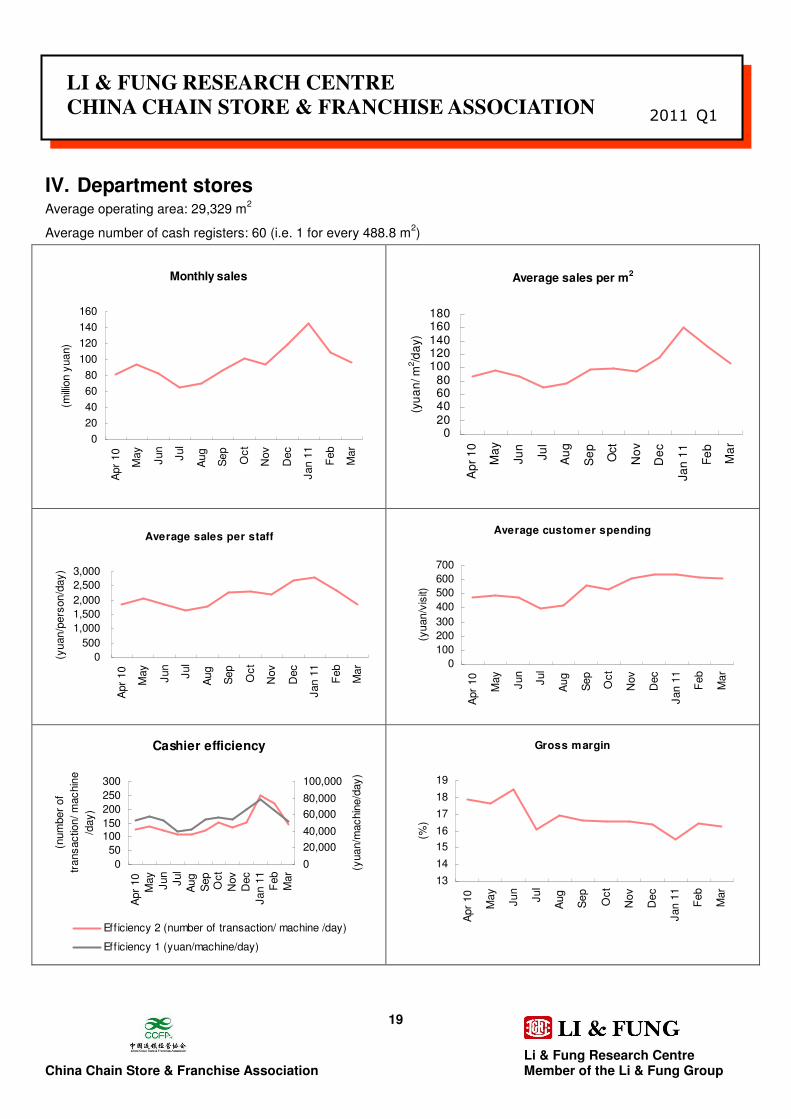
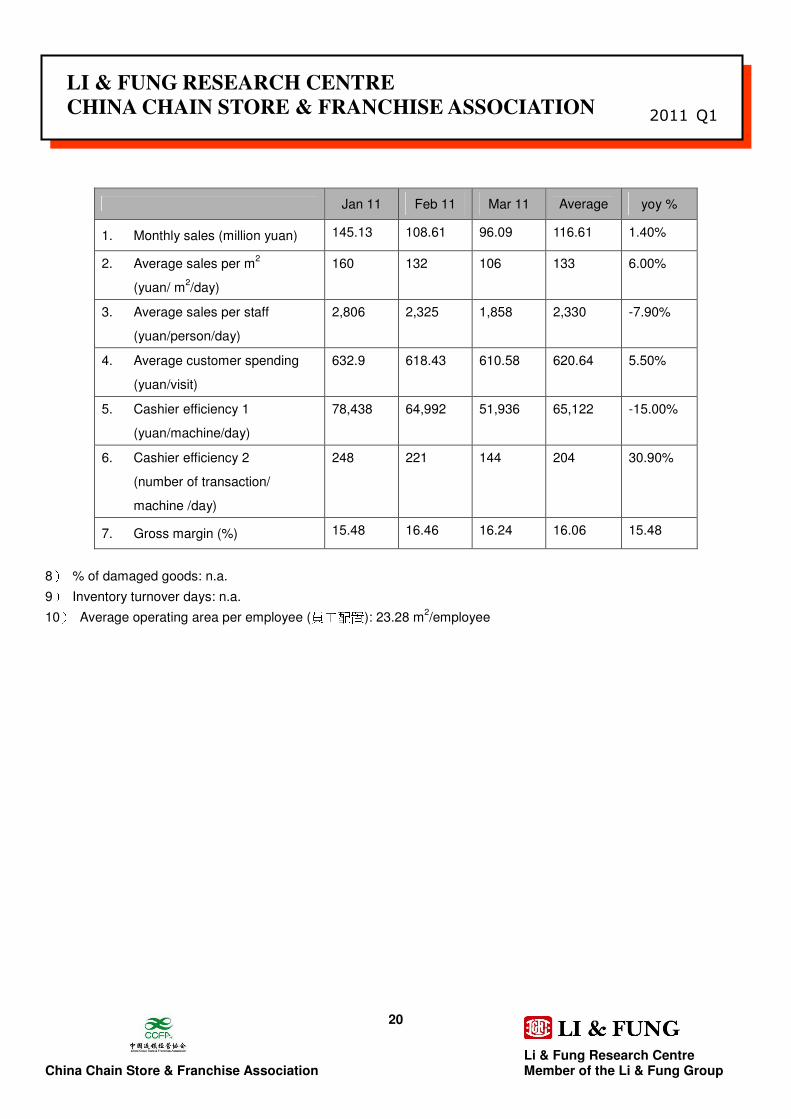
IV. Department stores Average operating area: 29,329 m
2
Average number of cash registers: 60 (i.e. 1 for every 488.8 m2)
Monthly sales
0
20
40
60
80
100
120
140
160
Apr
10
May
Jun
Jul
Aug
Sep
Oct
Nov
Dec
Jan 1
1
Feb
Mar
(millio
n y
uan)
Average sales per m2
020406080
100120140160180
Ap
r 1
0
Ma
y
Ju
n
Ju
l
Au
g
Se
p
Oct
No
v
De
c
Ja
n 1
1
Fe
b
Ma
r
(yu
an
/ m2/d
ay)
Average sales per staff
0
500
1,000
1,500
2,000
2,500
3,000
Apr
10
May
Jun
Jul
Aug
Sep
Oct
Nov
Dec
Jan 1
1
Feb
Mar
(yuan/p
ers
on/d
ay)
Average customer spending
0
100
200
300
400
500
600
700
Apr
10
May
Jun
Jul
Aug
Sep
Oct
Nov
Dec
Jan 1
1
Feb
Mar
(yuan/v
isit)
Cashier efficiency
0
50
100150
200
250
300
Apr
10
May
Jun
Jul
Aug
Sep
Oct
Nov
Dec
Jan 1
1
Feb
Mar
(num
ber
of
transactio
n/ m
achin
e
/day)
0
20,000
40,000
60,000
80,000
100,000
(yuan/m
achin
e/d
ay)
Eff iciency 2 (number of transaction/ machine /day)
Eff iciency 1 (yuan/machine/day)
Gross margin
13
14
15
16
17
18
19
Apr
10
May
Jun
Jul
Aug
Sep
Oct
Nov
Dec
Jan 1
1
Feb
Mar
(%)
Li & Fung Research Centre China Chain Store & Franchise Association Member of the Li & Fung Group
20
2011 Q1
LI & FUNG RESEARCH CENTRE
CHINA CHAIN STORE & FRANCHISE ASSOCIATION
Jan 11 Feb 11 Mar 11 Average yoy %
1. Monthly sales (million yuan) 145.13 108.61 96.09 116.61 1.40%
2. Average sales per m2
(yuan/ m2/day)
160 132 106 133 6.00%
3. Average sales per staff
(yuan/person/day)
2,806 2,325 1,858 2,330 -7.90%
4. Average customer spending
(yuan/visit)
632.9 618.43 610.58 620.64 5.50%
5. Cashier efficiency 1
(yuan/machine/day)
78,438 64,992 51,936 65,122 -15.00%
6. Cashier efficiency 2
(number of transaction/
machine /day)
248 221 144 204 30.90%
7. Gross margin (%) 15.48 16.46 16.24 16.06 15.48
8) % of damaged goods: n.a.
9) Inventory turnover days: n.a.
10) Average operating area per employee (員工配置): 23.28 m2/employee
Li & Fung Research Centre China Chain Store & Franchise Association Member of the Li & Fung Group
21
2011 Q1
LI & FUNG RESEARCH CENTRE
CHINA CHAIN STORE & FRANCHISE ASSOCIATION
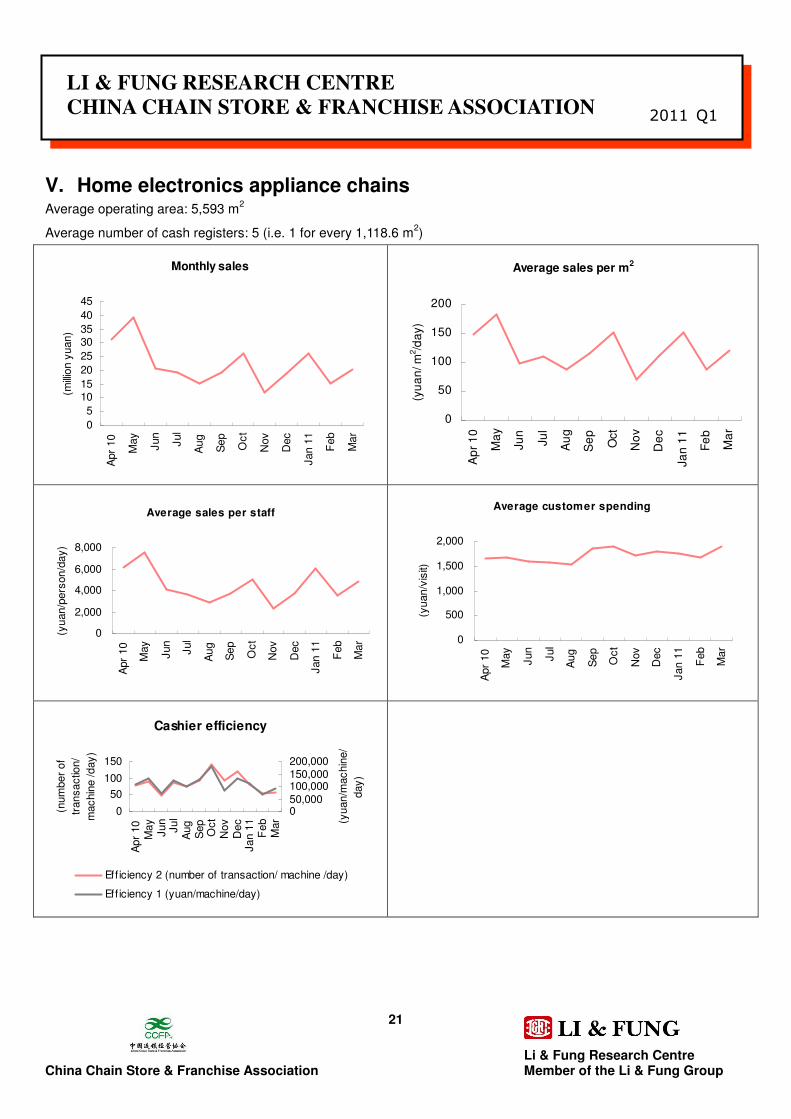
V. Home electronics appliance chains Average operating area: 5,593 m
2
Average number of cash registers: 5 (i.e. 1 for every 1,118.6 m2)
Monthly sales
0
5
1015
20
25
3035
40
45
Apr
10
May
Jun
Jul
Aug
Sep
Oct
Nov
Dec
Jan 1
1
Feb
Mar
(millio
n y
uan)
Average sales per m2
0
50
100
150
200
Ap
r 1
0
Ma
y
Ju
n
Ju
l
Au
g
Se
p
Oct
No
v
De
c
Ja
n 1
1
Fe
b
Ma
r
(yu
an
/ m
2/d
ay)
Average sales per staff
0
2,000
4,000
6,000
8,000
Apr
10
May
Jun
Jul
Aug
Sep
Oct
Nov
Dec
Jan 1
1
Feb
Mar
(yuan/p
ers
on/d
ay)
Average customer spending
0
500
1,000
1,500
2,000
Apr
10
May
Jun
Jul
Aug
Sep
Oct
Nov
Dec
Jan 1
1
Feb
Mar
(yuan/v
isit)
Cashier efficiency
0
50
100
150
Apr
10
May
Jun
Jul
Aug
Sep
Oct
Nov
Dec
Jan 1
1F
eb
Mar
(num
ber
of
transactio
n/
machin
e /day)
050,000100,000150,000200,000
(yuan/m
achin
e/
day)
Eff iciency 2 (number of transaction/ machine /day)
Eff iciency 1 (yuan/machine/day)

Li & Fung Research Centre China Chain Store & Franchise Association Member of the Li & Fung Group
22
2011 Q1
LI & FUNG RESEARCH CENTRE
CHINA CHAIN STORE & FRANCHISE ASSOCIATION
Jan 11 Feb 11 Mar 11 Average qoq %
1. Monthly sales (million yuan) 26.17 15.33 20.19 20.56 8.20%
2. Average sales per m2
(yuan/m2/day)
151 88 120 120 8.00%
3. Average sales per staff
(yuan/person/day)
6,020 3,527 4,798 4,782 28.40%
4. Average customer spending
(yuan/visit)
1,761.73 1,674.81 1,891.72 1,776.09 -1.70%
5. Cashier efficiency 1
(yuan/machine/day)
112,927 66,154 90,001 89,694 -31.80%
6. Cashier efficiency 2
(number of transaction/
machine /day)
80 55 68 64 -45.60%
7) % of damaged goods: n.a.
8) Inventory turnover days: n.a.
9) Average operating area per employee (員工配置): 39.95 m2/employee
Li & Fung Research Centre China Chain Store & Franchise Association Member of the Li & Fung Group
23
2011 Q1
LI & FUNG RESEARCH CENTRE
CHINA CHAIN STORE & FRANCHISE ASSOCIATION
About the Organizations
The China Chain Store & Franchise Association
中國連鎖經營協會中國連鎖經營協會中國連鎖經營協會中國連鎖經營協會
Founded in 1997, the China Chain Store & Franchise Association (CCFA) is an official representative of the retailing and
franchise industry in China. Currently, there are 900 enterprise members with 160,000 outlets, including domestic &
overseas retailers, franchisers, suppliers, and relevant organizations. The total sales of China’s “Top 100 retail chain
operators”, which are part of the members of the CCFA, exceeded RMB 1.36 trillion in 2009, with more than 137,000
stores in total.
CCFA participates in policymaking and coordination, safeguards the interests of industry and members, provides a
series of professional trainings and industry information and data for its members and establishes platforms for
exchange and cooperation.
Li & Fung Group
利豐集團利豐集團利豐集團利豐集團
The Li & Fung Group is a Hong Kong-based multinational company with three distinct core businesses: export sourcing,
distribution and logistics, and retailing. Founded in Guangzhou in 1906, the Li & Fung Group achieved an annual
turnover of over US$16 billion in 2009. Today, the Li & Fung Group operates in some 40 countries and regions and
employs over 35,000 people worldwide. One of its core competencies is “Supply Chain Management” (SCM).
Li & Fung Research Centre
利豐研究中心利豐研究中心利豐研究中心利豐研究中心
Li & Fung Research Centre is the research institute of the Li & Fung Group. It serves as a knowledge bank on China's
economy, industries, logistics and distribution sector, with its research scope covering the whole spectrum of the entire
supply chain, from ideas, production, distribution, retailing to consumers. It also offers research analyses and consulting
services to colleagues and clients to assist them in their day-to-day decision-making.
© Copyright 2011 Li & Fung Research Centre and the China Chain Store & Franchise Association (CCFA). All rights reserved.
Though Li & Fung Research Centre and CCFA endeavor to have information presented in this document as accurate and updated as possible, it accepts no responsibility for any error, omission or misrepresentation. Li & Fung Research Centre, CCFA and/or their associates accept no responsibility for any direct, indirect or consequential loss that may arise from the use of information contained in this document. Reproduction or redistribution of this material without Li & Fung Research Centre and CCFA’s prior written consent is prohibited.