kpi report for retail chain stores in china report for retail chain stores in china foreword about...
TRANSCRIPT

Li & Fung Research Centre China Chain Store & Franchise Association Member of the Li & Fung Group
1
2009 Q4
LI & FUNG RESEARCH CENTRE
CHINA CHAIN STORE & FRANCHISE ASSOCIATION
KPI report for retail chain stores in China
Foreword
About the KPI report
The China Chain Store & Franchise Association and the Li & Fung Research Centre have collaborated and established
the Key Performance Index System (hereafter the “KPI system”) for retail chain operators in China since 2007 and
published reports on a quarterly basis. The system aims to collect key performance indices of different format retail
stores in China.
In 2009, the data collection system are further upgraded and revised, and more store samples have been added. The
revised KPI report covers over 100 retail stores in China of 5 major formats, including convenience stores, supermarkets,
hypermarkets, department stores and home electronics appliance chains, of which supermarkets and hypermarkets are
further divided into several categories by operating area for easier references. We hope this report can shed some light
on the key development trends of China's retail chain stores.
About the indicators
Data of the following is collected in the KPI system –
1. Monthly sales (月度銷售額) – Pre-tax monthly sales value
2. Total operating area (總營業面積) – Including self-operating area and leasing area
3. Leasing area (對外租賃面積) – Area leased to other operators
4. Total staff number (員工總數) – Total number of staff including dispatched employees hired by labor agents (勞務派遣人員)
5. Total number of contract staff (正式員工數) – Total number of staff hired directly by the retailers
6. Total operating cost (成本及費用總額)
7. Total salaries and wages (工資總額)
8. Total number of SKUs (單品總數)
9. Number of SKUs distributing directly through the distribution centre (統一配送單品數)
10. Average daily number of transactions (平均日交易數)
11. Inventory turnover days (庫存周轉天數)
12. Non-operating income (營業外收入) – Income derived from activities other than sales of goods
Li & Fung Research Centre China Chain Store & Franchise Association Member of the Li & Fung Group
2
2009 Q4
LI & FUNG RESEARCH CENTRE
CHINA CHAIN STORE & FRANCHISE ASSOCIATION
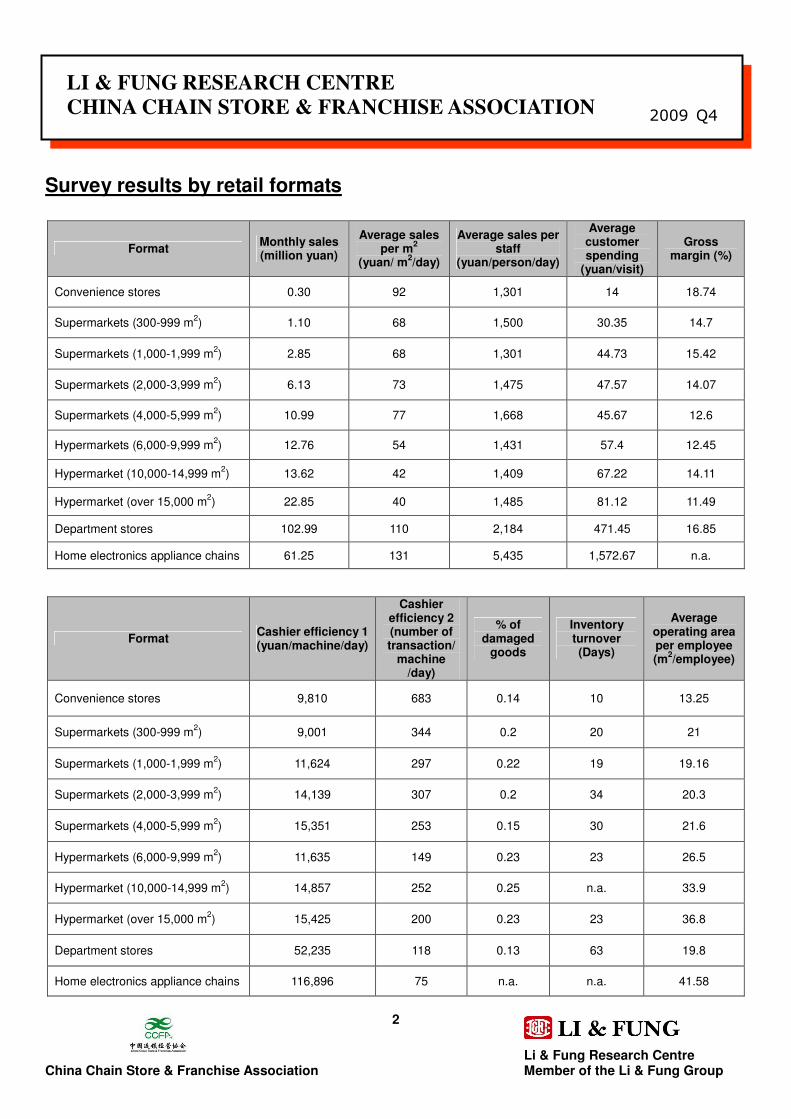
Survey results by retail formats
Format Monthly sales (million yuan)
Average sales per m
2
(yuan/ m2/day)
Average sales per staff
(yuan/person/day)
Average customer spending
(yuan/visit)
Gross margin (%)
Convenience stores 0.30 92 1,301 14 18.74
Supermarkets (300-999 m2) 1.10 68 1,500 30.35 14.7
Supermarkets (1,000-1,999 m2) 2.85 68 1,301 44.73 15.42
Supermarkets (2,000-3,999 m2) 6.13 73 1,475 47.57 14.07
Supermarkets (4,000-5,999 m2) 10.99 77 1,668 45.67 12.6
Hypermarkets (6,000-9,999 m2) 12.76 54 1,431 57.4 12.45
Hypermarket (10,000-14,999 m2) 13.62 42 1,409 67.22 14.11
Hypermarket (over 15,000 m2) 22.85 40 1,485 81.12 11.49
Department stores 102.99 110 2,184 471.45 16.85
Home electronics appliance chains 61.25 131 5,435 1,572.67 n.a.
Format Cashier efficiency 1 (yuan/machine/day)
Cashier efficiency 2 (number of transaction/
machine /day)
% of damaged
goods
Inventory turnover (Days)
Average operating area per employee (m
2/employee)
Convenience stores 9,810 683 0.14 10 13.25
Supermarkets (300-999 m2) 9,001 344 0.2 20 21
Supermarkets (1,000-1,999 m2) 11,624 297 0.22 19 19.16
Supermarkets (2,000-3,999 m2) 14,139 307 0.2 34 20.3
Supermarkets (4,000-5,999 m2) 15,351 253 0.15 30 21.6
Hypermarkets (6,000-9,999 m2) 11,635 149 0.23 23 26.5
Hypermarket (10,000-14,999 m2) 14,857 252 0.25 n.a. 33.9
Hypermarket (over 15,000 m2) 15,425 200 0.23 23 36.8
Department stores 52,235 118 0.13 63 19.8
Home electronics appliance chains 116,896 75 n.a. n.a. 41.58

Li & Fung Research Centre China Chain Store & Franchise Association Member of the Li & Fung Group
3
2009 Q4
LI & FUNG RESEARCH CENTRE
CHINA CHAIN STORE & FRANCHISE ASSOCIATION
I. Convenience stores Average operating area: 106m
2
Average number of cash registers: 1 (i.e. 1 cash register for every 106 m2)
Monthly sales
0.250.28 0.29
0.33
0.22
0.23
0
0.05
0.1
0.15
0.2
0.25
0.3
0.35
Jul Aug Sep Oct Nov Dec
(mill
ion y
uan)
Average sales per m 2
7885 90
102
72
66
0
20
40
60
80
100
120
Jul Aug Sep Oct Nov Dec(y
uan/ m
2/d
ay)
Average sales per staff
1,0691,206 1,263
1,433
910
989
0
500
1,000
1,500
2,000
Jul Aug Sep Oct Nov Dec
(yuan/p
ers
on/d
ay)
Average customer spending
12.54
16.9
12.23 12.81
11.61
16.05
0
5
10
15
20
Jul Aug Sep Oct Nov Dec
(yuan/v
isit)
Cashier efficiency
600
650
700
750
Jul Aug Sep Oct Nov Dec
(num
ber
of
transaction/
machin
e /
day)
0
5,000
10,000
15,000
(yuan/
machin
e/d
ay)
Efficiency 2 (number of transaction/ machine /day)
Efficiency 1 (yuan/machine/day)
Gross margin
19.31
18.8518.77
18.62
19.5
19.51
18
18.2
18.4
18.6
18.8
19
19.2
19.4
19.6
Jul Aug Sep Oct Nov Dec
(%)

Li & Fung Research Centre China Chain Store & Franchise Association Member of the Li & Fung Group
4
2009 Q4
LI & FUNG RESEARCH CENTRE
CHINA CHAIN STORE & FRANCHISE ASSOCIATION
Oct 09 Nov 09 Dec 09 Average Qoq %
1. Monthly sales (million yuan) 0.28 0.29 0.33 0.30 29.80%
2. Average sales per m2
(yuan/ m2/day)
85 90 102 92 28.00%
3. Average sales per staff
(yuan/person/day)
1,206 1,263 1,433 1,301 31.50%
4. Average customer spending
(yuan/visit)
16.9 12.23 12.81 14 4.30%
5. Cashier efficiency 1
(yuan/machine/day)
9,098 9,527 10,804 9,810 31.20%
Cashier efficiency 2
(number of transaction/
machine /day)
681 685 682 683 -0.30%
6. Gross margin (%) 18.85 18.77 18.62 18.74 -3.60%
7) % of damaged goods: 0.14%
8) Inventory turnover days: 10 days
8) Average operating area per employee (員工配置): 13.25 m2/employee
Li & Fung Research Centre China Chain Store & Franchise Association Member of the Li & Fung Group
5
2009 Q4
LI & FUNG RESEARCH CENTRE
CHINA CHAIN STORE & FRANCHISE ASSOCIATION
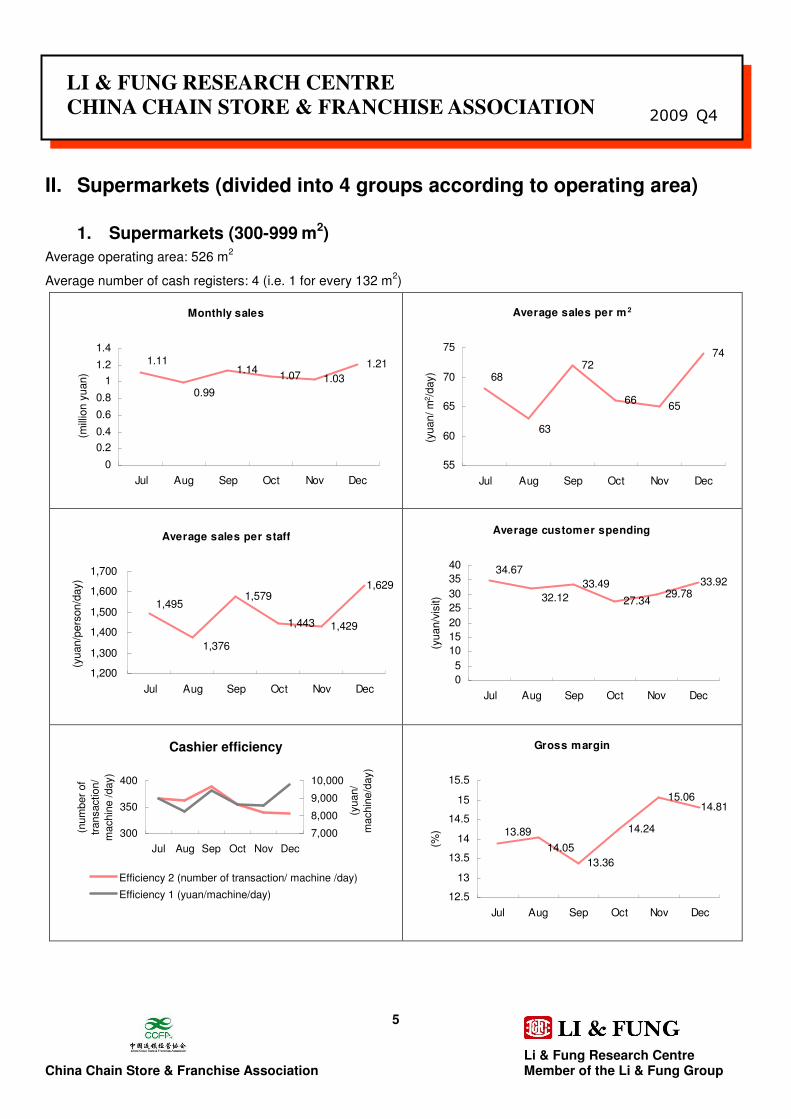
II. Supermarkets (divided into 4 groups according to operating area)
1. Supermarkets (300-999 m2)
Average operating area: 526 m2
Average number of cash registers: 4 (i.e. 1 for every 132 m2)
Monthly sales
1.141.07 1.03
1.211.11
0.99
0
0.2
0.4
0.6
0.8
1
1.2
1.4
Jul Aug Sep Oct Nov Dec
(mill
ion y
uan)
Average sales per m 2
72
6665
74
63
68
55
60
65
70
75
Jul Aug Sep Oct Nov Dec
(yuan/ m
2/d
ay)
Average sales per staff
1,579
1,443 1,429
1,629
1,495
1,376
1,200
1,300
1,400
1,500
1,600
1,700
Jul Aug Sep Oct Nov Dec
(yuan/p
ers
on/d
ay)
Average customer spending
33.49
27.3429.78
33.92
32.12
34.67
0
5
10
15
20
25
30
35
40
Jul Aug Sep Oct Nov Dec
(yuan/v
isit)
Cashier efficiency
300
350
400
Jul Aug Sep Oct Nov Dec
(num
ber
of
transaction/
machin
e /
day)
7,000
8,000
9,000
10,000
(yuan/
machin
e/d
ay)
Efficiency 2 (number of transaction/ machine /day)
Efficiency 1 (yuan/machine/day)
Gross margin
13.36
14.24
15.0614.81
13.89
14.05
12.5
13
13.5
14
14.5
15
15.5
Jul Aug Sep Oct Nov Dec
(%)
Li & Fung Research Centre China Chain Store & Franchise Association Member of the Li & Fung Group
6
2009 Q4
LI & FUNG RESEARCH CENTRE
CHINA CHAIN STORE & FRANCHISE ASSOCIATION
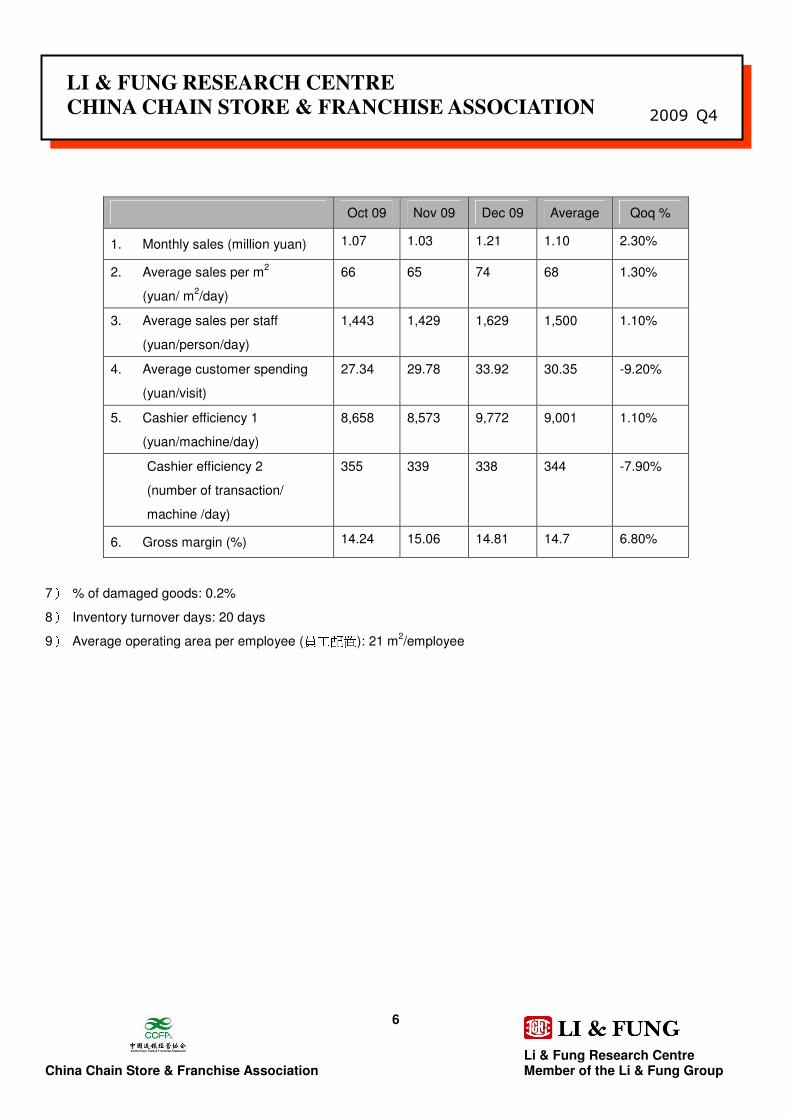
Oct 09 Nov 09 Dec 09 Average Qoq %
1. Monthly sales (million yuan) 1.07 1.03 1.21 1.10 2.30%
2. Average sales per m2
(yuan/ m2/day)
66 65 74 68 1.30%
3. Average sales per staff
(yuan/person/day)
1,443 1,429 1,629 1,500 1.10%
4. Average customer spending
(yuan/visit)
27.34 29.78 33.92 30.35 -9.20%
5. Cashier efficiency 1
(yuan/machine/day)
8,658 8,573 9,772 9,001 1.10%
Cashier efficiency 2
(number of transaction/
machine /day)
355 339 338 344 -7.90%
6. Gross margin (%) 14.24 15.06 14.81 14.7 6.80%
7) % of damaged goods: 0.2%
8) Inventory turnover days: 20 days
9) Average operating area per employee (員工配置): 21 m2/employee

Li & Fung Research Centre China Chain Store & Franchise Association Member of the Li & Fung Group
7
2009 Q4
LI & FUNG RESEARCH CENTRE
CHINA CHAIN STORE & FRANCHISE ASSOCIATION
2. Supermarkets (1,000-1,999 m2)
Average operating area: 1,370 m2
Average number of cash registers: 8 (i.e. 1 for every 171 m2)
Monthly sales
2.81 2.842.79
2.93
2.56
2.5
2.2
2.3
2.4
2.5
2.6
2.7
2.8
2.9
3
Jul Aug Sep Oct Nov Dec
(mill
ion y
uan)
Average sales per m 2
69
6768
69
61
61
56
58
60
62
64
66
68
70
Jul Aug Sep Oct Nov Dec(y
uan/ m
2/d
ay)
Average sales per staff
1,1301,281 1,300 1,320
996
1,002
0
200
400
600
800
1,000
1,200
1,400
Jul Aug Sep Oct Nov Dec
(yuan/p
ers
on/d
ay)
Average customer spending
55.91
40.96 42.7
50.5351.5939.83
0
10
20
30
40
50
60
Jul Aug Sep Oct Nov Dec
(yuan/v
isit)
Cashier efficiency
260
280
300
320
340
Jul Aug Sep Oct Nov Dec
(num
ber
of
transaction/
machin
e /
day)
9,000
10,000
11,000
12,000
(yuan/
machin
e/d
ay)
Efficiency 2 (number of transaction/ machine /day)
Efficiency 1 (yuan/machine/day)
Gross margin
15.3815.47
15.78
15.0315.01 15.29
14.6
14.8
15
15.2
15.4
15.6
15.8
16
Jul Aug Sep Oct Nov Dec
(%)
Li & Fung Research Centre China Chain Store & Franchise Association Member of the Li & Fung Group
8
2009 Q4
LI & FUNG RESEARCH CENTRE
CHINA CHAIN STORE & FRANCHISE ASSOCIATION
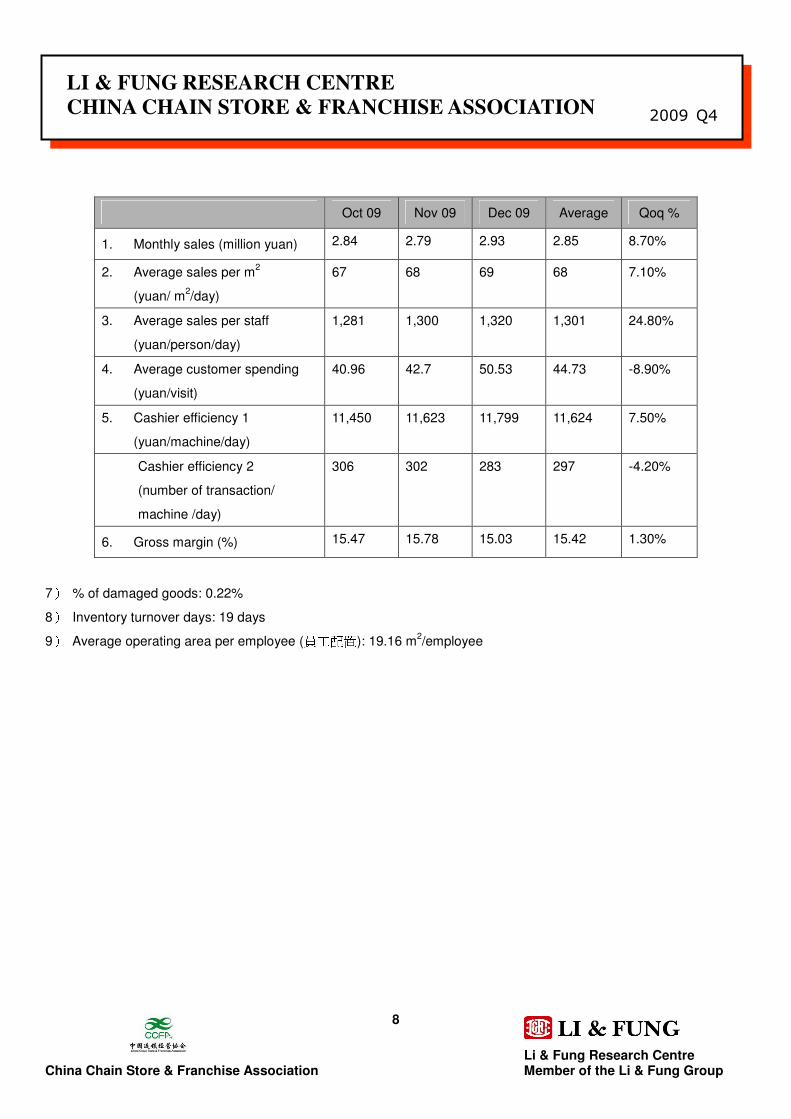
Oct 09 Nov 09 Dec 09 Average Qoq %
1. Monthly sales (million yuan) 2.84 2.79 2.93 2.85 8.70%
2. Average sales per m2
(yuan/ m2/day)
67 68 69 68 7.10%
3. Average sales per staff
(yuan/person/day)
1,281 1,300 1,320 1,301 24.80%
4. Average customer spending
(yuan/visit)
40.96 42.7 50.53 44.73 -8.90%
5. Cashier efficiency 1
(yuan/machine/day)
11,450 11,623 11,799 11,624 7.50%
Cashier efficiency 2
(number of transaction/
machine /day)
306 302 283 297 -4.20%
6. Gross margin (%) 15.47 15.78 15.03 15.42 1.30%
7) % of damaged goods: 0.22%
8) Inventory turnover days: 19 days
9) Average operating area per employee (員工配置): 19.16 m2/employee

Li & Fung Research Centre China Chain Store & Franchise Association Member of the Li & Fung Group
9
2009 Q4
LI & FUNG RESEARCH CENTRE
CHINA CHAIN STORE & FRANCHISE ASSOCIATION
3. Supermarkets (2,000-3,999 m2)
Average operating area: 2,738 m2
Average number of cash registers: 14 (i.e. 1 for every 196 m2)
Monthly sales
6.26.62
5.696.065.33
5.69
0
1
2
3
4
5
6
7
Jul Aug Sep Oct Nov Dec
(mill
ion y
uan)
Average sales per m 2
75 7869 71
69
63
0
20
40
60
80
100
Jul Aug Sep Oct Nov Dec(y
uan/ m
2/d
ay)
Average sales per staff
1,526 1,5781,402 1,4441,269
1,402
0
500
1,000
1,500
2,000
Jul Aug Sep Oct Nov Dec
(yuan/p
ers
on/d
ay)
Average customer spending
48.97
51.01
44.66
47.03
44.0342.73
38
40
42
44
46
48
50
52
Jul Aug Sep Oct Nov Dec
(yuan/v
isit)
Cashier efficiency
0
100
200
300
400
Jul Aug Sep Oct Nov Dec
(num
ber
of
transaction/
machin
e /
day)
0
5,000
10,000
15,000
20,000
(yuan/
machin
e/d
ay)
Efficiency 2 (number of transaction/ machine /day)
Efficiency 1 (yuan/machine/day)
Gross margin
13.45 13.53
14.5214.17
13.05 13.57
12
12.5
13
13.5
14
14.5
15
Jul Aug Sep Oct Nov Dec
(%)

Li & Fung Research Centre China Chain Store & Franchise Association Member of the Li & Fung Group
10
2009 Q4
LI & FUNG RESEARCH CENTRE
CHINA CHAIN STORE & FRANCHISE ASSOCIATION
Oct 09 Nov 09 Dec 09 Average Qoq %
1. Monthly sales (million yuan) 6.62 5.69 6.06 6.13 6.70%
2. Average sales per m2
(yuan/ m2/day)
78 69 71 73 5.40%
3. Average sales per staff
(yuan/person/day)
1,578 1,402 1,444 1,475 5.40%
4. Average customer spending
(yuan/visit)
51.01 44.66 47.03 47.57 5.10%
5. Cashier efficiency 1
(yuan/machine/day)
15,124 13,444 13,848 14,139 10.50%
Cashier efficiency 2
(number of transaction/
machine /day)
313 308 301 307 22.70%
6. Gross margin (%) 13.53 14.52 14.17 14.07 5.30%
7) % of damaged goods: 0.2%
8) Inventory turnover days: 34 days
9) Average operating area per employee (員工配置): 20.3 m2/employee

Li & Fung Research Centre China Chain Store & Franchise Association Member of the Li & Fung Group
11
2009 Q4
LI & FUNG RESEARCH CENTRE
CHINA CHAIN STORE & FRANCHISE ASSOCIATION
4. Supermarkets (4,000-5,999 m2)
Average operating area: 4,640 m2
Average number of cash registers: 23 (i.e: 1 for every 202 m2)
Monthly sales
13.04
10.33 9.98
12.6510.73
10.63
0
2
4
6
8
10
12
14
Jul Aug Sep Oct Nov Dec
(mill
ion y
uan)
Average sales per m 2
94
72 72
88
77
75
0
20
40
60
80
100
Jul Aug Sep Oct Nov Dec(y
uan/ m
2/d
ay)
Average sales per staff
1,7931,553 1,550
1,901
1,429
1,463
0
500
1,000
1,500
2,000
Jul Aug Sep Oct Nov Dec
(yuan/p
ers
on/d
ay)
Average customer spending
58.44
47.11 45.96 43.9346.44
46.9
0
10
20
30
40
50
60
70
Jul Aug Sep Oct Nov Dec
(yuan/v
isit)
Cashier efficiency
230240250260270280
Jul Aug Sep Oct Nov Dec
(num
ber
of
transaction/
machin
e /
day)
0
10,000
20,000
30,000
(yuan/
machin
e/d
ay)
Efficiency 2 (number of transaction/ machine /day)
Efficiency 1 (yuan/machine/day)
Gross margin
12.96 12.95
12.69
12.15
12.37
12.41
11.6
11.8
12
12.2
12.4
12.6
12.8
13
13.2
Jul Aug Sep Oct Nov Dec
(%)

Li & Fung Research Centre China Chain Store & Franchise Association Member of the Li & Fung Group
12
2009 Q4
LI & FUNG RESEARCH CENTRE
CHINA CHAIN STORE & FRANCHISE ASSOCIATION
Oct 09 Nov 09 Dec 09 Average Qoq %
1. Monthly sales (million yuan) 10.33 9.98 12.65 10.99 -4.20%
2. Average sales per m2
(yuan/ m2/day)
72 72 88 77 -5.60%
3. Average sales per staff
(yuan/person/day)
1,553 1,550 1,901 1,668 6.80%
4. Average customer spending
(yuan/visit)
47.11 45.96 43.93 45.67 -9.70%
5. Cashier efficiency 1
(yuan/machine/day)
14,293 14,265 17,494 15,351 -10.10%
Cashier efficiency 2
(number of transaction/
machine /day)
253 257 249 253 -5.00%
6. Gross margin (%) 12.95 12.69 12.15 12.6 0.20%
7) % of damaged goods: 0.15%
8) Inventory turnover days: 30 days
9) Average operating area per employee (員工配置): 21.6 m2/employee
Li & Fung Research Centre China Chain Store & Franchise Association Member of the Li & Fung Group
13
2009 Q4
LI & FUNG RESEARCH CENTRE
CHINA CHAIN STORE & FRANCHISE ASSOCIATION
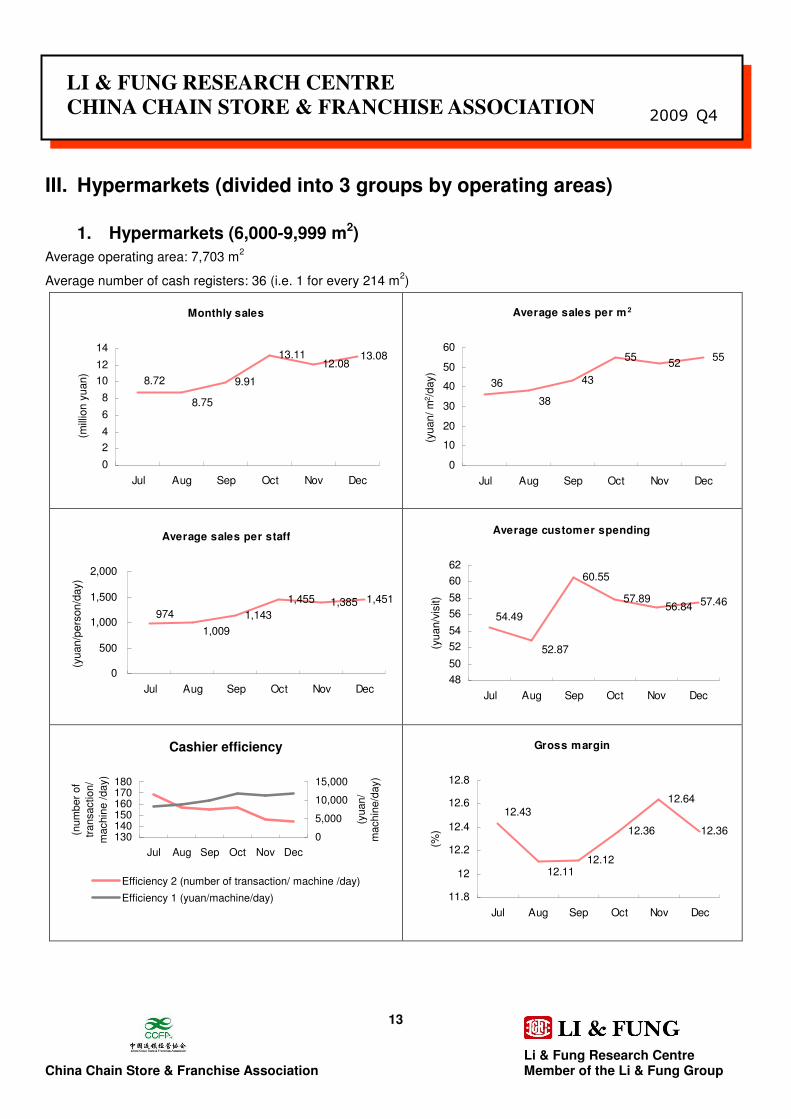
III. Hypermarkets (divided into 3 groups by operating areas)
1. Hypermarkets (6,000-9,999 m2)
Average operating area: 7,703 m2
Average number of cash registers: 36 (i.e. 1 for every 214 m2)
Monthly sales
9.91
13.1112.08
13.08
8.72
8.75
0
2
4
6
8
10
12
14
Jul Aug Sep Oct Nov Dec
(mill
ion y
uan)
Average sales per m 2
43
5552
55
38
36
0
10
20
30
40
50
60
Jul Aug Sep Oct Nov Dec
(yuan/ m
2/d
ay)
Average sales per staff
1,143
1,455 1,385 1,451
974
1,009
0
500
1,000
1,500
2,000
Jul Aug Sep Oct Nov Dec
(yuan/p
ers
on/d
ay)
Average customer spending
60.55
57.8956.84 57.46
52.87
54.49
48
50
52
54
56
58
60
62
Jul Aug Sep Oct Nov Dec
(yuan/v
isit)
Cashier efficiency
130140150160170180
Jul Aug Sep Oct Nov Dec
(num
ber
of
transaction/
machin
e /
day)
0
5,000
10,000
15,000
(yuan/
machin
e/d
ay)
Efficiency 2 (number of transaction/ machine /day)
Efficiency 1 (yuan/machine/day)
Gross margin
12.12
12.36
12.64
12.36
12.43
12.11
11.8
12
12.2
12.4
12.6
12.8
Jul Aug Sep Oct Nov Dec
(%)
Li & Fung Research Centre China Chain Store & Franchise Association Member of the Li & Fung Group
14
2009 Q4
LI & FUNG RESEARCH CENTRE
CHINA CHAIN STORE & FRANCHISE ASSOCIATION
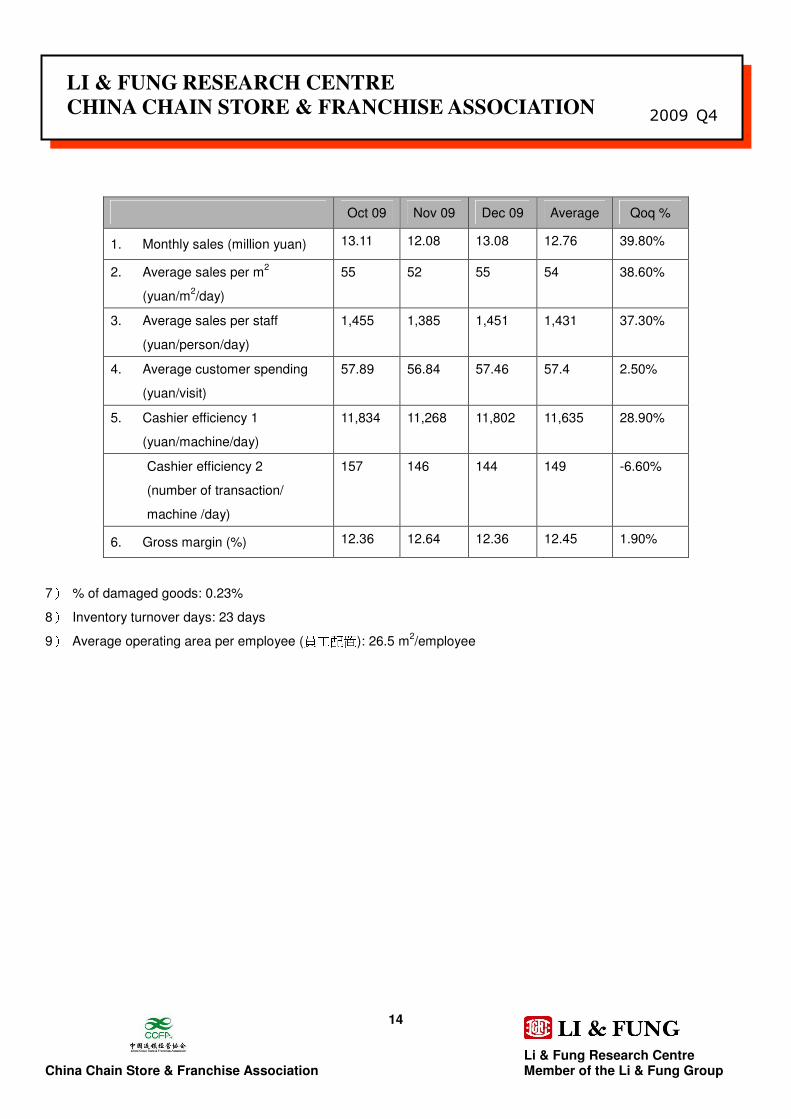
Oct 09 Nov 09 Dec 09 Average Qoq %
1. Monthly sales (million yuan) 13.11 12.08 13.08 12.76 39.80%
2. Average sales per m2
(yuan/m2/day)
55 52 55 54 38.60%
3. Average sales per staff
(yuan/person/day)
1,455 1,385 1,451 1,431 37.30%
4. Average customer spending
(yuan/visit)
57.89 56.84 57.46 57.4 2.50%
5. Cashier efficiency 1
(yuan/machine/day)
11,834 11,268 11,802 11,635 28.90%
Cashier efficiency 2
(number of transaction/
machine /day)
157 146 144 149 -6.60%
6. Gross margin (%) 12.36 12.64 12.36 12.45 1.90%
7) % of damaged goods: 0.23%
8) Inventory turnover days: 23 days
9) Average operating area per employee (員工配置): 26.5 m2/employee

Li & Fung Research Centre China Chain Store & Franchise Association Member of the Li & Fung Group
15
2009 Q4
LI & FUNG RESEARCH CENTRE
CHINA CHAIN STORE & FRANCHISE ASSOCIATION
2. Hypermarket (10,000-14,999 m2)
Average operating area: 10,676 m2
Average number of cash registers: 30 (i.e. 1 for every 356 m2)
Monthly sales
13.2115.74
12.36 12.7612.83
11.41
0
5
10
15
20
Jul Aug Sep Oct Nov Dec
(mill
ion y
uan)
Average sales per m 2
4148
39 3940
34
0
10
20
30
40
50
60
Jul Aug Sep Oct Nov Dec(y
uan/ m
2/d
ay)
Average sales per staff
1,4341,612
1,308 1,3061,1991,393
0
500
1,000
1,500
2,000
Jul Aug Sep Oct Nov Dec
(yuan/p
ers
on/d
ay)
Average customer spending
59.39
72.4
58.48
70.78
53.22
51.75
0
10
20
30
40
50
60
70
80
Jul Aug Sep Oct Nov Dec
(yuan/v
isit)
Cashier efficiency
0
100
200
300
400
Jul Aug Sep Oct Nov Dec
(num
ber
of
transaction/
machin
e /
day)
0
5,000
10,000
15,000
20,000
(yuan/
machin
e/d
ay)
Efficiency 2 (number of transaction/ machine /day)
Efficiency 1 (yuan/machine/day)
Gross margin
13.94
14.09
14.18
14.06
14.23
14.09
13.7
13.8
13.9
14
14.1
14.2
14.3
Jul Aug Sep Oct Nov Dec
(%)

Li & Fung Research Centre China Chain Store & Franchise Association Member of the Li & Fung Group
16
2009 Q4
LI & FUNG RESEARCH CENTRE
CHINA CHAIN STORE & FRANCHISE ASSOCIATION
Oct 09 Nov 09 Dec 09 Average Qoq %
1. Monthly sales (million yuan) 15.74 12.36 12.76 13.62 9.10%
2. Average sales per m2
(yuan/ m2/day)
48 39 39 42 7.70%
3. Average sales per staff
(yuan/person/day)
1,612 1,308 1,306 1,409 5.00%
4. Average customer spending
(yuan/visit)
72.4 58.48 70.78 67.22 22.70%
5. Cashier efficiency 1
(yuan/machine/day)
16,999 13,794 13,779 14,857 -2.30%
Cashier efficiency 2
(number of transaction/
machine /day)
278 242 237 252 -8.50%
6. Gross margin (%) 14.09 14.18 14.06 14.11 0.20%
7) % of damaged goods: 0.25%
8) Inventory turnover days: n.a.
9) Average operating area per employee (員工配置): 33.9 m2/employee

Li & Fung Research Centre China Chain Store & Franchise Association Member of the Li & Fung Group
17
2009 Q4
LI & FUNG RESEARCH CENTRE
CHINA CHAIN STORE & FRANCHISE ASSOCIATION
3. Hypermarket (over 15,000 m2)
Average operating area: 18,431 m2
Average number of cash registers: 48 (i.e. 1 for every 384 m2)
Monthly sales
23.29
23.75
21.31
23.49
22.1823.26
20
20.5
21
21.5
22
22.5
23
23.5
24
Jul Aug Sep Oct Nov Dec
(mill
ion y
uan)
Average sales per m 2
42 42
39
4142
39
37
38
39
40
41
42
43
Jul Aug Sep Oct Nov Dec(y
uan/ m
2/d
ay)
Average sales per staff
1,528 1,528
1,417
1,511
1,408
1,526
1,300
1,350
1,400
1,450
1,500
1,550
Jul Aug Sep Oct Nov Dec
(yuan/p
ers
on/d
ay)
Average customer spending
82.39
80.17 80.3
82.88
76.49
78.01
72
74
76
78
80
82
84
Jul Aug Sep Oct Nov Dec
(yuan/v
isit)
Cashier efficiency
180
190
200
210
220
Jul Aug Sep Oct Nov Dec
(num
ber
of
transaction/
machin
e /
day)
13,000
14,000
15,000
16,000
17,000
(yuan/
machin
e/d
ay)
Efficiency 2 (number of transaction/ machine /day)
Efficiency 1 (yuan/machine/day)
Gross margin
10.98
11.27
11.63 11.58
10.82
10.68
10.2
10.4
10.6
10.8
11
11.2
11.4
11.6
11.8
Jul Aug Sep Oct Nov Dec
(%)

Li & Fung Research Centre China Chain Store & Franchise Association Member of the Li & Fung Group
18
2009 Q4
LI & FUNG RESEARCH CENTRE
CHINA CHAIN STORE & FRANCHISE ASSOCIATION
Oct 09 Nov 09 Dec 09 Average Qoq %
1. Monthly sales (million yuan) 23.75 21.31 23.49 22.85 -0.30%
2. Average sales per m2
(yuan/m2/day)
42 39 41 40 -1.40%
3. Average sales per staff
(yuan/person/day)
1,528 1,417 1,511 1,485 -0.10%
4. Average customer spending
(yuan/visit)
80.17 80.3 82.88 81.12 2.70%
5. Cashier efficiency 1
(yuan/machine/day)
15,869 14,714 15,693 15,425 -3.60%
Cashier efficiency 2
(number of transaction/
machine /day)
192 200 208 200 -3.40%
6. Gross margin (%) 11.27 11.63 11.58 11.49 6.20%
7) % of damaged goods: 0.23%
8) Inventory turnover days: 23 days
9) Average operating area per employee (員工配置): 36.8 m2/employee
Li & Fung Research Centre China Chain Store & Franchise Association Member of the Li & Fung Group
19
2009 Q4
LI & FUNG RESEARCH CENTRE
CHINA CHAIN STORE & FRANCHISE ASSOCIATION
IV. Department stores Average operating area: 30,824 m
2
Average number of cash registers: 51 (i.e. 1 for every 604 m2)
Monthly sales
90.13101.07 97.01
110.9
66.37
73.87
0
20
40
60
80
100
120
Jul Aug Sep Oct Nov Dec
(mill
ion y
uan)
Average sales per m 2
99106 105
120
8170
0
20
40
60
80
100
120
140
Jul Aug Sep Oct Nov Dec(y
uan/ m
2/d
ay)
Average sales per staff
1,9032,097 2,080
2,377
1,3561,560
0
500
1,000
1,500
2,000
2,500
Jul Aug Sep Oct Nov Dec
(yuan/p
ers
on/d
ay)
Average customer spending
451.23
310.73
542.49561.14
392.78
423.33
0
100
200
300
400
500
600
Jul Aug Sep Oct Nov Dec
(yuan/v
isit)
Cashier efficiency
100
110
120
130
Jul Aug Sep Oct Nov Dec
(num
ber
of
transaction/
machin
e /
day)
0
20,000
40,000
60,000
(yuan/
machin
e/d
ay)
Efficiency 2 (number of transaction/ machine /day)
Efficiency 1 (yuan/machine/day)
Gross margin
16.97
16.18
17.44
16.94
17.52
17.64
15
15.5
16
16.5
17
17.5
18
Jul Aug Sep Oct Nov Dec
(%)

Li & Fung Research Centre China Chain Store & Franchise Association Member of the Li & Fung Group
20
2009 Q4
LI & FUNG RESEARCH CENTRE
CHINA CHAIN STORE & FRANCHISE ASSOCIATION
Oct 09 Nov 09 Dec 09 Average Qoq %
1. Monthly sales (million yuan) 101.07 97.01 110.90 102.99 34.10%
2. Average sales per m2
(yuan/ m2/day)
106 105 120 110 32.30%
3. Average sales per staff
(yuan/person/day)
2,097 2,080 2,377 2,184 36.00%
4. Average customer spending
(yuan/visit)
310.73 542.49 561.14 471.45 11.60%
5. Cashier efficiency 1
(yuan/machine/day)
50,133 49,725 56,847 52,235 27.30%
Cashier efficiency 2
(number of transaction/
machine /day)
125 109 120 118 5.00%
6. Gross margin (%) 16.18 17.44 16.94 16.85 -3.00%
7) % of damaged goods: 0.13%
8) Inventory turnover days: 63 days
9) Average operating area per employee (員工配置): 19.8 m2/employee

Li & Fung Research Centre China Chain Store & Franchise Association Member of the Li & Fung Group
21
2009 Q4
LI & FUNG RESEARCH CENTRE
CHINA CHAIN STORE & FRANCHISE ASSOCIATION
V. Home electronics appliance chains Average operating area: 15,221 m
2
Average number of cash registers: 17 (i.e. 1 for every 895 m2)
Monthly sales
39.06
60.08
32.1
91.56
28.91
26.85
0
20
40
60
80
100
Jul Aug Sep Oct Nov Dec
(mill
ion y
uan)
Average sales per m 2
93
127
70
194
64
66
0
50
100
150
200
250
Jul Aug Sep Oct Nov Dec(y
uan/ m
2/d
ay)
Average sales per staff
4,4045,300
2,926
8,077
3,154
3,027
0
2,000
4,000
6,000
8,000
10,000
Jul Aug Sep Oct Nov Dec
(yuan/p
ers
on/d
ay)
Average customer spending
1,461
1,669
1,5531,497
1,4401,400
1,200
1,300
1,400
1,500
1,600
1,700
Jul Aug Sep Oct Nov Dec
(yuan/v
isit)
Cashier efficiency
0
50
100
150
Jul Aug Sep Oct Nov Dec
(num
ber
of
transaction/
machin
e /
day)
0
50,000
100,000
150,000
200,000
(yuan/
machin
e/d
ay)
Efficiency 2 (number of transaction/ machine /day)
Efficiency 1 (yuan/machine/day)
Li & Fung Research Centre China Chain Store & Franchise Association Member of the Li & Fung Group
22
2009 Q4
LI & FUNG RESEARCH CENTRE
CHINA CHAIN STORE & FRANCHISE ASSOCIATION
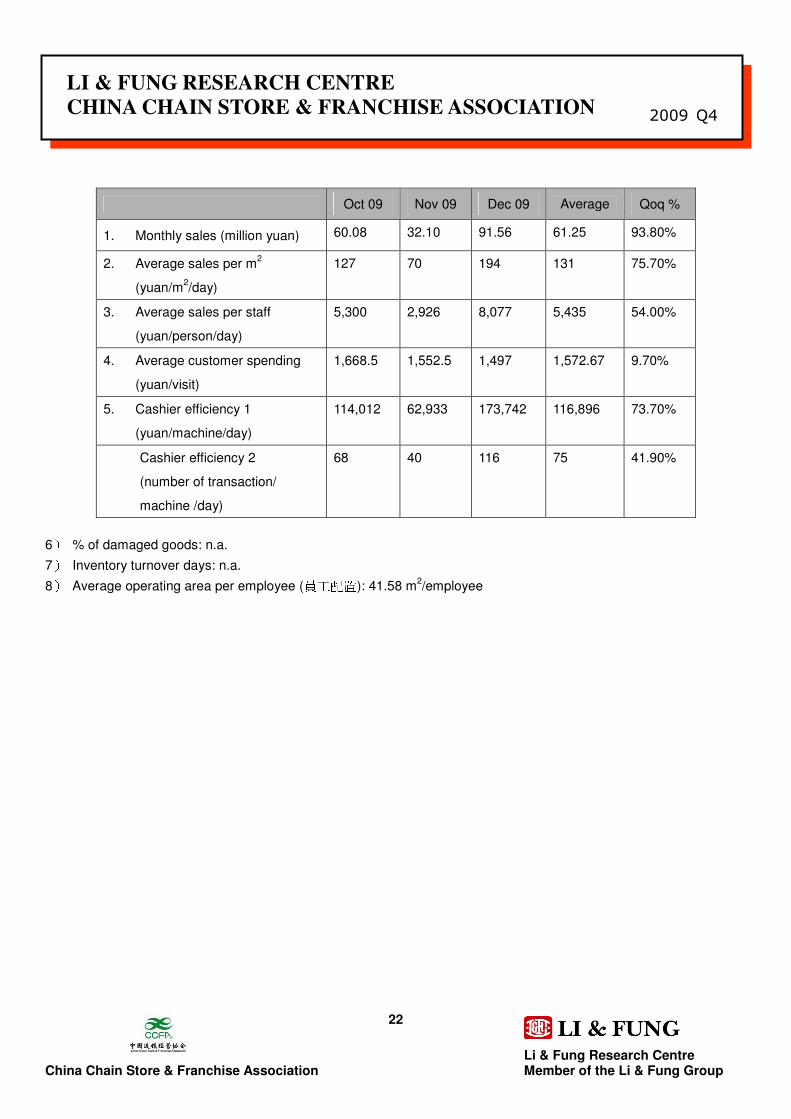
Oct 09 Nov 09 Dec 09 Average Qoq %
1. Monthly sales (million yuan) 60.08 32.10 91.56 61.25 93.80%
2. Average sales per m2
(yuan/m2/day)
127 70 194 131 75.70%
3. Average sales per staff
(yuan/person/day)
5,300 2,926 8,077 5,435 54.00%
4. Average customer spending
(yuan/visit)
1,668.5 1,552.5 1,497 1,572.67 9.70%
5. Cashier efficiency 1
(yuan/machine/day)
114,012 62,933 173,742 116,896 73.70%
Cashier efficiency 2
(number of transaction/
machine /day)
68 40 116 75 41.90%
6) % of damaged goods: n.a.
7) Inventory turnover days: n.a.
8) Average operating area per employee (員工配置): 41.58 m2/employee

Li & Fung Research Centre China Chain Store & Franchise Association Member of the Li & Fung Group
23
2009 Q4
LI & FUNG RESEARCH CENTRE
CHINA CHAIN STORE & FRANCHISE ASSOCIATION
Recent highlights of the retail chain operators (Brief notes from the speech of Ms Guo Ge-ping, Chairperson of the China Chain Store & Franchise Association during
the 11th China Retail Industry Convention)
After years of rapid developments, more retailers in China now pay increasing attention to achieving sustainable growth.
Improving efficiency, instead of solely pursuing scale, is high on many players’ agenda.
1. Growing calls to change retailers’ profit structure
In recent years, the profit structure of many retailers in China has changed significantly. Many retailers no longer derive
their profits from direct merchandise sales. Instead, cumbersome charges laid on suppliers, rental income and other
investment income become predominant source of income. This profit model may help retailers reduce initial outlays
and risks; in the long run, however, it would bring about problems such as lack of differentiation, strained relationship
between retailers and suppliers, and even corruption. These undermine retailers’ capability to effectively address to
consumers’ needs and retailers have to rely on price competition to stimulate sales. More and more retailers now are
trying to change the picture. And we see major changes in sourcing models in the fresh food category. Growing number
of retailers now embark on direct-farm sourcing to improve operating performance. .
2. Improving capability in merchandise management
The current profit structure of retailers in China has weakened their capability in merchandise management. To build
demand-driven supply chains, retailers in China must improve their capability in sourcing and merchandising – retailers
now recognize that more efforts should be paid on areas such as customer research and analyses, supplier
management, inventory control, and sales and marketing. By adding new value to customers, retailers can improve their
profit margin and speed up inventory turnover.
3. Launching private labels
Private labels are relatively new in China, accounting for only 3% of the total retail sales compared with more than 20%
in developed markets such as Europe or the United States. Many Chinese consumers are unfamiliar with or do not trust
private label products. And developing successful private labels requires retailers a lot of professional knowledge in
design, product development and quality control, etc. Nonetheless, as a possible lucrative profit source and a tool to
differentiate from competitors, many retailers are keen to try launching their private labels. It can also help build
customer loyalty and save customers’ money.

Li & Fung Research Centre China Chain Store & Franchise Association Member of the Li & Fung Group
24
2009 Q4
LI & FUNG RESEARCH CENTRE
CHINA CHAIN STORE & FRANCHISE ASSOCIATION
4. Managing supply chains
Many retailers have been squeezing suppliers for favorable terms; supply chain relationship is viewed as a zero-some
game. Supply chain management is gaining attention. More retailers now hope to collaborate with their supply chain
partners to lower costs and build win-win relationships with both customers and suppliers. Some ways to enhance
supply chain collaborations include improving logistics and information system, building strategic relationships with
suppliers etc.
5. Improving corporate social responsibility
In recent years, some established retailers in China have been taking key initiatives to improve corporate social
responsibility. Adopting green measures and charitable donations are some examples; and there are growing calls that
socially-responsible retailers must handle well relationships with suppliers as well. Indeed, more players now see a
socially-responsible image help them build their retailing brands and improve customer loyalty.
Li & Fung Research Centre China Chain Store & Franchise Association Member of the Li & Fung Group
25
2009 Q4
LI & FUNG RESEARCH CENTRE
CHINA CHAIN STORE & FRANCHISE ASSOCIATION
About the Organizations
The China Chain Store & Franchise Association
中國連鎖經營協會中國連鎖經營協會中國連鎖經營協會中國連鎖經營協會
Founded in 1997, the China Chain Store & Franchise Association (CCFA) is an official representative of the retailing and
franchise industry in China. Currently, there are 800 enterprise members with 160,000 outlets, including domestic &
overseas retailers, franchisers, suppliers, and relevant organizations. The total sales of China’s “Top 100 retail chain
operators”, which are part of the members of the CCFA, exceeded RMB 1.2 trillion in 2008, with more than 12,000
stores in total.
CCFA participates in policymaking and coordination, safeguards the interests of industry and members, provides a
series of professional trainings and industry information and data for its members and establishes platforms for
exchange and cooperation.
Li & Fung Group
利豐集團利豐集團利豐集團利豐集團
The Li & Fung Group is a Hong Kong-based multinational company with three distinct core businesses: export sourcing,
distribution and logistics, and retailing. Founded in Guangzhou in 1906, the Li & Fung Group achieved an annual
turnover of around US$16.7 billion in 2008. Today, the Li & Fung Group operates in some 40 countries and regions and
employs over 35,000 people worldwide. One of its core competencies is “Supply Chain Management” (SCM).
Li & Fung Research Centre
利豐研究中心利豐研究中心利豐研究中心利豐研究中心
Li & Fung Research Centre is the research institute of the Li & Fung Group. It serves as a knowledge bank on China's
economy, industries, logistics and distribution sector, with its research scope covering the whole spectrum of the entire
supply chain, from ideas, production, distribution, retailing to consumers. It also offers research analyses and consulting
services to colleagues and clients to assist them in their day-to-day decision-making.
© Copyright 2010 Li & Fung Research Centre and the China Chain Store & Franchise Association (CCFA). All rights reserved.
Though Li & Fung Research Centre and CCFA endeavor to have information presented in this document as accurate and updated as possible, it accepts no responsibility for any error, omission or misrepresentation. Li & Fung Research Centre, CCFA and/or their associates accept no responsibility for any direct, indirect or consequential loss that may arise from the use of information contained in this document. Reproduction or redistribution of this material without Li & Fung Research Centre and CCFA’s prior written consent is prohibited.