kari-heikki koskinen the long-term performance of
TRANSCRIPT

UNIVERSITY OF VAASA
FACULTY OF BUSINESS STUDIES
DEPARTMENT OF ACCOUNTING AND FINANCE
Kari-Heikki Koskinen
THE LONG-TERM PERFORMANCE OF ACQUIRING COMPANIES IN
FINLAND
Master`s Thesis in Accounting and Finance
Financial Accounting
VAASA 2009

1
TABLE OF CONTENTS page
1. INTRODUCTION 7
1.1. Research problem and approach 8
1.2. Research hypothesis 9
1.3. The organization of the research paper 10
2. MERGERS & ACQUISITION THEORY 11
2.1. Merger Waves 11
2.2. Different types of acquisitions 13
2.3. Motives for M & A 15
2.3.1. Synergy 15
2.3.2. Managerial motives 16
2.3.3. Economies of scale 17
2.3.4. Hubris 18
2.3.5. Stock market driven acquisitions 19
2.3.6. Other reasons for mergers and acquisitions. 20
3. PREVIOUS RESEARCH RESULTS 21
3.1. Results from long-term studies in US 21
3.2. Results from long-term studies from other countries 24
4. EVENT STUDY METHODOLOGY 28
4.1. Models for estimating abnormal returns 28
4.2. Long-run event studies 30
4.2.1. Models for testing long-run performance 31
4.2.2. Problems with long-run event studies 33
5. DATA DESCRIPTION AND METHODOLOGY 36
5.1. Portfolio formation 37
5.2. Calculation of abnormal returns 41
5.3. Statistical significance 41

2

3
5.4. Theoretical background 42
5.4.1. P/E ratio 42
5.4.2. B/M ratio 45
5.4.3. Method of payment 48
5.4.4. Size 50
6. EMPIRICAL FINDINGS 53
6.1. Do acquirers underperform? 53
6.1.1. Results for P/E portfolios 54
6.1.2. Results for P/B portfolios 57
6.1.3. Results from Method of payment 59
6.1.4. Results for Size 61
7. CONCLUSIONS AND RECOMMENDATIONS 64
REFERENCES 67
LIST OF TABLES page
Table 1. Descriptive statistics of P/B and P/E portfolios. 39
Table 2. Descriptive statistics of method of payment and size. 40
Table 3. The long-term performance of single –and multiple bidders. 53 Table 4. P/E portfolios long-term performance. 55
Table 5. P/E portfolios long-term performance (single bid allowed). 56 Table 6. P/B portfolios long-term performance. 58
Table 7. P/B portfolios long-term performance (single bid allowed). 59
Table 8. The effect of method of payment to long-term performance. 60
Table 9. Long-term performance of large, medium and small acquirers. 61
Table 10. The long-term effects of size and valuation. 62

5
______________________________________________________________________ UNIVERSITY OF VAASA Faculty of Business Studies Author: Kari-Heikki Koskinen Topic of the Thesis: The long-term performance of acquiring companies in Finland Name of the Supervisor: Timo Rothovius Degree: Master of Science in Economics and Business Administration Department: Accounting and Finance Line: Financial Accounting Year of Entering the University: 2004 Year of Completing the Thesis: 2010 Pages: 75 ______________________________________________________________________ ABSTRACT This research paper concentrates on evaluating the long-term post-merger performance of Finnish mergers and acquisitions completed during 1995–2006. As the overall wealth effects related to acquisitions are enormous, their performance and success has been immensely studied both by researchers and corporate managers. This research though has mainly concentrated on observing the announcement period returns while the long-term studies have been scarce. The purpose of this study is to test how and if the pre-merger valuation of the acquirer influences the eventual three-year post-merger performance. Using an event study method, the aim is to find out if high-valuation “glamour” firms are the primary cause of the long-term performance. The effects of the chosen payment method and acquirer size are also studied in order to offer a more comprehensive view of the factors affecting the mergers and acquisitions. Attention is also given for recent findings of the short comings of long-term event-studies and especially the problems which might present themselves. These findings imply that measuring problems associated to the use of the conventional t-test for long-term event-studies might have been a source of the negative underperformance of some of the earlier studies. The results clearly show that Finnish acquirers which undertake mergers and acquisitions perform poorly afterwards, but a majority of the poor performance can be accounted for high-valuation “glamour” acquirers. Low-valuation “value” firms also underperform but no statistical significance is found. The evidence also suggests that the chosen method of payment affects the long-term performance as acquisitions financed using equity only fared considerably worse than those financed with cash only. The acquirer size had also effect on the eventual performance of the merger. All size groups underperformed but statistical significance was only found for medium and small acquirers.
______________________________________________________________________
KEYWORDS: mergers and acquisitions, pre-merger valuation, long-term performance

6

7
1. INTRODUCTION
Every year billions change hands when corporations complete mergers or takeovers.
The ongoing integration and the rapid development of worldwide capital markets have
given companies access to new markets and growth opportunities. This has also affected
the merger markets in a way that the number of mergers and their overall value has
constantly increased. When corporate executives decide to acquire smaller competitors
or struggling rivals, they are making decisions which might affect thousands of
employees, customers and owners around the world. This is why mergers, their
performance and overall results have been studied extensively by researchers and
corporate management themselves. The aim has been to discover specific factors or
determinants which could help to explain why certain mergers succee and others fail
completely.
In Finland, the deep recession in the turn of 1980s and 1990s forced companies to
restruct or sell their unprofitable businesses. Large companies in metal, forest, banking
and technology sectors were unable to continue as large conglomerates, and had to
streamline their operations just to survive. As Ali-Yrkkö (2002: 1) mentions, this started
a decade long merger wave in Finland. Kallunki, Peltoniemi and Pyykkö (2009) state
that especially the deregulation of capital markets which allowed foreign investors to
buy and hold the stocks of Finnish companies boosted the development and the
liquidity of the markets and meant that the Helsinki stock exchange became one of the
most international stock markets in the world. Similarly the increased liquidity and
therefore a more efficient flow of resources gave Finnish companies an opportunity to
expand their own businesses. Rising stock market during the 1990s had also a positive
influence on the mergers and acquisition (later M&A) market. Evidenced by Ali-Yrkkö
(2002 especially Figure 4.2) who shows that, when the size of the economy is taken into
consideration, Finland was the most active EU member state during the 1990´s in the
M&A business.
Pike and Neale (2006: 545) point out the total value of worldwide M&A markets
dropped to 1,75$ trillion dollars in 2001, from 3,5$ trillion in 2000. More recently, after
the economy started to recover from the tech bubble, companies were again eager to
undertake new M&A. According to a M&A outlook (2007), the worldwide M&A
activity was a staggering 4,06$ trillion in 2006. The report predicts that the M&A
activity will continue to rise in 2007 and 2008, but because of the cyclical nature of the

8
M&A markets, a sharp decline in the world economic growth or a financial crises would
seriously affect the M&A markets in a similar fashion as in 2001.
In Finland, several large mergers valued over a billion € have been completed after the
turn of the millennium, the most notable mergers happening in the energy, forest and
finance sectors. Currently as the world economy is recovering from the financial crisis,
low interest rates, increased liquidity and conservative firm valuations could be seen as
positive signs when anticipating an increase in the future merger activity.
Because of the enormous wealth effects associated to the M&A, firm and manager
specific characteristics affecting the overall merger outcome have been studied
immensely. These merger motives have been usually associated to synergy gains where
two merging companies should function more efficiently compared to operating
individually. Similarly the merger performance has attracted several researchers to
study and evaluate the market reactions and overall outcomes of mergers.
While the short-term wealth gains for target owners have been observed in numerous
studies time and time again, the returns and benefits for bidders and more precisely their
long-run returns are still a bit of a mystery. Depending on the research period and the
studied market, results from the long-term performance of bidders have been
conflicting, and lately, the development of the estimation methods especially regarding
stock returns have shown that long-term tests are vulnerable to serious biases depending
on the chosen methodological approach, thus creating a new problem for measuring the
overall M&A outcome.
1.1. Research problem and approach
The purpose of this paper is to study the long-term stock performance of Finnish
companies undertaking acquisitions. This is done by evaluating the three year period
after the original deal announcement, in order to discover how the acquirers` pre-merger
valuation affects the long-term stock performance. This paper also studies how the
chosen payment method and the acquirers` size affect the eventual outcome of the
merger. The motivation for the study has two main reasons.

9
First, as the majority of research papers concentrates on the immediate stock market
reaction of both the bidders and targets share prices, studies focusing on the long-term
performance of these acquisitions have been rather scarce. The announcement period
returns have been studied using Finnish data also, but the long-term performance has
been somewhat neglected, so this paper aims to offer more information about the long-
term performance of Finnish acquisitions compared to other countries and provide
knowledge if similar return patterns exists also in Finland.
Secondly, several influential research papers have documented the effect of company
valuation to its future stock returns, an area that until quite recently hasn`t been studied
in relation to M&A. While research papers studying this valuation effect has been
published concerning other nations, Finland hasn`t been part of these countries. So this
paper looks to fulfil this gap in research, and evaluates how bidder valuation affects the
long-term results of M&A in Finland.
1.2. Research hypothesis
Studies have shown that pre-merger valuation affects how well or badly the acquirer
performs after the announced merger. Rau and Vermaelen (1998) and Sudarsanam and
Mahate (2003) measure the pre-merger valuation using company P/E and B/M ratios as
proxies. They show that in the US and in the UK respectively, value companies (low
valuation) outperform glamour companies (high valuation) on the following long-term
period after the merger. More precisely, the weak after-merger performance of the
glamour acquirers seems to be the primary source of the previously widely observed
and reported long-term underperformance.
The same studies also show that the method chosen to pay for the acquisition affects the
long-term performance of the undertaken M&A. Rau and Vermaelen and Sudarsanam
and Mahate report that cash bidders outperform equity bidders. The effects of acquirer
size is tested because of findings by Fama and French (1992,1993) and Bauman,
Conover and Miller (1998) whom report that size is an important factor explaining the
variation of stock returns and that there is a significant performance difference between
glamour and value firms. So, this paper aims to study if pre-merger valuation, method
of payment and acquirer size affects the long-term performance of Finnish acquirers,
and therefore the hypotheses for this study are:

10
H1: Low P/E acquirers (value acquirers) outperform high P/E acquirers (glamour
acquirers)
H2: Low ME/BE acquirers (value acquirers) outperform high ME/BE acquirers
(glamour acquirers)
H3: Bidders using cash as a method of payment will outperform bidders using equity as
a method of payment
H4: Value acquirers will outperform similar sized glamour acquirers
1.3. The organization of the research paper
This research paper examines the long-term post merger stock performance of the
acquiring companies in Finland and how their pre-merger valuation affects the success
of the completed M&A. To sufficiently cover the area of long-term performance the rest
of the paper is organised in the following way. Chapter 1 offers insight on the economic
importance of M&A, and also the motivation, research problem and the testable
hypotheses for this research paper. Chapter 2 includes definitions associated with M&A,
explains different merger types and reviews the most important motives for M&A.
Chapter 3 is devoted to the previous studies conducted about the long-term performance
of M&A while Chapter 4 explains the most common approaches available when
conducting long-term post-merger performance studies, and also reviews recent
developments and findings that could cause difficulties within these studies. Chapter 5
presents the data selection and explains the used research methods and the theoretical
background of the hypotheses, followed by Chapter 6 which reports the results of the
study and finally Chapter 7 includes the conclusions drawn from this research paper and
recommendations for future study.

11
2. MERGERS & ACQUISITION THEORY
In this paper all reported acquisitions are considered to be similar with oneanother, but
in reality there are differences with the types of M&A. As Pike and Neale (2006: 542–
543) clarify, a merger happens when two companies combine their interests and form a
new company. This action has to be accepted by shareholders of both companies. A
takeover in the other hand is an acquisition by a single company offering cash, shares or
some combination of these, to acquire the share capital of another company. If a
takeover is completed, the acquiring company absorbs the target but in this case, no new
entity is created. Halpern (1983) states that tender offers are offers to purchase a
proportion of available stock on specific terms or dates while Loughran and Vijh (1997)
further explain that tender offers are usually made directly to target shareholders. By
doing this, acquirers try to avoid the possible resistance of incapable managers and are
looking for greater efficiency gains.
Especially when public companies propose and undertake M&A decisions, Bean (1975:
1) explains that they are immediately carefully processed by market participants.
Details, like costs and future profits, are extremely interesting for lenders and buyers
and could drastically affect the future of the acquiring company. Also, companies may
have some sources of value e.g. labour skills or technical excellence which isn`t directly
reflected in companies balance statements and thus in their stock price, but could be
very valuable (Bean 1975: 2). A good example of this was the hostile takeover of Partek
by Kone in 2002. Partek that had previously been active in the acquisitions market was
a target of Kone but also KCI Konecranes. Kone ultimately won the bidding contest,
and shortly after the acquisition, Kone sold several parts of old Partek while re-
acclaiming a substantial share of the original price paid or was suggested by Partek`s
stock value that time.
2.1. Merger Waves
It`s been well documented that M&A cluster and appear in waves. So far five merger
waves have been documented and studied by financial researchers: in early 1900s, the
1920s, the 1960s, the 1980s and the 1990s. The last one being particularly important
because of it`s size and geographical dispersion. Previously focused in the US markets,
the last merger wave included an emergence of European and UK companies

12
participating in the M&A. The overall M&A activity in the euro area increased sharply
after 1997 and reached an all time high in 2000, when transactions involving EU
companies were almost 2000€ billion. (Martynova and Renneboog 2008; Campa and
Hernando 2006.)
Economic booms are usually behind the increased merger activity as conditions in the
financial markets are pleasant for undertaking acquisitions. Takeovers coincide with
times of rapid credit expansion, high stock market valuation and changes in legislation
or deregulation of markets. Similarly, M&A markets tend to slow down quickly after
stock market declines or during times of recession. The first merger wave in the
beginning of the 1900s can be attributed for large intra industry mergers, triggered by
technology and industrial innovations. Second (1920s) for the creation of several
oligopolies, third (1960s) was the wave of conglomerates as companies were looking to
reduce their cyclical risks and therefore acquired unrelated companies or new
businesses. The wave of 1980s started when stock markets recovered from their
previous decline, and simultaneously several changes in the regulation of financial
markets were introduced. Finally the last merger wave (1990s) can be seen as a first
global merger wave, as for the first time, companies from Europe and Asia also
participated in several billion dollar M&A. (Martynova and Renneboog 2008; Ali-
Yrkkö 2002.)
While previous research has shown that M&A appear in waves, they also seem to
cluster sector-wise. Mitchell and Mulherin (1996) evidenced that intra industry shocks
are important factors for the increases in merger activity on a specific sector. They list
e.g deregulation, innovations in financing technology and input cost changes as sources
for these shocks, and to counter these shocks on a sector level, corporate takeovers are
an economical way to react to them. Mitchell and Mulherin studied the 1980s merger
wave in the US and report that there appeared to be substantial sector variation in the
number of undertaken mergers and to which sectors they concentrated. Although all
industries experienced takeovers during the 1980s, the highest number of M&A activity
was completed in industries experiencing the greatest fundamental shocks. Andrade and
Stafford (2004) show that in their research, half of observed intra industry mergers
clustered to a five-year span and resulted from industry shocks.
Mitchell and Mulherin (1996) state that in a case of e.g. an intra industry technological
shock that creates an expansion in firm sizes, can be countered internally or externally
in that sector. Companies could achieve the size growth through an outside takeover or

13
an inside expansion. Andrade and Stafford (2004) add that firms might try to increase
their size and scale in order to afford major capital investments. Intra industry mergers
could also be caused by corporate restructuring i.e. rationalization of operations or
excluding of overlapping functions. Halford (2005) agrees with Mitchell and Mulherin
and Andrade and Stafford with their findings but adds that a sufficient increase in
capital liquidity i.e. low transaction costs and economic motivation is imperative for
industry shocks to become merger waves.
Rhodes-Kropf, Robinson and Viswanathan (2005) find that increases in average sector
valuation error, increase the merger activity on that specific industry compared to other
sectors. They also report that while sector-level miss valuation is a crucial component of
merger waves, it explains only 15% of them. On a firm-level, miss-valuation is integral
of explaining who participates in merger waves. Harford (2005) finds a somewhat
differing result, he reports that intra industry market-to-book ratio has some predictive
power of merger waves but when including additional economic values to the model it
becomes insignificant. Harford also reports of some evidence of bidder
underperformance after a merger wave.
2.2. Different types of acquisitions
Pike and Neale (2006: 549) list three different types of acquisitions:
Horizontal integration – an acquisition where a company acquires inside the same
industry and the target company is at the same stage of the production process. Fee and
Thomas (2004) studied horizontal acquisitions and report that the main reason why
managers undertake such acquisitions is the expectation of higher productive efficiency.
Fee and Thomas note that horizontal acquisitions gives also more buying power to the
merged entity, thus decreasing supplier cash flows and ultimately their profits,
especially on more concentrated sectors. Andrade and Stafford (2004) show that on an
industry-level, excessive product capacity increases the likelihood of mergers while
peak product capacity leads to increased internal investments by firms. Capron (1999)
studies the long-term performance of European and US manufacturing companies
conducting horizontal acquisitions. He reports that cost savings, market coverage and
innovation capabilities as the main reasons affecting their post-merger performance.

14
Vertical integration – is similar to horizontal integration but the target company
operates on a different stage of the production process. Fan and Goyal (2006) state that
vertical mergers give acquiring companies more control of the production processes.
They also report that between 1962 and 1996, one-third of the US sample mergers
where vertical by nature and that the number of completed vertical mergers was on the
rise regardless of what sector they were undertaken.
Conglomerate or unrelated diversification – the target corporation may operate in an
entirely different sector, but they may share some activities e.g marketing or
administration. Capron (1999) mentions that sharing activities enables merging
businesses to achieve cost reduction based on learning curve economics. Without the
merger, the businesses alone might not have the necessary cumulative production
volume to fully take advantage of them. Fan and Goyal (2006) report that in the US,
conglomerate mergers peaked during the 1960s and later they became more focus
related i.e were more industry specific. Shleifer and Vishny (2003) suggest that the
conglomerates wave was triggered by owners of high-valuation bidders trying to claim
a substantial share of long-term capital.
Ross, Westerfield and Jordan (2006: 801) offer examples of other types of mergers.
They explain that a proxy contest occurs when a group tries to obtain enough votes (by
using proxies i.e. a right to vote with someone else’s rights) to get a controlling seats in
the corporate board of directors. The aim is to change the current directors. Company
directors and outside investors may choose to conduct a leveraged buyout (LBO), i.e.
buying all the available equity. A LBO purchase is usually heavily leveraged, hence the
name.
Ross et al. also report that companies don`t necessarily need to conduct mergers while
increasing their level of co-operation. A strategic alliance might be formed in an effort
to create e.g. new products or pursuit some other joint goal. Also a joint venture could
be formed, where two or more firms invest money to create a new firm which to
operate. Pike and Neale (2006: 549) conclude that in reality acquisitions are rarely so
easily classified because of the complexity associated to them.

15
2.3. Motives for M & A
Shareholder wealth maximization is considered in the finance literature as the number
one priority for company management. They should continuously search and exploit
new opportunities, when trying to improve their company value. Bean (1975: 2) adds
that even when the economy isn`t doing well, this shouldn`t stop firms from looking for
new investment opportunities, but instead requiring them to make better capital
investment decisions with more limited resources. Halpern (1983: 299) adds that for the
acquirers there should be an expectation of a positive economic gain and thus the
acquiring firm should earn at least a normal rate of return.
The finance literature in general states that companies undertake acquisitions because
they are trying to generate more profits or act more efficiently as a new entity,
compared to separate companies. Andrade and Stafford (2004) add that one must
evaluate the pros and cons of the choice to merge or invest internally, as they both are
ways to increase firm`s assets and productive base. This so called value-additivity is an
important reason behind corporate acquisitions and is usually illustrated as:
Va+b > Va + Vb
where, entities a and b together are worth more than a and b separately.
The aforementioned description is called the neoclassical theory of mergers where
managers act to maximize shareholder wealth, i.e. assets are redeployed to a more
efficient use. In contrast, if increased merger activity is attributed to periods of financial
market miss valuations or managers having information not available to other market
participants, this could signal that overvaluation influences merger activity. Some
believe that the staggering equity price drops following recent merger waves support
this view. (Rhodes-Kropf et. al 2005; Rosen 2006.)
2.3.1. Synergy
Synergy is constantly mentioned as the main reason why managers decide to undertake
corporate mergers. The financial literature features numerous studies concerning the
synergy effects that may or may not be achieved by a merger. Synergy benefits are
thought to be obtainable when two separate entities merge, forming a new corporation
which is more valuable than two separate companies (usually presented as 2+2=5). Pike
and Neale (2006: 549) clarify that synergy gains are not related to economics of scale

16
and might emerge from some specific way of utilizing combined resources. Ross et al.
(2006: 806) state that an important factor for an acquisition is the thought that the new
firm would generate higher revenues, which could be created by marketing gains,
strategic benefits or an increase in market power.
There`s three different synergy effects distinguished: financial, operational and
managerial. Financial synergies result as a lower cost of capital, what could happen by
investing to unrelated business or increasing the company size. They can also be
attainable if a company creates an internal capital market, where operating using
superior information could lead to more efficient allocation of capital. Operating
synergies can rise from combining separate units or from knowledge transfer. Both
could lead to lesser costs of business units, but must be weighted against the cost of
acquiring the assets or units. Managerial synergies depend on the superiority of
acquirers planning and supervisory abilities, which are beneficial for the target
company. (Trautwein 1990.)
A study by Devos, Kadapakkam and Krishnamurthy (2008) concentrated on measuring
the eventual effect that synergies create. They find that in a sample of 264 large mergers
during 1980 – 2004, the measured average synergy gain is 10,03% of the total value of
the newly combined entities. They further decompose the results and show that
operating synergies consist for 8,38% of observed gain and the rest comes from tax
savings. Devos et al. also find supporting evidence for e.g. Rau and Vermaelen (1998)
study that value acquirers undertake better mergers compared to glamour acquirers.
2.3.2. Managerial motives
This section reviews studies concentrating on different managerial motives related to
M&A. Some overlapping does exists concerning these theories. The agency theory (see
Jensen and Meckling 1976) argues that corporate managers and their own interests may
be vastly different from the views and interests of corporate owners or shareholders,
thus creating an agency problem. Managers might be inclined to e.g. expand the
company beyond its sustainable or rational level, or they might try to obtain more
profitable positions from other companies when undertaking mergers. Rosen (2006)
notes that many of the defensive mergers during 1990s where caused by managers
protecting their own interests.

17
The free cash flow (FCF) that companies are able to accumulate is available money that
could be e.g. paid to owners. Jensen (1988) mentions that if the FCF that a company
produces is substantial, the possibility of irrational actions, i.e. investing at projects at a
lower than the cost of capital rate, by corporate managers could even severe the conflict
of interests of the two parties. Jensen also concludes that it`s somewhat paradoxical that
a higher amount of available resources could lead to more in-efficiencies and thus result
as a lower company value.
Draper and Paudyal (2008) investigate if information asymmetry between corporate
managers and financial markets is a source for M&A. They hypothesize that
undervalued companies might undertake M&A in order to increase the attention of
market participants, and to make them to re-evaluate them, in a view to increase their
stock price and valuation. Managers of undervalued companies could be inclined to use
such a method in order to fight possible takeovers and at the same time project their
own benefits. Draper and Paudyal find supporting evidence from the UK mergers for
their hypothesis, i.e. when there is higher information asymmetry between managers
and outside investors this leads to higher announcement period returns. The result is
even more apparent for infrequent bidders than to multiple bidders.
2.3.3. Economies of scale
Walker (2000) gives various reasons which could manifest as economies of scale.
Companies could expand geographically to new markets, they could broaden their
product line by acquiring a rival whose successful at some another product sector,
increase their market share or choose to diversify. Pike and Neale (2006: 549) add that
larger size should create economies of scale in manufacturing, marketing or give the
corporation a chance to negotiate better terms with their capital markets associates. Ross
et al. (2006: 807) give an example of Cingulars acquisition of AT&T Wireless, where
although the combined firm was much larger after the acquisition, the company saved a
lot of money streamlining its operations, and as a result the operating and capital cost
per customer was much lower.
Lambrecht (2004) offers additional information of acquisitions that happen because of
economies of scale. He provides evidence that there exists a positive correlation
between merger gains from economies of scale and product market demand. These
acquisitions are more likely to appear during rising product markets. Lambrecht also

18
shows that friendly mergers tend to happen at the beginning of a merger wave and
speculates that hostile acquisitions should take place later on, because of the time
needed for the merger approval and restructuring.
2.3.4. Hubris
One of the major hypotheses for merger activity is the Hubris hypothesis presented by
Roll (1986). This theory suggests that acquiring firm managers when making takeover
decisions overestimate the possible gains from successful acquisitions and thus pay
more of their targets on average. Even if there really is a chance for the entities to
achieve financial gains, Roll argues that the takeover premium for the target
shareholders includes a valuation error and hubris. Roll also concludes that the
existence of hubris means that corporate management doesn`t always act with the best
interests of the shareholders in their mind. Morck, Shleifer and Vishny (1990) go as far
as claiming that “…managers will overpay for targets with high private benefits. p.32”
Rosen (2006) speculates that if managers are rewarded for short-term performance they
might undertake bad acquisitions in order to improve the stock price, which in turn
could explain the positive announcement period returns and also the long-run reversal.
Berkovitch and Narayanan (1993) conduct a study were they test synergy- and agency
motives as well as the hubris simultaneously, in order to measure the correlation
between the target and total gains. They hypothesize that the correlation should be
positive for mergers conducted because of synergy, negative if done for management
(agency) reasons, and zero if hubris is the motive. The results suggest that synergy is the
main reason (positive correlation between target and total gains) but there is
considerable differences between the studied subsamples, were the agency theory is the
dominating motive, and the likely cause of value-reducing acquisitions instead of
hubris.
Hayward and Hambrick (1997) also study the CEO Hubris and the effects it has on
corporate takeovers. They find evidence of four different factors which are attributable
for CEO hubris. They identify acquiring company`s recent performance, recent media
exposure of the CEO, a measure for CEO`s self-importance and a composite factor of
the previous as sources for CEO hubris. Their study provides evidence that a higher
level of CEO hubris leads to higher bid premiums and finally results as lower long-term
returns. Moeller, Schlingemann and Stultz (2004) find supporting evidence for this,

19
reporting that the paid acquisition premiums grow as the size of the acquirer increases
leading them to sum that the hubris effect is more of a problem for large firms than
small.
2.3.5. Stock market driven acquisitions
Shleifer and Vishny (2003) introduced a new theory of acquisitions where they are
driven by stock markets and their miss valuations. They argue that markets aren`t
completely efficient, so companies might be miss valued, but also that company
managers are completely rational and are able to use this knowledge for their own
benefit when making merger decisions. Companies would have an incentive to use their
own overvalued stock as they purchase new corporations. Like Shleifer and Vishny
(2003) study, Rhodes-Kropf and Viswanathan (2004) present a behavioral explanation
for stock market related acquisitions. Their model assumes that managers from both
companies (acquirer and target), have private information about their own company and
also are aware that the observed company value is incorrect. Target company
management is forced to make a decision to accept or reject the offer with incomplete
knowledge of the true value of the acquirer. Still, they know that the acquirer (using
stock as method of payment) is overvalued (because they are too) and therefore are able
to adjust the incorrect valuation, and hence, on average they`re able to make the right
decision about the acceptance of the acquisition offer.
Rhodes-Kropf et al. (2005) tested the aforementioned theories and their empirical
implications, more precisely if there is a link between merger waves and miss valuation.
Rhodes-Kropf et al. use the Market-to-Book measure (they decompose it to firm and
sector level component and also to a component that measures firms long-run growth
opportunities) to test if and when companies choose to undertake mergers or become
targets of such. They find that acquirers and targets cluster on high time-series sector
errors, meaning that they both have a similar miss valuation component. On a sector
level, the time-series error also seems to increase the equity financed merger activity.
They also note the acquirer valuations are usually significantly higher than their targets,
and finally that the observed miss valuation explains roughly 15% of the sector level
merger activity acting as important factor explaining the merger activity along with e.g.
sector productivity shocks.

20
Rhodes-Kropf et al. also report that when controlling for the firm-specific and time-
series sector errors, they find that low long-run value-to-book companies surprisingly
buy the high long-run value-to-book targets. An unusual finding regarding the merger
activity, the researchers speculate that it could be caused by managers buying targets
with a higher long-run valuation or perhaps by incompetent managers who might be
acquiring companies with more skilled managers, and then trying to adapt their own
organization to learn from them.
2.3.6. Other reasons for mergers and acquisitions.
There exists also wide array of other motives that academics have been able to discover
and study. Jensen and Ruback (1983: 24) mention tax reasons as a stimulant for M&A,
although Devos et al (2008) report that tax considerations aren`t as important source for
M&A as previously thought. Jensen (1988) mentions that corporate managers have an
incentive to create new debt as a substitute for dividends, and this way are able to
reduce the available FCF. Morck et al. (1990) find evidence that managerial motives
cause managers to buy growth and to diversify, in order to gain more personal benefits.
Rosen (2006) offers merger momentum as source for increased merger activity. He finds
evidence that if the markets have reacted favourably to previous merger
announcements; it will continue to perceive them more positively. Petmezas (2009)
arrives to the same conclusion when studying UK mergers. He finds evidence that
managers rushed merger decisions during the hot merger period, but the lack of proper
evaluation about the merger had a negative impact on the post-merger returns. Pike and
Neale (2006: 550) include market power acquisitions, risk reduction and stock market
listing also as possible reasons for M&A.

21
3. PREVIOUS RESEARCH RESULTS
Because the purpose of the thesis is to concentrate solely on the long-term performance
of mergers, I don`t review research papers which have studied the immediate
(announcement period) returns for acquiring and target companies. Jensen and Ruback
(1983), Loughran and Vijh (1997), Agrawal and Jaffe (1999) sum that researchers have
found that during the announcement period target company owners earn significant
returns from all acquisitions, and that acquiring companies earn little or no abnormal
returns for tender offers and negative abnormal returns from mergers.
The majority of the research concerning the long-term return of mergers have studied
the US and UK markets. For this reason Dutta and Jog (2009) claim that some studies
suffer from overlapping US data and data mining. As the number of previous US studies
is high compared to other countries, US studies are reviewed separately from other
countries.
3.1. Results from long-term studies in US
One of earliest studies that study the long-term performance of takeovers was conducted
by Asquith (1983). He studies the merger process as whole, and argue that previous
studies neglecting to do so, miss some of the returns associated with mergers. The idea
was to study the pre-merger period to observe can markets anticipate the coming merger
and also to study the stock returns after the merger announcement. The research sample
included successful and unsuccessful mergers from a time period of 1962 to 1976, and
Asquith uses an estimation period starting 480 trading days before the merger
announcement and ending 240 days after. The results show that as predicted by efficient
markets, market participants were able to anticipate the upcoming mergers and suggest
that previous studies were unable to measure the total returns of the merger process
correctly. They also show that after 240 trading days bidder firms had a statistically
negative returns of 7.2 percent, a result that remained puzzling.
Jensen and Ruback (1983) review thoroughly the existing literature concerning
corporate takeovers. They mention that previous results suggest that on average bidding
firms announcement period returns are approximately zero, i.e. no abnormal returns.
The authors note that bidding firm returns are harder to estimate, and because stock

22
prices reflect expectations, a merger news shouldn`t change the observed price. Like
Asquith (1983), Jensen and Ruback wonder why bidders stock price fall one year
following the merger, concluding that this is against the market efficiency and suggest
overestimation of merger gains as a reason behind this.
An important study by Franks, Harris and Titman (1991) who concentrate solely on the
post-takeover issue, offers a comprehensive view on different testing methods and
several factors that could affect the long-term performance of corporate acquisitions.
Agrawal and Jaffe (1999) use the Franks et al. (1991) research paper as a divider in the
research done on the M&A field, and give them credit for their valuable work in the
post-takeover issue.
Franks et al. study examines 399 acquisitions from 1975 to 1984 and they e.g. form
comparable eight –and ten-factor portfolio benchmarks to measure the long-term
performance of the acquirers, while trying to avoid the known biases with the traditional
benchmarks. They find contrasting evidence about the long-term performance of the
acquirers depending on the used benchmark. When comparing single-factor benchmarks
to multi-factor benchmarks, it appeared that the multi-factor models showed statistically
insignificant post-merger performance while the observed results for single-factor
benchmarks where the opposite. This lead Franks et al. to conclude that previous studies
findings were due to benchmarking errors.
Agrawal, Jaffe and Mandelker (1992) study US mergers from 1955 to 1987 in NYSE
and AMEX stock exchanges. Their sample includes 937 mergers and 227 tender offers
and they use two different kinds of research methods to evaluate the long-term returns
and factors affecting them. Agrawal et al. take into account the firm size and company
beta and test how they affect the merger outcome. They report a robust statistically
significant negative return of about 10% for the following five–year post-merger return
using several different methods. But they don`t find evidence that a change in the beta
factor causes the result. Fama and French (1993) comment that the negative results
could be a result of the book-to-market effect. Agrawal et.al also repeat the Franks et.al
(1991) study and report that their findings are specific only for the research period and
the results are influenced by the fact, that they include mergers and tender offers in the
same sample.

23
Loughran and Vijh (1997) study US mergers for a period of 1970–1989 from NYSE
and AMEX stock exchanges. Their research method differs from Franks et al. (1991)
and Agrawal et.al (1992) as they measure the five-year abnormal returns using matching
stocks to control for size and book-to-market effect. They report that the post merger
abnormal returns depend on the type of the acquisition (merger or tender offer) and the
method of payment (cash or stock). The reported abnormal returns vary from
significantly negative -25 % to significantly positive 61,7 % depending on the
aforementioned factors. Loughran and Vijh state that the observed large abnormal post
acquisition results are against the market efficiency.
Rau and Vermaelen (1998) conduct an interesting study about the long-term
performance of US mergers. They take into account the bidder size and book-to-market
factors and study separately mergers and tender offers. The authors also separate, on
basis of their book-to-market valuation, high “glamour” and low “value” bidders from
each other. Their study includes 3169 mergers and 348 tender offers from 1980 to 1991.
When adjusting for size and book-to-market ratios, bidders (mergers) underperform
their equally weighted control portfolios, but for tender offers the results show that they
earn a statistically significant abnormal return of 9%. When comparing the value and
glamour bidders, Rau and Vermaelen report that value bidders earn significantly higher
abnormal returns than glamour bidders and also that the result is unchanged even when
events are excluded. This leads the authors to comment that glamour bidders make
poorer acquisition decisions altogether.
Mitchell and Stafford (2000) study mergers, seasoned equity offerings (SEO) and share
repurchases from 1958 – 1993. They also discuss in detail the recent developments
concerning the long-term event study tests and concentrate especially on the Buy-and-
hold abnormal return (later BHAR) method as it has been the most common method
when studying the overall effects of corporate mergers. They use a three-year period for
the long-term testing and measure the overall effects using the BHAR method. Their
results show that the BHAR method has statistical limitations, and when these are
accounted for, Mitchell and Stafford are unable to find evidence of any abnormal
returns contrary to many other studies.
Rosen (2006) studies how and if merger momentum and investor sentiment influence
the long-run returns for acquiring companies. Rosen studies how mergers undertaken
during a “hot merger” market compare to those that are announced some time else. The
study sample includes US mergers from 1992 to 2001 and Rosen uses the BHAR

24
method but also investigates long-run results using a portfolio approach. The results
show that mergers announced during hot merger markets suffer from long-run reversal,
and that their announcement period returns are higher compared to mergers which are
announced outside of “hot merger periods”. Rosen explains that investors react
positively to merger announcements but revise their expectations later on.
An exhaustive research paper by Betton, Eckbo and Thorburn (2008) reviews the
research done in different phases of the acquisition process. As a part of their review
paper they conduct a long-term testing for a sample of 15,298 completed US mergers
during 1980–2003. They study three-year post-merger returns and also compare the
returns to matched firms of corresponding size and B/M ratio. The results show that
acquirers underperform significantly. The observed BHARs for acquirers using equal or
valueweights are respectively -21,9% and 17,1%. Betton et.al also measures the long-
run returns using a modified Fama-French (1993) model and a portfolio performance
estimation. The results are strikingly different, and show that there doesn`t appear to be
any significant underperformance. Betton et al. state that differences between event and
matched firms may partly cause the differencing result, but still conclude that they
cannot reject the hypothesis that merging firms underperform.
3.2. Results from long-term studies from other countries
Gregory (1997) studies large UK mergers over a period of 1984–1992. He uses several
benchmarks and research methods to minimize errors caused by the long research
period. The sample consists of 452 mergers and regardless of the research method, the
reported results show clearly that acquirers lost in the two year post merger period. The
findings are similar to other studies conducted in the UK and Gregory also notes that
company size or their book-to-market values don`t explain the negative post merger
returns.
Sudarsanam and Mahate (2003) follow the Rau and Vermaelen (1998) study and test if
there are similarities to be found using a UK sample. Sudarsanam and Mahate examine
both short- and long-term performance of value and glamour acquirers (measured by
P/E ratio and market-to-book value, MTBV) and also their method of payment and pre-
and post-merger performance. The study measures BHAR returns and uses four
different benchmark models: The mean-adjusted model, the market-adjusted model,

25
size-adjusted model and the market-to-book value adjusted model. Sudarsanam and
Mahate find that long-term returns depending on the benchmark index differ from -
21,9% to -8,7%. When comparing high P/E acquirers to low P/E acquirers, the results
show that BHARs for high P/E acquirers ranges from -47% to -17% but for low P/E
acquirers only from -9% to -2%. The results are similar when comparing high MTBV
(glamour companies) acquirers to low MTBV (value companies) acquirers. Sudarsanam
and Mahate conclude that the results are similar to the Rau and Vermaelen (1998) study.
Gregory (2005) tests the FCF hypothesis (see Jensen 1988) and how it might affect the
long-run post-merger returns. Gregory uses UK mergers from January 1984 to
December 1992 and a five-year post-announcement period to test the FCF hypothesis.
Gregory measures the abnormal returns by size and book-to-market matched returns,
and also creates specific reference portfolios for them using the methodology suggested
by Lyon, Barber and Tsai (1999). The results show that acquirers earn significantly
negative returns for the post-merger period, a finding similar as reported in Gregory
(1997). Gregory doesn`t find evidence supporting the FCF hypothesis for UK acquirers
and their long-term returns, although reporting weak support for the announcement
period. And an interesting finding is though that, acquirers with high FCFs tend to beat
acquirers with low FCFs in the post-merger period contradictive of what the FCF
hypothesis suggests.
Campa and Hernando (2006) examine the long-run returns in the European financial
sector. They use a one year post-merger period and study acquiring and target
companies. A small majority of their sample firms display negative returns for the post-
merger period, but there doesn`t appear to be any statistical significance. Later, the
authors further modify their sample and divide the included mergers based on their size
and if the merger is a domestic one or international. The results show that acquirers
completing smaller deals had significant negative long-run returns, while acquirers
making large deals earned positive abnormal returns of 6%.
Antoniou, Arbour and Zhao (2006) conduct a long-term test using UK mergers from
1985 to 2001, and also concentrate on the statistical methods and problems related to
long-term testing. (detailed discussion in chapter 4.2) They adopt a similar testing
method as Mitchell and Stafford (2000) i.e. “corrected” BHAR returns but Antoniou et
al. include multiple bidders in their sample, a choice they consider more appropriate as
“… multiple bids constitute a large part of merger population p.3” Antoniou et al. first
report statistically significant underperformance using “uncorrected” BHAR returns,

26
when using the corrected BHAR returns the reported test results become less significant
or lose their significance all together.
Antoniou et al. also conduct several statistical tests concentrating on previously
observed determinants of long-term underperformance. They test for the method of
payment (Loughran and Vijh 1997, Rau and Vermaelen 1998), diversification, book-to-
market effect (Rau and Vermaelen 1998) and size. They report that when adjusting the
original t-statistics, observed BHAR results seemed to disappear almost entirely and
displayed only weak significance. Antoniou et al. conclude that all conventional t-test
statistics are overstated when discarding the positive cross-correlation of stock returns.
This results in over-rejection of null hypothesis i.e. no abnormal returns.
Bogdanova (2007) studied in a master`s thesis the long-term performance of domestic
and foreign acquisitions made by Finnish companies. The research period is from 1995
to 2000, and includes 12 domestic and 21 cross-border acquisitions made by companies
in the OMXH main list. The reported results show a statistically significant negative
long-term BHAR return of – 33 % for the whole sample, and when further divided to
domestic and foreign acquisitions, they are – 9 % and – 47 % respectively. Bogdanova
mentiones that the results are similar of what has been reported in previous research
papers about domestic and foreign acquisitions.
Petmezas (2009) studies the short –and long-term performance (one to three years) of
public and private UK acquirers between 1984 and 2003. Petmezas studies both high –
and low valuation time periods measured by the overall P/E ratio of the value-weighted
market index and how investor sentiment affects the overall merger return, a similar
study was conducted by Rosen (2006) using US data. Petmezas employes a calendar
time portfolio method to avoid the problem of cross-sectional dependence of sample
observations. Petmezas finds evidence of similar investor over optimism as reported by
Rosen (2006) and also long-run revearsal where acquisitions announced during rising
stock markets cause a poor bidder performance in the long-run.
Dutta and Jog (2009) study the long-term performance in Canada. Their sample
includes 1300 M&A and span from 1993 to 2003. They use both event –and calendar-
time approaches (suggested by Kothari and Warner 2006) and several benchmarks to
test the long-term stock and operating performance. The researchers state that they are
using an out-of-the-sample study and the most modern and precise statistical methods.
Like in Betton et al. (2008) for US, Dutta and Jog find very conflicting results. When

27
using reference portfolios (indexes) as benchmarks, the BHAR returns are reported to
be statistically negative at a 1 %-level, but using control firms as a benchmark, the
results are not statistically significant anymore. Dutta and Jog report that these results
for acquiring firms are also robust when they account for different factors. Finally they
comment that the contrasting results to US studies which report underperformance may
be due to regulatory or capital market differencies.

28
4. EVENT STUDY METHODOLOGY
The event study methodology is useful when measuring the impact that some specific
event has on asset prices. Rationality in the market assures that asset prices will change
accordingly when new news becomes public. It can be applied to studies with a short or
long observation period and for observing the long-run results, like for instance M&A.
Event studies focusing especially on measuring short-horizon effects provide additional
information about corporate policy decisions and help to better understand them. Also,
for short-period studies the results are thought to be more reliable compared to long-
horizon studies. (Campbell, Lo and MacKinlay 1997: 149; Kothari and Warner 2006.)
The event study method has its roots in the 1930`s, but seminal studies were done in
1960`s (see Ball and Brown (1968) and Fama, Fisher, Jensen and Roll (1969)). Ball and
Brown studied the information content of earnings, whereas Fama et al. studied the
effects of stock splits. The event study method quickly established itself, and ever since
has been used extensively for measuring several different corporate events e.g corporate
mergers and their effects.
The existence of efficient capital markets creates problems when trying to evaluate and
interpret results of residual analyses i.e event study approach. An announcement of a
merger or tender offer provides considerable amount of information regarding e.g the
event itself, the identity of the acquirer or the method of payment. Even the information
about the acquisition could allready be incorporated in the security prices because of
information leaks or insider trading. The separation and evaluation of the reasoning
behind the merger announcements may therefore be difficult. (Halpern 1983: 298.)
4.1. Models for estimating abnormal returns
Several models have been developed for the testing of abnormal returns. The most
commonly used are, the Constant-Mean-Return-Model (CMRT) or the market model.
Brown and Warner (1985) find that despite the simple nature of the mean-return-model
it yields similar results to those of more complex design. Campbell et al. (1997:154)
explain that this is attributable to the fact that the variance of the abnormal return isn`t
reduced much by choosing more sophisticated methods

29
Fama (1998) explains that the market model is, used outside of the event window to
estimate the stock`s expected returns conditional on market returns for the specific event
period. And because these estimations are done without constraining the cross-section
of expected returns, thus can be used to study firm-specific events e.g mergers.
Campbell et al. (1997) recommend the market model over the CMRT, because the
market model can reduce the variance of the abnormal return and therefore yield better
results.
The market model is usually defined as:
(1) ��� � �� � ���� � ��
where Rit and Rmt are period-t returns for security i and the market portfolio respectively.
εit is the error term and αi and βi are parameters of the market model. When rearranged,
abnormal returns can be calculated:
(2) ���� � ��� � �� � ����� Where ARit is the observed abnormal return for stock i on day t.
Brown and Warner (1985: 4–5) report some problems associated to the use of daily data
in event studies. They summarize them as non-normality, non-synchronous trading and
market model parameter estimation, and variance estimation. Kothari and Warner
(2006) mention, that the use of daily data is preferred because it provides more accurate
measurements of abnormal returns and thus more informative studies.
Extensive testing has also been done on a couple of other well known models, like, the
Capital Asset Prising Model (CAPM), the Arbitrage prising model (APT), and with
several multifactor models e.g. the Fama-French (1993) three factor model. The Fama-
French model in particular has been used on several research papers studying the long-
term performance of M&A.

30
Fama-French three factor-model is defined as:
(3) � �� � �� �� � � � ����� �� � �� ��� � ����� �� � ����� �� � � ��
where, R(t)–RF(t) is the portfolios excess return, [RM(t) – RF(t)] is the excess market
return, SMB(t) is the excess return of small – big firms (market capitalization), HML(t) is
the excess return of high-book-to market – low-book-to market firms and ε(t) is the error
term. β1,β2 and β3 are estimated from the regression.
Also an important factor affecting the estimation and testing is the choice of the
benchmark index. Dimson and Marsh (1986) report when using capitalisation weighted
indexes, they can be expected to underperform equally-weighted portfolios of event
securities in case of powerful size effect, and similarly, an equally weighted index will
produce biased results if event securities differ greatly in size from typical companies
included in the index. The researchers also report serious problems when using CAPM-
type models.
4.2. Long-run event studies
The long-horizon event study for specific sample of firms tests, if one-to-five year
returns following a specific event are non-zero systematically. The basic thought behind
this, is that markets over- or under-react after a specific event because of human
judgements or behavioral biases. A systematic component in e.g. behavioral biases
doesn`t cancel them out, but appear in the security prices which continuously differ
from the underlying fundamentals. (Kothari 2001: 188; Kothari and Warner 2006.)
Fama (1998) challenges the behavioral explanation arguing that the existence of
efficient markets, presents and creates naturally over –and under-reaction by chance,
and also that the frequency for both is about the same. Fama also adds that if long-term
returns can`t be attributed to chance, i.e. the returns are too large, then the existence of
over –and under-reaction is a victory for the market efficiency. Finally, Fama argues
that studies for long-term returns usually neglect to test or offer any suitable alternative
to market efficiency, but instead relax on market inefficiency. Instead Fama states that if

31
the market efficiency is rejected, it should be done by some better model for price
formation, and one that can be tested by empirical tests.
Compared to short-event studies, long-horizon studies require an appropriate adjustment
for risk. While inadequate risk adjustment doesn`t affect the test results in short event
testing (or the effect is minimal), risk adjustment is usually the main reason for
difficulties in long-term testing. A small error in risk adjustment could be economically
substantial also the choice of return model is a cause of errors. (Kothari and Warner
2006.)
4.2.1. Models for testing long-run performance
Recent studies measuring the long-term performance of acquiring companies have used
mainly the Cumulative Abnormal Returns (later CAR) and BHAR returns to measure
the post-event returns. Fama (1998) explains that when measuring returns on a longer
time period than one month, the monthly average abnormal returns can be averaged or
summed (CAR). Kothari and Warner (2006) add that both testes provide also
information about market efficiency, as systematically non-zero abnormal returns
suggests inefficiency, and therefore a possibility for a trading rule. The CAR and BHAR
methods can be presented in a following way.
where, Rit is the simple return for month t for a sample firm, E(Rit) is expected return for
the sample firm at time t, and ARit is the abnormal return in month t. When cumulated
across (τ) periods yields CAR.
The return for a buy-and-hold investment for a sample firm (BHAR) is illustrated as
where, BHARit is the buy-and-hold abnormal return for company i over the time period
T.
( )[ ]ititt
it RERCAR −=∑=
τ
1
)4(
∏=
−+=T
titit ARBHAR
1
1)1()5(

32
Rosen (2006) explains that the choice of using a portfolio approach or BHAR method
leads to different trade-offs between type 1 or type 2 errors. The use of BHAR method
gives a lot of power for the hypothesis testing, but in turn may reject too many nulls
(type 1 errors). On the other hand, the use of the portfolio method fails to measure all
relevant information when aggregating individual events to calendar time portfolios.
This reduces the power of the hypothesis testing i.e (type 2 errors.)
Lyon et al. (1999) study improved methods for the long-term testing. The first method
is constructed around the basic BHAR method, but Lyon et al. improve the estimates by
controlling for the reported biases (a detailed discussion follows) in order to decrease
the misspecifications of test statistics. The second method is based on calendar-time
portfolios where abnormal retuns are calculated for sample firms. The first model for
calendar time-returns for a portfolio is estimated using a regression of the Fama-French
three factor model (equation 3). The estimated αi intercept denotes a test for null
hypothesis that the mean monthly excess return for a portfolio is zero.
The second method employed by Lyon et al. is for calculating Mean Monthly Calendar-
Time Abnormal Returns. For an event period of three to five years, abnormal returns for
portfolios are calculated first. Then for each calendar month i mean abnormal returns
(MAR t) across firms in the portfolio is calculated:
Where n is the number of stocks in the portfolio, and xit describes the weight when
abnormal returns are equal -or value-weighted. The grand mean monthly abnormal
returns (MMAR) can be then calculated as:
A very contemporary study by Jegadeesh and Karceski (2009) states that methods
suggested by Lyon et al. (1999) are now commonly used in studies concentrating on the
long-term performance of corporate events. They however are concerned about some
misspecifications and limitations in the Lyon et al. findings and suggestions. Therefore
Jegadeesh and Karceski develop improved methods for long-term testing designed to
∑=
=tn
iititt ARxMAR
1
)6(
t
T
t
MART
MMAR ∑=
=1
1)7(

33
overcome the problems in Lyon et al. They perform the testing using the same data
sample employed by Lyon et al. and their models are designed to take into consideration
the similar characteristics of sample companies (e.g same industry) and also the
possibility of multiple inclusions in the sample (i.e overlapping returns). Jegadeesh and
Karceski propose two models for autocorrelation-consistent test statistics. These models
are presented as:
where SC_t is the Hansen and Hodrick (1980) estimator which allows correlation across
monthly cohort results but assumes heteroskedasticity. The other estimator is HSC_t
which allows heteroskedasticity and serial correlation. (See Jegadeesh and Karceski
2009 for a detailed presentation of the estimator construction.)
4.2.2. Problems with long-run event studies
Because the aim of this study is to concentrate on the long-run performance of the
acquirers it`s imperative to consider some methodological problems that may arise.
Lately, there has been vivid discussion about how the long-term testing should be
conducted and which methods should be used.
Dimson and Marsh (1986) show that discarding the size effect when conducting a long-
horizon event study causes distortion in the test results, and therefore should be
controlled as part of the testing. Later studies by Fama and French (1992, 1993) and
Barber and Lyon (1997) confirm this. A conflicting result is reported by Lyon et al.
(1999) who find that controlling for size and the book-to-market isn`t enough to
produce well-specified test statistics.
As reported in Kothari and Warner and Barber and Lyon (1997) long-horizon event
studies tend to produce biased test results. Part of the biases is caused by using the
conventional t-statistic to measure the statistical significance of the abnormal returns.
vwSCw
HsampleARtSC
_´
)(_)8( =
vwHSCw
HsampleARtHSC
_´
)(_)9( =

34
Rau and Vermaelen (1998) report that the t-statistic suffers from assumptions of:
normality, stationary and time independence of observations. Jegadeesh and Karceski
(2009) state that in their tests of long-term performance of conventional t-statistics, their
results imply that the in the case of industry clustering or overlapping returns the t-tests
are miss-specified. They suspect that the reason is that the “…standard errors in a
random sample understate the true standard errors p. 109.” To avoid these problems
Lyon et al. (1999) advocate the use of bootstrapped t-statistics in favor of the
conventional t-test. (See Lyon et al. 1999 for a detailed discussion of the bootstrap
measure)
Kothari and Warner (1997) and Barber and Lyon (1997) show that, the use of the CAR
method alone for testing the long-horizon performance is susceptible for biases which
can lead to flawed test results and indicate e.g. abnormal returns where they don`t exists
compared to the BHAR method. They report that a survivor bias is possible in long-run
event studies, where sample firms are tracked for the post-event period but firms which
are included in the reference portfolio might start trading after the event month.
Rebalancing bias arises when the compounded returns are calculated differently for a
weighted market index and the sample firms. Also, skewness bias is caused by positive
skewness in the distribution of long-run abnormal returns. Lyon et al. (1999) add cross-
sectional dependance and a bad model of asset prising as causes for misspecification
and add that the choice of methods for the calculation of the abnormal returns will
determine if and how these factors affect the misspecification. Finally, Kothari (2001)
lists three problems with the long-horizon event studies: risk estimation, data problems
and lack of a market theory of market inefficiency.
Fama (1998) critizes both models for being susceptible for bad-model problems
especially for long-term studies, because when the average abnormal returns are
calculated over a long-horizon (compounded) it eventually becomes statistically
significant. Antoniou et al. (2006) add that cross-sectional dependance is caused by
companies which undertake several acquisitions during the long observation period,
causing their measured monthly returns to become non-independent because of the
overlapping of monthly returns.
Because of findings by e.g Gregory (1997), Betton et al. (2008) and Dutta and Jog
(2009), who report that the choice of the comparable benchmarks -or portfolios
significantly influence the test results and ultimately the conclusions drawn from them.
Antoniou et al. (2006) show that in their research, results for BHAR returns were

35
restricted only to equal-weighted results but they couldn`t find any underperformance
using value-weighting. Kothari and Warner (2006) add that despite the problems with
comparable return benchmarks, their use is still necessary in order to isolate the
increment effect a single event has on a security price performance.
As a conclusion it can be noted that Kothari and Warner (1997) and Barber and Lyon
(1997) strongly favour the BHAR method and suggest that for future studies the use of
nonparametric procedures like the bootstrapping method as ways to reduce the
misspecification of long-term testing. Fama (1998) and Lyon et al. (1999) recommend
that for long-run studies, researchers should apply the BHAR-method with
bootstrapping and also use calendar-time portfolios for the calculation of abnormal
returns.
Antoniou et al. (2006) and Jegadeesh and Karceski (2009) comment that the
bootstrapping method is also susceptible for errors as it assumes that sample firm
abnormal returns are independent. But because of the cyclical and clustering nature of
M&A, stock returns become positively cross-correlated and thus, test statistics which
assume observation independence become overstated. Therefore they strongly advocate
that future long-term studies would take the cross-correlation of sample stocks in to
consideration in order to obtain reliable statistical results.
In the end, much is known on how to make long-horizon event studies more accurate
but so far a method that could be completely trusted doesn`t exist. Also compared to
short-event studies long-horizon studies lack the power to succesfully measure the
abnormal returns inside and outside of the event window. The longer the horizon, the
worst are the results. (Kothari and Warner 2006.)

36
5. DATA DESCRIPTION AND METHODOLOGY
This chapter presents the methods used in the research paper, the sample for the study
and also the hypotheses for the study of the long-term performance of Finnish publicly
traded companies from January 1995 to June 2006 which complete acquisitions. As this
research paper uses the event study method, all required definitions are presented next.
Event study method is usually applied to study short-term abnormal returns where the
observed event period could be really short, usually denoted by e.g. [-5, 5], and the
studied event is included in the observation period. This research paper uses the event
study method to evaluate long-term performance and also the market model to estimate
the average returns for the observation period. The market model that is used in this
study is by definitions similar to equation number (2).
The average returns from the market model are estimated from the time period of [-360,
-30] i.e. 360 days before the first announcement date to 30 days before it. This is done
to obtain reliable estimates for the company alpha and beta estimates and also to avoid
the possible build-up (e.g. Halpern 1983 mentions information leaks) related to stock
returns. To minimize data lost some firms which are included in the data set have a
shorter estimation period.
This study concentrates on the long-run post-merger performance and this event
window is denoted by [40,750] i.e. beginning 40 days after the first announcement date
to 750 days after. The three year period is chosen because the majority of studies
assessing the long-term performance uses it, and it is long enough to sufficiently
evaluate the effects of the M&A.
After the interesting event and the observation period are both determined, a data set for
the study must be obtained. For this study, the data is received from the Thompson One
Banker Deals thorough the Department of Accounting and Finance of University of
Vaasa. Additional data is gathered from the databases of Helsinki School of Economics
(Helecon) and Kauppalehti Online and also from the ETLA database to obtain the
necessary accounting information.

37
5.1. Portfolio formation
After the interesting event has been chosen and event periods have been determined,
criteria for streamlining the original data sample must be chosen to determine which
companies are included in the study or why they are left out. Depending on the
completed long-term studies, researchers use different excluding methods of factors
when refining the original data. Loughran and Vijh (1997) discard target or acquiring
companies which are trading at less than three dollars on the effective date. Gregory
(1997, 2005) Sudarsanam and Mahate (2003) exclude acquirers that have a market
value less than 10M£. Dutta and Jog (2009) exclude firms from the financial sector
from their sample but include all acquisitions regardless of their size. Campa and
Hernando (2006) leave out acquisitions where the buyer already owned at least 50% off
the target company (a toehold). Similarly, Rosen (2006) doesn`t include toeholds where
acquirers gradually increase the size of their holding and also includes only acquisition
valued at least 10% relative to the acquirer. Rosen also requires that afterwards the
acquirer owns at least 90% of the target to be considered as a merger.
In this study, the following requirements are adopted:
–The acquisition is listed as completed in the original data sample.
–Sufficient stock return data must be available for the estimation purposes of the market
model and also companies must have available accounting information for the gathering
of their P/E and P/B values. If the bidder has had two or stock series listed, the one with
a higher liquidity is included in the sample.
–The acquisition has to be valued at least 10% compared to the acquirers book-value.
This is required to study acquisitions of greater significance. The 10 % cut-off rate is
also included in the OMXH Harmonized Disclosure Rules (2008) and as Ali-Yrkkö
(2002) reports a majority of acquisitions made by Finnish companies have been of small
targets so this limitation ensures that economically significant acquisitions are studied.
Although the 10% cut-off rate might be somewhat arbitrary, e.g. Rosen (2006) mentions
that his main research results hold also for acquisitions valued 5% to 25% relative to
acquirers` size.

38
–Toeholds are allowed, if the acquirer doesn`t control over 50 % of the target before the
acquisition, but does own at least 50 % afterwards, and at the same time the acquisition
is at least 10 % relative to the acquirers book-value. Again, this limitation is required for
the purpose of studying acquisitions of greater significance, as usually the acquirers just
increases their overall holding to just over 50 % i.e usually the required level for a
majority ownership, but the acquisition itself might be insignificant.
An un-necessary exclusion of firms that do not survive the full post-merger period could
lead to survivorship bias. An elimination of non-survivors with negative returns would
bias the sample performance estimates upwards. This bias may affect both the acquirers
and also control samples used as benchmarks. Still, it`s unclear what kind of an effect
the survivorship bias might have, in case of a merger or acquisition it could be positive
and in case of a bankruptcy or liquidation negative. If both samples have similar
elimination rates, the effect could be possibly canceled out. (Barber and Lyon 1997:356;
Sudarsanam and Mahate 2003.)
For this data set, the elimination rate is only 3,4% where as Sudarsanam and Mahate
(2003) report a 15,2% exit rate for non-survivors, a number previously shown to be
normal with UK acquisitions. In the case where an acquirer itself becomes a target, the
missing stock data for the three-year period is replaced by relevant benchmark return
following the reasoning in Mitchell and Stafford (2000).
After the data selection is completed, all surviving companies are assigned to portfolios
and from the original sample, 117 M&A survive the selection criteria when allowing for
multiple acquisitions and 87 acquisitions survive the Mitchell and Stafford (2000)
selection process i.e. only one acquisition per company is allowed for the three-year
post-merger period. In table 1 is shown the descriptive statistics from the formation of
the P/E and P/B portfolios.
The pre-merger valuations are calculated three months before the announcement date
and companies are included to portfolios based on this valuation. If the required
accounting information is unavailable the closest accounting release to the
announcement date is used to minimize data lost. The surviving sample of companies is
then divided to three equal parts based on their pre-merger valuation. These portfolios
are labelled glamour, neutral and value. Again to minimize data lost when forming
portfolios based on their P/E ratio, companies that reported negative earnings are
gathered to a separate portfolio denoted by neg. P/E. So in total, four P/E portfolios and

39
three P/B portfolios are formed and after the formation no rebalancing is conducted
following the reasoning in Mitchell and Stafford (2000).
Table 1. Descriptive statistics of P/B and P/E portfolios. P/B portfolios (allowing multiple bids) P/E portfol ios (allowing multiple bids)
N Median Low High N Median Low High
Value 39 1,10 0,28 1,56 Value 33 21,37 4,9 35,4
Neutral 39 2,16 1,57 2,95 Neutral 33 70,4 37,0 195,1
Glamour 39 5,30 3,00 80,91 Glamour 33 501,4 202 12220
(Neg P/E) 18
All acquirers (N=117)
2,14 All acquirers (N=99)
73,3
As can be seen from table 1, for the P/B portfolios the median P/B value for the
glamour portfolio is 2,45 times the median of neutral portfolio and almost five times the
median of the value portfolio. Even higher deviation is observable in the P/E portfolios.
There, the median of the glamour portfolio is over seven times the median of neutral
portfolio and astounding 23,46 times the median of the value portfolio. The reported
absolute high and low values in the P/E are also extremely high. Although the P/E ratio
doesn`t have any theoretical (positive) limitations, the low value of 202 and a high value
of 12220 are very unprecedented, and are a direct result of the baseless valuation that
several companies had in the turn of the millennium. Even the reported P/E ratio for the
neutral portfolio is unfamiliarly high.
Table 2. includes more descriptive statistics for the full sample. The merger activity for
the study period seems to increase towards the turn of the millennium, where almost
40% of the total M&A is completed between 1999 and 2001.

40
Table 2. Descriptive statistics of method of payment and size. Method of Payment Descriptive statistics
Year of Acquisition
N Cash Mi-xed
Equi -ty
Portfolio Size
N Median €
Low €
High €
1995 7 1 3 3 1996 4 3 - 1 Small 39 49,0M€ 10,4
M€ 120M€
1997 6 5 - 1 1998 9 3 2 4 Medium 39 308M€ 121,
2M€ 772,7M€
1999 10 5 1 4 2000 21 7 1 13 Large 39 1,89B€ 812,
8M€ 12,78B€
2001 14 9 1 4 2002 9 8 - 1 2003 7 6 - 1 2004 8 6 1 1 2005 10 4 2 4
2006 (June) 5 1 4 -
∑ 117 65 15 37
After the global economic downturn the number of acquisitions quickly drops, and
again, after the economy started to recover the M&A activity seems to be on the rise.
Table 2 also shows the statistics for the size portfolios. The sizes for the bidders vary a
lot, ranging from 10,4 M€ to 12,78 B€ measured by market capitalization.
In this sample, over a half of the M&A are financed using cash only, about one third
using equity only and 15 M&A are financed by the acquirer using both cash and equity
(denoted by mixed). Faccio and Masulis (2005) report that for their European sample a
majority of deals is financed using cash only (about 80%) with the lowest procentages
reported in Finland (66%) and Norway (69%). For US Betton et al. (2008) report that
the mixed form of payment is the most used followed by all equity deals and all cash
deals, and for the UK Sudarsanam and Mahate (2003) state that over 60% of the deals in
the sample are financed using the mixed method of payment and the rest spread between
all equity and all cash deals. The uneven deviation creates also problems for the present
study when drawing the statistical inferences for each of the portfolios.

41
5.2. Calculation of abnormal returns
The abnormal returns for each stock in the portfolio are done by firstly calculating their
daily abnormal returns:
where ARit is the abnormal return for the stock in the portfolio on day t, Rit is the
observed daily return and âi and βi parameters respectively are estimators calculated
using the market model. After the abnormal returns for individual stocks are calculated,
the long-run BHAR returns for stocks are then calculated using equation (5).
The performance of the portfolios is then compared to the OMXH25 and OMXH
general indexes, as many studies (e.g. Gregory 1997 and Rosen 2006) compare the
long-term performance of the portfolios to the general stock indexes. The performance
of an individual portfolio is then compared to the index using average abnormal buy-
and-hold returns, calculated as:
where, ABHART is the average abnormal return across a portfolio of companies during
a holding period T.
5.3. Statistical significance
In order to draw reliable conclusions about the calculated abnormal returns and their
meaningfulness, a statistical method must be employ to test the null hypothesis. A
standard t-test is used to observe if the BHAR returns are significantly different from
zero and also if the calculated means differ significantly from one another. Although its`
reported limitations, the t-test is and long has been used as the method for testing short –
and long-horizon post-event abnormal returns. In this study the following measure for
testing the t-value is employed:
)()10( mtiiitit RRAR∧∧
+−= βα
)/()12(
NBHAR
BHARBHAR
it
itt σ
=
∑=
=N
iTiT BHAR
NABHAR
1,
1)11(

42
where, BHARit is the portfolios average ABHAR return and σBHARit is the cross-
sectional standard deviation of 36-month mean abnormal returns.
5.4. Theoretical background
This section presents the theoretical background of the testable hypotheses. The main
hypotheses tested in this study are constructed based on findings by Rau and Vermaelen
(1998) in the US, and Sudarsanam and Mahate (2003) in the UK, who find that
acquirers pre-merger valuation affects the long-term performance of M&A. As proxies
of the valuation, these studies use acquirers P/E –and B/M-ratios, which are also chosen
for this research paper. Also hypotheses for the method of payment and size are tested.
The method of payment hypotheses was also tested by Rau and Vermaelen and
Sudarsanam and Mahate who show that cash financed acquisitions outperform those
financed with equity. Because of findings by Bauman et al. (1998) whom show that
value firms generally outperform similar sized glamour firms, I also test if acquirer size
affects the long-term post-merger performance.
5.4.1. P/E ratio
The price-earnings ratio (later P/E) is a simple and much used performance ratio. It`s
the current share price divided by most recent reported earnings per share. In a sector
level it is the current market value of all sector companies divided by total sector
earnings. A high P/E ratio implies that investors have high growth expectations for a
specific company, although irregular events affecting the share price naturally affects
the P/E ratio. A divergence of a sector average P/E might mean that a company is under
–or overvalued. Also and evident problem using the P/E ratio is that it uses accounting
profits instead of expected cash flows. The P/E ratio could also be considered as a
payback period, where e.g a P/E value of 18.7 would mean that it will take 18 or 19
years to recover the initial investment back. (Pike and Neale 2006: 45, 97.)
( )
−= ∑=
750
40
21)13(
imtitit RAR
NBHARσ

43
Basu (1977) was one of the first to study how a firms P/E ratio affects its performance.
Basu formed portfolios consisting of firms with similar P/E ratios and compared their
risk-return performance. Also the return of the low P/E portfolio was compared to a
portfolio constructed with random stocks to test the efficient market hypothesis. Basu
shows that portfolios with the lowest P/E ratios outperformed portfolios with a higher
P/E ratio, a result generally robust when adjusting for the risk accordingly. Basu
concludes that the information concerning the P/E ratio wasn`t completely assessed in
the security prices as quickly as it should have been, at least not during the studied time
frame. This result implies that the semi-strong form of the efficient market hypothesis
didn`t hold but couldn`t been completely denied.
Booth, Martikainen, Perttunen and Yli-Olli (1994) tested the E/P anomaly using US and
Finnish data for the period of 1976 – 1986. Their results confirm the existence of the
E/P anomaly in the US and also confirm the similar existence in Finland. Booth et al.
conclude that the results are interesting considering the major differences between the
Finnish stock market and other major stock markets. Pätäri and Leivo (2009) also
examine how portfolios constructed using e.g the E/P ratios perform against a market
portfolio in Finland. They report that a value portfolio constructed on the basis of the
E/P ratio outperforms the market portfolio statistically significantly during the
observation period from 1993 to 2008, but conclude that when a more precise measures
for kurtosis and skewness are used, the result isn`t significant no more.
Anderson and Brooks (2006) offer additional evidence on performance of the P/E ratio.
Studying UK firms from 1975 to 2003, Anderson and Brooks are able to show that
increasing the number of years from which the P/E is calculated, significantly increases
the predictive power of the P/E ratio. When using eight years of returns compared to
one, the observed value premium between glamour and value deciles is almost doubled.
Anderson and Brooks note that predictive power of the P/E ratio isn`t linear (years two
and three perform badly) and also mention that the bid-ask spread and liquidity had
effect on the value premium although marginal.
Welch and Goyal (2008) study several factors which in the financial literature have
been suggested as predictors for the equity premium, one being the E/P ratio. They
employ a conventional ordinary least squares (OLS) approach but statistical significance
of the variables is computed using bootstrapped F-values. Using the S&P 500 index
returns from 1926 to 2005, Welch and Goyal state that for the E/P ratio, the general
results show insignificant predictive performance and only vaguely significant

44
performance on certain specific time periods. Overall, almost all models based on these
predictors are unstable and perform badly. Welch and Goyal do admit that their analysis
are simple but nevertheless offer additional information of the validity of these models
and how to improve them in the future.
A very recent study by Barnhart and Giannetti (2009) studies also the predictive power
of E/P ratio (earnings yield) and its` predictive power in the US. The research divides
the E/P ratio to winner and loser components based on quarterly earnings releases from
companies, and measures the future stock return capabilities of these. Barnhart and
Giannetti find that the E/P ratio has predictive power for S&P 500 quarterly returns but
report that the negative earnings component (denoted EPLOS) is the main reason
behind this. They also report that when implementing market-timing strategies for
assessing the forecasting capabilities of the earnings measures, only the EPLOS
measure is able to generate excess returns which leads Barnhart and Giannetti to
conclude that “… the negative earnings component is the driving factor behind the
aggregate earnings-price yield and in our ability to significantly predict future market
returns p. 83 ”.
Firms considered as glamour acquirers are those which have high values as result from
a prior stock market performance. These stocks have high P/E and high market to book
value ratios. Inversely companies with low P/E and market to book values are
considered as value stocks. They could be undervalued but may offer positive value
gains in the future. More precisely, glamour firms have high growth rates and value
firms have low growth rates (Sudarsanam and Mahate 2003.) Rau and Vermaelen
(1998) state that for glamour firms, the ultimate decision makers (i.e large stock holders
or a board of directors) are more likely to accept acquisition proposals from company
management than value firm owners, whose company may have have suffered from a
poor track record and thus are more careful at approving major transactions. Rau and
Vermaelen report that this means that company directors aren`t suffering from the
hubris and therefore these acquisitions “…should create shareholder value rather than
destroy it p.226”.
International evidence of the performance for value vs. growth is provided by Bauman
et al. (1998). They study the performance of value vs. growth stocks in 21 countries, to
test if value stocks outperform growth stocks in non US-markets also. The study period
is from 1986 – 1996 and stocks are placed into portfolios based on four different
valuation methods one being the P/E ratio. The results for the full sample show that

45
value stocks (measured by the P/E ratio) outperform glamour stocks on a 1%
significance level.
As an explanation for the underperformance of M&A Rau and Vermaelen (1998)
propose a performance extrapolation hypothesis, where market participants would give
too much weight for the previous success of a bidding company concerning the
announced M&A bid. More specifically, Rau and Vermaelen argue that bidding
company managers are overoptimistic about their own abilities to manage the
forthcoming acquisition, and so, would be infected by hubris. They find evidence
supporting the hypothesis and show that markets are overly optimistic about the
prospects of glamour bidders and vice versa, overly pessimistic about value bidders
whom aren`t infected by hubris. Sudarsanam and Mahate (2003) test the same
hypothesis for the long-term performance of M&A in the UK and find also supporting
evidence for it. While Rau and Vermaelen (1998) don`t use the P/E ratio as a proxy for
the glamour/value status, Sudarsanam and Mahate advocate the use of it as “since P/E is
more widely used as a valuation tool in acquisition valuation… p.303”. This leads to the
first hypothesis, stated as:
H1: Low P/E acquirers (value acquirers) outperform high P/E acquirers
(glamour acquirers)
5.4.2. B/M ratio
The book-to-market ratio (B/M) has become a factor as a determinant of future expected
returns. It has been shown that the B/M ratio explains a significant portion of cross-
sectional variation in average returns. This could be because the B/M ratio proxies for
future cash flows, and thus is a proxy of cash flows for the current price level. More
specifically, holding expected cash flows constant, a positive increase in discount rate
leads to a lower market value but to a higher B/M ratio. Still, the observed effects have
been weaker on larger firms and the results might also been somewhat affected by data
mining. (Kothari and Shanken 1997; Pontiff and Schall 1998.)
The Price-to-Book (P/B) value is calculated as market value of a company’s market
value of its assets divided by their book value. As measure of the current valuation, the
higher the P/B value the higher is the appropriate valuation used by investors. A relative
high market valuation, high profitability etc. are factors which increase the observed
46
market value but don`t affect the book-value. The P/B ratio follows the development of
the return of assets (ROA), i.e. the higher is the ROA the higher is the value of P/B
value. Companies with high P/B ratios are considered to have high levels of profitability
and growth or those that have intangible assets that carry growth potential. (Kallunki et
al. 2009.)
An influential study by Fama and French (1992) reports that BE/ME factor has a
stronger relation to average returns than the size effect. For the research period from
July 1963 to December 1990 portfolios formed on the basis of BE/ME ranks, show
strong positive relation between average return and BE/ME. The reported effect is twice
as large as the difference between average returns of the smallest and largest size
portfolios. Furthermore, the combination of ME and the BE/ME factors include the
apparent roles of leverage and E/P ratio in average returns. Also an important finding is
that on average, low BE/ME companies have continuously high earnings compared to
high BE/ME firms which tend to have persistently low earnings.
Fama and French (1993) expand their earlier research and test how time-series
regressions especially their slopes (i.e. “factor loadings that unlike size or BE/ME have
a clear interpretation as risk factor sensitivities for bonds as well as for stocks” p.4) and
R2 values show if size and BE/ME risk factors capture shared variations of stocks and
bonds that other factors can`t explain. The results prove that portfolios made to mimic
risk factors related to size and BE/ME capture this variation, depend less of what else is
included in the time-series regressions. A result what Fama and French consider as
evidence that size and BE/ME are proxies for the sensitivity of common risk factors in
stock returns. The researchers do however point out that these factors alone can`t
explain the substantial difference of average returns of stocks and the one-month bills,
this is attributable for a market factor.
Kothari and Shanken (1997) test the predictive powers of B/M ratio and the dividend
yield on the US market. They use a bootstrap simulation to test the null hypothesis i.e
no predictive power, and also to test the economic significance of its determinants, i.e
the B/M ratio and the dividend yield. For a time period from 1926–91, they find
evidence that both ratios track the time-series variation in expected real one-year stock
returns. Still, Kothari and Shanken state that despite the success of the B/M ratio in
explaining cross-sectional variations of stock returns, it appears that the forecasting
power varies from time to time, and therefore should be remembered when making

47
future investment decisions. Welch and Goyal (2008) report that the B/M had excellent
predictive power until the oil shocks of the 1970s, but perform indifferently afterwards.
Also motivated by the Fama and French (1992) study, Pontiff and Schall (1998)
investigate how an aggregate B/M ratio forecasts market returns on Dow Jones
Industrial Index (DJIA). They report a similar result as Kothari and Shanken (1997) i.e
the B/M ratio predicts market returns, but additionally report its` capability to predict
the excess returns of small firms over large firms. Pontiff and Schall find also evidence
of a cross-sectional relationship between the B/M ratio and cash flows and recommend
that future research should be conducted on this relation in order to better understand
the relation of B/M and returns.
On an international level Bauman et al. (1998) report that portfolios constructed using
the P/B value and dividing the sample companies to value and growth firms, value
portfolios outperform glamour firms on a statistically significant 1%-level, a result
consistent with previous US studies. On a country level value stocks performed best in
Australia, France, Germany and Japan whereas growth firms outperformed in the UK.
In Finland, Pätäri and Leivo (2009) report that during their study period neither the
glamour nor value portfolios constructed using the B/P values, statistically differ from
the returns of the market portfolio which is an unusual finding. They do report that
value portfolios nevertheless perform better than the glamour portfolios.
Cohen, Polk and Vuolteenaho (2003) study what part of cross-sectional dispersion in
book-to-market ratios is caused by variation of expected stock returns, and how much is
caused by variation in expected cash-flow growth. They examine the US markets for a
long time period and also study international panel data. Cohen et al. report that their
findings suggests that 20 to 25 % of the book-to-market dispersion is due to dispersion
in expected stock returns, and rest due to dispersion in expected profitability. Cohen et
al. also report that for value strategies (long on value stocks, short on growth stocks),
the expected return on value-minus-growth coincides with times when the value spread
is high and the market is cheap i.e. it`s time varying.
Eleswarapu and Reinganum (2004) also study the predictability of stock returns
focusing on value and growth stocks. They report that annual excess returns of the stock
market (over the risk-free rate) are negatively related with past returns of glamour
stocks. While Eleswarapu and Reinganum are unable to find any predictive power for
value stocks, a glamour stock portfolio continues to predict future stock returns. This

48
finding implies that the probability of a major stock market decline increases following
periods when glamour stocks have performed exceptionally well. Welch and Goyal
(2008) also suggests further research on e.g. predicting disaggregated returns of value
and growth stocks. They speculate that value stocks could respond more strongly to
dividends, while growth stocks could respond more to book-to-market factors.
As discussed earlier, Rau and Vermaelen (1998) and Sudarsanam and Mahate (2003)
both use B/M proxy as a valuation method for value and growth acquirers. Both studies
report that value firms clearly outperform glamour acquirers, thus I construct the
following hypothesis:
H2: Low ME/BE acquirers (value acquirers) outperform high ME/BE
acquirers (glamour acquirers)
5.4.3. Method of payment
The chosen method for the payment of the M&A is an important one for the acquirer, as
they can make a decision to use either cash or issue new equity to finance the M&A.
Several studies have examined the reasons that influence the choice of payment and also
how it affects the overall outcome of the M&A afterwards. Also the current valuation of
the acquirer has been shown to influence the chosen method, e.g. overvalued companies
have an incentive to use their stock to finance the acquisition and use cash otherwise.
Sudarsanam and Mahate (2003) describe this as an adverse selection problem where the
acquirer and the target have a problem on how to adequately value the counterpart if
one or the other has private information of the true value of their company.
Several studies have also examined if the type of the merger (a merger or a tender offer)
and how it has been has financed affects the long-term performance of the acquirer. For
US e.g. Agrawal et al. (1992) find but don`t report that tender offers completed using
equity fare worse than those financed with cash and they find a similar result for
mergers also. Loughran and Vijh (1997) show that mergers completed using equity earn
a statistically significant negative returns of -25% compared to similar sized reference
stocks, and also that tender offers financed with cash earn statistically significant
positive returns of 61,7% compared to reference stocks. They though are a bit cautious
when interpreting the results, as they could be limited to the type of the acquisition or
caused by overoptimistic beliefs of markets or managers. In the UK e.g. Gregory (1997)

49
reports that equity financed M&A perform worse compared to cash financed and the
initial findings by Antoniou et al. (2006) confirm this but when they apply the corrected
t-test method the observed underperformance of equity financed M&A disappears.
Faccio and Masulis (2005) study also European M&A markets, stating that European
markets offer an excellent opportunity to examine several factors related to M&As
which don`t exists in the US markets. Faccio and Masulis argue that when making
M&A finance decisions, the bidder is facing a choice between cash –or equity finance
and their different implications. Cash offers e.g usually require more debt financing
leading to possible distress problems and equity financing in the other hand to corporate
control issues. These corporate control issues might be related to stock holding changes
or the ultimate power to control a firm. Faccio and Masulis show that corporations
prefer to use cash financing when there is a possibility of surrendering shareholder
voting power. On the other hand, bidders’ frequency to use equity finance increases if
the measures of their financial conditions get worse.
Rau and Vermaelen (1998) test a means of payment hypothesis that long-run abnormal
returns for acquirers will be on average negative in equity-financed and positive in cash-
financed deals. They find some supporting evidence for this hypothesis, reporting that
in the merger sample bidders typically pay using equity and cash in the tender offers.
More presicely glamour bidders pay with stock more frequently as compared to value
bidders but the means of payment hypothesis cannot predict the significant difference in
the tender offer sample were glamour acquirers fare much worse than value bidders.
Sudarsanam and Mahate (2003) conduct a similar test in the UK reporting supporting
results. They find that in high P/E portfolios there is higher tendency to use equity as a
source of financing the bid than cash, and an opposite result in the low P/E portfolio.
They also report evidence that for the long-term post-merger period, cash bidders
generally statistically outperform equity bidders. These findings lead to the following
hypotheses:
H3: Bidders using cash as a method of payment will outperform bidders
using equity as a method of payment

50
5.4.4. Size
An observable size effect would have important implications to both practioners and
academics. For asset management purposes the notion that small firms could yield
higher returns is particularly interesting, and for academics too, because a finding of a
risk-based explanation for the size effect would affect the standing academic view of
alternative asset prising models and thus impact the current research methods like the
event-study method and fund performance evaluation. It`s also of importance to study if
the size effect exists on international level, as various factors and characteristics like
corporate finance decisions or the level of market efficiency varies from country to
country. (van Dijk 2007.)
Banz (1981) is one of the earliest studies concentrating on the size effect and how it
affects average returns. Banz studies stocks listed in NYSE in the 1936-1975 period and
finds that small firms had, on average, higher risk-adjusted returns than the stock of
large firms. He shows that size effect isn`t linear, varies over time (it has a negative
value in 1946 – 1955) and it`s most pronounced for the smallest firms in the sample
while the differences between medium and large firms are insignificant. In the UK
Dimson and Marsh (1986) show that a size effect causes distortions in long-run event
studies, and thus produce different results depending if an equal –or a value-weighted
performance method is used. They strongly advocate that size-adjusted methods should
be used in event studies.
The Fama and French (1992, 1993) studies which report that company size (measured
by a stock`s price times shares outstanding, ME) is an important factor explaining the
cross-sectional variation in stock returns. When constructing portfolios based on size
only and observing their performance the Fama and French (1992) study confirms the
findings in Banz (1981) i.e there seems to exist a strong negative relationship between
size and average return. Fama and French also show that the smallest decile of firms
outperforms the largest firms by 0,74% per month, and that small companies have
higher returns in all stock indices which they study. In Fama and French (1993) they
expand their previous study by testing stock and bond returns. The results confirm that
portfolios designed to mimic size and BE/ME factors capture the normal variation in
stock returns and therefore size and the BE/ME factors proxy for the sensitivity to
common risk factors in stock returns. Fama and French note that, in almost all BE/ME
quintiles, average returns tend to diminish when moving from small –to bigger-size
portfolios.

51
Fama and French (2008) paper discusses several previously observed anomalies, their
causes and empirical shortcomings when studying them. They argue that e.g. when
studies are reporting results for equal-weighted returns for different size decile
portfolios, the researchers usually are focused on comparing the extreme size deciles
(large vs. micro cap) which Fama and French mention could be a problem as micro cap
stocks account only for roughly 3% of the overall index values but 60% of the total
number of stocks. Fama and French show that when measuring equal-weighted returns
micro cap stocks increase the average equal-weight return considerably. The opposite is
observed when comparing the value-weighted returns which are dominated by large cap
stocks, now the observed average value-weight retuns across all stocks is close to
average large cap portfolio return. Fama and French report that their results imply that
the size effect itself is strongest among the micro caps and has some effect on small and
large companies and their average returns.
Pätäri and Leivo (2009) examine if the size (Fama-French SMB factor) effect has any
impact on the observed value premiums when it is added to the regression models.
When comparing value and glamour portfolios Pätäri and Leivo report that although
size does create changes to the originally observed results, they aren`t statistically
significant leading them to conclude that the size anomaly does not explain the value
premium in Finland
Moeller et al. (2004) focus on company size and how it affects the observed
announcement period returns of M&A. For a large US sample they show that small
acquirers make profitable acquisitions, although small in absolute dollar value, whereas
large firms in the other hand make large acquisitions but also suffer large losses. Also,
regardless of the payment used in the acquisition small firms display higher
announcement period returns, results which are un-reversed over time (tested for
different subsamples).
Moeller et al. also study the reasons behind the observed size effect. They state that
small firms use cash more likely than equity to finance the acquisitions and also that
small and large firms have different characteristics which could help to explain the size
effect. The authors also report that in their sample equally-weighted abnormal returns
and similarly weighted abnormal dollar returns have opposite signs, an inclination of a
size effect. In the UK, Antoniou et al. (2006) state that the significant long-run BHAR
underperformance is observed only on equal-weighting and not in value-weighting
leading them to suspect that small firms are cause for the underperformance.

52
Although studies which account both acquirer size and the valuation effects are scarce,
international evidence is provided by Bauman et al. (1998) whom report that small non-
US companies fared considerably better than larger firms but that the observed quartile
returns decrease as the quartile size increases. The reported return spread between the
smallest –and largest cap is 11,2% (significant at 1% level) but Bauman et al. note that
the sample median for the smallest portfolio is very small and the standard deviation
very large. (See Fama and French 2008 for implications.)
Bauman et al. further examined how value and growth firms performed in similar size
deciles. They report that both the value –and the size effects influence the observed
average returns in all size deciles. The smallest value firms when measured by their P/B
value had the highest average returns in all size deciles (27,5%), and the largest value
firms outperformed their glamour counterparts by the highest margin (7,4%). To test if
similar value –and size effects are observable in Finnish M&A, I test the following
hypothesis:
H4: Value acquirers will outperform similar sized glamour acquirers
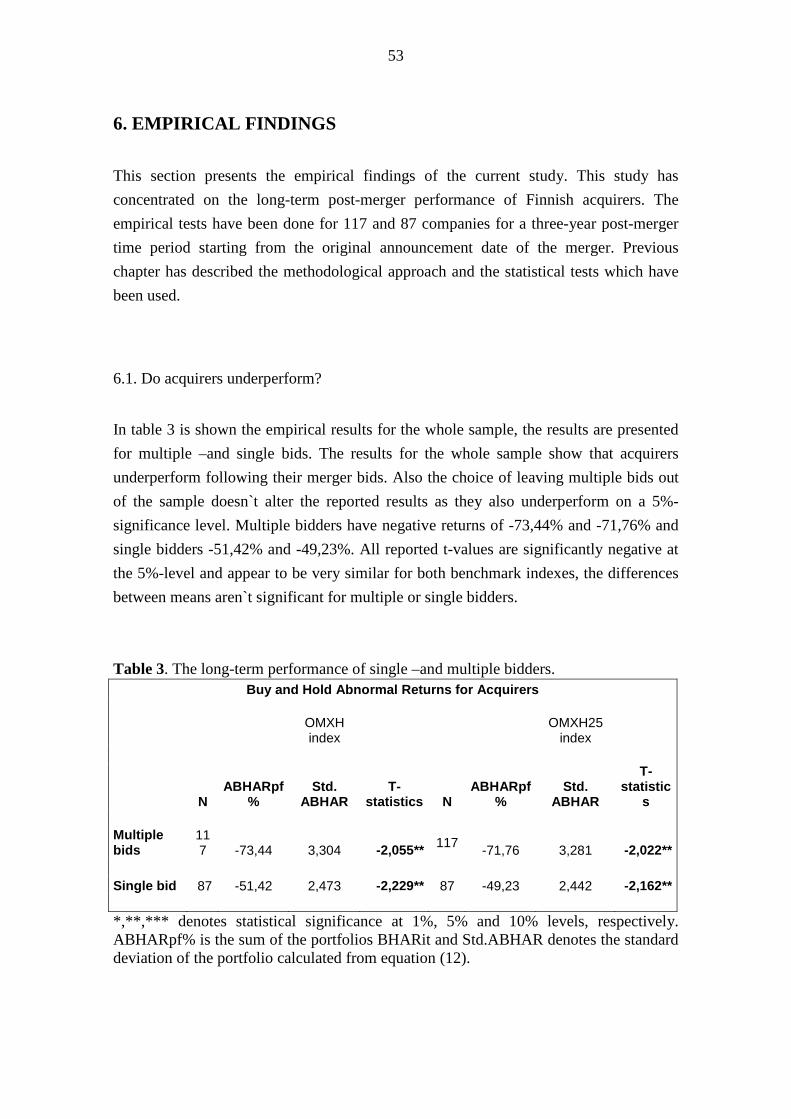
53
6. EMPIRICAL FINDINGS
This section presents the empirical findings of the current study. This study has
concentrated on the long-term post-merger performance of Finnish acquirers. The
empirical tests have been done for 117 and 87 companies for a three-year post-merger
time period starting from the original announcement date of the merger. Previous
chapter has described the methodological approach and the statistical tests which have
been used.
6.1. Do acquirers underperform?
In table 3 is shown the empirical results for the whole sample, the results are presented
for multiple –and single bids. The results for the whole sample show that acquirers
underperform following their merger bids. Also the choice of leaving multiple bids out
of the sample doesn`t alter the reported results as they also underperform on a 5%-
significance level. Multiple bidders have negative returns of -73,44% and -71,76% and
single bidders -51,42% and -49,23%. All reported t-values are significantly negative at
the 5%-level and appear to be very similar for both benchmark indexes, the differences
between means aren`t significant for multiple or single bidders.
Table 3. The long-term performance of single –and multiple bidders. Buy and Hold Abnormal Returns for Acquirers
OMXH index
OMXH25 index
N ABHARpf
% Std.
ABHAR T-
statistics N ABHARpf
% Std.
ABHAR
T-statistic
s Multiple bids
117 -73,44 3,304 -2,055** 117
-71,76 3,281 -2,022** Single bid 87 -51,42 2,473 -2,229** 87 -49,23 2,442 -2,162** *,**,*** denotes statistical significance at 1%, 5% and 10% levels, respectively. ABHARpf% is the sum of the portfolios BHARit and Std.ABHAR denotes the standard deviation of the portfolio calculated from equation (12).

54
The results are also very similar to other international studies. In the US e.g. Agrawal et
al. (1992) and Rau and Vermaelen (1998) report that acquirers significantly
underperform, and in the UK the same is reported by e.g. Gregory (1997) and
Sudarsanam and Mahate (2003). Overall the results suggest that acquirers clearly
underperform, but it could be too premature to confirm these results. As has been
discussed earlier, several problems and biases affect the outcome of long-term event-
studies and ultimately the conclusions drawn from them. Next, a more detailed look is
provided of the reported results as I further evaluate different causes affecting the long-
run results.
6.1.1. Results for P/E portfolios
This section presents the empirical findings of the Finnish post-merger performance for
both samples when portfolios are constructed based on the company pre-merger P/E
ratio.
Table 4 presents the empirical findings of value, neutral, glamour and the negative P/E
portfolios compared to the OMXH general- and OMXH25 indexes. The results clearly
show that on a 1% confidence-level, the neutral, glamour and the negative P/E
portfolios underperform while the value portfolio seems to perform in a very similar
way as both indexes. Only the value portfolios have a positive sign and abnormal
returns of 0,96% and 1,35% although either isn`t close to being statistically significant.
The negative abnormal returns for glamour, neutral and neg. P/E portfolios range from -
38,61% to -11,73%. Although the number of stocks in the negative P/E portfolio is less
than in the others and thus not really an exact comparable to the other portfolios, the
neg. P/E portfolio exhibits high negative abnormal returns and thus, high negative t-
values of -6,436 and -6,574 indicating that this portfolio (and the stocks included) suffer
immensely after completing M&A. The performance of the neg. P/E portfolio is
actually very similar to the glamour portfolio.
The reported results also are very similar to those reported in e.g Rau and Vermalen
(1998) for the US and in Sudarsanam and Mahate (2003) for the UK. None of the
portfolios seem to positively outperform their benchmark indexes, a similar result as in
th UK, but Rau and Vermaelen report that value acquirers had positive abnormal retuns
(7,4% for mergers). Bauman et al. (1998) finds also that on an international level, when
portfolios are constructed using the P/E ratio, value firms outperform growth firms on a
1%-significance level.

55
Table 4. P/E portfolios long-term performance. Buy and Hold Abnormal Returns for Acquirers
OMXH index
N ABHARpf% Std.ABHARpf T-statistics Value 33 0,96 0,029 0,209 Neutral 33 -11,73 0,772 -2,646* Glamour 33 -38,61 0,990 -6,789* Neg.P/E 18 -20,75 0,744 -6,574*
OMXH25 index
N ABHARpf% Std.ABHARpf T-statistics Value 33 1,35 0,784 0,301 Neutral 33 -11,88 0,769 -2,691* Glamour 33 -37,99 0,987 -6,697* Neg.P/E 18 -20,26 0,742 -6,436* *,**,*** denotes statistical significance at 1%, 5% and 10% levels, respectively. ABHARpf is the sum of the portfolios BHARit and Std.ABHARpf denotes the standard deviation of the portfolio calculated from equation (12).
In table 5 is reported the empirical findings using the Mitchell and Stafford (2000)
portfolio formation. The number of companies drops to 87 from 117 as multiple bidders
are excluded from the sample. The overall results are strikingly similar to table 4. Value
firms don`t display any statistically significant returns but neutral, glamour and the neg.
P/E portfolios all earn statistically negative abnormal returns. Compared to table 4 the
observed negative abnormal returns are now lower, ranging from -27,76% to -5,49%.
Similar results are reported by Loughran and Vijh (1997). When they exclude multiple
bidders from their sample, the results are similar as for the whole sample i.e acquirers
underperform.

56
Table 5. P/E portfolios long-term performance (single bid allowed). Buy and Hold Abnormal Returns for Acquirers (P/E)
OMXH index
N ABHARpf% Std.ABHARpf T-statistics Value 25 -0,71 0,596 -0,239 Neutral 25 -10,34 0,581 -3,558* Glamour 25 -27,76 0,727 -7,377* Neg. P/E 12 -14,23 1,095 -3,750*
OMXH25 index N ABHARpf% Std.ABHARpf T-statistics Value 25 0,83 0,594 0,279 Neutral 25 -8,23 0,579 -2,844* Glamour 25 -20,16 1,316 -3,063* Neg. P/E 12 -5,49 0,737 -2,149** *,**,*** denotes statistical significance at 1%, 5% and 10% levels, respectively.
In table 5 is reported the empirical findings using the Mitchell and Stafford (2000)
portfolio formation. The number of companies drops to 87 from 117 as multiple bidders
are excluded from the sample. The overall results are strikingly similar to table 4. Value
firms don`t display any statistically significant returns but neutral, glamour and the neg.
P/E portfolios all earn statistically negative abnormal returns. Compared to table 4 the
observed negative abnormal returns are now lower, ranging from -27,76% to -5,49%.
Similar results are reported by Loughran and Vijh (1997). When they exclude multiple
bidders from their sample, the results are similar as for the whole sample i.e acquirers
underperform.
Some peculiar changes though are worth mentioning. When comparing the performance
of value firms in tables 4 and 5, it seems that in full sample they had positive signs for
both benchmarks but in table 5 and compared to OMXH index they have a negative
sign. What is also interesting is that reported the abnormal returns for glamour
portfolios differ significantly from each other at a 1%-significance level, ranging from -
27,76% (OMXH) to -20,16% (OMXH25). Similar deviation wasn`t observed when

57
allowing multiple bids for acquirers. There is also an interesting difference with the
standard deviations of these two. The Std.ABHARpf for the glamour portfolio is a lot
lower when compared to OMXH index than OMXH25 index. The latter is also higher
than what was reported in table 4 although the total number of stocks in the portfolio is
lower. This finding implies that some stocks have a higher correlation with the OMXH
index than with the OMXH25, but also that using several benchmarks is recommend,
although it doesn`t alter the reported results. The t-values for the neg. P/E portfolio
seem to vary also, but the result could be more of a product of the low number of stocks
(N=12) which affects the statistical inferences.
In the end, when using the P/E ratio as the valuation method, leaving multiple bidders
out of the sample doesn`t change any of the previously reported results and based on the
findings in tables 4 and 5, the results show that hypotheses H1 is strongly supported.
6.1.2. Results for P/B portfolios
This section presents the empirical findings of the Finnish post-merger performance for
the full sample when the portfolios are constructed based on the company P/B ratio.
Table 6 presents the performance of the P/B portfolios compared to the OMXH and
OMXH25 indexes. The reported results show that only the glamour portfolio
underperforms statistically significantly and the result is similar for both benchmarks.
The glamour portfolios have very high negative abnormal returns of -53,37% and -
51,34%. These ABHARpf values for the glamour portfolios are six or seven times
higher than those of value or neutral portfolios. Also the standard deviation of the
glamour portfolio is the highest of the portfolios. The neutral portfolio has a t-value of -
1,45 which is close of being statistically significant at the 10% level when comparing to
the OMXH index, but becomes only -1,356 for the OMXH25 index. An interesting
result compared to P/E portfolios is the negative sign for the value portfolios. Although
not statistically significant, it implies that value firms were unable to undertake
profitable acquisitions, while e.g Rau and Vermaelen (1998) reported a statistically
significant positive performance for value acquirers.

58
Table 6. P/B portfolios long-term performance. Buy and Hold Abnormal Returns for Acquirers
OMXH index
N ABHARpf% Std. ABHARpf T-Statistics Value 39 -6,84 0,948 -1,155 Neutral 39 -8,21 0,907 -1,45 Glamour 39 -51,34 1,415 -5,808*
OMXH25 index N ABHARpf% Std. ABHARpf T-Statistics Value 39 -8,78 0,967 -1,45 Neutral 39 -7,67 0,905 -1,356 Glamour 39 -53,37 1,383 -6,180* *,**,*** denotes statistical significance at 1%, 5% and 10% levels, respectively.
In table 7 is shown the results when multiple bidders are left out of the sample. The
results are quite similar to table 6 but some changes do appear. The value portfolios
again don`t show any statistically significant performance and the original signs remain
the same. Neutral portfolios in the other hand, now appear to underperform on a 5%-
significance level, the t-values being -2,332 and -2,15. The reported ABHARpf value
for the neutral portfolio is almost identical with table 6 but the standard deviation is
lower for single bidders. This result is a bit puzzling as it suggests that neutral valuation
multiple bidders could actually fare better than single bidders. An opposite result is
observable in the glamour portfolio where the reported underperformance becomes
much lower but the reported t-values actually become higher than in table 6.
The reported result for P/B portfolios compared to both indexes are very similar to those
reported in Rau and Vermaelen (1998), Bauman et al. (1998) and Sudarsanam and
Mahate (2003). A different result is found by Petmezas (2009) who reports that mean
differences between high –and low valuation bidders to be insignificant for the three-
year post-merger period.

59
Of course, the reported results could again be affected by measurement problems and
other biases. Still, like in table 6 the original hypotheses H2 is supported, although all
reported signs in tables 6 and 7 are negative suggesting that companies undertaking
M&A underperform, the results clearly support the stated hypotheses H2 i.e. value firms
outperform glamour firms when their P/B values are used.
Table 7. P/B portfolios long-term performance (single bid allowed). Buy and Hold Abnormal Returns for Acquirers
OMXH index
N ABHARpf% Std.ABHARpf T-statistics Value 29 -3,71 0,733 -0,939 Neutral 29 -8,82 0,703 -2,332** Glamour 30 -43,01 0,961 -8,172*
OMXH25 index N ABHARpf% Std.ABHARpf T-statistics Value 29 -3,47 0,731 -0,881 Neutral 29 -8,10 0,700 -2,15** Glamour 30 -45,16 0,893 -9,224* *,**,*** denotes statistical significance at 1%, 5% and 10% levels, respectively.
6.1.3. Results from Method of payment
The results from the empirical tests of method of payment and it`s effects to the long-
term post-merger performance are shown in table 8. The observed results show clearly
that acquirers using only equity or a mixed finance underperform the benchmark
indexes on a statistically significant 1% level. For the M&A which were completed
using cash to finance them, the results aren`t nearly as conclusive. Acquisitions
completed using cash only perform also poorly with negative abnormal returns of -
20,5% and -19,96% compared to the benchmarks. Their reported t-statistics (-1,545 and
-1,570) are very close to being statistically significant at the 10% -level (a t-value of
1.645).

60
Table 8. The effect of method of payment to long-term performance. Buy and Hold Abnormal Returns, Method of Payment
OMXH index
N ABHARpf% std.ABHARpf T-statistics Cash 65 -19,96 1,603 -1,545 Mixed 15 -16,76 0,448 -9,657* Equity 37 -39,98 1,222 -5,381*
OMXH index N ABHARpf% std.ABHARpf T-statistics Cash 65 -20,50 1,619 -1,57 Mixed 15 -16,66 0,439 -9,801* Equity 37 -27,60 1,149 -3,950* *,**,*** denotes statistical significance at 1%, 5% and 10% levels, respectively.
The high number of stocks in the cash portfolio does increase the validity of the
observed t-value while the results for the mixed portfolio with a low number of stocks
might remain inconclusive despite its` high t-value. The differences between the
benchmark indexes are also minimal as only in the equity portfolio happens sizable
changes. When comparing the reported ABHARpf values for equity portfolio, it is
significantly smaller when the performance is compared to the OMXH25 index than to
OMXH index. The difference between reported t-values for equity portfolio differs from
one another at the 1%-significance level.
The reported results are broadly similar when compared to other international studies.
For US Loughran and Vijh (1997) report that equity financed mergers underperform
statistically significantly but mixed or cash financed merger deals don`t. For tender
offers they report that cash deals underperform. Moeller et al. (2004) on the other hand
don`t report any statistical abnormal performance for their long-run sample. In the UK
Sudarsanam and Mahate (2003) report that cash acquirers clearly outperform equity
bidders. For the post-merger period, cash bidders earn abnormal returns ranging from -
2% to 14% compared to equity bidders -2% to -57%. The results by Petmezas (2009)
also show that almost all deals (cash, equity or mixed) underperform the following three
year post-merger period. He also reports that the observed magnitude of the
underperformance increases from the first post-merger year to the third-post merger

61
year. Overall though, the reported results in table 8 support the H3 as cash bidders
although having a negative sign, outperform equity bidders.
6.1.4. Results for Size
Table 9 shows the results of acquirer performance when portfolios are constructed using
market capitalization as a measure of size. The results are very clear, showing that both
medium and small acquirers clearly underperform at a statistically significant 1%-level.
And also what is notable is that medium acquirers have an ABHARpf value about twice
higher than the small firms and over five times higher than large firms. The large
bidders also have a negative sign suggesting that they fare worse than the benchmark
indexes, but the negative abnormal returns of -7,62% and -7,32% and the reported t-
values (-1,175 and -1,22) are far from being statistically significant.
Table 9. Long-term performance of large, medium and small acquirers. Buy and Hold Abnormal returns
Acquirer size OMXH index OMXH25 index N ABHARpf% T-values ABHARpf% T-values Large 39 -7,62 -1,175 -7,32 -1,22 Medium 39 -42,98 -5,89* -41,24 -5,68* Small 39 -21,71 -3,00* -21,81 -3,01* *,**,*** denotes statistical significance at 1%, 5% and 10% levels, respectively.
The results imply that a measurable size effect affected the Finnish M&A at least during
this observation period, but at the same time the results are somewhat inconsistent with
other earlier studies. This finding might be caused by the fact that the employed
benchmark indexes do not sufficiently control for company size. Another plausible
reason might be that the managers of large companies are more capable than their small
firm counterparts or that small firm managers might be affected by hubris. (Confirming
tests for these possibilities are left for future studies). Bauman et al. (1998) show, that
small firms had the highest overall returns and also the highest standard deviation each
year. They also report that the reported returns got smaller as the size decile grew.
Moeller et al. (2004) state that for their full sample they were unable to find any

62
statistical differences between large and small acquirers, but the results show that when
they acquire private companies large firms outperform small bidders significantly.
In table 10 is shown the calculated t-values for each individual size portfolio which are
further decomposed to value, neutral and glamour bidders. It must be immediately
mentioned that the low number of stocks in an individual portfolio (N=13) affects the
measurements and therefore also the validity of these findings. Still, the results are
largely what to be expected, as several portfolios display severe underperformance
regardless of the size or valuation level.
Table 10. The long-term effects of size and valuation.
Buy and Hold Abnormal Returns
OMXH index Size
Valuation Large Medium Small
ABHARpf(%) -0,35 -33,30 -17,63 Glamour (-0,235) (-17,637*) (-10,611*)
-7,44 -10,27 -1,40 Neutral (-7,650*) (-8,318*) (-1,160)
-0,32 0,58 -2,67 Value (-0,312) (0,537) (-2,045**)
OMXH25 index
ABHARpf(%) 0,15 -32,81 -17,49 Glamour (0,101) (-17,478*) (-10,544*)
-7,27 -9,14 -1,60 Neutral (-7,522*) (-7,400*) (-1,318)
-0,20 0,70 -2,72 Value (-0,194) (0,651) (-2,082**)
*,**,*** denotes statistical significance at 1%, 5% and 10% levels, respectively. In this table is shown the ABHARpf values for every size/valuation portfolio and also their t-values in parentheses.
It appears again that glamour firms are the primary source of the poor post-merger
performance, but the magnitude is very different across the size groups. The highest
observed ABHARpf% difference (-33,88%) is between medium sized value and
glamour firms, and the smallest between large value and glamour firms only 0,03%. In
the large portfolio, a majority of it`s poor performance reported in table 9 appears to be

63
caused by neutral valuation companies which perform badly while glamour and value
bidders do not show any over –or underperformance.
Additional comparison reveals that the tested hypothesis H4 isn`t supported, as on an
intra portfolio level, value firms do outperform their glamour counterparts in the small
and medium portfolios, in the large portfolio though the hypothesis is rejected. Large
value firms are unable to outperform large glamour firms, although as mentioned, the
number of stocks per portfolio is low and therefore a very poor performance by a single
bidder could cause the results to be biased.
Even so, a more detailed discussion of some of the results is in order. Firstly, it appers
that, a size -and a valuation effect does seem to affect the long-term post-merger
performance, and the effects are observable in almost all individual size/valuation
groups. Small value firms fare worst when compared to medium –and large value firms.
The small firms underperform on a statistically significant 5%-level while no under –or
overperformance is found for medium and large value firms. The opposite is evident
when comparing neutral portfolios. Regardless of the size of the acquirer, they all have
a negative sign and the observed t-value for small acquirers is the only one
unsignificant. Again for glamour acquirers, a complete reversal is notable.
Large glamour companies clearly outperform their medium –and small counterparts
which both perform poorly. Bauman et al (1998) report, that in their study the largest
difference between glamour and value companies was in the largest size group while the
smallest difference was between small value and growth stocks. They also state that
among medium and large companies value stocks outperform growth stocks.
Secondly, as was reported in several tables before, the choice of the benchmark index
doesn`t appear to be significant. All results appear to very stable regardless of which
benchmark is used as only change in the reported sign between benchmark indexes
happens in the portfolio of large glamour firms and even the magnitude for this change
remains statistically un-significant.

64
7. CONCLUSIONS AND RECOMMENDATIONS
The present study has studied how pre-merger valuation, size and the chosen method of
payment affect the long-term performance of the acquiring companies in Finland. A
time period from 1995 – 2006 was studied and the performance of 117 mergers and
acquisitions evaluated using an event study method.
The event study results were very convincing and rather stable regardless of which
benchmark index was used to measure the post-merger performance. The results
showed that all acquirers underperformed on a 5%-statisticly significant level, but most
of the underperformance was later shown to be attributable for glamour acquirers which
fared very poorly. The complete sample had negative abnormal returns of -73,44% and
–71,76 for multiple bidders and -51,42% and –49,23% for single bidders, and the
removing of multiple bidders from the sample didn`t have any statistical effect on the
observed results. The reported abnormal returns though are extremely high compared to
many other similar studies, as previously have been reported abnormal returns ranging
from -25% downwards.
As a majority of the sample firms cluster to the turn of the millennium, the large
difference with previous studies and their reported long-term returns could be partly
caused by a “peripheria” syndrome. As discussed, the majority of the long-term
performance studies have been conducted in the US and UK, but Finland as a remote
financial market is more thinly traded as compared to many other markets and this
might cause more extreme variation in stock returns. Foreign investors particularly are
more eager to pull their investments out in an event of economic downturn and therefore
facilitating excess variation to stock returns.
When further dividing the sample based on individual stocks pre-merger valuation, the
poor performance of high valuation companies becomes evident. Almost all portfolios,
discarding the value i.e. low valuation portfolio, had negative abnormal returns and
underperformed on a one or a five percent significance level. The reported results are
very similar as what has been found on other international studies. Rau and Vermaelen
(1998) reported for a US sample that value firms outperformed glamour firms, but I was
unable to find any significant positive abnormal returns for value firms as reported by
Rau and Vermaelen. On an international level, broadly similar results were reported by
Bauman et al. (1998) and in the UK by Sudarsanam and Mahate (2003).

65
When testing the effects of chosen method of payment the results remained very robust.
Cash –or equity only and the mixed finance portfolio all had negative abnormal returns
ranging from -39,98% to -16,76%. Acquisitions financed using cash only, didn`t
underperform on a statistically significant level like the other portfolios thus supporting
reported findings from other countries. The very poor performance of the equity
financed deals implies that high valued acquirers were using overvalued stock to
complete their M&A.
Finally, when evaluating if acquirer size affects the outcome of the M&A, sample
companies were divided to size portfolios based on their market cap. Again all acquirers
underperformed but interestingly large firms fared the best. While medium and small
firms underperformed poorly, the reported negative t-value for large firms was un-
significant. A size effect did indeed appear for this time period but it suggests that large
firms could be better acquirers than medium and small bidders. van Dijk (2007) reports
in his review paper that several studies show that the size effect is time varying and in
this paper size adjusted benchmarks weren`t used so the confirmation of these results is
left for future studies.
When each size portfolio was further decomposed based on company pre-merger
valuation, several interesting results appeared. It must be noted that this lead to very
small individual portfolios casting a doubt on the reported results and the validity of the
findings. For the large portfolio, majority of the previously reported underperformance
was caused by neutral valuation companies which had high negative returns, while
glamour and value firms fared fairly well. In the case of the large portfolio, hypothesis
H4 was rejected as no statistical significance was found between value and glamour
firms. Medium sized value firms outperformed other similar sized companies easily, but
opposite results were again found for small acquirers. Now, while the glamour firms
again had very high negative returns neutral firms were able to outperform value firms.
The results reported in table 10 especially are somewhat susceptible as each portfolio
had only 13 stocks in them.
Overall, the results clearly imply that acquisitions undertaken by Finnish companies
where very unsuccessful. While the three-year post-merger period might not be
sufficient enough to fairly judge the acquisition choices or their eventual success, at a
first glance they seemed to destroy shareholder value rather than maximize it.

66
Several possibilities for future research have risen during this study. First of all, more
sophisticated research methods should be used. As reported by Antoniou et al. (2006)
and Dutta and Jog (2009) the use of the “corrected” t-values suggested by Mitchell and
Stafford (2000) when measuring BHAR returns is highly recommend. Antoniou et al.
state that several previously reported abnormalities disappeared entirely or the reported
results became less significant when more precise statistical methods were employed.
The results found in this study might also be altered or corrected by using the
“corrected” t-values.
Another path that could be taken is the evaluation of multiple bidders and how they
fare. While leaving multiple bidders out of the sample didn`t alter the reported results, it
doesn`t really give an idea how they perform and how much and if they actually over –
or underperform in the long-term. And as has been noted in several studies M&A
cluster in time and by sector, so a choice to leave them out doesn`t represent the true
reality of the markets.
Future studies could also try to employ a more complete acquisition sample. As nearly
two decades have passed since Finnish financial markets became more open and more
efficient, a more thorough investigation of the completed mergers could be in order, e.g.
dividing the full sample to sub-samples, concentrating on the turn of the millennium etc.
While Kallunki et al. (2009) examine the reasons and consequences of foreign bidders’
acquisitions of Finnish companies; similar study regarding domestic acquisitions could
be insightful. These might ver well offer more insights about the M&A markets of
Finland. Also some additional explanatory factors could be tested, like the relative
bidder/target size, is the merger diversifying or non-diversifying or does acquiring
public or private companies produce different announcement period or long-term
results.
As almost all of the threats described in the M&A outlook (2007) became reality very
soon after, somewhat ironically even, the M&A markets experienced a rapid halt. The
worldwide economic disaster caused firms to streamline and cancel or delay their
ongoing projects. Now, two years later the current low interest rate-level and
expansionary monetary policies are again offering a boost to faltering economies and
businesses. In light of the events of last few years, it is therefore interesting to see if the
probable resurrection of the acquisition markets is approached by bidders and managers
in a more careful way. Do they continue to make questionable acquisitions or are we
going to see companies concentrating more on internal growth instead?

67
REFERENCES
Agrawal, Anup, Jeffrey F. Jaffe & Gershon N. Mandelker (1992). The Post-Merger
Performance of Acquiring Firms: A Re-examination of an Anomaly. The
Journal of Finance 47:4, 1605–1621.
Agrawal, Anup & Jeffrey F. Jaffe (1999). The Post-Merger Puzzle [online]. [cited 25-
10-2009] Available from the World Wide Web:
<URL:http://bama.ua.edu/~aagrawal/post.pdf>
Ali-Yrkkö, Jyrki (2002). Mergers and Acquisitions – reasons and results. ETLA
Discussion papers. No. 792. ISSN 0781-6847
Anderson, Keith & Chris Brooks (2006). The Long-Term Price Earnings Ratio. Journal
of Business Finance & Accounting 33:7–8, 1063–1085. doi:
10.1111/j.1468-5957.2006.00621.x
Andrade, Gregor & Erik Stafford (2004). Investigating the economic role of mergers.
Journal of Corporate Finance 10, 1–36. doi:10.1016/S0929-
1199(02)00023-8
Antoniou, Antonios, Philippe Arbour & Huainan Zhao (2006). The effects of the Cross-
Correlation of Stock Returns on Post Merger Stock Performance
[online]. [cited 15-1-2010]Available from the World Wide
Web:<URL:http://papers.ssrn.com/sol3/papers.cfm?abstract_id=493882>
Asquith, Paul (1983). Merger bids, Uncertainty and stockholder returns. Journal of
Financial Economics 11, 51–83.
Ball, Ray & Philip Brown (1968). An Empirical Evaluation of Accounting Income
Numbers. Journal of Accounting Research 6:2, 159–178. Available from
the World Wide Web :<URL:http://www.econ.sdu.edu.cn/jrtzx/
uploadfile/pdf/ empiricalfinance/27.pdf>
Banz, Rolf W. (1981). The Relationship between Return and Market Value of Common
Stocks. Journal of Financial Economics 9:1, 3–18.
68
Barber, Brad M. & John D. Lyon (1997). Detecting long-run abnormal stock returns:
The empirical power and specification of test statistics. Journal of
Financial Economics 43:3, 341–372.
Barnhart, Scott W. & Antoine Giannetti (2009). Negative earnings, positive earnings
and stock return predictability: An empirical examination of market
timing. Journal of EmpiricalFinance 16, 70–86.
doi:10.1016/j.jempfin.2008.04.001
Basu, S. (1977). Investment performance of common stocks in relation to their price-
earnings ratios: a test of the efficient market hypothesis. The Journal of
Finance 32:3, 663–682.
Bauman,W. Scott, C. Mitchell Conover & Robert E. Miller (1998). Growth versus
Value and Large-Cap versus Small-Cap Stocks in International Markets.
Financial Analysts Journal March/April, 75–89.
Bean, D. G. (1975). Financial Strategy in Acquisition Decision. Gower Press Limited,
p.175 ISBN:0-1761-0268-4
Berkovitch, Elazar & M. P. Narayanan (1993). Motives for Takeovers: An Empirical
Investigation. Journal of Financial and Quantitative Analysis 28:3, 347–
361.
Betton, Sandra, B.Espen Eckbo & Karin Thorburn (2008). Corporate Takeovers. Tuck
School of Business, Working paper No. 2008-47 [online]. [cited 2-11-
2009] Available from the World Wide Web:
<URL:http://mba.tuck.dartmouth.edu/pages/faculty/karin.thorburn/
publications/Ch15-N53090.pdf>
Bogdanova, Nadejda (2007). Long-run post-merger performance of the Finnish
companies. 63 p. Unpublished. Library of University of Vaasa.
Booth, Geoffrey G., Teppo Martikainen, Jukka Perttunen & Paavo Yli-Olli (1994). On
the functional form of earnings and stock prices: International evidence
and implications for the E/P anomaly. Journal of Business
Finance & Accouning, 21:3, 395–408.
69
Brown, Stephen J. & Jerold B. Warner (1985). Using daily stock returns: The case of
event studies. Journal of Financial Economics 14:1, 3–31.
Campbell, John Y., Andrew W. Lo & A. Graig MacKinlay (1997). The Econometrics of
Financial Markets. Princeton University Press, 611 p. ISBN:0-691-04301-
9
Campa, José Manuel & Ignacio Hernando (2006). M&As performance in the European
financial industry. Journal of Banking and Finance 30:12, 3367–3392.
doi:10.1016/j.jbankfin.2006.06.006
Capron, Laurence (1999). The long-term performance of horizontal acquisitions.
Strategic Management Journal 20:11, 987–1018. doi:
10.1002/(SICI)1097-0266
Cohen, Randolph P., Christopher Polk & Tuomo Vuolteenaho (2003). The Value
Spread. Journal of Finance 58:2, 609–641. Stable URL:
http://www.jstor.org/stable/3094552
Devos, Erik, Palani-Rajan Kadapakkam & Srinivasan Krishnamurthy (2008). How do
Mergers Create Value? A Comparison of Taxes, Market Power and
Efficiency Improvements as Explanations for Synergies. [online]. [cited 1-
11-2009]. Available from the World Wide Web:
<URL:http://leedsfaculty.colorado.edu/bhagat/
HowDoMergersCreateValue.pdf.>
Dijk van, Mathijs A. (2007). Is Size dead? A Review of the Size Effect in Equity
Returns [online]. [cited 21-03-2010].Available from the World Wide:
<URL:http://papers.ssrn.com/ sol3/papers.cfm?abstract_id=879282>
Dimson, Elroy & Paul Marsh (1986). Event study methodologies and the size effect:
The case of UK press recommendations. Journal of Financial Economics
17:1, 113–142.
Draper, Paul & Krishna Paudyal (2008). Information Asymmetry and Bidders` Gains.
Journal of Business Finance & Accounting 35:3–4, 376–405.
doi:10.1111/j.1468-5957.2008.02082.x

Dutta, Shantanu & Vijay Jog (2009)
re-examination of an anomaly.
1412. doi:10.1016/j.jbankfin.2009.02.004
Eleswarapu, Venkat R. & Marc R. Reinganum (2004).
Stock Returns:
77:2, 275– 294.
Faccio, Mara & Ronald W.
European Mergers
Stable URL: http://www.jstor.org/stable/3694929
Fama Eugene F., Lawrence
adjustment of
Review 10:1, 1
the World Wide Web: <URL:
http://web.ebscohost.com.proxy.tritonia.fi/ehost/pdf?vid=8&hid=104&sid
=958801ad-b875
Fama, Eugene F. & Kenneth R. French (1992).
Returns. The
Fama, Eugene F. & Kenneth R. French (1993).
stocks and
Fama, Eugene F. (1998). Market efficiency, long
Journal of
405X(98)00026
Fan, Joseph P. H. & Vidhan K. Goyal (2006).
Vertical
10.1086/499141
Fee, C. Edward & Shawn Thomas (2004). Sources of gains in hor
evidence from
Economics 74, 423
70
Dutta, Shantanu & Vijay Jog (2009). The long-term performance of acquiring firms: A
examination of an anomaly. Journal of Banking and Finance
doi:10.1016/j.jbankfin.2009.02.004
Eleswarapu, Venkat R. & Marc R. Reinganum (2004). The Predictability of Aggregate
Stock Returns: Evidence Based on Glamour Stocks. Journal of Business
294. doi: 10.1086/381275
Faccio, Mara & Ronald W. Masulis (2005). The Choice of Paym
European Mergers and Acquisitions. Journal of Finance 60:3, 1345
http://www.jstor.org/stable/3694929
Lawrence Fisher, Michael C. Jensen & Richard Roll
ment of stock prices to new information. International Economic
10:1, 1–21. [online]. [cited 8-11-2009]. Available
the World Wide Web: <URL:
http://web.ebscohost.com.proxy.tritonia.fi/ehost/pdf?vid=8&hid=104&sid
b875-430d-9982-d4dbb667fe2b%40sessionmgr104
Fama, Eugene F. & Kenneth R. French (1992). The Cross-Section of Expected Stock
Journal of Finance 47:2, 427–465.
Fama, Eugene F. & Kenneth R. French (1993). Common risk factors in the
bonds. Journal of Financial Economics 33:1, 3
Fama, Eugene F. (1998). Market efficiency, long-term returns, and behavioral finance.
Financial Economics 49:3, 283–306. doi:10.1016/S0304
405X(98)00026-9
Fan, Joseph P. H. & Vidhan K. Goyal (2006). On the Patterns and Wealth Effects of
Mergers. Journal of Business 79:2, 877
10.1086/499141
Fee, C. Edward & Shawn Thomas (2004). Sources of gains in horizontal mergers:
evidence from customer, supplier, and rival firms. Journal of Financial
74, 423–460. doi:10.1016/j.jfineco.2003.10.002
term performance of acquiring firms: A
Journal of Banking and Finance 33, 1400–
The Predictability of Aggregate
Journal of Business
Masulis (2005). The Choice of Payment Method in
60:3, 1345–1388.
Roll (1969). The
International Economic
2009]. Available from
the World Wide Web: <URL:
http://web.ebscohost.com.proxy.tritonia.fi/ehost/pdf?vid=8&hid=104&sid
d4dbb667fe2b%40sessionmgr104
Section of Expected Stock
Common risk factors in the returns on
1, 3–56.
term returns, and behavioral finance.
doi:10.1016/S0304-
On the Patterns and Wealth Effects of
79:2, 877–902. doi:
izontal mergers:
Journal of Financial
doi:10.1016/j.jfineco.2003.10.002

71
Franks, Julian, Robert Harris & Sheridan Titman (1991). The postmerger share-price
performance of acquiring firms. Journal of Financial Economics 29:1,
81–96.
Gregory, Alan (1997). An examination of the long run performance of UK acquiring
firms. Journal of Business Finance & Accounting 27:7&8, 971–1002.
doi:10.1111/1468-5957.00146
Gregory, Alan (2005). The Long Run Abnormal Performance of UK Acquirers and the
Free Cash Flow Hypothesis. Journal of Business Finance & Accounting
32:5&6, 777–814. doi: 10.1111/j.0306-686X.2005.00614.x
Halpern, Paul (1983). Corporate Acquisitions: A Theory of Special Cases? A Review of
Event Studies Applied to Acquisitions, The Journal of Finance 38:2, 297–
317.
Harford, Jarrad (2005). What drives merger waves? Journal of Financial Economics 77,
529 – 560. doi: 10.1016/j.jfineco.2004.05.004
Hayward, Mathew L. A. & Donald C. Hambrick (1997). Explaing the large premiums
paid for large acquisitions: Evidence of CEO Hubris. Administrative
Science Quaterly 42, 103-127.
Jegadeesh, Narasimhan & Jason Karceski (2009). Long-run performance evaluation:
Correlation and heteroskedasticity-consistent tests. Journal of Empirical
Finance 16, 101–111. doi:10.1016/j.jempfin.2008.06.002
Jensen, Michael J. & William H. Meckling (1976). Theory off the firm: Managerial
behaviour, agency costs and ownership structure. Journal of Financial
Economics 3, 305 – 360.
Jensen, Michael C. & Richard S. Ruback (1983). The market for corporate control.
Journal of Financial Economics 11, 5–50.
Jensen, Michael C. (1988). Takeovers: Their Causes and Consequences. The Journal of
Economic Perspectives 2:1, 21–48. [online] [cited 7.10.2009] Available

from the World Wide Web:
u.ac.jp/~hanaeda/takeovers.pdf
Kallunki, Juha-Pekka, Janne Peltoniemi & Elina Pyykkö.
pörssiyhtiöiden ostot ulkomaille.
taloudellisia syitä ja seurauksia
Business, University of Oulu.
Available from the World Wide Web:
herkules.oulu.fi/isbn9789514291029/isbn9789514291029.pdf
Kothari, S.P. & Jerold B. Warner (1997). Measuring long
performance.
Kothari, S.P. & Jay Shanken (1997). Book
market returns: A time
44, 169–203.
Kothari, S.P. (2001). Capital markets research in accounting.
Finance 31:1-
Kothari, S.P. & Jerold B.
Working Paper, Center for Corporate Governance, Tuck School of
Business. [cited
Handbook of Corporate Finance: Empirical Corporate Finance.
from the World Wide Web:
pages/faculty/espen.eckbo/PDFs/Handbookpdf/CH1
Lambrecht, Bart M. (2004). The timing and term of mergers motivated by economies of
scale. Journal of financial economics
doi:10.1016/j.jfineco.2003.09.002
Loughran, Tim & Anand M. Vijh
Corporate Ac
Lyon, John D., Brad M. Barber & Chih
of Long-Run Abnormal Stock Returns.
201. doi:10.1111/0022
72
from the World Wide Web: <URL: http://obata.misc.hit
u.ac.jp/~hanaeda/takeovers.pdf >
Pekka, Janne Peltoniemi & Elina Pyykkö. (2009).
pörssiyhtiöiden ostot ulkomaille. Ulkomaiseen hallintaan siirtymisten
taloudellisia syitä ja seurauksia. [online] Faculty of Economics and
University of Oulu. Working papers No. 28 [cited 28
Available from the World Wide Web: <URL:http://
herkules.oulu.fi/isbn9789514291029/isbn9789514291029.pdf
Kothari, S.P. & Jerold B. Warner (1997). Measuring long-horizon security price
performance. Journal of Financial Economics 43:3, 301–339.
Kothari, S.P. & Jay Shanken (1997). Book-to-Market, dividend yield and expected
market returns: A time-series analysis. Journal of Financial Economics
203.
Kothari, S.P. (2001). Capital markets research in accounting. Journal of Accounting and
-3, 105–231. doi:10.1016/S0165-4101(01)00030
Jerold B. Warner (2006). Econometrics of Event Studies
Working Paper, Center for Corporate Governance, Tuck School of
[cited 27-09-2009]. Forthcoming in B.Esben Eckbo (ed.),
k of Corporate Finance: Empirical Corporate Finance.
from the World Wide Web: <URL: http://mba.tuck.dartmouth.edu/
pages/faculty/espen.eckbo/PDFs/Handbookpdf/CH1-EventStudies.pdf
Lambrecht, Bart M. (2004). The timing and term of mergers motivated by economies of
Journal of financial economics
doi:10.1016/j.jfineco.2003.09.002
Loughran, Tim & Anand M. Vijh (1997). Do Long-Term Shareholders Benefit from
quisitions? The Journal of Finance 52:5, 1765
Lyon, John D., Brad M. Barber & Chih-Ling Tsai (1999). Improved Methods for Tests
Run Abnormal Stock Returns. The Journal of Finance
:10.1111/0022-1082.00101
http://obata.misc.hit-
(2009). Suomalaisten
Ulkomaiseen hallintaan siirtymisten
Faculty of Economics and
[cited 28-10-2009]
herkules.oulu.fi/isbn9789514291029/isbn9789514291029.pdf>
horizon security price
339.
et, dividend yield and expected
Journal of Financial Economics
Journal of Accounting and
4101(01)00030-1
Econometrics of Event Studies. [online].
Working Paper, Center for Corporate Governance, Tuck School of
Forthcoming in B.Esben Eckbo (ed.),
k of Corporate Finance: Empirical Corporate Finance. Available
http://mba.tuck.dartmouth.edu/
EventStudies.pdf>
Lambrecht, Bart M. (2004). The timing and term of mergers motivated by economies of
72, 41–62.
eholders Benefit from
1765–1790.
Ling Tsai (1999). Improved Methods for Tests
The Journal of Finance 54:1, 165–

Martynova, Marina & Luc Renneboog (2008). A century of cor
we have learned and where do we stand?
32, 2148–2177.
Mitchell, Mark L. & J. Harold Mulherin (1996). The impact of industry shocks on
takeover and
193–229.
Mitchell, Mark L. & Erik Stafford (2000). Managerial decisions and Long
Price Performance.
Moeller, Sara B., Frederik P. Schlingemann & René M. Stultz (2004)
gains from acquisitions.
doi:10.1016/j.jfineco.2003.07.002
Morck, Randall, Andrei Schleifer &
Objectives Drive Bad Acquisitions?
OMXH (2008) Harmonized Disclosure Rules
the World
digitalAssets/64/64431_harmonized_disclosure_rul
me_change.pdf
Petmezas, Dimitris (2009) What drives acquisitions? Market val
performance.
doi:10.1016/j.mu
Pike, Richard & Bill Neale
strategies. 5th
69561-4
Pontiff, Jeffrey & Lawrence D. Schall (1998). Book
market returns. Journal of Financial Economics 49, 141
doi:10.1016/S0304
73
Marina & Luc Renneboog (2008). A century of corporate takeovers: What
learned and where do we stand? Journal of Banking and Finance
2177. doi:10.1016/j.jbankfin.2007.12.038
J. Harold Mulherin (1996). The impact of industry shocks on
restructuring activity. Journal of Financial Economics
Mitchell, Mark L. & Erik Stafford (2000). Managerial decisions and Long
Price Performance. Journal of Business 73:3, 287–329.
, Sara B., Frederik P. Schlingemann & René M. Stultz (2004). Firm size and the
acquisitions. Journal of Financial Economics
doi:10.1016/j.jfineco.2003.07.002
Morck, Randall, Andrei Schleifer & Robert V. Vishny (1990).
Objectives Drive Bad Acquisitions? The Journal of Finance
Harmonized Disclosure Rules [online]. [cited 12.11.2009]
Wide Web: <URL:http://www.nasdaqomx.com/
digitalAssets/64/64431_harmonized_disclosure_rules_fin_010708_incl_na
me_change.pdf>
Petmezas, Dimitris (2009) What drives acquisitions? Market valuations and bidder
performance. Journal of Multinational Financial Management
10.1016/j.mulfin.2008.05.001
Neale (2006). Corporate Finance and Investment. Decisions and th edition. Pearson Education Limited. 759 p
Pontiff, Jeffrey & Lawrence D. Schall (1998). Book-to-market ratios as predictors of
returns. Journal of Financial Economics 49, 141
doi:10.1016/S0304-405X(98)00020-8
porate takeovers: What
Journal of Banking and Finance
J. Harold Mulherin (1996). The impact of industry shocks on
Journal of Financial Economics 41,
Mitchell, Mark L. & Erik Stafford (2000). Managerial decisions and Long-Term Stock
. Firm size and the
Journal of Financial Economics 73, 201–228.
Robert V. Vishny (1990). Do Managerial
The Journal of Finance 45:1, 30–48.
[cited 12.11.2009]. Available from
http://www.nasdaqomx.com/
es_fin_010708_incl_na
uations and bidder
Journal of Multinational Financial Management 19, 54–74.
Corporate Finance and Investment. Decisions and
p. ISBN: 0-273-
ratios as predictors of
returns. Journal of Financial Economics 49, 141–160.

74
Pätäri, Eero & Timo Leivo (2009). Performance of Value Strategies in the Finnish
Stock Market. [online] Journal of Money, Investment and Banking 8, 5 –
24. [cited 8-10-2009] Available from the World Wide Web:
<URL:http://www.eurojournals.com/ jmib_8_01.pdf>
Rau, P. Raghavendra & Theo Vermaelen (1998). Glamour, value and post-acquisition
performance of acquiring firms. Journal of Financial Economics 49, 223–
253. doi:10.1016/S0304-405X(98)00023-3
Rhodes-Kropf, Matthew & S. Viswanathan (2004). Market Valuation and Merger
Waves. The Journal of Finance 59:6, 2685–2718. doi: 10.1111/j.1540-
6261.2004.00713.x
Rhodes-Kropf, Matthew, David T. Robinson S. Viswanathan (2005). Valuation waves
and merger activity: The empirical evidence. Journal of Financial
Economics 77, 561–603. doi:10.1016/j.jfineco.2004.06.015
Roll, Richard (1986). The Hubris Hypothesis of Corporate Takeovers. Journal of
Business 59:2, 197–216.
Rosen, Richard J. (2006). Merger Momentum and Investor Sentiment: The Stock
Market Reaction to Merger Announcements. Journal of Business 79:21,
987–1017.
Ross, Stephen A., Randolph W. Westerfield & Bradford D. Jordan (2006). Corporate
Finance Fundamentals 7th edition, McGraw-Hill Irwin, 844 p. ISBN: 0-
07-111802-0
Shleifer, Andrei & Robert W. Vishny (2003). Stock market driven acquisitions. Journal
of Financial Economics 70, 295–311. doi:10.1016/S0304-405X(03)00211-
3
Sudarsanam, Sudi & Ashraf A. Mahate (2003). Glamour Acquirers, Method of Payment
and Post- acquisition Performance: The UK Evidence. Journal of
Business Finance & Accounting 30:1&2, 299–341. DOI: 10.1111/1468-
5957.00494

75
The outlook for global M&A acticity (2007). Economic Outlook, 31:2, 21–27 [online].
[cited 10.11.2009] doi: 10.1111/j.1468-0319.2007.00598.x
Trautwein, Friedrich (1990). Merger motives and merger prescriptions. Strategic
Management Journal 11, 283–295.
Walker, M. Mark (2000). Corporate takeovers, Strategic Objectives, and Acquiring-
Firm Shareholder Wealth. Financial Management Spring, 53–66.
Welch, Ivo & Amit Goyal (2008). A Comprehensive Look at the Empirical
Performance of Equity Premium Prediction. Review of Financial Studies
21:4, 1455–1508. doi:10.1093/rfs/hhm014