jericho diamond project aquatic effects monitoring program mining milling/2a... · jericho diamond...
TRANSCRIPT
JERICHO DIAMOND PROJECT
AQUATIC EFFECTS MONITORING PROGRAM
Prepared for
Tahera Diamond Corporation Toronto, Ontario
By
Mainstream Aquatics Ltd. 6956 Roper Road
Edmonton, Alberta T6B 3H9
and
AMEC Earth & Environmental
2227 Douglas Road Burnaby, British Columbia
V5C 5A9
August 2004

Citation: Mainstream Aquatics Ltd. and AMEC Earth and Environmental Inc. 2004. Jericho Diamond Project – Aquatic Effects Monitoring Program. Prepared for Tahera Diamond Corporation. Report No. 04006D: 37 p.
Jericho Diamond Project – Aquatic Effects Monitoring Program Table of Contents
Mainstream and AMEC August 2004 i
TABLE OF CONTENTS Page #
TABLE OF CONTENTS ............................................................................................................................ i
LIST OF TABLES ..................................................................................................................................... iii
LIST OF FIGURES ................................................................................................................................... iv
1.0 INTRODUCTION................................................................................................................................. 1 1.1 BACKGROUND.......................................................................................................................... 1 1.2 PURPOSE..................................................................................................................................... 1 1.3 MONITORED WATERBODIES................................................................................................. 2
2.0 WATER AND SEDIMENT CHEMISTRY........................................................................................ 5 2.1 WATER CHEMISTRY................................................................................................................ 5
2.1.1 Parameters ........................................................................................................................................5 2.1.2 Sample Waterbodies and Stations.....................................................................................................7 2.1.3 Sample Frequency ............................................................................................................................7 2.1.4 Field Methods .................................................................................................................................11 2.1.5 Field QA/QC...................................................................................................................................11 2.1.6 Laboratory Methods .......................................................................................................................12 2.1.7 Laboratory QA/QC.........................................................................................................................12 2.1.8 Sewage Treatment Plant Discharge ................................................................................................12 2.1.9 Stream C1 Diversion Water Quality Monitoring............................................................................13
2.2 SEDIMENT CHEMISTRY........................................................................................................ 13 2.2.1 Parameters ......................................................................................................................................13 2.2.2 Sample Waterbodies and Stations...................................................................................................13 2.2.3 Sample Frequency ..........................................................................................................................14 2.2.4 Field Methods .................................................................................................................................14 2.2.5 Field QA/QC...................................................................................................................................15 2.2.6 Laboratory Methods .......................................................................................................................15 2.2.7 Laboratory QA/QC.........................................................................................................................15
2.3 DATA ANALYSIS .................................................................................................................... 15 2.4 REPORTING.............................................................................................................................. 16 2.5 RESPONSIBILITY FOR SAMPLING...................................................................................... 16
3.0 AQUATIC BIOTA.............................................................................................................................. 17 3.1 PARAMETERS.......................................................................................................................... 17 3.2 SAMPLE LOCATIONS............................................................................................................. 18
Jericho Diamond Project – Aquatic Effects Monitoring Program Table of Contents
Mainstream and AMEC August 2004 ii
3.3 SAMPLING FREQUENCY AND REPLICATON ................................................................... 20 3.4 PHYTOPLANKTON METHODS ............................................................................................. 21
3.4.1 Field................................................................................................................................................21 3.4.2 Laboratory ......................................................................................................................................21
3.5 ZOOPLANKTON METHODS .................................................................................................. 22 3.5.1 Field................................................................................................................................................22 3.5.3 Laboratory ......................................................................................................................................23
3.6 PERIPHYTON METHODS....................................................................................................... 24 3.6.1 Field................................................................................................................................................24 3.6.2 Laboratory ......................................................................................................................................24
3.7 BENTHIC INVERTEBRATES METHODS ............................................................................. 25 3.7.1 Field................................................................................................................................................25 3.7.2 Laboratory ......................................................................................................................................25
3.8 FISH METHODS ....................................................................................................................... 26 3.8.1 Field................................................................................................................................................26 3.8.2 Laboratory ......................................................................................................................................27
3.9 QUALITY CONTROL/ASSURANCE...................................................................................... 28 3.10 DATA ANALYSES ................................................................................................................. 28 3.11 REPORTING............................................................................................................................ 29 3.12 RESPONSIBILITY FOR SAMPLING .................................................................................... 29
4.0 SEDIMENT DEPOSITION ............................................................................................................... 31 4.1 PARAMETERS.......................................................................................................................... 31 4.2 SAMPLE LOCATIONS............................................................................................................. 31 4.3 SAMPLING FREQUENCY....................................................................................................... 31 4.4 METHODS................................................................................................................................. 31
4.4.1 Field................................................................................................................................................33 4.4.2 Laboratory ......................................................................................................................................33
4.5 QUALITY CONTROL/ASSURANCE...................................................................................... 33 4.6 DATA ANALYSES ................................................................................................................... 33 4.7 REPORTING.............................................................................................................................. 33 4.8 RESPONSIBILITY FOR SAMPLING...................................................................................... 33
5.0 LITERATURE CITED ...................................................................................................................... 35
Jericho Diamond Project – Aquatic Effects Monitoring Program List of Tables
Mainstream and AMEC August 2004 iii
LIST OF TABLES Page #
Table 1.1 Discharge sources, potential mode of entry, and receiving waterbodies by Project
phase, Jericho Diamond Project AEMP. ............................................................................... 2
Table 2.1 Water chemistry monitoring parameters and detection limits. .............................................. 5
Table 2.2 Water and sediment chemistry monitoring stations and purpose, Jericho Diamond Project AEMP........................................................................................................................ 7
Table 2.3 Jericho Water Quality Sampling Locations........................................................................... 7
Table 2.4 Water chemistry monitoring frequency, Jericho Diamond Project AEMP. .......................... 8
Table 2.5 Sediment chemistry monitoring parameters and detection limits........................................ 13
Table 2.6 Sediment chemistry site locations ....................................................................................... 14
Table 2.7 Summary of Historical Sediment Sampling ........................................................................ 14
Table 3.1 Indicators and parameters to be measured as part of the AEMP for the Jericho Diamond Project. ................................................................................................................. 17
Table 3.2 Metal constituents and detection limits for fish tissue metal contaminants as part of the AEMP for the Jericho Diamond Project.................................................................... 18
Table 3.3 Community characteristics to be measured as part of the AEMP for the Jericho Diamond Project. ................................................................................................................. 18
Table 3.4 Stations and waterbodies to be sampled for aquatic biota as part of the AEMP for the Jericho Diamond Project. .............................................................................................. 20
Table 3.5 Sampling frequency and replication for aquatic biota as part of the AEMP for the Jericho Diamond Project. .................................................................................................... 20
Table 3.6 Fish sampling strategy as part of the AEMP for the Jericho Diamond Project. .................. 21
Table 4.1 Stations and waterbodies to be sampled for sediment deposition as part of the AEMP for the Jericho Diamond Project.............................................................................. 31

Jericho Diamond Project – Aquatic Effects Monitoring Program List of Figures
Mainstream and AMEC August 2004 iv
LIST OF FIGURES Page #
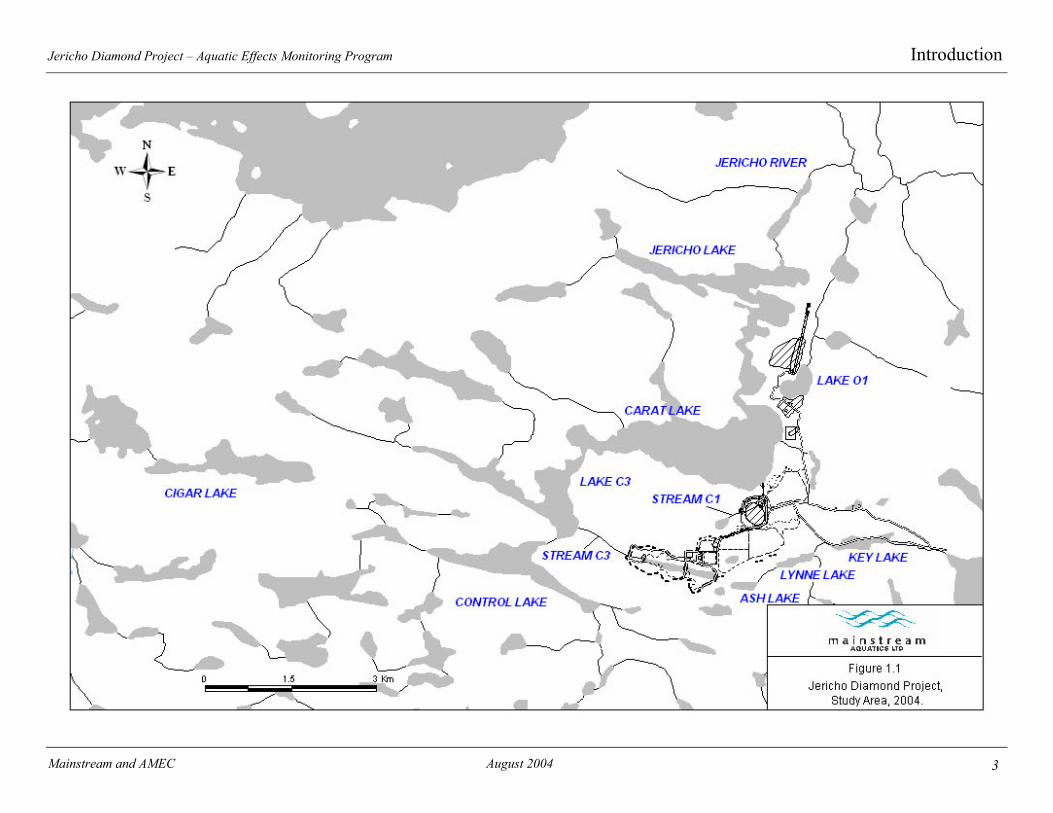
Figure 1.1 Waterbodies in the vicinity of the Jericho Diamond Project. .............................................. 3
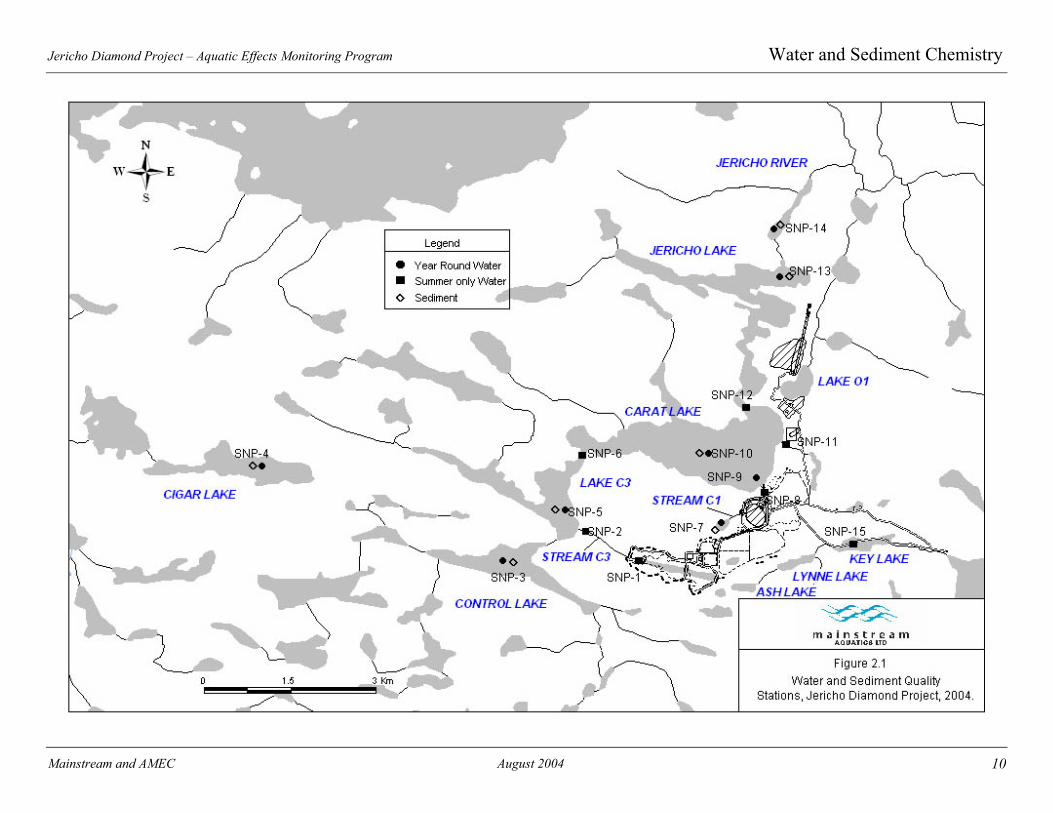
Figure 2.1 Water and sediment chemistry monitoring stations. ........................................................... 10
Figure 3.1 Aquatic biota monitoring stations. ...................................................................................... 19
Figure 4.1 Sediment deposition monitoring stations. ........................................................................... 32
Jericho Diamond Project – Aquatic Effects Monitoring Program Introduction
Mainstream and AMEC August 2004 1
1.0 INTRODUCTION
1.1 BACKGROUND
The Jericho Diamond Project was initiated in 1995 based on the discovery of a kimberlite pipe adjacent to
the southern shore of an unnamed lake (locally known as Carat Lake). The Jericho Diamond Project has
undergone environmental review by the Nunavut Impact Review Board (NIRB), which recommended
that the Project be approved, subject to several terms and conditions. These conditions include
development and implementation of a comprehensive environmental monitoring plan. An integral part of
this plan will be the Aquatic Effects Monitoring Program (AEMP) designed specifically to monitor
potential effects of the development on the aquatic environment.
This document outlines recommended AEMP protocols for the Jericho Diamond Project. The protocols
have been developed based on the results of the pilot aquatic effects monitoring program conducted in
1999 (RL&L 2001) and input from regulatory authorities presented during public hearings for the Jericho
Diamond Project (http://ftp.nunavut.ca/nirb/Reviews/). Where appropriate it follows approaches
described in the Metal Mining Guidance Document for Aquatic Environmental Effects Monitoring
(MMEEM) by Environment Canada (2002) and other programs (e.g. Ekati Diamond Mine AEMP
Re-evaluation and Refinement Report [Rescan 2003]).
1.2 PURPOSE
The purpose of an AEMP is to monitor the potential effects of effluent sources on the aquatic
environment during Project construction and operation. This will be achieved using a design and
scientifically defensible, cost-effective methods that meet regulatory requirements. The results will be
used to:
• Protect the health and integrity of the aquatic environment. • Confirm impact predictions. • Ascertain whether mitigation measures are effective. • Adjust mitigation where appropriate.
The document describes an AEMP that will be undertaken during pre-construction, construction,
operation, and post-closure.
Jericho Diamond Project – Aquatic Effects Monitoring Program Introduction
Mainstream and AMEC August 2004 2
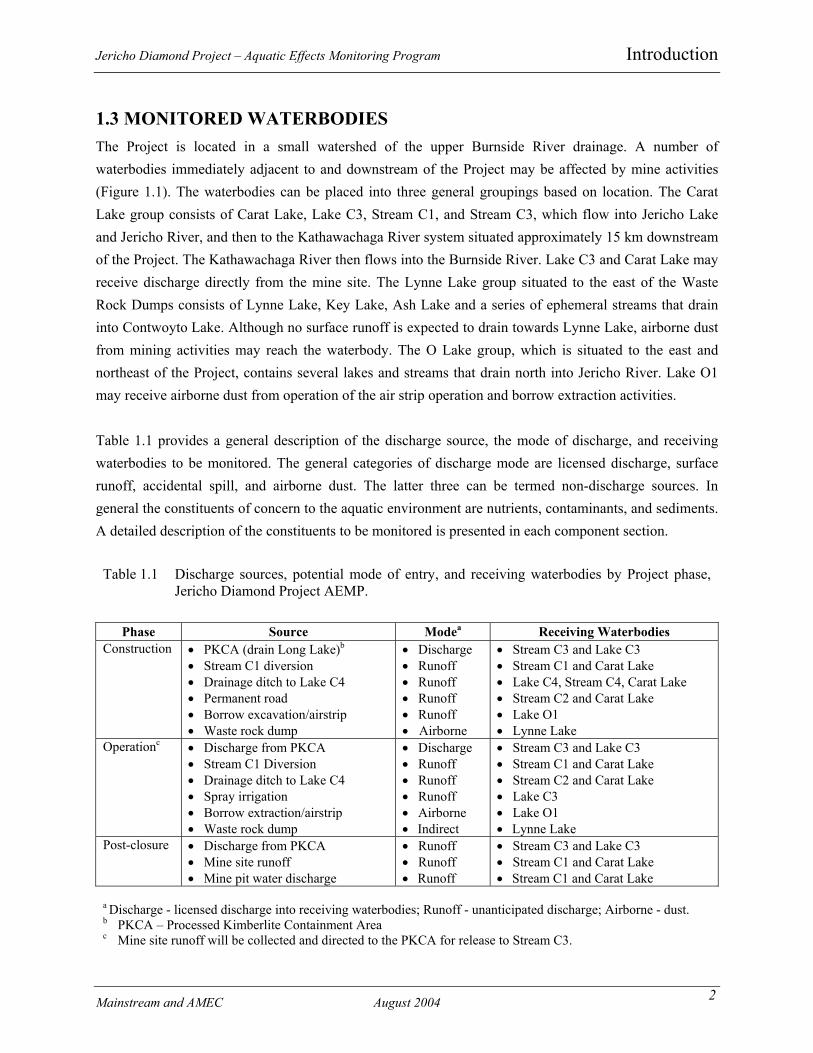
1.3 MONITORED WATERBODIES The Project is located in a small watershed of the upper Burnside River drainage. A number of waterbodies immediately adjacent to and downstream of the Project may be affected by mine activities (Figure 1.1). The waterbodies can be placed into three general groupings based on location. The Carat Lake group consists of Carat Lake, Lake C3, Stream C1, and Stream C3, which flow into Jericho Lake and Jericho River, and then to the Kathawachaga River system situated approximately 15 km downstream of the Project. The Kathawachaga River then flows into the Burnside River. Lake C3 and Carat Lake may receive discharge directly from the mine site. The Lynne Lake group situated to the east of the Waste Rock Dumps consists of Lynne Lake, Key Lake, Ash Lake and a series of ephemeral streams that drain into Contwoyto Lake. Although no surface runoff is expected to drain towards Lynne Lake, airborne dust from mining activities may reach the waterbody. The O Lake group, which is situated to the east and northeast of the Project, contains several lakes and streams that drain north into Jericho River. Lake O1 may receive airborne dust from operation of the air strip operation and borrow extraction activities. Table 1.1 provides a general description of the discharge source, the mode of discharge, and receiving waterbodies to be monitored. The general categories of discharge mode are licensed discharge, surface runoff, accidental spill, and airborne dust. The latter three can be termed non-discharge sources. In general the constituents of concern to the aquatic environment are nutrients, contaminants, and sediments. A detailed description of the constituents to be monitored is presented in each component section.
Table 1.1 Discharge sources, potential mode of entry, and receiving waterbodies by Project phase, Jericho Diamond Project AEMP.
Phase Source Modea Receiving Waterbodies
Construction • PKCA (drain Long Lake)b • Stream C1 diversion • Drainage ditch to Lake C4 • Permanent road • Borrow excavation/airstrip • Waste rock dump
• Discharge • Runoff • Runoff • Runoff • Runoff • Airborne
• Stream C3 and Lake C3 • Stream C1 and Carat Lake • Lake C4, Stream C4, Carat Lake • Stream C2 and Carat Lake • Lake O1 • Lynne Lake
Operationc • Discharge from PKCA • Stream C1 Diversion • Drainage ditch to Lake C4 • Spray irrigation • Borrow extraction/airstrip • Waste rock dump
• Discharge • Runoff • Runoff • Runoff • Airborne • Indirect
• Stream C3 and Lake C3 • Stream C1 and Carat Lake • Stream C2 and Carat Lake • Lake C3 • Lake O1 • Lynne Lake
Post-closure • Discharge from PKCA • Mine site runoff • Mine pit water discharge
• Runoff • Runoff • Runoff
• Stream C3 and Lake C3 • Stream C1 and Carat Lake • Stream C1 and Carat Lake
a Discharge - licensed discharge into receiving waterbodies; Runoff - unanticipated discharge; Airborne - dust. b PKCA – Processed Kimberlite Containment Area c Mine site runoff will be collected and directed to the PKCA for release to Stream C3.
Jericho Diamond Project – Aquatic Effects Monitoring Program Introduction
Mainstream and AMEC August 2004 3

Jericho Diamond Project – Aquatic Effects Monitoring Program Water and Sediment Chemistry
Mainstream and AMEC August 2004 5
2.0 WATER AND SEDIMENT CHEMISTRY
This section discusses surface water and sediment chemistry monitoring protocols for the Jericho
Diamond Project during pre-development, construction, and operation phases. The primary purpose of
the program is to provide information on the extent of influence of mine operations on the water and
sediment chemistry of receiving waters.
2.1 WATER CHEMISTRY
2.1.1 Parameters
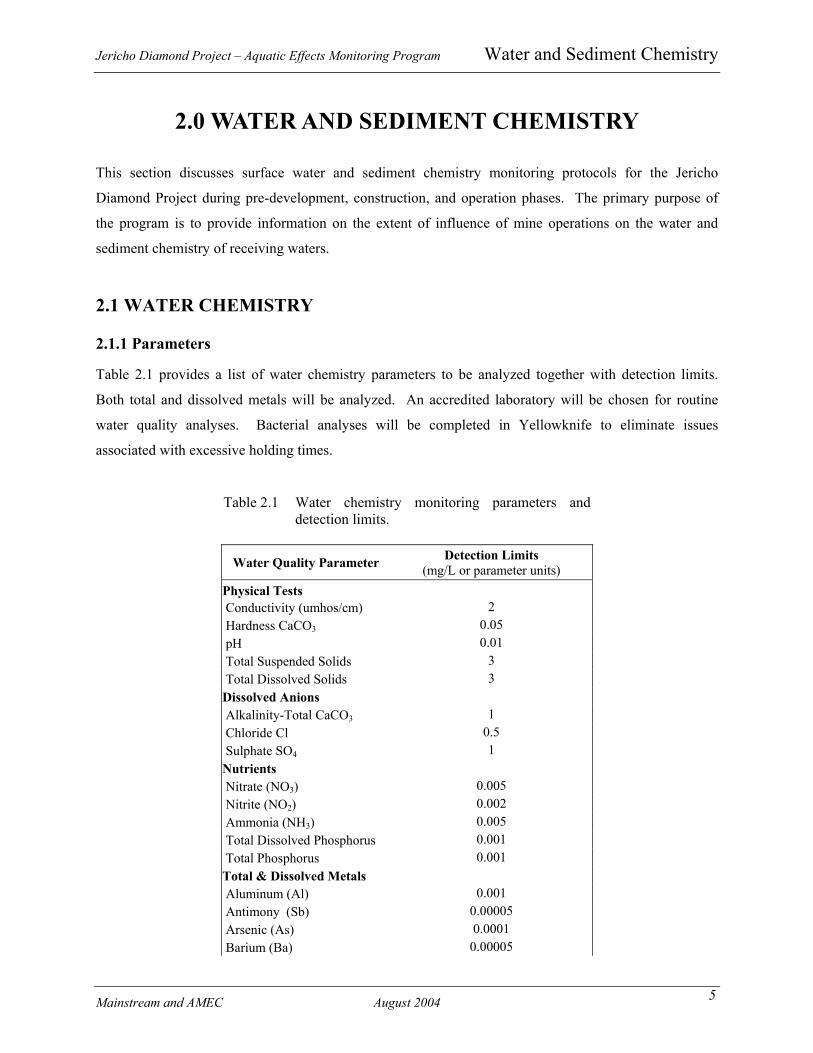
Table 2.1 provides a list of water chemistry parameters to be analyzed together with detection limits.
Both total and dissolved metals will be analyzed. An accredited laboratory will be chosen for routine
water quality analyses. Bacterial analyses will be completed in Yellowknife to eliminate issues
associated with excessive holding times.
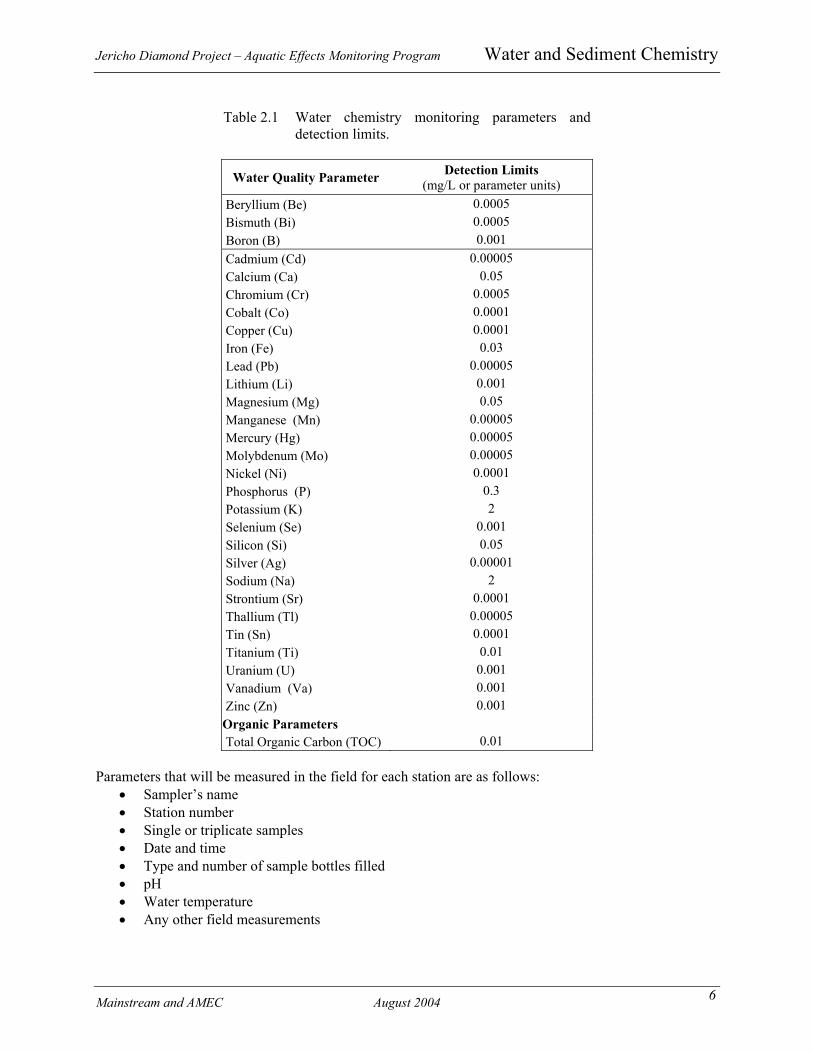
Table 2.1 Water chemistry monitoring parameters and detection limits.
Water Quality Parameter Detection Limits (mg/L or parameter units)
Physical Tests Conductivity (umhos/cm) 2 Hardness CaCO3 0.05 pH 0.01 Total Suspended Solids 3 Total Dissolved Solids 3 Dissolved Anions Alkalinity-Total CaCO3 1 Chloride Cl 0.5 Sulphate SO4 1 Nutrients Nitrate (NO3) 0.005 Nitrite (NO2) 0.002 Ammonia (NH3) 0.005 Total Dissolved Phosphorus 0.001 Total Phosphorus 0.001 Total & Dissolved Metals Aluminum (Al) 0.001 Antimony (Sb) 0.00005 Arsenic (As) 0.0001 Barium (Ba) 0.00005
Jericho Diamond Project – Aquatic Effects Monitoring Program Water and Sediment Chemistry
Mainstream and AMEC August 2004 6
Table 2.1 Water chemistry monitoring parameters and detection limits.
Water Quality Parameter Detection Limits (mg/L or parameter units)
Beryllium (Be) 0.0005 Bismuth (Bi) 0.0005 Boron (B) 0.001 Cadmium (Cd) 0.00005 Calcium (Ca) 0.05 Chromium (Cr) 0.0005 Cobalt (Co) 0.0001 Copper (Cu) 0.0001 Iron (Fe) 0.03 Lead (Pb) 0.00005 Lithium (Li) 0.001 Magnesium (Mg) 0.05 Manganese (Mn) 0.00005 Mercury (Hg) 0.00005 Molybdenum (Mo) 0.00005 Nickel (Ni) 0.0001 Phosphorus (P) 0.3 Potassium (K) 2 Selenium (Se) 0.001 Silicon (Si) 0.05 Silver (Ag) 0.00001 Sodium (Na) 2 Strontium (Sr) 0.0001 Thallium (Tl) 0.00005 Tin (Sn) 0.0001 Titanium (Ti) 0.01 Uranium (U) 0.001 Vanadium (Va) 0.001 Zinc (Zn) 0.001 Organic Parameters Total Organic Carbon (TOC) 0.01
Parameters that will be measured in the field for each station are as follows:
• Sampler’s name • Station number • Single or triplicate samples • Date and time • Type and number of sample bottles filled • pH • Water temperature • Any other field measurements
Jericho Diamond Project – Aquatic Effects Monitoring Program Water and Sediment Chemistry
Mainstream and AMEC August 2004 7
All information will be kept in a field log book and data entered into a water quality database kept by the
mine environmental coordinator.
2.1.2 Sample Waterbodies and Stations
The specific purpose of individual stations and their locations are presented in Table 2.2 and Figure 2.1,
respectively.
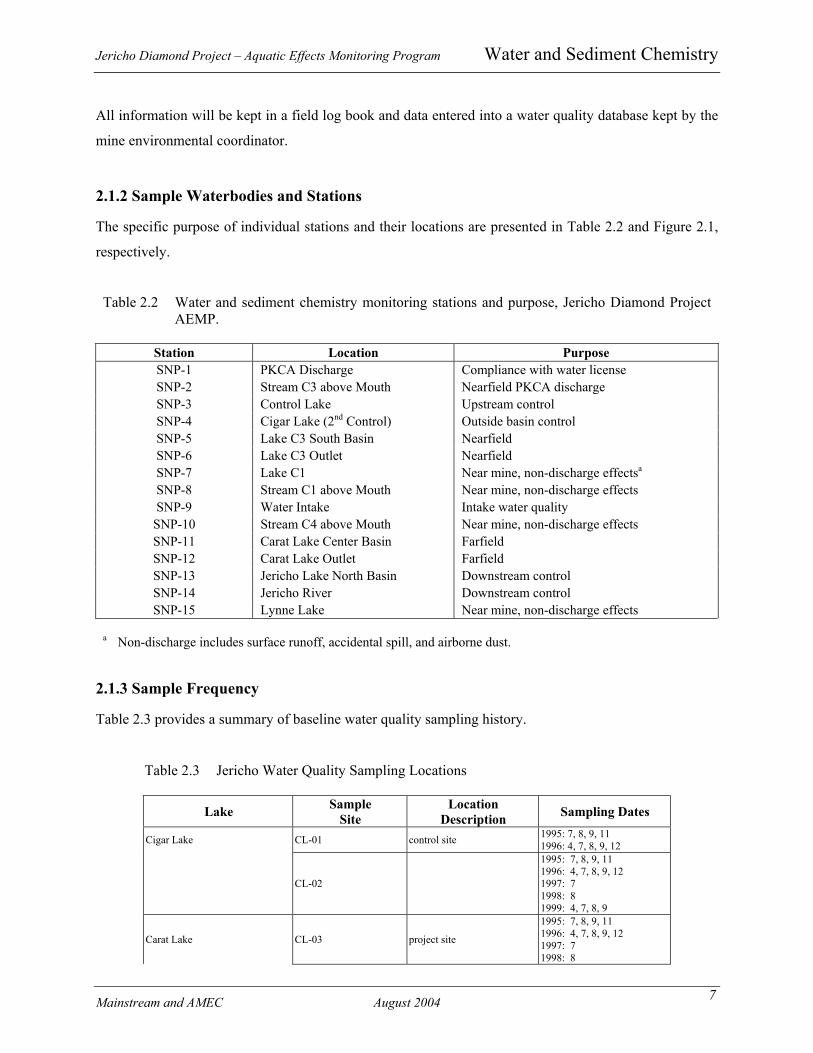
Table 2.2 Water and sediment chemistry monitoring stations and purpose, Jericho Diamond Project AEMP.
Station Location Purpose SNP-1 PKCA Discharge Compliance with water license SNP-2 Stream C3 above Mouth Nearfield PKCA discharge SNP-3 Control Lake Upstream control SNP-4 Cigar Lake (2nd Control) Outside basin control SNP-5 Lake C3 South Basin Nearfield SNP-6 Lake C3 Outlet Nearfield SNP-7 Lake C1 Near mine, non-discharge effectsa SNP-8 Stream C1 above Mouth Near mine, non-discharge effects SNP-9 Water Intake Intake water quality SNP-10 Stream C4 above Mouth Near mine, non-discharge effects SNP-11 Carat Lake Center Basin Farfield SNP-12 Carat Lake Outlet Farfield SNP-13 Jericho Lake North Basin Downstream control SNP-14 Jericho River Downstream control SNP-15 Lynne Lake Near mine, non-discharge effects
a Non-discharge includes surface runoff, accidental spill, and airborne dust.
2.1.3 Sample Frequency
Table 2.3 provides a summary of baseline water quality sampling history.
Table 2.3 Jericho Water Quality Sampling Locations
Lake Sample Site
Location Description Sampling Dates
Cigar Lake CL-01 control site 1995: 7, 8, 9, 11 1996: 4, 7, 8, 9, 12
CL-02
1995: 7, 8, 9, 11 1996: 4, 7, 8, 9, 12 1997: 7 1998: 8 1999: 4, 7, 8, 9
Carat Lake CL-03 project site
1995: 7, 8, 9, 11 1996: 4, 7, 8, 9, 12 1997: 7 1998: 8
Jericho Diamond Project – Aquatic Effects Monitoring Program Water and Sediment Chemistry
Mainstream and AMEC August 2004 8
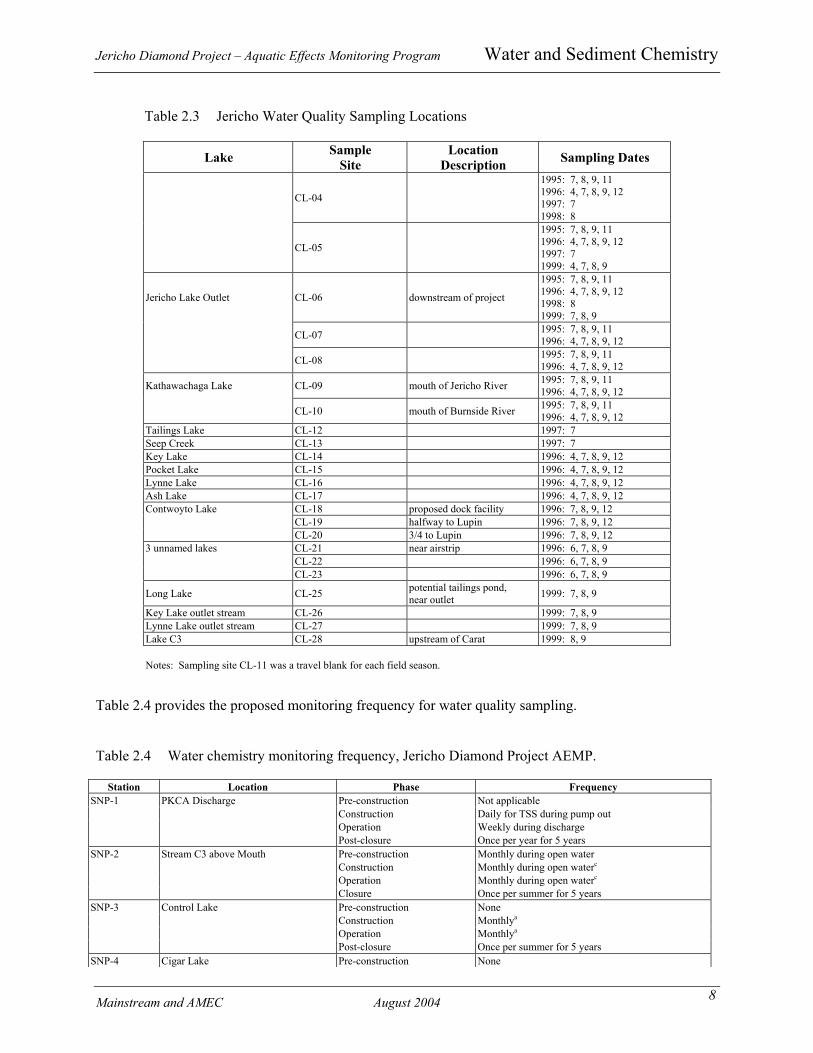
Table 2.3 Jericho Water Quality Sampling Locations
Lake Sample Site
Location Description Sampling Dates
CL-04
1995: 7, 8, 9, 11 1996: 4, 7, 8, 9, 12 1997: 7 1998: 8
CL-05
1995: 7, 8, 9, 11 1996: 4, 7, 8, 9, 12 1997: 7 1999: 4, 7, 8, 9
Jericho Lake Outlet CL-06 downstream of project
1995: 7, 8, 9, 11 1996: 4, 7, 8, 9, 12 1998: 8 1999: 7, 8, 9
CL-07 1995: 7, 8, 9, 11 1996: 4, 7, 8, 9, 12
CL-08 1995: 7, 8, 9, 11 1996: 4, 7, 8, 9, 12
Kathawachaga Lake CL-09 mouth of Jericho River 1995: 7, 8, 9, 11 1996: 4, 7, 8, 9, 12
CL-10 mouth of Burnside River 1995: 7, 8, 9, 11 1996: 4, 7, 8, 9, 12
Tailings Lake CL-12 1997: 7 Seep Creek CL-13 1997: 7 Key Lake CL-14 1996: 4, 7, 8, 9, 12 Pocket Lake CL-15 1996: 4, 7, 8, 9, 12 Lynne Lake CL-16 1996: 4, 7, 8, 9, 12 Ash Lake CL-17 1996: 4, 7, 8, 9, 12 Contwoyto Lake CL-18 proposed dock facility 1996: 7, 8, 9, 12 CL-19 halfway to Lupin 1996: 7, 8, 9, 12 CL-20 3/4 to Lupin 1996: 7, 8, 9, 12 3 unnamed lakes CL-21 near airstrip 1996: 6, 7, 8, 9 CL-22 1996: 6, 7, 8, 9 CL-23 1996: 6, 7, 8, 9
Long Lake CL-25 potential tailings pond, near outlet 1999: 7, 8, 9
Key Lake outlet stream CL-26 1999: 7, 8, 9 Lynne Lake outlet stream CL-27 1999: 7, 8, 9 Lake C3 CL-28 upstream of Carat 1999: 8, 9 Notes: Sampling site CL-11 was a travel blank for each field season.
Table 2.4 provides the proposed monitoring frequency for water quality sampling.
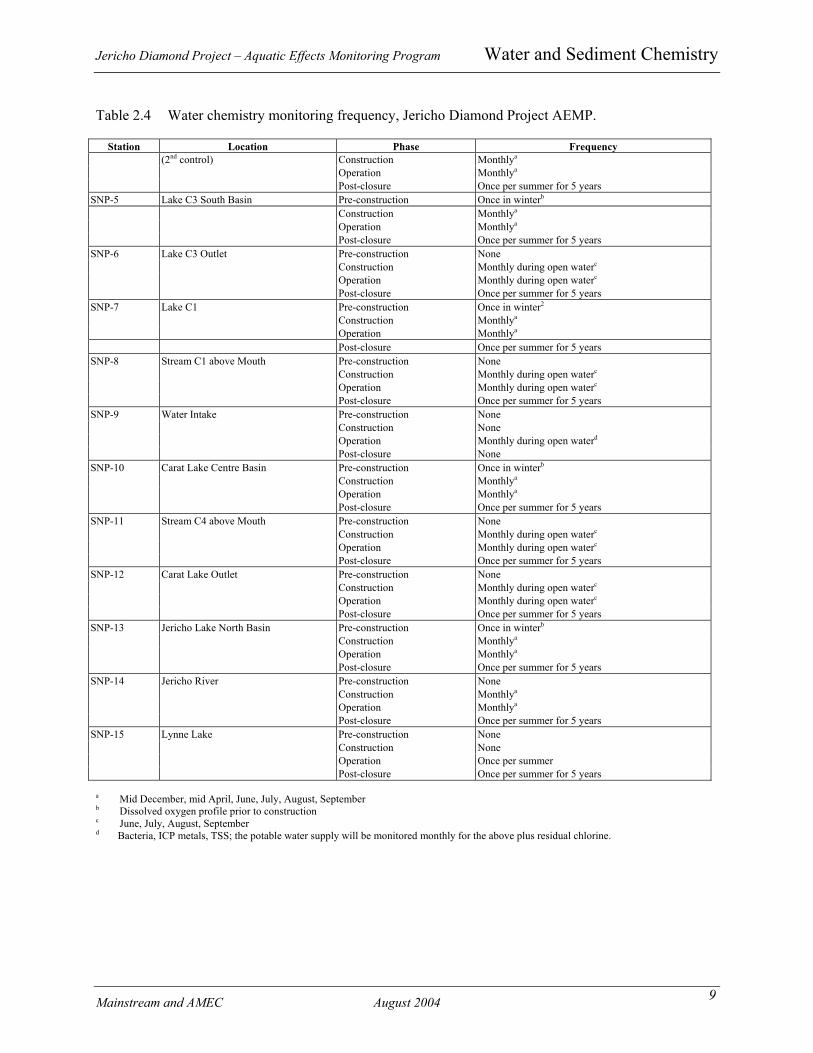
Table 2.4 Water chemistry monitoring frequency, Jericho Diamond Project AEMP.
Station Location Phase Frequency SNP-1 PKCA Discharge Pre-construction Not applicable Construction Daily for TSS during pump out Operation Weekly during discharge Post-closure Once per year for 5 years SNP-2 Stream C3 above Mouth Pre-construction Monthly during open water Construction Monthly during open waterc Operation Monthly during open waterc Closure Once per summer for 5 years SNP-3 Control Lake Pre-construction None Construction Monthlya Operation Monthlya Post-closure Once per summer for 5 years SNP-4 Cigar Lake Pre-construction None
Jericho Diamond Project – Aquatic Effects Monitoring Program Water and Sediment Chemistry
Mainstream and AMEC August 2004 9
Table 2.4 Water chemistry monitoring frequency, Jericho Diamond Project AEMP.
Station Location Phase Frequency (2nd control) Construction Monthlya Operation Monthlya Post-closure Once per summer for 5 years SNP-5 Lake C3 South Basin Pre-construction Once in winterb Construction Monthlya Operation Monthlya Post-closure Once per summer for 5 years SNP-6 Lake C3 Outlet Pre-construction None Construction Monthly during open waterc Operation Monthly during open waterc Post-closure Once per summer for 5 years SNP-7 Lake C1 Pre-construction Once in winter2 Construction Monthlya Operation Monthlya Post-closure Once per summer for 5 years SNP-8 Stream C1 above Mouth Pre-construction None Construction Monthly during open waterc Operation Monthly during open waterc Post-closure Once per summer for 5 years SNP-9 Water Intake Pre-construction None Construction None Operation Monthly during open waterd Post-closure None SNP-10 Carat Lake Centre Basin Pre-construction Once in winterb Construction Monthlya Operation Monthlya Post-closure Once per summer for 5 years SNP-11 Stream C4 above Mouth Pre-construction None Construction Monthly during open waterc Operation Monthly during open waterc Post-closure Once per summer for 5 years SNP-12 Carat Lake Outlet Pre-construction None Construction Monthly during open waterc Operation Monthly during open waterc Post-closure Once per summer for 5 years SNP-13 Jericho Lake North Basin Pre-construction Once in winterb Construction Monthlya Operation Monthlya Post-closure Once per summer for 5 years SNP-14 Jericho River Pre-construction None Construction Monthlya Operation Monthlya Post-closure Once per summer for 5 years SNP-15 Lynne Lake Pre-construction None Construction None Operation Once per summer Post-closure Once per summer for 5 years a Mid December, mid April, June, July, August, September b Dissolved oxygen profile prior to construction c June, July, August, September d Bacteria, ICP metals, TSS; the potable water supply will be monitored monthly for the above plus residual chlorine.
Jericho Diamond Project – Aquatic Effects Monitoring Program Water and Sediment Chemistry
Mainstream and AMEC August 2004 10
Jericho Diamond Project – Aquatic Effects Monitoring Program Water and Sediment Chemistry
Mainstream and AMEC August 2004 11
2.1.4 Field Methods
Prior to sampling raw water, sample bottles will be rinsed three times; pre-treated sample bottles will not
be rinsed. During summer, water will be collected by submersing bottles 0.25 m below the surface in
lakes and below the surface in streams, uncapping and allowing bottles to fill, recapping and then
resurfacing. During periods of ice cover (i.e., the April and December sampling periods), holes will be
drilled through the ice cover by a gas powered ice auger for the collection of surface grab water samples.
Samples will be collected approximately 0.5 m below the water surface exposed in the holes. Rinsing of
sample containers with in-situ water will be impractical due to the cold weather; consequently, laboratory
prepared sample containers will be used. The following procedure will be used to avoid contamination.
When water is collected through the ice the last 30 cm of ice before water will be completed with a hand
auger. The hole will be bailed of a minimum of 100 L of water and samples collected directly into
bottles. Bottles will be uncapped and recapped below the water surface.
Dissolved metal samples will be filtered through a 0.45 µm millipore filter and preserved with AA grade
nitric acid. Total metals samples will also be preserved with AA grade nitric acid. Total organic carbon
samples will be preserved with AA grade sulphuric acid. A 2-L sample of raw water will not be
preserved. All samples will be kept cool during storage and air transported to the analytical laboratory.
Chain of custody forms will be used to track samples.
2.1.5 Field QA/QC
To check on the precision of the samplers, triplicate water samples will be submitted for testing.
Sequential triplicate samples will be collected for 10% of the total number of samples per sampling
session. A sequential triplicate requires that the collector fill three sampling sets (group of bottles from
three different samples at the same depth). Since sampling will take place over three seasons, no spatial
bias towards any specific site or temporal bias towards any season will be incorporated into the sampling
program. The sampling program will submit blind triplicates for analysis (i.e., triplicate samples not
labeled with the location).
To ascertain whether contamination had reached the samples, field blanks will be incorporated into the
sampling process. A field blank is a set of bottles filled with demineralized, de-ionized water (supplied
by the lab) and processed in the same manner as a collected water sample. These blanks will be used for
each sampling session. All blanks will be filled in the field to ensure that they undergo the same
conditions and procedures as the water samples. One field blank will be processed for each sample
collection period.
Jericho Diamond Project – Aquatic Effects Monitoring Program Water and Sediment Chemistry
Mainstream and AMEC August 2004 12
The third level of quality control will be a check on the laboratory’s precision and accuracy by preparing
a split sample in the field. A split sample is a discrete water sample separated into two identical tests.
The water sample is collected at one time and at a specific depth. In theory, the same results should be
achieved when analyzed by the laboratory. One split will be processed for each sample collection period.
2.1.6 Laboratory Methods
General water parameters (pH, dissolved anions, nutrients) will be analyzed in accordance with
procedures described in “Methods for Chemical Analysis of Water and Wastes” (United States
Environmental Protection Agency), “Manual for the Chemical Analysis of Water, Wastewaters,
Sediments and Biological Tissues” (British Columbia Ministry of the Environment), and/or “Standard
Methods for the Examination of Water and Wastewater” (American Public Health Association).
Total and dissolved metals and organic parameter samples will be analyzed in accordance with
procedures described in “Standard Methods for the Examination of Water and Wastewater”, 18th Edition
(American Public Health Association, 1992). Several methods will be employed for metals analysis,
including Inductively Coupled Plasma-Mass Spectrometry (ICP-MS) and Atomic Absorption
Spectrophotometry (AA) to obtain the required detection limit for each element. Organic parameters will
be analyzed using a gas chromatograph - flame ionization detector (GC/FID). Mercury will be analyzed
by cold vapour AA.
2.1.7 Laboratory QA/QC
Laboratory quality assurance/quality control (QA/QC) will consist of a routine program to check the
accuracy and precision of the analyses and to ensure that laboratory contamination will not contribute to
the results. This program will be conducted in-house by the laboratory. It involves checking every 20 to
25% of the total number of samples being analyzed. It also includes triplicate, blank and split samples
collected in the field.
2.1.8 Sewage Treatment Plant Discharge
The sewage treatment plant will discharge to the PKCA and will be monitored quarterly for parameters
regulated by the Project’s Water License. Typical parameters (NWT Water Board 1992) include
biochemical oxygen demand (BOD), total suspended solids, nutrients (phosphorus, nitrogen), and residual
chlorine.
Jericho Diamond Project – Aquatic Effects Monitoring Program Water and Sediment Chemistry
Mainstream and AMEC August 2004 13
2.1.9 Stream C1 Diversion Water Quality Monitoring
Stream C1 diversion will be constructed in the winter and pre-washed rock will be used for armouring to
reduce sediment export from the diversion during the first spring freshet. Notwithstanding the mitigation
measures that will be employed, some sedimentation during the first freshet would be expected. During
this period in Year 1, turbidity will be monitored daily at the outlet of Lake C1, at the bottom of the
diversion, above and below silt curtains, and at the mouth of Stream C1 until turbidity levels drop to
background.
2.2 SEDIMENT CHEMISTRY 2.2.1 Parameters
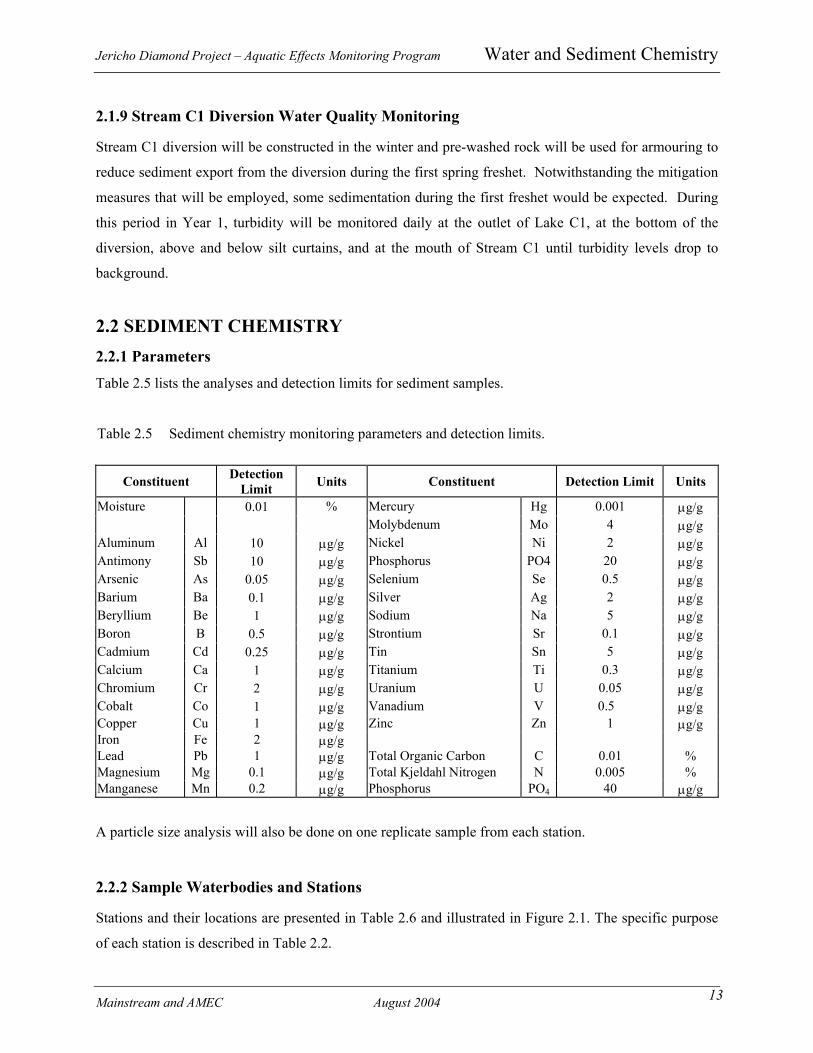
Table 2.5 lists the analyses and detection limits for sediment samples.
Table 2.5 Sediment chemistry monitoring parameters and detection limits.
Constituent Detection Limit Units Constituent Detection Limit Units
Moisture 0.01 % Mercury Hg 0.001 µg/g Molybdenum Mo 4 µg/g Aluminum Al 10 µg/g Nickel Ni 2 µg/g Antimony Sb 10 µg/g Phosphorus PO4 20 µg/g Arsenic As 0.05 µg/g Selenium Se 0.5 µg/g Barium Ba 0.1 µg/g Silver Ag 2 µg/g Beryllium Be 1 µg/g Sodium Na 5 µg/g Boron B 0.5 µg/g Strontium Sr 0.1 µg/g Cadmium Cd 0.25 µg/g Tin Sn 5 µg/g Calcium Ca 1 µg/g Titanium Ti 0.3 µg/g Chromium Cr 2 µg/g Uranium U 0.05 µg/g Cobalt Co 1 µg/g Vanadium V 0.5 µg/g Copper Cu 1 µg/g Zinc Zn 1 µg/g Iron Fe 2 µg/g Lead Pb 1 µg/g Total Organic Carbon C 0.01 % Magnesium Mg 0.1 µg/g Total Kjeldahl Nitrogen N 0.005 % Manganese Mn 0.2 µg/g Phosphorus PO4 40 µg/g
A particle size analysis will also be done on one replicate sample from each station.
2.2.2 Sample Waterbodies and Stations
Stations and their locations are presented in Table 2.6 and illustrated in Figure 2.1. The specific purpose
of each station is described in Table 2.2.
Jericho Diamond Project – Aquatic Effects Monitoring Program Water and Sediment Chemistry
Mainstream and AMEC August 2004 14
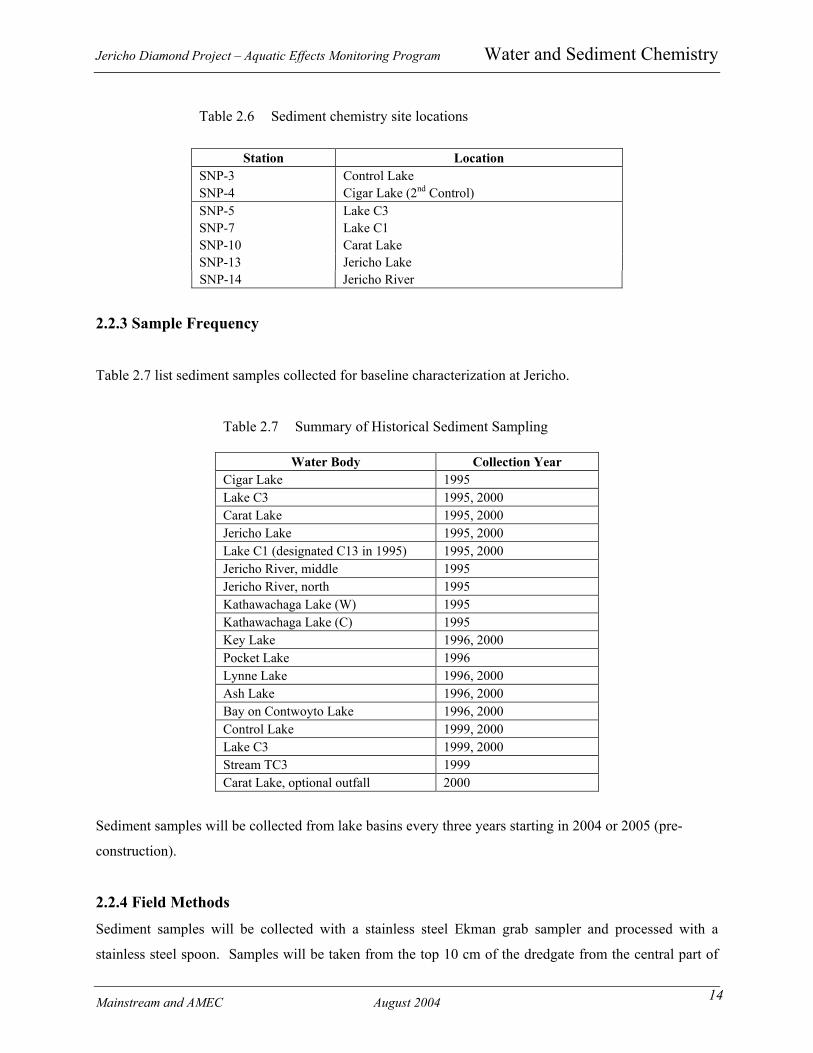
Table 2.6 Sediment chemistry site locations
Station Location SNP-3 Control Lake SNP-4 Cigar Lake (2nd Control) SNP-5 Lake C3 SNP-7 Lake C1 SNP-10 Carat Lake SNP-13 Jericho Lake SNP-14 Jericho River
2.2.3 Sample Frequency
Table 2.7 list sediment samples collected for baseline characterization at Jericho.
Table 2.7 Summary of Historical Sediment Sampling
Water Body Collection Year Cigar Lake 1995 Lake C3 1995, 2000 Carat Lake 1995, 2000 Jericho Lake 1995, 2000 Lake C1 (designated C13 in 1995) 1995, 2000 Jericho River, middle 1995 Jericho River, north 1995 Kathawachaga Lake (W) 1995 Kathawachaga Lake (C) 1995 Key Lake 1996, 2000 Pocket Lake 1996 Lynne Lake 1996, 2000 Ash Lake 1996, 2000 Bay on Contwoyto Lake 1996, 2000 Control Lake 1999, 2000 Lake C3 1999, 2000 Stream TC3 1999 Carat Lake, optional outfall 2000
Sediment samples will be collected from lake basins every three years starting in 2004 or 2005 (pre-
construction).
2.2.4 Field Methods
Sediment samples will be collected with a stainless steel Ekman grab sampler and processed with a
stainless steel spoon. Samples will be taken from the top 10 cm of the dredgate from the central part of
Jericho Diamond Project – Aquatic Effects Monitoring Program Water and Sediment Chemistry
Mainstream and AMEC August 2004 15
the grab. Enough sediment will be collected at each station to allow the lab to analyze quintuplicate (5)
samples the first year. A power analysis will be conducted on the results from the first sampling year to
determine the number of replicates required for subsequent years’ monitoring.
2.2.5 Field QA/QC
The Ekman grab sampler and sampling spoon will be thoroughly washed with sample station lake water
prior to collecting the sample. Sediment samples will be placed either in clean wide-mouth plastic bottles
or plastic bags. If in bags, samples will be double-bagged with a label between the bags, as well as
sample information marked on the outside of the bag with a waterproof ink marker. If wide mouth jars
are provided by the laboratory, jars will be labeled prior to use. Only new (unused) jars or bags will be
used to store samples.
2.2.6 Laboratory Methods
Sediments will be analyzed for total extractable metals to be consistent with 1999 and 2000 methods
(EPA 3050/6010). Analytical methods will be similar to those used for water chemistry.
2.2.7 Laboratory QA/QC
See water chemistry, Section 2.1.7.
2.3 DATA ANALYSIS
Water chemistry data analysis will follow the procedures used for baseline studies and discussed in the
Jericho Project Final Environmental Impact Statement. Minimum, arithmetic mean and maximum values
were determined for all samples together with standard deviation for samples from each station.
For operational sampling, water from control sites will be compared to nearfield and farfield sites.
Results will be compared to effluent chemistry to ascertain whether dilution model predictions are
validated and to aid in interpretation of biological results (See Section 3.0). Analyses of effluent will be
compared to the Mine’s water license for compliance. Analyses of receiving water bodies will be
compared to CCME as a guide to potential for chronic effects. CCME is not proposed as a trigger for
action, rather effects detected at the site from biological monitoring are. While Jericho Mine will be a
diamond mine and not a metal mine, it is expected that many provisions of aquatic effects monitoring
required by MMER will be set out as conditions of the mine’s water license. Protocols for follow up
Jericho Diamond Project – Aquatic Effects Monitoring Program Water and Sediment Chemistry
Mainstream and AMEC August 2004 16
actions when effects are detected are expected to be required at the Jericho mine. (see Environment
Canada 2002).
Sediment chemistry data analysis will include:
• Power analysis on Year 0 (pre-construction samples requested by Environment Canada at the Jericho Public Hearing) to determine the number of replicates required for additional sample campaigns.
• Within sample variation at each site (part of the above). • Baseline characterization (mean, minimum, maximum, standard deviation). • Comparison of samples collected after operations commence for differences between control,
nearfield and farfield chemistry. • Evaluation of effects as per water chemistry.
Data analyses will be included in reports.
2.4 REPORTING
A report summarizing the methods and results of the monitoring program will be prepared and submitted.
The timing of report submission will be in accordance with the mine’s water license.
2.5 RESPONSIBILITY FOR SAMPLING The ultimate responsibility for monitoring will be the mine environmental coordinator who will arrange
for contractors, sample containers, shipment of samples, and will either conduct the sampling or supervise
the sampling.
Jericho Diamond Project – Aquatic Effects Monitoring Program Aquatic Biota
Mainstream and AMEC August 2004 17
3.0 AQUATIC BIOTA
There are a number of potential sources of deleterious substances that can affect aquatic biota, which can
be categorized into three broad groups: nutrient loading, elevated suspended sediments, and increased
levels of metal contaminants. All three have the potential to adversely affect aquatic biota.
3.1 PARAMETERS
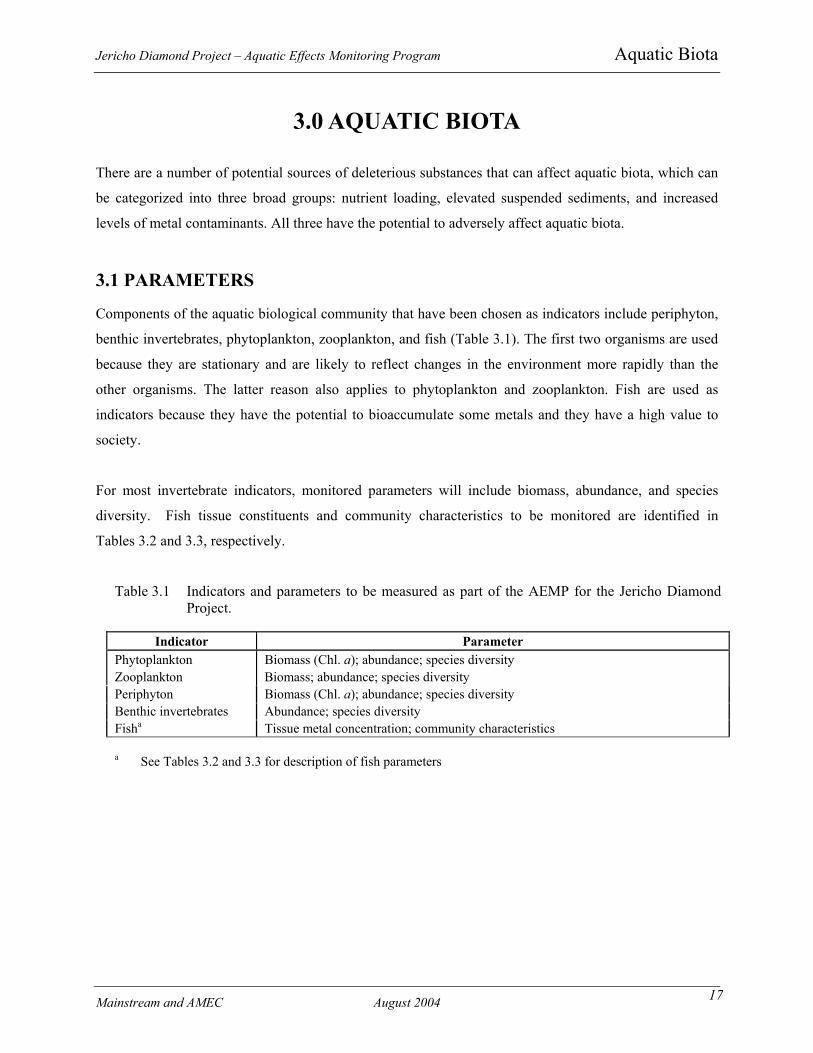
Components of the aquatic biological community that have been chosen as indicators include periphyton,
benthic invertebrates, phytoplankton, zooplankton, and fish (Table 3.1). The first two organisms are used
because they are stationary and are likely to reflect changes in the environment more rapidly than the
other organisms. The latter reason also applies to phytoplankton and zooplankton. Fish are used as
indicators because they have the potential to bioaccumulate some metals and they have a high value to
society.
For most invertebrate indicators, monitored parameters will include biomass, abundance, and species
diversity. Fish tissue constituents and community characteristics to be monitored are identified in
Tables 3.2 and 3.3, respectively.
Table 3.1 Indicators and parameters to be measured as part of the AEMP for the Jericho Diamond Project.
Indicator Parameter
Phytoplankton Biomass (Chl. a); abundance; species diversity Zooplankton Biomass; abundance; species diversity Periphyton Biomass (Chl. a); abundance; species diversity Benthic invertebrates Abundance; species diversity Fisha Tissue metal concentration; community characteristics a See Tables 3.2 and 3.3 for description of fish parameters
Jericho Diamond Project – Aquatic Effects Monitoring Program Aquatic Biota
Mainstream and AMEC August 2004 18
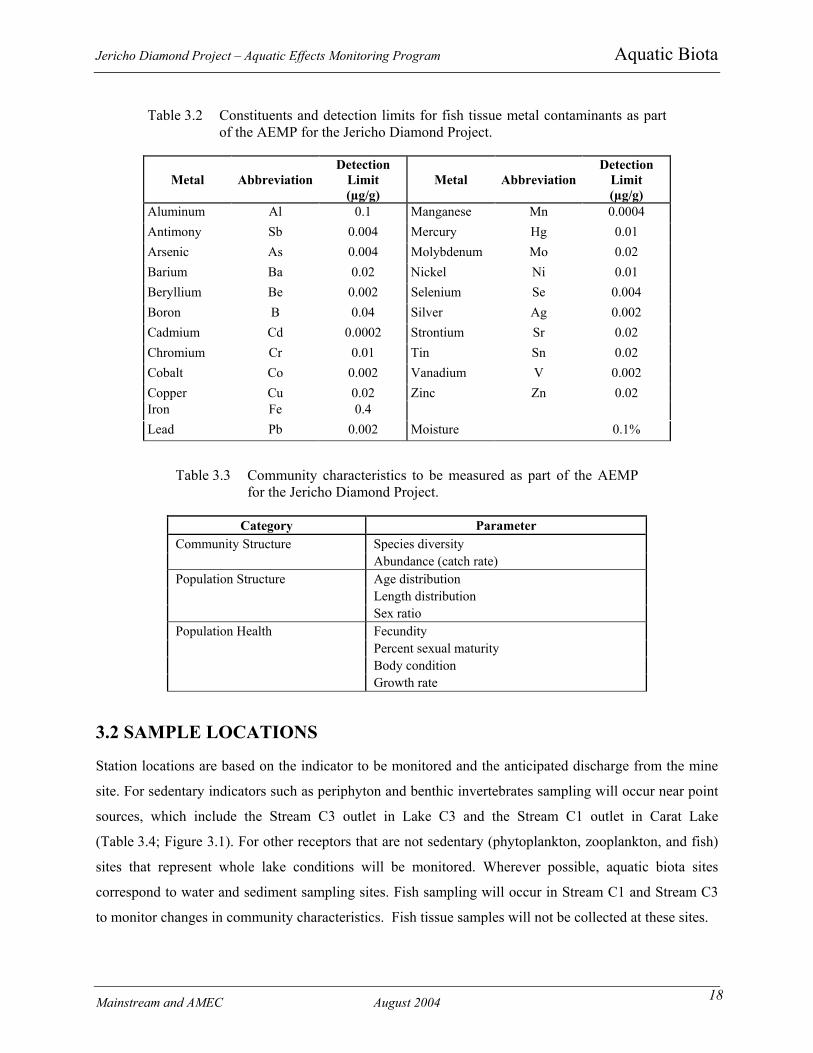
Table 3.2 Constituents and detection limits for fish tissue metal contaminants as part of the AEMP for the Jericho Diamond Project.
Metal Abbreviation Detection
Limit (µg/g)
Metal Abbreviation Detection
Limit (µg/g)
Aluminum Al 0.1 Manganese Mn 0.0004 Antimony Sb 0.004 Mercury Hg 0.01 Arsenic As 0.004 Molybdenum Mo 0.02 Barium Ba 0.02 Nickel Ni 0.01 Beryllium Be 0.002 Selenium Se 0.004 Boron B 0.04 Silver Ag 0.002 Cadmium Cd 0.0002 Strontium Sr 0.02 Chromium Cr 0.01 Tin Sn 0.02 Cobalt Co 0.002 Vanadium V 0.002 Copper Cu 0.02 Zinc Zn 0.02 Iron Fe 0.4 Lead Pb 0.002 Moisture 0.1%
Table 3.3 Community characteristics to be measured as part of the AEMP for the Jericho Diamond Project.
Category Parameter
Community Structure Species diversity Abundance (catch rate) Population Structure Age distribution Length distribution Sex ratio Population Health Fecundity Percent sexual maturity Body condition Growth rate
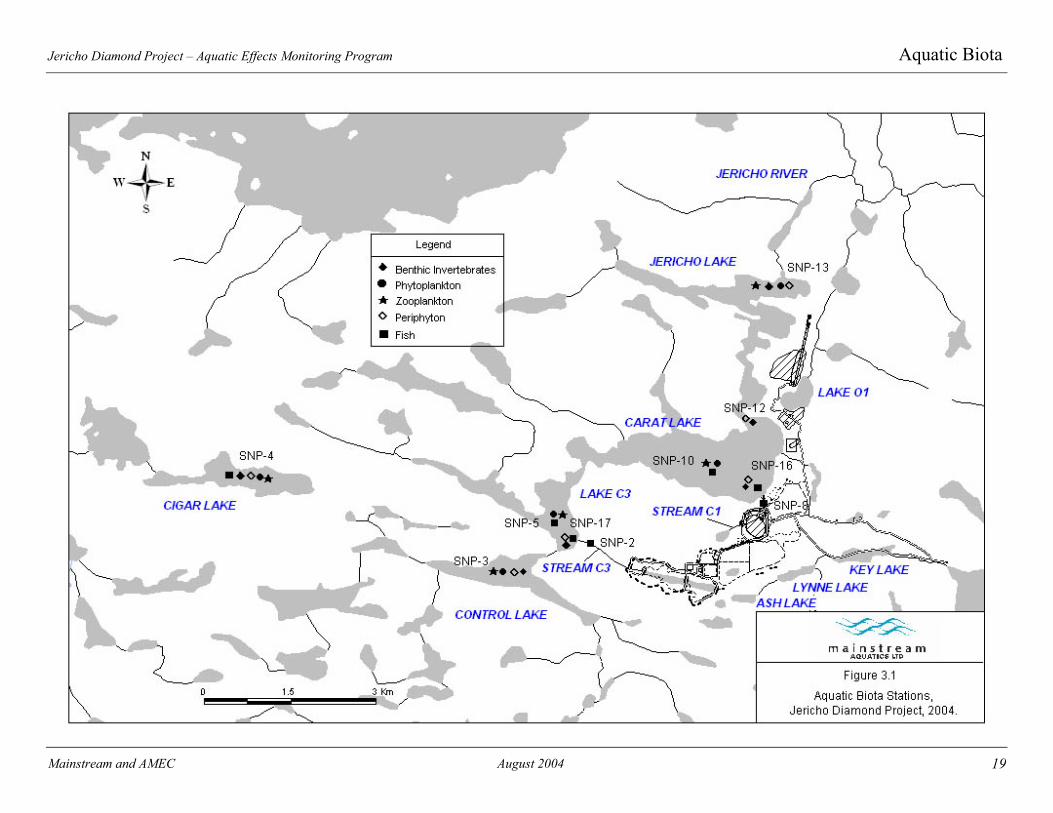
3.2 SAMPLE LOCATIONS
Station locations are based on the indicator to be monitored and the anticipated discharge from the mine
site. For sedentary indicators such as periphyton and benthic invertebrates sampling will occur near point
sources, which include the Stream C3 outlet in Lake C3 and the Stream C1 outlet in Carat Lake
(Table 3.4; Figure 3.1). For other receptors that are not sedentary (phytoplankton, zooplankton, and fish)
sites that represent whole lake conditions will be monitored. Wherever possible, aquatic biota sites
correspond to water and sediment sampling sites. Fish sampling will occur in Stream C1 and Stream C3
to monitor changes in community characteristics. Fish tissue samples will not be collected at these sites.
Jericho Diamond Project – Aquatic Effects Monitoring Program Aquatic Biota
Mainstream and AMEC August 2004 19
Jericho Diamond Project – Aquatic Effects Monitoring Program
Mainstream and AMEC August 2004 20
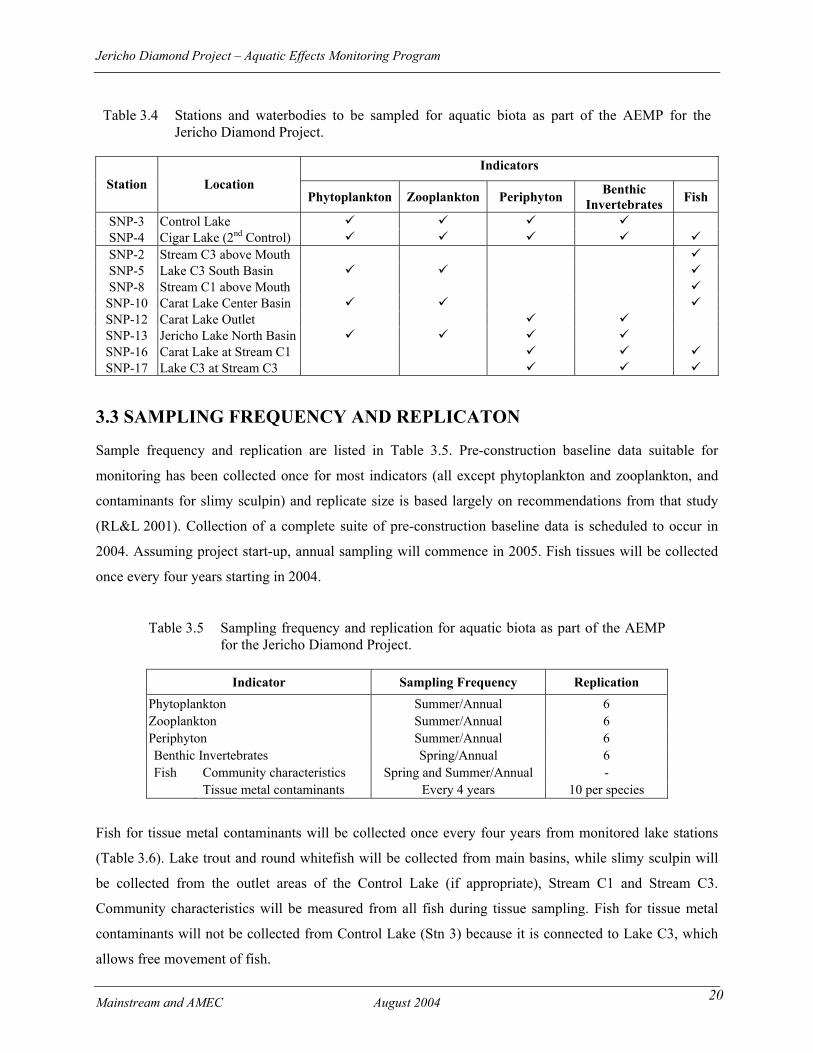
Table 3.4 Stations and waterbodies to be sampled for aquatic biota as part of the AEMP for the Jericho Diamond Project.
Indicators
Station Location Phytoplankton Zooplankton Periphyton Benthic
Invertebrates Fish
SNP-3 Control Lake SNP-4 Cigar Lake (2nd Control) SNP-2 Stream C3 above Mouth SNP-5 Lake C3 South Basin SNP-8 Stream C1 above Mouth SNP-10 Carat Lake Center Basin SNP-12 Carat Lake Outlet SNP-13 Jericho Lake North Basin SNP-16 Carat Lake at Stream C1 SNP-17 Lake C3 at Stream C3
3.3 SAMPLING FREQUENCY AND REPLICATON
Sample frequency and replication are listed in Table 3.5. Pre-construction baseline data suitable for
monitoring has been collected once for most indicators (all except phytoplankton and zooplankton, and
contaminants for slimy sculpin) and replicate size is based largely on recommendations from that study
(RL&L 2001). Collection of a complete suite of pre-construction baseline data is scheduled to occur in
2004. Assuming project start-up, annual sampling will commence in 2005. Fish tissues will be collected
once every four years starting in 2004.
Table 3.5 Sampling frequency and replication for aquatic biota as part of the AEMP for the Jericho Diamond Project.
Indicator Sampling Frequency Replication
Phytoplankton Summer/Annual 6 Zooplankton Summer/Annual 6 Periphyton Summer/Annual 6 Benthic Invertebrates Spring/Annual 6 Fish Community characteristics Spring and Summer/Annual - Tissue metal contaminants Every 4 years 10 per species
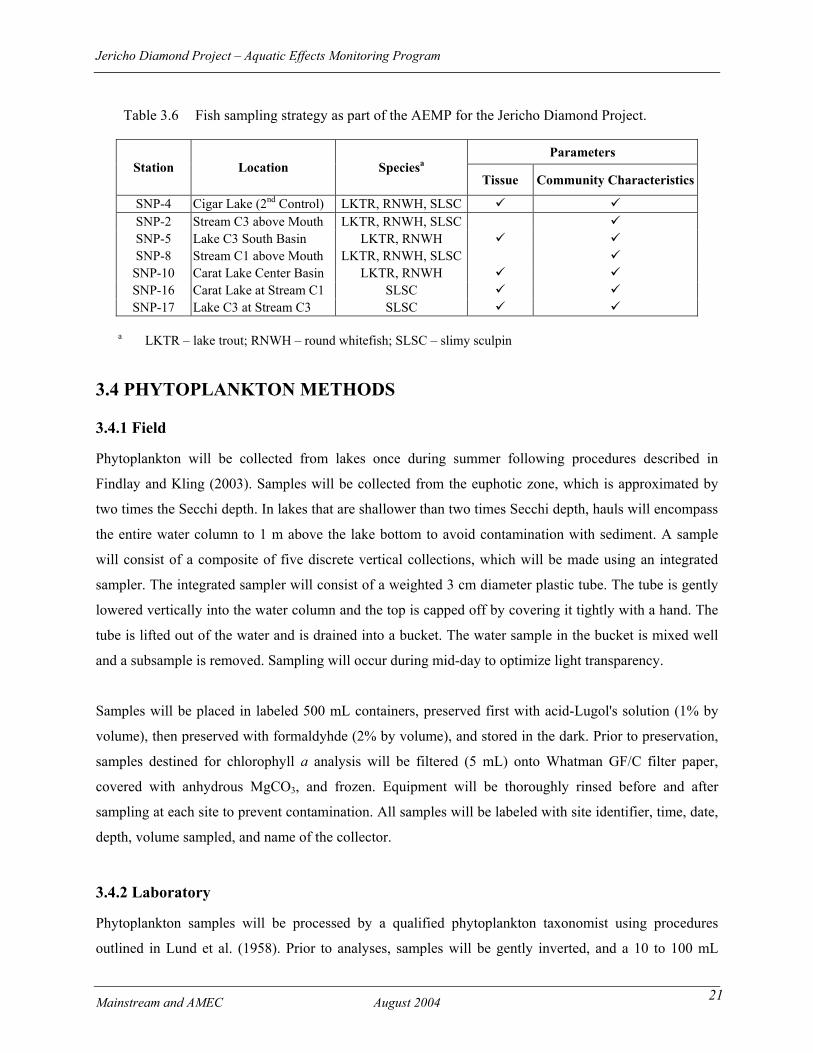
Fish for tissue metal contaminants will be collected once every four years from monitored lake stations
(Table 3.6). Lake trout and round whitefish will be collected from main basins, while slimy sculpin will
be collected from the outlet areas of the Control Lake (if appropriate), Stream C1 and Stream C3.
Community characteristics will be measured from all fish during tissue sampling. Fish for tissue metal
contaminants will not be collected from Control Lake (Stn 3) because it is connected to Lake C3, which
allows free movement of fish.
Jericho Diamond Project – Aquatic Effects Monitoring Program
Mainstream and AMEC August 2004 21
Table 3.6 Fish sampling strategy as part of the AEMP for the Jericho Diamond Project.
Parameters Station Location Speciesa
Tissue Community Characteristics
SNP-4 Cigar Lake (2nd Control) LKTR, RNWH, SLSC SNP-2 Stream C3 above Mouth LKTR, RNWH, SLSC SNP-5 Lake C3 South Basin LKTR, RNWH SNP-8 Stream C1 above Mouth LKTR, RNWH, SLSC
SNP-10 Carat Lake Center Basin LKTR, RNWH SNP-16 Carat Lake at Stream C1 SLSC SNP-17 Lake C3 at Stream C3 SLSC
a LKTR – lake trout; RNWH – round whitefish; SLSC – slimy sculpin
3.4 PHYTOPLANKTON METHODS
3.4.1 Field
Phytoplankton will be collected from lakes once during summer following procedures described in
Findlay and Kling (2003). Samples will be collected from the euphotic zone, which is approximated by
two times the Secchi depth. In lakes that are shallower than two times Secchi depth, hauls will encompass
the entire water column to 1 m above the lake bottom to avoid contamination with sediment. A sample
will consist of a composite of five discrete vertical collections, which will be made using an integrated
sampler. The integrated sampler will consist of a weighted 3 cm diameter plastic tube. The tube is gently
lowered vertically into the water column and the top is capped off by covering it tightly with a hand. The
tube is lifted out of the water and is drained into a bucket. The water sample in the bucket is mixed well
and a subsample is removed. Sampling will occur during mid-day to optimize light transparency.
Samples will be placed in labeled 500 mL containers, preserved first with acid-Lugol's solution (1% by
volume), then preserved with formaldyhde (2% by volume), and stored in the dark. Prior to preservation,
samples destined for chlorophyll a analysis will be filtered (5 mL) onto Whatman GF/C filter paper,
covered with anhydrous MgCO3, and frozen. Equipment will be thoroughly rinsed before and after
sampling at each site to prevent contamination. All samples will be labeled with site identifier, time, date,
depth, volume sampled, and name of the collector.
3.4.2 Laboratory
Phytoplankton samples will be processed by a qualified phytoplankton taxonomist using procedures
outlined in Lund et al. (1958). Prior to analyses, samples will be gently inverted, and a 10 to 100 mL
Jericho Diamond Project – Aquatic Effects Monitoring Program
Mainstream and AMEC August 2004 22
subsample will be dispensed into sedimentation chambers (Lund et al. 1958). Subsample volume is
dependant on the ability to count a minimum of 200 phytoplankton cells. After a 24 h sedimentation
period, samples will be processed. A species list will be developed by scanning the entire basal area of the
chamber with an inverted microscope (WildTM M-40). Taxonomic keys used for identification will
include Prescott (1970), Taft and Taft (1971), and Webber (1971).
Cell density will be assessed. To calculate cell density (cells/mL), individual cells will be enumerated
within a specified area of the sedimentation chamber. This is accomplished by counting the number of
cells along horizontal transects placed across the specified area. One or more transects are processed until
the minimum number of 200 cells are counted. To calculate the cell density, the number of cells within
the specified area is extrapolated to the subsample, and then to the entire sample.
Chlorophyll a analysis will be conducted using the spectrophotometric-acetone extraction method
described by Moss (1967a, 1967b). This method corrects for the presence of phaeophytin a, which may be
present in decaying algal cells. This is achieved by acidification of the sample after initial measurement
and referencing results to predetermined calibration curves.
3.5 ZOOPLANKTON METHODS
3.5.1 Field
Zooplankton will be collected from lakes once during summer following the general procedures described
in Paterson (2003). Each zooplankton sample will consist of a composite of five vertical hauls, each of
which will be taken from a depth that is equal to two times the euphotic zone (approximately four times
Secchi depth). In lakes that are shallower than four times Secchi depth, hauls will encompass the entire
water column to 1 m above the lake bottom to avoid contamination with sediment. Zooplankton
collections will be made with a Wisconsin plankton net constructed with Nitex® mesh (net mouth
diameter 130 mm; 0.064 x 0.064 mm mesh). For each haul, the net will be lowered to the desired depth
and then retrieved at a constant rate of 1.0 m/s. Each sample will be immediately preserved in 5%
formaldehyde and stored in a labeled 500 mL polyethylene bottle. All samples will be labeled with site
identifier, time, date, depth, and name of the collector. Equipment will be thoroughly rinsed before and
after sampling at each site to prevent contamination.
Jericho Diamond Project – Aquatic Effects Monitoring Program
Mainstream and AMEC August 2004 23
3.5.3 Laboratory
Zooplankton samples will be processed by a qualified taxonomist. Zooplankton counts will be conducted
using a dissecting stereo-microscope (WildTM-5); identifications will be made using a compound
microscope equipped with a phase-contrast condenser (WildTM 20). Taxonomic keys used for crustacean
plankton may include Brooks, Wilson, and Yeatman (in Edmondson 1959), supplemented by the keys of
Brooks (1957), Smirnov (1971), Brandlova et al. (1972), Flössner (1972), and Kiefer (1978). The
taxonomic key used for identification of rotifers will be the Voigt revision by Koste (1978), supplemented
by keys of Ahlstrom (1943) and Ruttner-Kolisko (1974). Chaoboridae will be identified using the keys of
Cook (1956) and Saether (1970). A species list will be developed for each sample.
Zooplankton will be identified and enumerated. The technique used will depend on the taxonomic group.
Cladocerans and copepods (all stages) will be enumerated either from three 15 mL subsamples or from
the entire sample using a dissecting microscope at 12× to 50× magnification. For cladocerans and
copepods, subsampling will be performed (using an automatic pipette) on samples that contain large
numbers of specimens. All samples will be subsampled (using an automatic pipette) for rotifer
enumeration; however, each subsample will be allowed to settle for 24 h before processing. An inverted
microscope (100× or 200× magnification) will be used to enumerate rotifers by counting either six fields
(one field = 0.02625 cm2) or the entire counting chamber (4.907 cm2). Subsamples will be continually
removed from the original sample until approximately 200 mature or identifiable rotifer organisms are
processed. Once numbers of organisms within each sample are established, these values will be converted
to densities per cubic metre. This will be accomplished by dividing the number of organisms encountered
in a sample by the total volume filtered (i.e., net mouth area * depth of haul * number of hauls).
Biomass will be determined. To calculate biomass, lengths will be measured from the first 30 individuals
observed in a sample. Lengths of larger zooplankton will be measured directly with a microscope
connected to a calibrated Sigma ScanTM digitizing tablet. Smaller zooplankton, such as rotifers, will be
measured using an eyepiece graticule and corrected for magnification. Using length measurements from
individual organisms, weights will be calculated from published length-weight regression equations. For
each sample, a mean individual weight will be calculated by averaging the estimated weights generated
from the length-weight regression equation. Biomass for each taxonomic group will be calculated by
multiplying the number enumerated for that sample by the mean individual weight.
Jericho Diamond Project – Aquatic Effects Monitoring Program
Mainstream and AMEC August 2004 24
3.6 PERIPHYTON METHODS
3.6.1 Field
The periphyton community will be monitored during the open water period using artificial substrates
placed on the lake bottom 5 m from the water surface. Substrates will be placed immediately following
ice-out and will be retrieved in late summer.
In late summer periphyton will be removed from a known surface area on each artificial substrate, and the
material rinsed with deionized water into a 500 mL polyethelyene sample bottle. Samples used for algal
identification and enumeration will be preserved with 5% acid-Lugol’s solution. Shortly after collection,
two drops of 100% formalin will be added to each of these samples to prevent growth of bacteria and
fungi. Samples used for chlorophyll a analysis will be filtered (5 mL) onto Whatman GF/C filter paper,
covered with anhydrous MgCO3, and frozen.
3.6.2 Laboratory
Periphyton samples will be processed by a qualified taxonomist using procedures described in Lund et al.
(1958). Samples will first be mixed and then subjected to serial dilutions (generally 0 to 1000 fold
dilutions depending on algal and organic debris in the original sample). Subsequently, 1 to 10 mL
subsamples will be dispensed into sedimentation chambers. Subsample volume is dependant on the ability
to count a minimum of 200 periphyton cells. After a 12 h settling period, the basal area of each chamber
will be scanned qualitatively with an inverted WildTM M-40 microscope to identify the best dilution factor
for subsequent quantitative analyses and to obtain a comprehensive species list. Once the appropriate
dilution factor is established, taxonomic groups within the sample are identified and enumerated.
Taxonomic keys of Smith (1950), Prescott (1970), and Webber (1971) will be used for species
identification. Counts will be made at a magnification of approximately 450 times along horizontal
transects across the diameter of the chamber. One or more transects are processed until the minimum
number of 200 cells are counted. Species that are encountered, but not enumerated during routine transect
counts, will be recorded as present.
To identify and enumerate diatoms, subsamples will be ashed in a muffle furnace and then repeateable
washed with distilled water. The cleaned frustules will then be dried on cover glasses and mounted in
StoraxTM.
Jericho Diamond Project – Aquatic Effects Monitoring Program
Mainstream and AMEC August 2004 25
Chlorophyll a analysis will be conducted using the spectrophotometric-acetone extraction method
described by Moss (1967a, 1967b). This method corrects for the presence of phaeophytin a, which may be
present in decaying algal cells. This is achieved by acidification of the sample after initial measurement
and referencing results to predetermined calibration curves.
3.7 BENTHIC INVERTEBRATES METHODS
3.7.1 Field
Benthic invertebrates will be sampled following general procedures described in Rosenberg et al. (2003).
Benthic invertebrates will be sampled immediately following ice-out from sites located from fine
sediments in water depths at 5.0 m. Sampling during the early open water period is deemed appropriate
for two reasons. First, it is logistically more feasible to sample during open water compared to winter
when ice formation limits access to sites. Two, collections made during the open water period before
emergence (transformation of larvae/pupae into adults), provides good representation of the benthic
macroinvertebrate community. Ekman grab sampler (aperture area equal to 0.023 m2) will be used to
collect replicates at each station. To reduce problems associated with low numbers of benthic
invertebrates and within-site variation, each replicate will consist of a composite of three grabs. The
quality of the sample will be examined (i.e., jaws are closed and the grab is full) before it is processed.
Samples will be sieved through a 0.243 mm mesh net to remove excess sediments, placed in labelled
polyethylene sample bags, and preserved in 10% formalin.
One sediment sample will be collected at each site to characterize particle size distribution.
3.7.2 Laboratory
Benthic invertebrate samples will be processed by a qualified taxonomist. Before processing, samples will
be rinsed of formaldahyde. Processing will involve several steps. First, larger materials (e.g., gravels and
aquatic vegetation) will be physically removed and macroinvertebrates separated from the material.
Second, samples will be repeatedly rinsed and decanted to remove the preservative and to collect
additional, exposed macroinvertebrates. This procedure will be continued until invertebrates are no longer
observed in the elutriated water. Third, the sample will be thoroughly mixed and a subsample equaling
one third of the total will be processed using standard methods and criteria described in Wrona et al.
1982.
Jericho Diamond Project – Aquatic Effects Monitoring Program
Mainstream and AMEC August 2004 26
Invertebrates will be sorted by major group and identified to the lowest practical taxonomic level using a
dissecting microscope (6 to 42 magnification). The taxonomic level will be genus or species for most
invertebrates. Chironomids will be identified to Family or Tribe. Keys used for identification may include
Wiggins (1977), Merritt and Cummins (1984), and Clifford (1991).
Once processing is complete samples will be preserved in 70% ethanol.
3.8 FISH METHODS
To avoid adverse effects on the fish populations residing in the Project area lakes, it is recommended that
only small numbers of fish be killed for monitoring purposes. As such, sample sizes likely will not be
sufficient to properly quantify the parameters recommended in the MMEEM guidelines because of the
inherent variability in fish populations (Environment Canada 2002). In addition, measurable changes to
the fish populations likely would not occur within the operational life of the Project. Despite these
limitations, fish will be included in the AEMP because they have high social value.
3.8.1 Field
Tissues
Gill nets will be used to collect lake trout and round whitefish from each of the monitored lakes. Slimy
sculpins will be collected from shoreline areas using a back electrofishers. Muscle and liver tissues will
be used to monitor tissue metal contaminants in lake trout and round whitefish. Due to small body size,
whole fish tissue analysis will be used for slimy sculpin.
Sampling protocol will follow procedures described by USAEPA (2000). Appropriate measures will be
taken to prevent inadvertent contamination. All dissections will occur on a washable plastic surface.
High-quality, corrosion-resistant stainless steel sample processing equipment will be used including
sterile knives with plastic handles. Utensils and containers will be cleaned thoroughly with a detergent
solution, rinsed with 5% HNO3, followed by an immediate rinse with distilled water. All dissecting
equipment, sample containers, sample wrapping and wash equipment will be shipped and stored in clean
waterproof containers.
Dorsal musculature (50 to 100 g) and livers (excluding the gall bladder) will be dissected from each fish
and sealed in 120 mL sterile, acid-washed specimen containers. All tissue samples will be immediately
frozen and kept frozen until the time of laboratory analyses.
Jericho Diamond Project – Aquatic Effects Monitoring Program
Mainstream and AMEC August 2004 27
Data recorded for each collected fish will include fork length (±1 mm), weight (± 2 g), sex, maturity, and
gonad weight (±1 %). An appropriate ageing structure will be collected (otoliths) from all captured fish.
Community Characteristics
Fish community characteristics in Stream C1 and Stream C3 will be monitored annually in spring and
summer. The purpose will be to ascertain fish use and to characterize the community. Spring and summer
sampling will encompass two major components of the fish community life strategies: spring spawning
and summer rearing. The primary method used will be backpack ekectrofishing. All captured fish will be
measured for non-lethal parameters. This will preclude collection of otoliths for aging purposes.
3.8.2 Laboratory
Analyses of metal concentrations in fish tissues will be conducted by a qualified laboratory. Fish tissue
monitoring parameters and detection limits are listed in Table 3.7. The following is a description of the
methods and instrumentation to be used.
Tissue samples will be stored frozen until analyses are undertaken. Samples will be prepared for analyses
by first homogenizing the tissue in plastic cups. Prior to homogenization of each sample, the apparatus
will be cleaned with deionized water. Approximately 1 g of homogenized tissue is then weighed into a
precleaned (triple nitric acid) teflon digestion vessel. High purity nitric acid (4 mL) is added and the
vessel is capped before being heated. The resulting solution is made up to a volume of 25 mL with
deionized water for subsequent analyses by Inductively Coupled Argon Plasma/Mass Spectrometer.
Moisture content will be measured using 1 g of homogenized tissue. The sample will be weighed into a
preweighed and tared 10 mL glass beaker. The beaker and sample are then dried overnight at 105°C.
After cooling to room temperature, the beaker and sample are transferred to a desiccator for 2 h, after
which, the beaker with the sample is re-weighed to obtain the loss in moisture. All results will be reported
as micrograms per gram on a ‘dry weight’ basis.
Jericho Diamond Project – Aquatic Effects Monitoring Program
Mainstream and AMEC August 2004 28
3.9 QUALITY CONTROL/ASSURANCE
Sampling protocols will be adhered to ensure consistency in sampling technique for each parameter. Fish
metal contaminants sampling will follow safeguards to prevent contamination as follows:
• Use of sterile stainless steel instruments. • Tissue cups rinsed in 5% nitric acid solution. • Covering the work area in plastic.
To check the analytical precision and accuracy of the laboratory for fish metal contaminants one split
tissue sample will be submitted from each monitored lake.
The following QA/QC procedures will be used to ensure the integrity of the data.
1. Constancy of identifications will be achieved by using the same person to analyze all samples. 2. Ten percent of samples, or check samples, will be analyzed by other qualified persons to ensure
the accuracy of identifications and counts. 3. Split samples will be collected from 5% of the samples. 4. When subsampling is required, confirmation that subsampling is random, will be tested by
comparing the subsample with a Poisson distribution (Prepas 1984). 5. For benthic invertebrates residues of 10% of the samples will be examined to determine the
proportion of benthic invertebrates left behind. 6. Use of reference keys and/or reference collections to ensure standard taxonomic identifications. 7. All samples will be archived for future reference.
For tissue metal contaminant analysis QA/QC procedures used will include running certified reference
materials (including NBS1566A-oyster tissue, DORM-2, and DOLT-2) and sample duplicates at a
minimum ratio of 1 per 20. Acceptance criteria for CRM’s is within 30% of nominal at >10 times the
LOD. For duplicates, acceptance criteria is that the sample and its duplicate are within ± 20% of the
average value at >10 times the LOD.
3.10 DATA ANALYSES
Data analyses will follow accepted protocols where appropriate that are described in Environment Canada
(2002). The methods for evaluation will involve, but not be limited to the following:
• Before-After-Control-Impact • Analysis of Variance or Analysis of Covariance • Linear or Nonlinear Regression • Trend Analysis • Visual (graphical) Analysis
Jericho Diamond Project – Aquatic Effects Monitoring Program
Mainstream and AMEC August 2004 29
The first step will involve exploration of the data in order to meet the assumptions required for parametric
statistical analyses. When these assumptions cannot be met, nonparametric tests will be employed. All
tests will follow descriptions presented in Sokal and Rolhf (1981).
The Z-value power equation described in Environment Canada and Department of Fisheries and Oceans
(1995) will be used to ascertain the power of the statistical analyses. Statistical levels of certainty will be
set at alpha = 0.1 and beta = 0.2.
3.11 REPORTING
A report summarizing the methods and results of the aquatic biota monitoring program will be prepared
and submitted. This report will also compare the results of this study with those of the earlier pilot study
and will make recommendations to improve the program design, where appropriate. The timing of report
submission will be in accordance with the mine’s water license.
3.12 RESPONSIBILITY FOR SAMPLING The ultimate responsibility for monitoring will be the mine environmental coordinator who will arrange
for contractors, sample containers, shipment of samples, and will either conduct the sampling or supervise
the sampling.

Jericho Diamond Project – Aquatic Effects Monitoring Program Sediment Deposition
Mainstream and AMEC August 2004 31
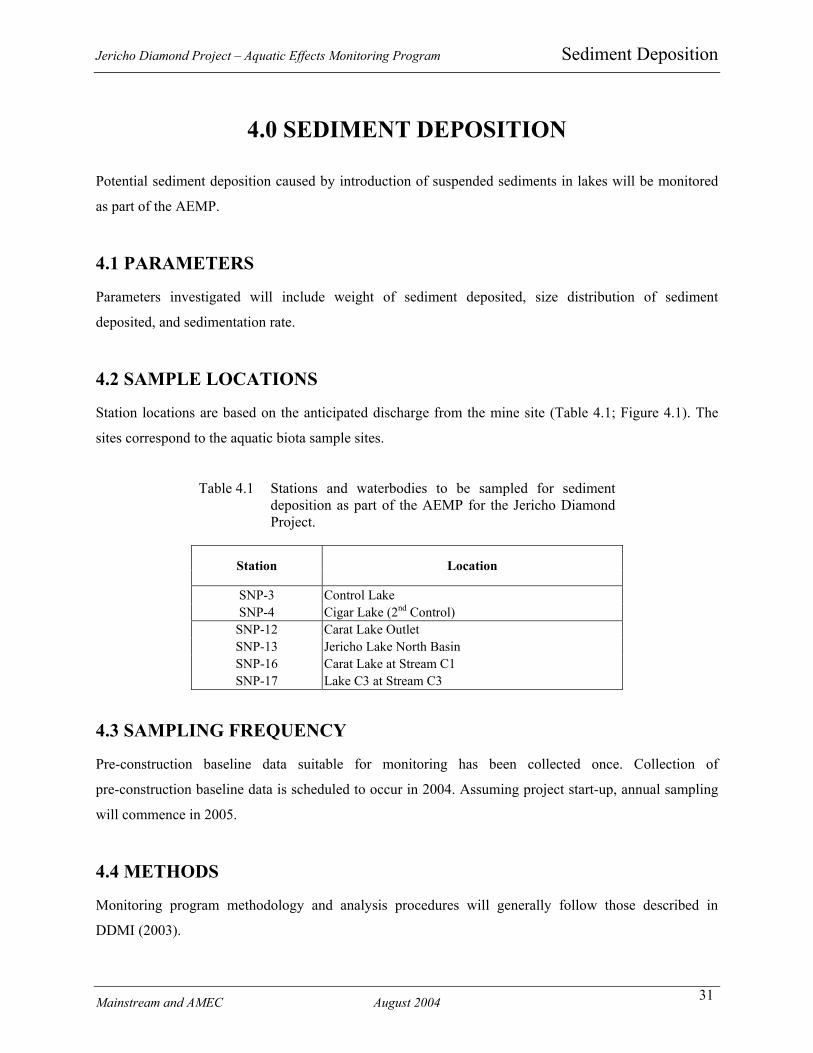
4.0 SEDIMENT DEPOSITION
Potential sediment deposition caused by introduction of suspended sediments in lakes will be monitored
as part of the AEMP.
4.1 PARAMETERS
Parameters investigated will include weight of sediment deposited, size distribution of sediment
deposited, and sedimentation rate.
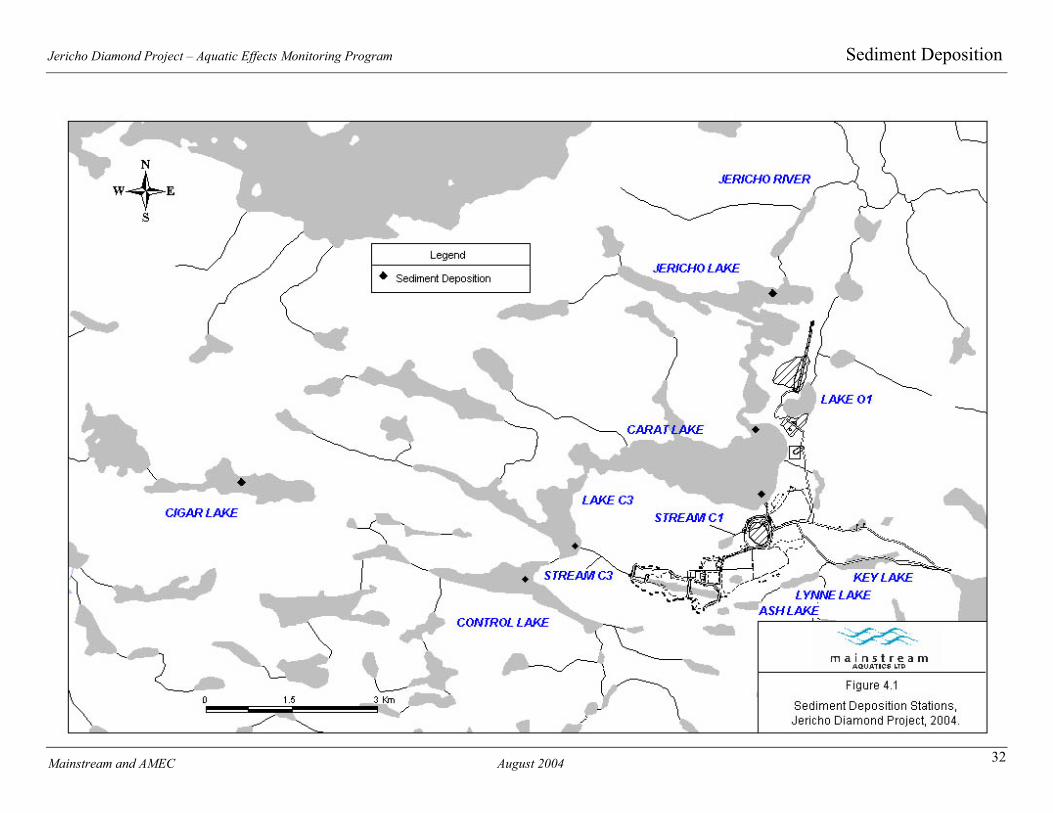
4.2 SAMPLE LOCATIONS
Station locations are based on the anticipated discharge from the mine site (Table 4.1; Figure 4.1). The
sites correspond to the aquatic biota sample sites.
Table 4.1 Stations and waterbodies to be sampled for sediment deposition as part of the AEMP for the Jericho Diamond Project.
Station Location
SNP-3 Control Lake SNP-4 Cigar Lake (2nd Control)
SNP-12 Carat Lake Outlet SNP-13 Jericho Lake North Basin SNP-16 Carat Lake at Stream C1 SNP-17 Lake C3 at Stream C3
4.3 SAMPLING FREQUENCY
Pre-construction baseline data suitable for monitoring has been collected once. Collection of
pre-construction baseline data is scheduled to occur in 2004. Assuming project start-up, annual sampling
will commence in 2005.
4.4 METHODS
Monitoring program methodology and analysis procedures will generally follow those described in
DDMI (2003).
Jericho Diamond Project – Aquatic Effects Monitoring Program Sediment Deposition
Mainstream and AMEC August 2004 32
Jericho Diamond Project – Aquatic Effects Monitoring Program Sediment Deposition
Mainstream and AMEC August 2004 33
4.4.1 Field
Sediment traps will be deployed at the end of the open water period (late August) and left in place for one
year. The design of the traps is similar to those described in the CRC Handbook of Techniques for
Aquatic Sediments Sampling (CSR 1991). Traps will consist of collection bottles located in PVC tubes
suspended 1 m above the lake bottom. The minimum water depth will be 5 m to avoid ice damage.
4.4.2 Laboratory
Immediately following retrieval of the trap, the collected sediments will be shipped to a qualified
laboratory for analysis of sediment weight and particle size distribution. The total dry weight (gm) of
sediment in each sample will be calculated by subtracting the filtered weight from the weight of the filter
paper. Percent particle size distribution (0.691 µm to 710 µm) will be determined by Microtrac analysis.
4.5 QUALITY CONTROL/ASSURANCE
To check laboratory’s precision and accuracy one replicate sample will be submitted..
4.6 DATA ANALYSES
Sediment deposition rates in mg/cm2/day will be calculated using the total dry weight of the collected
sediment divided by the cylinders’ orifice area, divided by the number of days deployed.
4.7 REPORTING
A report summarizing the methods and results of the sediment monitoring program will be prepared and
submitted. This report will also compare the results of this study with those of the earlier pilot study and
will make recommendations to improve the program design, where appropriate. The timing of report
submission will be in accordance with the mine’s water license.
4.8 RESPONSIBILITY FOR SAMPLING The ultimate responsibility for monitoring will be the mine environmental coordinator who will arrange
for contractors, sample containers, shipment of samples, and will either conduct the sampling or supervise
the sampling.

Jericho Diamond Project – Aquatic Effects Monitoring Program Literature Cited
Mainstream and AMEC August 2004 35
5.0 LITERATURE CITED
Ahlstrom, E.H. 1943. A revision of the rotatorian genus Keratella with descriptions of three new species and five new varieties. Bulletin of the American Museum of Natural History 80 (12): 411-57.
Brandlova, J., Z. Brandl, and C.H. Fernando. 1972. The Cladocera of Ontario with remarks on some species and distribution. Canadian Journal of Zoology 50 (11): 1373-403.
Brooks, J.L. 1957. The systematics of North American Daphnia. Memoirs of Connecticut Academy of Arts and Sciences 13: 1-180.
Clifford, H.F. 1991. Aquatic invertebrates of Alberta. University of Alberta. Press, Edmonton. 538 p.
Cook, E.F. 1956. The Nearctic Chaoborinae (Diptera: Culicidae). Bulletin of the Minnesota Agricultural Experimental Station 218: 102 p.
Diavik Diamond Mines Inc (2003). Sediment Deposition Compilation Study. pp 27 + Appendices.
Edmondson, W.T. 1959. Freshwater biology. 2nd edition John Wiley and Sons, New York, New York. 1248 p.
Environment Canada. 2002. Metal Mining Guidance Document for Aquatic Environmental Effects Monitoring.
Environment Canada and Department of Fisheries and Oceans. 1995. Further guidance for the invertebrate community survey for aquatic environmental effects monitoring related to the Fisheries Act requirements. EEM 2. 206 p.
Findlay, D, L. and H.J. Kling. 2003. Protocols for monitoring biodiversity: Phytoplankton in Freshwater. (WWW document). URL http://www.eman-rese.ca/eman/ecotools/protocols/freshwater/phytoplankton/intro.html
Flössner, D. 1972. Krebstiere, Crustacea: Kiemen und Blattfüsser, Brachiopoda, Fischäuse, Brachiura. Die Tierwelt Deutschlands. 60. Teil. Gustav Fischer Verlag, Jena. 501 p.
Kiefer, F. 1978. Zur Kenntnis des Diacyclops tames (S.A. Forces, 1882) (Copepoda, Cyclopoida). Crustaceana 34 (2): 214-16.
Koste, W. 1978. Rotatoria. Die Rädertiere Mitteleuropas. Ein Bestimmungswerk, begrunder von Max Voigt. Überordnung Monogononta. Gebrüder Bortraeger, Berlin, Stuttgart. Volume I: 673 p. Volume II: 469 p.
Lund, J.W.G., C. Kipping, and E.D. LeCren. 1958. The inverted microscope method of estimating algal numbers and the statistical basis of estimation of counting. Hydrobiologia 11:143-70.
Merritt, R.W., and K.W. Cummins (editors). 1984. An introduction to the aquatic insects of North America. 2nd edition. Kendall/Hunt Publishing Company, Dubuque, Iowa, U.S.A. 722 p.
Jericho Diamond Project – Aquatic Effects Monitoring Program Literature Cited
Mainstream and AMEC August 2004 36
Moss, B. 1967a. A spectrophotometric method for the estimation of percentage degradation of chlorophyll a to phaeopohytin in extracts of algae. Limnology and Oceanography 12: 335-340.
Moss, B. 1967b. A note on the estimation of chlorophyll a in freshwater algal communities. Limnology and Oceanography 12: 340-342.
Mudroch A, and MacKnift S. (1991) CRC Handbook of Techniques for Aquatic Sediments Sampling. CSR Press, pp 112-119.
Paterson, M. 2003. Protocols for monitoring biodiversity: Zooplankton in Fresh Waters. (WWW document). URL http://www.eman-rese.ca/eman/ecotools/protocols/freshwater/zooplankton/intro.html
Prepas, E.E. 1984. Some statistical methods for the design of experiments and analysis of samples, p.
266-335. In J.A. Downing and F.H. Rigler (eds). A manual on methods for the assessment of secondary productivity in fresh waters. 2nd ed. Blackwell Scientific Publishers, Oxford.
Prescott, G.W. 1970. Algae of the Western Great Lakes area. Wm. C. Brown Co. Publishers, Dubuque, Iowa. 977 p.
Rescan Environmental Services Ltd. 2003. Ekati Diamond MineTM AEMP re-evaluation and refinement report: Proposed Program for 2003 – 2007. 89 pp. + appendices.
R.L. & L. Environmental Services Ltd. 2001. Jericho Diamond Project Pilot Aquatic Effects Monitoring Program (1999). Report prepared for Tahera Corporation. R.L.&L. Report No. 820F: 26 p. + 5 app.
Rosenburg, D.M., I.J. Davies, D.G. Cobb, and A.P. Wiens. 2003. Protocols for monitoring biodiversity: Benthic Macroinvertebrates in Fresh Waters. (WWW document). URL http://www.eman-
rese.ca/eman/ecotools/protocols/freshwater/benthics/intro.html Ruttner-Kolisko, A. 1974. Plankton rotifers: Biology and taxonomy. Die Binnengewasser, Volume 26/1,
Supplement. 146 p.
Saether, O.A. 1970. Nearctic and Palaearctic Chaoborus (Diptera: Chaoboridae). Fisheries Research Board of Canada Bulletin 174: 57 p.
Smirnov, N.N. 1971. Fauna of the U.S.S.R. Crustacea: Chydoridae. Volume 1, No. 2. Akad. Nauk. SSSR, New Series No. 101 (Translated from Russian). Israel Program for Scientific Translations, Jerusalem. 644 p.
Smith, G.M. 1950. The freshwater algae of the United States. 2nd ed. McGraw Hill Book Company. New York, New York. 719 p.
Sokal, R.R., and F.J. Rohlf. 1981. Biometry. W.H. Freeman and Co., San Francisco. 859 p.
Taft, C.E., and C.W. Taft. 1971. The algae of Western Lake Erie. Bulletin Ohio Biological Surveys 4: 1-189.
United States Environmental protection Agency. 2000. Guidance for Assessing Chemical Contaminant Data for Use in Fish Advisories Volume 1 - Fish Sampling and Analysis (Third Edition). EPA 823-B-00-007.
Jericho Diamond Project – Aquatic Effects Monitoring Program Literature Cited
Mainstream and AMEC August 2004 37
Webber, C.I. 1971. A guide to the common diatoms of water pollution surveillance system stations. U.S. Environmental Protection Agency, National Environmental Research Centre Analytical Quality Control Laboratory, Cincinnati, Ohio.
Wiggins, G.B. 1977. Larvae of the North American caddisfly genera (Trichoptera). University of Toronto Press, Toronto, Canada. 401 p.
Wrona, F.J., J.M. Culp, and R.W. Davies. 1982. Macroinvertebrate subsampling: A simplified apparatus and approach. Canadian Journal of Fisheries and Aquatic Sciences 39: 1051-1054.