aquatic assessment for alluvial diamond mining operations
TRANSCRIPT

Aquatic Assessment for alluvial diamond mining operations long the Vaal River at Rooipoort on the farms Zandplaats 102/5, Vogelstruis Pan 101/0, Vogelstruis Pan 98/0, Bergplaats 100/0 and Klipfontein 99/0 near Schmidtsdrif, Northern Cape Province.
August 2018
Prepared by:
Juan Potgieter Andre Strydom Prepared for:
Rooipoort Developments (Pty) Ltd
P.O. Box 110471
Hadison Park
8306

Aquatic assessment for proposed new diamond mining activities – Report
1
EXECUTIVE SUMMARY
This report is based on the results of the sampling survey conducted during June 2018 on the
selected sites in the Vaal River.
The primary objectives of this project are as follows:
• Determine the biotic integrity (in terms of macro-invertebrates and fish) of the Vaal
River in the vicinity of the proposed new diamond mining activities.
The aquatic ecosystem within the surrounding area of the proposed new diamond mining
activities were assessed as being largely modified (D) after the current assessment. The
majority of the impacts on this system were associated with upstream activities, agriculture
and instream habitat changes. These modifications in turn influenced the macro-invertebrate
and fish community structures. The water quality results indicated that the water quality was
good indicating only high levels of conductivity at some of the sites. The main sources of the
absence of the expected fish species and macro-invertebrates at the sites were from the
accumulative effects of upstream mining and agricultural activities, impoundments and
general anthropogenic activities.
As the study area does not fall within a Freshwater Ecological Protected Area (FEPA) it is not
governed by its stringent management guidelines. However, normal guidelines should still be
adhered to in regards to any planned development as well as future management of the river.
The impacts of the proposed new diamond mining activities in the system were found to be
potential loss of aquatic habitat and increased turbidity and siltation in the river. The impacts
will have an effect on the water quality and also on the biotic integrity of the system and
mitigation measures need to be implemented to limit any adverse effects.
The following recommendations are made, based on the survey:
• Implementation of a suitable management action plan during the operation of the
proposed diamond mine, based on analysis of bi-annual water quality and biological
monitoring data collected at sites upstream and downstream of all activities;
• Prevention of exotic vegetation encroachment;
• Prevent further siltation within the river segment as well as downstream of activities;
• Unnecessary destruction of marginal and instream habitat should be avoided at all times
during operations.

Aquatic assessment for proposed new diamond mining activities – Report
2
Table of Contents
EXECUTIVE SUMMARY ........................................................................................... 0
Table of Contents ........................................................................................................... 2
List of Figures ................................................................................................................ 3
List of Tables ................................................................................................................. 3
List of Acronyms ........................................................................................................... 4
1. INTRODUCTION ............................................................................................. 5
2. Terms of Reference ............................................................................................ 6
3. Project Team ...................................................................................................... 6
4. Limitations ......................................................................................................... 6
4.1. Factors influencing sampling ............................................................................ 6
4.2. Factors influencing interpretation ..................................................................... 6
5. Study Site Description ....................................................................................... 7
5.1. Location ............................................................................................................. 7
5.2. Climate ............................................................................................................... 7
5.3. Topography ........................................................................................................ 7
5.4. Geology and Soils .............................................................................................. 7
5.5. Hydrology .......................................................................................................... 7
6. Methodology .................................................................................................... 10
6.1. Sampling Site ................................................................................................... 10
6.2. Present Ecological State ................................................................................... 12
6.3. Water Quality ................................................................................................... 13
6.3.1. Physical water quality parameters .............................................................. 13
6.3.2. Diatoms ........................................................................................................ 13
6.4. Habitat Integrity (IHI) ...................................................................................... 15
6.5. Habitat Availability .......................................................................................... 16
6.5.1. Habitat Availability for macro-invertebrates .............................................. 16
6.5.2. Fish Habitat Availability .............................................................................. 16
6.6. Macro-invertebrates ........................................................................................ 17
6.6.1. SASS5 index ................................................................................................. 17
6.6.2. MIRAI ........................................................................................................... 18
6.7. Ichthyofauna .................................................................................................... 18
6.7.1. Fish Integrity ................................................................................................ 18
7. Results and Discussion .................................................................................... 19
7.1. Sampling site description ................................................................................. 19
7.2. Water Quality ................................................................................................... 25
7.3. Diatoms ............................................................................................................ 26
7.4. Habitat Integrity ............................................................................................... 29
7.5. Macro Invertebrates ......................................................................................... 30
7.5.1. SASS5 ........................................................................................................... 30
7.5.2. MIRAI ........................................................................................................... 31
7.6. Ichthyofauna .................................................................................................... 32 7.6.1. Fish habitat assessment ............................................................................... 32
7.6.2. Presence of fish species................................................................................ 32
7.6.3. FRAI ............................................................................................................. 35
8. Current Impacts on Aquatic Ecosystems ......................................................... 36
9. Possible impacts from new mining activities ................................................... 36
10. Conclusion ....................................................................................................... 37
11. Recommendations ............................................................................................ 38
References .................................................................................................................... 39
Appendix ...................................................................................................................... 45

Aquatic assessment for proposed new diamond mining activities – Report
3
List of Figures
Figure 5.5-1. Illustrating the Southern Kalahari Ecoregion (RHP, 2003). ............................ 8
Figure 5.5-2. Illustrating the flow data for Schmidtsdrif weir C9H024 (DWS,
2018).………… ........................................................................................................................ 8
Figure 5.5-3. Quaternary Catchment .................................................................................... 9
Figure 6.1-1 Aquatic sampling sites. ................................................................................. 11
Figure 6.2-1 Illustration of the distribution of categories on a continuum as shown in
Kleynhans and Louw (2008) .................................................................................................. 13
Figure 6.6.1-1 Ecological categories for the Southern Kalahari, calculated using
percentiles….… ...................................................................................................................... 17
Figure 7.4-1. Impacts associated with the decrease in habitat integrity of the instream and
riparian zone at the sampling site during the survey (as determined using HI of Kleynhans
(1996)).……….. ..................................................................................................................... 29
List of Tables
Table 3.1 Project team with associated areas of specialisation............................................ 6
Table 6.1.1 Selected survey site. .......................................................................................... 10
Table 6.2.1 Present Ecological State codes and descriptions with standardised colour
coding……… …………………………………………………………………………………12
Table 6.3.2.1 Diatom Indices Implemented in this assessment ........................................... 14
Table 6.3.2.2 Diatom categorised into various classes as Index score and class (Taylor,
2005)…………. ………………………………………………………………………………14
Table 6.4.1 The IHI scoring of each criterion to describe the extent of each impact (from
Kleynhans, 1996).................................................................................................................... 15
Table 6.4.2 Criteria and weightings used for the assessment of Instream and Riparian
Habitat Integrity (Kleynhans, 1996) ....................................................................................... 16
Table 7.1.1 Survey results and associated information for RP01 ......................................... 19
Table 7.1.2 Survey results and associated information for RP02 ......................................... 20
Table 7.1.3 Survey results and associated information for RP03 ......................................... 21
Table 7.1.4 Survey results and associated information for RP04 ......................................... 22
Table 7.1.5 Survey results and associated information for RP05 ......................................... 23
Table 7.1.6 Survey results and associated information for RP06 ......................................... 24
Table 7.2.1 The in situ constituents analysed at the site and Target Water Quality Range
(TWQR)……………. ............................................................................................................. 25
Table 7.2.2 A description of the water constituent that was present above WQ guidelines.. 26
Table 7.3.1 Survey diatom results ........................................................................................ 26
Table 7.3.2 Generic diatom based ecological classification for sampling sites .................... 26
Table 7.3.3 Dominant diatom species at sampling sites ....................................................... 27
Table 7.5.1.1 The SASS5 result from the aquatic sampling site during the survey. ............ 30
Table 7.5.2.1 The dominant biotope diversities observed for each site by means of Dallas
(2005)………… ..................................................................................................................... 32
Table 7.6.1.1 The dominant velocity-depth classes observed for each site by means of
Dallas (2005)…. ..................................................................................................................... 32
Table 7.6.2.1 Expected and sampled fish species for the river system associated with the
Lower Vaal River. .................................................................................................................. 33
Table 7.6.2.2 Reference and current fish frequency of occurrence ..................................... 34

Aquatic assessment for proposed new diamond mining activities – Report
4
List of Acronyms
ASPT Average Score Per Taxon
BDI Biological Diatom Index
DO Dissolved Oxygen
DWA Department of Water Affairs (previously known as DWAF)
DWS Department of Water and Sanitation
EC Ecological Category
EIA Environmental Impact Assessment
FEPA Freshwater Ecological Protected Area
FRAI Fish Response Assessment Index
FROC Frequency of Occurrence
GSM Stones, Gravel, Mud
IHI Index of Habitat Integrity
IH Instream habitat
IHAS Index Habitat Integrity Instream Habitat
LC Least Concern
m.a.s.l Meters above sea level
MAP The mean annual precipitation
MIRAI Macroinvertebrate Response Assessment Index
PES Present Ecological State
%PTV Percentage Pollution Tolerant Valves
RH Riparian Habitat
RHI River Health Index
RHP River Health Programme
SPI Specific Pollution sensitivity Index
SASS5 South African Scoring System, version 5
ToR
TWQR
Terms of Reference
Target Water Quality Range
WMAs Water Management Areas
WQ Water Quality

Aquatic assessment for proposed new diamond mining activities – Report
5
1. INTRODUCTION
Water is one of the most precious natural resources on earth and is utilised extensively for
various applications. Rivers create a wide range of benefits to humankind including fisheries,
wildlife, and agriculture, urban, industrial and social development close to water sources. The
unfortunate effect of these anthropogenic activities is the degradation of the integrity of river
systems around the world, due to mismanagement. Management strategies of water resources
should be built upon the knowledge and expertise of various disciplines, with the biologist
playing an important and sometimes the leading role.
Alluvial diamond mining activities in the Vaal and Orange Rivers have been conducted
presently and historically for many years. It plays an important role in the economy of South
Africa however, many of these activities have been found to be detrimental for the aquatic
biota within these rivers.
Biological communities reflect overall ecological integrity by integrating different stressors
over time and thus providing a broad measure of their aggregate impact. The monitoring of
biological communities therefore provides a reliable ecological measure of fluctuating
environmental conditions. The sampling protocols applied in this project should give a good
reflection of the human impacts on the system under investigation. The habitat condition and
availability, aquatic macro invertebrates and fish were investigated to determine the Present
Ecological Status (PES) of the study area in the Vaal River and potential impact of the
proposed new alluvial diamond mining activities on the ecological integrity of the receiving
system in its vicinity.

Aquatic assessment for proposed new diamond mining activities – Report
6
2. Terms of Reference
The Terms of Reference (ToR) for the study were as follows:
• Monitor the present and future impacts of the construction and operations of the new
proposed diamond mining project on the aquatic ecosystem.
• Monitoring the PES in terms of water, habitat, macro-invertebrate and fish integrity at
sampling points identified during the survey.
• The sampling points were selected to be representative of the area on the Vaal River.
• The present study serves to report on the survey regime of the aquatic integrity
(results from the 21-22 June 2018 sampling).
3. Project Team
This aquatic ecological assessment was conducted and managed by DPR- Ecologist and
Environmental Services. The details of the Aquatic project team are included in
Table 3.1.
Table 3.1 Project team with associated areas of specialisation
Specialist Area of Specialisation Qualification
J. Potgieter Aquatic Ecology
M.Sc. Aquatic Health
DWA Accredited – SASS Macro-
invertebrate monitoring
Pr.Sci.Nat
A. Strydom Aquatic Ecology DWA Accredited – SASS Macro-
invertebrate monitoring
4. Limitations
Unfortunately, some limitations were encountered even though all attempts were made to take
samples under optimal conditions. The limitations to this study included:
4.1. Factors influencing sampling
• The techniques used for assessing habitat integrity were subjective.
• Electro-narcosis was the only technique used for sampling fish, and therefore certain
habitats such as deep waters could not be properly sampled.
4.2. Factors influencing interpretation
The possible impacts on the river system from the proposed activities could be identified, but
not fully quantified. This was due to the presence of other influencing activities in this area,
namely livestock grazing and crop planting and existing weirs and upstream mining activities.

Aquatic assessment for proposed new diamond mining activities – Report
7
5. Study Site Description
A brief description of the location and biophysical characteristics of the study area that is
relevant to the current study is included below.
5.1. Location
The study site is situated approximately 1 km North-east of Schmidtsdrif within the North-
eastern region of the Northern Cape Province, on the farms Zand Plaats 1025, Berg Plaats
100, Klipfontein 99 and Vogelstruispan 101 (Figure 6.1-1).
5.2. Climate
The proposed new diamond mine site falls within the Southern Kalahari region, which is
typically characterised by warm wet summers and cold dry winters. The mean annual
maximum and minimum temperatures ranges between 36°C and 19°C, respectively for the
catchment. Maximum summer temperatures occur in January and minimum winter
temperatures are experienced in July. Rainfall is unreliable and irregular, falling primarily
during short-duration, high-intensity thunderstorms during the summer months (November to
April). The mean annual rainfall decreases from the north (250mm) to the south (223mm)
with very low humidity and high evaporation (DWA, 2004).
5.3. Topography
The Southern Kalahari can be described as a landscape with plains with low to moderate
relief as well as hills with low to moderate relief. Vegetation of this region predominantly
consists of Kalahari bushveld types. The study area lies within an elevation between 1000 m
and 1010 m above sea level (m.a.s.l) in the Lower Vaal. The water from the Lower Vaal
Water Management Area (WMA 10) flows into the Lower Orange Water Management Areas
(WMAs) before reaching the Atlantic Ocean near the town of Alexander Bay in the western
corner of the country (DWA, 2004).
5.4. Geology and Soils
The geology of the area consists mainly of sand, sandstone, tillite, quartzite, schist and biotite
granites. Regarding the soils, the area is predominated by loam-sand, sand-loam, sand-clay-
loam and sand-clay soils types (DWA, 2004).
5.5. Hydrology
The study area falls within the level 1 Ecoregion 29 and the level 2 Ecoregion 29.02,
according to the South African River Health Programme (RHP) and Kleynhans et al. (2005).
The aquatic monitoring sites investigated are located within quaternary catchment C92B
(Figure 5.5-3), which forms part of the Lower Vaal River Catchment in the Northern Cape.
The sampling sites in this study are on the Vaal River downstream of the town of

Aquatic assessment for proposed new diamond mining activities – Report
8
Schimdtsdrif. The surrounding area consists predominately of commercial farming, including
livestock,game and agriculture. Figure below illustrates the Southern Kalahari Ecoregion
(pink).
Figure 5.5-1. Illustrating the Southern Kalahari Ecoregion (RHP, 2003).
The flow gauging weir station, C9H024, is located just downstream of the study site. Due to
missing monthly records for the flow at this weir the data prior to 2001 could not be used for
flow analysis. Below in Figure 5.5-2 average monthly flow data for the period 2016 to 2018
are shown for the Schmidtsdrif weir (DWS, 2018).
Figure 5.5-2. Illustrating the flow data for Schmidtsdrif weir C9H024 (DWS, 2018).
A peak in the flow is observed during March 2017 as result of summer rainfall in the area
with March 2018 having a much lower flow rate as result of dry conditions in catchment area.
The flow pattern at the weir follows a normal trend in connection with annual rainfall patterns
of the area.
Southern Kalahari

Figure 5.5-3. Quaternary Catchment
6. Methodology
The River Health Programme (RHP), a national biomonitoring programme for South African
rivers, was implemented to monitor and thus improve and conserve the health of South
African freshwater ecosystems (Todd and Roux, 2000). The RHP specifies that a sampling
site must be representative of a river reach, have habitats amendable for sampling and suitable
for biomonitoring of the different RHP indices i.e. SASS5, MIRAI and FRAI (DWA, 2008).
These indices have been specifically designed for the flowing rivers of South Africa.
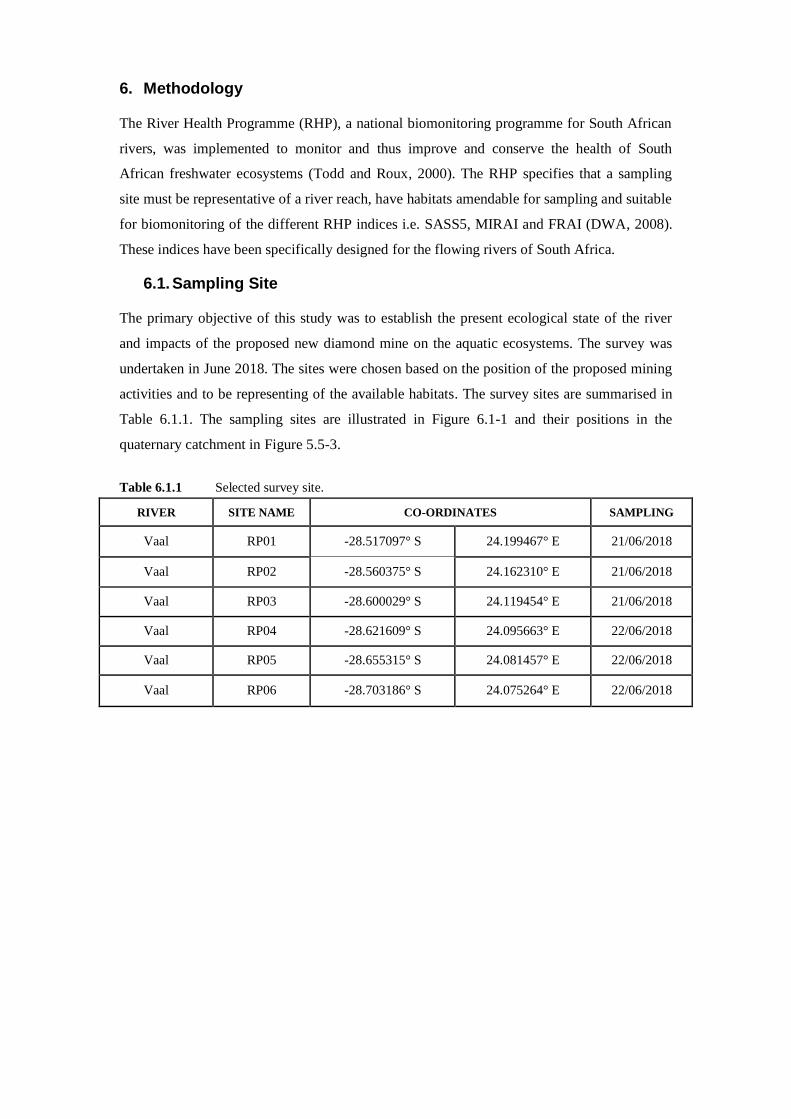
6.1. Sampling Site
The primary objective of this study was to establish the present ecological state of the river
and impacts of the proposed new diamond mine on the aquatic ecosystems. The survey was
undertaken in June 2018. The sites were chosen based on the position of the proposed mining
activities and to be representing of the available habitats. The survey sites are summarised in
Table 6.1.1. The sampling sites are illustrated in Figure 6.1-1 and their positions in the
quaternary catchment in Figure 5.5-3.
Table 6.1.1 Selected survey site.
RIVER SITE NAME CO-ORDINATES SAMPLING
Vaal RP01 -28.517097° S 24.199467° E 21/06/2018
Vaal RP02 -28.560375° S 24.162310° E 21/06/2018
Vaal RP03 -28.600029° S 24.119454° E 21/06/2018
Vaal RP04 -28.621609° S 24.095663° E 22/06/2018
Vaal RP05 -28.655315° S 24.081457° E 22/06/2018
Vaal RP06 -28.703186° S 24.075264° E 22/06/2018

Aquatic assessment for proposed new diamond mining activities – Report
Figure 6.1-1 Aquatic sampling sites.

Aquatic assessment for proposed new diamond mining activities – Report
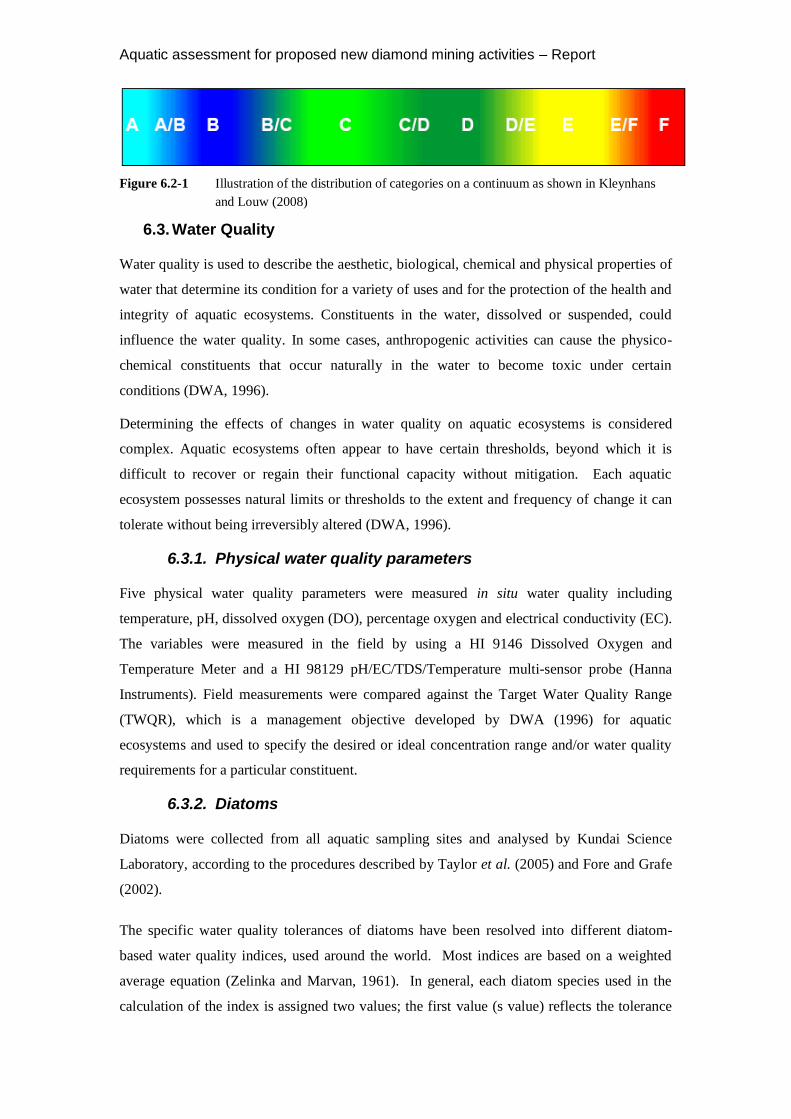
6.2. Present Ecological State
The Present Ecological Status (PES) of the Vaal River was determined by assessing the water
quality, instream and riparian habitat, macro-invertebrates and fish community integrity. The
ecological categories (EC) were used to assist in defining the current ecological condition of a
river in terms of the deviation of biophysical components from the natural reference condition
(Kleynhans and Louw, 2008). These categories range over a continuum of impacts, from
natural (Category A) to critically modified (Category F) and are represented by characteristic
colours defined by Kleynhans and Louw (2008) in Table 6.2.1. In some cases, there is an
uncertainty as to which category a particular entity belongs. This situation falls within the
concept of a “fuzzy” boundary, where a particular entity may potentially have membership of
both classes. For practical purposes these situations are referred to as boundary categories and
are denoted as for example B/C as depicted in Figure 6.2-1. In the current study, the ECs were
assigned to the results obtained from the index scores of the IHI measuring habitat and FRAI
scores measuring fish integrity. The SASS and ASPT scores were assigned ECs based on the
Highveld - lower zone defined by Dallas (2007) and further discussed in Section 6.4.
Table 6.2.1 Present Ecological State codes and descriptions with standardised colour coding
(adapted from Kleynhans and Louw, 2008)
CATEGORY
MIRAI,
FRAI
and IHI
(%)
SASS5 ASPT SHORT
DESCRIPTION LONG DESCRIPTION
A 90 – 100 >/=123 >/=5.6 Natural Natural – Unmodified state with no impacts, conditions natural
B 80 – 89 >/=82<123 >/=4.8<2.6 Largely natural
Largely natural with few
modifications. A small change in natural habitats and biota may have
taken place but the ecosystem
functions are essentially unchanged
C 60 – 79 >/=64<82 >/=4.6<4.8 Moderately
modified
Moderately modified – loss and
change of natural habitat and biota
have occurred, but the basic
ecosystem functions are still predominantly unchanged
D 40 – 59 >/=51<64 >=4.2<4.6 Largely
modified
Largely modified – a large loss of
natural habitat, biota and basic ecosystem functions has occurred
E 20 – 39 <51 <4.2 Seriously
modified
Seriously modified – the loss of
natural habitat, biota and basic ecosystem functions are extensive
F < 20 <51 <4.2 Critically
modified
Critically/Extremely modified –
modifications have reached a critical level and the system has
been modified completely with an
almost complete loss of natural habitat and biota. In the worst
instances the basic ecosystem
functions have been destroyed and
the changes are irreversible
Aquatic assessment for proposed new diamond mining activities – Report
Figure 6.2-1 Illustration of the distribution of categories on a continuum as shown in Kleynhans
and Louw (2008)
6.3. Water Quality
Water quality is used to describe the aesthetic, biological, chemical and physical properties of
water that determine its condition for a variety of uses and for the protection of the health and
integrity of aquatic ecosystems. Constituents in the water, dissolved or suspended, could
influence the water quality. In some cases, anthropogenic activities can cause the physico-
chemical constituents that occur naturally in the water to become toxic under certain
conditions (DWA, 1996).
Determining the effects of changes in water quality on aquatic ecosystems is considered
complex. Aquatic ecosystems often appear to have certain thresholds, beyond which it is
difficult to recover or regain their functional capacity without mitigation. Each aquatic
ecosystem possesses natural limits or thresholds to the extent and frequency of change it can
tolerate without being irreversibly altered (DWA, 1996).
6.3.1. Physical water quality parameters
Five physical water quality parameters were measured in situ water quality including
temperature, pH, dissolved oxygen (DO), percentage oxygen and electrical conductivity (EC).
The variables were measured in the field by using a HI 9146 Dissolved Oxygen and
Temperature Meter and a HI 98129 pH/EC/TDS/Temperature multi-sensor probe (Hanna
Instruments). Field measurements were compared against the Target Water Quality Range
(TWQR), which is a management objective developed by DWA (1996) for aquatic
ecosystems and used to specify the desired or ideal concentration range and/or water quality
requirements for a particular constituent.
6.3.2. Diatoms
Diatoms were collected from all aquatic sampling sites and analysed by Kundai Science
Laboratory, according to the procedures described by Taylor et al. (2005) and Fore and Grafe
(2002).
The specific water quality tolerances of diatoms have been resolved into different diatom-
based water quality indices, used around the world. Most indices are based on a weighted
average equation (Zelinka and Marvan, 1961). In general, each diatom species used in the
calculation of the index is assigned two values; the first value (s value) reflects the tolerance

Aquatic assessment for proposed new diamond mining activities – Report
or affinity of the particular diatom species to a certain water quality (good or bad) while the
second value (v value) indicates how strong (or weak) the relationship is (Taylor, 2004).
These values are then weighted by the abundance of the particular diatom species in the
sample (Lavoie et al., 2006; Taylor, 2004; Besse, 2007). The main difference between
indices is in the indicator sets (number of indicators and list of taxa) used in calculations
(Eloranta and Soininen, 2002).
These indices form the foundation for developing computer software to estimate biological
water quality. OMNIDIA (Lecointe et al., 1993) is one such software package; it has been
approved by the European Union and is used with increasing frequency in Europe and has
been used for this study. The program is a taxonomic and ecological database of 7500 diatom
species, and it contains indicator values and degrees of sensitivity for given species. It permits
the user to perform rapid calculations of indices of general pollution, saprobity and trophic
state, indices of species diversity, as well as of ecological systems (Szczepocka, 2007).
Data was interpreted in terms of species present, abundances, number of species with
deformed valves and characterised into 3 different indices calculated using OMNIDIA ver.
5.3 (Table 6.3.2.1) (Lecointe et al. 1993; database updated March 2009) and each was
classified into a class ranging from deteriorated to high quality as defined by Eloranta and
Soininen (2002)(Table 6.3.2.2).
Table 6.3.2.1 Diatom Indices Implemented in this assessment
Index Index Abbreviation Reference
Specific Pollution sensitivity Index SPI CEMAGREF (1982)
Biological Diatom Index BDI Lenoir & Coste (1996)
Percentage Pollution Tolerant Valves %PTV Kelly & Whitton (1995)
Table 6.3.2.2 Diatom categorised into various classes as Index score and class (Taylor, 2005)
Ecological Category (EC) ClassIndex Score (SPI
Score)
A 18 - 20
A/B 17 - 18
B 15 - 17
B/C 14 - 15
C 12 - 14
C/D 10 - 12
D 8 - 10
D/E 6 - 8
E 5 - 6
E/F 4 - 5
F <4
Bad quality
Interpretation of index scores
High quality
Good quality
Moderate quality
Poor quality
Aquatic assessment for proposed new diamond mining activities – Report
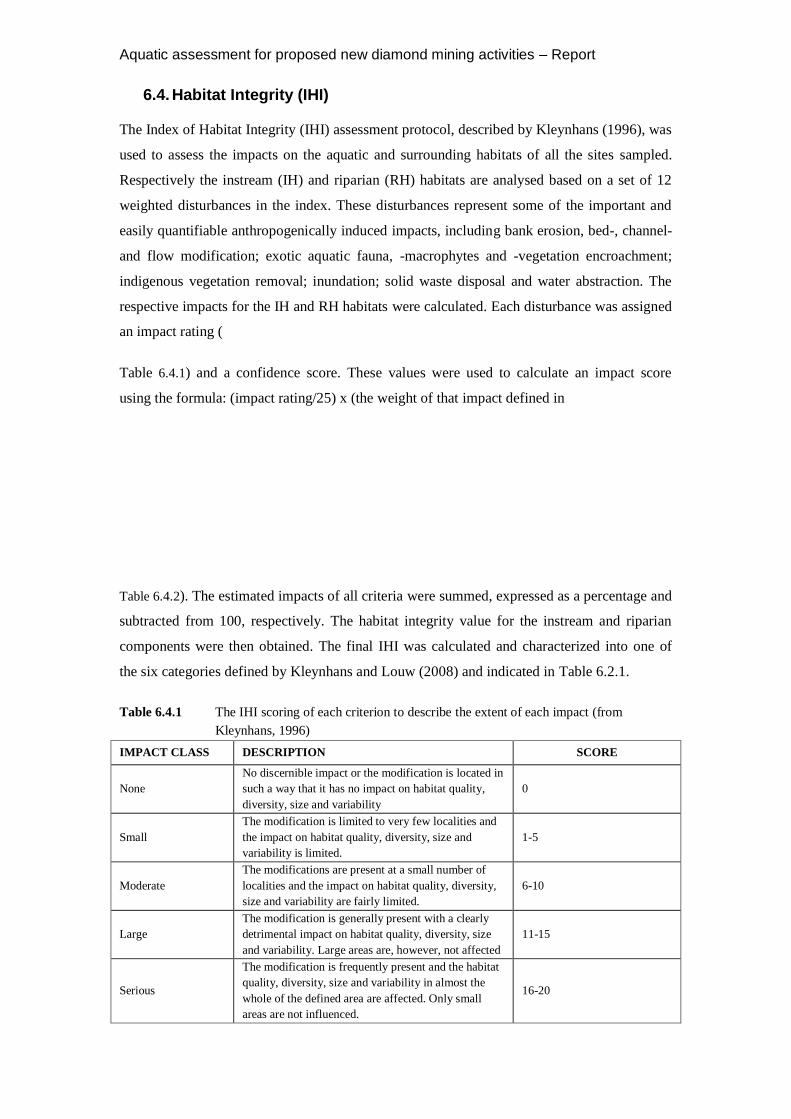
6.4. Habitat Integrity (IHI)
The Index of Habitat Integrity (IHI) assessment protocol, described by Kleynhans (1996), was
used to assess the impacts on the aquatic and surrounding habitats of all the sites sampled.
Respectively the instream (IH) and riparian (RH) habitats are analysed based on a set of 12
weighted disturbances in the index. These disturbances represent some of the important and
easily quantifiable anthropogenically induced impacts, including bank erosion, bed-, channel-
and flow modification; exotic aquatic fauna, -macrophytes and -vegetation encroachment;
indigenous vegetation removal; inundation; solid waste disposal and water abstraction. The
respective impacts for the IH and RH habitats were calculated. Each disturbance was assigned
an impact rating (
Table 6.4.1) and a confidence score. These values were used to calculate an impact score
using the formula: (impact rating/25) x (the weight of that impact defined in
Table 6.4.2). The estimated impacts of all criteria were summed, expressed as a percentage and
subtracted from 100, respectively. The habitat integrity value for the instream and riparian
components were then obtained. The final IHI was calculated and characterized into one of
the six categories defined by Kleynhans and Louw (2008) and indicated in Table 6.2.1.
Table 6.4.1 The IHI scoring of each criterion to describe the extent of each impact (from
Kleynhans, 1996)
IMPACT CLASS DESCRIPTION SCORE
None
No discernible impact or the modification is located in
such a way that it has no impact on habitat quality,
diversity, size and variability
0
Small
The modification is limited to very few localities and
the impact on habitat quality, diversity, size and
variability is limited.
1-5
Moderate
The modifications are present at a small number of
localities and the impact on habitat quality, diversity,
size and variability are fairly limited.
6-10
Large
The modification is generally present with a clearly
detrimental impact on habitat quality, diversity, size
and variability. Large areas are, however, not affected
11-15
Serious
The modification is frequently present and the habitat
quality, diversity, size and variability in almost the
whole of the defined area are affected. Only small
areas are not influenced.
16-20

Aquatic assessment for proposed new diamond mining activities – Report
IMPACT CLASS DESCRIPTION SCORE
Critical
The modification is present overall with a high
intensity. The habitat quality, diversity, size and
variability in almost the whole of the defined section
are influenced detrimentally.
21-25
Table 6.4.2 Criteria and weightings used for the assessment of Instream and Riparian Habitat
Integrity (Kleynhans, 1996)
INSTREAM CRITERIA WEIGHT RIPARIAN CRITERIA WEIGHT
Water abstraction 14
Vegetation removal 13
Water quality 13 Exotic vegetation 12
Flow modification 13 Bank erosion 14
Bed modification 13 Channel modification 12
Channel modification 14 Water abstraction 13
Inundation 10 Inundation 11
Exotic macrophytes 9 Flow modification 12
Exotic fauna 8 Water quality 13
Rubbish dumping 6
6.5. Habitat Availability
6.5.1. Habitat Availability for macro-invertebrates
Most aquatic fauna are largely influenced by the habitat diversity within an aquatic
ecosystem. As such different biotope diversities for macro-invertebrates were evaluated i.e.
stones in current (bedrock, cascade, chute, boulder rapid, riffle and run), stones out of current
(bedrock, backwater, slack-water and pool), instream vegetation, marginal vegetation and
GSM (gravel, sand and mud). Each of these biotopes were scored, rated on a scale from 0 to 5
according to presence of biotopes, namely absent (0), rare (1), sparse (2), common (3),
abundant (4) or entire (5) (Dallas, 2005). The invertebrate habitat assessment system (IHAS)
index was not incorporated into the present study. However, some of the categories from the
IHAS were identified, including algal presence, biotopes and dominant vegetation types.
6.5.2. Fish Habitat Availability
A fish habitat assessment was done to provide a measure of the fish refuge potential
associated with each of the sampling sites. This assessment characterises the fish habitats into
four velocity-depth classes (including slow-deep, slow-shallow, fast-deep and fast-shallow
habitat class, where fast is greater than 0.3 m/s, slow is less than 0.3 m/s, deep is greater than
0.3m and shallow is less than 0.3 m) and associated cover present at each of the habitats

Aquatic assessment for proposed new diamond mining activities – Report
(Dallas, 2005). All of these were quantified on a scale from 0 to 5, being absent (0), rare (1),
sparse (2), common (3), abundant (4) or entire (5) (Dallas 2005). Measuring these various
habitat types are an essential component in the interpretation of the fish integrity because it
can influence (by creating or restricting) the fish populations and communities present within
each sampling site.
6.6. Macro-invertebrates
Macro-invertebrate communities were sampled using the SASS5 (South African Scoring
System, version 5) method described by Dickens & Graham (2002). Macro-invertebrates
were collected using a standard SASS net in stones, vegetation and gravel, sand and mud
(GSM) within specified time frames. Fifteen minutes were taken to identify the presence and
approximate abundances of macro-invertebrate families in each of the habitat. SASS5 and
MIRAI scores could be calculated to determine the current ecological status of the macro-
invertebrates.
6.6.1. SASS5 index
The assessment of macro-invertebrate communities in a river system is a recognised means of
determining river “health” (Dickens and Graham, 2002). Macro-invertebrates are good
indicators because they are visible, easy to identify and have rapid life cycles. Macro-
invertebrate communities were assessed using the SASS5 method described by Dickens &
Graham (2002). SASS5 is a rapid assessment index of the macro-invertebrate status of a
flowing instream system. As such could not be calculated for non-flowing streams. In the
flowing systems, the SASS5 score was calculated by the sum of the sensitivity scores of the
present families. The average score per taxon (ASPT) was calculated by dividing the total
SASS score by the total number of taxon. The results were interpreted based on the SASS5
interpretation guidelines by Dallas (2007), using the ecological categories derived for the
Southern Kalahari Ecoregion (Figure 6.6.1-1) and defined in Table 6.2.1.

Aquatic assessment for proposed new diamond mining activities – Report
Figure 6.6.1-1 Ecological categories for the Southern Kalahari, calculated using percentiles
(Dallas, 2007)
6.6.2. MIRAI
The MIRAI was incorporated in this study, as an alternative to the SASS5, to determine the
PES of the macro-invertebrate community assemblage. The index integrates the ecological
requirements of the invertebrate taxa in a community or assemblage and their response to
modified habitat conditions, whilst comparing the present assemblage with a reference list
(Thirion, 2007). The reference list for this study was derived by using numerous literature
sources including historical data from the Rivers Database (2007) and past experience within
this quaternary catchment and results obtained from the previous studies in the area. In
addition, the functional feeding groups and river continuum were considered.
The MIRAI model makes a comparison between the expected macro-invertebrate families
with the present assemblages obtained using SASS5 sampling protocol (Thirion, 2007). The
habitat preferences for each of the macro-invertebrates were incorporated in terms of flow,
habitat and water quality. Each component was rated within a metric in terms of how much
the macro-invertebrate presence and abundances changed from reference and were done for
each of the metrics. After all the metrics were scored, the model generated a MIRAI score for
each site and was characterised into an EC as defined in Table 6.2.1.
6.7. Ichthyofauna
6.7.1. Fish Integrity
The fish community integrity was assessed using the Fish Response Assessment Index
(FRAI) developed by Kleynhans (2008). At each site, the fish were sampled according to the

Aquatic assessment for proposed new diamond mining activities – Report
methodologies recommended for FRAI. This included sampling fish by means of electro-
narcosis in three different river segments (where possible), for approximately 20 minutes in
each segment. The sampled fish were identified to species level using Skelton (2001) and
safely returned to the aquatic system before they were documented into the separate segments
and habitat types. The FRAI model makes a comparison between the expected fish species list
obtained from the FROC report by Kleynhans et al. (2007) and the FROC of sampled fish
species. It incorporates the habitat preferences in terms of velocity-depth, substrate, water
quality, alteration in physical-chemical composition of the water, as well as migration
requirements of each fish species. The intolerances and preferences are divided into metric
groups that relate to the requirements and preferences of individual species. This allows for
the understanding of cause-effect relationships between drivers and responses of the fish
assemblage to these drivers of change. Having compared the expected list to the actual
sampled list, the model generates a FRAI score for each site, which can be characterised into
an EC as defined in Table 6.2.1.

Aquatic assessment for proposed new diamond mining activities – Report
7. Results and Discussion
7.1. Sampling site description
The results for the current field sampling (21-22 June 2018) are summarised in the tables
below, along with the general information for the sites, which are presented in
Table 7.1.1,
Table 7.1.2,
Table 7.1.3, Table 7.1.4,
Table 7.1.5 and Table 7.1.6. The tables are then followed by the water quality, diatom, habitat,
macro-invertebrate and fish integrity results and discussions.
Table 7.1.1 Survey results and associated information for RP01
RP1
UPSTREAM DOWNSTREAM
2018
River Vaal River
Site Description Perennial river located on the farm, Rooipoort
GPS co-ordinates of sampling point -28.517097° S; 24.199467° E
Altitude (m.a.s.l) 1002 m
Quaternary Catchment C92B
WMA (Midgley et al. 1994) Lower Vaal Water Management Area 10
Ecoregion 29.02
Ecoregion Name Southern Kalahari Basin
Regional Vegetation Type Kalahari Bushveld Bioregion
Riparian Vegetation Type Grasses and Sedges
Geomorphological Zonation
(Rowntree and Wadeson 2000) Lowland River
Channel Type: Valley bottom with channel
Water Surface Dimensions Width:5–15m; Depth: 0.5–1.5m
Water Turbidity (Dallas 2005) Discoloured and silty
Algal presence Extensive
Dominant Velocity-depth Classes Slow shallow, Slow deep
Dominant Biotope Diversity Pools, run
Water Quality Parameters T(°C) = 15; pH = 8.60; EC(mS/m) = 72.3; DO(mg/l) = 8.82; DO(%) = 99.4
Other Biota Fish
Highly Sensitive Taxa (Score 11-15) None
DATE SAMPLER SASS5 ASPT No of
Taxa
PER
CLASS IHI MIRAI FRAI
21/06/2018 A. Strydom 35 3.88 9 D/E D D D/E
EXISTING THREATS • Algal growth
Aquatic assessment for proposed new diamond mining activities – Report
• Sedimentation
• Upstream mining
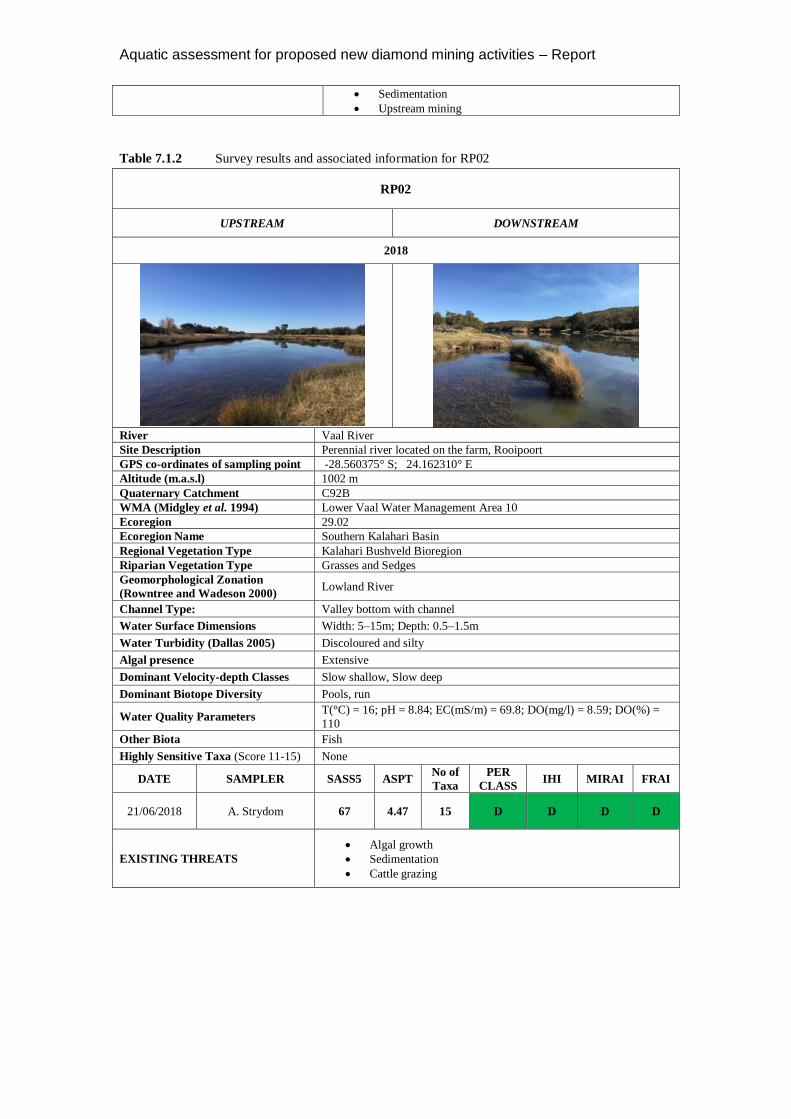
Table 7.1.2 Survey results and associated information for RP02
RP02
UPSTREAM DOWNSTREAM
2018
River Vaal River
Site Description Perennial river located on the farm, Rooipoort
GPS co-ordinates of sampling point -28.560375° S; 24.162310° E
Altitude (m.a.s.l) 1002 m
Quaternary Catchment C92B
WMA (Midgley et al. 1994) Lower Vaal Water Management Area 10
Ecoregion 29.02
Ecoregion Name Southern Kalahari Basin
Regional Vegetation Type Kalahari Bushveld Bioregion
Riparian Vegetation Type Grasses and Sedges
Geomorphological Zonation
(Rowntree and Wadeson 2000) Lowland River
Channel Type: Valley bottom with channel
Water Surface Dimensions Width: 5–15m; Depth: 0.5–1.5m
Water Turbidity (Dallas 2005) Discoloured and silty
Algal presence Extensive
Dominant Velocity-depth Classes Slow shallow, Slow deep
Dominant Biotope Diversity Pools, run
Water Quality Parameters T(°C) = 16; pH = 8.84; EC(mS/m) = 69.8; DO(mg/l) = 8.59; DO(%) =
110
Other Biota Fish
Highly Sensitive Taxa (Score 11-15) None
DATE SAMPLER SASS5 ASPT No of
Taxa
PER
CLASS IHI MIRAI FRAI
21/06/2018 A. Strydom 67 4.47 15 D D D D
EXISTING THREATS
• Algal growth
• Sedimentation
• Cattle grazing

Aquatic assessment for proposed new diamond mining activities – Report
Table 7.1.3 Survey results and associated information for RP03
RP03
UPSTREAM DOWNSTREAM
2018
River Vaal River
Site Description Perennial river located on the farm, Rooipoort
GPS co-ordinates of sampling point -28.600029° S; 24.119454° E
Altitude (m.a.s.l) 1002 m
Quaternary Catchment C92B
WMA (Midgley et al. 1994) Lower Vaal Water Management Area 10
Ecoregion 29.02
Ecoregion Name Southern Kalahari Basin
Regional Vegetation Type Kalahari Bushveld Bioregion
Riparian Vegetation Type Grasses and Sedges
Geomorphological Zonation
(Rowntree and Wadeson 2000) Lowland River
Channel Type: Valley bottom with channel
Water Surface Dimensions Width:5–15m; Depth: 0.5–1.5m
Water Turbidity (Dallas 2005) Discoloured and silty
Algal presence Extensive
Dominant Velocity-depth Classes Slow shallow, Slow deep, Fast shallow
Dominant Biotope Diversity Pools, run, ripples
Water Quality Parameters T(°C) = 14; pH = 8.34; EC(mS/m) = 72.8; DO(mg/l) = 12.32; DO(%) =
124
Other Biota Fish
Highly Sensitive Taxa (Score 11-15) None
DATE SAMPLER SASS5 ASPT No of
Taxa
PER
CLASS IHI MIRAI FRAI
21/06/2018 A. Strydom 50 4.17 12 D D D D
EXISTING THREATS
• Sedimentation
• Algae
• Mining activities
Aquatic assessment for proposed new diamond mining activities – Report
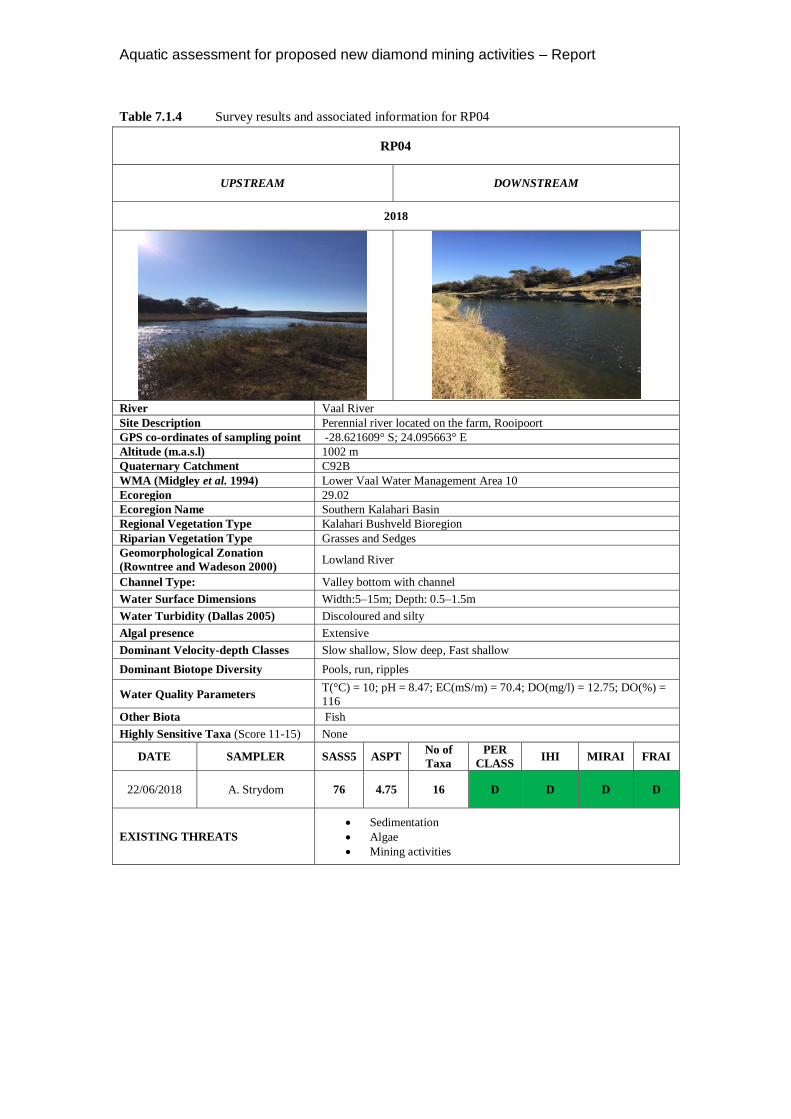
Table 7.1.4 Survey results and associated information for RP04
RP04
UPSTREAM DOWNSTREAM
2018
River Vaal River
Site Description Perennial river located on the farm, Rooipoort
GPS co-ordinates of sampling point -28.621609° S; 24.095663° E
Altitude (m.a.s.l) 1002 m
Quaternary Catchment C92B
WMA (Midgley et al. 1994) Lower Vaal Water Management Area 10
Ecoregion 29.02
Ecoregion Name Southern Kalahari Basin
Regional Vegetation Type Kalahari Bushveld Bioregion
Riparian Vegetation Type Grasses and Sedges
Geomorphological Zonation
(Rowntree and Wadeson 2000) Lowland River
Channel Type: Valley bottom with channel
Water Surface Dimensions Width:5–15m; Depth: 0.5–1.5m
Water Turbidity (Dallas 2005) Discoloured and silty
Algal presence Extensive
Dominant Velocity-depth Classes Slow shallow, Slow deep, Fast shallow
Dominant Biotope Diversity Pools, run, ripples
Water Quality Parameters T(°C) = 10; pH = 8.47; EC(mS/m) = 70.4; DO(mg/l) = 12.75; DO(%) =
116
Other Biota Fish
Highly Sensitive Taxa (Score 11-15) None
DATE SAMPLER SASS5 ASPT No of
Taxa
PER
CLASS IHI MIRAI FRAI
22/06/2018 A. Strydom 76 4.75 16 D D D D
EXISTING THREATS
• Sedimentation
• Algae
• Mining activities

Aquatic assessment for proposed new diamond mining activities – Report
Table 7.1.5 Survey results and associated information for RP05
RP05
UPSTREAM DOWNSTREAM
2018
River Vaal River
Site Description Perennial river located on the farm, Rooipoort
GPS co-ordinates of sampling point -28.655315° S; 24.081457° E
Altitude (m.a.s.l) 1002 m
Quaternary Catchment C92B
WMA (Midgley et al. 1994) Lower Vaal Water Management Area 10
Ecoregion 29.02
Ecoregion Name Southern Kalahari Basin
Regional Vegetation Type Kalahari Bushveld Bioregion
Riparian Vegetation Type Grasses and Sedges
Geomorphological Zonation
(Rowntree and Wadeson 2000) Lowland River
Channel Type: Valley bottom with channel
Water Surface Dimensions Width:5–15m; Depth: 0.5–1.5m
Water Turbidity (Dallas 2005) Discoloured and silty
Algal presence Extensive
Dominant Velocity-depth Classes Slow shallow, Slow deep
Dominant Biotope Diversity Pools, run
Water Quality Parameters T(°C) = 9; pH = 8.57; EC(mS/m) = 70.4; DO(mg/l) = 11.05; DO(%) =
118
Other Biota Fish
Highly Sensitive Taxa (Score 11-15) None
DATE SAMPLER SASS5 ASPT No of
Taxa
PER
CLASS IHI MIRAI FRAI
22/06/2018 A. Strydom 52 13 4.00 D D D D/E
EXISTING THREATS • Sedimentation
• Algae
Aquatic assessment for proposed new diamond mining activities – Report
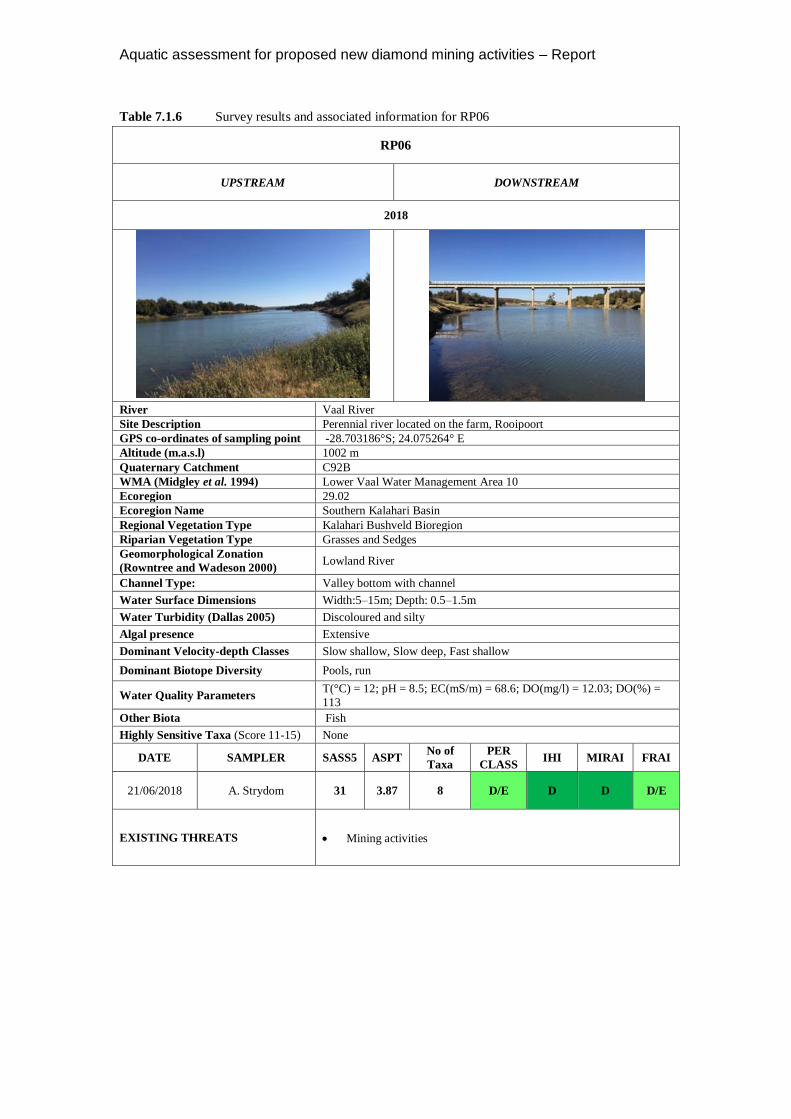
Table 7.1.6 Survey results and associated information for RP06
RP06
UPSTREAM DOWNSTREAM
2018
River Vaal River
Site Description Perennial river located on the farm, Rooipoort
GPS co-ordinates of sampling point -28.703186°S; 24.075264° E
Altitude (m.a.s.l) 1002 m
Quaternary Catchment C92B
WMA (Midgley et al. 1994) Lower Vaal Water Management Area 10
Ecoregion 29.02
Ecoregion Name Southern Kalahari Basin
Regional Vegetation Type Kalahari Bushveld Bioregion
Riparian Vegetation Type Grasses and Sedges
Geomorphological Zonation
(Rowntree and Wadeson 2000) Lowland River
Channel Type: Valley bottom with channel
Water Surface Dimensions Width:5–15m; Depth: 0.5–1.5m
Water Turbidity (Dallas 2005) Discoloured and silty
Algal presence Extensive
Dominant Velocity-depth Classes Slow shallow, Slow deep, Fast shallow
Dominant Biotope Diversity Pools, run
Water Quality Parameters T(°C) = 12; pH = 8.5; EC(mS/m) = 68.6; DO(mg/l) = 12.03; DO(%) =
113
Other Biota Fish
Highly Sensitive Taxa (Score 11-15) None
DATE SAMPLER SASS5 ASPT No of
Taxa
PER
CLASS IHI MIRAI FRAI
21/06/2018 A. Strydom 31 3.87 8 D/E D D D/E
EXISTING THREATS • Mining activities

Aquatic assessment for proposed new diamond mining activities – Report
7.2. Water Quality
It is important to assess WQ variables in order to determine the impacts within an ecosystem
that may contribute toward changes within the biotic integrity.
Physical (in situ) water quality parameters
All the in situ physical variables were measured and the values along with their associated
TWQRs, as defined by DWA (1996), are presented in Table 7.2.1. Each water quality
parameter and the TWQR will be discussed in the section below. The potential pollution
sources and impacts are summarised in
Table 7.2.2.
In the study area, the physical water quality indicated overall good results. Comparing the
results with the TWQR it is observed that the water quality at the site shows no deterioration
from recommended guidelines and all of the values fell within the target WQ range (Table
7.2.1).
Table 7.2.1 The in situ constituents analysed at the site and Target Water Quality Range (TWQR)
TWQRa RP01 RP02 RP03 RP04 RP05 RP06
pH 6-9 8.6 8.8 8.3 8.4 8.8 8.5
DO (mg/ℓ) >8 8.82 8.59 12.32 12.75 11.05 12.03
DO (%) 80-120 99 110 121 116 117 113
Temp. (°C) 5-30 15 16 14 10 8 12
EC (mS/m) 70 72.3 69.8 72.8 70.4 70.4 68.6
Figures in bold are characterised as high but not detrimental to the aquatic integrity
The EC exceeded the TWQR at sites RP01 and RP03. The increased EC levels are caused by
increased concentrations of dissolved solutes namely sulphates, calcium, magnesium and
sodium, which enter the aquatic ecosystem via point and non-point gold and coal mining,
agriculture and also alluvial diamond mining sources upstream (Dallas and Day 2004). The
host material for coal contains pyrite (FeS2) and when this is uncovered and exposed to the
oxidizing action of air, water and chemosynthetic bacteria it will convert the inorganic
sulphur to sulphate and sulphuric acid. These increased sulphates will lead to salinisation due
to increased concentrations of the ions (Dallas and Day 2004; Colvin et al. 2011; Rikard and
Kunkle 1990). The increased siltation caused by alluvial mining activities upstream may also
attribute to the increased conductivity.

Aquatic assessment for proposed new diamond mining activities – Report
Table 7.2.2 A description of the water constituent that was present above WQ guidelines
defined by DWAF (1996)
WQ
constituent Sites Possible sources
Description and impacts (Dallas and Day
2004; DWA 1996)
Conductivity RP01 &
RP03
The main causes of the extreme
conductivity levels in this study
were mostly attributed to
upstream farming and mining
activities and inflow of tributaries
of the Vaal with high salt loads.
Electrical Conductivity (EC) is a measure
of the ability of water to conduct an
electrical current. This ability is a result
of the presence of ions such as carbonate
(CO3²¯), bicarbonate (HCO3¯), chloride
(Cl¯), sulphate (SO4²¯), nitrate (NO3¯),
sodium (Na+), potassium (K+), calcium
(Ca²+), magnesium (Mg²+). The increase
in the EC levels is due to the increased
concentrations of the ions, namely Ca²+,
Mg²+, Na+, NO3¯ and Cl¯ at these sites.
7.3. Diatoms
A summary of the diatom results is provided in Table 7.3.1 and the diatom based ecological
classification based on Van Dam et al. (1994) for diatom-based water quality is given in Table
7.3.2 and the presence of PTVs is also indicated in Table 7.3.1.
Table 7.3.1 Survey diatom results
Site No species SPI
score Ecological Category Class PTV (%)
RP01 36 14.0 B/C Moderate quality 7.50%
RP02 43 12.5 C Moderate quality 8.80%
RP03 38 14 B/C Moderate quality 9.00%
RP04 27 15.2 B Good quality 0.50%
RP05 33 14.7 B/C Good quality 5.30%
RP06 52 11.9 C/D Moderate quality 21.50%
Table 7.3.2 Generic diatom based ecological classification for sampling sites
Site pH Salinity Organic nitrogen Oxygen levels Pollution
levels
Trophic
status
RP01 Alkaline Fresh
brackish
Tolerating very small
concentrations of organically bound nitrogen
Continuously high
(~100% saturation)
Moderately
polluted
Meso-
Eutrophic
RP02 Alkaline Fresh
brackish
Tolerating very small concentrations of
organically bound nitrogen
Continuously high (~100% saturation)
Moderately
polluted
Meso-Eutrophic
RP03 Alkaline Fresh
brackish
Tolerating elevated
concentrations of
organically bound nitrogen
Continuously high
(~100% saturation)
Moderately
polluted
Meso-
Eutrophic
RP04 Alkaline Fresh
brackish
Tolerating elevated
concentrations of
organically bound nitrogen
Continuously high
(~100% saturation)
Moderately
polluted
Meso-
Eutrophic
RP05 Alkaline Fresh
brackish
Tolerating elevated
concentrations of organically bound nitrogen
Continuously high (~100% saturation)
Moderately
polluted
Meso-Eutrophic
RP06 Alkaline Fresh
brackish
Tolerating elevated concentrations of
organically bound nitrogen
Fairly high (~75%
saturation)
Moderately
polluted Eutrophic

Aquatic assessment for proposed new diamond mining activities – Report
The biological water quality at sites RP01 (14), RP02 (12.5), RP03 (14) and RP06 (11.9) was
classified as MODERATE (Table 7.3.1.). However, the biological water quality at sites RP04
and RP05 was classified as GOOD with SPI scores of 15.2 and 14.7, respectively (Table
7.3.1.).
The following table (Table 7.3.3) indicates the dominant diatom species which occurred at the
sampling sites:
Table 7.3.3 Dominant diatom species at sampling sites
Diatom Species Preferred Habitat Dominant at Sites
Achnanthidium minutissima Found in well oxygenated and fresh
water.
RP01, RP02, RP03, RP04, RP05,
RP06
Encyonopsis microcephala-
A cosmopolitan species found in
calcareous water with moderate electrolyte content
RP01, RP02, RP03
Fragilaria elliptica-
Found in electrolyte rich and brackish waters
RP01, RP02, RP05, RP06
Nitzschia dissipata
Generally found in waters of moderate to high electrolyte
content, not present in waters with
low electrolyte content.
RP01, RP05
Stephanodiscus agassizensis Found in elevated electrolyte
concentrations RP01
Cymbella kappii Found in alkaline waters with low
to moderate electrolyte content RP03
Diatoma vulgaris Found in meso-eutrophic waters RP04
Achnanthidium eutrophilum
Found in well oxygenated waters
tolerant to slight and moderate
pollution.
RP04
Fragilaria capucina
Found in circum-neutral, oligo-
mesotrophic waters with moderate
electrolyte contents
RP04
Encyonema minutum
A cosmopolitan species found in
oligotrophic waters with moderate electrolyte content.
RP05
Epithemia sorex
A cosmopolitan species found in both flowing and standing waters of
moderate to high electrolyte
content. Also extending into
brackish biotopes
RP06
Stephanodiscus hantzschii
planktonic taxon found in rivers and
lakes with elevated electrolyte concentration
RP06
Nitzschia species Indication of a water body with readily available nutrients
(Cholnoky, 1968)
RP06
Achnanthidium eutrophilum
Found in well oxygenated eutrophic
fresh waters. Tolerant only to slight
or moderate pollution
RP06
The diatom based ecological classification for RP01 (from Van Dam et al., 1994, Table 7.3.2)
indicated that organic pollution levels were present but not problematic and Table 7.3.1.
indicated that PTVs made up 7.5% of the total count. The sub-dominance of Mastogloia
smithii and Nitzschia species which has preference for brackish, saline and nutrient enriched

Aquatic assessment for proposed new diamond mining activities – Report
water further indicated that salinity and nutrient levels are starting to elevate and that there is
impact occurring from anthropogenic activities in the surrounding areas.
According to Luís et al. (2008) several studies on metal polluted rivers have shown that
diatoms respond to perturbations not only at the community but also at the individual level
with alteration in cell wall morphology. In particular, size reduction and frustule
deformations have been sometimes associated with high metal concentrations. The total
abundance of valve deformities were 0% which indicated that metal toxicity was absent at the
time of sampling.
The high abundance of A. minutissima and Fragilaria species indicates that elevated flows
occurred at site RP 2, these species occur in great abundance in waters with high saturated
oxygen levels. The diatom based ecological classification (from Van Dam et al., 1994; Table
7.3.2) indicated that organic pollution levels were present but not problematic and Table
7.3.1. indicated that PTVs made up 8.8 % of the total count. The sub dominant species
Epithemia sorex and Stephanodiscus hantzschii indicates that nutrient and salinity levels are
slightly elevated at this site as these species has an affinity for moderate to high electrolyte
content, also extending into brackish biotopes.
The diatom based ecological classification at site RP03 (from Van Dam et al., 1994; Table
7.3.2) indicated that organic pollution levels were present but not problematic and Table
7.3.1. indicated that PTVs made up 9 % of the total count. The sub dominant species
Achnanthidium eutrophilum, Nitzschia linearis, Encyonema caespitosum and Navicula
capitatoradiata indicated that there is an influx of deteriorated water quality as these species
has an affinity for moderately polluted conditions.
The dominance of Achnanthidium minutissima and Fragilaria species indicated that flows
were recently elevated and provided increased oxygenation levels and resulted in an
improvement of diatom based water quality. The diatom based ecological classification (from
Van Dam et al., 1994; Table 7.3.2) indicated that organic pollution levels were present but not
problematic and Table 7.3.1. indicated that PTVs made up 0.5 % of the total count.
The dominant species found at site RP05 indicates that high electrolyte contents and saline
water were present, which can be associated with industrial and agricultural activities within
the surrounding areas. The dominance of Achnanthidium minutissima and Fragilaria elliptica
indicated that there was influx of water that caused elevated flows. The diatom based
ecological classification (from Van Dam et al., 1994; Table 7.3.2) indicated that organic
pollution levels were present but not problematic and Table 7.3.1. indicated that PTVs made
up 5.3 % of the total count.

Aquatic assessment for proposed new diamond mining activities – Report
The diatom based ecological classification for RP06 (from Van Dam et al., 1994; Table 7.3.2)
indicated that the site was moderately polluted and Table 7.3.1. indicated that PTVs made up
21.5 % of the total count. The presence of more than 20% PTVs shows significant organic
impact. The organic pollution that was present can also explain the lowering of oxygen levels
according to Table 7.3.2.
No valve deformities were noted in any of the samples which indicated that metal toxicity has
been below detection limits.
7.4. Habitat Integrity
The habitat integrities of the sites were assessed and presented in Figure 7.4-1. The riparian
and instream habitats were classified as being largely modified (D) for all the sites sampled.
The habitat changes are mostly due to poor bed conditions brought about by reduced flow
together with siltation and algae. This caused reduced habitat availability at the sampling
sites. In addition, the reduced flow led to increased algae, aquatic vegetation and
sedimentation at the sites. The poor condition of the non-marginal zone has also influenced
the instream integrity, with the main impacts being substrate exposure due to clearing. In
general, the deterioration of the sites were largely due to bed modifications from high algal
content (RP03, RP04) and sedimentation (RP01, RP02, RP03, RP04, RP05), channel- and
flow modifications (RP03) caused by agriculture and cattle farming, weirs and upstream
diamond mining activities. These habitat modifications indirectly changed the biotope
availability, velocity-depth flow structures, which influenced the biotic component of the
ecosystem at the sites.

Aquatic assessment for proposed new diamond mining activities – Report
Figure 7.4-1. Impacts associated with the decrease in habitat integrity of the instream and riparian
zone at the sampling site during the survey (as determined using HI of Kleynhans (1996)).
7.5. Macro Invertebrates
7.5.1. SASS5
The PES and impacts on the macro-invertebrate communities were assessed using SASS5 and
ASPT scores according to the interpretation guidelines by Dallas (2007) and presented in
Table 7.5.1.1. The family assemblage of this baseline assessment is represented in Appendix
A. The macro-invertebrate integrity was calculated to be largely modified (D) for sites RP02,
RP03, RP04, RP05 and largely-seriously modified (E/D) for sites RP01 and RP06.
Table 7.5.1.1 The SASS5 result from the aquatic sampling site during the survey.
Biomonitoring
Refa RP01 RP02 RP03 RP04 RP05 RP06
SASS Score 200 35 67 50 76 52 31
ASPT 6.5 3.88 4.47 4.17 4.75 4.00 3.87
PES D/E D D D D D/E
No. of families 49 9 15 12 16 13 8
No. of airbreathers 5 5 2 4 5 5
% airbreathers 55 33 17 25 38 62
MIRAI Score - 45 54 56 55 53 49
MIRAI EC - D D D D D D
- Not available a-Reference obtained from historical data, functional feeding groups and Ecoregion
The SASS5 and ASPT scores were used to interpret the impacts on the community
assemblage during this survey. The sites which had the lowest SASS5 score were RP01 (35)
and RP06 (31). These sites were largely - seriously modified (E/D) and these changes were
mostly due to a reduction in family diversity due to the absence of good habitat.
At RP02 (67), RP03 (50), RP04 (76) and RP05 (52), there were more families present than at
sites RP01 (35) and RP06 (31). There was also a high percentage of airbreathers in the macro-
invertebrate integrity of the two sites, with RP06 having the highest percentage of all the sites
surveyed (62%). A reduction in family diversity combined with a lower number of sensitive
families was found at the sites. In addition, the habitat was influenced by the presence of
algae and silt which reduced habitat availability at the sites. These two sites did not have any
“stones in-current” habitat. Although sites RP03 and RP04 indicated lower number of
airbreathers, these sites were highly impacted by algae and sedimentation on the rocks. This
can be mainly due to the reduced flow caused by the mining activities and other
anthropogenic activities and had a large influence on the MIRAI score at both these sites.
SASS5 results for both sites RP03 and RP04 indicated the sites are largely modified (D).
It must also be noted that the reference list of the macro-invertebrates consisted out of 49
families. From the reference list it can be indicated that the sites are impacted on because

Aquatic assessment for proposed new diamond mining activities – Report
much less species (8 - 16) were sampled at the sites compared to reference conditions. This
result suggests that the macro-invertebrate communities were impacted due to possible
deteriorated water quality and habitat, as discussed above.
7.5.2. MIRAI
The MIRAI score and EC of the current study are summarised in Table 7.5.1.1. The reference
list derived for the MIRAI index had a maximum SASS5 and ASPT score of 200 and 6.5
respectively. Therefore, the site was calculated to being largely modified (D) compared to
reference conditions. These modifications were due to three main causes, namely:
• A much lower number of families in comparison with the reference assemblages.
• Reduction in the number of sensitive taxa, namely Leptophlebiidae, Tricorythidae and
more than two species of Baetidae.
• Very high abundances of tolerant families including Corixidae and Chironimidae.
A further indication that these macro-invertebrate community structures were impacted on,
was through the assessment of the abundances of present families. High abundances of
tolerant families such as Corixidae, Chironomidae and Corbiculidae were observed at the
sites. These families are algae scrapers, shredders and gatherers and were most likely present
as a result of the excessive algae content and sedimentation in the Vaal River caused by the
organic enrichment from agriculture and cattle farming as well as flow modifications by
weirs.
MIRAI measures the response of the macro-invertebrates to certain drivers, namely flow,
habitat and water quality. The decrease in flow (caused by abstraction and impoundments)
and increase of algae on the stones biotopes caused the absence of various families that prefer
these habitats (
Table 7.5.2.1).
It should be noted that even though the SASS5 results showed higher scores in the current
report, the MIRAI indicates that these increases were as a result of the vegetation biotope.
There were an increase in algae and aquatic plants and as a result of this the macro-
invertebrates that preferred this habitat had increased. None of these macro-invertebrates were
considered to be sensitive. Therefore, MIRAI is a better indication of the macro-invertebrates
community structure because it compares the reference conditions with the current conditions
Aquatic assessment for proposed new diamond mining activities – Report
of these rivers. This in turn indicated that they are severely impacted on by flow and WQ
drivers.
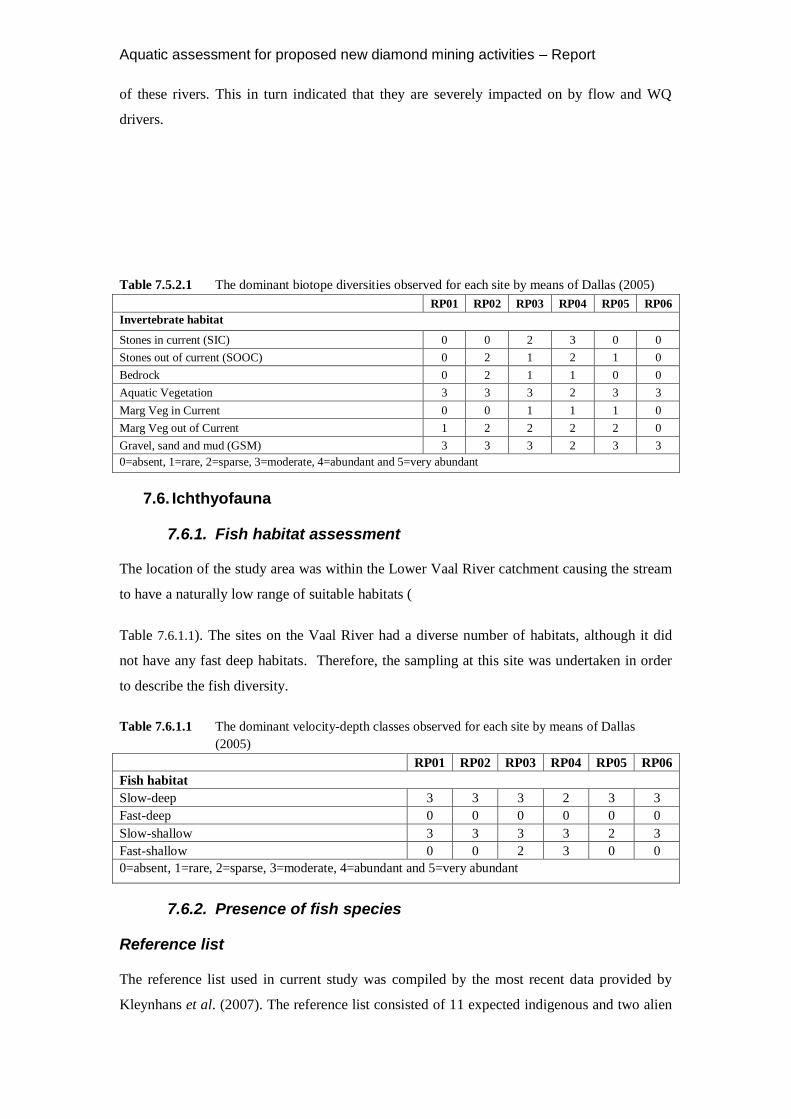
Table 7.5.2.1 The dominant biotope diversities observed for each site by means of Dallas (2005)
RP01 RP02 RP03 RP04 RP05 RP06
Invertebrate habitat
Stones in current (SIC) 0 0 2 3 0 0
Stones out of current (SOOC) 0 2 1 2 1 0
Bedrock 0 2 1 1 0 0
Aquatic Vegetation 3 3 3 2 3 3
Marg Veg in Current 0 0 1 1 1 0
Marg Veg out of Current 1 2 2 2 2 0
Gravel, sand and mud (GSM) 3 3 3 2 3 3
0=absent, 1=rare, 2=sparse, 3=moderate, 4=abundant and 5=very abundant
7.6. Ichthyofauna
7.6.1. Fish habitat assessment
The location of the study area was within the Lower Vaal River catchment causing the stream
to have a naturally low range of suitable habitats (
Table 7.6.1.1). The sites on the Vaal River had a diverse number of habitats, although it did
not have any fast deep habitats. Therefore, the sampling at this site was undertaken in order
to describe the fish diversity.
Table 7.6.1.1 The dominant velocity-depth classes observed for each site by means of Dallas
(2005)
RP01 RP02 RP03 RP04 RP05 RP06
Fish habitat
Slow-deep 3 3 3 2 3 3
Fast-deep 0 0 0 0 0 0
Slow-shallow 3 3 3 3 2 3
Fast-shallow 0 0 2 3 0 0
0=absent, 1=rare, 2=sparse, 3=moderate, 4=abundant and 5=very abundant
7.6.2. Presence of fish species
Reference list
The reference list used in current study was compiled by the most recent data provided by
Kleynhans et al. (2007). The reference list consisted of 11 expected indigenous and two alien

Aquatic assessment for proposed new diamond mining activities – Report
fish species and presented in

Aquatic assessment for proposed new diamond mining activities – Report
Table 7.6.2.1. The fish species that should occur in quaternary catchment C92B included
Barbus anoplus, Enteromius paludinosus (Barbus paludinosus), Clarias gariepinus, Labeo
capensis, Labeo umbratus, Labeobarbus aeneus, Austroglanis sclateri, Enteromius
trimaculatus (Barbus trimaculatus), Pseudocrenilabrus philander, Labeobarbus
kimberleyensis, Tilapia sparrmanii and the exotic species Cyprinus carpi and Gambusia
affinis.

Aquatic assessment for proposed new diamond mining activities – Report
Table 7.6.2.1 Expected and sampled fish species for the river system associated with the Lower
Vaal River.
FAMILY SPECIES COMMON NAME CONSERVATION
STATUS SAMPLED
CYPRINIDAE Barbus anoplus Chubbyhead barb LC No
CYPRINIDAE Enteromius paludinosus
(Barbus paludinosus) Straightfin barb LC Yes
CLARIIDAE Clarias gariepinus Sharptooth catfish LC Yes
CLARIIDAE Austroglanis sclateri Rock catfish LC No
CYPRINIDAE Enteromius trimaculatus (Barbus trimaculatus)
Three-spot barb LC Yes
CYPRINIDAE Labeo capensis Orange River
mudfish LC Yes
CYPRINIDAE Pseudocrenilabrus
philander
Southern
mouthbrooder LC Yes
CYPRINIDAE Labeo umbratus Moggel Introduced locally No
CYPRINIDAE Labeobarbus aeneus Vaal Orange Smallmouth
yellowfish
LC No
CYPRINIDAE Labeobarbus kimberleyensis
Vaal Orange Largemouth
yellowfish
NT No
CYPRINIDAE Tilapia sparrmanii Banded Tilapia LC Yes
Alien and Invasive Fish Species
CYPRINIDAE Cyprinus carpio Carp Alien No
POECILIIDAE Gambusia affinis Mosquito fish Alien Yes
LC = Least concern; NT = Near threatened
Species sampled
Seven (7) of the 13 expected fish species were sampled in the current study and presented in
Table 7.6.2.2. Pictures of the fish species sampled are included in Appendix B. This included
the indigenous species namely E. paludinosus, E. trimaculatus, L. capensis, P. philander, T.
sparrmanii and C. gariepinus. The alien species G. affinis were also sampled during this
survey. None of these species were classified as red data species and were all generally
tolerant. The habitat preferences of E. paludinosus, P. philander, T. sparrmanii, E.
trimaculatus and C. gariepinus, as well as the alien species (G. affinis), are predominantly
slow pools with aquatic and marginal vegetation (Kleynhans, 2008; Skelton, 2001), which
was abundant at the sites (
Table 7.6.1.1). This together with their lack of sensitivity to flow and water quality changes
further indicates why they were present at the sites.
Enteromius paludinosus are hardy and prefers quiet, well-vegetated waters in lakes, swamps
or marginal areas of larger rivers and slow flowing streams (Skelton, 2001). L. capensis
prefers running waters of large rivers but also survives well in large impoundments. They

Aquatic assessment for proposed new diamond mining activities – Report
gather in shallow rocky rapids where they breed during the summer season. E. trimaculatus
are mostly found in shallow water near river outlets or close to swampy areas. They are hardy
species and commonly occur in a wide variety of habitats, especially where there is vegetation
(Skelton, 2001).
T. sparrmanii and P. philander occurs in widely diverse habitat and favors areas where plant
cover exists along the edges of rivers, lakes or swamps (Skelton, 2001). These species prefer
shallow sheltered waters and does not colonize the open water. C. gariepinus is widely
tolerant of many different habitats, even the upper reaches of estuaries, but is considered to be
a freshwater species. It favours floodplains, slow flowing rivers, lakes and dams (Skelton
2001). It can tolerate waters high in turbidity and low in dissolved oxygen, and is often the
last or only fish species found in remnant pools of drying rivers (Safriel & Bruton 1984, Van
der Waal 1998).
The alien invasive species G. affinis were intentionally introduced in many areas with large
mosquito populations to decrease the population of mosquitoes by eating the mosquito larvae
(Skelton, 2001). They are found most abundantly in shallow water where they are protected
from larger fish. This species can survive relatively inhospitable environments, and are
resilient to low oxygen concentrations, high salt concentrations and also temperatures
variations (Skelton, 2001). They have been known for their aggressive behaviour towards
other fish species.
Table 7.6.2.2 Reference and current fish frequency of occurrence
Reference
FO RP01 RP02 RP03 RP04 RP05 RP06
# of indigenous species 11 3 4 5 4 3 3
Total abundances 3 26 35 31 35 63 26
# of exotic species 2 0 0 0 1 1 0
FRAI score % NA 28 37 46 37 28 28
FRAI EC NA D/E D D D D/E D/E
Barbus anoplus 3 - - - - - -
Enteromius paludinosus 3 12 1 11 13 31 15
Clarias gariepinus 3 - 2 - - - -
Austroglanis sclateri 3 - - - - - -
Enteromius trimaculatus 3 - - 2 - - -
Labeo capensis 3 - - 1 6 - -
Pseudocrenilabrus philander 3 5 12 6 3 8 5
Labeo umbratus 3 - - - - - -
Labeobarbus aeneus 3 - - - - - -
Labeobarbus kimberleyensis 3 - - - - - -
Cyprinus carpio NA - - - - - -
Tilapia sparrmanii 3 9 20 11 12 20 6
Gambusia affinis NA - - - 1 4 -
- Not sampled NA = Not available

Aquatic assessment for proposed new diamond mining activities – Report
FO-frequency of occurrence scoring according to Kleynhans et al. (2008)
Pseudocrenilabrus philander Clarias gariepinus
Southern mouthbrooder Sharptooth catfish
Figure 7.6.2 Images of two of the fish species sampled.
Species not sampled
The expected indigenous species that were not sampled included L. umbratus, Lb.
kimberleyensis, Lb. aeneus, B. anoplus and Austroglanis sclateri (Table 7.6.2.2). Lb.
kimberleyensis, also the only species that has a conservation status according to the IUCN and
is considered to be near threatened (NT), favours good habitats with fast flowing water and
deep pools, but are also found in large dams. These species are moderately intolerant to no
flow and their cover preference includes a very high water column (Kleynhans, 2008;
Skelton, 2001; Scott et al. 2006). Based on this, these species were not sampled in the study
area because of the lack of these habitats and flow conditions at the sampling sites.
L. umbratus prefers standing or slow flowing water and thrives in shallow impoundments and
farm dams (Skelton 2001; Scott et al. 2006). They are tolerant to modified water quality
conditions (Kleynhans 2008) and because they were locally introduced, it is possible that they
might not occur in the area of sampling.
B. anoplus prefers predominantly slow pools with aquatic and marginal vegetation
(Kleynhans, 2008; Skelton, 2001). They are tolerant to modified water quality conditions
(Kleynhans 2008) and it is possible that the presence of the alien species G. affinis at the sites
might be a contributing factor of their absence during sampling.
Austroglanis sclateri prefers rocky habitat in mainstream areas of major rivers. It is
omnivorous and feeds on invertebrates especially from rock surfaces with larger specimens
also feeding on small fish (Skelton 2001).
7.6.3. FRAI
The FRAI score and EC are summarized in Table 7.6.2.2. The score was calculated to be
largely modified (D/E). The baseline study indicates that there is deterioration in the fish
community assemblages in the area compared to expected reference list. This was because
only seven (7) of the 13 expected species were sampled.

Aquatic assessment for proposed new diamond mining activities – Report
Although, only seven of the reference list species were sampled of the possible 13 at the sites,
all of the eleven indigenous species expected under reference conditions are still expected to
be present under the present conditions at these sites and in the river. This was probably as a
result of reduced habitat availability and also the migration barriers formed by weirs present
upstream of the sites. It is expected that species which are moderately intolerant to no flow
conditions (Lb. kimberleyensis and A. sclateri) will still be present as they will survive and be
sustained in the current habitat for extended periods, but that their spawning success and
recruitment will be reduced.
Due to flow modification and reduced flows and floods there is a loss of FD and FS habitats
as well as substrate as cover, due to siltation (all sites) and excessive algae (RP03, RP04),
reducing the occurrence of A. sclateri, L. umbratus and Lb. kimberleyensis. Large pools are
present, and all the species will be able to utilise the pools as cover and refugia.
The presence of the alien species G. affinis (mosquitofish) at sites RP04 and RP05 may also
have an impact on the occurrence of indigenous species as this species is known to impact
other species in competition for suitable breeding habitat.
8. Current Impacts on Aquatic Ecosystems
The current aquatic impacts are summarised below:
• The increased concentrations of ions indicated by the slightly high EC levels at some
sites which may be a matter of concern.
• The aquatic habitats were impacted due to general catchment activities including
upstream alluvial diamond mining, agricultural activities and weirs that induced
modifications to flow regime, in-stream channel, and water quality.
• The aquatic biota was also modified from natural assemblages. The macro-invertebrate
assemblages were largely modified due to alterations in the habitat, water quality and
abundance of tolerant families. The fish assemblages were also impacted, with some
the of expected fish species absent within this study due to modified habitat at the
sites.
9. Possible impacts from new mining activities
The possible future impacts from the proposed new development on the freshwater biota are
given below:
• Increased turbidity and siltation of the river and aquatic habitats.
• Potential loss of aquatic habitats.
• Deterioration of water quality.

Aquatic assessment for proposed new diamond mining activities – Report
10. Conclusion
The aquatic ecosystem within the surrounding area of Proposed new diamond mining
activities was assessed as being largely modified (D) in relation to the habitat integrity and
macro-invertebrate assessment. The PES for the fish assessment also showed a largely
modified (D) ecological state after the current assessment. The majority of the impacts on this
system were associated with Upstream mining, agriculture and instream habitat changes.
These modifications in turn influenced the macro-invertebrate and fish community structures.
The physical water quality results indicated that the water quality were good at the site, with
current impacts on water quality mainly attributed to upstream anthropogenic activities. The
main sources for the absence of the expected fish species and macro-invertebrates at all the
sites assessed, were from the absence of suitable habitat due to accumulative effects of
impoundments, upstream mining and general anthropogenic activities.
As the study area does not fall within a Freshwater Ecological Protected Area (FEPA) it is not
governed by its stringent management guidelines. However, normal guidelines should still be
adhered to in regards to any planned development as well as future management of the river.
The impacts of the proposed new diamond mining activities in the system were found to be
potential loss of aquatic habitat and increased turbidity and siltation in the river. The impacts
will have an effect on the water quality and also on the biotic integrity of the system and
mitigation measures need to be implemented to limit any adverse effects.
The diatom data indicated that the diatom based derived water quality was moderate for sites
RP01, RP02, RP03 and RP06, whereas sites RP04 and RP05 had slight better diatom derived
water quality scores of good quality. The dominance of the species A. minutissima indicates
that there were elevated flows that occurred from site RP01 through to site RP06. There was
a significant change in water quality and in the amount of pollution tolerant valves (PTVs)
between site RP03 and RP04. Site RP03 was classified as moderate and had a PTV score of
9% and site RP 4 indicated an increase in water quality and was classified as good quality and
the PTV score for site RP04 was recorded at 0.5% which indicated that there was a fresh
inundation of water that occurred at site RP04.
The PTVs and water quality scores started deteriorating toward Site RP05 and RP06. There
was a significant decrease in the water quality scores between site RP05 and RP06. The
Diatom community also indicated a shift towards organically and saline enriched waters. The
Nitzschia species were key indicators which indicated an increased gradient of nutrient
loading between sites RP05 and RP06 as Nitzschia species reflect a water body with readily
available nutrients (Cholnoky, 1968).

Aquatic assessment for proposed new diamond mining activities – Report
Generally the Vaal River site were dominated by the species Achnanthidium minutissima and
is considered by some authors as n pioneer coloniser and characteristic of disturbed
conditions capable of invading open areas due to changes in environmental conditions and
indicates the presence of diffuse pollutants (Luis et al., 2008). This species does however also
occur in great abundance in waters with high saturated oxygen levels and is an indicator of
these conditions.
The diatom results indicated an overall deterioration in the biological water quality within the
study area and indicated that salinity and nutrient levels are becoming elevated, although not
yet deemed as problematic, the nutrient and salinity levels may become problematic. Indicator
species from site RP01 through to site RP05 indicated that industrial impacts and agricultural
activities contributed to the deteriorating of water qualities within the study area. The overall
diatom community at site RP06 indicated a significant shift with key indicator species having
preferences for organically enriched waters. Indicator species for industrial and mining
activities were present. Organic pollutions levels also increased significantly at site RP06
which indicated that there is an influx of deteriorating water quality entering into the aquatic
system.
Although no follow up assessment are currently planned, it is highly recommended that a
follow-up survey be planned to further assess the aquatic ecosystems. It is recommended that
the recommendations and mitigation measures from this report are adhered to and be
continuously monitored.
11. Recommendations
• Implementation of a suitable management action plan during the installation and
operation of the proposed diamond mining activities, based on analysis of bi-annual water
quality and biological monitoring data collected at sites upstream and downstream of all
activities;
• Prevention of exotic vegetation encroachment;
• Prevent further siltation within the river segment as well as downstream of activities;
• Unnecessary destruction of marginal and instream habitat should be avoided at all times
during operations.

Aquatic assessment for proposed new diamond mining activities – Report
References
Colvin, C., Burns, A., Schatschneider, K., Maherry, A., Charmier, J. And De Wit, M. 2011.
Coal and Water Features in South Africa. WWF Report. www.wwf.org.za
Dallas, H.F. 2000. The derivation of ecological reference conditions for riverine
macroinvertebrates. Institute for water quality studies. Department of Water Affairs
and Forestry. Pretoria, South Africa.
Dallas, H.F. 2005. River Health Programme: Site characterisation field-manual and field-data
sheets. Resource quality services. Department of Water Affairs and Forestry. Pretoria,
South Africa.
Dallas, H.F. 2007. River Health Programme: South African Scoring System (SASS) Data
Interpretation Guidelines. The Freshwater Consulting Group/Freshwater Research
Unit. University of Cape Town. Prepared for Institute of Natural Resources and the
Department of Water Affairs and Forestry.
Dallas, H.F. and Day, J.A. 2004. The effect of water quality variables on Aquatic Ecosystems:
A Review. WRC Report No. TT 224/04. Water Research Commission. Pretoria,
South Africa.
Department of Water Affairs and Forestry (DWA) 1996. South African Water Quality
Guidelines Volume 7 Aquatic Ecosystems. Department of Water Affairs and Forestry.
Pretoria, South Africa.
Department of Water Affairs (DWA) 2004. Upper Vaal Water Management Area: Internal
Strategic Perspective. Prepared by PDNA, WRP Consulting Engineers (Pty) Ltd,
WMB and Kwezi-V3 on behalf of the Directorate: National WaterResource Planning.
DWAF Report No P WMA 08/000/00/0304.
Department of Water Affairs (DWA) 2008. National Aquatic Ecosystem Health Monitoring
Programme (NAEHMP): River Health Programme (RHP) Implementation Manual.
Version 2. Department of Water Affairs and Forestry. Pretoria, South Africa.
Department of Water Affairs (DWA) 2011. Classification of Significant Water Resources
(River, Wetlands, Groundwater and Lakes) in the Upper, Middle and Lower Vaal
Water Management Areas (WMA) 8, 9, 10: Water Resource Analysis Report

Aquatic assessment for proposed new diamond mining activities – Report
Department of Water and Sanitation (DWS) 2018. Resource water quality data for Lower
Vaal Water Management Area (WMA).
Dickens, C.W.S. and Graham, P.M. 2002. The South African Scoring System (SASS) Version
5 Rapid Bioassessment Method for Rivers. African Journal of Aquatic Science, 27:1–
10.
Gammeter, S. and Frutiger, A. 1990. Short-term toxicity of ammonia and low oxygen to
benthic macro-invertebrates of running waters and conclusions for wet weather water
pollution control measures. Water Science and Technology, 22:291–296.
IUCN RED LIST OF THREATENED SPECIES (website). Widely recognized as the most
comprehensive, objective global approach for evaluating the conservation status of plant
and animal species. Available at: www.iucnredlist.org Visited February 2014
Kleynhans, C.J. 2008. Module D: Fish Response Assessment Index in River
EcoClassification: Manual for EcoStatus Determination, version 2. Joint Water
Research Commission and Department of Water Affairs and Forestry report. WRC
Report No.
Kleynhans, C.J. 1996. A qualitative procedure for the assessment of habitat integrity status of
the Levuvhu River (Limpopo System South Africa). Journal of Aquatic Ecosystem
Health, 5:41–54.
Kleynhans, C.J. and Louw, M.D. 2008. Module A: EcoClassification and Ecostatus
determination in River EcoClassification: Manual for ecostatus determination
(Version 2). Pretoria, South Africa: Joint Water Research Commission and the
Department of Water Affairs and Forestry. Pretoria, South Africa.
Kleynhans, C.J., Louw, M.D. and Moolman, J. 2007. Reference frequency of occurrence of
fish species in South Africa. Pretoria. DWAF and WRC Report no. TT 331/08.
Department of Water Affairs and Forestry. Water Research Commission. Pretoria,
South Africa.
Kleynhans, C.J., Thirion, C. and Moolman, J. 2005. A level I River Ecoregional classification
system for South African, Lesotho and Swaziland. Report No: N/0000/00/REQ0104.

Aquatic assessment for proposed new diamond mining activities – Report
Resource Quality Services, Department of Water Affairs and Forestry, Pretoria, South
Africa.
Kotze, P. 2001. The ecological integrity of the Klip River (Gauteng). PhD thesis,
unpublished. Rand Afrikaans University. Johannesburg. South Africa.
McKee, J.E and Wolf, H.W. 1963. Water quality criteria. The Resource Agency of California
(2nd edition). State Water Quality Control Bd., Publication 3A. 584pp.
Midgley, D.C., Pitman, W.V. and Middleton, B.J. 1994. Surface water resources of South
Africa 1990: Appendices. Vol. 1. Water Resources Commission, WRC Report No.
298/1.1/94.
Mucina, L. and Rutherford, M.C. (eds.) 2006. The vegetation of South Africa, Lesotho and
Swaziland. Strelitzia 19. South African National Biodiversity Institute, Pretoria,
South Africa.
Nel, J.L., Driver, A, Strydom, WF, Maherry, A, Petersen, C, Hill, L, Roux, D.J., Nienaber, S,
van Deventer, H, Swartz, E and Smith-Adao, L.B., 2011. ATLAS of
FRESHWATER ECOSYSTEM PRIORITY AREAS in South Africa: Maps to
support sustainable development of water resources. Water Research Commission.
Report no. TT 500/11
Rikard, M. and Kunkle, S. 1990. Sulphate and conductivity as field indicators for detecting
coal mining pollution. Environmental Monitoring and Assessment, 15:49–58.
River Health Programme (RHP) 2003. State-of-Rivers Report: Free State Region River
System. Department of Water Affairs and Forestry. Pretoria, South Africa.
Rivers Database 2007. Version 3. The River Health Programme in conjunction with the
Department of Water Affairs and Forestry and the Water Research Commission.
Pretoria, South Africa.
Rowntree, K.M and Wadeson, R.A. 2000. Field manual for channel classification and
condition assessment. National Aquatic Ecosystem Biomonitoring Programme Report
Series No. 13. Institute for Water Quality Studies, Department of Water Affairs and
Forestry, Pretoria, South Africa.

Aquatic assessment for proposed new diamond mining activities – Report
Safriel, O. & Bruton, M.N. 1984. A cooperative aquaculture research programme for South
Africa. South African National Scientific Programmes Report 89. CSIR, Pretoria, pp.
79.
Scott, L.E.P., Skelton, P.H., Booth, A.J., Verheust, L., Harris, R. and Dooley, J. 2006. Atlas
of South African Fishes. Grahamstown: The South African Institute for Aquatic
Biodiversity (SAIAB).
Skelton, P. 2001. A complete guide to the freshwater fishes of southern Africa, 2nd edition.
Halfway House: Southern Publishers. Cape Town, South Africa. 395pp.
Thirion, C. 2007. Module E: Macroinvertebrate Response Assessment Index in River
EcoClassification: Manual for EcoStatus Determination (version 2). Joint Water
Research Commission and Department of Water Affairs and Forestry report. Pretoria,
South Africa.
Todd, C. and Roux. D. 2000. Design of an Aquatic Biomonitoring Programme, using the
South African River Health Programme as a Case Study. 1st WARFSA/WaterNet
Symposium: Sustainable Use of Water Resources; Maputo, 1-2 November 2000.
http://www.bvsde.paho.org/bvsacd/cd46/todd.pdf
Van der Waal, B.C.W. 1998. Survival strategies of sharptooth catfish Clarias gariepinus in
desiccating pans in the northern Kruger National Park. Koedoe - African Protected
Area Conservation and Science 41: 131-138.
Williams, K.A., Green, D.W.J. and Pascoe, D. 1986. Studies on the acute toxicity of
pollutants to freshwater macro-invertebrates. Archiv fuer Hydrobiologie, 106:61–70.
Water Research Commission, (WRC), 2011. Implementation Manual for Freshwater
Ecosystem Priority Areas. WRC Report No. XXXX
AFNOR (2000). Norme Française NF T 90–354. Détermination de l’Indice Biologique
Diatomées IBD. Association Française de Normalisation, 63 pp.
Battarbee, RW (1986). Diatom Analysis. In Berglund BE (ed) Handbook of Holocene
Paleoecology and Paleohydrology. John Wiley & Sons Ltd. Chichester. Great Briton.
pp 527-570.
Besse A. 2007 Integrated Project to evaluate the Impacts of Global Change on European
Freshwater Ecosystems: Task 4 - Generation of an indicator value database for

Aquatic assessment for proposed new diamond mining activities – Report
European freshwater species. Euro-limpacs. Project No. GOCE-CT-2003-505540.
ALTERRA, Green World Research, Wageningen, Netherlands.
Cattaneo, A, Couillard, Y, Wunsam, S, and Courcelles, M (2004). Diatom taxonomic and
morphological changes as indicators of metal pollution and recovery in Lac Dufault
Québec, Canada. Journal of Paleolimnology 32: 163-175.
Cholnoky, BJ (1968). Die Ökologie der Diatomeen in Binnengewässern. J Cramer, Lehre.
Dixit, SS, Smol, JP, Kingston, JC & Charles, DF (1992). Diatoms: Powerful indicators
of environmental change. Environmental Science and Technology 26: 23–33.
De la Rey, PA, Taylor, JC, Laas, A, Van Rensburg, L & Vosloo, A (2004). Determining the
possible application value of diatoms as indicators of general water quality: A
comparison with SASS 5. Water SA 30: 325-332.
Eloranta P and Soininen J (2002) Ecological status of Finnish rivers evaluated using benthic
diatom communities. J. Appl. Phycol. 14: 1-7.
Fore, L.S. and Grafe, C. 2002. Using diatoms to assess the biological condition of large
rivers in Idaho (U.S.A.). Freshwater Biology (2002) 47, 2015–2037.
Hecky, R.E. and Kilham, P. (1973). Diatoms in alkaline, saline lakes: Ecology and
geochemical implications. Limnology and oceanography 53 (Volume 18:1).
Kelly M. G., Whitton B. A., 1995, The Trophic Diatom Index: a new index for monitoring
eutrophication in rivers, Journal of Applied Phycology 7, 433- 444.
Kelly, M.G., Adams, C., Graves, A.C., Jamieson, J., Krokowski, J., Lyncett, E.B., Murry-
Bligh, J., Pritchard, S. and Wilkins, C. (2001). The Trophic Diatom Index: A user’s
manual. Revised Edition. Environmental Agency Technical Report E2/TR2.
Krammer, K and Lange-Bertalot, H (1986-1991). Bacillario-phyceae. Süßwasserflora von
Mitteleuropa 2 (1-4). Spektrum Akademischer Verlag, Heidelberg. Berlin.
Lavoie I, Campeau S, Grenier M and Dillon PJ (2006) A diatom-based index for the
biological assessment of eastern Canadian rivers: an application of correspondence
analysis (CA). Can. J. Fish. Aquat. Sci. 63(8): 1793–1811.
Lecointe, C, Coste, M and Prygiel, J (1993). “Omnidia”: Software for taxonomy, calculation
of diatom indices and inventories management. Hydrobiologia 269/270: 509-513.
Leira, M and Sabater, S (2005). Diatom assemblages distribution in Catalan rivers, NE Spain,
in relation to chemical and physiographical factors. Water Research 39: 73-82
Luís, A.T., Teixeira, P., Almeida, S.F.P., Ector, L., Matos, J.X. and Ferreira da Silva, A.
2008. Impact of Acid Mine Drainage (AMD) on Water Quality, Stream Sediments and

Aquatic assessment for proposed new diamond mining activities – Report
Periphytic Diatom Communities in the Surrounding Streams of Aljustrel Mining Area
(Portugal). Water Air Soil Pollution. DOI 10.1007/s11270-008-9900-z.
Pudwill R., Timm T, 1997, The salinization of streams by water from coal mine spoil dumps
in the Ruhr area (Germany), Limnologica, 27(1): 65-75.
Schoeman, FR (1973). A systematical and ecological study of the diatom flora of Lesotho
with special reference to water quality. V&R Printers, Pretoria, South Africa.
Szczepocka E (2007) Benthic diatoms from the outlet section of the Bzura River.
International Journal of Oceanography and Hydrobiology 36(1): 255-260.
Taylor, JC. 2004. The Application of Diatom-Based Pollution Indices in the Vaal Catchment.
Unpublished M.Sc. thesis, North-West University, Potchefstroom Campus,
Potchefstroom.
Taylor, JC, Harding, WR and Archibald, CGM (2007a). A methods manual for the
collection, preparation and analysis of diatom samples. Water Research Commission
Report TT281/07. Water Research Commission. Pretoria.
Taylor, JC, Harding, WR and Archibald, CGM (2007b). An illustrated guide to some
common diatom species from South Africa. Water Research Commission Report
TT282/07. Water Research Commission. Pretoria.
Tilman, D, Kilham, SS, & Kilham, P (1982). Phytoplankton community ecology: The role of
limiting nutrients. Annual Review of Ecology and Systematics 13: 349–372.
Van Dam, Mertens A and Sinkeldam J (1994) A coded checklist and ecological indicator
values of freshwater diatoms from the Netherlands. Netherlands Journal of Aquatic
Ecology 28(1): 177-133.
Zelinka M and Marvan P (1961) Zur Prikisierung der biologischen Klassifikation der Reinheit
fliessender Gewasser. Archiv. Hydrobiol. 57: 389-407.

Aquatic assessment for proposed new diamond mining activities – Report
Appendix
Appendix A Biomonitoring Data for aquatic assessment 2018
TAXON REF RP01 RP02 RP03 RP04 RP05 RP06
PORIFERA (Sponge) A
COELENTERATA (Cnidaria)
TURBELLARIA (Flatworms) A
ANNELIDA
Oligochaeta (Earthworms) A 1 A
Hirudinea (Leeches) A A A
CRUSTACEA
Amphipoda (Scuds)
Potamonautidae* (Crabs) A A
Atyidae (Freshwater Shrimps) A B B A B A
Palaemonidae (Freshwater Prawns)
HYDRACARINA (Mites) A 1
PLECOPTERA (Stoneflies)
Notonemouridae
Perlidae
EPHEMEROPTERA (Mayflies)
Baetidae 1sp A 1
Baetidae 2spp B B
Baetidae >2spp A
Caenidae (Squaregills/Cainfles) A 1 A A A
Ephemeridae
Heptageniidae (Flatheaded mayflies) A
Leptophlebiidae (Prongills) A
Oligoneuridae (Brushlegged mayflies)
Polymitarcyidae (Pale Burrowers)
Prosopistomatidae (Water specs)
Teloganodidae SWC (Spiny Crawlers)
Tricorythidae (Stout Crawlers) A
ODONATA (Dragonflies & Damselflies)
Calopterygidae ST,T (Demoiselles)
Chlorocyphidae (Jewels) A
Synlestidae (Chlorolestidae)(Sylphs) A
Coenagrionidae (Sprites and blues) A 1 A A A A A
Lestidae (Emerald Damselflies/Spreadwings) A
Platycnemidae (Stream Damselflies)
Protoneuridae (Threadwings)
Aeshnidae (Hawkers & Emperors) A
Corduliidae (Cruisers)
Gomphidae (Clubtails) A A A A
Libellulidae (Darters/Skimmers) A A A 1 A
LEPIDOPTERA (Aquatic Caterpillars/Moths)
Crambidae (Pyralidae)
HEMIPTERA (Bugs)
Belostomatidae* (Giant water bugs) A 1
Corixidae* (Water boatmen) A B A A A B
Gerridae* (Pond skaters/Water striders) A
Hydrometridae* (Water measurers) A
Naucoridae* (Creeping water bugs) A A
Nepidae* (Water scorpions) A
Notonectidae* (Backswimmers) A A A A 1
Pleidae* (Pygmy backswimmers) A
Veliidae/M...veliidae* (Ripple bugs) A 1 1 A
MEGALOPTERA (Fishflies, Dobsonflies and Alderflies)
Corydalidae (Fishflies & Dobsonflies)
Sialidae (Alderflies)
TRICHOPTERA (Caddisflies)
Dipseudopsidae
Ecnomidae
Hydropsychidae 1 sp A 1
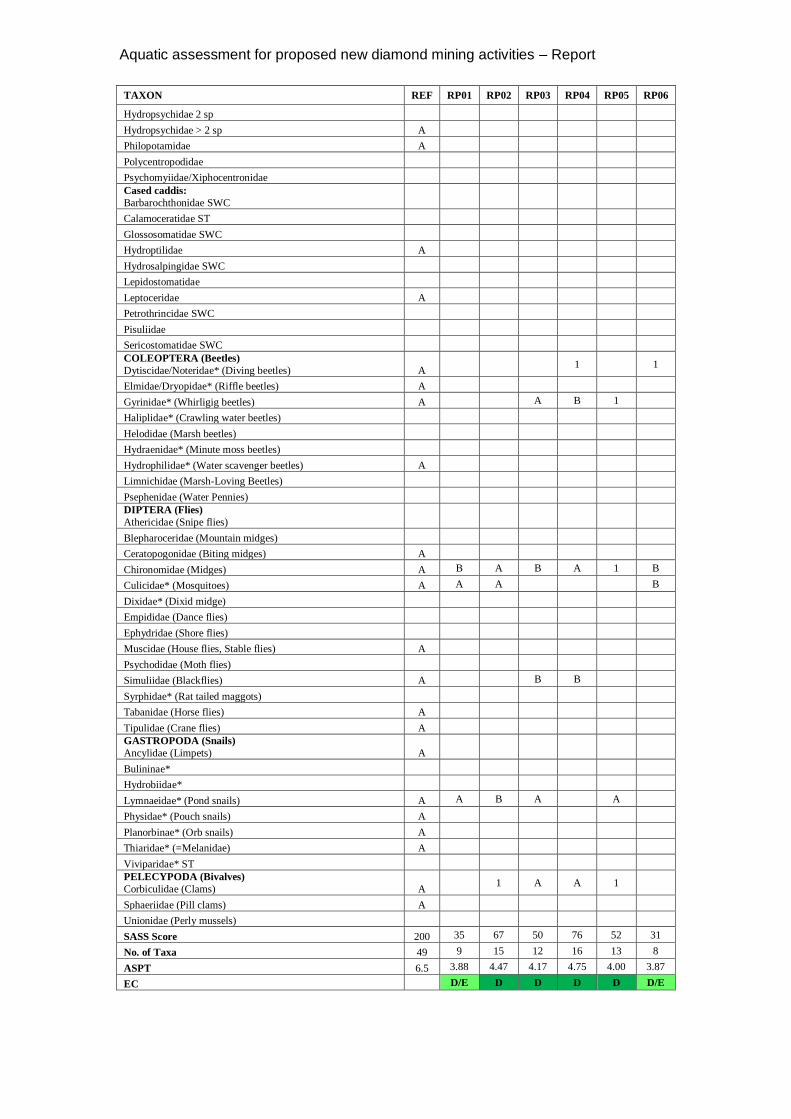
Aquatic assessment for proposed new diamond mining activities – Report
TAXON REF RP01 RP02 RP03 RP04 RP05 RP06
Hydropsychidae 2 sp
Hydropsychidae > 2 sp A
Philopotamidae A
Polycentropodidae
Psychomyiidae/Xiphocentronidae
Cased caddis:
Barbarochthonidae SWC
Calamoceratidae ST
Glossosomatidae SWC
Hydroptilidae A
Hydrosalpingidae SWC
Lepidostomatidae
Leptoceridae A
Petrothrincidae SWC
Pisuliidae
Sericostomatidae SWC
COLEOPTERA (Beetles)
Dytiscidae/Noteridae* (Diving beetles) A 1 1
Elmidae/Dryopidae* (Riffle beetles) A
Gyrinidae* (Whirligig beetles) A A B 1
Haliplidae* (Crawling water beetles)
Helodidae (Marsh beetles)
Hydraenidae* (Minute moss beetles)
Hydrophilidae* (Water scavenger beetles) A
Limnichidae (Marsh-Loving Beetles)
Psephenidae (Water Pennies)
DIPTERA (Flies)
Athericidae (Snipe flies)
Blepharoceridae (Mountain midges)
Ceratopogonidae (Biting midges) A
Chironomidae (Midges) A B A B A 1 B
Culicidae* (Mosquitoes) A A A B
Dixidae* (Dixid midge)
Empididae (Dance flies)
Ephydridae (Shore flies)
Muscidae (House flies, Stable flies) A
Psychodidae (Moth flies)
Simuliidae (Blackflies) A B B
Syrphidae* (Rat tailed maggots)
Tabanidae (Horse flies) A
Tipulidae (Crane flies) A
GASTROPODA (Snails)
Ancylidae (Limpets) A
Bulininae*
Hydrobiidae*
Lymnaeidae* (Pond snails) A A B A A
Physidae* (Pouch snails) A
Planorbinae* (Orb snails) A
Thiaridae* (=Melanidae) A
Viviparidae* ST
PELECYPODA (Bivalves)
Corbiculidae (Clams) A 1 A A 1
Sphaeriidae (Pill clams) A
Unionidae (Perly mussels)
SASS Score 200 35 67 50 76 52 31
No. of Taxa 49 9 15 12 16 13 8
ASPT 6.5 3.88 4.47 4.17 4.75 4.00 3.87
EC D/E D D D D D/E

Aquatic assessment for proposed new diamond mining activities – Report
Appendix B Fish species sampled for the aquatic assessment 2018
Barbus paludinosus Barbus trimacultus
Pseudocrenilabrus philander Tilapia sparrmanii
Gambusia affinis