java high speed train project
DESCRIPTION
Presentation about High Speed Train project in Java, IndonesiaTRANSCRIPT
HIGH SPEED TRAIN PROJECT IN INDONESIA (JAKARTA – SURABAYA CORRIDOR)
HERMANTO DWIATMOKO
Directorate General of RailwaysMinistry of Transportation
Republic of IndonesiaJakarta, 2010
High Speed Train Project in Indonesia
(Jakarta ‐ Surabaya Corridor) 1
HIGH SPEED TRAIN PROJECT IN INDONESIA (JAKARTA – SURABAYA CORRIDOR)
Hermanto Dwiatmoko
Director of Safety and Technical Rolling Stock. Directorate General of Railways, Ministry of Transportation.
Republic of Indonesia
SUMMARY Indonesia is accelerating industrialization and urbanization, perticulary in the suburbs of large cities such as Jakarta and Surabaya. The High Speed Train is a technological break‐through in passenger transport which has allowed to increase railways share in modal split, competing with others transport mode. Some benefits of High Speed Train project in Indonesia for Jakarta – Surabaya Corridor, approximately 685 km, have been identified as cost saving such as the value of time saved by passengers traveling on High Speed Train, the foreign exchange saved due to decrease in oil import as result of a decrease in freight transportation by commercial trucks due to increase in freight trains as passengers shift from conventional trains and airplanes to High Speed Train and the foregin exchange earned by selling the surplus CO2 emission right that results from decrease in conventional trains and airplanes as passengers shift to High Speed Train. It will increase economic growth and trading due to increasing of people movement and regional development, coincide with decreasing of cars or petrol usage, and resulting improvement of environment. Accordingly, the investment of the project will not faces a profitability problem from the financial viewpoint and appropriate as a PPP (Public Private Partnerships) project to be implemented by mainly Indonesia government and the private sectors. 1. Introduction
In order to improve the economic growth, not only the software aspect such as laws, social systems, social safety, labor, but also the hardware aspect especially, the transportation sector is important. Transportation sector plays a great role among measures for sustainable economic growth. Transportation sector is an important component of the economy impacting on development, especially between large city such as Jakarta and Surabaya as a main artery, to make a substitute city for Jakarta area as the center of development. Jakarta and its surrounding cities (Jabodetabek) contributed about 20% to Indonesia’s GDP (Gross Domestic Product), followed by greater Surabaya 6%, greater Bandung 3%, and Makassar 1%. The railway section between Jakarta and Surabaya is connected by conventional double tracking between Jakarta – Cirebon and Pemalang – Larangan, integrated with single tracking between Cirebon – Pemalang and Larangan – Surabaya, while the line capacity between this two cities is limited and the number of passenger is increasing. The traveling time between this two cities by a train is about 10 ‐ 14 hours and by a bus is more than 18 hours due to the traffic jam, which means a wasting time for businees people and very tired for the passengers. However, although currently there is one air flight every hour between Jakarta and Semarang, the runway of the Soekarno Hatta Airport is expected to reach the capacity limit by 2015.
Better solution should be achieved by developing an efficient transportation system and environmentally friendly between Jakarta and Surabaya, which will take only 2.5 hours traveling time. If travel range in a day is expanded by an efficient transportation system, human and material distribution will become active, and opportunities to utilize resources in local regions, which carry high added values but tend to be centralized in Jakarta, will be effectively utilized. Thus regional development and human resource development target in Indonesia will be achieved. As a result, the cities dotting along the north shore of Java with independent economic activities can be integrated into a line‐shaped region, and become capable of efficient economic activities while sharing tasks in their respective realms of expertise. This leads to economic development of the whole integrated area, and at the same time, the development is more efficiently.
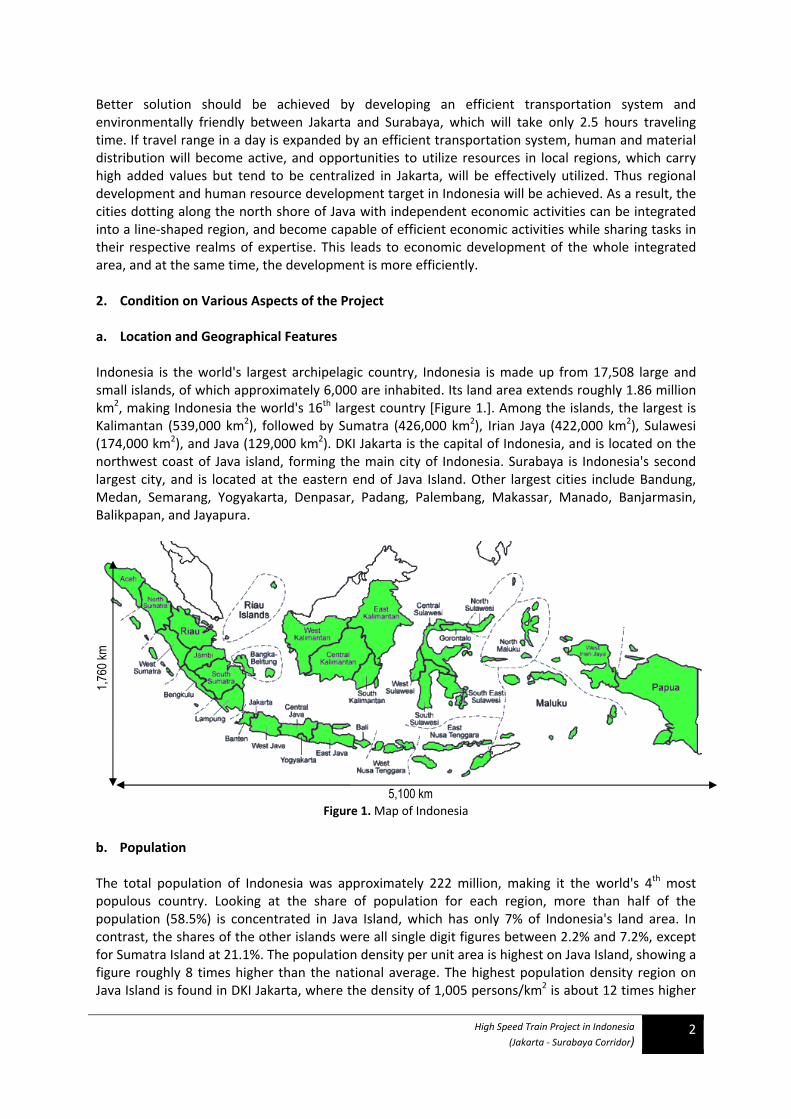
2. Condition on Various Aspects of the Project a. Location and Geographical Features Indonesia is the world's largest archipelagic country, Indonesia is made up from 17,508 large and small islands, of which approximately 6,000 are inhabited. Its land area extends roughly 1.86 million km2, making Indonesia the world's 16th largest country [Figure 1.]. Among the islands, the largest is Kalimantan (539,000 km2), followed by Sumatra (426,000 km2), Irian Jaya (422,000 km2), Sulawesi (174,000 km2), and Java (129,000 km2). DKI Jakarta is the capital of Indonesia, and is located on the northwest coast of Java island, forming the main city of Indonesia. Surabaya is Indonesia's second largest city, and is located at the eastern end of Java Island. Other largest cities include Bandung, Medan, Semarang, Yogyakarta, Denpasar, Padang, Palembang, Makassar, Manado, Banjarmasin, Balikpapan, and Jayapura.
High Speed Train Project in Indonesia
(Jakarta ‐ Surabaya Corridor) 2
Figure 1. Map of Indonesia b. Population
The total population of Indonesia was approximately 222 million, making it the world's 4th most populous country. Looking at the share of population for each region, more than half of the population (58.5%) is concentrated in Java Island, which has only 7% of Indonesia's land area. In contrast, the shares of the other islands were all single digit figures between 2.2% and 7.2%, except for Sumatra Island at 21.1%. The population density per unit area is highest on Java Island, showing a figure roughly 8 times higher than the national average. The highest population density region on Java Island is found in DKI Jakarta, where the density of 1,005 persons/km2 is about 12 times higher
High Speed Train Project in Indonesia
(Jakarta ‐ Surabaya Corridor) 3
than the overall density for Java Island. More than 60% of Indonesian population are living on the Java Island which accounts only 7% of the national land, especially, concentration of population in the Jakarta metropolitan area is extreme. c. Economic Condition
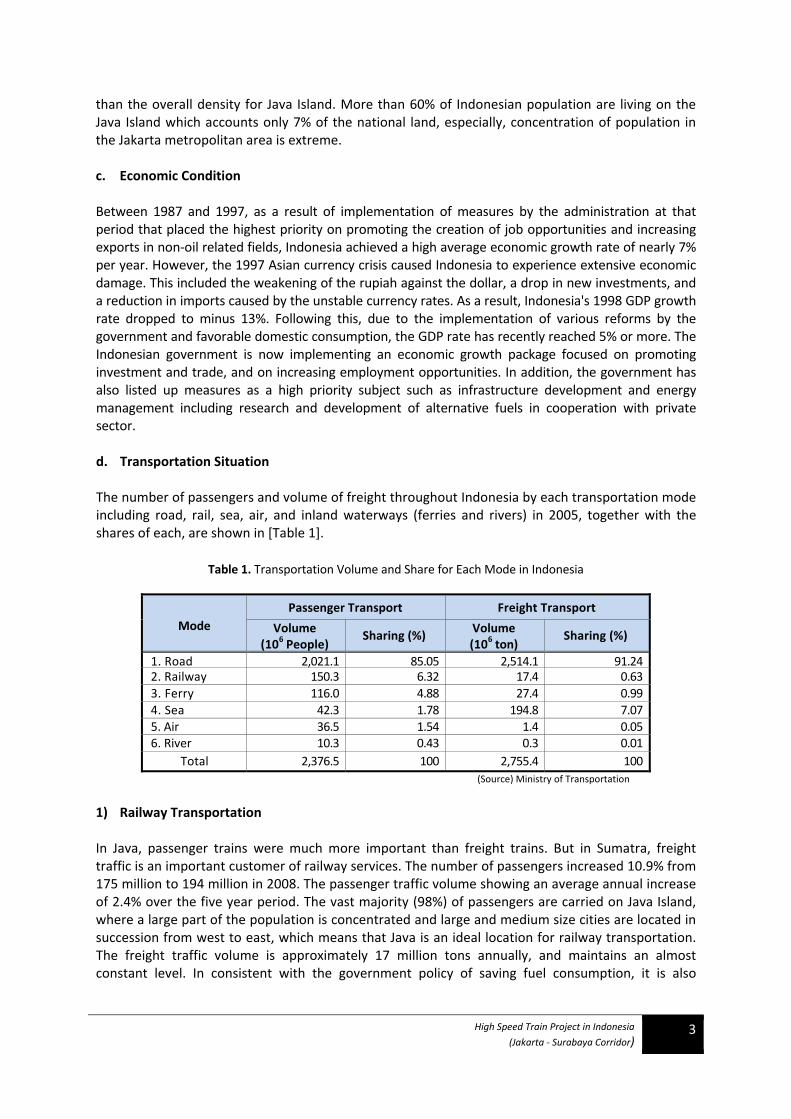
Between 1987 and 1997, as a result of implementation of measures by the administration at that period that placed the highest priority on promoting the creation of job opportunities and increasing exports in non‐oil related fields, Indonesia achieved a high average economic growth rate of nearly 7% per year. However, the 1997 Asian currency crisis caused Indonesia to experience extensive economic damage. This included the weakening of the rupiah against the dollar, a drop in new investments, and a reduction in imports caused by the unstable currency rates. As a result, Indonesia's 1998 GDP growth rate dropped to minus 13%. Following this, due to the implementation of various reforms by the government and favorable domestic consumption, the GDP rate has recently reached 5% or more. The Indonesian government is now implementing an economic growth package focused on promoting investment and trade, and on increasing employment opportunities. In addition, the government has also listed up measures as a high priority subject such as infrastructure development and energy management including research and development of alternative fuels in cooperation with private sector. d. Transportation Situation The number of passengers and volume of freight throughout Indonesia by each transportation mode including road, rail, sea, air, and inland waterways (ferries and rivers) in 2005, together with the shares of each, are shown in [Table 1].
Table 1. Transportation Volume and Share for Each Mode in Indonesia
Mode Passenger Transport Freight Transport
Volume (106 People)
Sharing (%) Volume(106 ton)
Sharing (%)
1. Road 2,021.1 85.05 2,514.1 91.24 2. Railway 150.3 6.32 17.4 0.63 3. Ferry 116.0 4.88 27.4 0.99 4. Sea 42.3 1.78 194.8 7.07 5. Air 36.5 1.54 1.4 0.05 6. River 10.3 0.43 0.3 0.01
Total 2,376.5 100 2,755.4 100 (Source) Ministry of Transportation
1) Railway Transportation In Java, passenger trains were much more important than freight trains. But in Sumatra, freight traffic is an important customer of railway services. The number of passengers increased 10.9% from 175 million to 194 million in 2008. The passenger traffic volume showing an average annual increase of 2.4% over the five year period. The vast majority (98%) of passengers are carried on Java Island, where a large part of the population is concentrated and large and medium size cities are located in succession from west to east, which means that Java is an ideal location for railway transportation. The freight traffic volume is approximately 17 million tons annually, and maintains an almost constant level. In consistent with the government policy of saving fuel consumption, it is also
High Speed Train Project in Indonesia
(Jakarta ‐ Surabaya Corridor) 4
planned to increase coal production, and that railways should be used to transport the additional coal. 2) Road Transportation The total length of road nationwide is approximately 380,000km, meanwhile, the registered numbers for each type of vehicle over the last five year period was 63 million. The average annual growth rate over the seven year period was 21.2% for all vehicles, which is an extremely large figure compared with the mere 1.1% growth of the road length expansion rate over the five year period. As a result of this rapid increase in the number of vehicles, the road traffic situation particularly in the main cities is worsening every year following the severe traffic jams and traffic accidents. In particular, the poor traffic morals of motorcycle riders are confusing the flow of traffic and causing even more traffic jams and accidents. Due to this over‐large number of accidents and casualties, traffic accidents have now become a major social problem, and not only are improvements to the road infrastructure required, but also changes in traffic morals, such as observing the traffic regulations. 3) Air Transportation Currently, there are 31 airlines on domestic routes, including those operating non‐scheduled services and both large and small companies, which are operating 195 routes linking 101 cities. The majority of the domestic routes currently link Jakarta with other major cities. The number of flights from Jakarta and a list of the top destinations for domestic passengers was Surabaya both for the number of flights and the number of passengers. Other destinations in Java island, such as from Jakarta to Semarang or to Yogyakarta, each made up 5% of the total. On the other hand, the runway of the Soekarno Hatta Airport is expected to reach the capacity limit by 2015. 4) Sea and Inland Waterways Transportation Situation For Indonesia, as the world's largest archipelagic nation made up of 17,500 islands, sea transportation can be said to be an indispensable transportation means. Sea transportation has large advantages vis‐a‐vis air transportation which has common function of linking two points directly. The passenger numbers of domestic passengers carried on sea transportation declined approximately by 40% from 8.4 million in 2003 to 5.1 million in 2007, it is believed that this was due to the shift of passengers to fare discounted air transport. 3. Railway Services in Indonesia There are currently four unconnected railway systems in Indonesia, one in Java Island, and three in Sumatra Island, consisting more than 6,900 kms track and around 4,800 kms is in operation. Railway network of 1067 mm (3' 6") gauge that existed in Indonesia generally were the ones that were built during the Netherlands Colonial era (1864). In the recent years the Indonesian railway has faced tough challenges. There are a number of types of rails used for railway tracks with the maximum design speed of 120 km/hr, but the high maintenance costs, aged conditions and safety purpose caused the maximum operational speed to be reduced to less than 100 km/hr. The railway networks also have limited carriage capacity due to limited axle load of 15 ton in Java and 18 ton in Sumatera. The availability and reliability of service are low, due to backlog of maintenance and lack of spare parts both of infrastructure and rolling stock. The railway required subsidies to keep operations, many lines could not be run at a profit, obtaining sufficient spare parts for rolling stock and infrastructure that was concerned as a major problem in Indonesia.
High Speed Train Project in Indonesia
(Jakarta ‐ Surabaya Corridor) 5
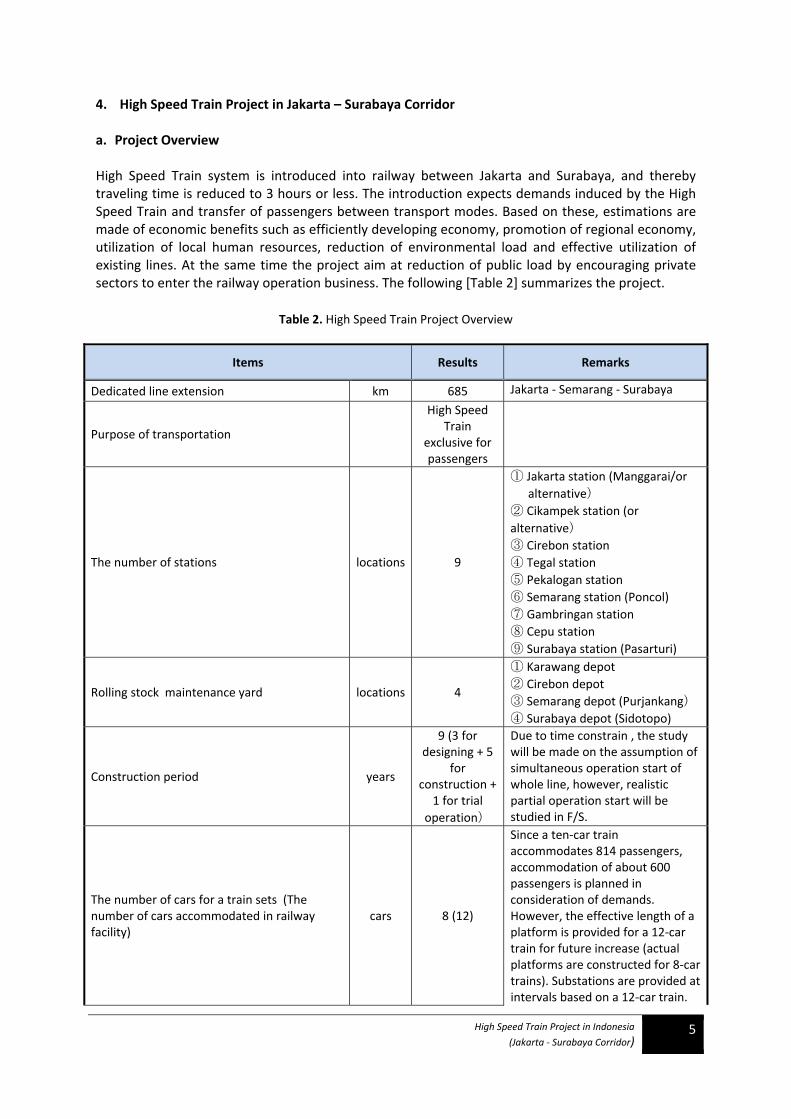
4. High Speed Train Project in Jakarta – Surabaya Corridor a. Project Overview High Speed Train system is introduced into railway between Jakarta and Surabaya, and thereby traveling time is reduced to 3 hours or less. The introduction expects demands induced by the High Speed Train and transfer of passengers between transport modes. Based on these, estimations are made of economic benefits such as efficiently developing economy, promotion of regional economy, utilization of local human resources, reduction of environmental load and effective utilization of existing lines. At the same time the project aim at reduction of public load by encouraging private sectors to enter the railway operation business. The following [Table 2] summarizes the project.
Table 2. High Speed Train Project Overview
Items Results Remarks
Dedicated line extension km 685 Jakarta ‐ Semarang ‐ Surabaya
Purpose of transportation
High Speed Train
exclusive for passengers
The number of stations locations 9
① Jakarta station (Manggarai/or alternative)
② Cikampek station (or alternative) ③ Cirebon station ④ Tegal station ⑤ Pekalogan station ⑥ Semarang station (Poncol) ⑦ Gambringan station ⑧ Cepu station ⑨ Surabaya station (Pasarturi)
Rolling stock maintenance yard locations 4
① Karawang depot ② Cirebon depot ③ Semarang depot (Purjankang) ④ Surabaya depot (Sidotopo)
Construction period years
9 (3 for designing + 5
for construction +
1 for trial operation)
Due to time constrain , the study will be made on the assumption of simultaneous operation start of whole line, however, realistic partial operation start will be studied in F/S.
The number of cars for a train sets (The number of cars accommodated in railway facility)
cars 8 (12)
Since a ten‐car train accommodates 814 passengers, accommodation of about 600 passengers is planned in consideration of demands. However, the effective length of a platform is provided for a 12‐car train for future increase (actual platforms are constructed for 8‐car trains). Substations are provided at intervals based on a 12‐car train.
High Speed Train Project in Indonesia
(Jakarta ‐ Surabaya Corridor) 6
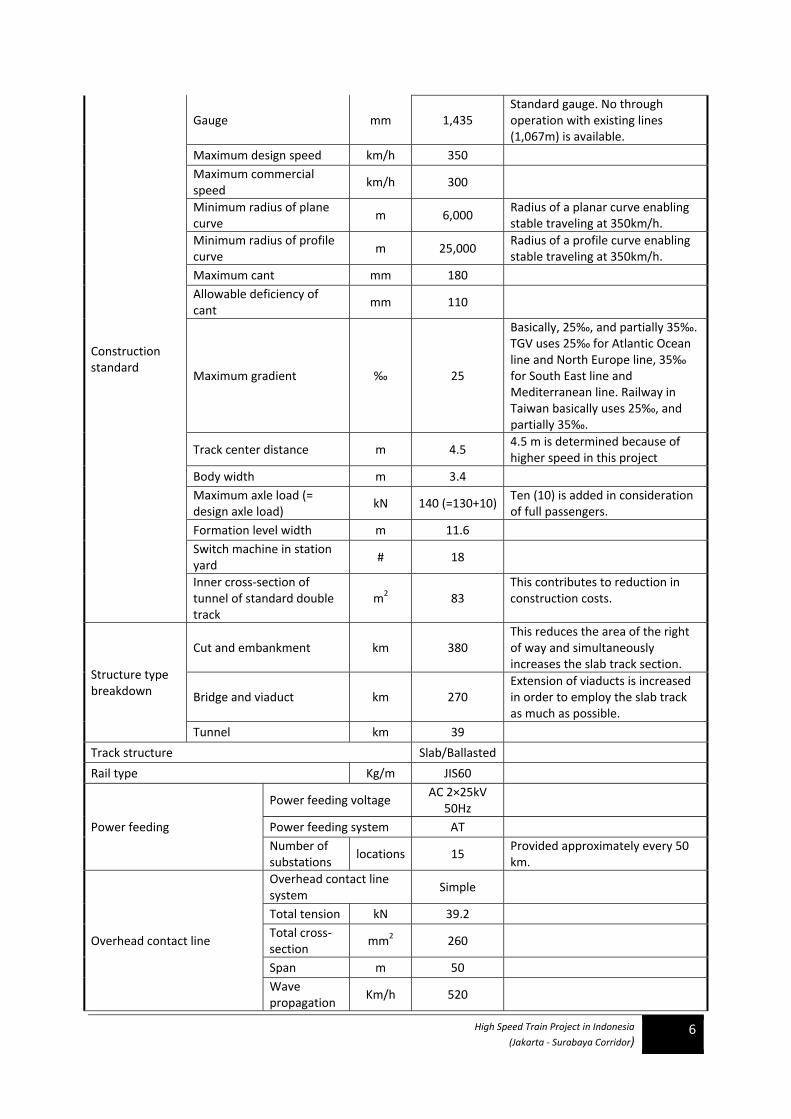
Construction standard
Gauge mm 1,435 Standard gauge. No through operation with existing lines (1,067m) is available.
Maximum design speed km/h 350 Maximum commercial speed
km/h 300
Minimum radius of plane curve
m 6,000 Radius of a planar curve enabling stable traveling at 350km/h.
Minimum radius of profile curve
m 25,000 Radius of a profile curve enabling stable traveling at 350km/h.
Maximum cant mm 180 Allowable deficiency of cant
mm 110
Maximum gradient ‰ 25
Basically, 25‰, and partially 35‰. TGV uses 25‰ for Atlantic Ocean line and North Europe line, 35‰ for South East line and Mediterranean line. Railway in Taiwan basically uses 25‰, and partially 35‰.
Track center distance m 4.5 4.5 m is determined because of higher speed in this project
Body width m 3.4 Maximum axle load (= design axle load)
kN 140 (=130+10)Ten (10) is added in consideration of full passengers.
Formation level width m 11.6 Switch machine in station yard
# 18
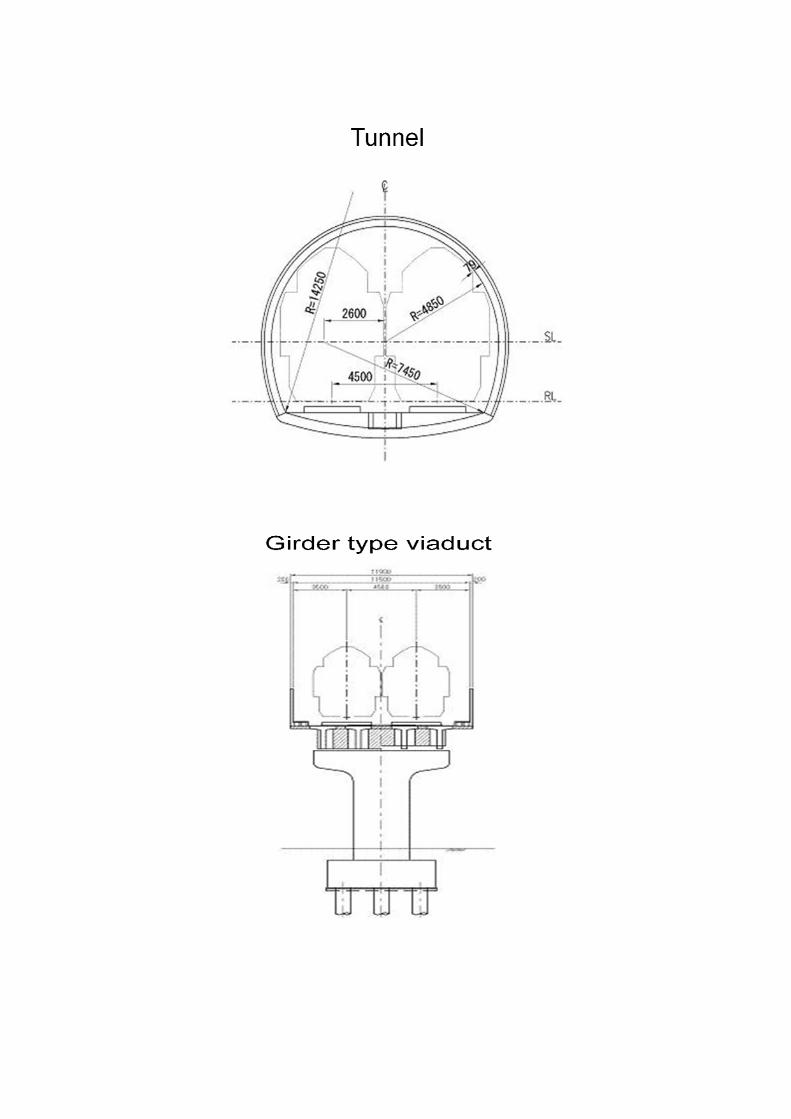
Inner cross‐section of tunnel of standard double track
m2 83 This contributes to reduction in construction costs.
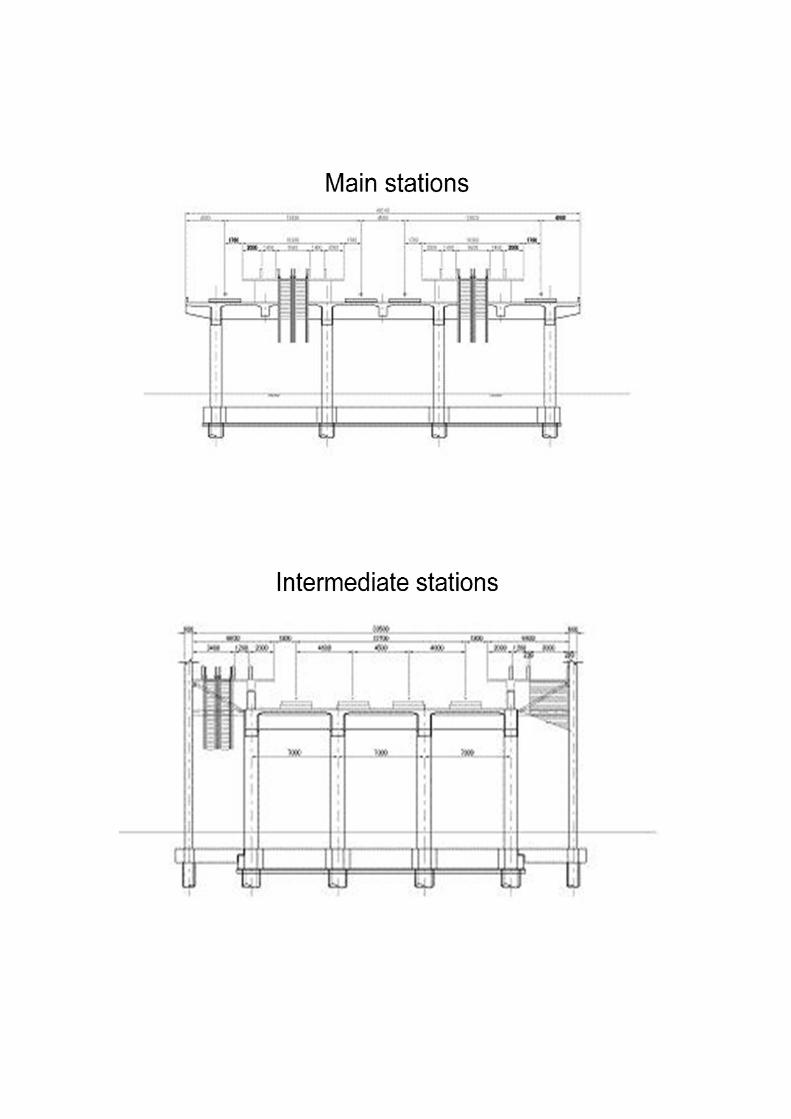
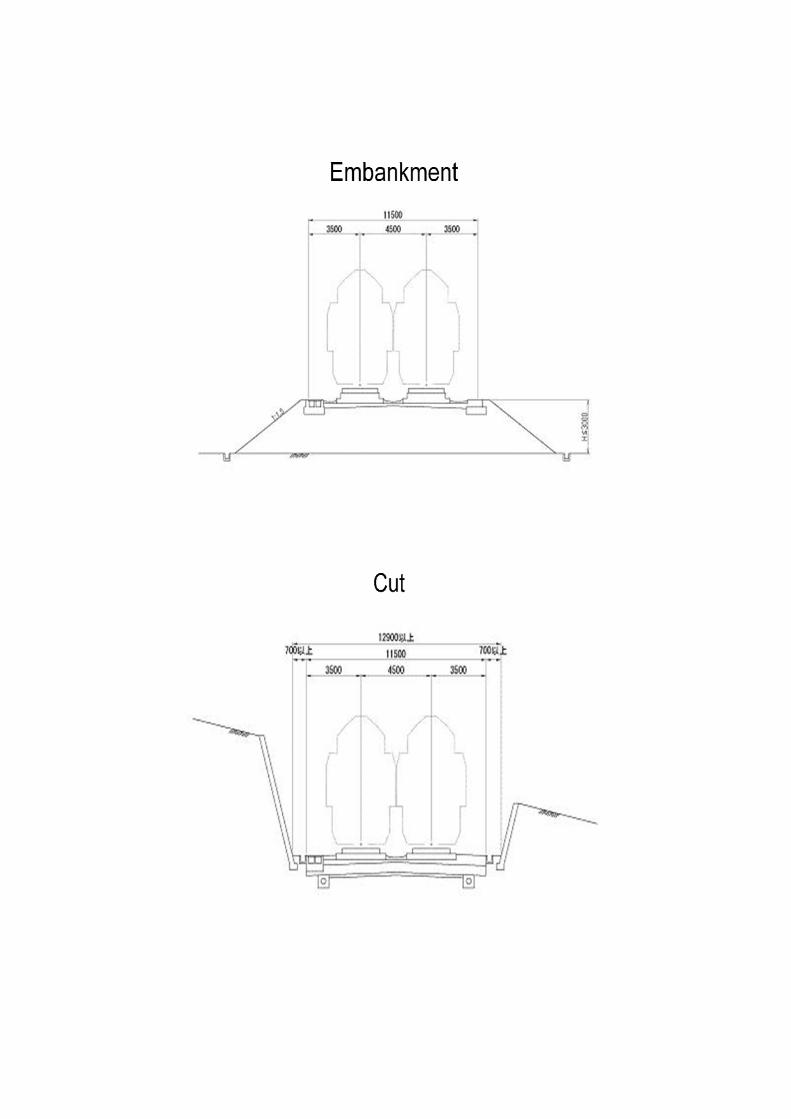
Structure type breakdown
Cut and embankment km 380 This reduces the area of the right of way and simultaneously increases the slab track section.
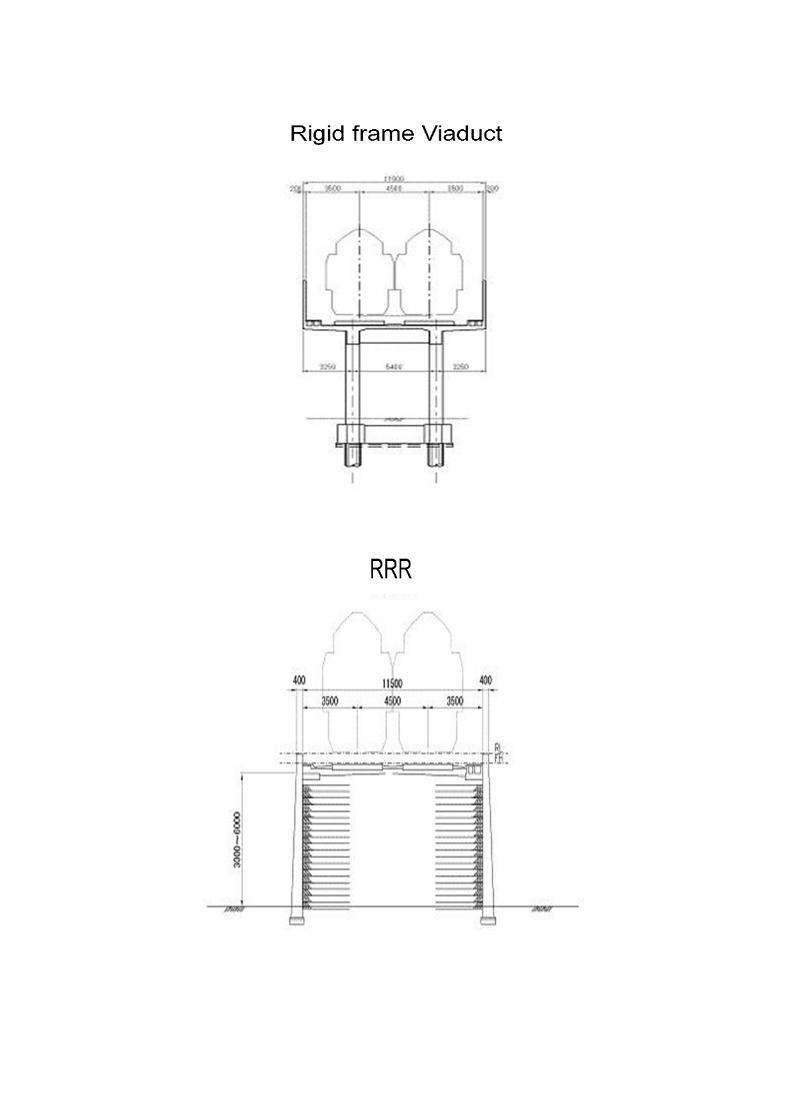
Bridge and viaduct km 270 Extension of viaducts is increased in order to employ the slab track as much as possible.
Tunnel km 39
Track structure Slab/Ballasted
Rail type Kg/m JIS60
Power feeding
Power feeding voltage AC 2×25kV
50Hz Power feeding system AT Number of substations
locations 15 Provided approximately every 50 km.
Overhead contact line
Overhead contact line system
Simple
Total tension kN 39.2 Total cross‐section
mm2 260
Span m 50 Wave propagation
Km/h 520
speed of contact wire
Signal
Signaling system Cab signal
Block system Automatic
block
Train control ATC single‐step brake
Pattern following system
Train detection Insulated
track circuit
Telecommunication/operation
Basic transmission
Digital transmission by optical cable
Ground‐train talk system Digital space
wave Reverse operation Not available
Tracking to existing lines Not available
Earthquake rapid alarm UrEDAS An urgent brake works at intensity 4 upper to stop power supply.
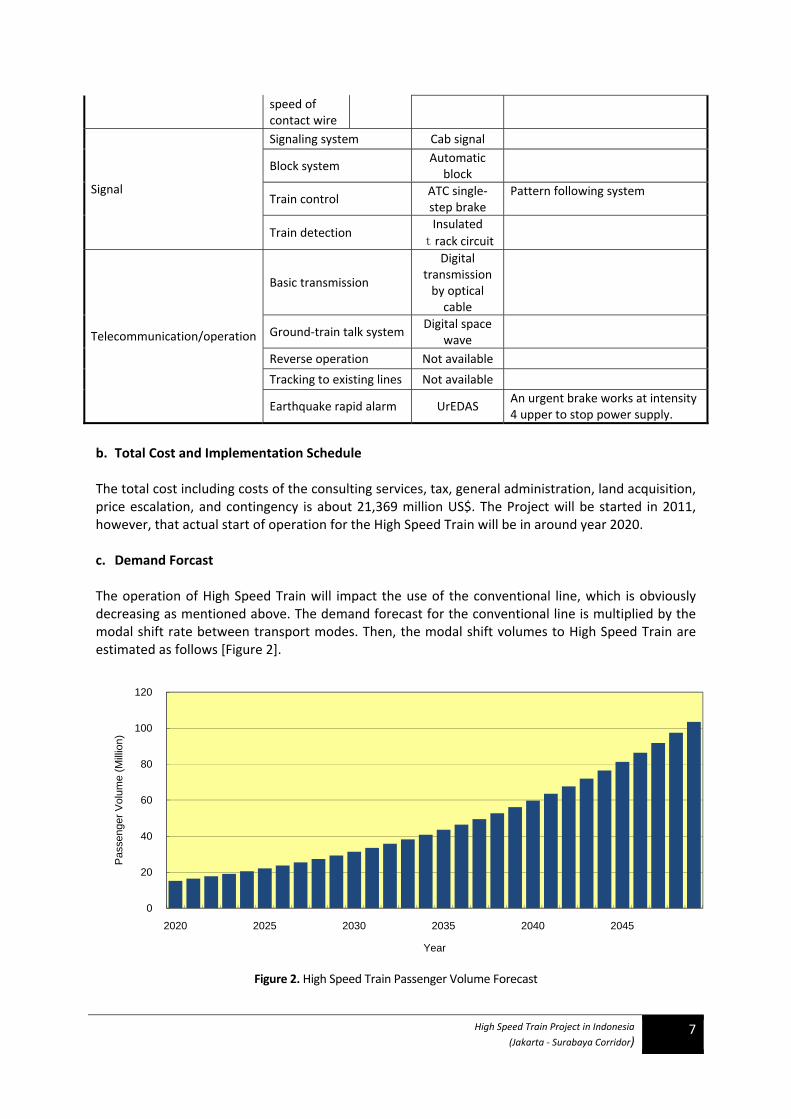
b. Total Cost and Implementation Schedule The total cost including costs of the consulting services, tax, general administration, land acquisition, price escalation, and contingency is about 21,369 million US$. The Project will be started in 2011, however, that actual start of operation for the High Speed Train will be in around year 2020. c. Demand Forcast The operation of High Speed Train will impact the use of the conventional line, which is obviously decreasing as mentioned above. The demand forecast for the conventional line is multiplied by the modal shift rate between transport modes. Then, the modal shift volumes to High Speed Train are estimated as follows [Figure 2].
Figure 2. High Speed Train Passenger Volume Forecast
0
20
40
60
80
100
120
2020 2025 2030 2035 2040 2045
Pas
seng
er V
olum
e (M
illio
n)
Year
High Speed Train Project in Indonesia
(Jakarta ‐ Surabaya Corridor) 7
High Speed Train Project in Indonesia
(Jakarta ‐ Surabaya Corridor) 8
. Financial and Economic Analysis
. Financial FIRR Analysis
itial investment cost was estimated at 26 billion US$ including risk inflation hedge on the basis of
. Economic IRR Analysis
ased on the financial cost, the economic cost was estimated at 18.5 billion US$, while transfer
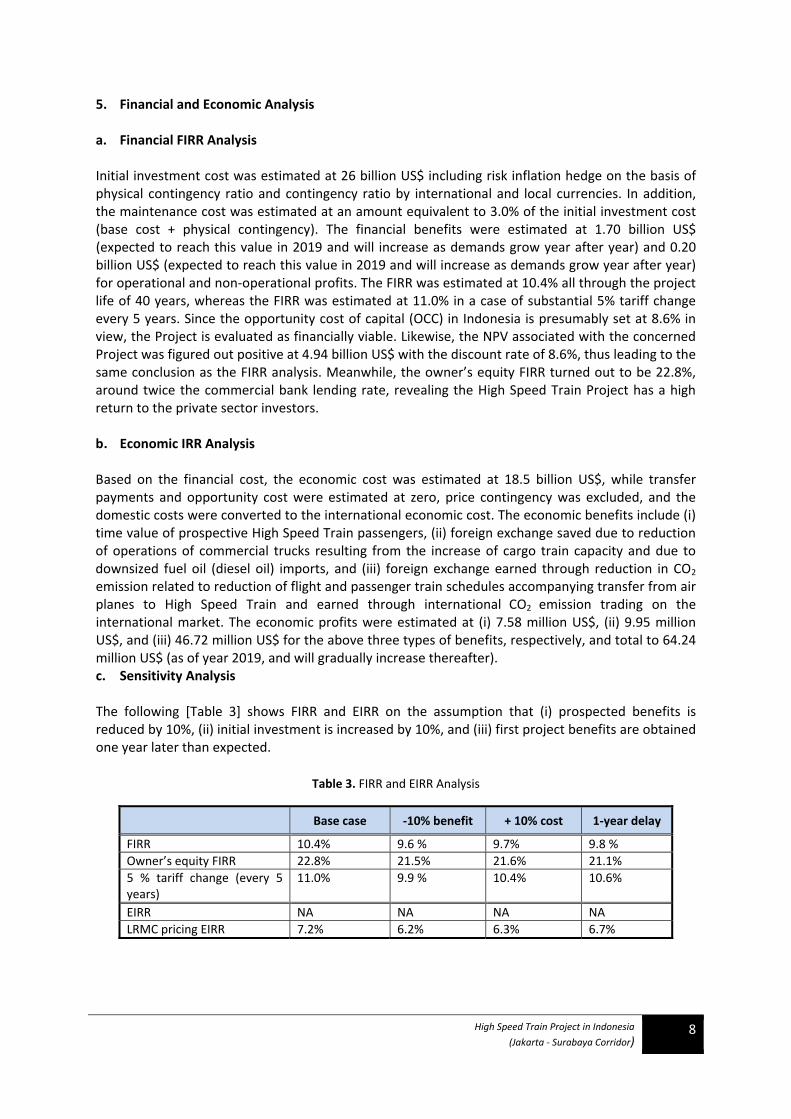
he following [Table 3] shows FIRR and EIRR on the assumption that (i) prospected benefits is
Table 3. FIRR and EIRR Analysis
5 a Inphysical contingency ratio and contingency ratio by international and local currencies. In addition, the maintenance cost was estimated at an amount equivalent to 3.0% of the initial investment cost (base cost + physical contingency). The financial benefits were estimated at 1.70 billion US$ (expected to reach this value in 2019 and will increase as demands grow year after year) and 0.20 billion US$ (expected to reach this value in 2019 and will increase as demands grow year after year) for operational and non‐operational profits. The FIRR was estimated at 10.4% all through the project life of 40 years, whereas the FIRR was estimated at 11.0% in a case of substantial 5% tariff change every 5 years. Since the opportunity cost of capital (OCC) in Indonesia is presumably set at 8.6% in view, the Project is evaluated as financially viable. Likewise, the NPV associated with the concerned Project was figured out positive at 4.94 billion US$ with the discount rate of 8.6%, thus leading to the same conclusion as the FIRR analysis. Meanwhile, the owner’s equity FIRR turned out to be 22.8%, around twice the commercial bank lending rate, revealing the High Speed Train Project has a high return to the private sector investors. b Bpayments and opportunity cost were estimated at zero, price contingency was excluded, and the domestic costs were converted to the international economic cost. The economic benefits include (i) time value of prospective High Speed Train passengers, (ii) foreign exchange saved due to reduction of operations of commercial trucks resulting from the increase of cargo train capacity and due to downsized fuel oil (diesel oil) imports, and (iii) foreign exchange earned through reduction in CO2
emission related to reduction of flight and passenger train schedules accompanying transfer from air planes to High Speed Train and earned through international CO2 emission trading on the international market. The economic profits were estimated at (i) 7.58 million US$, (ii) 9.95 million US$, and (iii) 46.72 million US$ for the above three types of benefits, respectively, and total to 64.24 million US$ (as of year 2019, and will gradually increase thereafter). c. Sensitivity Analysis Treduced by 10%, (ii) initial investment is increased by 10%, and (iii) first project benefits are obtained one year later than expected.
Base case ‐10% benefit + 10% cost 1‐year delay
FIRR 10. 9 9.4% .6 % 7% 9.8 % Owner’s equity FIRR 22.8% 21.5% 21.6% 21.1% 5 % tariff change (every 5 years)
11.0% 9.9 % 10.4% 10.6%
EIRR NA NA NA NA LRMC pricing EIRR 7.2% 6.2% 6.3% 6.7%
High Speed Train Project in Indonesia
(Jakarta ‐ Surabaya Corridor) 9
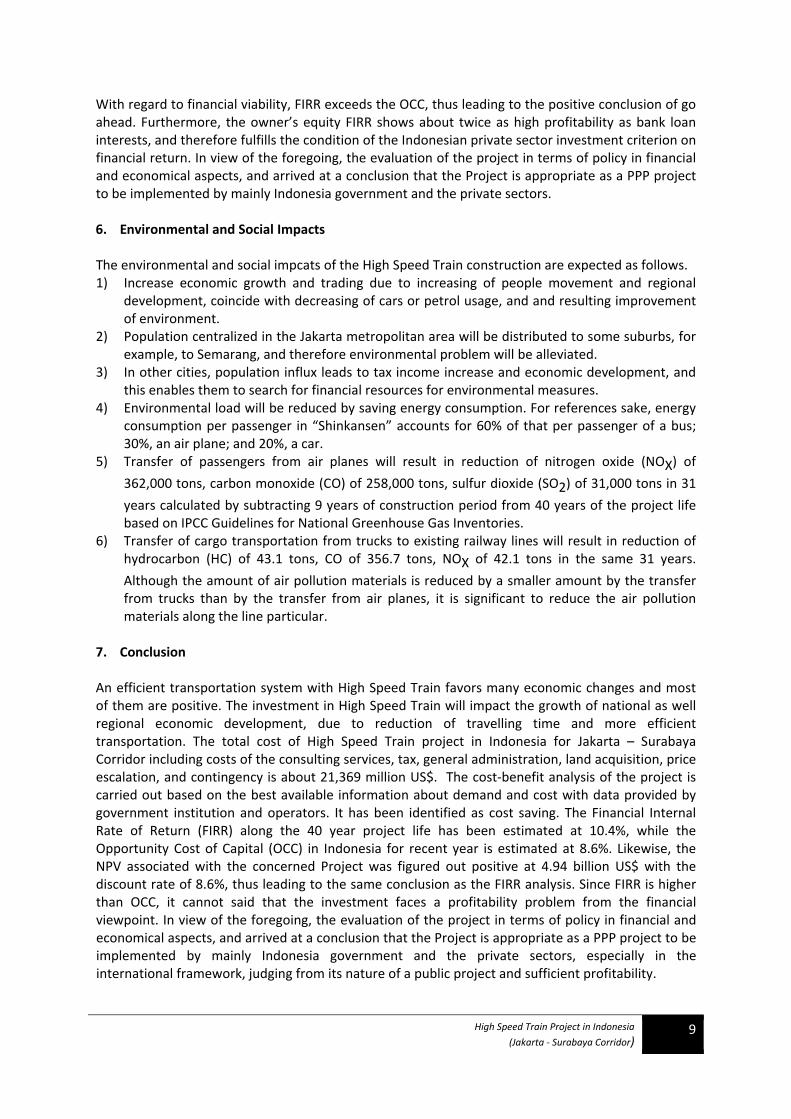
ith regard to financial viability, FIRR exceeds the OCC, thus leading to the positive conclusion of go
6. nvironmental and Social Impacts
he environmental and social impcats of the High Speed Train construction are expected as follows.
lized in the Jakarta metropolitan area will be distributed to some suburbs, for
elopment, and
es sake, energy
planes will result in reduction of nitrogen oxide (NOX) of
s will result in reduction of
7. nclusion
An ficient transportation system with High Speed Train favors many economic changes and most
r S
Wahead. Furthermore, the owner’s equity FIRR shows about twice as high profitability as bank loan interests, and therefore fulfills the condition of the Indonesian private sector investment criterion on financial return. In view of the foregoing, the evaluation of the project in terms of policy in financial and economical aspects, and arrived at a conclusion that the Project is appropriate as a PPP project to be implemented by mainly Indonesia government and the private sectors.
E
T1) Increase economic growth and trading due to increasing of people movement and regional
development, coincide with decreasing of cars or petrol usage, and and resulting improvement of environment.
2) Population centraexample, to Semarang, and therefore environmental problem will be alleviated.
3) In other cities, population influx leads to tax income increase and economic devthis enables them to search for financial resources for environmental measures.
4) Environmental load will be reduced by saving energy consumption. For referencconsumption per passenger in “Shinkansen” accounts for 60% of that per passenger of a bus; 30%, an air plane; and 20%, a car.
5) Transfer of passengers from air
362,000 tons, carbon monoxide (CO) of 258,000 tons, sulfur dioxide (SO2) of 31,000 tons in 31
years calculated by subtracting 9 years of construction period from 40 years of the project life based on IPCC Guidelines for National Greenhouse Gas Inventories.
6) Transfer of cargo transportation from trucks to existing railway linehydrocarbon (HC) of 43.1 tons, CO of 356.7 tons, NOX of 42.1 tons in the same 31 years.
Although the amount of air pollution materials is reduced by a smaller amount by the transfer from trucks than by the transfer from air planes, it is significant to reduce the air pollution materials along the line particular. Co ef
of them are positive. The investment in High Speed Train will impact the growth of national as well regional economic development, due to reduction of travelling time and more efficient transportation. The total cost of High Speed Train project in Indonesia fo Jakarta – urabaya Corridor including costs of the consulting services, tax, general administration, land acquisition, price escalation, and contingency is about 21,369 million US$. The cost‐benefit analysis of the project is carried out based on the best available information about demand and cost with data provided by government institution and operators. It has been identified as cost saving. The Financial Internal Rate of Return (FIRR) along the 40 year project life has been estimated at 10.4%, while the Opportunity Cost of Capital (OCC) in Indonesia for recent year is estimated at 8.6%. Likewise, the NPV associated with the concerned Project was figured out positive at 4.94 billion US$ with the discount rate of 8.6%, thus leading to the same conclusion as the FIRR analysis. Since FIRR is higher than OCC, it cannot said that the investment faces a profitability problem from the financial viewpoint. In view of the foregoing, the evaluation of the project in terms of policy in financial and economical aspects, and arrived at a conclusion that the Project is appropriate as a PPP project to be implemented by mainly Indonesia government and the private sectors, especially in the international framework, judging from its nature of a public project and sufficient profitability.

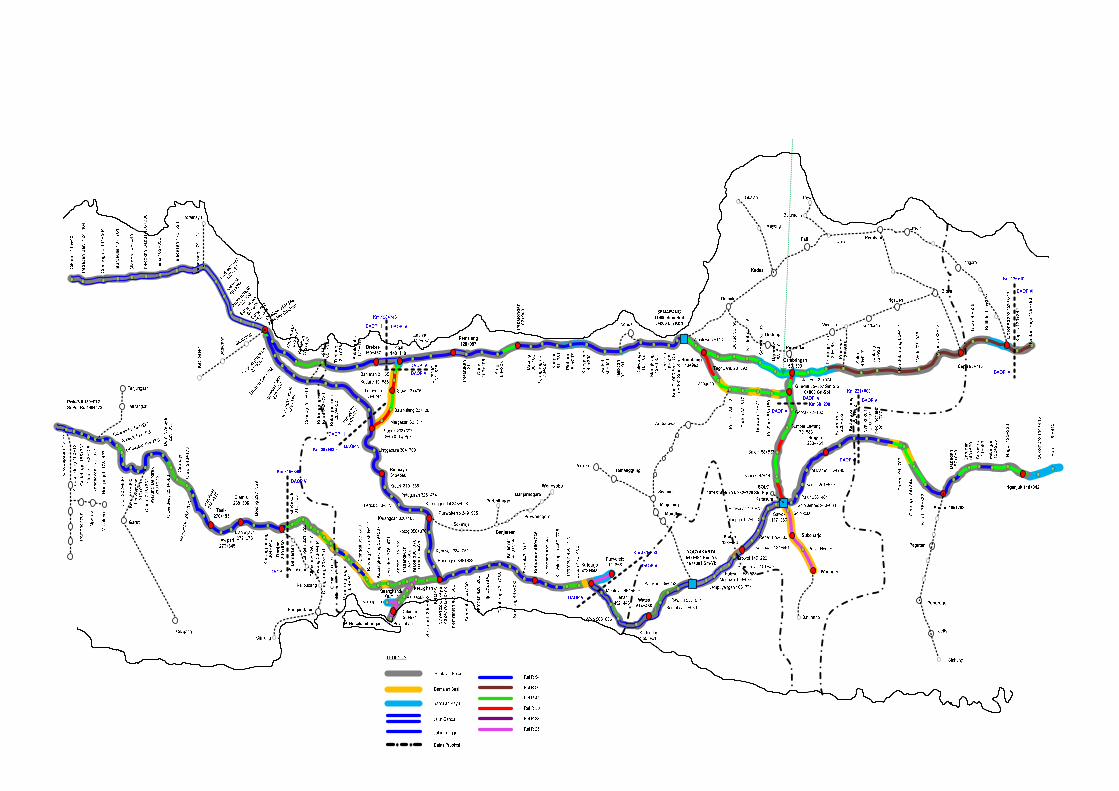
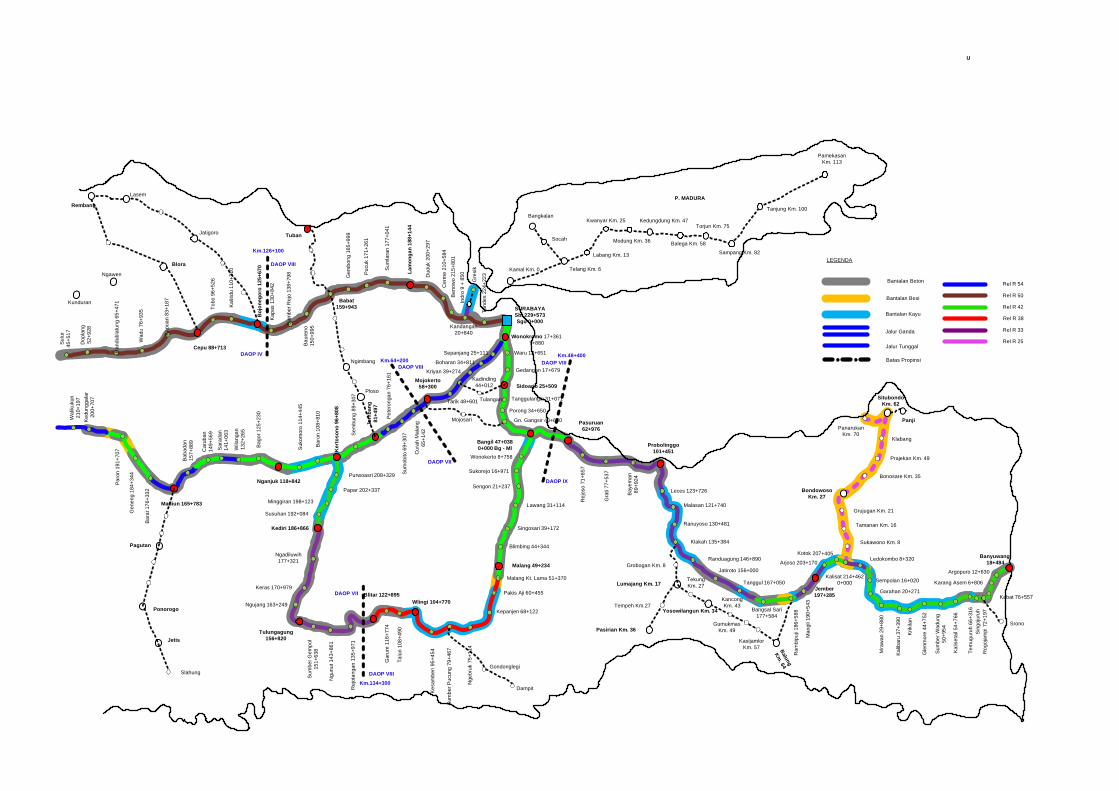
APPENDIX
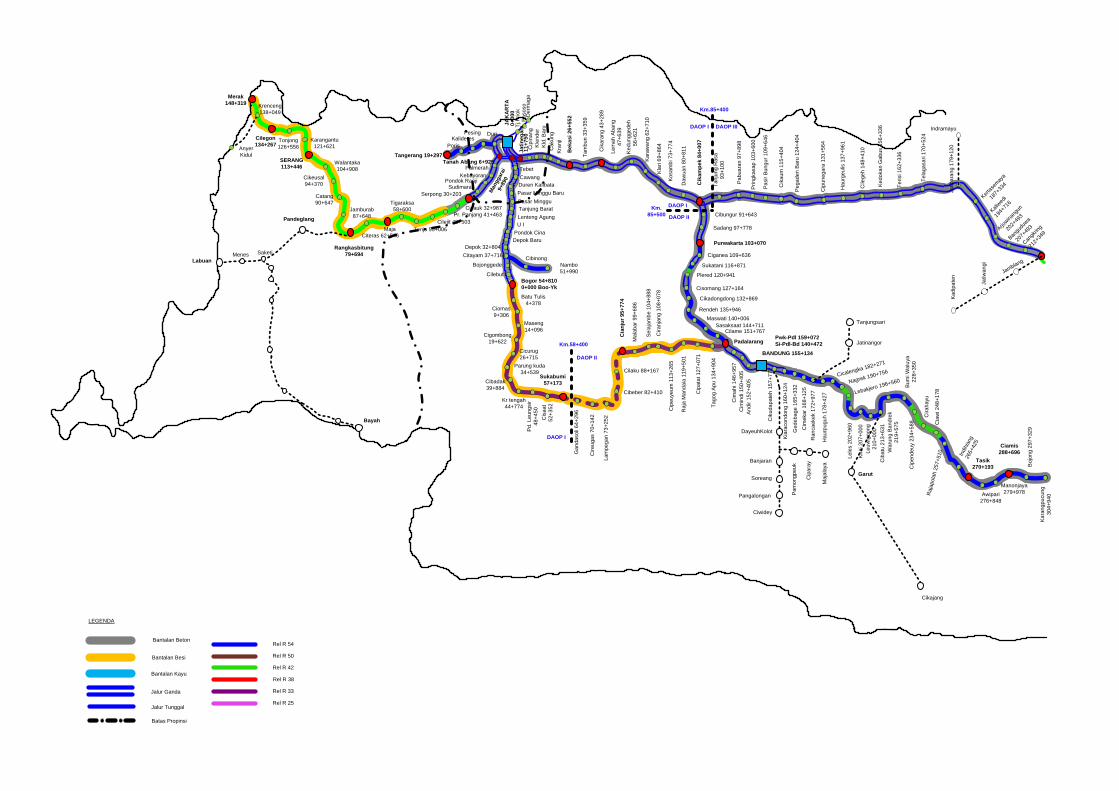
Existing Railway Map
Cilegon 134+267
SERANG 113+446
Rangkasbitung 79+694
Pandeglang
Tangerang 19+297
JAK
AR
TA
Bek
asi 2
6+55
2
Cik
aran
g 43
+289
Kar
awan
g 62
+710
Cik
ampe
k 84
+007
Purwakarta 103+070
Sukabumi 57+173
Bogor 54+8100+000 Boo-Yk
Cia
njur
95+
774
BANDUNG 155+134
Padalarang
Hau
rgeu
lis 1
37+9
61
Bayah
Cile
geh
148+
410
Kedo
kan
Gab
us 1
56+3
36
Teris
i 162
+336
Tela
gasa
ri 17
0+52
4
Tanj
ung
Ras
a 93
+100
Pab
uara
n 97
+898
Prin
gkas
ap 1
03+6
00
Cik
aum
115
+404
Pega
den
Baru
124
+404
Cip
uneg
ara
131+
564
Cibungur 91+643
Sadang 97+778
Ciganea 109+636
Plered 120+941
Sukatani 116+871
Cisomang 127+164
Cikadongdong 132+869
Rendeh 135+946Maswati 140+006
Sasaksaat 144+711Cilame 151+767C
iranj
ang
108+
078
Sela
jam
be 1
04+8
88
Mal
abar
99+
686
Tago
g A
pu 1
34+9
04
Cip
atat
127
+071
Raj
a M
anda
la 1
19+5
01
Cip
euye
um 1
13+2
65
Andi
r 152
+405
Cim
indi
150
+405
Cim
ahi 1
46+9
57
Cik
udap
ateh
157
+772
Kiar
acon
dong
160
+124
Ged
ebag
e 16
5+33
2
Cim
ekar
168
+125
Ran
caek
ek 1
72+9
77
Hau
rpug
uh 1
78+4
27
Cicalengka 182+271
Nagrek 190+756
Lebakjero 196+560
Lele
s 20
2+96
0
Knai
207
+000
Leuw
igoo
ng
210+
000
Cib
atu
213+
631
War
ung
Band
rek
219+
575
Bum
i Wal
uya
228+
350
Cip
ende
uy 2
34+5
88 Cia
wi 2
48+1
78Cibeber 82+410
Cilaku 88+167
Lam
pega
n 73
+252
Cire
ugas
70+
142
Gan
daso
li 64
+296
Daw
uan
80+8
11
Klar
i 69+
864
Kosa
mbi
73+
774
Ked
ungg
edeh
56
+621
Lem
ah A
bang
47
+639
Tam
bun
33+3
59
Maja 62+546
Serpong 30+203
Tanah Abang 6+925
0+00
0
Depok 32+804Citayam 37+716
Nambo 51+990
Cibinong
Man
ggar
ai
9+89
0
Merak 148+319
Tenjo 55+006
Cibadak 39+884
Cicurug 26+715
Parung kuda 34+539
Batu Tulis 4+378
Ciomas 9+306
Maseng 14+096
Cigombong 19+622
Kr tengah 44+774
Pd. L
eung
sir
48+4
50C
isaa
t 52
+352
Krenceng 138+049
Tonjong 126+556
Karangantu 121+621
Walantaka 104+908
Cikeusal 94+370
Catang 90+647
Jamburab 87+648
Labuan
Anyer Kidul
TebetCawangDuren KalibataPasar Minggu BaruPasar Minggu
Cilebut
Bojonggede
Depok BaruPondok Cina
U ILenteng AgungTanjung Barat
Raj
apol
ah 2
57+5
10
PalmerahKebayoran
Pondok RanjiSudimara
Cisauk 32+987Pr. Panjang 41+463
Cilejit 48+503
Tigaraksa 58+600
PesingKalideres
Poris
Citeras
Cip
inan
gK
lend
erKl
d. B
aru
Cak
ung
Kra
nji
Cira
hayu
Ciwidey
Pangalongan
Soreang
Banjaran
Pam
ongp
euk
Cip
aray
Maj
alay
a
DayeuhKolot
Tanjungsari
Jatinangor
Ciamis 288+696
Jatib
aran
g 17
9+12
0
Kertas
emay
a
187+
334
Kaliwed
i
194+
716
Arjowina
ngun
202+
493
Bangu
duwa
207+
493
Cangk
ring
212+
349
Tasik 270+193
Awipari 276+848
Manonjaya 279+978
Boj
ong
297+
329
Kara
ngpu
cung
30
4+94
0
Indi
hian
g 26
5+42
5
Kadi
pate
n
Duri
DAOP I
DAOP III
DAOP II
DAOP II
DAOP I
Km.58+400
Km.85+400
Km.85+500
DAOP I
11+
750
Indramayu
Garut
Cikajang
Bantalan Beton
Bantalan Besi
Bantalan Kayu
Rel R 54
Rel R 42
Rel R 50
Rel R 38
Rel R 25
Rel R 33
LEGENDA
Jalur Ganda
Jalur Tunggal
Batas Propinsi
SaketiMenes
Jamblang
Jatiw
angi
Tj.P
riok
Der
mag
aP
asos
o
Pwk-Pdl 159+072Si-Pdl-Bd 140+472
Pasi
r Bun
gur 1
09+6
46
Jatin
egar
a
SURABAYASbi 229+573Sgu 0+000
Jember 197+285
Ram
bipu
ji 18
6+58
8
Man
gli 1
90+5
43
Banyuwangi 18+484
Kalib
aru
37+3
90
Gle
nmor
e 44
+752
Rog
ojam
pi 7
2+19
7
Leces 123+726
Klakah 135+384
Lawang 31+114
Singosari 39+172
Kepanjen 68+122
Rej
otan
gan
135+
971
Ker
toso
no 9
6+80
8
Car
uban
14
9+56
9
Ran
dubl
atun
g 65
+471
Wad
u 76
+935
Kap
uan
83+1
87
Kalit
idu
110+
310
Tobo
96+
526
Cepu 88+713
Kap
as 1
30+8
42
Boj
oneg
oro
125+
670
Sum
ber R
ejo
138+
798
Baur
eno
150+
995
Babat 159+943
Gem
bong
165
+999
Pucu
k 17
1+26
1
Sum
lara
n 17
7+04
1
Lam
onga
n 18
8+14
4
Dud
uk 2
00+2
97
Cer
me
210+
584
Kandangan20+840
Tand
es 2
24+2
23
Wonokromo 17+3617+880
Waru 13+651
Gedangan 17+679
Sidoarjo 25+509
Tanggulangin 31+071
Porong 34+650
Gn. Gangsir 40+650
Sepanjang 25+111
Boharan 34+811
Kriyan 39+274Kadinding 44+012
Tarik 48+601
Mojokerto 58+300
MojosariC
urah
Mal
ang
65+1
42
Bangil 47+0380+000 Bg - Ml
Wonokerto 8+758
Sukorejo 16+971
Sengon 21+237
Blimbing 44+344
Malang 49+234
Malang Kt. Lama 51+370
Pakis Aji 60+455
Wlingi 104+770
Nge
bruk
75+
114
Talu
n 10
8+49
0
Sum
ber P
ucun
g 79
+467
Kesa
mbe
n 95
+454
Gar
um 1
16+7
74
Blitar 122+895
Ngu
nut 1
43+8
61
Sum
ber G
empo
l 15
1+63
8
Tulungagung 156+820
Ngujang 163+249
Keras 170+979
Ngadiluwih 177+321
Kediri 186+866
Susuhan 192+084
Minggiran 198+123
Papar 202+337
Purwoasri 208+329
Sem
bung
89+
307
Jom
bang
81
+497
Pete
rong
an 7
6+16
1
Sum
obito
69+
307
Bar
on 1
08+8
10
Suk
omor
o 11
4+44
5
Nganjuk 118+842
Bag
or 1
25+2
30
Wila
ngan
13
2+26
5
Sar
adan
14
1+06
3
Bab
adan
15
7+88
9
Madiun 165+783
Bar
at 1
76+3
32
Gen
eng
184+
344
Paro
n 19
1+70
7
Pasuruan 62+976
Probolinggo 101+451
Rej
oso
71+8
57
Gra
ti 77
+537
Bay
eman
89
+924
Malasan 121+740
Ranuyoso 130+481
Randuagung 146+890
Jatiroto 156+000
Tanggul 167+050
Bangsal Sari 177+584
Arjoso 203+170
Kotok 207+405Ledokombo 8+320
Garahan 20+271
Mra
wan
29+
880
Sum
ber W
adun
g 50
+954
Kal
iset
ail 5
4+76
6
Tem
ugur
uh 6
6+31
6
Tuban
Lumajang Km. 17
BondowosoKm. 27
SitubondoKm. 62
PanarukanKm. 70
Argopuro 12+630
Karang Asem 6+806
P. MADURA
Ben
owo
215+
801
Lasem
Wal
ikuk
un
210+
197
Ked
ungg
alar
20
0+70
7
Sulu
r 45
+517
Dop
lang
52
+928
Rembang
DAOP VII
DAOP VIII
DAOP VII
DAOP VIII
DAOP IV
DAOP VIII
DAOP IX
DAOP VIIIKm.48+400
Km.126+100
Km.64+200
Km.134+300
Kamal Km. 0
Bangkalan
Socah
Telang Km. 6
Labang Km. 13
Kwanyar Km. 25
Balega Km. 58Modung Km. 36
Torjun Km. 75
Tanjung Km. 100
PamekasanKm. 113
Panji
Pasirian Km. 36
Balung
Km. 64
Srono
Gondonglegi
Dampit
Ponorogo
Slahung
Blora
Ngawen
Kunduran
Gre
sik
Tulangan
Sampang Km. 82
Krik
ilan
Sin
goju
ruh
Kabat 76+557
Jatigoro
Ngimbang
Ploso
Pagutan
Jetis
Yosowilangun Km. 34
Sukawono Km. 8
Tamanan Km. 16
Grujugan Km. 21
Bonosare Km. 35
Prajekan Km. 49
Kedungdung Km. 47
Grobogan Km. 8
Tempeh Km.27
Tekung Km. 27
KancongKm. 43
GumukmasKm. 49
KasijamlorKm. 57
Klabang
Indr
o 9
+ 85
0
Bantalan Beton
Bantalan Besi
Bantalan Kayu
Rel R 54
Rel R 42
Rel R 50
Rel R 38
Rel R 25
Rel R 33
LEGENDA
Jalur Ganda
Jalur Tunggal
Batas Propinsi
U
Sempolan 16+020Kalisat 214+462
0+000
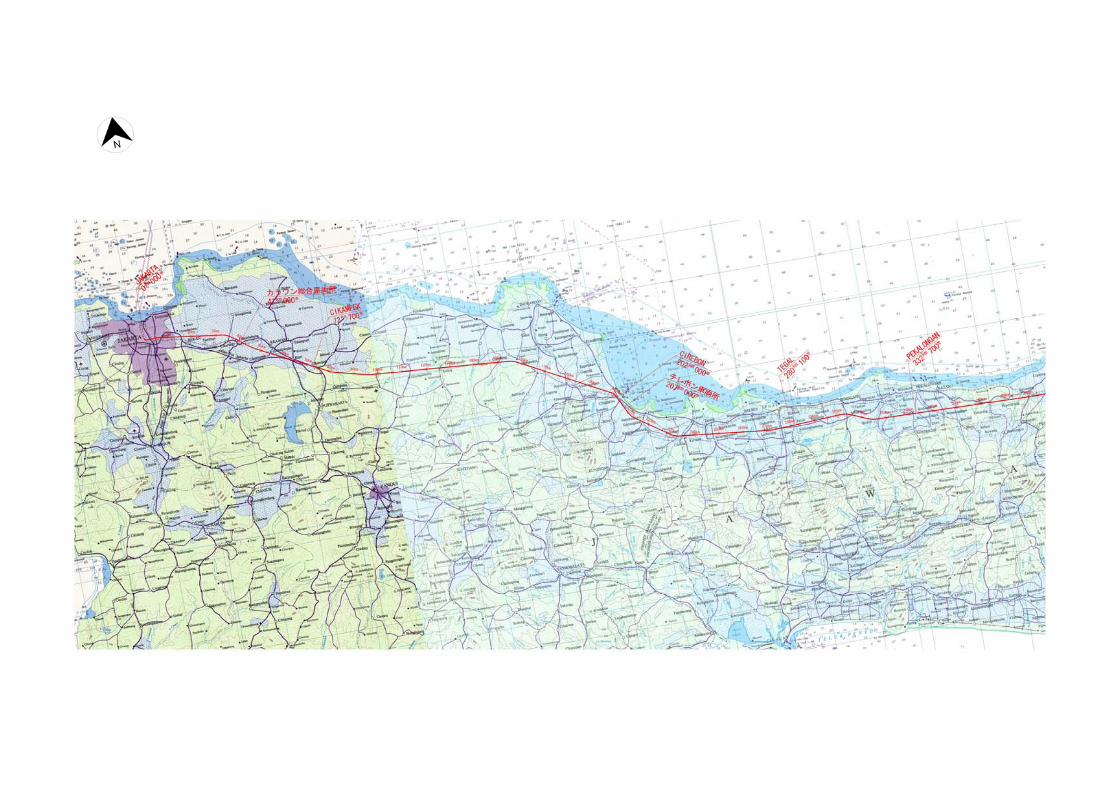
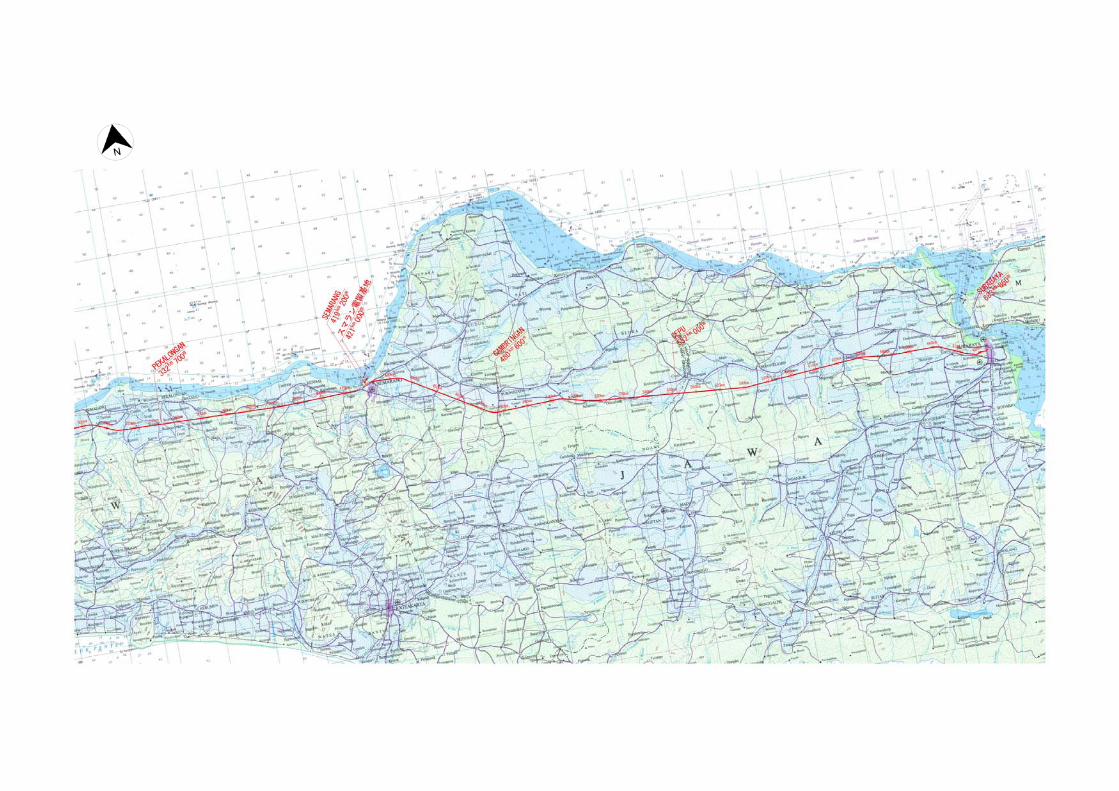
High Speed Train Map
(Jakarta – Surabaya Corridor)

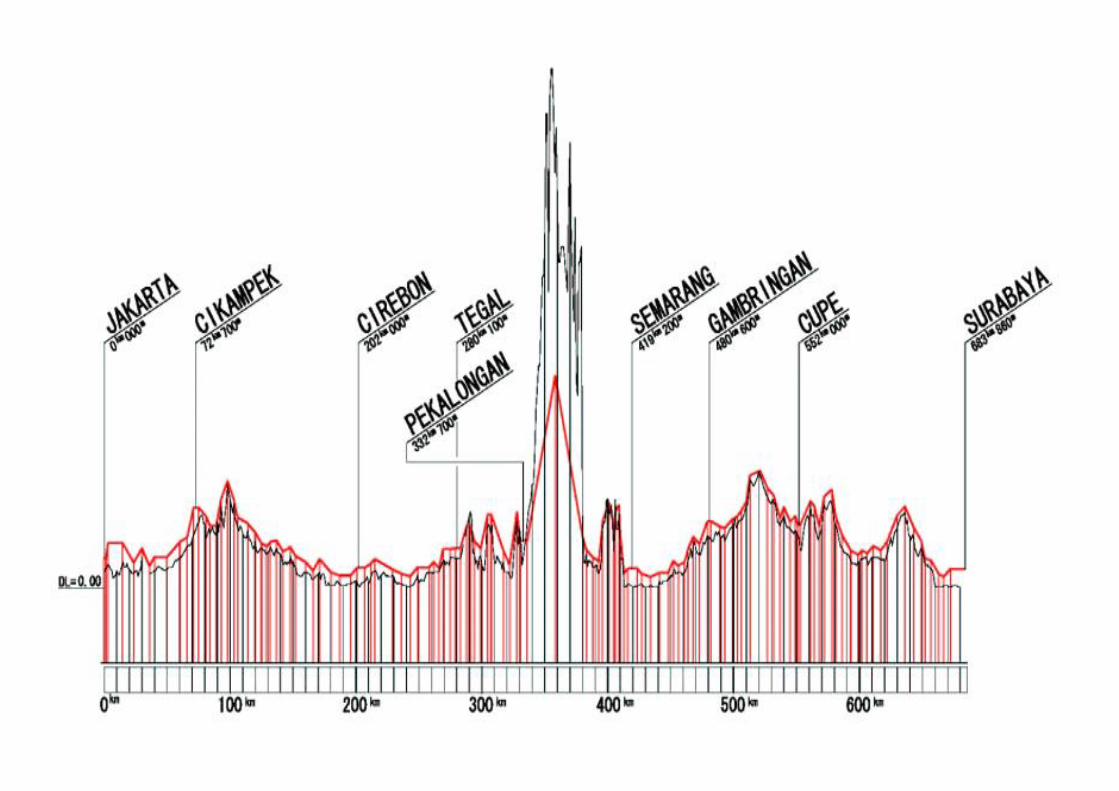
Route Profile
Cross Section of Structures