interpreting graphs aims math blitz – spring, 2008
TRANSCRIPT

Interpreting GraphsAIMS Math Blitz – Spring, 2008

Period 1Recreational Activities in Allentown
0 2000 4000 6000
Swimming
Reading
Bowling
Baseball
Movies
Live Theater
Tennis
People Per Month
1. What type of graph is shown?2. Estimate the number of people participating in each activity. 3. Which two activities are done by the most people per month?4. Which two activities are done by the fewest people per month?5. Which activity is more popular?
a. baseball or bowling b. reading or tennis c. swimming or bowling d. movies or reading

Period 2 Composition of One Year's Waste in the U.S.
metal10%
glass9%
paper40%
yard waste17%
food9%
furniture6%
plastic7%
cans2%
1. Which category of waste is the largest?
2. Which category of waste is the smallest?
3. If the total waste for a year is 200 tons, how many tons would be made up of each type?
4. What percentage of the total year’s waste comes from…
a.glass, metal & plastic?
b.furniture, cans, and metal?
c.paper, food, and plastic?
d.glass and metal? Percentage is by weight.

Period 3
1. What is the total spent on pet items?2. What is the mean of the 3 amounts?3. How much more is spent on food than
veterinary care?4. How much less is spent on veterinary care
than supplies and medicine?

Period 41. What type of graph is shown?
2. Estimate the number of pets registered for each year.
3. When was the maximum number of registrations done?
4. When was the minimum number of pets registered?
5. What is the range of pet registered?
6. What is the mean of the number of pets registered shown?
7. What is the median of the number of pets registered?
8. What is the mode of the number of pets registered?
Number of Pets Registered
0
50
100
150
2003 2004 2005 2006 2007
Year
Nu
mb
er o
f P
ets

Period 5Annual Rainfall
42.645.7
28.126.3
51.5
0
10
20
30
40
50
60
1 2 3 4 5
Rai
nfa
ll in
Inch
es
2002 2003 2004 2005 2006
1. What is the maximum rainfall and in what year did it occur?
2. What is the minimum rainfall and in what year did it occur?
3. Between which two years did the amount of rainfall decrease the most?
4. Between which two years did the amount of rainfall increase the most?

Period 6
0
200
400
600
800
1000
1200
1188
Professional degree
Master's degree
Bachelor's degree
Assoc iate degree
Postsecondaryvocational training
High School Graduate,no college
No High SchoolDiploma
Median Weekly Income (in dollars) by Educational Level Attained - 2004
1. Estimate the weekly amount earned by each level of education.
2. Between which two levels is the difference greatest?
3. Between which two levels is the difference the least?
4. What is the range of incomes?
5. If a person works 40 years, what will be the lifetime difference between having no high school diploma and having a bachelor’s degree?

Period 1ANSWERS
Recreational Activities in Allentown
0 2000 4000 6000
Swimming
Reading
Bowling
Baseball
Movies
Live Theater
Tennis
People Per Month
1. What type of graph is shown? Bar graph2. Estimate the number of people participating in each activity. Tennis ≈ 1,500 Live Theatre ≈ 2,000 Movies ≈ 5,000
Baseball ≈ 3,000 Bowling ≈ 2,500 Reading ≈ 4,000Swimming ≈ 3,000
3. Which two activities are done by the most people per month? Movies and Reading4. Which two activities are done by the fewest people per month? Tennis and Live Theatre5. Which activity is more popular?
a.baseball or bowling b. reading or tennis c. swimming or bowling d. movies or reading

Period 2ANSWERS Composition of One Year's Waste in the U.S.
metal10%
glass9%
paper40%
yard waste17%
food9%
furniture6%
plastic7%
cans2%
1. Which category of waste is the largest? Paper
2. Which category of waste is the smallest? Cans
3. If the total waste for a year is 200 tons, how many tons would be made up of each type?
Paper = 80 tons Yard waste = 34 tons Food = 18 tons Glass = 18 tons Metal = 20 tons Plastic = 14 tons Furniture = 12 tons Cans = 4 tons
4. What percentage of the total year’s waste comes from…
a. glass, metal & plastic? 26%
b. furniture, cans, and metal? 18%
c. paper, food, and plastic? 56%
d. glass and metal? 19%
Percentage is by weight.

Period 3ANSWERS
1. What is the total spent on pet items? $33.9 billion2. What is the mean of the 3 amounts? $11.3 billion3. How much more is spent on food than veterinary
care? $6.2 billion4. How much less is spent on veterinary care than
supplies and medicine? $100 million ($0.1 billion)
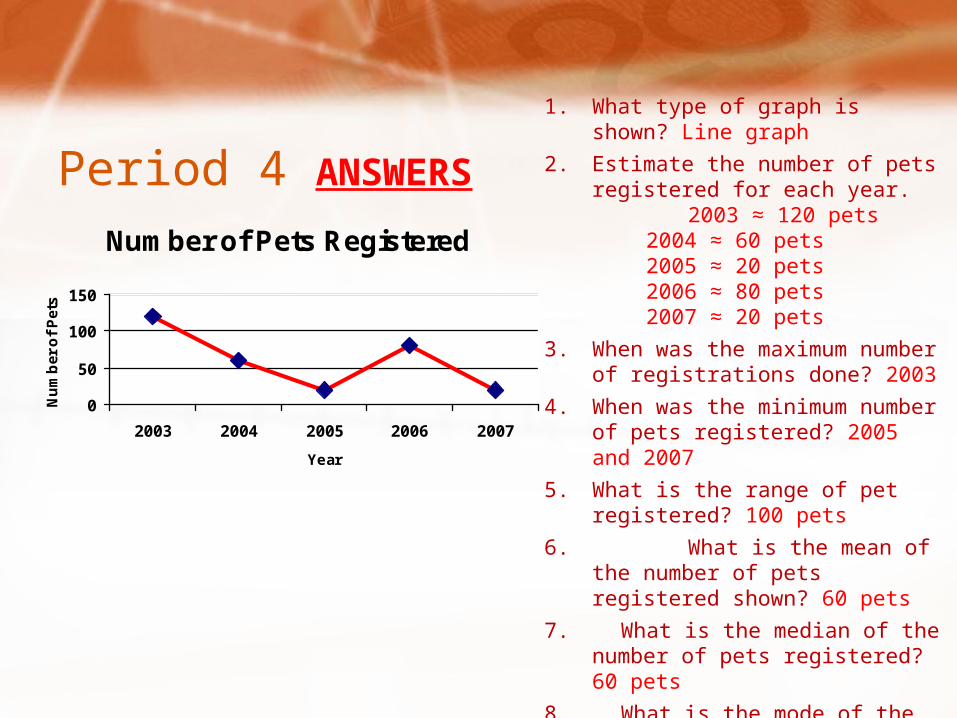
Period 4 ANSWERS
1. What type of graph is shown? Line graph
2. Estimate the number of pets registered for each year.
2003 ≈ 120 pets 2004 ≈ 60 pets 2005 ≈ 20 pets 2006 ≈ 80 pets 2007 ≈ 20 pets
3. When was the maximum number of registrations done? 2003
4. When was the minimum number of pets registered? 2005 and 2007
5. What is the range of pet registered? 100 pets
6. What is the mean of the number of pets registered shown? 60 pets
7. What is the median of the number of pets registered? 60 pets
8. What is the mode of the number of pets registered? 20 pets
Number of Pets Registered
0
50
100
150
2003 2004 2005 2006 2007
Year
Nu
mb
er o
f P
ets

Period 5Annual Rainfall
42.645.7
28.126.3
51.5
0
10
20
30
40
50
60
1 2 3 4 5
Rai
nfa
ll in
Inch
es
2002 2003 2004 2005 2006
1. What is the maximum rainfall and in what year did it occur? 51.5 inches, 2003
2. What is the minimum rainfall and in what year did it occur? 26.3 inches, 2005
3. Between which two years did the amount of rainfall decrease the most? 2004 and 2005
4. Between which two years did the amount of rainfall increase the most? 2002 and 2003

Period 6 ANSWERS
0
200
400
600
800
1000
1200
1188
Professional degree
Master's degree
Bachelor's degree
Assoc iate degree
Postsecondaryvocational training
High School Graduate,no college
No High SchoolDiploma
Median Weekly Income (in dollars) by Educational Level Attained - 2004
1. Estimate the weekly amount earned by each level of education.
Professional degree ≈ $1,050Master’s degree ≈ $950Bachelor’s degree ≈ $800Associate’s degree ≈ $600Postsecondary voc trning ≈ $550High Sch graduate,no col ≈ $500No High School diploma ≈ $350
2. Between which two levels is the difference greatest? Associate’s degree and Bachelor’s degree
3. Between which two levels is the difference the least? Associate’s degree, Postsecondary vocational training, and High School graduate, no college
4. What is the range of incomes? $700
5. If a person works 40 years, what will be the lifetime difference between having no high school diploma and having a bachelor’s degree? $936,000
1.