connecting the data: reading and interpreting graphs and tables
TRANSCRIPT
CONNECTING THE DATA: READING AND INTERPRETING GRAPHS AND TABLES
Presented by
Kenneth Fahndrick
CONNECTING THE DATA: READING AND INTERPRETING GRAPHS AND TABLES
Developing Data & Graph Literacy Agenda
Developing Data & Graph Literacy Agenda
Introductions and Ice Breakers
Developing Data & Graph Literacy Agenda
Introductions and Ice Breakers
Why Develop Data & Graph Literacy?
Approximately 50% of GED math test questions involve some kind of visual/graph, from which students must extract some information necessary for using to solving the math problem!
Developing Data & Graph Literacy Agenda
Introductions and Ice Breakers
Why Develop Data & Graph Literacy?
Approximately 50% of GED math test questions involve some kind of visual/graph, from which students must extract some information necessary for using to solving the math problem!
Construct, Interpret & Compare Graphs of Statistical Data
Objectives• Broaden Instructional Strategies
• Incorporate Real-World Materials
• Recognize and Understand Math Misconceptions of Today’s GED Student –Concepts, Rules, and Principles
• Provide Tools and Games for GED Math Teachers
– Actively Engage Students
– Provide Large and small Group Instruction
– Provide Hands On Learning Activities
Math Themes – Most Missed Questions
• Theme 1: Geometry and Measurement
• Theme 2: Applying Basic Math Principles to Calculation
• Theme 3: Reading and Interpreting Graphs and Tables
Why are Graphics Important?• Graphic aids are really designed to make the
information easier to read and understand.
• Visuals such as tables, charts, and graphs summarize information in a way that allows us to see it differently.
• Graphs and Data tables condense information from the text.
• Reading the graphics will actually save you time!
Words to Remember• Charts—a graphically representation of
numbers.
• Graphs—represent data visually to compare data from different sources, show change over time, and make projection about the future.
• Tables—organize information or data in columns and rows. (Specific information is found where the column and row) intersect
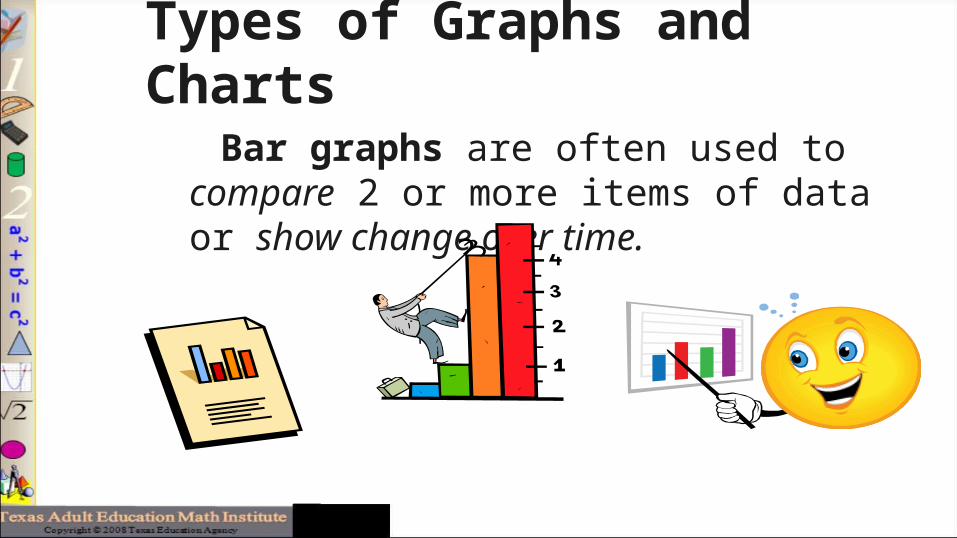
Types of Graphs and Charts
Bar graphs are often used to compare 2 or more items of data or show change over time.
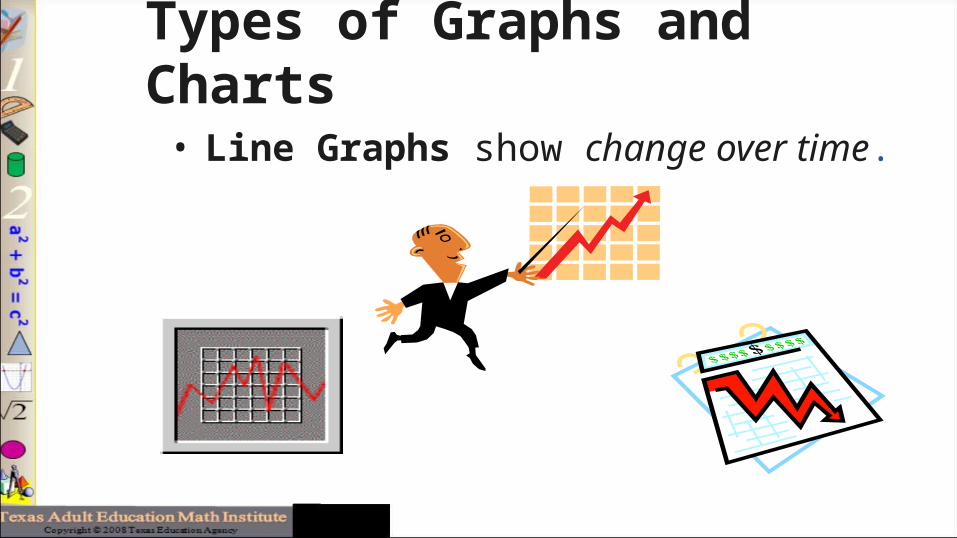
Types of Graphs and Charts
• Line Graphs show change over time.
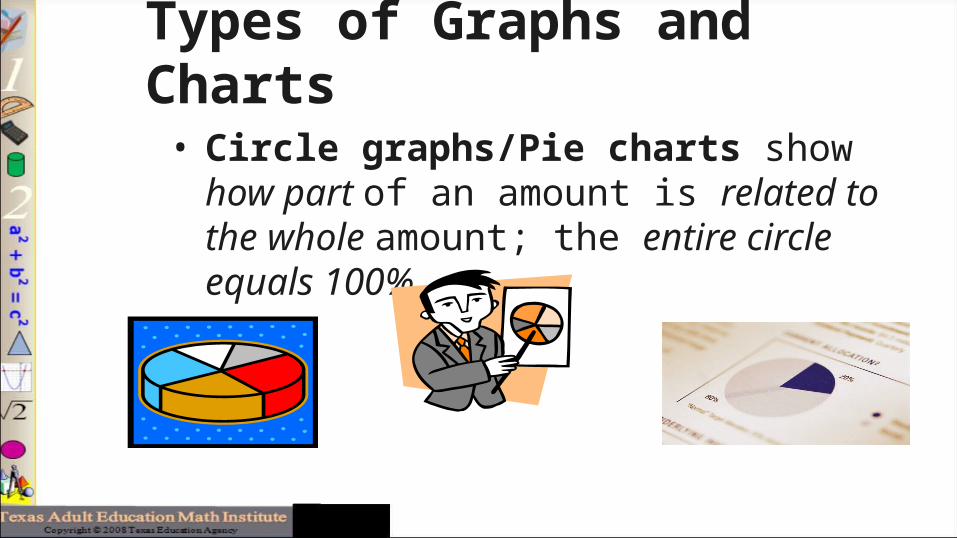
Types of Graphs and Charts
• Circle graphs/Pie charts show how part of an amount is related to the whole amount; the entire circle equals 100%
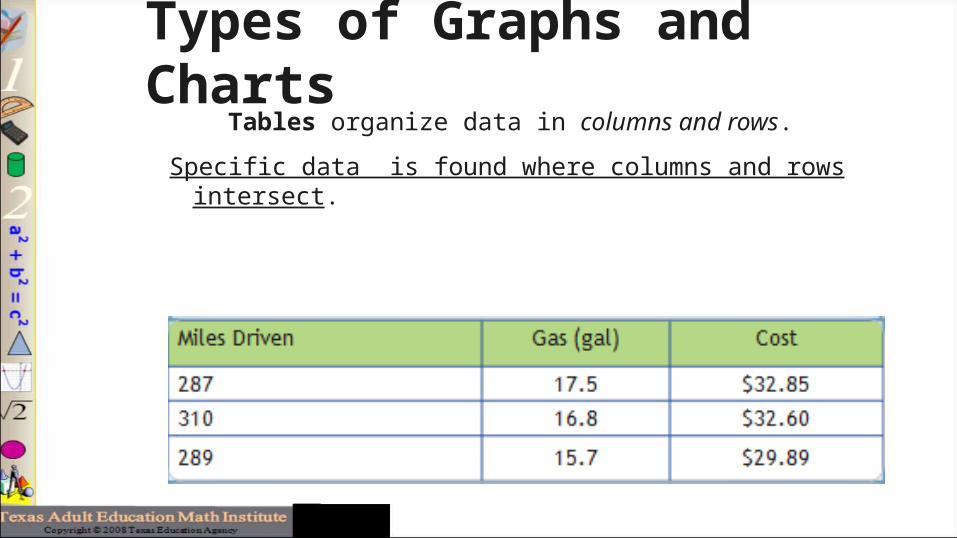
Types of Graphs and Charts Tables organize data in columns and rows.
Specific data is found where columns and rows intersect.
Types of Graphs and Charts
Types of Graphs and Charts
• Pictogram
Types of Graphs and Charts
• Pictogram
• Frequency table
Types of Graphs and Charts
• Pictogram
• Frequency table
• Scatter plots
Types of Graphs and Charts
• Pictogram
• Frequency table
• Scatter plots
• Line of best fit
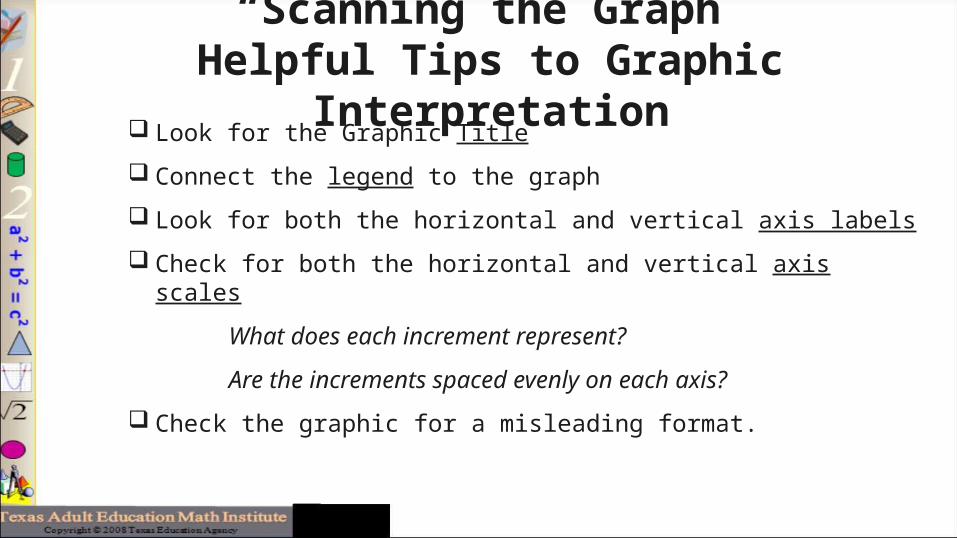
“Scanning the Graph”Helpful Tips to Graphic Interpretation Look for the Graphic Title
Connect the legend to the graph
Look for both the horizontal and vertical axis labels
Check for both the horizontal and vertical axis scales
What does each increment represent?
Are the increments spaced evenly on each axis?
Check the graphic for a misleading format.
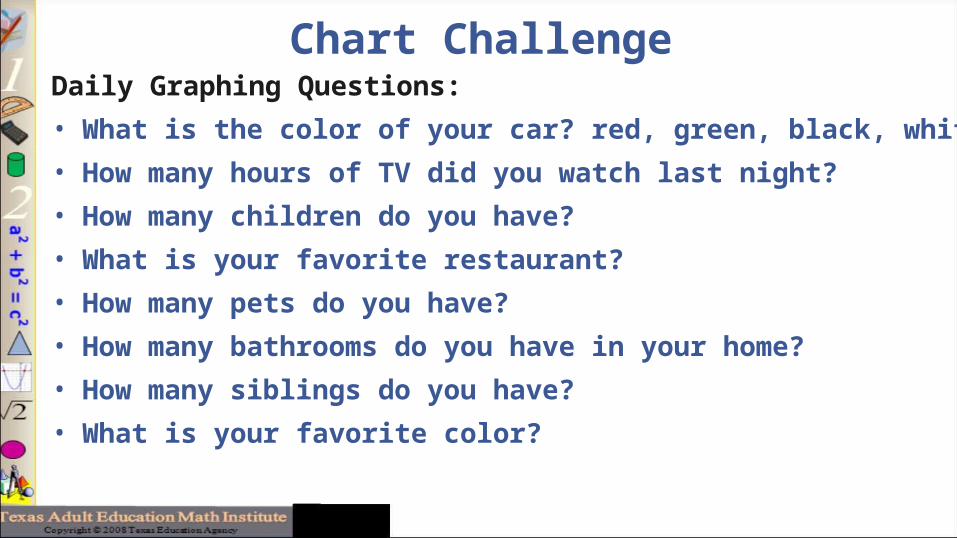
Chart ChallengeDaily Graphing Questions:
• What is the color of your car? red, green, black, white
• How many hours of TV did you watch last night?
• How many children do you have?
• What is your favorite restaurant?
• How many pets do you have?
• How many bathrooms do you have in your home?
• How many siblings do you have?
• What is your favorite color?
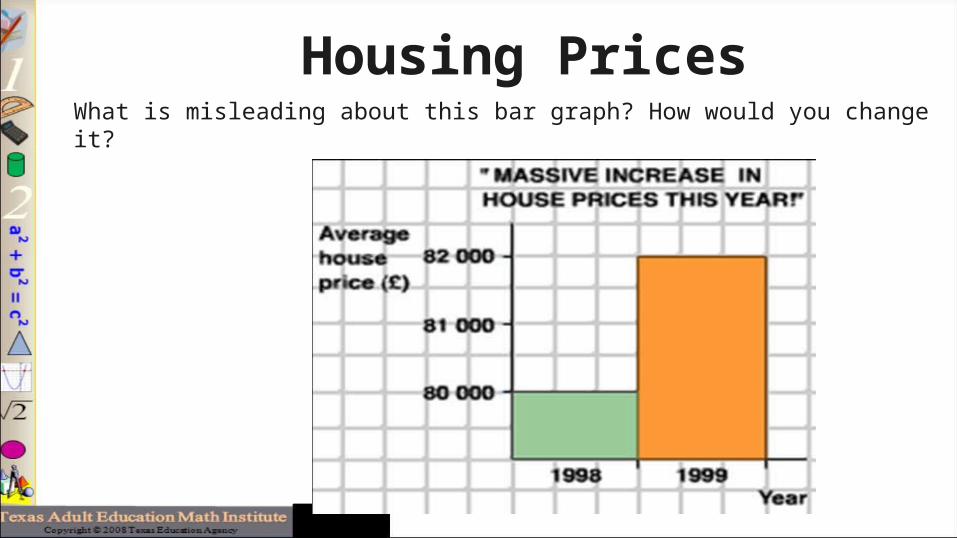
Housing PricesWhat is misleading about this bar graph? How would you change it?
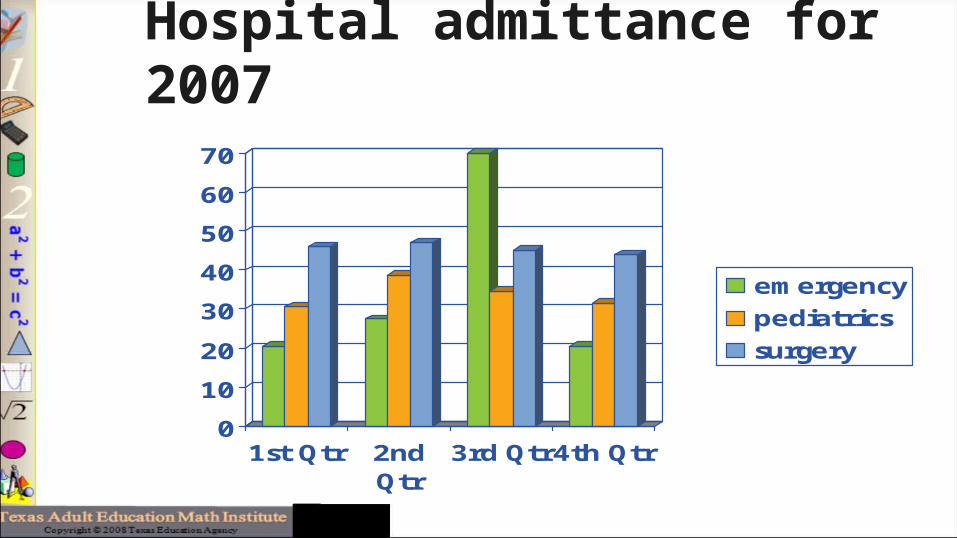
Hospital admittance for 2007
0
10
20
30
40
50
60
70
1st Qtr 2ndQtr
3rd Qtr4th Qtr
emergency
pediatrics
surgery
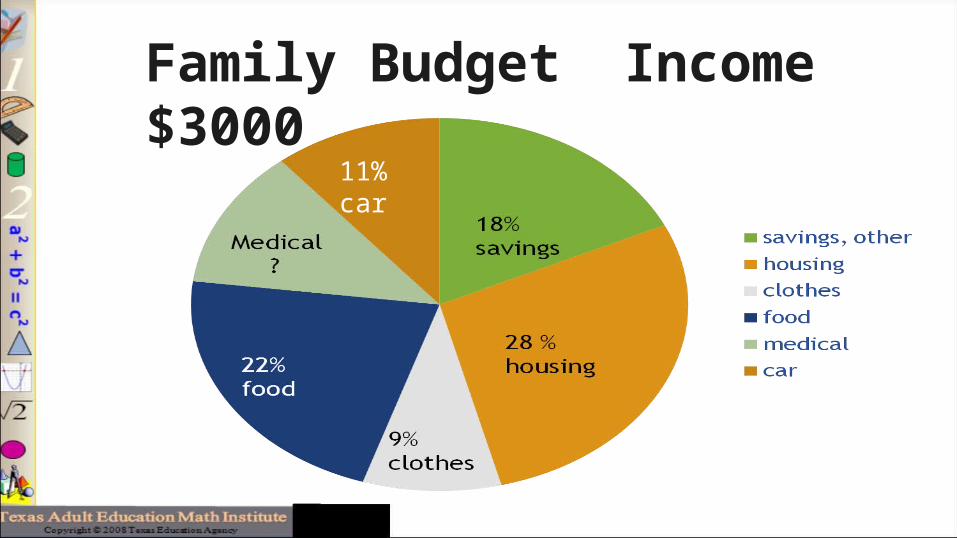
11%car
Family Budget Income $3000
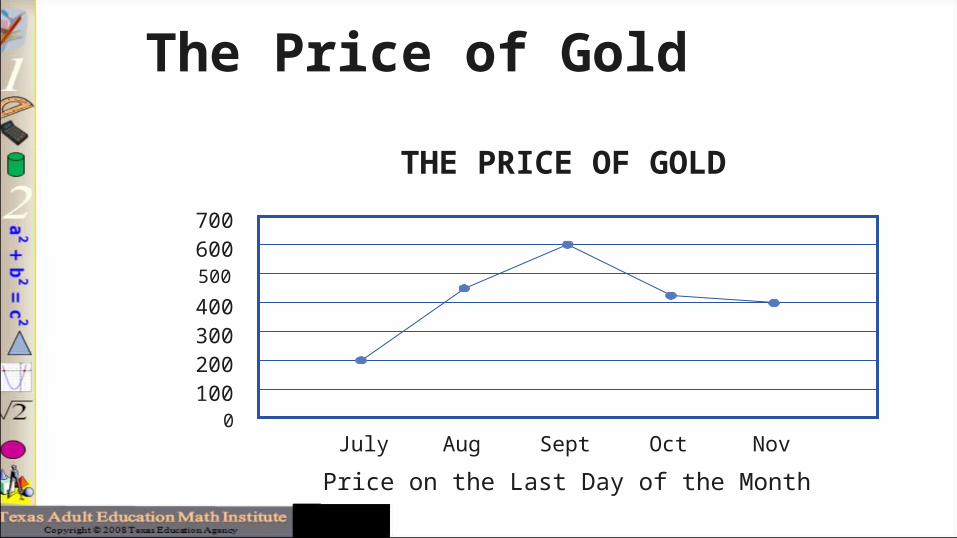
The Price of Gold
700600500
400300200100
0July Aug Sept Oct Nov
Price on the Last Day of the Month
THE PRICE OF GOLD
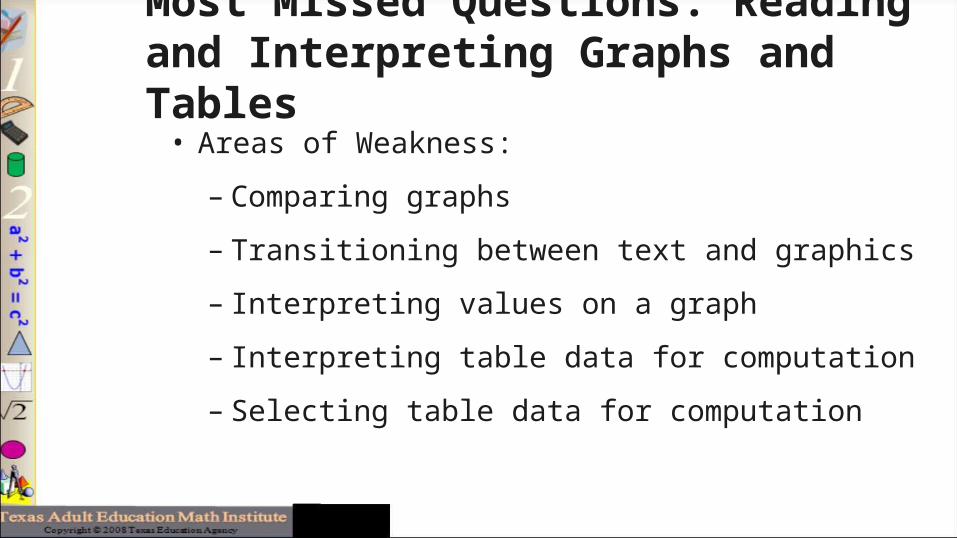
Most Missed Questions: Reading and Interpreting Graphs and Tables
• Areas of Weakness:
– Comparing graphs
– Transitioning between text and graphics
– Interpreting values on a graph
– Interpreting table data for computation
– Selecting table data for computation
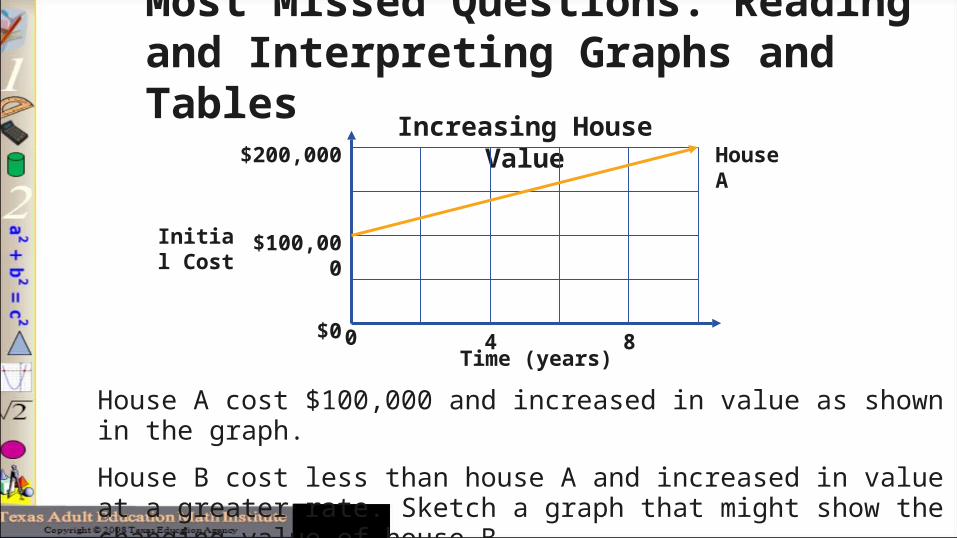
House A cost $100,000 and increased in value as shown in the graph.
House B cost less than house A and increased in value at a greater rate. Sketch a graph that might show the changing value of house B.
Initial Cost
Increasing House Value
0
4 8$0
$100,000
$200,000
House A
Time (years)
Most Missed Questions: Reading and Interpreting Graphs and Tables
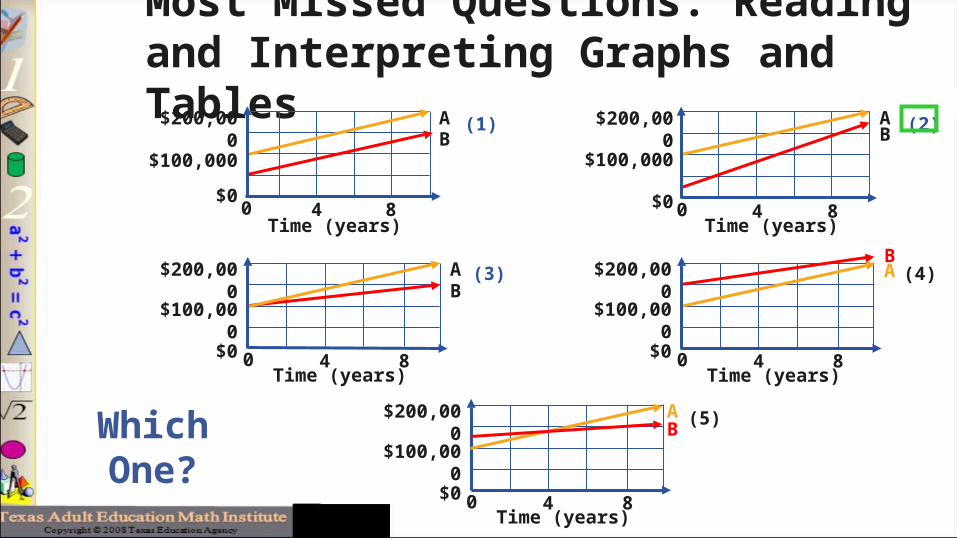
Which One?
(3)
BA
(2)
Most Missed Questions: Reading and Interpreting Graphs and Tables
(1)
0
4 8
Time (years)
0
4 8$0
$100,000
$200,000
(4)
(5)
BA
Time (years)$0
$100,000
$200,000
AB
0
4 8$0
$100,000
$200,000
Time (years)
$100,000
8
0
4$0
$200,000 B
A
Time (years)
Time (years)
0
4 8$0
$100,000
$200,000 B
A
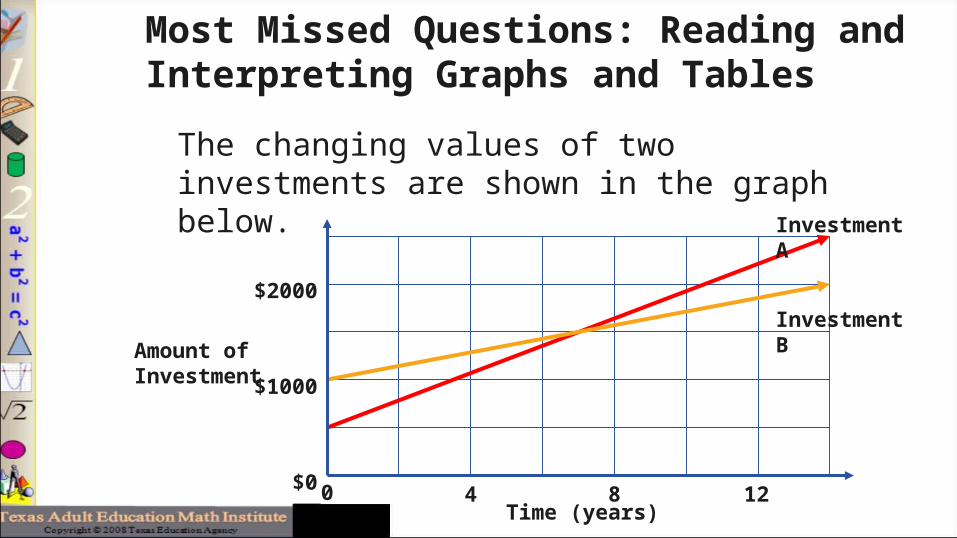
The changing values of two investments are shown in the graph below.
Most Missed Questions: Reading and Interpreting Graphs and Tables
Amount of Investment
0
4 8 12
$0
$1000
$2000
Investment A
Investment B
Time (years)
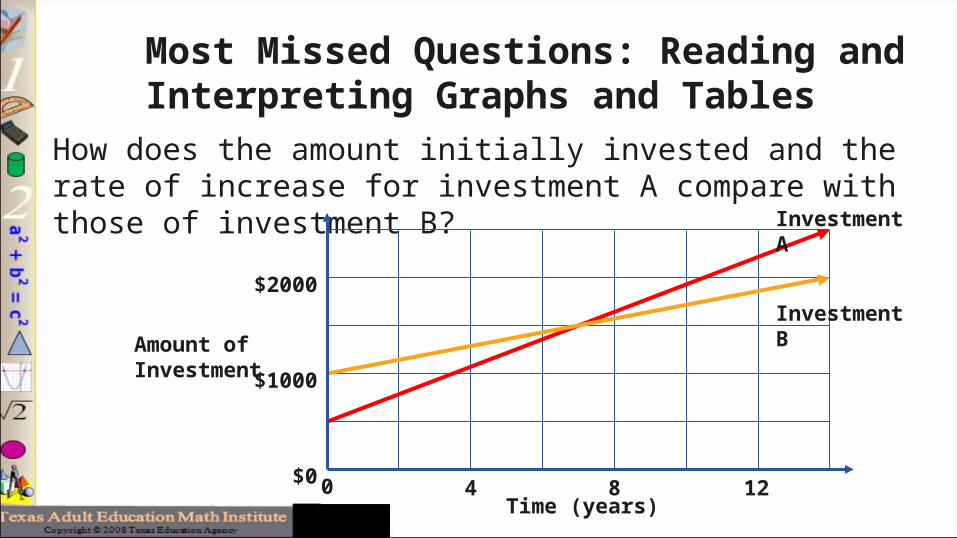
How does the amount initially invested and the rate of increase for investment A compare with those of investment B?
Most Missed Questions: Reading and Interpreting Graphs and Tables
Amount of Investment
0
4 8 12
$0
$1000
$2000
Investment A
Investment B
Time (years)
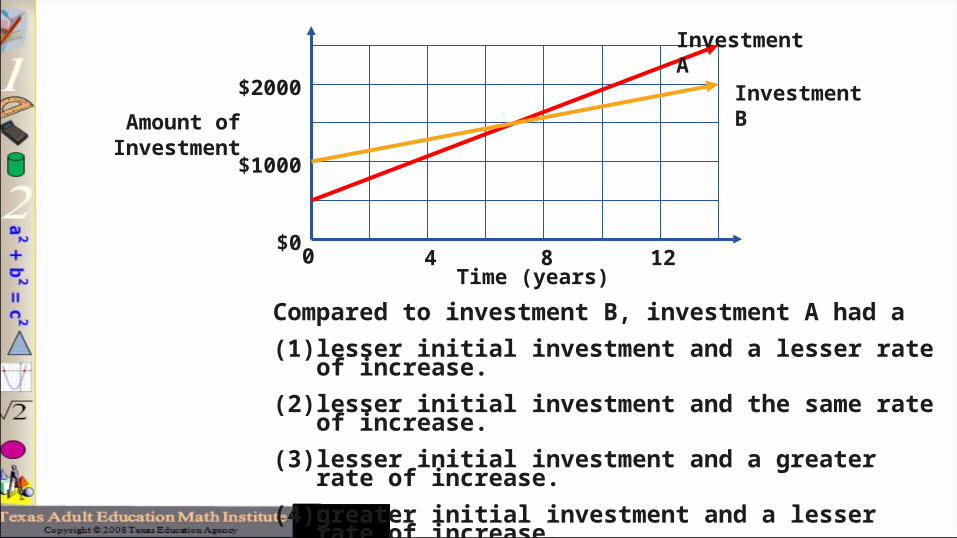
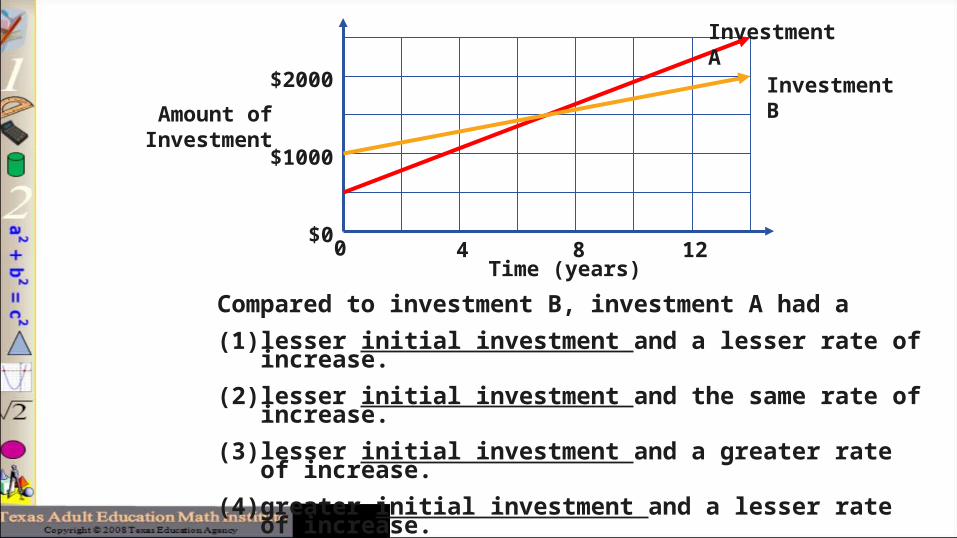
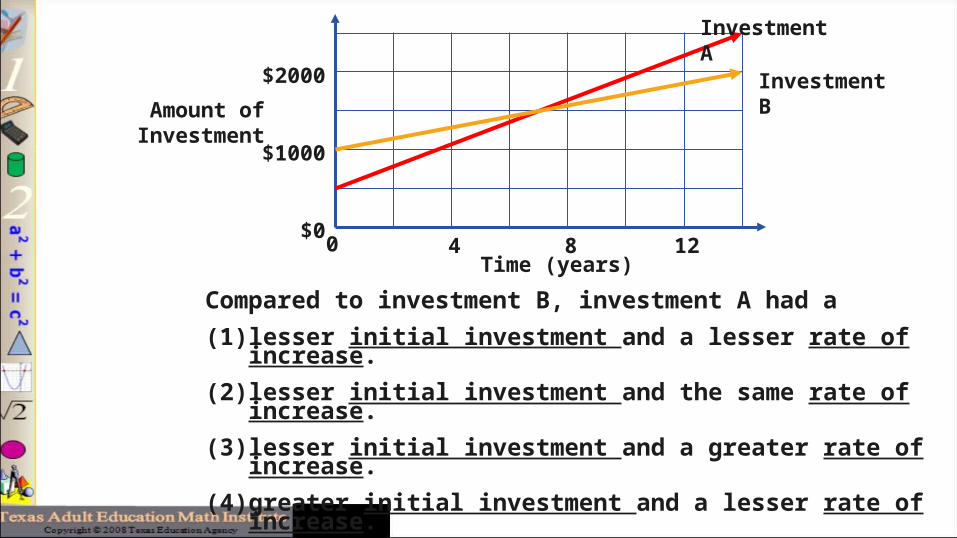
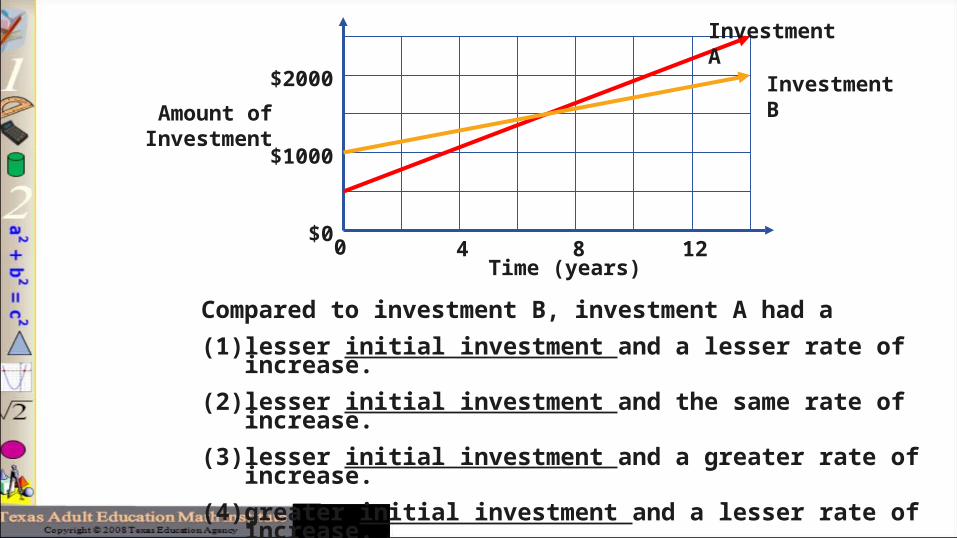
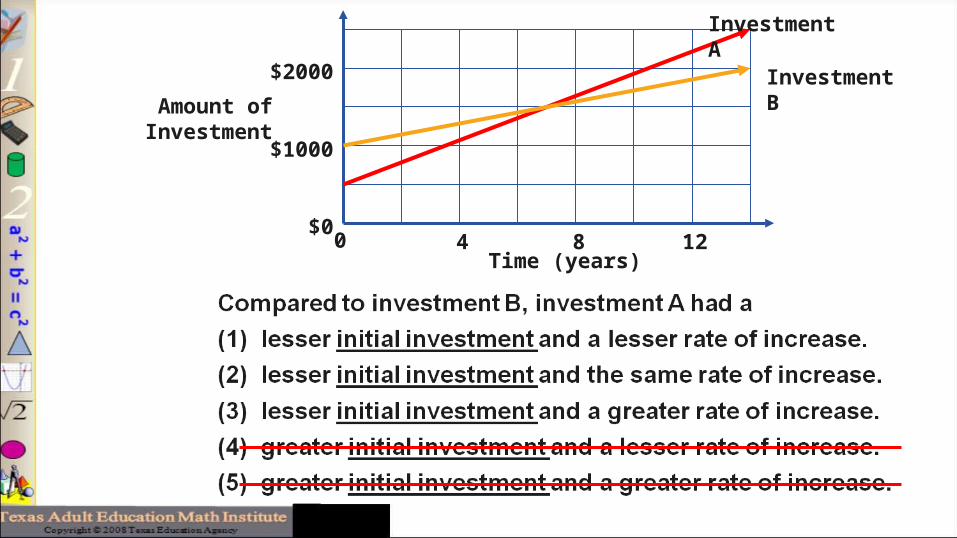
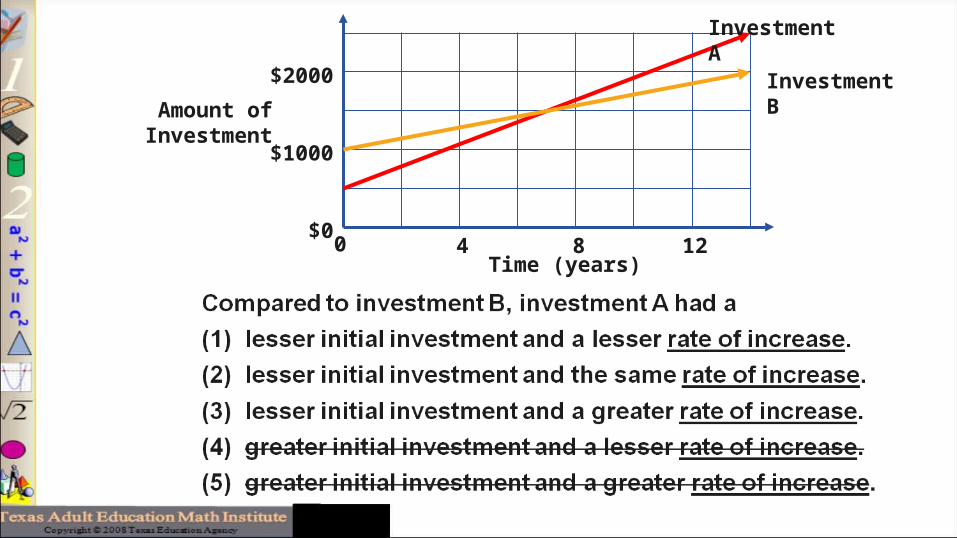
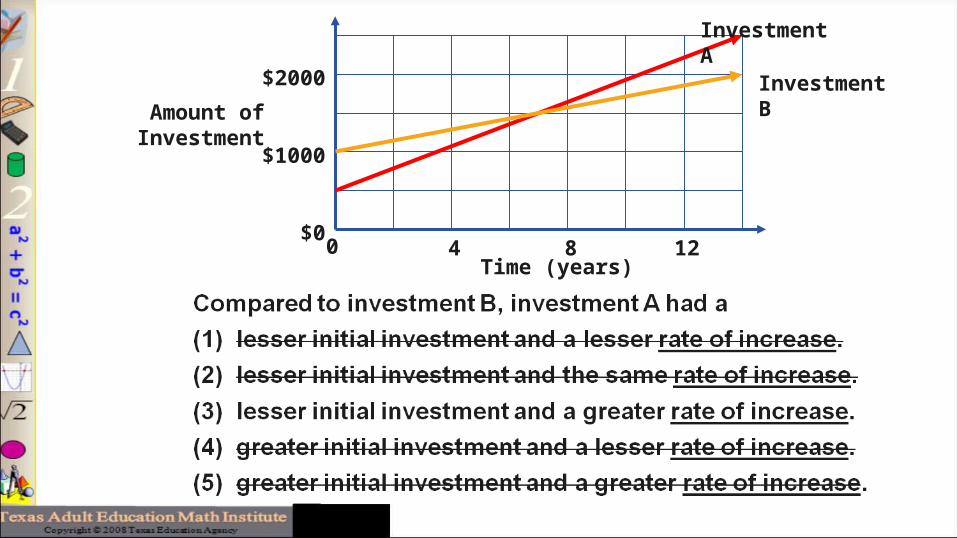
Compared to investment B, investment A had a
(1) lesser initial investment and a lesser rate of increase.
(2) lesser initial investment and the same rate of increase.
(3) lesser initial investment and a greater rate of increase.
(4) greater initial investment and a lesser rate of increase.
(5) greater initial investment and a greater rate of increase.
04 8 12
$0
$1000
$2000Amount of
Investment
Investment A
Investment B
Time (years)
Compared to investment B, investment A had a
(1) lesser initial investment and a lesser rate of increase.
(2) lesser initial investment and the same rate of increase.
(3) lesser initial investment and a greater rate of increase.
(4) greater initial investment and a lesser rate of increase.
(5) greater initial investment and a greater rate of increase.
0
4 8 12$0
$1000
$2000Amount of
Investment
Investment A
Investment B
Time (years)
0
4 8 12$0
$1000
$2000Amount of
Investment
Investment A
Investment B
Time (years)
0
4 8 12$0
$1000
$2000Amount of
Investment
Investment A
Investment B
Time (years)
0
4 8 12$0
$1000
$2000Amount of
Investment
Investment A
Investment B
Time (years)

Compared to investment B, investment A had a
(1) lesser initial investment and a lesser rate of increase.
(2) lesser initial investment and the same rate of increase.
(3) lesser initial investment and a greater rate of increase.
(4) greater initial investment and a lesser rate of increase.
(5) greater initial investment and a greater rate of increase.
0
4 8 12$0
$1000
$2000Amount of
Investment
Investment A
Investment B
Time (years)
Most Missed Questions: Reading and Interpreting Graphs and Tables
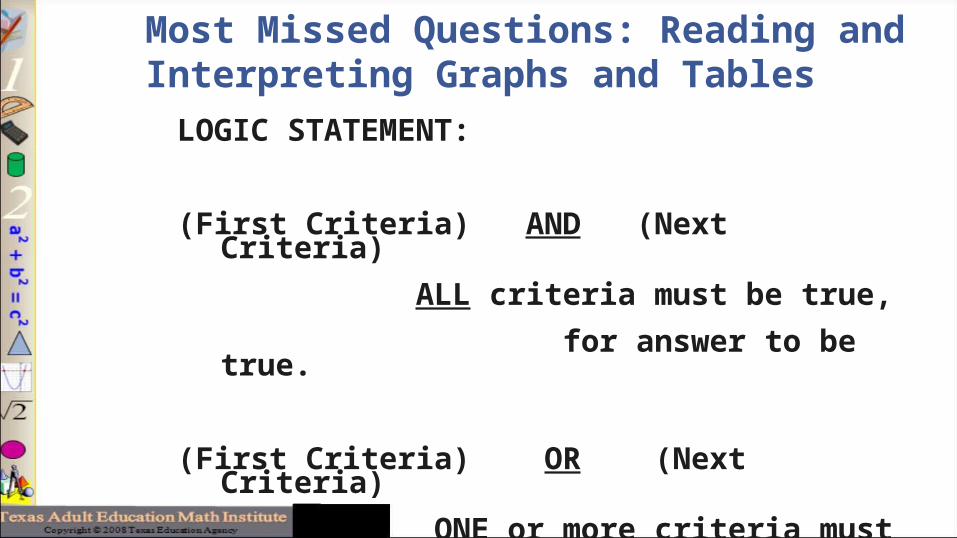
LOGIC STATEMENT:
(First Criteria) AND (Next Criteria)
ALL criteria must be true,
for answer to be true.
(First Criteria) OR (Next Criteria)
ONE or more criteria must be true,
for answer to be true.
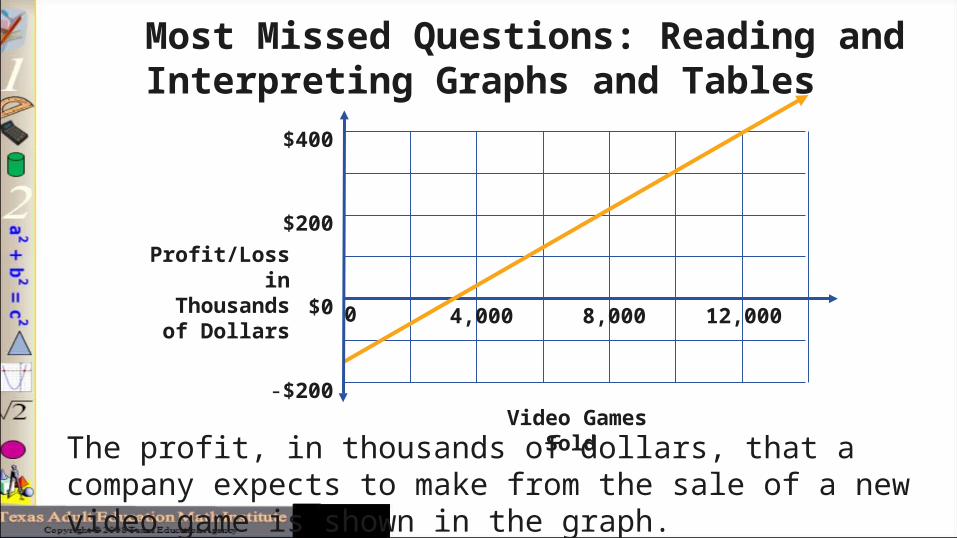
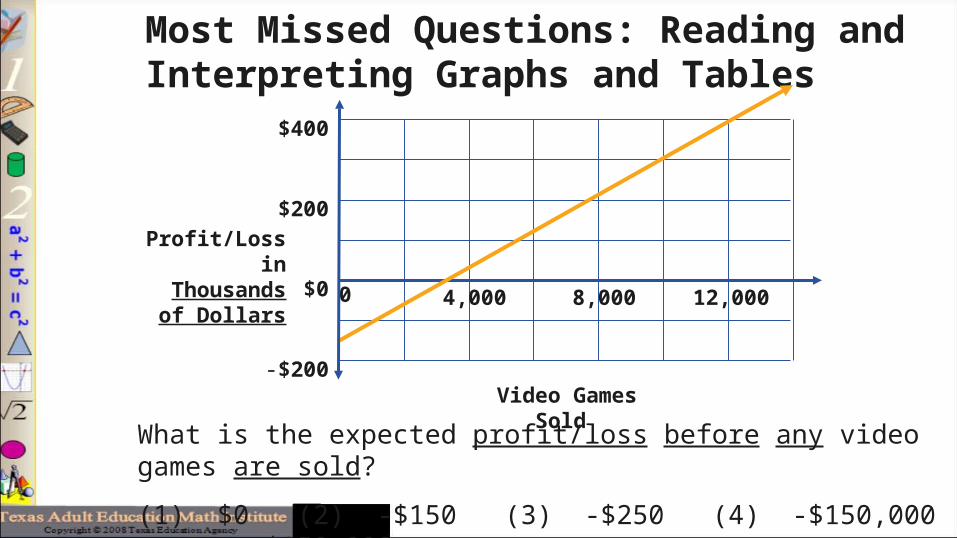
The profit, in thousands of dollars, that a company expects to make from the sale of a new video game is shown in the graph.
Most Missed Questions: Reading and Interpreting Graphs and Tables
0
4,000 8,000 12,000$0
$200
$400
Profit/Loss in Thousands of
Dollars
Video Games Sold -$200
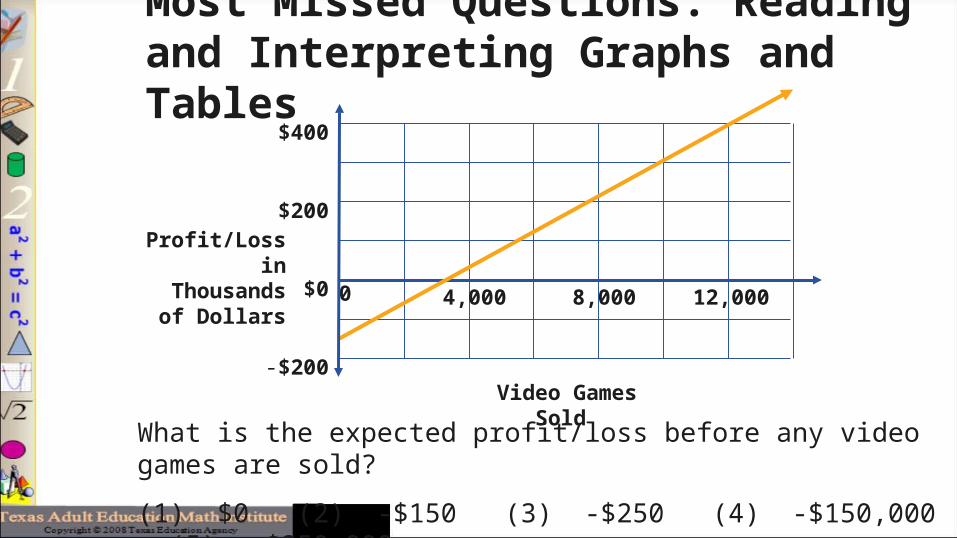
What is the expected profit/loss before any video games are sold?
(1) $0 (2) -$150 (3) -$250 (4) -$150,000 (5) -$250,000
Most Missed Questions: Reading and Interpreting Graphs and Tables
0
4,000 8,000 12,000
$0
$200
$400
Profit/Loss in Thousands of
Dollars
Video Games Sold -$200
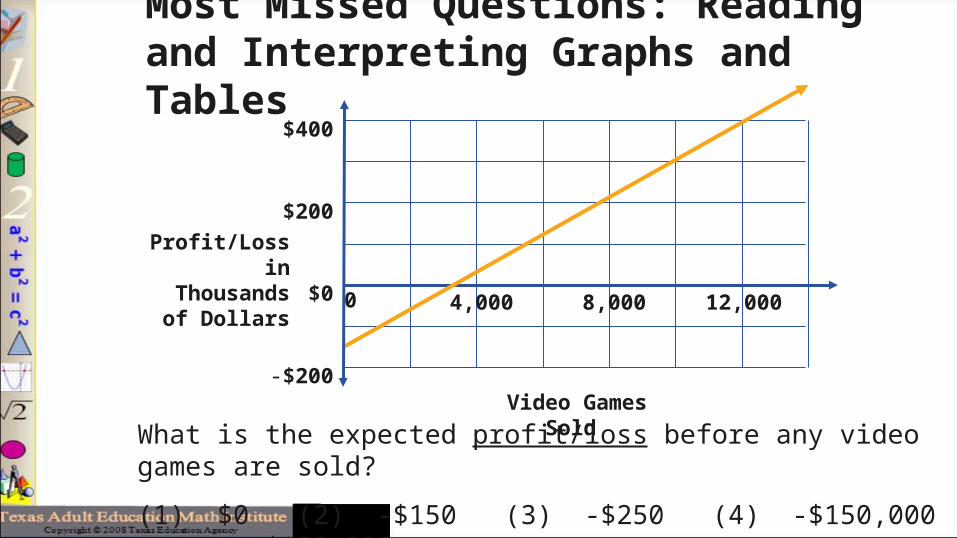
What is the expected profit/loss before any video games are sold?
(1) $0 (2) -$150 (3) -$250 (4) -$150,000 (5) -$250,000
Most Missed Questions: Reading and Interpreting Graphs and Tables
0
4,000 8,000 12,000$0
$200
$400
Profit/Loss in Thousands of
Dollars
Video Games Sold -$200
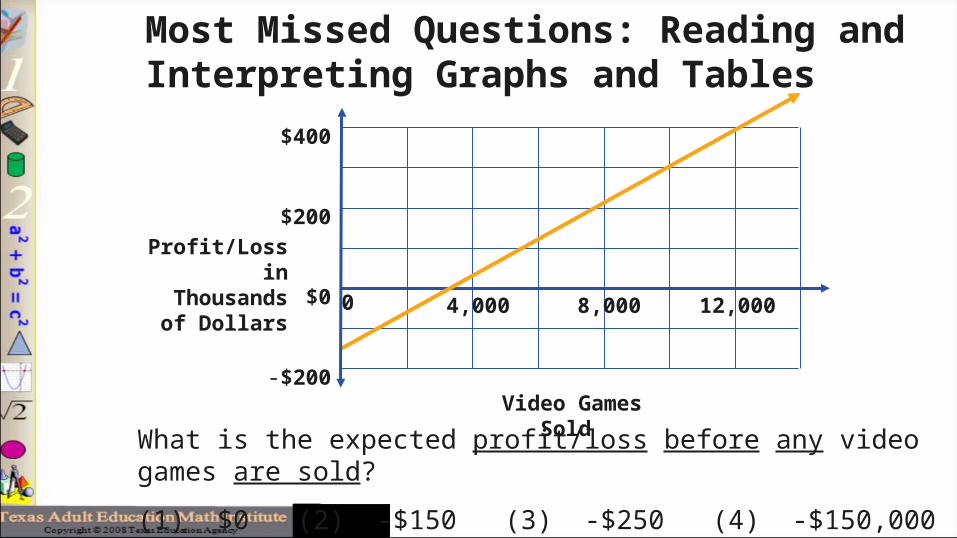
What is the expected profit/loss before any video games are sold?
(1) $0 (2) -$150 (3) -$250 (4) -$150,000 (5) -$250,000
Most Missed Questions: Reading and Interpreting Graphs and Tables
0
4,000 8,000 12,000$0
$200
$400
Profit/Loss in Thousands of
Dollars
Video Games Sold -$200
What is the expected profit/loss before any video games are sold?
(1) $0 (2) -$150 (3) -$250 (4) -$150,000 (5) -$250,000
Most Missed Questions: Reading and Interpreting Graphs and Tables
0
4,000 8,000 12,000
$0
$200
$400
Profit/Loss in Thousands of
Dollars
Video Games Sold -$200
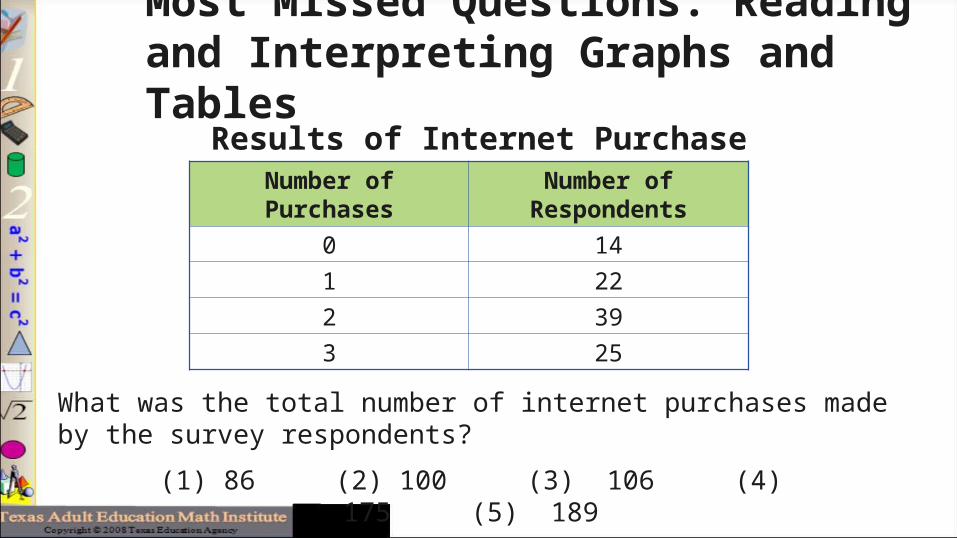
Results of Internet Purchase SurveyNumber of Purchases
Number of Respondents
0 14
1 22
2 39
3 25
What was the total number of internet purchases made by the survey respondents?
(1) 86 (2) 100 (3) 106 (4) 175 (5) 189
Most Missed Questions: Reading and Interpreting Graphs and Tables
Results of Internet Purchase SurveyNumber of Purchases Number of
Respondents
0 14
1 22
2 39
3 25
What was the total number of internet purchases made by the survey respondents?
(1) 86 (2) 100 (3) 106 (4) 175 (5) 189
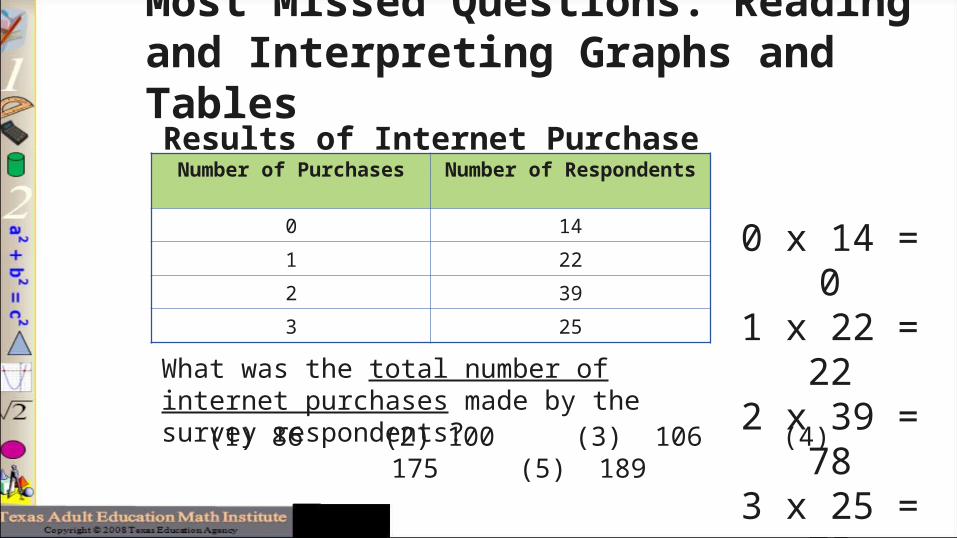
Most Missed Questions: Reading and Interpreting Graphs and Tables
0 x 14 = 0
1 x 22 = 22
2 x 39 = 78
3 x 25 = 75
Results of Internet Purchase SurveyNumber of Purchases Number of
Respondents
0 14
1 22
2 39
3 25
What was the total number of internet purchases made by the survey respondents?
(1) 86 (2) 100 (3) 106 (4) 175 (5) 189
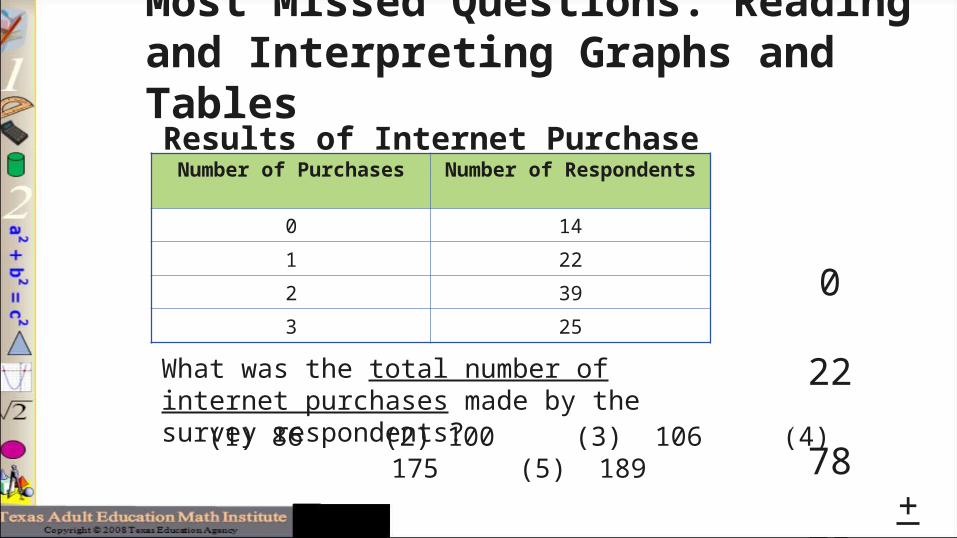
Most Missed Questions: Reading and Interpreting Graphs and Tables
0 x 14 = 0
1 x 22 = 22
2 x 39 = 78
3 x 25 + 75
175
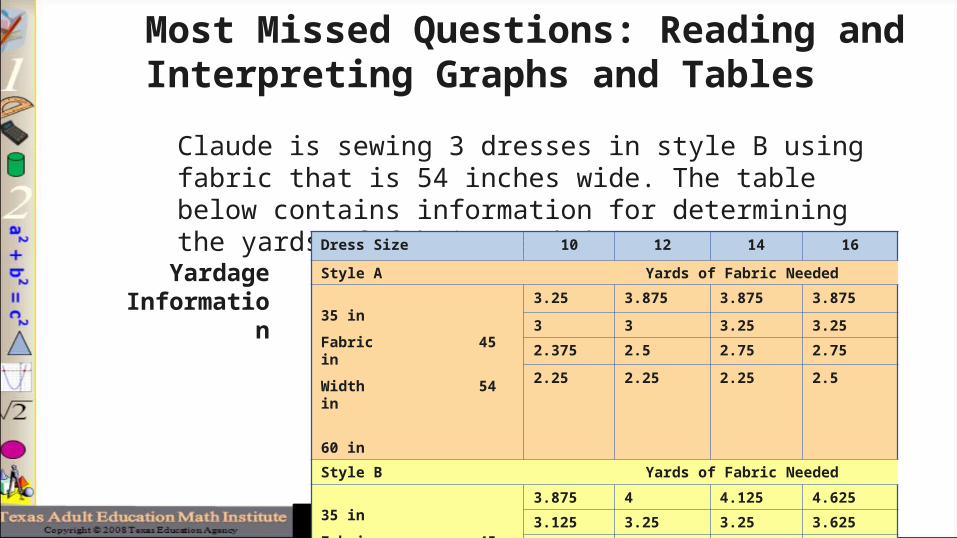
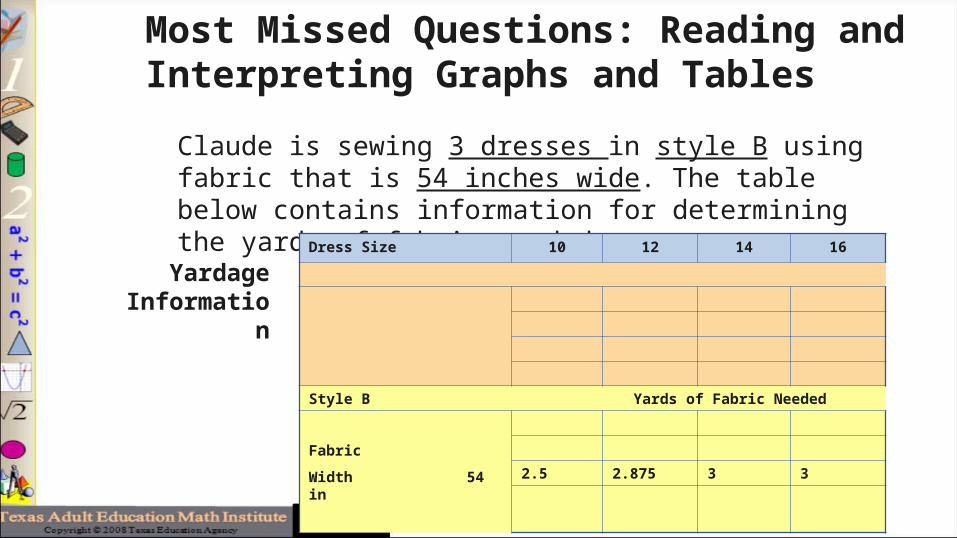
Claude is sewing 3 dresses in style B using fabric that is 54 inches wide. The table below contains information for determining the yards of fabric needed.
Yardage Information
Most Missed Questions: Reading and Interpreting Graphs and Tables
Dress Size 10 12 14 16
Style A Yards of Fabric Needed
35 in
Fabric 45 in
Width 54 in
60 in
3.25 3.875 3.875 3.875
3 3 3.25 3.25
2.375 2.5 2.75 2.75
2.25 2.25 2.25 2.5
Style B Yards of Fabric Needed
35 in
Fabric 45 in
Width 54 in
60 in
3.875 4 4.125 4.625
3.125 3.25 3.25 3.625
2.5 2.875 3 3
2.25 2.375 2.5 2.75
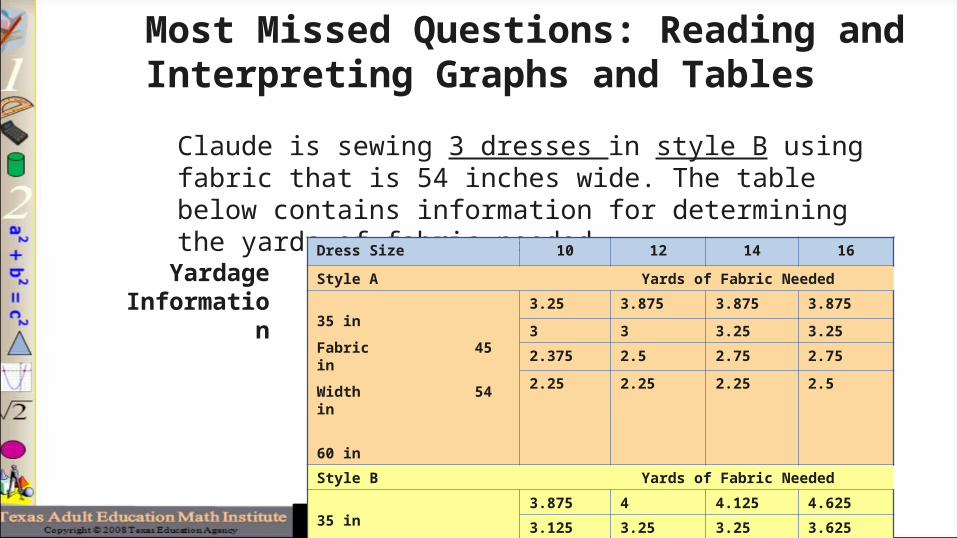
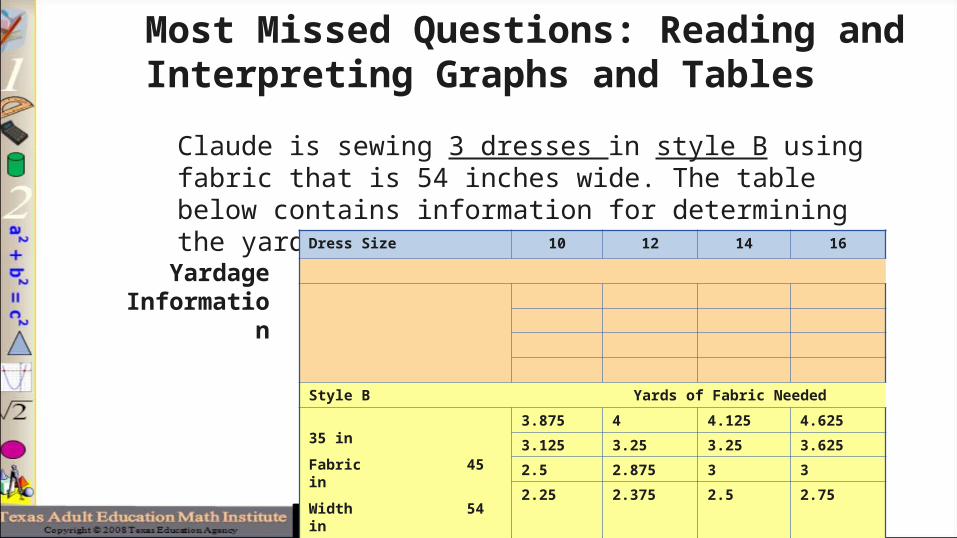
Claude is sewing 3 dresses in style B using fabric that is 54 inches wide. The table below contains information for determining the yards of fabric needed.
Yardage Information
Most Missed Questions: Reading and Interpreting Graphs and Tables
Dress Size 10 12 14 16
Style B Yards of Fabric Needed
35 in
Fabric 45 in
Width 54 in
60 in
3.875 4 4.125 4.625
3.125 3.25 3.25 3.625
2.5 2.875 3 3
2.25 2.375 2.5 2.75
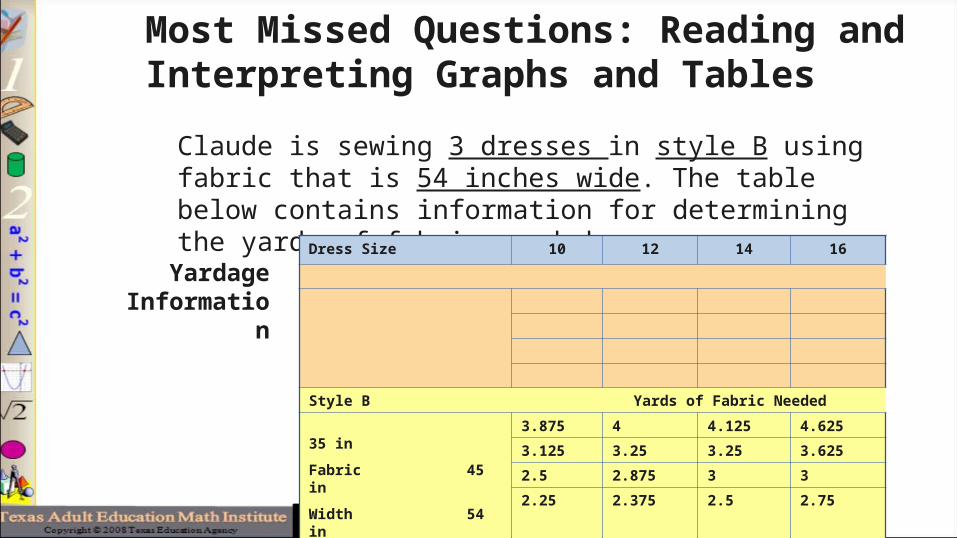
Claude is sewing 3 dresses in style B using fabric that is 54 inches wide. The table below contains information for determining the yards of fabric needed.
Yardage Information
Most Missed Questions: Reading and Interpreting Graphs and Tables
Dress Size 10 12 14 16
Style B Yards of Fabric Needed
35 in
Fabric 45 in
Width 54 in
60 in
3.875 4 4.125 4.625
3.125 3.25 3.25 3.625
2.5 2.875 3 3
2.25 2.375 2.5 2.75
Claude is sewing 3 dresses in style B using fabric that is 54 inches wide. The table below contains information for determining the yards of fabric needed.
Yardage Information
Most Missed Questions: Reading and Interpreting Graphs and Tables
Dress Size 10 12 14 16
Style B Yards of Fabric Needed
Fabric
Width 54 in
2.5 2.875 3 3
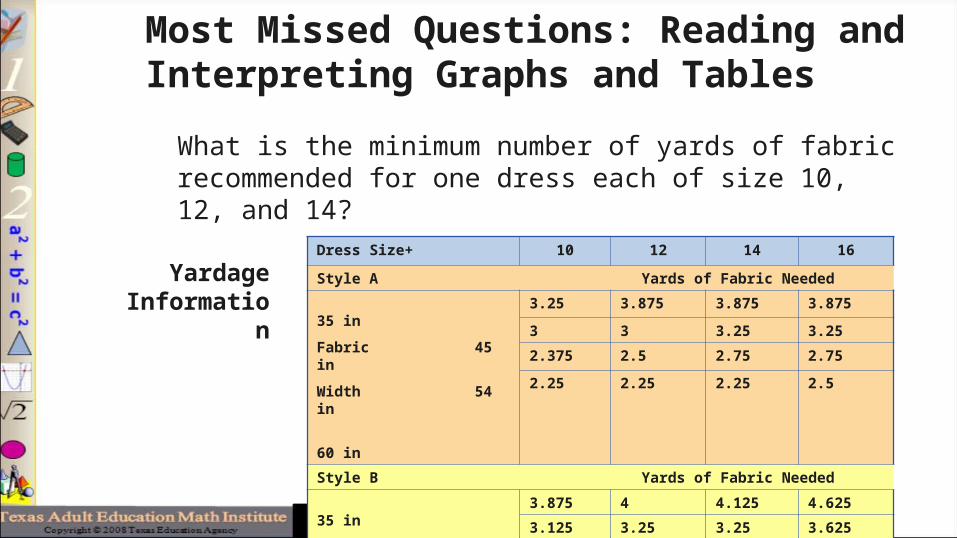
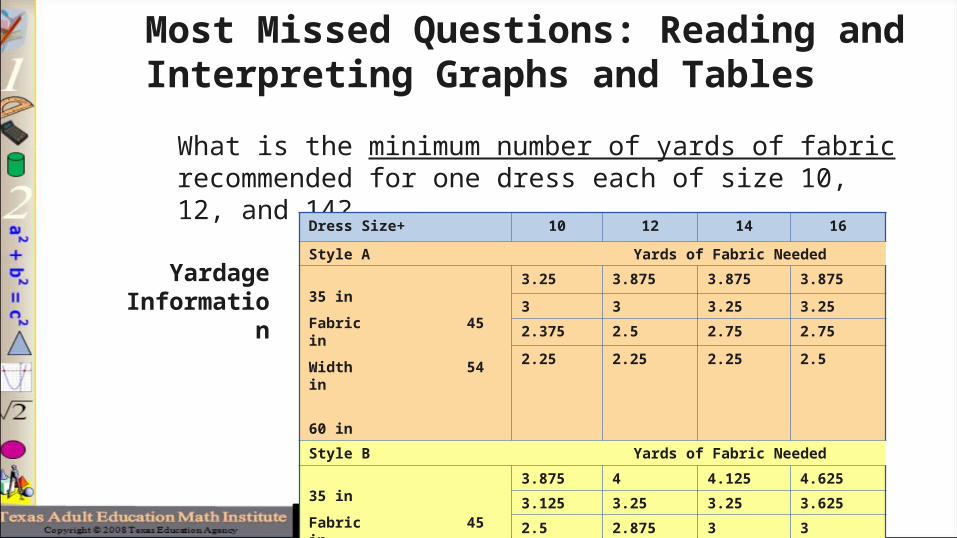
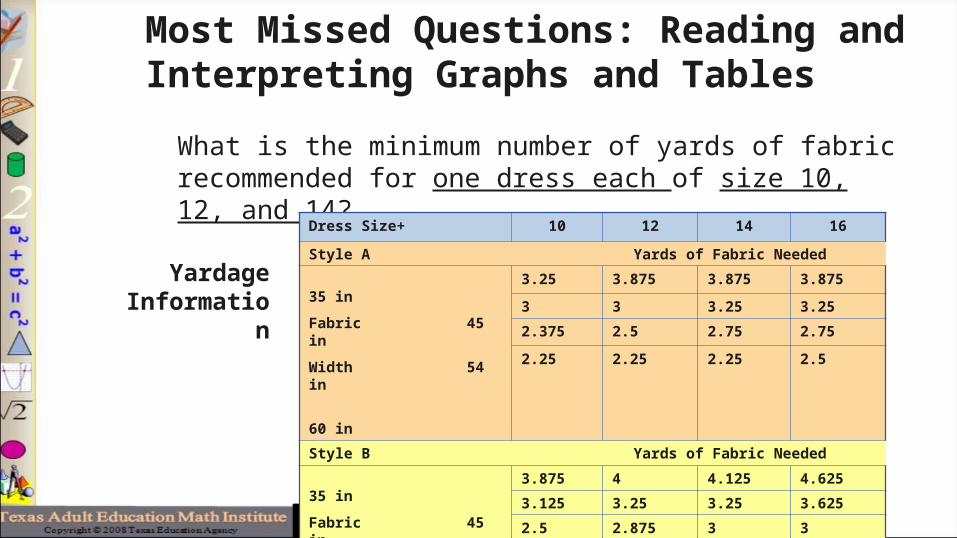
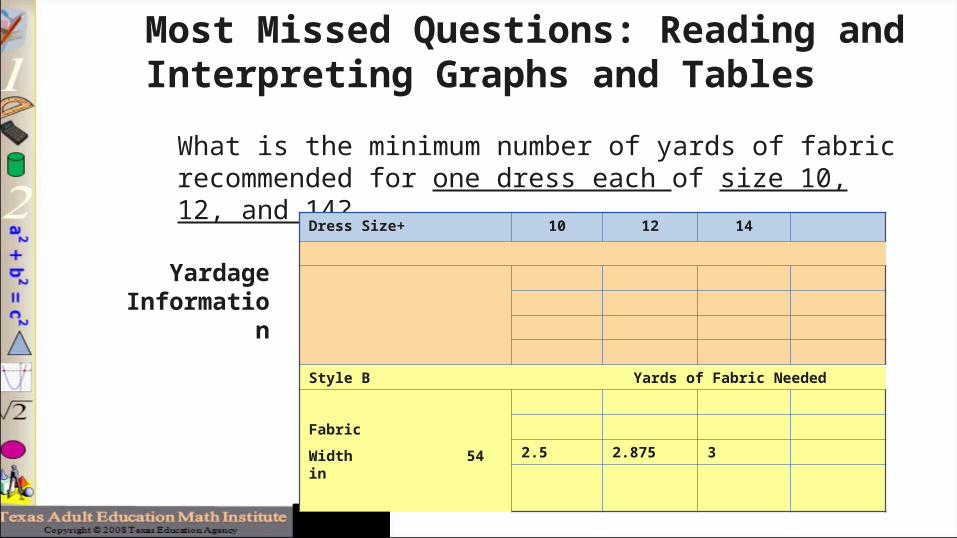
What is the minimum number of yards of fabric recommended for one dress each of size 10, 12, and 14?
Yardage Information
Most Missed Questions: Reading and Interpreting Graphs and Tables
Dress Size+ 10 12 14 16
Style A Yards of Fabric Needed
35 in
Fabric 45 in
Width 54 in
60 in
3.25 3.875 3.875 3.875
3 3 3.25 3.25
2.375 2.5 2.75 2.75
2.25 2.25 2.25 2.5
Style B Yards of Fabric Needed
35 in
Fabric 45 in
Width 54 in
60 in
3.875 4 4.125 4.625
3.125 3.25 3.25 3.625
2.5 2.875 3 3
2.25 2.375 2.5 2.75
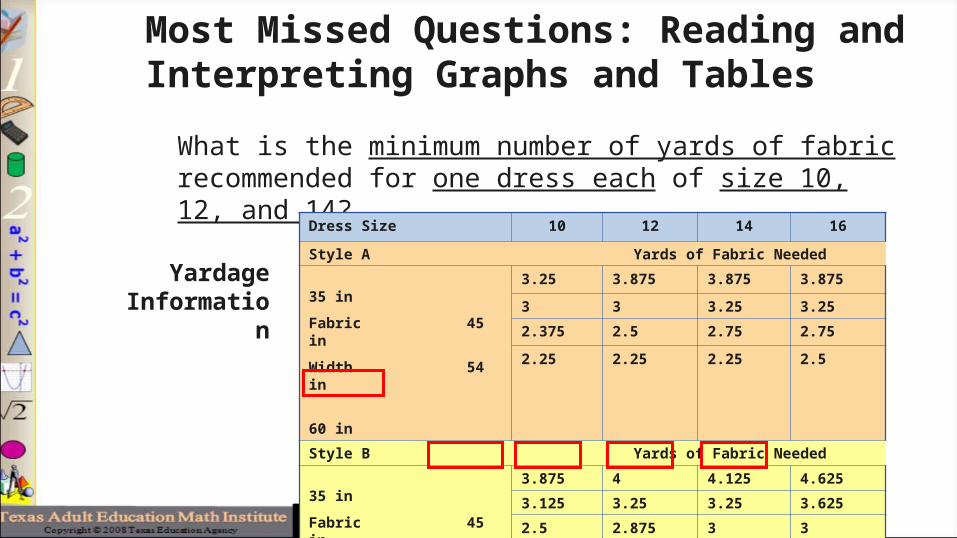

What is the minimum number of yards of fabric recommended for one dress each of size 10, 12, and 14?
Yardage Information
Most Missed Questions: Reading and Interpreting Graphs and Tables
Dress Size+ 10 12 14 16
Style B Yards of Fabric Needed
Fabric
Width 54 in
2.5 2.875 3 3
What is the minimum number of yards of fabric recommended for one dress each of size 10, 12, and 14?
Yardage Information
Most Missed Questions: Reading and Interpreting Graphs and Tables
Dress Size+ 10 12 14
Style B Yards of Fabric Needed
Fabric
Width 54 in
2.5 2.875 3
What is the minimum number of yards of fabric recommended for one dress each of size 10, 12, and 14?
Yardage Information
Most Missed Questions: Reading and Interpreting Graphs and Tables
Dress Size 10 12 14 16
Style A Yards of Fabric Needed
35 in
Fabric 45 in
Width 54 in
60 in
3.25 3.875 3.875 3.875
3 3 3.25 3.25
2.375 2.5 2.75 2.75
2.25 2.25 2.25 2.5
Style B Yards of Fabric Needed
35 in
Fabric 45 in
Width 54 in
60 in
3.875 4 4.125 4.625
3.125 3.25 3.25 3.625
2.5 2.875 3 3
2.25 2.375 2.5 2.75

What is the minimum number of yards of fabric recommended for one dress each of size 10, 12, and 14?
Yardage Information
Most Missed Questions: Reading and Interpreting Graphs and Tables
Dress Size 10 12 14 16
Style A Yards of Fabric Needed
35 in
Fabric 45 in
Width 54 in
60 in
3.25 3.875 3.875 3.875
3 3 3.25 3.25
2.375 2.5 2.75 2.75
2.25 2.25 2.25 2.5
Style B Yards of Fabric Needed
35 in
Fabric 45 in
Width 54 in
60 in
3.875 4 4.125 4.625
3.125 3.25 3.25 3.625
2.5 2.875 3 3
2.25 2.375 2.5 2.75
2.500
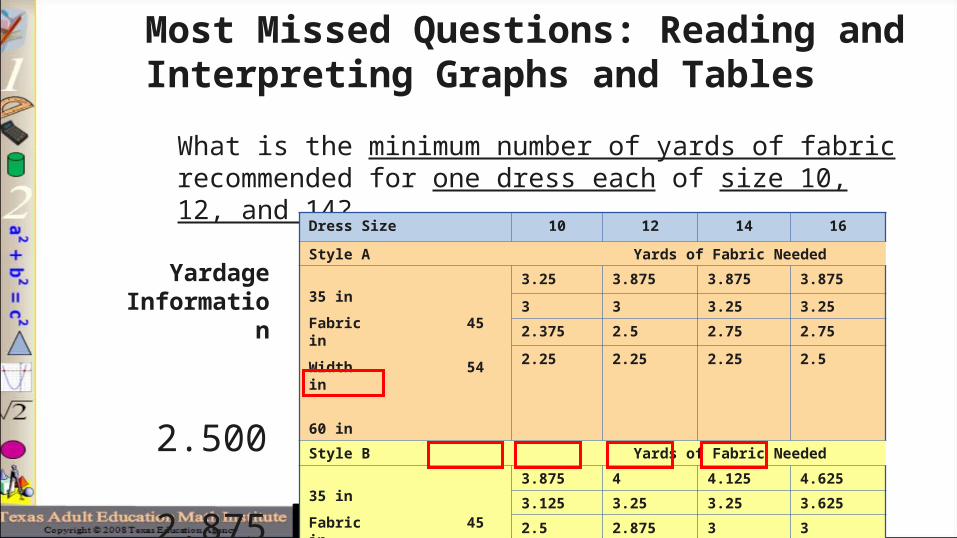
What is the minimum number of yards of fabric recommended for one dress each of size 10, 12, and 14?
Yardage Information
Most Missed Questions: Reading and Interpreting Graphs and Tables
Dress Size 10 12 14 16
Style A Yards of Fabric Needed
35 in
Fabric 45 in
Width 54 in
60 in
3.25 3.875 3.875 3.875
3 3 3.25 3.25
2.375 2.5 2.75 2.75
2.25 2.25 2.25 2.5
Style B Yards of Fabric Needed
35 in
Fabric 45 in
Width 54 in
60 in
3.875 4 4.125 4.625
3.125 3.25 3.25 3.625
2.5 2.875 3 3
2.25 2.375 2.5 2.75
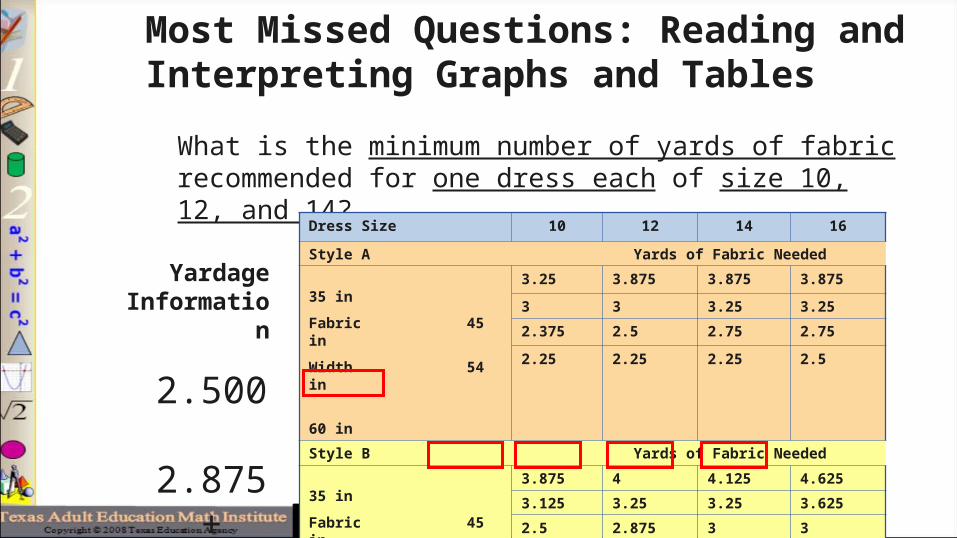
2.500
2.875

What is the minimum number of yards of fabric recommended for one dress each of size 10, 12, and 14?
Yardage Information
Most Missed Questions: Reading and Interpreting Graphs and Tables
Dress Size 10 12 14 16
Style A Yards of Fabric Needed
35 in
Fabric 45 in
Width 54 in
60 in
3.25 3.875 3.875 3.875
3 3 3.25 3.25
2.375 2.5 2.75 2.75
2.25 2.25 2.25 2.5
Style B Yards of Fabric Needed
35 in
Fabric 45 in
Width 54 in
60 in
3.875 4 4.125 4.625
3.125 3.25 3.25 3.625
2.5 2.875 3 3
2.25 2.375 2.5 2.75
2.500
2.875
3.000

What is the minimum number of yards of fabric recommended for one dress each of size 10, 12, and 14?
Yardage Information
Most Missed Questions: Reading and Interpreting Graphs and Tables
Dress Size 10 12 14 16
Style A Yards of Fabric Needed
35 in
Fabric 45 in
Width 54 in
60 in
3.25 3.875 3.875 3.875
3 3 3.25 3.25
2.375 2.5 2.75 2.75
2.25 2.25 2.25 2.5
Style B Yards of Fabric Needed
35 in
Fabric 45 in
Width 54 in
60 in
3.875 4 4.125 4.625
3.125 3.25 3.25 3.625
2.5 2.875 3 3
2.25 2.375 2.5 2.75
2.500
2.875
+ 3.000
8.375
Tips from GEDTS: Reading and Interpreting Graphs and Tables
• Have candidates find examples of different types of graphs.
• Have candidates create questions for their graphics and/or those of others.
• Develop the capacity to translate from graphics to text as well as text to graphics.
• Develop the capacity to select pertinent information from the information presented.
• Reinforce the need to read and interpret scales, present graphs without scales or without units.
Kenn Pendleton, GEDTS Math Specialist
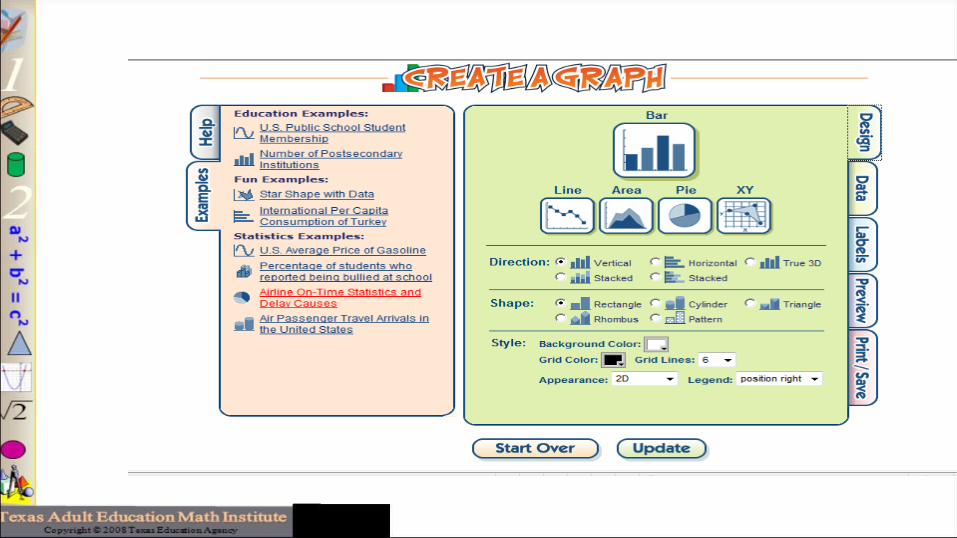
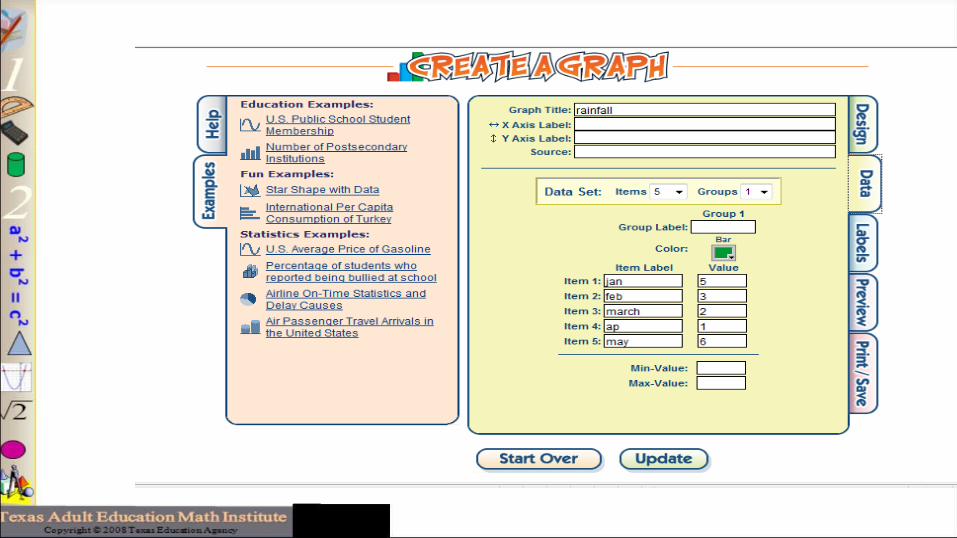
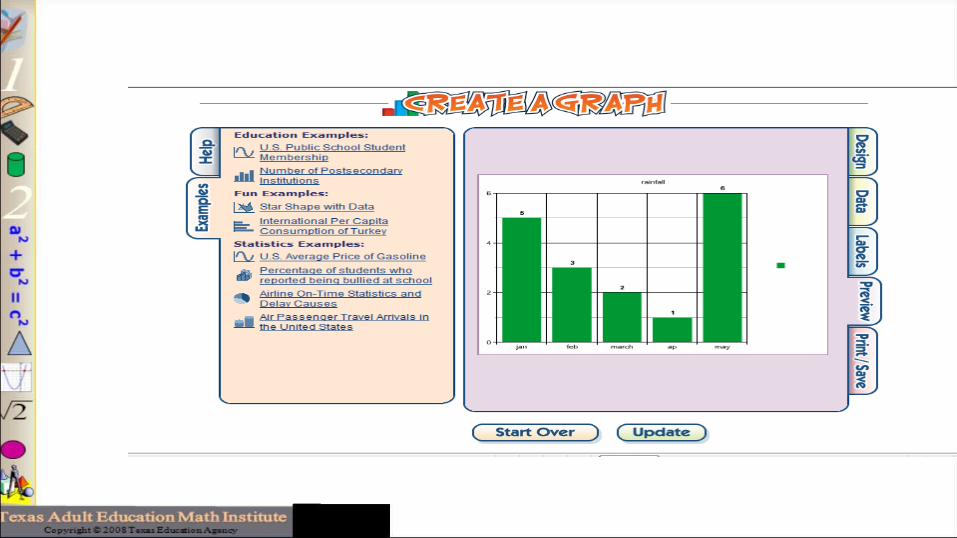
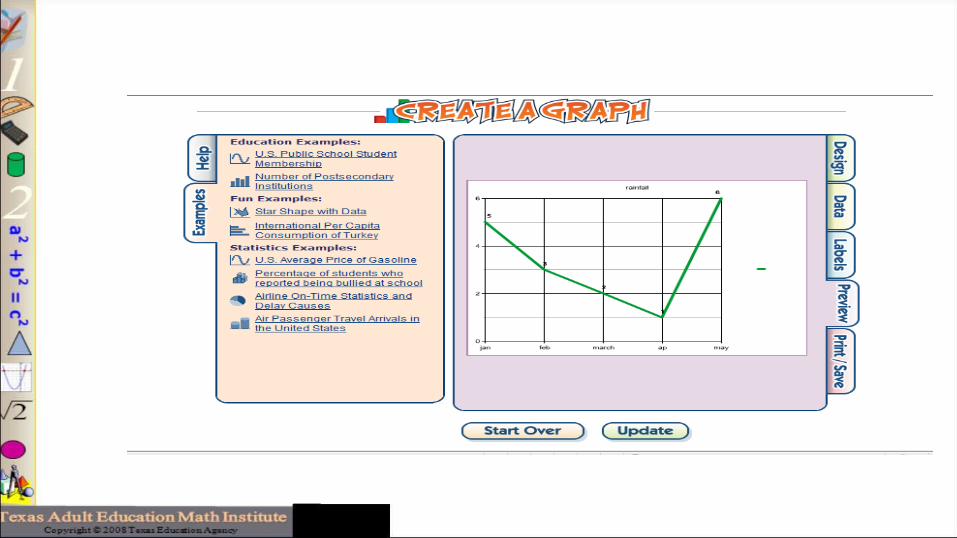
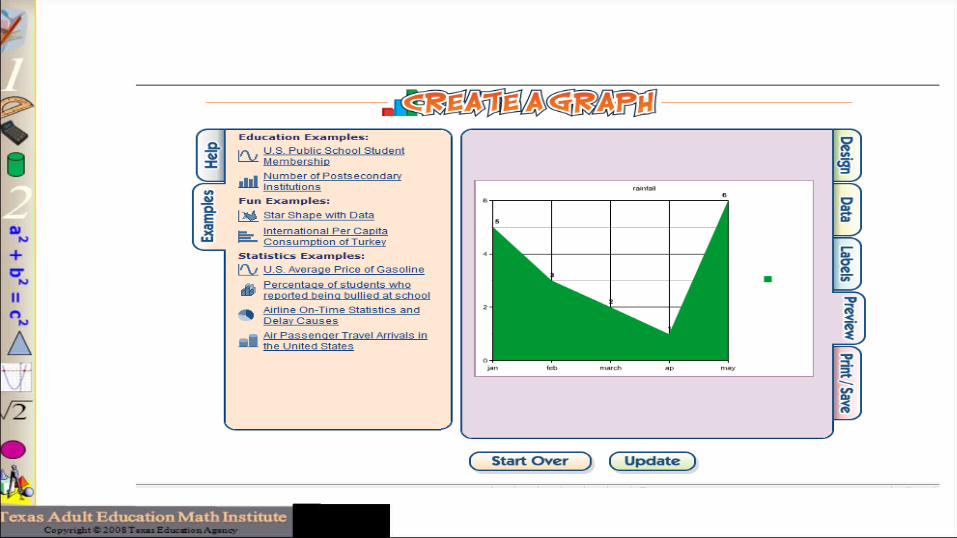
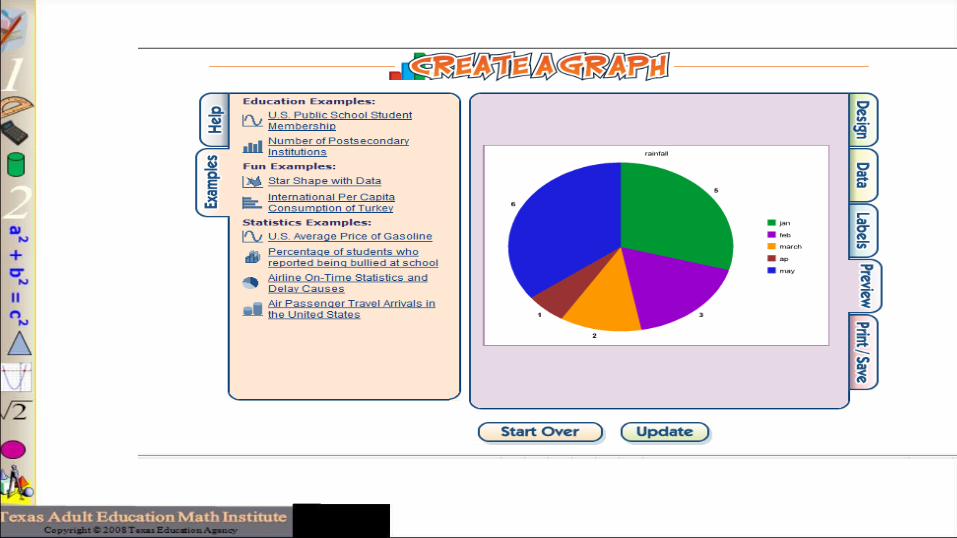
Graph website
• http://nces.ed.gov/nceskids/createagraph/default.aspx