interpreting distance–time graphs · interpreting distance-time graphs teacher guide beta version...
TRANSCRIPT
Interpreting Distance-Time Graphs Teacher Guide Beta Version
© 2011 MARS University of Nottingham 1
Interpreting Distance–Time Graphs Mathematical goals This lesson unit is intended to help you assess how well students are able to interpret distance–time graphs, and in particular, to help you identify students who have the following difficulties:
• Interpreting distance–time graphs as if they are pictures of situations rather than abstract representations of them.
• Relating speeds to slopes of these graphs.
Common Core State Standards This lesson involves mathematical content in the standards from across the grades, with emphasis on:
F-IF: Interpret functions that arise in applications in terms of the context. This lesson involves a range of mathematical practices, with emphasis on:
2. Reason abstractly and quantitatively. 3. Construct viable arguments and critique the reasoning of others.
Introduction The lesson unit is structured in the following way:
• Before the lesson, students work on a task designed to reveal their current understandings and difficulties. You then review their work, and create questions for students to answer in order to improve their solutions.
• A whole-class introduction provides students with guidance on how to work through the first task. Students then work in small groups on a collaborative discussion task, matching verbal interpretations with graphs. As they do this, they translate between words and graphical features, and begin to link the representations.
• This is followed by a whole-class discussion about applying realistic data to a graph. • Students next work in small groups, matching tables of data to the existing matched pairs of cards.
They then explain their reasoning to another group of students. • In a final whole-class discussion, students draw their own graphs from verbal interpretations. • Finally, students return to their original task and try to improve their individual responses.
Materials required Each individual student will need:
• Two copies of the assessment task Journey to the Bus Stop. • A mini-whiteboard, a pen, and an eraser.
Each small group of students will need:
• Card Set A: Distance–Time Graphs, Card Set B: Interpretations, and Card Set C: Tables of Data. • One large sheet of paper, and a glue stick for making posters.
The cards should be cut up beforehand.
You will also need a supply of graph paper to give to students who request it. There are some projector resources to support your teaching.

Interpreting Distance-Time Graphs Teacher Guide Beta Version
© 2011 MARS University of Nottingham 2
Time needed Approximately 15 minutes before the lesson, a 90-minute lesson (or two 45-minute lessons), and 10 minutes in a following lesson (or homework). Timings given are only approximate. Exact timings will depend on the needs of the class.
Interpreting Distance-Time Graphs Teacher Guide Beta Version
© 2011 MARS University of Nottingham 3
Before the lesson
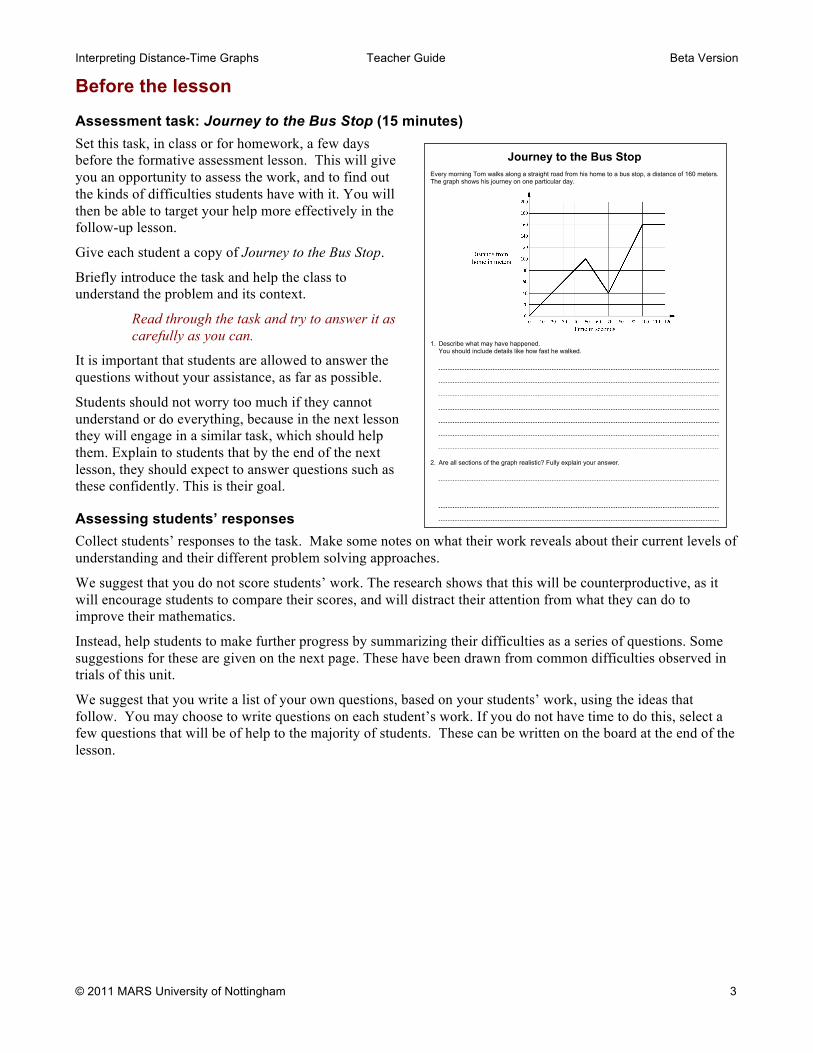
Assessment task: Journey to the Bus Stop (15 minutes) Set this task, in class or for homework, a few days before the formative assessment lesson. This will give you an opportunity to assess the work, and to find out the kinds of difficulties students have with it. You will then be able to target your help more effectively in the follow-up lesson.
Give each student a copy of Journey to the Bus Stop.
Briefly introduce the task and help the class to understand the problem and its context.
Read through the task and try to answer it as carefully as you can.
It is important that students are allowed to answer the questions without your assistance, as far as possible.
Students should not worry too much if they cannot understand or do everything, because in the next lesson they will engage in a similar task, which should help them. Explain to students that by the end of the next lesson, they should expect to answer questions such as these confidently. This is their goal.
Assessing students’ responses Collect students’ responses to the task. Make some notes on what their work reveals about their current levels of understanding and their different problem solving approaches.
We suggest that you do not score students’ work. The research shows that this will be counterproductive, as it will encourage students to compare their scores, and will distract their attention from what they can do to improve their mathematics.
Instead, help students to make further progress by summarizing their difficulties as a series of questions. Some suggestions for these are given on the next page. These have been drawn from common difficulties observed in trials of this unit.
We suggest that you write a list of your own questions, based on your students’ work, using the ideas that follow. You may choose to write questions on each student’s work. If you do not have time to do this, select a few questions that will be of help to the majority of students. These can be written on the board at the end of the lesson.
Interpreting Distance–Time Graphs Student Materials Alpha 2 version 21 Oct 2010
© 2010 Shell Center/MARS University of Nottingham UK S-1
Journey to the Bus Stop Every morning Tom walks along a straight road from his home to a bus stop, a distance of 160 meters. The graph shows his journey on one particular day.
1. Describe what may have happened.
You should include details like how fast he walked.
2. Are all sections of the graph realistic? Fully explain your answer.
Interpreting Distance-Time Graphs Teacher Guide Beta Version
© 2011 MARS University of Nottingham 4
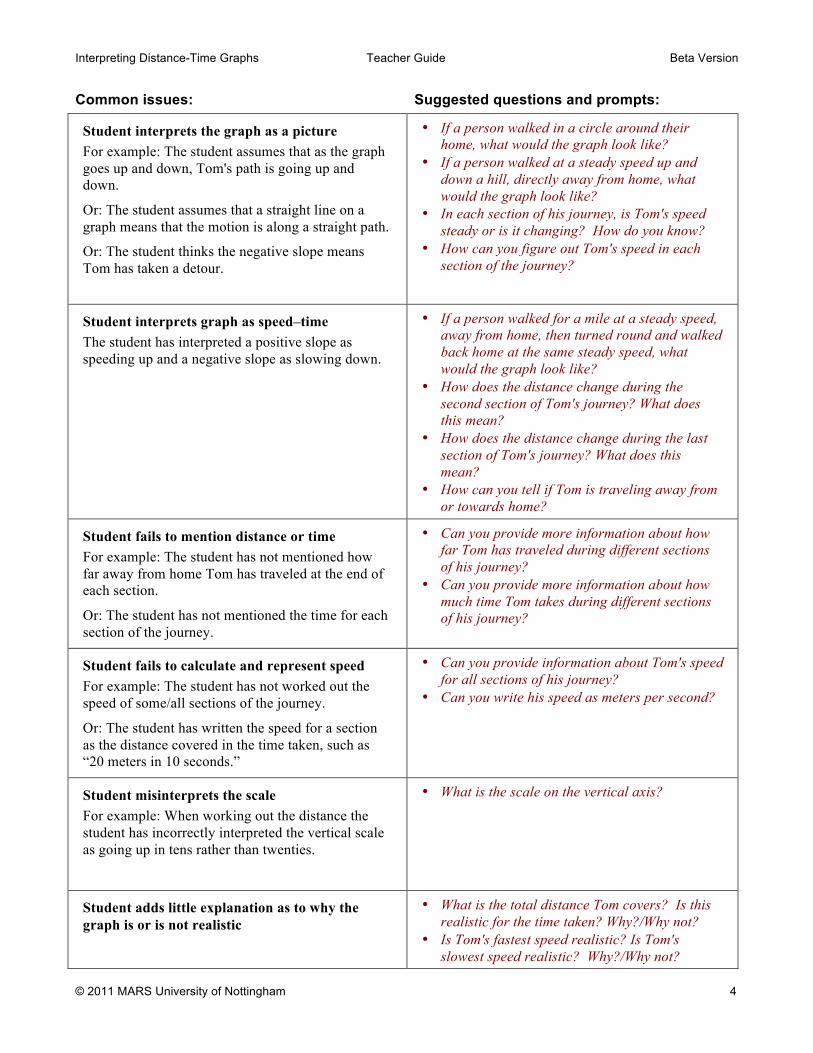
Common issues: Suggested questions and prompts:
Student interprets the graph as a picture For example: The student assumes that as the graph goes up and down, Tom's path is going up and down.
Or: The student assumes that a straight line on a graph means that the motion is along a straight path.
Or: The student thinks the negative slope means Tom has taken a detour.
• If a person walked in a circle around their home, what would the graph look like?
• If a person walked at a steady speed up and down a hill, directly away from home, what would the graph look like?
• In each section of his journey, is Tom's speed steady or is it changing? How do you know?
• How can you figure out Tom's speed in each section of the journey?
Student interprets graph as speed–time The student has interpreted a positive slope as speeding up and a negative slope as slowing down.
• If a person walked for a mile at a steady speed, away from home, then turned round and walked back home at the same steady speed, what would the graph look like?
• How does the distance change during the second section of Tom's journey? What does this mean?
• How does the distance change during the last section of Tom's journey? What does this mean?
• How can you tell if Tom is traveling away from or towards home?
Student fails to mention distance or time For example: The student has not mentioned how far away from home Tom has traveled at the end of each section.
Or: The student has not mentioned the time for each section of the journey.
• Can you provide more information about how far Tom has traveled during different sections of his journey?
• Can you provide more information about how much time Tom takes during different sections of his journey?
Student fails to calculate and represent speed For example: The student has not worked out the speed of some/all sections of the journey.
Or: The student has written the speed for a section as the distance covered in the time taken, such as “20 meters in 10 seconds.”
• Can you provide information about Tom's speed for all sections of his journey?
• Can you write his speed as meters per second?
Student misinterprets the scale For example: When working out the distance the student has incorrectly interpreted the vertical scale as going up in tens rather than twenties.
• What is the scale on the vertical axis?
Student adds little explanation as to why the graph is or is not realistic
• What is the total distance Tom covers? Is this realistic for the time taken? Why?/Why not?
• Is Tom's fastest speed realistic? Is Tom's slowest speed realistic? Why?/Why not?
Interpreting Distance-Time Graphs Teacher Guide Beta Version
© 2011 MARS University of Nottingham 5
Suggested lesson outline If you have a short lesson or you find the lesson is progressing at a slower pace than anticipated, we suggest you break the lesson after the first sharing of posters and continue it at a later time.
Whole-class introduction: interpreting and sketching graphs (10 minutes) Throughout this activity, encourage students to articulate their reasoning, justify their choices mathematically, and question the choices put forward by others. This introduction will provide students with a model of how they should work with their partners in the first small-group activity.
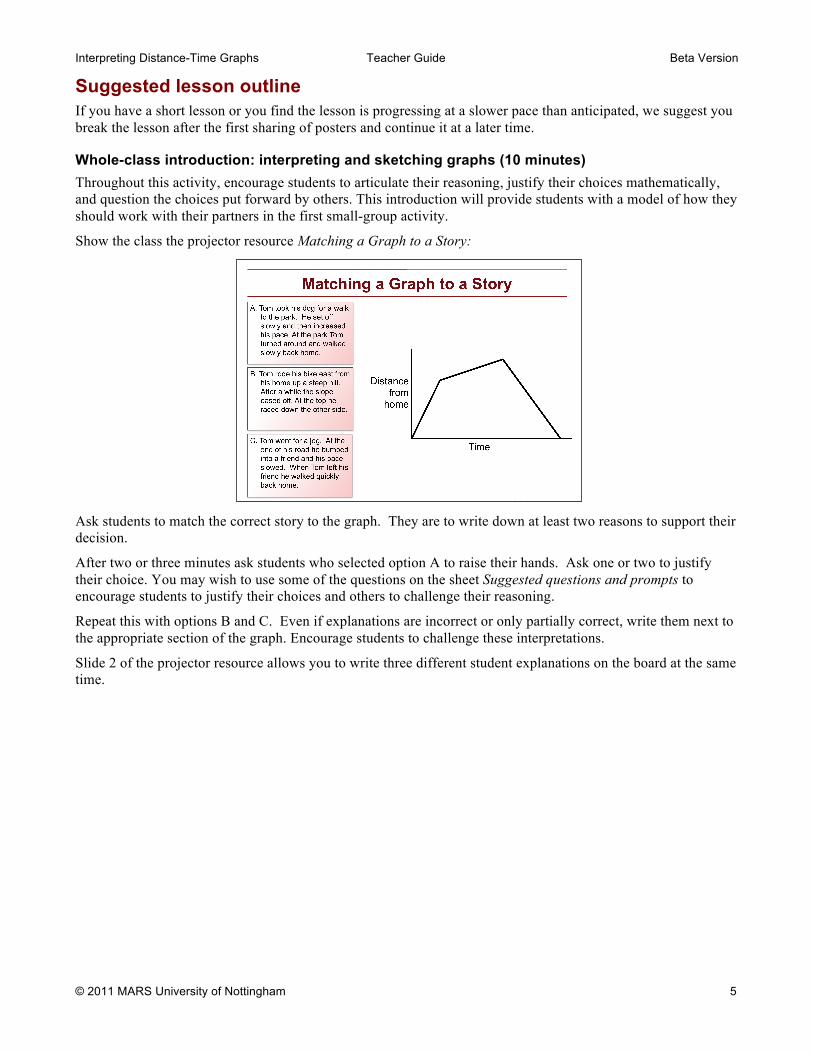
Show the class the projector resource Matching a Graph to a Story:
Ask students to match the correct story to the graph. They are to write down at least two reasons to support their decision.
After two or three minutes ask students who selected option A to raise their hands. Ask one or two to justify their choice. You may wish to use some of the questions on the sheet Suggested questions and prompts to encourage students to justify their choices and others to challenge their reasoning.
Repeat this with options B and C. Even if explanations are incorrect or only partially correct, write them next to the appropriate section of the graph. Encourage students to challenge these interpretations.
Slide 2 of the projector resource allows you to write three different student explanations on the board at the same time.

Interpreting Distance-Time Graphs Teacher Guide Beta Version
© 2011 MARS University of Nottingham 6
A graph may end up looking like this:
This is how students should annotate their graphs when working on the collaborative task.
Collaborative activity: matching Card sets A and B (20 minutes) Ask students to work in small groups of two or three students.
Give each group the Card Set A: Distance–Time Graphs, and Card Set B: Interpretations, along with a large sheet of paper and a glue stick for making a poster.
You are now going to continue to explore matching graphs with a story but as a group.
You will be given ten graph cards and ten story cards.
In your group take a graph and find a story that matches it. Alternatively, you may want to take a story and find a graph that matches it.
Take turns at matching pairs of cards. Each time you do this, explain your thinking clearly and carefully. If you think there is no suitable card that matches, write one of your own.
Place your cards side by side on your large sheet of paper, not on top of one another, so that everyone can see them.
Write your reasons for the match on the cards or the poster just as we did with the example in class. Give explanations for each line segment.
Make sure you leave plenty of space around the cards, as eventually you will be adding another card to each matched pair.
The purpose of this structured group work is to encourage students to engage with each other's explanations and take responsibility for each other's understanding.
Slide 3 of the projector resource summarizes these instructions.
Distance from
home
Time
Tom starts from home
Line not too steep - this means Tom slows down.
Furthest Tom gets from home.
Negative slope means Tom is walking back to his home.
Tom returns home.
Interpreting Distance-Time Graphs Teacher Guide Beta Version
© 2011 MARS University of Nottingham 7
You have two tasks during the small-group work: to make a note of student approaches to the task, and to support student reasoning.
Make a note of student approaches to the task Listen and watch students carefully. Note different student approaches to the task and any common mistakes. For example, students may interpret the graph as a picture or students may read the graph from right to left. Also notice the ways students check to see if their match is correct and how they explain and justify a match to each other. You can use this information to focus a plenary whole-class discussion.
Support student reasoning
Try not to make suggestions that move students towards a particular match. Instead, ask questions to help students to reason together.
If you find one student has produced a solution for a particular match, challenge another student in the group to provide an explanation.
John matched these cards. Sharon, why do you think John matched these two cards?
If you find students have difficulty articulating their decisions, then use the sheet Suggested questions and prompts to support your own questioning of students.
In trials of this lesson some students had difficulty stating where home is on the graph.
For this graph, where does the journey start? Is that home?
Give me a graph that shows a journey starting away from home.
For this graph, does the journey end at home? How do you know?
If the whole class is struggling on the same issue, you could write a couple of questions on the board and hold an interim, whole-class discussion. You could ask students who performed well in the assessment to help struggling students.
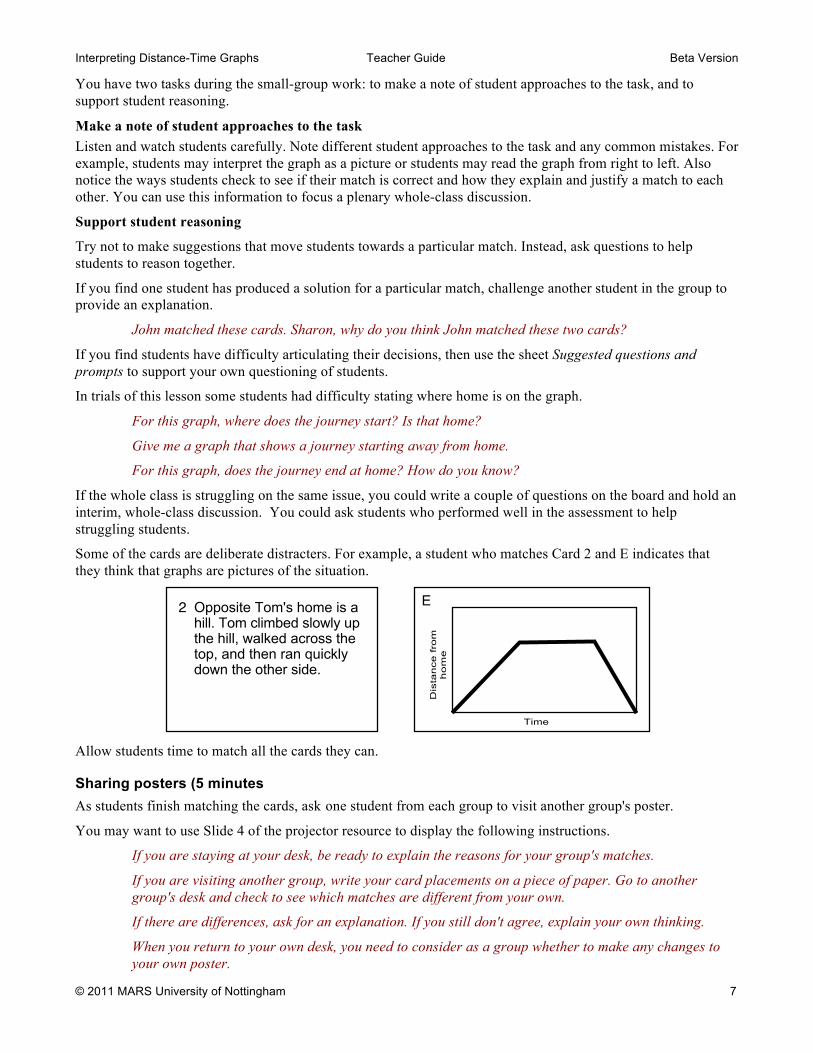
Some of the cards are deliberate distracters. For example, a student who matches Card 2 and E indicates that they think that graphs are pictures of the situation.
Allow students time to match all the cards they can.
Sharing posters (5 minutes As students finish matching the cards, ask one student from each group to visit another group's poster.
You may want to use Slide 4 of the projector resource to display the following instructions.
If you are staying at your desk, be ready to explain the reasons for your group's matches.
If you are visiting another group, write your card placements on a piece of paper. Go to another group's desk and check to see which matches are different from your own.
If there are differences, ask for an explanation. If you still don't agree, explain your own thinking.
When you return to your own desk, you need to consider as a group whether to make any changes to your own poster.
Dis
tan
ce f
rom
ho
me
Time
Opposite Tom's home is a hill. Tom climbed slowly up the hill, walked across the top, and then ran quickly down the other side.
2 E

Interpreting Distance-Time Graphs Teacher Guide Beta Version
© 2011 MARS University of Nottingham 8
Students may now want to make changes to their poster. At this stage there is no need for students to glue the cards onto their posters, as they may decide to make further changes.
If you need to extend the lesson over two days: Once students have finished sharing posters, organize a whole-class discussion. Invite pairs of students to describe one pair of cards that they think they have matched correctly, and the reasoning they employed. Encourage other students to challenge their explanations.
Finally, ask students to note their matches on the back of their poster, and to use a paperclip to attach all cards to the poster.
At the start of the second lesson, spend a few minutes reminding the class about the activity:
Can you remember what we were working on in the last lesson?
Return the posters to each group. The whole-class discussion on interpreting tables can serve as an introduction to the lesson.
Whole-class discussion: Interpreting tables (15 minutes) Bring the class together and give each student a mini-whiteboard, a pen, and an eraser. Display Slide 5 of the projector resource:
On your whiteboard, create a table that shows possible times and distances for Tom's journey.
After a few minutes, ask students to show you their whiteboards. Ask some students to explain how they created their tables. Write their figures on the board. Ask the rest of the class to check these figures.
Is Tom's speed slower or faster in this section compared to that section?
How do you know from the graph? From the table?
Is this speed constant? How can you tell? Do the figures in the table show a constant speed for this section of the journey?
What units might these be measured in?
Are these figures realistic?
© 2011 MARS University of Nottingham Beta Version Projector resources:
Making Up Data for a Graph
3
Time Distance
0
2
4
6
8
10
Interpreting Distance-Time Graphs Teacher Guide Beta Version
© 2011 MARS University of Nottingham 9
Collaborative activity: matching Card Set C (20 minutes) Hand out Card Set C: Tables of Data, and ask students to match these cards with the cards already on their poster.
You are now going to match tables with the cards already on your desk. In your group take a graph and try to find a table that matches it, or take a table and find a graph that matches it.
Again take turns at matching cards you think belong together. Each time you do this, explain your thinking clearly and carefully.
Write your reasons for the match on the poster.
Students may also wish to suggest suitable units for the distances and times on the cards.
The tables should help students confirm or modify existing matches.
As they work on the matching, support the students as in the previous matching activity.
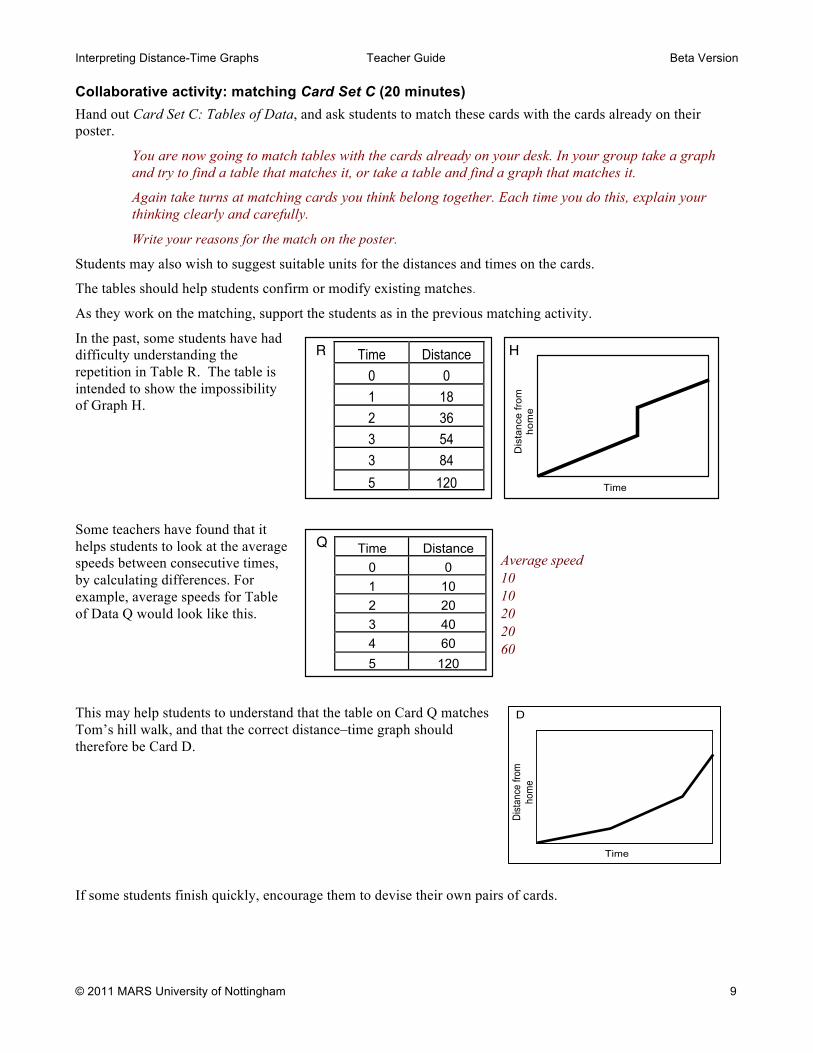
In the past, some students have had difficulty understanding the repetition in Table R. The table is intended to show the impossibility of Graph H.
Some teachers have found that it helps students to look at the average speeds between consecutive times, by calculating differences. For example, average speeds for Table of Data Q would look like this.
This may help students to understand that the table on Card Q matches Tom’s hill walk, and that the correct distance–time graph should therefore be Card D.
If some students finish quickly, encourage them to devise their own pairs of cards.
Time Distance 0 0 1 18 2 36 3 54 3 84 5 120
HR
Dis
tanc
e fro
mho
me
Time
Q Time Distance 0 0 1 10 2 20 3 40 4 60 5 120
Average speed1010202060
A B
C D
E F
Dist
ance
from
hom
e
Time
Dist
ance
from
hom
e
Time
Dist
ance
from
hom
e
Time
Dist
ance
from
hom
e
Time
Dist
ance
from
hom
e
Time
Dist
ance
from
hom
e
Time
Interpreting Distance-Time Graphs Teacher Guide Beta Version
© 2011 MARS University of Nottingham 10
Sharing posters (5 minutes) When students have completed the task, the student who has not already visited another pair should go share their work with another pair of students. Students are to share their reasoning as they did earlier in the lesson unit.
Students may now want to make final changes to their poster. When they are completely satisfied, ask them to glue their cards onto the large sheet of paper.
Plenary whole-class discussion (10 minutes) Using mini-whiteboards, make up some journeys and ask the class to show you the corresponding graphs.
On your whiteboards, draw a distance–time graph to show each of the following stories:
1. Sam ran out of his front door, then slipped and fell. He got up and walked the rest of the way to school.
2. Sara walked from home up the steep hill opposite her house. She stopped at the top to put her skates on, then skated quickly down the hill, back home again.
3. Chris cycled rapidly down the hill that starts at his house. He then slowed down as he climbed up the other side.
Ask students to show their whiteboards to the whole-class. Select some to explain their graph to the class. Encourage others in the class to challenge their reasoning.
Improving individual solutions to the assessment task (10 minutes) Return to the students their original assessment task Shape Statements, as well as a second blank copy of the task.
Look at your original responses and think about what you have learned this lesson.
Using what you have learned, try to improve your work.
If you have not added questions to individual pieces of work then write your list of questions on the board. Students should select from this list only the questions they think are appropriate to their own work.
If you find you are running out of time, then you could set this task in the next lesson or for homework.
Interpreting Distance-Time Graphs Teacher Guide Beta Version
© 2011 MARS University of Nottingham 11
Solutions
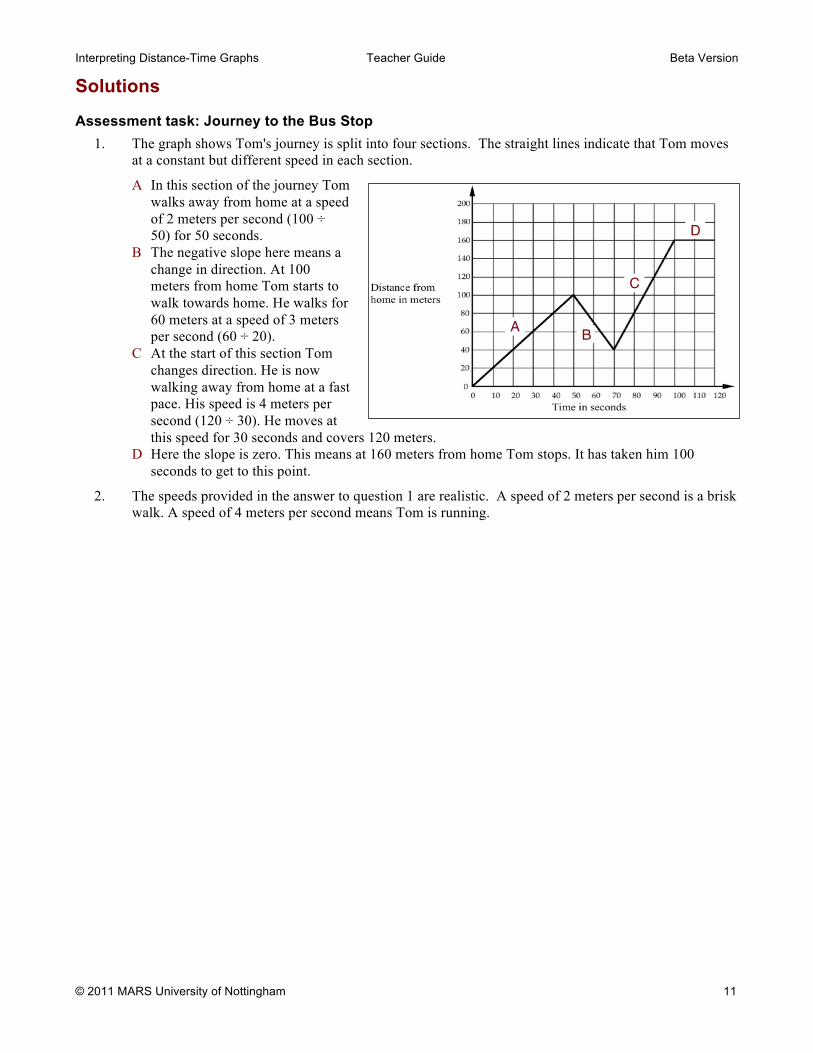
Assessment task: Journey to the Bus Stop 1. The graph shows Tom's journey is split into four sections. The straight lines indicate that Tom moves
at a constant but different speed in each section.
A In this section of the journey Tom walks away from home at a speed of 2 meters per second (100 ÷ 50) for 50 seconds.
B The negative slope here means a change in direction. At 100 meters from home Tom starts to walk towards home. He walks for 60 meters at a speed of 3 meters per second (60 ÷ 20).
C At the start of this section Tom changes direction. He is now walking away from home at a fast pace. His speed is 4 meters per second (120 ÷ 30). He moves at this speed for 30 seconds and covers 120 meters.
D Here the slope is zero. This means at 160 meters from home Tom stops. It has taken him 100 seconds to get to this point.
2. The speeds provided in the answer to question 1 are realistic. A speed of 2 meters per second is a brisk walk. A speed of 4 meters per second means Tom is running.
A B
C
D
Interpreting Distance-Time Graphs Teacher Guide Beta Version
© 2011 MARS University of Nottingham 12
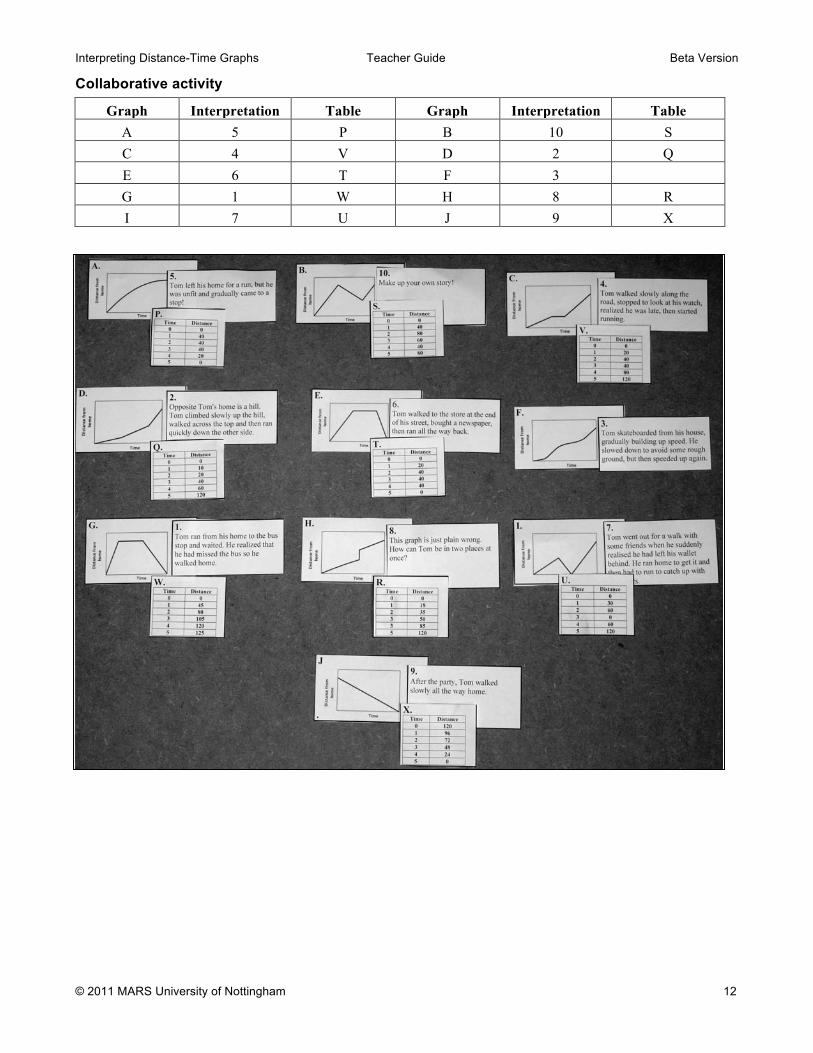
Collaborative activity
Graph Interpretation Table Graph Interpretation Table A 5 P B 10 S C 4 V D 2 Q E 6 T F 3 G 1 W H 8 R I 7 U J 9 X