day 1: interpreting graphs - white plains middle · pdf fileday 1: interpreting graphs swbat:...
TRANSCRIPT

1
Day 1: Interpreting Graphs SWBAT:
Identify independent and dependent variables
Interpret features of a qualitative graph, including rates of change and x- and y-intercepts
Decide whether a graph (or a function) is discrete or continuous given a description of the variables
Draw a qualitative graph from a context scenario and create a context scenario given a qualitative graph
Distinguish between linear change and nonlinear change Warm – Up Consider the following situation: If you owned a hair salon, how would you determine the cost of a haircut? What is the real-world meaning of the graph at right, which shows the relationship between the number of customers getting haircuts each week and the price charged for each haircut. What is the dependent variable? What is the independent variable? As the price increases, the number of haircuts ________________________ linearly. Conclusion: ____________________________________________________________
What does the slope indicate? _____________________________________________
What does the x-intercept indicate? _________________________________________ What does the y-intercept indicate? _________________________________________

2
a. Based on the graph, at what times is soda consumed most rapidly? b. When is the machine refilled? How can you tell? c. When is the machine empty? How can you tell? d. What do you think the student council will recommend to solve the problem? Both the graph of haircut customers and the graph in the example are shown as continuous graphs. In reality, the quantity of soda in the machine can take on only discrete values, because the number of cans must be a whole number. The graph might more accurately be drawn with a series of short horizontal segments, as shown at right. The price of a haircut and number of haircuts can also take on only discrete values. This graph might be more accurately drawn with separate points. However, in both cases, a continuous “graph sketch” make it easier to see the trends and patterns.
Example 1 Students at Central High School are complaining that the soda machine is frequently empty. Several student council members decide to study this problem. They record the number of cans in the soda machine at various times during a typical school day make a graph.

3
Practice
1. The graph below represents the cost of a bag of popcorn with respect to its mass in grams. Answer the following questions. Which bag is the most expensive and how much does it cost? Which bag has the least mass? What is this mass? Which bags have the same mass? What is this mass? Which bags cost the same? What is this cost? Which bag has the best value for your money? Why? What are the independent and dependent variables?
2. Analyze the following graph.
What does each segment represent?
Origin to A:
AB
BC
CD
DE
EF
FG
What are the independent and dependent variables?

4
3. The following graph shows the changes in volume of water in a watering can over time.
Answer the following questions.
What does point A represent?
What is happening from point A to point B?
What is happening from point B to point C?
What is happening from point C to point D?
Explain the situation at point D.
What are the independent and dependent
variables?
Example 2 Sketching a graph for a given situation.
Samuel went on a bicycle ride. He accelerated for 2 minutes until he reached a speed of 20
km/h, and then he cycled for 30 minutes at approximately 20 km/h. Samuel arrived at the
bottom of a hill and his speed decreased to approximately 5 km/h for about 10 minutes as he
cycled up the hill. He stopped at the top of the hill for about 10 minutes.
Sketch a graph of speed as a function of time for this situation. Label each aspect of the
graph and explain what each segment means. Properly label the x and y axis. Include scale
and a title.
Origin to A:
AB:
BC:
CD:
DE:
EF:

5
Practice:
At the beginning of a race, Alicia took 2 s to reach a speed of 8 m/s. She ran at
approximately 8 m/s for 12 seconds and then slowed to a stop in 2 s. Sketch a graph of
speed as a function of time. Label each section of your graph and explain what it represents.
Origin to A:
AB:
BC:
What are the independent and
dependent variables?

6
Summary The main point of this lesson is that graphs can represent many aspects of real-world situations.
Real – world Graph
growing/shrinking/unchanging increasing/decreasing/horizontal
discrete/continuous separated points/connected points
linear/nonlinear straight line/curve
independent/dependent variable horizontal/vertical axis
Exit Ticket This graph shows the depth of a scuba diver as a function of time passed.
How many minutes did the dive last? At what times did the diver stop her descent? What is the greatest depth that the diver reached? How long was the diver at that depth?
7
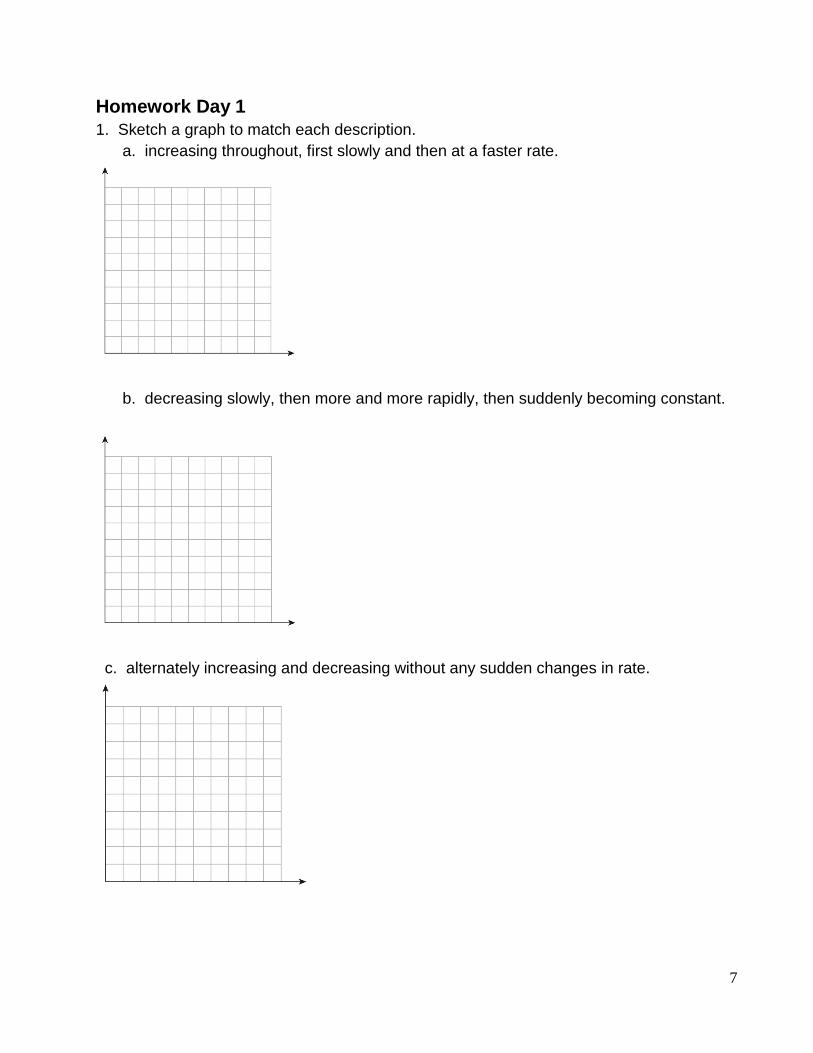
Homework Day 1
1. Sketch a graph to match each description.
a. increasing throughout, first slowly and then at a faster rate.
b. decreasing slowly, then more and more rapidly, then suddenly becoming constant.
c. alternately increasing and decreasing without any sudden changes in rate.

8
2. For each graph, write a description like those in exercise 1.
3. Match a description to each graph.
A. increasing more and more rapidly
B. decreasing more and more rapidly
C. increasing more and more slowly
D. decreasing more and more slowly
4. Harold’s concentration often wanders from the game of golf to
the mathematics involved in his game. His scorecard
frequently contains mathematical doodles and graphs.
a. What is a real-world meaning for this graph found on one
of his recent scorecards?
b. What units might he be using?
c. Describe a realistic domain and range for this graph.
Recall: domain refers to x-values and range to y-values.
d. Does this graph show how far the ball traveled? Explain.

9
5. Make up a story to go with the graph at right. Be sure to interpret the x- and y-
intercepts.
6. Sketch what you think is a reasonable graph for each relationship described. In each
situation, identify the variables and label your axes appropriately.
a. the height of a basketball during the last 10 seconds of a game.
b. the distance it takes to brake a car to a full stop, compared to the car’s speed when
the brakes are first applied.
c. the temperature of an iced drink as it sits on a table for a long period of time.
d. the speed of a falling acorn after a squirrel drops it from the top of an oak tree
e. your height above the ground as you ride a Ferris wheel.
USE THIS AREA FOR YOUR GRAPHS OR USE SEPARATE GRAPH PAPER.

10
7. Sketch what you think is a reasonable graph for each relationship described. In each
situation, identify the variables and label your axes appropriately. Identify the
independent and dependent variable. In each situation, will the graph
be continuous or will it be a collection of discrete points or pieces? Explain why.
a. the amount of money you have in a savings account that is compounded annually,
over a period of several years, assuming no additional deposits are made.
b. the same amount of money that you started with in 7a, hidden under your mattress
over the same period of time.
c. an adult’s shoe size compared to the adult’s foot length.

11
d. your distance from Orlando during a flight from Orlando to New York if your plane is
forced to circle the airport in a holding pattern when you approach New York.
e. the daily maximum temperature of a town, for a month.

12
PROJECT:
Graph a Story
Every graph tells a story. Make a graph to go with the story in Part 1. Then invent your
own story to go with the graph in Part 2.
As you interpret data and graphs that show a relationship between two variables, you must
always decide which is the independent variable and which is the dependent variable. You
should also consider whether the variables are discrete or continuous.
Part 1
Sketch a graph that reflects all the information given in this story.
“It was a dark and stormy night. Before the torrents of rain came, the bucket was empty.
The rain subsided at daybreak. The bucket remained untouched through the morning
until Old Dog Trey arrived as thirsty as a dog. The sun shown brightly through the
afternoon. Then Billy, the kid next door, arrived. He noticed two plugs in the side of the
bucket. One of them was about a quarter of the way up, and the second one was near the
bottom. As fast as you could blink an eye, he pulled out the plugs and ran away.”
Part 2 This graph tells a story. It could be a story about a lake, a bathtub, or whatever you imagine. Spend some time with your group discussing the information contained in the graph. Write a story that conveys all of this information, including when and how the rates of change increase or decrea

13
Day 2: Relations, Domain, and Range
Warm-Up Plot the following points on the axes provided.
A (4, 2) B (-3, 5) C (0, 4) D (5, 0)
Vocabulary Ordered Pairs Relation
Domain Range
What is an ordered pair? What is a relation?
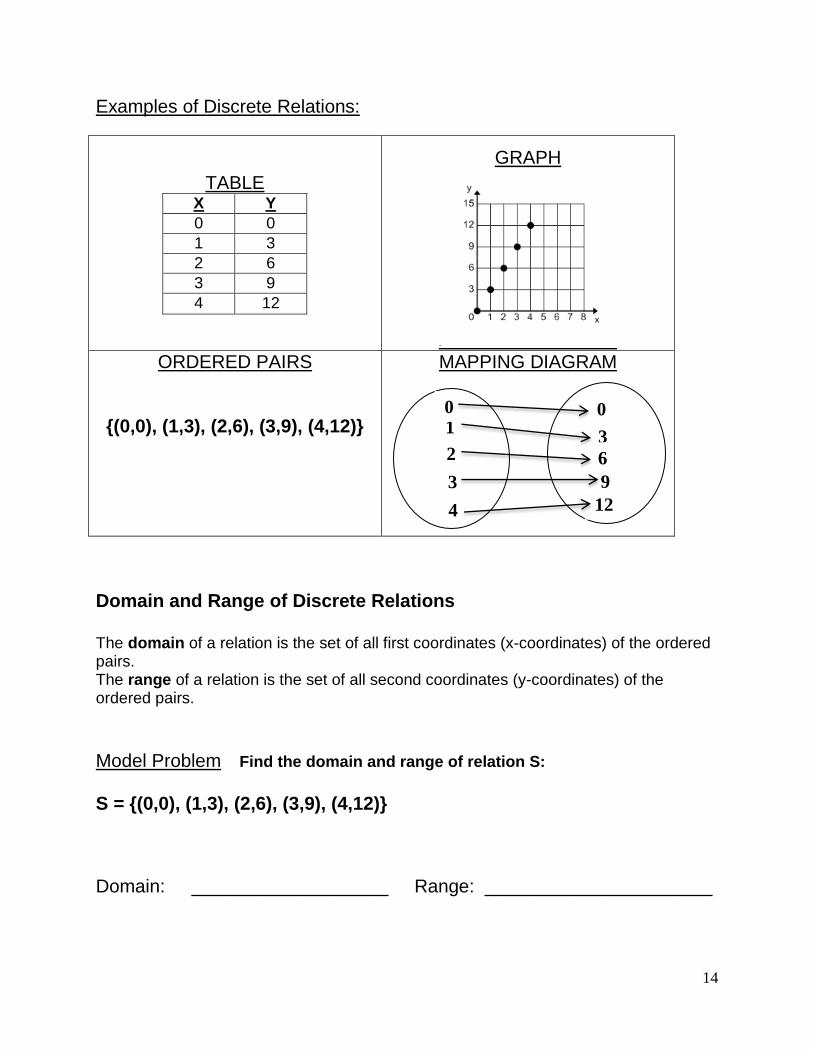
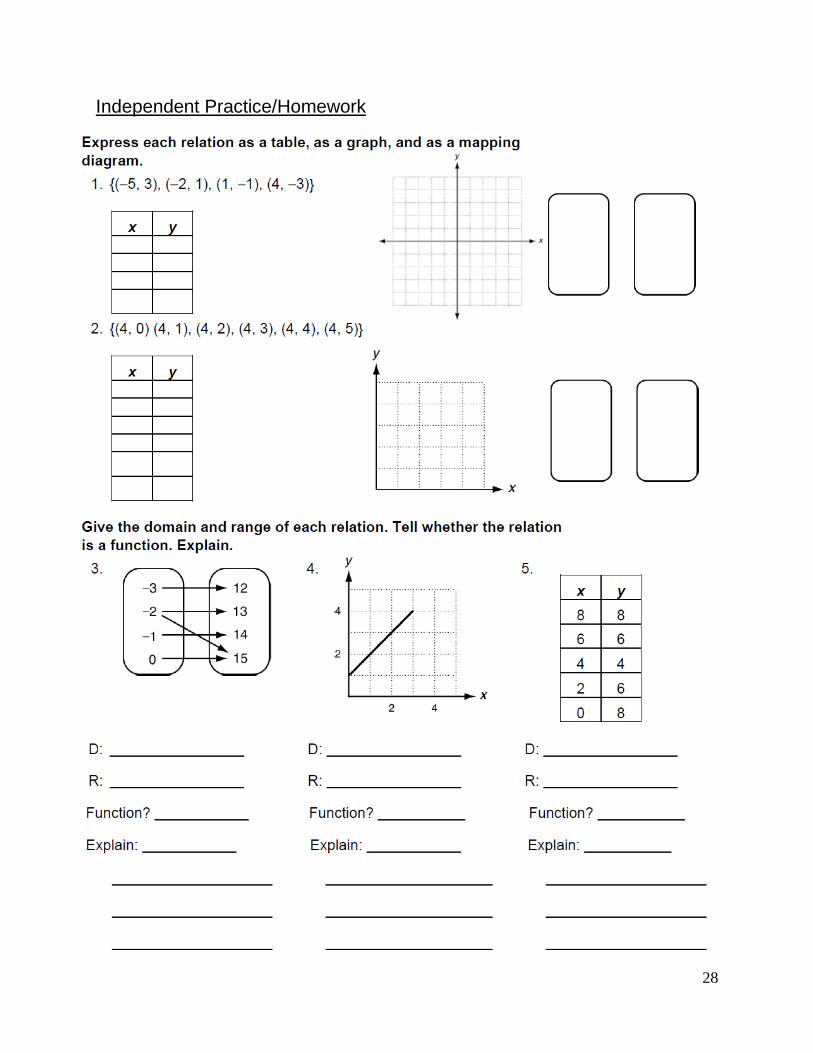
An ordered pair is defined as two numbers written in a certain order. We usually write it in parentheses like this: (4,5) An ordered pair can be used to show the position on a graph, where the "x" (horizontal) value is first, and the "y" (vertical) value is second. For example, the point (2, 3) means go 2 units right and 3 units up. A relation is a set of ordered pairs. It can be expressed in a table, as a set of ordered pairs, as a graph, or as a mapping diagram. When a relation contains a finite (countable) series of ordered pairs, it is called a discrete relation. When the set of ordered pairs is infinite (uncountable), it is called a continuous relation. A continuous relation is represented by a graph of a line or curve.
14
Examples of Discrete Relations:
TABLE X Y
0 0
1 3
2 6
3 9
4 12
GRAPH
ORDERED PAIRS
{(0,0), (1,3), (2,6), (3,9), (4,12)}
MAPPING DIAGRAM
Domain and Range of Discrete Relations
The domain of a relation is the set of all first coordinates (x-coordinates) of the ordered pairs. The range of a relation is the set of all second coordinates (y-coordinates) of the ordered pairs.
Model Problem Find the domain and range of relation S:
S = {(0,0), (1,3), (2,6), (3,9), (4,12)}
Domain: ___________________ Range: ______________________
1 0
2
3
4
0
3
6
9
12

15
Exercise
Give the domain and range of this relation: Domain: __________________________ Range: _____________________________
Domain: ___________________________ Range: ____________________________
Domain and Range of Continuous Relations If the relation is continuous, we cannot list the ordered pairs in the set. We must describe it using an inequality or interval notation. This part of the lesson will teach you how to describe the domain and the range using inequalities or interval notation.

16
Model Problem A/Exercise A Domain of Horizontal Lines
Express the domain of each relation 1) as an inequality and 2) in interval notation.
Inequality:________________ Inequality: _______________ Inequality: ________________ Interval Notation: __________ Interval Notation: __________ Interval Notation: ___________
Inequality: _______________ Interval Notation:__________
Inequality: _______________ Interval Notation: __________
Inequality: __________________ Interval Notation: ____________

17
Model Problem B/Exercise B Range of Vertical Lines
Express the range of each relation 1) as an inequality and 2) in interval notation.
Inequality: _____________ Interval Notation:________
Inequality: _______________ Interval Notation: __________
Inequality: _____________ Interval Notation: ________
Inequality: ____________
Interval Notation: _______
Inequality: ____________
Interval Notation: ______
Inequality: _____________
Interval Notation: _______
18
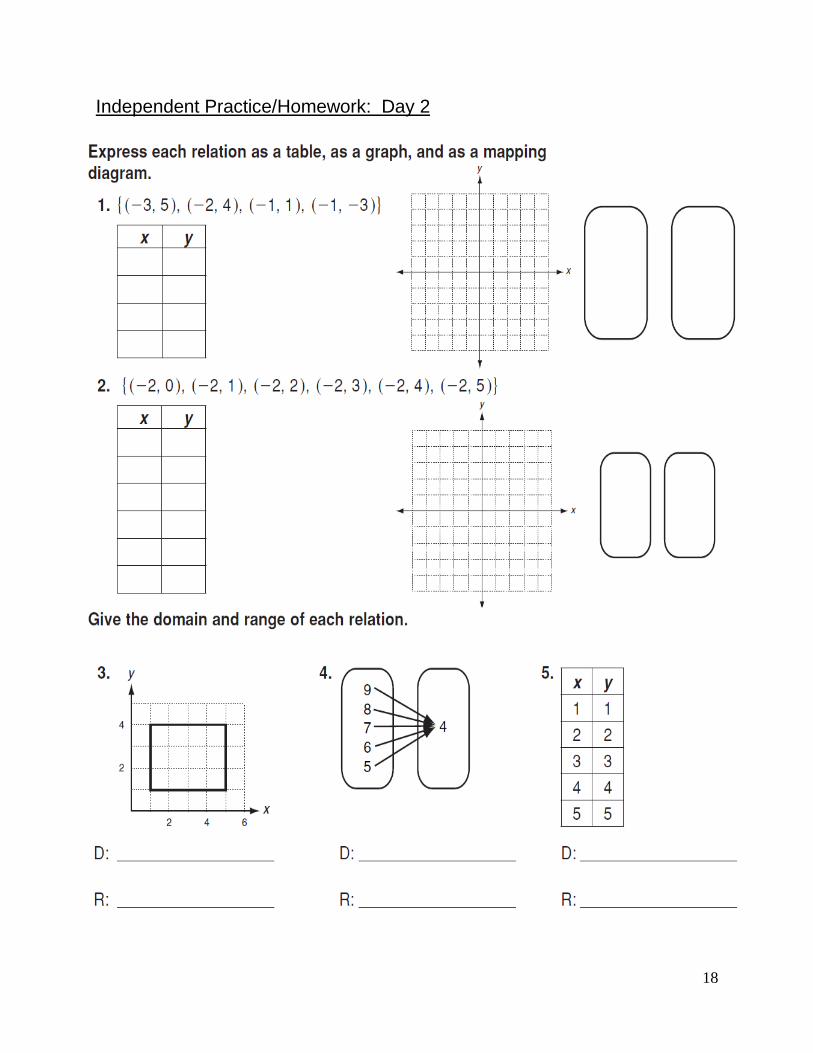
Independent Practice/Homework: Day 2
19
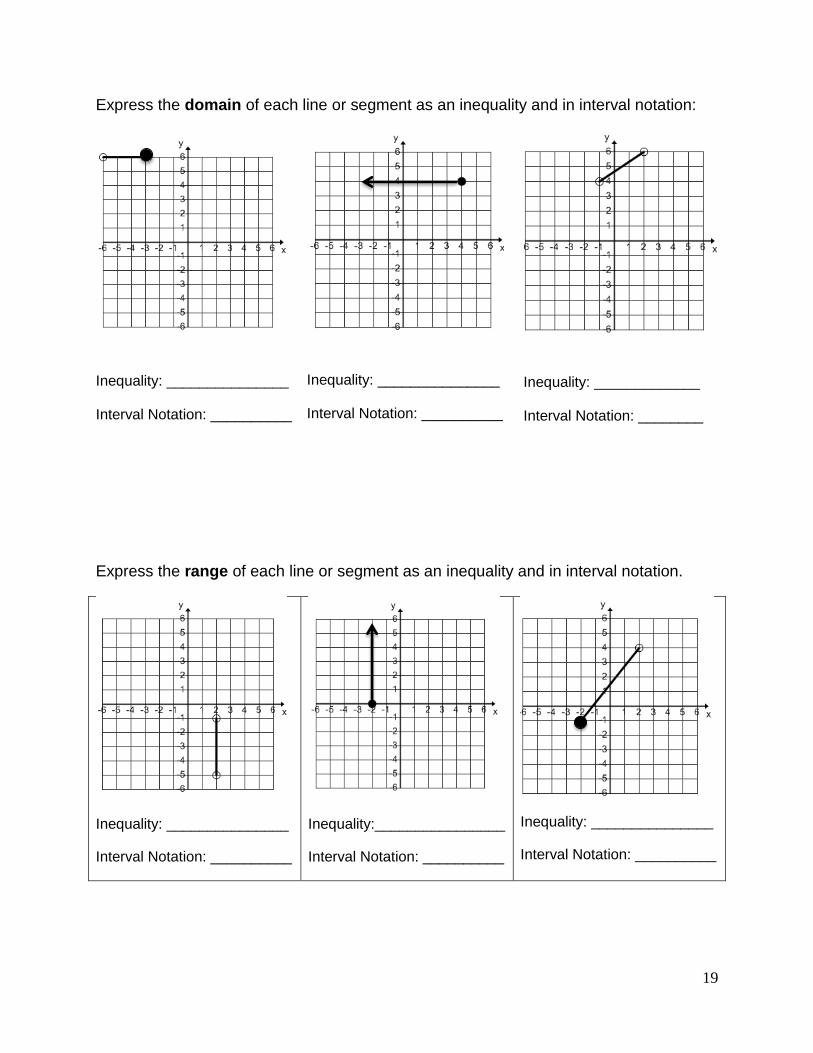
Express the domain of each line or segment as an inequality and in interval notation:
Inequality: _______________ Interval Notation: __________
Inequality: _______________ Interval Notation: __________
Inequality: _____________ Interval Notation: ________
Express the range of each line or segment as an inequality and in interval notation.
Inequality: _______________
Interval Notation: __________
Inequality:________________
Interval Notation: __________
Inequality: _______________
Interval Notation: __________

20
Day 3: More Practice on Domain and Range Warm-Up Sketch a segment on the axes below whose domain is [-3, 2).
Model Problem The “Box Method”
State the domain and range of the relation below as an inequality and in interval notation: Domain = ___________________________ Range_______________________
Why do we need to express the domain and range as an inequality? _______________________________________________________

21
Guided Practice
Give the domain and range of the relation below as an inequality and in interval notation:
Domain: _____________________
_____________________
Range: _______________________
___________________
Unbounded Relations (Relations that continue forever on one or both sides)
1. Words: Domain: ____________________
____________________ Range: _____________________
_____________________
2. Words: Domain: ____________________
____________________ Range: _____________________ _____________________

22
Independent Practice/Homework State the domain and range of each relation.
3. Words: Domain: ____________________
____________________ Range: _____________________ _____________________
Domain: _________________ Domain: ____________________
Range: _________________ Range: ____________________
Domain: _________________ Domain: ____________________
Range: _________________ Range: ____________________

23
Sketch a function below whose domain and range are given.
Domain: _________________ Domain: ____________________
Range: _________________ Range: ____________________
Domain: Domain: (-5, -2)
Range: Range: [-5, 5]

24
Day 4 – Functions
Warm-Up State the domain and range of this relation.
What is a function? A function is a mapping between two sets, X and Y, in which each element of X is matched to one and only one element of Y. The set X is called the domain of the function. The notation f: X Y is used to name the function and describes both X and Y. If x is an element in the domain X of the function f, then x is matched to an element of Y called
“f of x” represented like this: f(x). We say that f(x) is the image or output of x.
Example
Domain Range

25
The range of a function are the elements in Y that have something in X mapped onto them. In other words, all the elements y such that y = f(x).
In other words…. A relation can be called a function if no element in the domain is assigned to two different elements in the range. That is, no element in the domain repeats. We can see this illustrated in ordered pairs, mapping diagrams, and graphs.
Examples of Functions vs. Non-Functions
A) Set of Ordered Pairs R = {(1, 2), (2, 3), (3, 6), (4, 5)} This is a function because no x-value is paired with two different y-values. S = {(1, 2), (2, 2), (3, 2), (4, 2)} This is a function because no x-value is paired with two different y-values. The domain elements (x-values) do not repeat. It does not matter that the range elements (y-values) do. T = {(4, 1), (4, 2), (5, 3), (6, 2)} This is NOT a function because the element {4} in the domain is paired with two different values in the range (1 and 2).
B) Mapping Diagrams This is a function because no element in the domain is going to two different elements in the range. Note: The range in this case is {4, 6}, not {4, 5, 6}. {5} has nothing pointing to it, so it is not in the range.
A
B
C
4
5
6

26
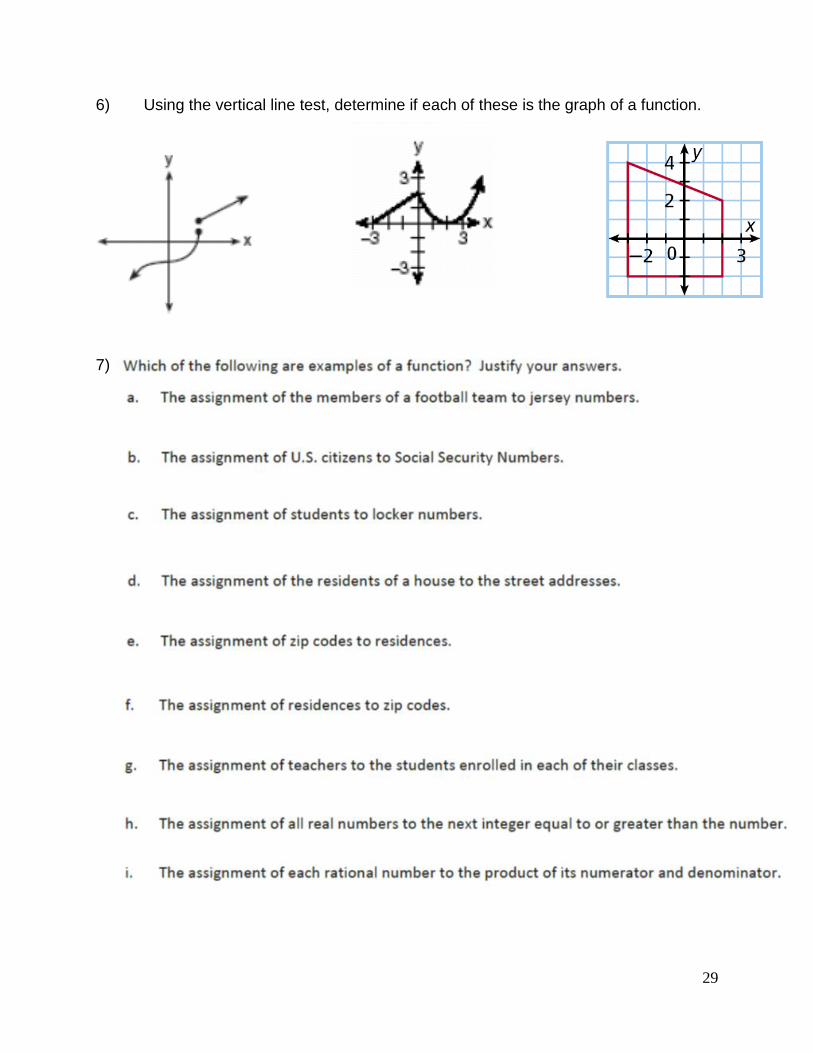
Exercise Tell whether each relation is a function. Explain why or why not.
3) Is the assignment of students to English teachers an example of a function? Explain why or why not. 4) Is the assignment of English teachers to students an example of a function? Explain why or why not.
B) Mapping Diagrams (cont’d) This is NOT a function because the element A in the domain is paired with two different elements in the range, 4 and 5.
4
5
6
A
B
C

27
C) Graphs: Using the Vertical Line Test
To tell whether a relation is a function when we are given a graph, we use the vertical line test.
The Vertical Line Test If any vertical line drawn to the graph hits the graph in one and only one point, then the graph is a function. If the vertical line hits the graph more than once at any point on the graph, then the graph is NOT a function.
The vertical line represents an x-value (an element in the domain). If it hits the graph more than once, that element in the domain has more than one element in the range (a y-value) assigned to it, and it is not a function. That is why the vertical line test works!
Examples
Any vertical line hits the graph only once, no matter where you draw it. This is the graph of a function.
A vertical line can hit the graph more than once. This is NOT the graph of a function.
28
Independent Practice/Homework
29
6) Using the vertical line test, determine if each of these is the graph of a function.
7)