interaction effects of climate and land use/land cover change on soil organic carbon sequestration
TRANSCRIPT

Science of the Total Environment 493 (2014) 974–982
Contents lists available at ScienceDirect
Science of the Total Environment
j ourna l homepage: www.e lsev ie r .com/ locate /sc i totenv
Interaction effects of climate and land use/land cover change on soilorganic carbon sequestration
Xiong Xiong a,⁎, Sabine Grunwald a, D. BrentonMyers b, C.Wade Ross a,Willie G. Harris a, Nicolas B. Comerford c
a Department of Soil and Water Science, University of Florida, Gainesville, FL 32611, USAb Division of Plant Science, University of Missouri, Columbia, MO 65211, USAc North Florida Research and Education Center, University of Florida, Quincy, FL 32351, USA
H I G H L I G H T S
• Soils in Florida (FL) have acted as a sink for carbon (C) over the last 40 years.• Climate interacting with land use/land cover impacted soil C sequestration.• Land use/land cover in FL changed significantly over the past 40 years.• Some Florida soils continue to sequester C under projected climate.
⁎ Corresponding author at: 1184 McCarty Hall A, UniveGainesville, FL 32611, USA. Tel.: +1 352 294 3145.
E-mail address: [email protected] (X. Xiong).
http://dx.doi.org/10.1016/j.scitotenv.2014.06.0880048-9697/© 2014 Elsevier B.V. All rights reserved.
a b s t r a c t
a r t i c l e i n f oArticle history:Received 23 April 2014Received in revised form 18 June 2014Accepted 20 June 2014Available online 7 July 2014
Editor: D. Barcelo
Keywords:Land use/land cover changeSoil carbon sequestrationClimate changeSoil carbon change
Historically, Florida soils stored the largest amount of soil organic carbon (SOC) among the conterminousU.S. states (2.26 Pg). This region experienced rapid land use/land cover (LULC) shifts and climate change in thepast decades. The effects of these changes on SOC sequestration are unknown. The objectives of this studywere to 1) investigate the change in SOC stocks in Florida to determine if soils have acted as a net sink or netsource for carbon (C) over the past four decades and 2) identify the concomitant effects of LULC, LULC change,and climate on the SOC change. A total of 1080 sites were sampled in the topsoil (0–20 cm) between 2008and 2009 representing the current SOC stocks, 194 of which were selected to collocate with historicalsites (n = 1251) from the Florida Soil Characterization Database (1965–1996) for direct comparison.Results show that SOC stocks significantly differed among LULC classes – sugarcane and wetland containedthe highest SOC, followed by improved pasture, urban, mesic upland forest, rangeland, and pineland whilecrop, citrus and xeric upland forest remained the lowest. The surface 20 cm soils acted as a net sink for Cwith the median SOC significantly increasing from 2.69 to 3.40 kg m−2 over the past decades. The SOCsequestration rate was LULC dependent and controlled by climate factors interacting with LULC.Higher temperature tended to accelerate SOC accumulation, while higher precipitation reduced the SOCsequestration rate. Land use/land cover change observed over the past four decades also favored the Csequestration in soils due to the increase in the C-rich wetland area by ~140% and decrease in the C-pooragricultural area by ~20%. Soils are likely to provide a substantial soil C sink considering the climate andLULC projections for this region.
© 2014 Elsevier B.V. All rights reserved.
1. Introduction
It has been estimated that soil organic carbon (SOC) constitutesabout two-thirds of the Earth's terrestrial carbon pool (Stockmannet al., 2013). Its active interactions with biosphere and atmosphere
rsity of Florida, PO Box 110290,
carbon pools make it a critical component in the global carbon cycle(Kutsch et al., 2010). Great scientific attention has been drawn to theSOC pool because of the huge potential to deposit carbon belowgroundwith a relatively slow turnover rate (Post et al., 1982). However, the SOCpool is susceptible to human interferences primarily as land use/landcover (LULC) change. Worldwide, conversions from primary forestto agricultural land are thought to be depleting SOC while afforestationis considered ameans to restore SOC stocks (Genxu et al., 2002; Guo andGifford, 2002; DeGryze et al., 2004; Grünzweig et al., 2004; Dawson andSmith, 2007; Maia et al., 2010).

975X. Xiong et al. / Science of the Total Environment 493 (2014) 974–982
Climate change has raised concerns about its impact on globalSOC stocks. However, there has been no consensus on soil's roleas a sink or source in response to global warming (Davidson andJanssens, 2006). The controversy results from the complex interactionbetween soil and environments. Microbial activity and decomposi-tion of soil organic matter (SOM) depend on the amount, structure,composition of biotic material input to soils and environmental con-ditions (e.g., temperature, moisture, and nutrient status) (Kutschet al., 2010). Among these environmental conditions, the effect oftemperature on the microbial decomposition of SOM has been exten-sively studied in the context of global climate change (Kirschbaum,1995; Giardina and Ryan, 2000; Fierer et al., 2005). Some studieshave shown that the warming temperature can accelerate microbialdecomposition of SOM and cause a net loss of carbon (C) to theatmosphere (Davidson et al., 2000; Bellamy et al., 2005; Dorrepaalet al., 2009). However, other studies argued that the increasingtemperature can lead to a net gain of SOC by promoting biomassinput to soil, which exceeds the increase of decomposition (Nemaniet al., 2003; Bond-Lamberty and Thomson, 2010). The debatereflects the complexity in temperature sensitivity in respect toSOC decomposition. SOM has a wide range of intrinsic temperaturesensitivity of decomposition because it consists of thousands oforganic compounds each of which has its own inherent decomposi-tion property (Kutsch et al., 2010). Furthermore, the temperaturesensitivity can be confounded by some edaphic and environmentalconditions that interfere with the decomposition process. Forexample, SOM can be physically protected from decompositionwhen contained within soil aggregates, or be chemically protectedif adsorbed onto soil mineral surfaces (Davidson and Janssens,2006). LULC plays a critical role in the response of SOC to temperaturechange. On the one hand, LULC controls the quantity and quality oforganic compounds that enter soils, and subsequently determines theintrinsic temperature sensitivity of the SOM decomposition. On theother hand, LULC also changes the soil and environmental conditionsthat can further affect the apparent temperature sensitivity (Post andKwon, 2000; Jones et al., 2005; Davidson and Janssens, 2006). Thereis a need to study the interaction effect of LULC and climate on SOCchanges in order to better understand how SOC responds to climatechange.
Florida soils store approximately 2.26 Pg of SOC – more thanany other state in the conterminous U.S. according to the U.S. GeneralSoil Map (Natural Resources Conservation Service, 2006). This is pri-marily due to the extensive occurrence of Histosols in the 46,951 km2
of wetlands in the state especially in south Florida (U.S. Fish andWildlife Service, 2009). In addition, Florida features the SOC-richSpodosols which cover about 32% of the land area. The formation ofthese high SOC soils is attributed to the unique climatic (high tempera-ture and precipitation), topographic (flat landscape) and hydrologic(high water table) conditions (Stone et al., 1993; Vasques et al., 2012).Meanwhile, Florida has been experiencing significant LULC shiftswhich include rapid urban growth and losses of agricultural and forestland for the past decades (Kautz et al., 2007), which may have causedsignificant SOC change in Florida. In a recent study, Ross et al. (2013)made the first assessment of SOC stock change over the last 40 yearsin the northeast and east central regions of Florida (~15% of the areaof Florida) and found that soils acted as a net sink for C. However, atstate scale there is still substantial lack in knowledge about how SOCstocks changed over the past decades. More importantly, the anthro-pogenic and natural factors that caused the SOC temporal change inFlorida still remain unknown. Understanding the driving factorsthat determine if soils act as a sink or a source for carbon is criticalbecause future projections for this region indicate substantial climatechange and land use shifts (Zwick and Carr, 2006; Konrad et al.,2013). Therefore, the objectives of the study were to 1) investigatethe SOC stock change to determine if Florida soils act as a net sink ornet source for C over the past four decades, and 2) identify the unique
and interaction effects of LULC and climate on SOC stocks andsequestration.
2. Materials and methods
2.1. Study area
The study area is the state of Florida, located in the southeast UnitedStates, with latitudes from 24°27′ N to 31°00′ N and longitudes from80°02′ W to 87°38′ W. Florida covers approximately 150,000 km2
(United States Census Bureau, 2000). The climate is humid andsubtropical in northern and central Florida and is humid and tropicalin southern Florida. Themean annual precipitation of Florida is 1373mmand the mean annual temperature is 22.3 °C (National Climatic DataCenter, 2008). Overall, soils in Florida are sandy in texture. Dominantsoil orders of Florida are: Spodosols (32%), Entisols (22%), Ultisols(19%), Alfisols (13%), and Histosols (11%). Most frequent soil subgroupsare: Aeric Alaquods, Ultic Alaquods, Lamellic Quartzipsamments,Typic Quartzipsamments, and Arenic Glossaqualfs (Natural ResourcesConservation Service, 2009). The Florida LULC consists mainly ofwetlands (28%), pinelands (18%), urban and barren lands (15%),agriculture (9%), rangelands (9%), and improved pasture (8%)(Florida Fish and Wildlife Conservation Commission, 2003). Florida'stopography is muted with gentle slopes varying from 0 to 5% in almostthe whole State (United States Geological Survey, 1999).
2.2. Historical SOC data
The historical SOC dataset is from the Florida Soil CharacterizationDatabase (FSCD) which includes 1251 site-specific soil profiles (Fig. 1).Each of the soil profiles were collected and described within the timeperiod 1965 to 1996. Soil sampling locations were selected based ontacit knowledge of field soil scientists for the purposes of soil surveydevelopment and verification.
The FSCD measured SOC and BD values for each genetic horizonup to 2 m depth. SOM was measured in mineral soils (A, B, C andE horizons) by the Walkley–Black modified acid-dichromate (WB)method (Nelson and Sommers, 1996) and in organic soils, SOMwas measured by loss-on-ignition (LOI).
2.3. Current SOC dataset
A new soil sampling campaign was designed and carried outbetween 2008 and 2009 to quantify the current topsoil SOC stocksacross Florida. A total of 1080 sites were sampled in the topsoil(0–20 cm) (Fig. 1). A random sampling design stratified by the com-bination of soil suborder and LULC was used to pre-select locations.The two spatial layers (soil suborder derived from NRCS (2009)and LULC derived from the FFWCC (2003)) were overlaid to createa strata map (89 strata). Sampling locations were spatially randomlyselected in each stratum and the number of samples in each stratumwas proportional to the size of the stratum. Among the 1080 sites,194 were randomly selected to overlap with the historical sites(collocated sites) from FSCD to facilitate the assessment of site-specific SOC change over the past decades. Samples were collectedusing a 5.7-cm-diameter-steel core at 0–20 cm depth, transferredto ziploc bags, labeled, kept in 0 °C coolers, and transported to thelaboratory. Then the samples were air dried, weighted, sieved througha 2-mm sieve, and ball milled for laboratory analyses.
Total carbon (TC) was analyzed by combustion catalytic oxidation at900 °C and inorganic carbon (IC) was analyzed by phosphoric acidextraction at 200 °C (Shimadzu SSM-5000A). Soil organic Cwas derivedby subtraction (TC − IC). The laboratory SOC measurements in massunits (%) were converted to stock units (kg m−2) using the measuredbulk density and soil depth (20 cm).

Fig. 1. The historical sites from the Florida Soil Characterization Database (1965–1996), current sampling sites (2008–2009), and the 194 sites where current and historical sitesare collocated.
976 X. Xiong et al. / Science of the Total Environment 493 (2014) 974–982
2.4. Harmonization of historical and current datasets
To derive SOC change historical and current data had to beharmonized. The data harmonization procedure has been fullydocumented in Ross et al. (2013). Briefly, pedotransfer functions(PTFs) were developed using linear regression on a representativesoil set (n: 144) that spans across soil types found in Florida to accountfor the systematic error due to different SOC measurement methods inhistoric and contemporary soil datasets. Then a depthweighted averageof horizon-based SOC density was calculated to standardize them tofixed depth (0–20 cm).
2.5. Carbon sequestration rates
The SOC sequestration rates were calculated according to Eqs. (1)and (2) for all collocated sites.
ΔSOC x0; NYð Þ ¼ SOC x0;YMcð ÞDS2−SOC x0;YMhð ÞDS1 ð1Þ
SOCseq x0ð Þ ¼ ΔSOC x0; NYð ÞNY
ð2Þ
where, DS1 is the historical (1965–1996) SOC dataset, DS2 is thecurrent (2008–2009) SOC dataset, YMh is the year of historicalmeasurement (DS1), YMc is the year of current measurement(DS2), NY is the number of years between historical and current ob-servations (NY)= YMc− YMh, SOC is SOC stocks in g m−2, SOCseq isthe SOC sequestration rate (g m−2 yr−1) constrained to collocatedhistorical and current sites (x0), and x0 is the geographic coordinate(x and y coordinates) of collocated sites.
Positive SOCseq values represent soil carbon gains (sequestration)and negative SOCseq values represent soil carbon losses over theconsidered time period.
2.6. LULC and climate data
The Florida LULC data of 1995, 2004 and 2008–2011 were acquiredfrom the Florida Department of Environmental Protection (FDEP) andthe data of 1970s (i.e., data collected over a 10-year span) from theUnited States Geological Survey (USGS). The LULC changes at thecollocated sites were tracked by comparing the historical LULC dataand the LULC type determined by the sampling crew in the currentsampling campaign. In order to confirm the LULC changes, the observedLULC changes were further scrutinized and confirmed with the
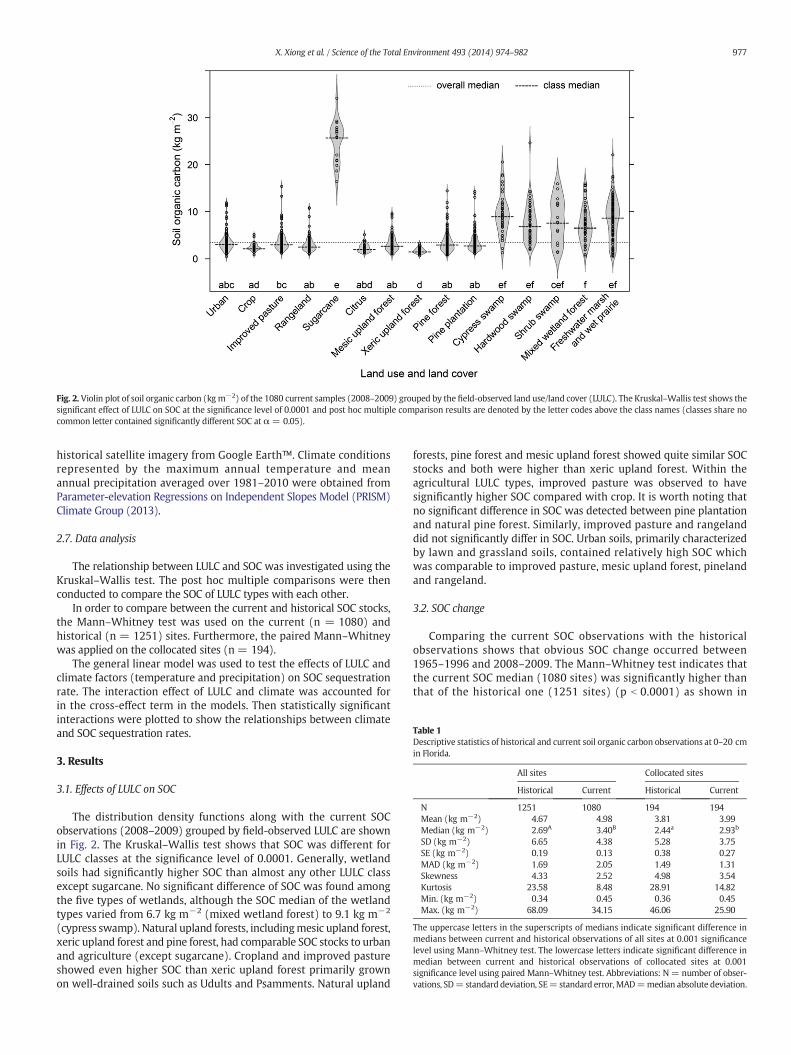
Fig. 2. Violin plot of soil organic carbon (kgm−2) of the 1080 current samples (2008–2009) grouped by the field-observed land use/land cover (LULC). The Kruskal–Wallis test shows thesignificant effect of LULC on SOC at the significance level of 0.0001 and post hoc multiple comparison results are denoted by the letter codes above the class names (classes share nocommon letter contained significantly different SOC at α = 0.05).
Table 1Descriptive statistics of historical and current soil organic carbon observations at 0–20 cmin Florida.
All sites Collocated sites
Historical Current Historical Current
N 1251 1080 194 194Mean (kg m−2) 4.67 4.98 3.81 3.99Median (kg m−2) 2.69A 3.40B 2.44a 2.93b
SD (kg m−2) 6.65 4.38 5.28 3.75SE (kg m−2) 0.19 0.13 0.38 0.27MAD (kg m−2) 1.69 2.05 1.49 1.31Skewness 4.33 2.52 4.98 3.54Kurtosis 23.58 8.48 28.91 14.82Min. (kg m−2) 0.34 0.45 0.36 0.45Max. (kg m−2) 68.09 34.15 46.06 25.90
The uppercase letters in the superscripts of medians indicate significant difference inmedians between current and historical observations of all sites at 0.001 significancelevel using Mann–Whitney test. The lowercase letters indicate significant difference inmedian between current and historical observations of collocated sites at 0.001significance level using paired Mann–Whitney test. Abbreviations: N = number of obser-vations, SD= standard deviation, SE= standard error,MAD=median absolute deviation.
977X. Xiong et al. / Science of the Total Environment 493 (2014) 974–982
historical satellite imagery from Google Earth™. Climate conditionsrepresented by the maximum annual temperature and meanannual precipitation averaged over 1981–2010 were obtained fromParameter-elevation Regressions on Independent Slopes Model (PRISM)Climate Group (2013).
2.7. Data analysis
The relationship between LULC and SOC was investigated using theKruskal–Wallis test. The post hoc multiple comparisons were thenconducted to compare the SOC of LULC types with each other.
In order to compare between the current and historical SOC stocks,the Mann–Whitney test was used on the current (n = 1080) andhistorical (n = 1251) sites. Furthermore, the paired Mann–Whitneywas applied on the collocated sites (n = 194).
The general linear model was used to test the effects of LULC andclimate factors (temperature and precipitation) on SOC sequestrationrate. The interaction effect of LULC and climate was accounted forin the cross-effect term in the models. Then statistically significantinteractions were plotted to show the relationships between climateand SOC sequestration rates.
3. Results
3.1. Effects of LULC on SOC
The distribution density functions along with the current SOCobservations (2008–2009) grouped by field-observed LULC are shownin Fig. 2. The Kruskal–Wallis test shows that SOC was different forLULC classes at the significance level of 0.0001. Generally, wetlandsoils had significantly higher SOC than almost any other LULC classexcept sugarcane. No significant difference of SOC was found amongthe five types of wetlands, although the SOC median of the wetlandtypes varied from 6.7 kg m−2 (mixed wetland forest) to 9.1 kg m−2
(cypress swamp). Natural upland forests, includingmesic upland forest,xeric upland forest and pine forest, had comparable SOC stocks to urbanand agriculture (except sugarcane). Cropland and improved pastureshowed even higher SOC than xeric upland forest primarily grownon well-drained soils such as Udults and Psamments. Natural upland
forests, pine forest and mesic upland forest showed quite similar SOCstocks and both were higher than xeric upland forest. Within theagricultural LULC types, improved pasture was observed to havesignificantly higher SOC compared with crop. It is worth noting thatno significant difference in SOC was detected between pine plantationand natural pine forest. Similarly, improved pasture and rangelanddid not significantly differ in SOC. Urban soils, primarily characterizedby lawn and grassland soils, contained relatively high SOC whichwas comparable to improved pasture, mesic upland forest, pinelandand rangeland.
3.2. SOC change
Comparing the current SOC observations with the historicalobservations shows that obvious SOC change occurred between1965–1996 and 2008–2009. The Mann–Whitney test indicates thatthe current SOC median (1080 sites) was significantly higher thanthat of the historical one (1251 sites) (p b 0.0001) as shown in
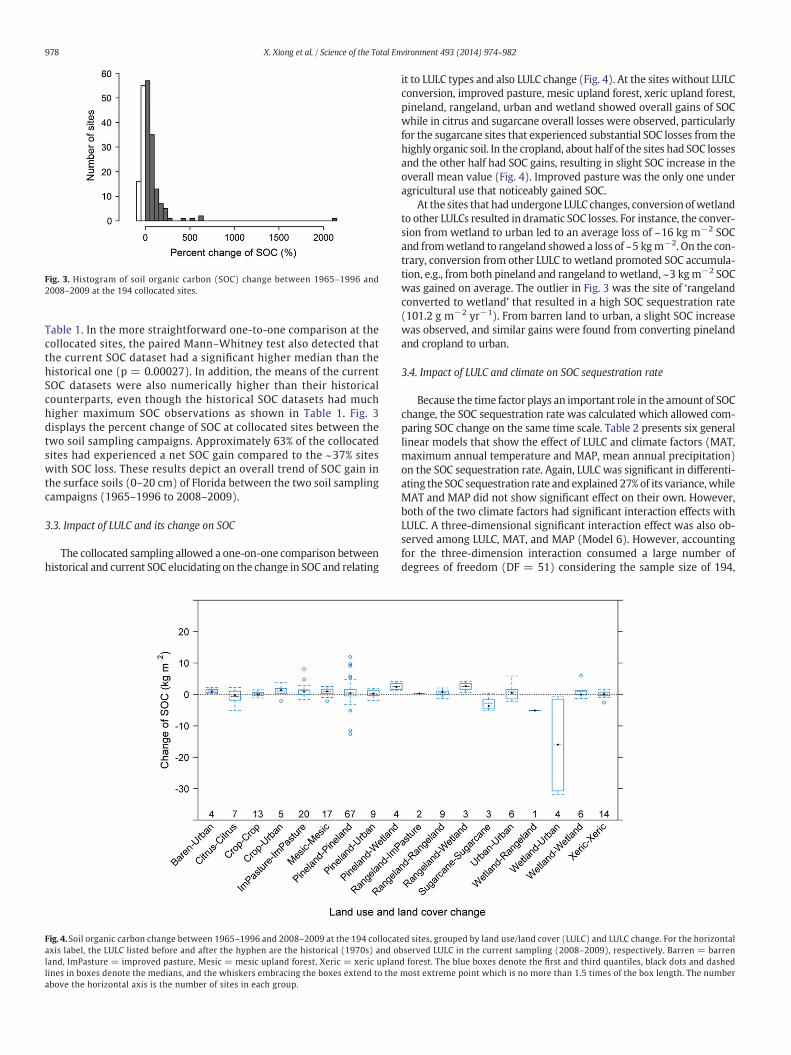
Fig. 3. Histogram of soil organic carbon (SOC) change between 1965–1996 and2008–2009 at the 194 collocated sites.
978 X. Xiong et al. / Science of the Total Environment 493 (2014) 974–982
Table 1. In the more straightforward one-to-one comparison at thecollocated sites, the paired Mann–Whitney test also detected thatthe current SOC dataset had a significant higher median than thehistorical one (p = 0.00027). In addition, the means of the currentSOC datasets were also numerically higher than their historicalcounterparts, even though the historical SOC datasets had muchhigher maximum SOC observations as shown in Table 1. Fig. 3displays the percent change of SOC at collocated sites between thetwo soil sampling campaigns. Approximately 63% of the collocatedsites had experienced a net SOC gain compared to the ~37% siteswith SOC loss. These results depict an overall trend of SOC gain inthe surface soils (0–20 cm) of Florida between the two soil samplingcampaigns (1965–1996 to 2008–2009).
3.3. Impact of LULC and its change on SOC
The collocated sampling allowed a one-on-one comparison betweenhistorical and current SOC elucidating on the change in SOC and relating
Fig. 4. Soil organic carbon change between 1965–1996 and 2008–2009 at the 194 collocataxis label, the LULC listed before and after the hyphen are the historical (1970s) and oland, ImPasture = improved pasture, Mesic = mesic upland forest, Xeric = xeric uplanlines in boxes denote the medians, and the whiskers embracing the boxes extend to theabove the horizontal axis is the number of sites in each group.
it to LULC types and also LULC change (Fig. 4). At the sites without LULCconversion, improved pasture, mesic upland forest, xeric upland forest,pineland, rangeland, urban and wetland showed overall gains of SOCwhile in citrus and sugarcane overall losses were observed, particularlyfor the sugarcane sites that experienced substantial SOC losses from thehighly organic soil. In the cropland, about half of the sites had SOC lossesand the other half had SOC gains, resulting in slight SOC increase in theoverall mean value (Fig. 4). Improved pasture was the only one underagricultural use that noticeably gained SOC.
At the sites that had undergone LULC changes, conversionofwetlandto other LULCs resulted in dramatic SOC losses. For instance, the conver-sion from wetland to urban led to an average loss of ~16 kg m−2 SOCand fromwetland to rangeland showed a loss of ~5 kgm−2. On the con-trary, conversion from other LULC to wetland promoted SOC accumula-tion, e.g., from both pineland and rangeland to wetland, ~3 kgm−2 SOCwas gained on average. The outlier in Fig. 3 was the site of ‘rangelandconverted to wetland’ that resulted in a high SOC sequestration rate(101.2 g m−2 yr−1). From barren land to urban, a slight SOC increasewas observed, and similar gains were found from converting pinelandand cropland to urban.
3.4. Impact of LULC and climate on SOC sequestration rate
Because the time factor plays an important role in the amount of SOCchange, the SOC sequestration rate was calculated which allowed com-paring SOC change on the same time scale. Table 2 presents six generallinear models that show the effect of LULC and climate factors (MAT,maximum annual temperature and MAP, mean annual precipitation)on the SOC sequestration rate. Again, LULC was significant in differenti-ating the SOC sequestration rate and explained 27% of its variance, whileMAT and MAP did not show significant effect on their own. However,both of the two climate factors had significant interaction effects withLULC. A three-dimensional significant interaction effect was also ob-served among LULC, MAT, and MAP (Model 6). However, accountingfor the three-dimension interaction consumed a large number ofdegrees of freedom (DF = 51) considering the sample size of 194,
ed sites, grouped by land use/land cover (LULC) and LULC change. For the horizontalbserved LULC in the current sampling (2008–2009), respectively. Barren = barrend forest. The blue boxes denote the first and third quantiles, black dots and dashedmost extreme point which is no more than 1.5 times of the box length. The number

Table 2General linear models showing the effects of land use/land cover, temperature and precipitation on the soil organic carbon sequestration rate.
Model Model ID Df F P-value R2 AIC
SOC seq. rate ~ LULC*** 1 14 6.19 b0.001*** 0.27 2404SOC seq. rate ~ LULC*** + MAT 2 15 6.03 b0.001*** 0.28 2402SOC seq. rate ~ LULC*** + MAT + LULC × MAT** 3 27 4.96 b0.001*** 0.38 2386SOC seq. rate ~ LULC*** + MAP 4 15 5.79 b0.001*** 0.28 2401SOC seq. rate ~ LULC*** + MAP + LULC × MAP*** 5 27 5.22 b0.001*** 0.40 2381SOC seq. rate ~ LULC*** + MAP + MAT + LULC × MAT*** + LULC × MAP + MAT × MAP +LULC × MAT × MAP**
6 51 3.67 b0.001*** 0.46 2382
Significance code: *** b0.001, **b0.01, and * b0.05. Abbreviations: SOC seq. rate (g m−2 yr−1)= soil organic carbon sequestration rate, LULC= land use/land cover,MAT (°C)=maximumannual temperature average over 1981–2010, MAP (mm) = annual precipitation average over 1981–2010. AIC = Akaike Information Criterion.
979X. Xiong et al. / Science of the Total Environment 493 (2014) 974–982
which may raise the question of overfitting. In fact, there is a sign ofover-parameterization as indicated by the increased Akaike InformationCriterion (AIC) value that not only rewards goodness of fit but alsopenalizes the increase in the number of model parameter. In cropland,mesic upland forest and pineland which remained unchanged between1970s and 2008–2011, the SOC sequestration rate showed an increasingtrendwith theMAT increasing from about 25 to 29 °C (Fig. 5). The sameeffect was also observed in the sites that had been converted frompineland to urban. In contrast, elevated MAP slowed down the SOCaccumulation in cropland and pineland (Fig. 6).
4. Discussion
4.1. Impact of LULC and its change on SOC
Quite a few reviews have shown that LULC and its change are amajor human-induced driver of SOC change in a wide range of climatezones (Post and Kwon, 2000; Guo and Gifford, 2002; Don et al., 2011;Poeplau et al., 2011). In this study, it is found that any LULC conversioninvolving wetlands resulted in a large SOC change. Wetland soil gener-ally had significantly higher SOC than any other LULC due to its highsoil moisture creating anaerobic conditions that are favorable to SOCaccumulation (Euliss et al., 2006; Vasques et al., 2012; Ziegelgruberet al., 2013). The conversion of wetland to urban or rangeland greatlyaltered the hydric soil condition and resulted in significant amountof SOC losses. Conversely, change of LULC from drier soil condition(i.e., pineland) to wetland led to marked SOC accumulation. However,the SOC gain in recreatedwetlandwasmuch lower than the SOC decline
Fig. 5. The effect of maximum annual temperature on the soil organic carbonsequestration rate in four land use/land cover (LULC) and LULC change types. Filledred circles denote crop, filled blue triangles mesic upland forest, open dark-greencircles pineland and light-green crosses change from pineland to urban between1970s and 2008–2011.
in the lost wetland (SOC sequestration rate: +101.2 g m−2 yr−1 forrangeland converted to wetland vs. −422 g m−2 yr−1 for wetlandlost to urban and rangeland), showing a ‘slow in fast out’ effect(i.e., SOC accumulates slowly but loses fast) in SOC change due toLULC conversion (Poeplau et al., 2011; Vasques et al., 2012).
Agricultural practices, such as tillage, have been reportedworldwideto decrease the SOC level (Wu et al., 2003; Maia et al., 2010). However,no substantial change in SOC for cropland sites under constant LULCwasobserved between the two sampling campaigns in this study. This isbecause these cropland sites had been under agricultural use for along history and the SOC balance had already reached equilibrium. Asreported by Poeplau et al. (2011), it required approximate 17 and23 years for croplands converted from grassland and forest to reachtheir equilibriums of SOC change rates, respectively, while the croplandsites in this study had been under agricultural use for more than 19 to39 years.
The sugarcane collocated sites were in the Everglades AgricultureArea (EAA) in south Florida which is one of the prime farming areasdeveloped onHistosols (Armentano, 1980). Tomaintain the agriculturalproductivity, drainage systems that consist of farm canals, ditches,and pump stations have been used to manage the hydrology in EAA(Kwon et al., 2010). In an average year, the EAA receives more rainfallthan it needs for agriculture so water is pumped to Lake Okeechobeeto the north (Bottcher and Izuno, 1994). The net water loss, oxida-tion of the organic soils (Histosols), and agriculture practices in theEAA were likely responsible for the dramatic SOC loss from 6.44 to2.78 kg m−2 for the last four decades in this study.
In citrus soils, the SOC was relatively low with mean and median of2.38 kg m−2 which was the second lowest among all the LULC (Fig. 2).
Fig. 6. The effect of mean annual precipitation on soil organic carbon sequestrationrate in two land use/land cover types. Filled red circles denote crop and open dark-green circles pineland without change between 1970s and 2008–2011.

Fig. 7. General land use/land cover change between 1970s and 2008–2011 in Florida.The data of 1970s come from the United States Geological Survey (USGS), and the dataof 1995, 2004 and 2008–2011 come from the Florida Department of EnvironmentalProtection (FDEP).
980 X. Xiong et al. / Science of the Total Environment 493 (2014) 974–982
In addition, it was observed that the SOC slowly declined at the rateof 22.9 g m−2 yr−1 on average. A similar finding was reported incoarse-textured soils (≤200 g clay kg−1) in citrus and other low-intensity agriculture uses, such as perennial crops in Brazil where 20%SOC loss at 0–20 cm depth was detected (Zinn et al., 2005). In contrast,the improved pasture soils tended to accumulate SOC at an average rateof 42 g m−2 yr−1. This can be attributed to the management for highgrass productivity such as fertilization and cultivar selection, whichenhances the SOC input from roots, root exudates and plant residues(Post and Kwon, 2000). Moreover, improved pasture maintainedrelatively high SOC stocks which were significantly higher than thosein crop and citrus soils (Fig. 2). Other studies also found that the conver-sion of row crops to managed pasture in the subtropical moist climatezone resulted in a net gain of SOC at 33.2 g m−2 yr−1 (Lugo et al.,1986). These results show the encouraging potential of improved pasturesoils in sequestering carbon under low-intensity agriculture use.
In urban soils, relatively high SOC stocks were observed comparedwith other human-managed LULC systems such as citrus and cropland(Fig. 2). In addition, urban soils also showed a relatively large SOC accu-mulation of 0.79 kg m−2 on average (Fig. 4). These results suggest thaturban soils, especially in residential areas, can serve as an ideal soil Csink because of the high level ofmanagement, such as irrigation and fer-tilization, and the lack of soil disturbances that may occur in other sys-tems, such as tillage and harvesting in agriculture and prescribed firein forestmanagement (West andPost, 2002). Pouyat et al. (2006) inves-tigated C storage by urban soils in the conterminous U.S. and found thatresidential lawns consistently contained high SOC stocks in all urbanlandscapes – even higher thanmany forest soils. In addition, cities locat-ed in warmer climate (e.g., the southeast U.S.) tended to accumulateSOC after urban establishment on non-wetland areas (Pouyat et al.,2006). This trendwas also reflected in our result where the conversionsof crop to urban and pineland to urban soils resulted in substantial over-all gains of SOC between the historical and current sampling campaigns.
Another interesting finding is that the SOC stocks of pine plantationwere not significantly different from the natural pine forest, suggestingthat the (human) management of forests did not have significantimpact on SOC stock. Overall, pineland (including both pine forestand pine plantation) showed an average SOC accumulation rate of18.2 g m−2 yr−1. However, the SOC change in pineland was extremelyvariable (Fig. 4). This can be attributed to disturbances, such as naturaland prescribed fire, that are common to pineland systems in Florida,which has been shown to greatly remove SOC in the surface soils(Certini, 2005).
4.2. Impact of LULC and climate on SOC sequestration rate
In this study, LULC alone explained 27% of the variability of SOCsequestration rate, while climate factors explained little (Table 2).It was the interactions between LULC and climate factors (MAP andMAT) that explained up to 46% of the variability of SOC sequestrationrate. Elevated temperature tended to accelerate SOC accumulationunder cropland, mesic upland forest, pineland and urban converted
Table 3Confusionmatrix showing the area of land use/land cover (LULC) change between 1970s and 20the LULC 2008–2011.
Urban Agriculture Rangeland
km2
Urban 7254 248 220Agriculture 6231 18,497 1127Rangeland 2393 4366 1733Upland forest 5377 2615 2217Water 321 89 38Wetlands 1219 1454 557Barren land 2105 97 99
The data of 1970s and 2008–2011 were derived from the United States Geological Survey (USG
from pineland, while precipitation had an opposite effect in croplandand pineland. Various studies reported that elevated temperature canhave opposite effects on SOC change concomitantly enhancing SOCinput bypromotingprimary production and accelerating SOC decompo-sition rate as well (Davidson et al., 2002; Bond-Lamberty and Thomson,2010; Gao et al., 2013). In this study, the higher SOC sequestration ratesinwarmer climate under both changed and unchanged LULC conditionsindicate that the SOC balancewas dictated by SOC input rather than SOCdecomposition. A similar result was reported by Poeplau et al. (2011)from a meta-analysis of 95 studies conducted in the temperate zone,inwhich they found thatmean annual temperature had a positive effecton SOC accumulation in five LULC change conditions (cropland tograssland, grassland to cropland, forest to cropland, cropland to forest,and grassland to forest). Altogether these results suggest that soils areable to sequester C at a faster rate to reduce greenhouse gas emissionunder the current global warming trend. Precipitation has beenknown to promote primary production and increase the roots, rootexudates and plant residues into soils as SOC input (Kirschbaum,1995; Gao et al., 2013). However, a negative relationship was observedbetween SOC sequestration rate in the top soils and mean annualprecipitation. This may be due to the sandy texture of Florida soilswith high permeability that allows more organic material to migratevertically to lower layers under higher precipitation (Jobbágy andJackson, 2000).
4.3. Implications for future SOC change
For the past four decades, Florida has experienced profound LULCchange primarily due to urbanization (Mulkey, 2007). From the 1970sto 2008–2011, the urban area in Florida increased by more than 140%
08–2011 in Florida. Rownames represent the LULC in 1970s and column names represent
Upland forest Water Wetlands Barren land
637 353 379 244461 603 2731 1752178 259 3070 51
26,093 377 10,577 89128 4773 896 17
3495 978 25,679 78271 107 422 38
S) and Florida Department of Environmental Protection (FDEP), respectively.

981X. Xiong et al. / Science of the Total Environment 493 (2014) 974–982
to about 24,900 km2, primarily converted from agriculture and uplandforest (Table 3). Due to a variety of wetland restoration projects inFlorida, the wetland area kept increasing for the past four decadesfrom 33,458 km2 in 1970s to 43,752 km2 in 2008–2011, primarilyconverted from upland forest (Fig. 7 and Table 3). For example, theSouth Florida Water Management District alone has restored about300 km−2 of wetlands (also known as Stormwater Treatment Areas)in south Florida, which represents the largest constructed wetland inthe world (South Florida Water Management District, 2013). Thewetland area in Florida reported by the National Wetland Inventory asof 2009 was 46,951 km2 (U.S. Fish and Wildlife Service, 2009), whichis slightly higher than the 2008–2011 data from FDEP. The NationalLand Cover Dataset (NLCD) also confirmed that the Florida wetlandarea increased by 21.5% between 1992 and 2006, while the agriculturalarea declined by about 20% (Multi-Resolution Land CharacteristicsConsortium, 1992, 2006). These LULC conversions that are favorableto SOC accumulation could further explain the overall SOC increase be-tween 1965–1996 and 2008–2009 and support the argument that soilacted as a net sink for C over the past four decades.
In the context of global climate change, the findings of interactionLULC–climate effects have strong implications for future SOC seques-tration. Since the 1970s, temperatures in the southeast U.S. havebeen reported to steadily increase, particularly in the last decade(2001–2010), and are expected to increase through the end of the21st century (Konrad et al., 2013). Given the positive effect of tem-perature on the SOC sequestration rates in agriculture and uplandforest that account for about 45% of Florida's land area (Fig. 5 andTable 3), the warming trend not only explains the SOC sequestrationover the last four decades, but also indicates a possibility to enhancesoil C sequestration. The mean annual precipitation in south Florida,on the other hand, is projected to decrease by as much as 15% by themid-21st century (Keim et al., 2011; Konrad et al., 2013). This trendmay also benefit the SOC increase in Florida's cropland and pinelandsurface soils.
5. Conclusions
This study is a major development from the previous study by Rosset al. (2013) on temporal change of SOC by scaling up from a subregionthat covers ~15% area of Florida to the whole state. The key innovationof this research is that it investigates and reveals the natural andanthropogenic factors that caused the SOC sequestration in Florida,i.e., LULC, climate, and the interaction effect between LULC and climate.
This study shows that LULC strongly related to SOC variation inFlorida. Generally, sugarcane and wetland contained the highestSOC stock, followed by improved pasture, urban, mesic upland forest,rangeland, and pineland while crop, citrus and xeric upland forestremained the lowest. Our comparative analyses of current and historicalSOC datasets showed a significant SOC accumulation between1965–1996 and 2008–2009. The amount of SOC change was dependenton LULC and LULC change types. In most of the LULC classes an overallsequestration of SOC was observed, except in sugarcane and citrus.Remarkable site-specific SOC losses were involved in the conversionsof wetland to other LULC types, and vice versa. At regional scale restora-tion of wetlands contributed to the buildup of SOC stocks. Urbansoils contained moderately high SOC stocks and conversions of crop,pineland and barren land resulted in SOC accumulation, which suggeststhat urban soils can serve as a promising SOC sink if managed properly.In general, the LULC change in Florida for the past four decades followeda trend that favored SOC accumulation – the wetland and urban areasincreased and the agriculture area decreased as shown by differentLULC data sources (FDEP and NLCD).
The SOC sequestration rate was not only LULC dependent but alsocontrolled by climate factors interacting with LULC. Warmer climatetended to accelerate SOC accumulation, while higher precipitationreduced the SOC sequestration rate in the topsoil. These major findings
provide insights into how LULC and LULC change and their interactioneffects with climate factors (temperature and precipitation) haveimpacted SOC change over the past four decades, suggesting thatunder near-decadal climate and LULC projections for this region soilsare poised to provide a substantial soil C sink.
Acknowledgments
This study was funded by USDA-CSREES-NRI grant award2007-35107-18368 ‘Rapid Assessment and Trajectory Modelingof Changes in Soil Carbon across a Southeastern Landscape’ (NationalInstitute of Food and Agriculture (NIFA) – Agriculture and Food Re-search Initiative (AFRI)). This project is a Core Project of the NorthAmerican Carbon Program. The authors would like to thank Aja Stoppe,SamiahMoustafa, Lisa Stanley, Adriana Comerford, and AnneQuidez fortheir hard work in field soil sampling and lab analyses.
References
Armentano TV. Drainage of organic soils as a factor in the world carbon cycle. BioScience1980;30(12):825–30. [Dec 1].
Bellamy PH, Loveland PJ, Bradley RI, Lark RM, Kirk GJD. Carbon losses from all soils acrossEngland and Wales 1978–2003. Nature 2005;437(7056):245–8.
Bond-Lamberty B, Thomson A. Temperature-associated increases in the global soilrespiration record. Nature 2010;464(7288):579–82.
Bottcher AB, Izuno FT. Everglades Agricultural Area (EAA): water, soil, crop, andenvironmental management. Gainesville, FL: University Press of Florida; 1994.
Certini G. Effects of fire on properties of forest soils: a review. Oecologia 2005;143(1):1–10. [Mar 1].
Davidson EA, Janssens IA. Temperature sensitivity of soil carbon decomposition andfeedbacks to climate change. Nature 2006;440(7081):165–73. [Mar 9].
Davidson EA, Trumbore SE, Amundson R. Biogeochemistry: soil warming and organiccarbon content. Nature 2000;408(6814):789–90. [Dec 14].
Davidson EA, Belk E, Boone RD. Soil water content and temperature as independent orconfounded factors controlling soil respiration in a temperate mixed hardwoodforest. Glob Change Biol 2002;4(2):217–27. [Jan 4].
Dawson JJC, Smith P. Carbon losses from soil and its consequences for land-usemanagement. Sci Total Environ 2007;382(2–3):165–90. [Sep 1].
DeGryze S, Six J, Paustian K,Morris SJ, Paul EA, Merckx R. Soil organic carbon pool changesfollowing land-use conversions. Glob Change Biol 2004;10(7):1120–32.
Don A, Schumacher J, Freibauer A. Impact of tropical land-use change on soil organiccarbon stocks — a meta-analysis. Glob Change Biol 2011;17(4):1658–70.
Dorrepaal E, Toet S, van Logtestijn RSP, Swart E, van de Weg MJ, Callaghan TV, et al.Carbon respiration from subsurface peat accelerated by climate warming in thesubarctic. Nature 2009;460(7255):616–9. [Jul 30].
Euliss Jr NH, Gleason RA, Olness A, McDougal RL, Murkin HR, Robarts RD, et al. NorthAmerican prairie wetlands are important nonforested land-based carbon storagesites. Sci Total Environ 2006;361(1–3):179–88. [May 15].
Fierer N, Craine JM, McLauchlan K, Schimel JP. Litter quality and the temperaturesensitivity to decomposition. Ecology 2005;86(2):320–6. [Feb 1].
Florida Fish and Wildlife Conservation Commission (FFWCC). Florida vegetation and landcover data derived from Landsat ETM+ imagery [Internet]. Tallahassee, FL, 2003[Available from: http://myfwc.com/research/gis/data-maps/terrestrial/fl-vegetation-land-cover/].
Gao Y, Zhou X,Wang Q,Wang C, Zhan Z, Chen L, et al. Vegetation net primary productivityand its response to climate change during 2001–2008 in the Tibetan Plateau. Sci TotalEnviron 2013;444:356–62. [Feb 1].
Genxu W, Ju Q, Guodong C, Yuanmin L. Soil organic carbon pool of grassland soils on theQinghai–Tibetan Plateau and its global implication. Sci Total Environ 2002;291(1–3):207–17. [May 27].
Giardina CP, Ryan MG. Evidence that decomposition rates of organic carbon in mineralsoil do not vary with temperature. Nature 2000;404(6780):858–61. [Apr 20].
Grünzweig JM, Sparrow SD, Yakir D, Stuart Chapin F. Impact of agricultural land-usechange on carbon storage in boreal Alaska. Glob Change Biol 2004;10(4):452–72.
Guo LB, Gifford RM. Soil carbon stocks and land use change: a meta analysis. Glob ChangeBiol 2002;8(4):345–60.
Jobbágy EG, Jackson RB. The vertical distribution of soil organic carbon and its relation toclimate and vegetation. Ecol Appl 2000;10(2):423–36.
Jones C, McConnell C, Coleman K, Cox P, Falloon P, Jenkinson D, et al. Global climatechange and soil carbon stocks; predictions from two contrasting models for theturnover of organic carbon in soil. Glob Change Biol 2005;11(1):154–66.
Kautz R, Stys B, Kawula R. Florida vegetation 2003 and land use change between 1985–89and 2003. Fla Sci 2007;70(1):12.
Keim BD, Fontenot R, Tebaldi C, Shankman D. Hydroclimatology of the U.S. Gulf Coastunder global climate change scenarios. Phys Geogr 2011;32(6):561–82. [Nov 1].
Kirschbaum MUF. The temperature dependence of soil organic matter decomposition,and the effect of global warming on soil organic C storage. Soil Biol Biochem 1995;27(6):753–60. [Jun].
Konrad II CE, Fuhrmann CM, Billiot A, Keim BD, Kruk MC, Kunkel KE, et al. Climate of thesoutheast USA: past, present, and future. In: Ingram KT, Dow K, Carter L, Anderson J,

982 X. Xiong et al. / Science of the Total Environment 493 (2014) 974–982
editors. Climate of the southeast United States: variability, change, impacts, andvulnerability. Washington, DC: Island Press; 2013.
Kutsch W, Bahn M, Heinemeyer A. Soil carbon relations: an overview. Soil carbondynamics: an integrated methodology. Cambridge, UK: Cambridge UniversityPress; 2010. p. 1–15.
Kwon HY, Grunwald S, Beck HW, Jung Y, Daroub SH, Lang TA, et al. Ontology-basedsimulation of water flow in organic soils applied to Florida sugarcane. Agric WaterManage 2010;97(1):112–22.
Lugo AE, Sanchez MJ, Brown S. Land use and organic carbon content of some subtropicalsoils. Plant Soil 1986;96(2):185–96. [Jun 1].
Maia SMF, Ogle SM, Cerri CEP, Cerri CC. Soil organic carbon stock change due to land useactivity along the agricultural frontier of the southwestern Amazon, Brazil, between1970 and 2002. Glob Change Biol 2010;16(10):2775–88.
Mulkey S. Climate change and land use in Florida: interdependencies and opportu-nities [Internet]. Gainesville, FL: Department of Botany, University of Florida;2007 [Available from: http://sarasota.wateratlas.usf.edu/upload/documents/ClimateChangeAndLandUse.pdf].
Multi-Resolution Land Characteristics Consortium (MRLC). National Land Cover Data(NLCD) [Internet]. Research Triangle Park, NC, 1992 [Available from: http://www.epa.gov/mrlc/nlcd.html].
Multi-Resolution Land Characteristics Consortium (MRLC). National Land Cover Data(NLCD) [Internet]. Research Triangle Park, NC, 2006 [Available from: http://www.epa.gov/mrlc/nlcd.html].
National Climatic Data Center (NCDC), National Oceanic and Atmospheric Administration(NOAA). Monthly surface data [Internet]. Asheville, NC, 2008 [Available from: http://www.ncdc.noaa.gov].
Natural Resources Conservation Service (NRCS), U.S. Department of Agriculture. U.S.General Soil Map (STATSGO2) [Internet]. Lincoln, NE, 2006 [Available from: http://soils.usda.gov/survey/geography/statsgo/].
Natural Resources Conservation Service (NRCS), U.S. Department of Agriculture. SoilSurvey Geographic Database (SSURGO) [Internet]. Lincoln, NE, 2009 [Availablefrom: http://soils.usda.gov/survey/geography/ssurgo/].
Nelson DW, Sommers LE. Total carbon, organic carbon, and organic matter. In: Sparks DL,Page AL, Helmke PA, Loeppert RH, Soltanpour PN, Tabatabai MA, et al, editors.Methods of soil analysis Part 3 — Chemical methods. Madison, WI: Soil ScienceSociety of America; 1996. p. 961–1010.
Nemani RR, Keeling CD, Hashimoto H, Jolly WM, Piper SC, Tucker CJ, et al. Climate-drivenincreases in global terrestrial net primary production from 1982 to 1999. Science2003;300(5625):1560–3. [Jun 6].
Parameter-elevation Regressions on Independent Slopes Model (PRISM) climategroup. PRISM spatial climate layers [Internet]. Corvallis, OR, 2013, [Availablefrom: http://www.prism.oregonstate.edu/].
Poeplau C, Don A, Vesterdal L, Leifeld J, Van Wesemael B, Schumacher J, et al. Temporaldynamics of soil organic carbon after land-use change in the temperate zone —carbon response functions as a model approach. Glob Change Biol 2011;17(7):2415–27.
Post WM, Kwon KC. Soil carbon sequestration and land‐use change: processes andpotential. Glob Change Biol 2000;6(3):317–27. [Mar].
Post WM, Emanuel WR, Zinke PJ, Stangenberger AG. Soil carbon pools and world lifezones. Nature 1982;298(5870):156–9. [Jul 8].
Pouyat RV, Yesilonis ID, Nowak DJ. Carbon storage by urban soils in the United States.J Environ Qual 2006;35(4):1566.
Ross CW, Grunwald S, Myers DB. Spatiotemporal modeling of soil organic carbon stocksacross a subtropical region. Sci Total Environ 2013;461–462:149–57. [Sep 1].
South Florida Water Management District. Everglades Stormwater Treatment Areas:managed wetlands improving water quality [Internet]. West Palm Beach, FL, 2013,[Available from: http://www.sfwmd.gov/portal/page/portal/xrepository/sfwmd_re-pository_pdf/bts_sta.pdf].
Stockmann U, Adams MA, Crawford JW, Field DJ, Henakaarchchi N, Jenkins M, et al. Theknowns, known unknowns and unknowns of sequestration of soil organic carbon.Agric Ecosyst Environ 2013;164:80–99. [Jan 1].
Stone EL, Harris WG, Brown RB, Kuehl RJ. Carbon storage in Florida Spodosols. Soil Sci SocAm J 1993;57(1):179–82. [Jan 1].
U.S. Fish and Wildlife Service. National Wetland Inventory (NWI) [Internet]. Washington,D.C., 2009, [Available from: http://www.fws.gov/wetlands/Data/State-Downloads.html].
United States Census Bureau. The boundary of the State of Florida [Internet]. Washington,D.C., 2000, [Available from: http://www.census.gov/geo/www/cob/cbf_state.html].
United States Geological Survey (USGS). National Elevation Dataset (NED) [Internet].Reston, VA, 1999 [Available from: http://ned.usgs.gov/].
Vasques GM, Grunwald S, Myers DB. Associations between soil carbon and ecologicallandscape variables at escalating spatial scales in Florida, USA. Landscape Ecol2012;27(3):355–67. [Jan 3].
West TO, Post WM. Soil organic carbon sequestration rates by tillage and crop rotation.Soil Sci Soc Am J 2002;66(6):1930.
Wu H, Guo Z, Peng C. Land use induced changes of organic carbon storage in soils ofChina. Glob Change Biol 2003;9(3):305–15.
Ziegelgruber KL, Zeng T, Arnold WA, Chin Y-P. Sources and composition of sedimentpore-water dissolved organic matter in prairie pothole lakes. Limnol Oceanogr2013;58(3):1136–46.
Zinn YL, Lal R, Resck DVS. Changes in soil organic carbon stocks under agriculture inBrazil. Soil Tillage Res 2005;84(1):28–40. [Nov].
Zwick PD, Carr MH. Florida 2060: a population distribution scenario for the state ofFlorida. Gainesville, FL: GeoPlan Center at the University of Florida; 2006.