carbon sequestration associated to the land-use and land...
TRANSCRIPT

*[email protected]; phone +55 19 3211-6200; fax: +55 19 3211-6222
Carbon sequestration associated to the land-use and land-cover
changes in the forestry sector in Southern Brazil
Carlos C. Ronquim*a, Ramon F. B. Silvab, Eduardo B. de Figueiredoc, Ricardo O. Bordonald,
Antônio H. de C. Teixeiraa, Thomas C. D. Cochasrkia, Janice F. Leivasa aEmbrapa Monitoramento por Satélite, Campinas, SP, Brazil; bUniversity of Campinas, Campinas,
SP, Brazil; cSão Paulo State University, Jaboticabal, SP, Brazil; dBrazilian Bioethanol Science and
Technology Laboratory, Campinas, SP, Brazil
ABSTRACT
We studied the Paraíba do Sul river watershed, São Paulo state (PSWSP), Southeastern Brazil, in order to assess the land
use and cover (LULC) and their implications to the amount of carbon (C) stored in the forest cover between the years 1985
and 2015. The region covers an area of 1,395,975 ha. We used images made by the Operational Land Imager (OLI) sensor
(OLI/Landsat-8) to produce mappings, and image segmentation techniques to produce vectors with homogeneous
characteristics. The training samples and the samples used for classification and validation were collected from the
segmented image. To quantify the C stocked in aboveground live biomass (AGLB), we used an indirect method and applied
literature-based reference values. The recovery of 205,690 ha of a secondary Native Forest (NF) after 1985 sequestered
9.7 Tg (Teragram) of C. Considering the whole NF area (455,232 ha), the amount of C accumulated along the whole
watershed was 35.5 Tg, and the whole Eucalyptus crop (EU) area (113,600 ha) sequestered 4.4 Tg of C. Thus, the total
amount of C sequestered in the whole watershed (NF + EU) was 39.9 Tg of C or 145.6 Tg of CO2, and the NF areas were
responsible for the largest C stock at the watershed (89%). Therefore, the increase of the NF cover contributes positively
to the reduction of CO2 concentration in the atmosphere, and Reducing Emissions from Deforestation and Forest
Degradation (REDD+) may become one of the most promising compensation mechanisms for the farmers who increased
forest cover at their farms.
Keywords: Remote sensing, Forestry dynamics, Native forest, Eucalyptus, Paraíba do Sul River watershed.
1. INTRODUCTION
Land-use and land-cover (LULC) changes occur faster at the tropics, where an unbalance between deforestation and
regrowth of secondary forests has significant consequences to the global carbon cycle [1]. Among the tropical countries,
Brazil has the highest deforestation rates, and has released nearly 1.6 Gt (gigatonne) CO2eq (carbon dioxide equivalent),
to the atmosphere in 2014, mostly due to land-use change, especially the cutoff of native forests and their replacement by
pastures, which is the main responsible for greenhouse gas emissions (GHG), contributing with 32.7% or 0.5 Gt CO2eq of
the total emission [2].
Due to the importance of the forests in the global carbon cycle, researchers have been increasingly interested in the loss of
forest cover and in the carbon gain potential of secondary-forest regeneration [3, 4]. Studies on Atlantic forest fragments
are recent and poorly understood [5, 6, 7]. The long process of deforestation and forest degradation, as well as the diversity
of plant formations associated with strong fragmentation in different sizes and forms make carbon stock estimations for
Mata Atlântica's forest formations imprecise without a predictable pattern [7].
The lato sensu Atlantic Forest is a biodiversity mosaic composed of several types of vegetation distributed along 27 latitude
degrees at the South hemisphere, and under strong variations in altitude, longitude, edaphic and climatic conditions [8].
As a true hotspot, the Brazilian Atlantic Forest features exceptional biodiversity levels, but its forests now cover only
14.5% of their original range [9], and are distributed mainly across 245,173 small fragments with an average size of 64 ha
and some wide, continuous forest areas [10].
Remote Sensing for Agriculture, Ecosystems, and Hydrology XVIII, edited by Christopher M. U. Neale, Antonino Maltese, Proc. of SPIE Vol. 9998, 99981T
© 2016 SPIE · CCC code: 0277-786X/16/$18 · doi: 10.1117/12.2242094
Proc. of SPIE Vol. 9998 99981T-1
Downloaded From: http://proceedings.spiedigitallibrary.org/ on 10/28/2016 Terms of Use: http://spiedigitallibrary.org/ss/termsofuse.aspx
One of the challenges presented by the Atlantic Forest biome is that of better understanding the forest's transition processes.
Some Atlantic Forest regions became progressively degraded, probably beyond their resilience threshold, while other
regions face a forest transition phase as a result of regeneration dynamics that exceed the deforestation rate [11, 12, 13].
At the Paraíba do Sul watershed portion within the limits of the Brazilian state of São Paulo (PSWSP), located within the
Atlantic Forest, wide areas are predominantly covered by pastures featuring some degree of degradation [13]. Eucalyptus-
based forestry was the agricultural industry's branch with strongest economical and technical development, making a strong
contrast with milk farming, which has been decreasing its production since the 1980s [12]. Even though PSWSP's area is
dominated by extensive pastures, Eucalyptus crop and natural regrowth of secondary native forests have spread along the
whole PSWSP over the last decades [13].
The secondary native-forest fragments became important landscape components in the region's land-use mosaic. In 2011,
they already answered for about 50% of the PSWSP's forest cover [13]. The regrowth of secondary tropical forests
accumulates carbon in the aboveground biomass, partially compensating the carbon emissions produced by deforestation,
forest degradation, the burning of fossil fuels and other anthropic sources [4]. Therefore, the recovery of secondary forests
may play an important role in climate change mitigation and in the recovery of biodiversity and other ecosystem functions
[4].
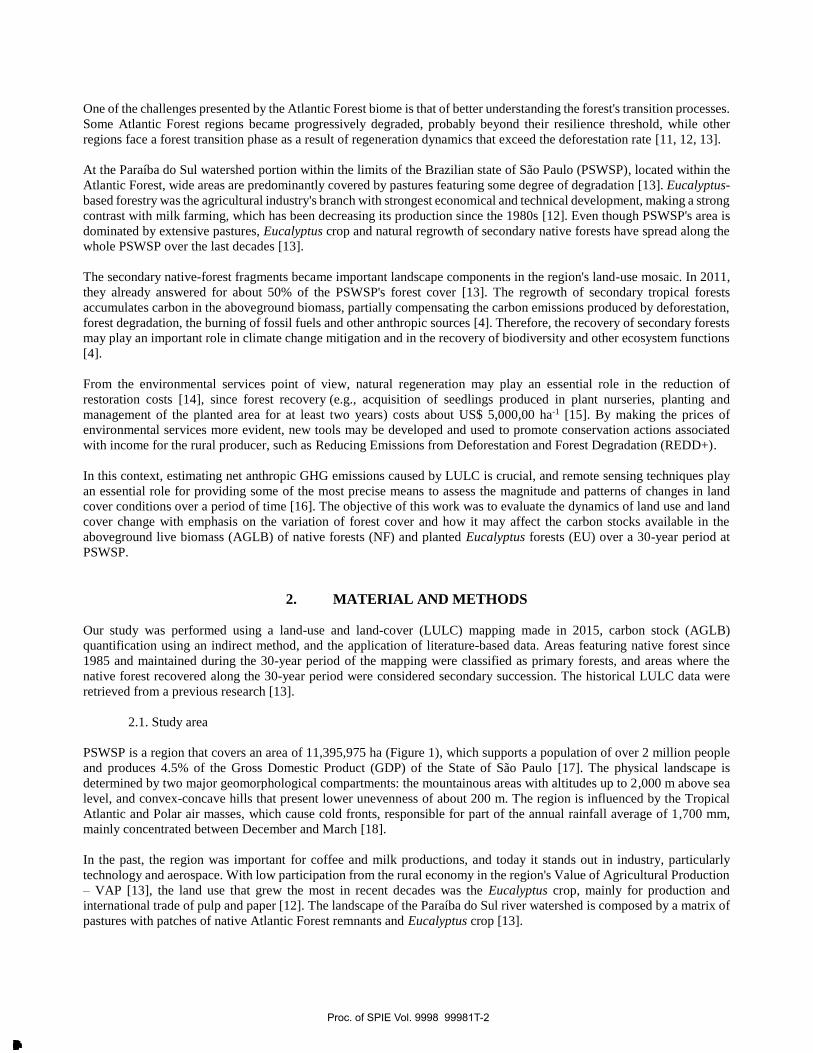
From the environmental services point of view, natural regeneration may play an essential role in the reduction of
restoration costs [14], since forest recovery (e.g., acquisition of seedlings produced in plant nurseries, planting and
management of the planted area for at least two years) costs about US$ 5,000,00 ha-1 [15]. By making the prices of
environmental services more evident, new tools may be developed and used to promote conservation actions associated
with income for the rural producer, such as Reducing Emissions from Deforestation and Forest Degradation (REDD+).
In this context, estimating net anthropic GHG emissions caused by LULC is crucial, and remote sensing techniques play
an essential role for providing some of the most precise means to assess the magnitude and patterns of changes in land
cover conditions over a period of time [16]. The objective of this work was to evaluate the dynamics of land use and land
cover change with emphasis on the variation of forest cover and how it may affect the carbon stocks available in the
aboveground live biomass (AGLB) of native forests (NF) and planted Eucalyptus forests (EU) over a 30-year period at
PSWSP.
2. MATERIAL AND METHODS
Our study was performed using a land-use and land-cover (LULC) mapping made in 2015, carbon stock (AGLB) quantification using an indirect method, and the application of literature-based data. Areas featuring native forest since
1985 and maintained during the 30-year period of the mapping were classified as primary forests, and areas where the
native forest recovered along the 30-year period were considered secondary succession. The historical LULC data were
retrieved from a previous research [13].
2.1. Study area
PSWSP is a region that covers an area of 11,395,975 ha (Figure 1), which supports a population of over 2 million people
and produces 4.5% of the Gross Domestic Product (GDP) of the State of São Paulo [17]. The physical landscape is
determined by two major geomorphological compartments: the mountainous areas with altitudes up to 2,000 m above sea
level, and convex-concave hills that present lower unevenness of about 200 m. The region is influenced by the Tropical
Atlantic and Polar air masses, which cause cold fronts, responsible for part of the annual rainfall average of 1,700 mm,
mainly concentrated between December and March [18].
In the past, the region was important for coffee and milk productions, and today it stands out in industry, particularly
technology and aerospace. With low participation from the rural economy in the region's Value of Agricultural Production
– VAP [13], the land use that grew the most in recent decades was the Eucalyptus crop, mainly for production and
international trade of pulp and paper [12]. The landscape of the Paraíba do Sul river watershed is composed by a matrix of
pastures with patches of native Atlantic Forest remnants and Eucalyptus crop [13].
Proc. of SPIE Vol. 9998 99981T-2
Downloaded From: http://proceedings.spiedigitallibrary.org/ on 10/28/2016 Terms of Use: http://spiedigitallibrary.org/ss/termsofuse.aspx

lo de Janeiro State
cl
Sao Paulo State CW:
2 Sip Paulometropolitan 41-
P region
og.0
íc.Paraiba Valley
tr-t4-t
4.- , /- a
..."-- ...ICA.
41,15-1/411,
. ;''OCt,y
sor MIDmeters
Figure 1. Study region, the Paraíba do Sul river watershed at the state of São Paulo (PSWSP), and the regional context.
2.2. Land-use and land-cover mapping
The LULC mapping used a set of two Landsat-8 images (Operational Land Imager – OLI), scenes 218/76 of January 19,
2015, and 219/76 of August 03, 2015, cloud free. The two Landsat-8 images covered the entire study area of the PSWSP
(Figure 1). The LULC mapping used was made by Silva et al. [13] using a set of Landsat-5 images (Thematic Mapper –
TM) for the years of 1985, 1995, 2005 and 2011. The mapping scheme defined for the present research follows the same
LULC classes used in the previous work [13]: Native Forest (NF), Pasture (PA), Abandoned Pasture (AP), Eucalyptus
crop (EU), Agriculture (AG), Built-up Area (BA), Bare Soil (BS) and Water (WA).
The images available at the GloVis U.S. Geological Survey platform were retrieved using Level 1T processing [19]. The
image pre-processing consisted of atmospheric correction using the Fast Line-of-sight Atmospheric Analysis of Hypercube
(FLAASH) algorithm [20]. After the atmospheric correction, the images were segmented using the parameters: Segment
Algorithm, Edge; Scale Level, 30; Merge Algorithm, Full Lambda Schedule; and Merge Level, 0 (implemented in ENVI
5.1 Example Based Feature Extraction). A Texture Kernel Size filter was maintained as a 3 x 3-window size.
The training data were collected using visual interpretation of the high spatial resolution images available in Google Earth.
For each scene, we selected a different number of random samples of each land use and land cover class, since each
Landsat-8 image used for mapping covered different proportions of the study area – scene 219/76 covered approximately
35% of the Paraíba do Sul river watershed in São Paulo state, while scene 218/76 covered 65%. Thus, 1,000 samples were
collected for each class of the LULC classification to assess the global accuracy for the scene 218/76, and 200 samples of
each class for scene 219/76. Based on the total training data for each Landsat-8 image, we randomly assigned a set of 90%
for training and classification procedures, and the remaining 10% for the accuracy assessment [21].
For the classification procedure, we used the Maximum Likelihood supervised algorithm. For the refinement of the
classification procedure (over the LULC map of 2015), a majority filter was applied with a window size of 3 x 3 pixels to
reassign an LULC class to the center of the 3 x 3 window [22]. The classification results of the two Landsat-8 scenes
Proc. of SPIE Vol. 9998 99981T-3
Downloaded From: http://proceedings.spiedigitallibrary.org/ on 10/28/2016 Terms of Use: http://spiedigitallibrary.org/ss/termsofuse.aspx

(218/76 and 219/76) were mosaicked to generate the LULC map of the PSWSP, 2015. After mosaicking the mapping
results of the two scenes, an independent set of 100 samples for each LULC class was selected by visual interpretation of
Google Earth's high spatial resolution images for accuracy assessment [21] of the final LULC map – LULC classes of
PSWSP, 2015.
2.3. Carbon quantification
In order to show native forest areas' potential to accumulate carbon in the aboveground live biomass (AGLB), we produced
a table featuring the amounts of carbon stocked in the AGLB of native forests found in several papers published about
Atlantic Forest formations at the Brazilian South and Southeast regions. These papers featured studies on different
physiognomies (Montane Moist Forest – MMF and Seasonal Semideciduous Forest – SSF), at different succession stages,
primary or secondary. PSWSP features one of the highest remnant-vegetation indices in the state of São Paulo. At the
valley's lowest areas, there are mainly SSF remnants, while areas encompassing the Bocaina and Mantiqueira mountain
chains and their catchments of the PSWSP are composed by MMF remnants [23].
The values of carbon stocked in the forest phytomass of native forests and Eucalyptus planted forests are the result of the
arithmetic average of values obtained in studies published on native forests, and are presented in Mg ha-1 (megagram per
hectare). It is known that the atomic weights of C is 12 and of O (oxygen) is 16, therefore 1.0 Mg of C corresponds to 3.66
Mg of CO2. Thus, the amount of CO2eq (carbon dioxide equivalent), was determined by multiplying the C value by 3.66
(conversion factor obtained by the ratio between the O and C atomic masses).
The stages of the forest fragments of native forests were divided into primary native forests and secondary native forests.
The values of carbon stocked in AGLB in primary forests were obtained from 13 remnants, and in secondary forests, from
23 remnants. All remnants belong to the Atlantic forest biome and are located in Southeast and South Brazil. To obtain the
carbon stock by area ratio, we used an indirect estimate and multiplied the total area (primary and secondary forest) of
native forest cover at PSWSP by the literature-based average carbon stocked in AGLB in the phytomass of primary and
secondary forest remnants informed in Mg ha-1 of C.
For the Eucalyptus planted forests, we used the average value found in nine papers, all referring to studies made at different
locations in Southeast Brazil, and the value of carbon stocked in AGLB was informed in Mg ha-1 of C. Since the age of
these forests ranges from zero to seven years, when the trees are harvested for cellulose production, we adopted an average
value of 3.5 years as reference for the value of carbon accumulated in a hectare. Thus, we multiplied by the average carbon
stocked in AGLB – Mg C ha-1 year-1 obtained in the literature.
2.4. Economy and sustainability
The variation of the Value of Agricultural Production (VAP) for 2015 was obtained on the website:
<http://www.iea.sp.gov.br/out/bancodedados.html> published by the Brazilian Institute of Agricultural Economics
(Instituto de Economia Agrícola, IEA) [24], which annually informs the result of the estimate of the VAP by regions of
state of São Paulo.
3. RESULTS AND DISCUSSION
3.1. Land-use and land-cover changes (LULC)
The LULC maps produced for PSWSP identified eight land uses in 1985 and 2015: areas under no human influence,
encompassing native forests that were divided into primary native forests that existed in 1985 and secondary native forests
areas that arose after 1985; areas created by human influence (i.e., pasture, Eucalyptus crop, agriculture, bare soil and built-
up areas); and water areas, such as rivers or artificial lakes (Figure 2). The classification shown in the map for the year
2015 featured a Kappa index of 0.8500 and a global accuracy of 87.1429%.
Proc. of SPIE Vol. 9998 99981T-4
Downloaded From: http://proceedings.spiedigitallibrary.org/ on 10/28/2016 Terms of Use: http://spiedigitallibrary.org/ss/termsofuse.aspx

Legenda
iwgnItureie.eyhisiNaWeFmeA
Pevye
iAbandoned Ant,iBare Solel wale'iBmlArea
Figure 2. Maps showing land-use and land-cover dynamics of Native Forest (NF), Pasture (PA), Abandoned Pasture (AP),
Eucalyptus (EU), Agriculture (AG), Built-up Area (BA), Bare Soil (BS) and Water (WA) areas at the PSWSP in 1985 and
2015.
The pastures, for beef and milk production, are still the main land cover (651 thousand hectares). However, these areas
have decreased 32% over the last 30 years, and nearly half of the pastures still available (around 40%; Figure 3) show
regrowth of native plant cover at different stages – the so called "dirty pasture", which is no longer managed and may
regenerate into new secondary native forests over the years.
Pasture areas near urban centers are being replaced by real estate projects, such as residential condominiums and rural
properties dedicated to leisure, as well as by Eucalyptus crop. This process has driven the region to its current scenario, in
which 67.4% of the area is dedicated to anthropic uses (Figure 3). Areas featuring Eucalyptus crop grew from 35,214 ha
(2.5% of the PSWSP area) in 1985 to 113,587 ha (8.1% of the PSWSP area) in 2015 (Figure 3).
Between 1985 and 2015, the native forest areas grew from 249,542 ha (considered as primary forests) to 455,232 ha, an
increase of 83% in areas covered by secondary native forests. This growth occurred mainly over areas previously used as
pastures. Native forests cover 32.6% of the PSWSP in 2015 in comparison to 17.9% in 1985 (Figure 3), a secondary forest
gain of 205,690 ha. This native forest cover occurs mostly in areas with slopeness above 20% (Table 1). Despite its high
fragmentation rate, PSWSP's area displays over twice the forest cover shown by the Brazilian Atlantic forest in proportion,
since Atlantic forest currently features only 14.5% of its original forest cover [24].
The smaller investments made by farmers contribute to the decrease in the management of areas which are less suitable
for use as pastures, such as mountain tops and steeper hills, as well as the slopes of hills facing South, which are less
favorable for pasture development [12, 13]. The abandonment of pasture areas which are more restraining to the cattle and
to mechanized agriculture ends up favoring the regrowth of the native tree cover, which after its consolidation as a
successional forest becomes protected under the “Brazilian Mata Atlântica law” (Law no. 11248 from 2006), that prevents
deforestation and favors the recovery of the forest cover.
Proc. of SPIE Vol. 9998 99981T-5
Downloaded From: http://proceedings.spiedigitallibrary.org/ on 10/28/2016 Terms of Use: http://spiedigitallibrary.org/ss/termsofuse.aspx

600
500
400
300 -
200 -
100 -
o
7.9%
i
32.6%
39,8%
25,2%
28%
21.4%
NF PA AP
3.7%2.6%
AG
4.6%2.8% 3,6% 3,4%
1985
2015
1,7% 2,1%
BA BS WA
Figure 3. Land-use and land-cover change values in hectare (ha) and in percentage (%), in PSWSP's Native Forest (NF), Pasture
(PA), Abandoned Pasture (AP), Eucalyptus crop (EU), Agriculture (AG), Built Area (BA), Bare Soil (BS) and Water (WA)
areas in 1985 and 2015.
The conservation and restoration of the PSWSP's plant cover are important because it is inserted in the Atlantic forest
biome, which is among the 25 most important diversity hotspots, and became an archipelago of small "forest islands"
surrounded by a matrix that might be formed by agriculture, pasture, Eucalyptus crop or urban areas [8, 10]. Brazilian
Atlantic forest has exceptional biodiversity levels, but the forest fragments are often too small to provide for and host many
species [6, 10, 14]. Mata Atlântica's importance goes beyond its rich and diverse biota, and encompasses a wide set of
relevant ecosystem services provided directly and indirectly to human wellbeing [5, 6, 7, 8, 14].
PSWSP's area is facing a phenomenon called "forest transition", which consists of a regrowth of the native forest over the
current agricultural use, and the factors that contribute to this restoration scenario are the population awareness, access to
information, international protocols, environmental law, and rural-urban migration [12, 13]. The irregular relief of the
whole PSWSP area may be considered, even if indirectly, the main factor behind this whole process. Over 50% of the
PSWSP's area, calculated as 1,395,975 ha, features slopes with steepness degrees above 20% (Table 1). The irregularity
of the terrain makes crop management more difficult, and agriculture does not provide a satisfactory economic return.
Since the lands are not suitable for agriculture, crop competition over areas does not happen at the PSWSP, which is a
characteristic of the LULC dynamics in the whole inland of the state of São Paulo, driven especially by sugarcane [25].
Not even, extensive pastures used for beef and milk productions, which are a low-cost investment opportunity for the
region's farmers, are competitive at the PSWSP's sloppy areas. This is seen on the stagnation of the PSWSP's milk
productivity since the 1980s [13]. The low income provided by the milk industry, the strict quality standards of dairy
factories, difficulties to find and hire qualified labor, among other reasons, make it harder for the rural producers to maintain
their activities.
Although the areas of most of the other watersheds in the state of São Paulo are under the same restrictive conditions of
the PSWSP – environmental laws, market influence, rural-urban migration, labor scarcity, among others – elsewhere there
was no regrowth of the native plant cover. Sugarcane crops depend highly on mechanization, which limits their expansion
over sloppy terrain [25, 26], such as that of the PSWSP.
Proc. of SPIE Vol. 9998 99981T-6
Downloaded From: http://proceedings.spiedigitallibrary.org/ on 10/28/2016 Terms of Use: http://spiedigitallibrary.org/ss/termsofuse.aspx

Table 1. Declivity classes in Native Forest (NF), Pasture (PA), Abandoned Pasture (AP) and Eucalyptus crop areas at PSWSP
in 1985 and 2015.
Atlantic Forest areas in the state of Alagoas, Northeast Brazil, show the opposite situation described by the forest transition
theory. There, rural-urban migration coincided with a deforestation trend because subsistence agriculture was replaced by
large sugarcane and soybean crops [27]. The recent increase in young secondary forests over sugarcane landscapes in the
state of São Paulo is likely the result of environmental planning efforts to honor the Brazilian Forest Code [25].
Another important aspect is the access to technologies. Only producers who use technologies are able to produce income
in their farms [28]. Contrary to what happened in the past, access to land became a less important variable in comparison
to technology, which surpassed the labor and land variables in the ranking of sources for agricultural growth [28]. The
absence of large agribusiness companies or their investments in their own crops or in partnering producers at the PSWSP
has left the small and medium producers with less capital and few resources, rendering them excessively frail to be able to
integrate the agricultural industry product chains. Without access to the best technology available, even large-scale
producers end up reducing their production area or stopping their activities altogether.
Over these 30 years, pastures have also made way for Eucalyptus plantation, which has grown from 35,214 ha (2.5%) to
113,587 ha (8.1%) (Figure 3). Although Eucalyptus's representativeness as a land-use class at the PSWSP is low,
Eucalyptus plantations have caused polemics within the local society, worried about the environmental impacts that this
monoculture may produce. Part of the local community, not necessarily backed up by technical knowledge, condemns
Eucalyptus crop stating that this exotic genus subtracts native trees, competes against food crops, influences regional
temperature, favors rural-urban migration, changes the natural landscape and creates huge "green deserts" [12, 29].
However, most of the Eucalyptus plantation have replaced pasture areas that were also artificially inserted, i.e., exotic
anthropic landscapes.
Occupying some areas with Eucalyptus crop will not provide all the ecosystem services or deliver all the ecosystem
functions of a preserved native forest, but will deliver part of it [12]. Many of the changes caused by Eucalyptus may
benefit the environment, especially when replacing pastures, particularly degraded pastures. Depending on the
management practice adopted, the age of the crop, the location, and the size of the plot reforestations may promote
environments which are favorable for the locomotion of forest animals [30], and the mitigation of temperature extremes
by increasing evapotranspiration [31]. Forestry companies currently seek environmental certifications, which require
satisfying demands and international standards. The adjustments involve recomposing 20% of legal reserve (RL) areas and
permanent preservation areas (APP) to abide to environmental laws. The farms featuring Eucalyptus crop at the PSWSP
increased the amount of native forest areas [32].
Eucalyptus crop is among the few commercial crops that may be explored at PSWSP despite the steep slopeness of the
topography. Nearly half of the Eucalyptus plantation areas are located in regions with slopeness above 20% (Table 1),
which are not suitable for the mechanized management of most other commercial crops. Mechanization development
currently enables planting and harvesting Eucalyptus in extremely sloppy terrains, which makes it a viable activity at the
PSWSP. However, the higher costs of the commercial management of Eucalyptus crop at the PSWSP hint at a break in
Declivity
(%)
Area Native Forest Pasture Abandoned
Pasture Eucalyptus
(%) (%) (%) (%)
(ha) (%) 1985 2015 1985 2015 1985 2015 1985 2015
0 to 3 12,789 0.9 1.2 2.4 3.9 7.5 8.8 5.2 3.6 2.8 3 to 8 180,286 12.9 5.7 6.9 10.7 14.5 16.4 13 11.2 9.7
8 to 20 496,802 35.6 27.5 29.6 36.7 41.2 43.7 40 41.2 40.6
20 to 45 526,180 37.7 52.6 50.6 43.8 34.6 29.9 38.2 41.3 44.4
45 to 75 163,229 11.7 12.2 9.9 4.7 2.1 1.1 3.4 2.7 2.5
> 75 16,689 1.2 0.8 0.6 0.3 0.1 0.1 0.2 0.1 0.0
Total 1,395,975 100 100 100 100 100 100 100 100 100
Proc. of SPIE Vol. 9998 99981T-7
Downloaded From: http://proceedings.spiedigitallibrary.org/ on 10/28/2016 Terms of Use: http://spiedigitallibrary.org/ss/termsofuse.aspx

their expansion. Fibria, a forestry company that explores these crops in its own lands and in partnership with farmers,
informed that its expansion policy for the forestry industry at PSWSP is currently stagnated and that the company will only
expand its exploration areas on third party properties located very near their plant.
3.2. Carbon sequestration
The average value of carbon stocked in the AGLB obtained from the literature was 103.4 ± 23.8 Mg C ha-1 (mean ± SE)
for primary native forests, and 47.0 Mg C ha-1 ± 22.1 (mean ± SE) for secondary native forests. For the areas featuring
forests until 1985 (249,542 ha), we assumed that the AGLB accumulated 103.4 Mg C ha-1, and therefore areas featuring
primary native forests sequestered 25.8 Tg C. Based on the recovery of 205.7 thousand hectares of native forests over the
last 30 years and considering the average values of carbon stocked in AGLB obtained from the literature (47.0 Mg C ha-
1), the secondary forests have sequestered 9.7 million Tg C from the atmosphere. Therefore, the amount of C accumulated
all over the PSWSP was of 35.5 Tg C or 129.5 Tg CO2eq during the period of 1985 until 2015.
If the C accumulated in the soil and litter was taken into account, C accumulation per hectare would be much higher, since
the amounts of carbon stocked in the soil layers of Atlantic Forest remnants in Southeast Brazil are even larger than the
carbon stocked in the AGLB [5]. Carbon stored in the soil layers of forest remaining Atlantic forest of southeastern Brazil
can reach over 170 Mg C ha- 1 [5].
The values of C accumulated in AGLB of several native Atlantic Forest formations in Southeast and South Brazil surveyed
in the literature varied from 17.9 Mg ha-1 in secondary native forests to 165.0 Mg ha-1 in primary native forests (Table 2).
Secondary native forests are often fragmented and accumulate less C by area (Table 2), because fragmentation changes the
plants' capacity to absorb CO2 and therefore to store C in the biomass [10]. The C stock is influenced by the interaction of
multiple landscape factors, such as higher mortality of trees within the first 100 m of the forest's margin [10], proximity to
the margin, kind of matrix, and forest age [33].
Currently, over half of the world's tropical native forests are under recovery [3]. The secondary forests arising at PSWSP
show strong fragmentation, caused by a long period of anthropic activities. This condition seems to be standard for the
whole Atlantic Forest, which spreads over 245,173 small fragments with an average size of 64 ha [10].
However, these secondary fragmented forests play a crucial role in tropical landscapes modified by human activities. They
show high carbon sequestration rates, and offer a set of ecosystem services that are intimately related to the resilience to
forest degradation, such as the capacity of rapidly recovering after a disturbance and of returning to the original pre-
deforestation state [3]. The carbon sequestered in AGLB by these secondary native forests partially compensates carbon
emissions produced during the deforestation, burning of fossil fuels and other anthropic sources [4]. This nature-based
solution may be considered an effective low-cost mechanism for carbon sequestration, particularly in tropical regions [4].
The average value for carbon accumulation in AGLB obtained in the literature, which is based on researches made in
Southeast Brazil for Eucalyptus crop (Table 3), was 11.1 (± 2.1) Mg ha-1 year-1. In 3.5 years (the average time of
permanence for commercial crops, which varies from zero to seven years), the amount of C accumulated applied in our
calculation was 38.9 Mg ha-1. Therefore, Eucalyptus crop in the PSWSP (113,587 ha) has accumulated 4,419 Mg C or 4.4
Tg C until 2015. At the same PSWSP area, it was observed a higher amount of carbon in the native forest area than in the
six-year-old Eucalyptus crop [34]. However, considering the average annual carbon increase (IMC), the native forest
showed an IMC of 1.3 Mg C ha-1 year-1, which is smaller than that of the Eucalyptus area, with 8.5 Mg C ha-1 year-1 [34].
Proc. of SPIE Vol. 9998 99981T-8
Downloaded From: http://proceedings.spiedigitallibrary.org/ on 10/28/2016 Terms of Use: http://spiedigitallibrary.org/ss/termsofuse.aspx

Table 2. Published papers of carbon stocks (Mg C ha-1) in aboveground live biomass (AGLB) from Atlantic Forest inventories
at different locations in South and Southeast Brazil.
*Montane Moist Forest (MMF), Seasonal Semideciduous Forest (SSF).
The future use of wood from Eucalyptus crop will determine the real amount of carbon fixed and for what period, since it
may be used for several purposes and have different cutting cycles. The uses vary from immediate burning for bioenergy
generation, cellulose production and furniture industry. In the first situation, the carbon immediately returns to the
atmosphere but also can be considered as alternative to fossil fuel use. For furniture, it remains fixed to the wood for a
longer time or a long live pool. At PSWSP, Eucalyptus reforestations are used mostly for cellulose production.
Carbon stock
Mg C ha-1
Successional
stages
Forest
Type Location Source
84.1 Primary SSF Barão de Cotegipe, RS [35] Oliveira et al., (2016)
85.1 Secundary MMF São Paulo, SP [36] Barbosa, (2016)
101.1 Primary MMF São João do Triunfo
PR [37] Maas, (2015)
61.8 Secundary SSF Viçosa, MG [38] Figueiredo et al., (2015)
98.7 Primary MMF São João do Triunfo,
PR [39] Lipinski, (2015)
33.3 Secundary MMF Serra da Cantareira, SP [40] Carvalho (2015)
20.8 Secundary SSF Pinheiral, RJ [7] Dinis et al., (2015)
61.8
14.8 Secundary MMF Serra da Cantareira, SP [33] Costa, 2015
105.7 Primary MMF Curitiba, PR [ 41] Barreto et al., (2014)
96.7 Primary SSF Ribeirão Grande, SP [42 ] Carvalho et al., (2014)
30.9 Secundary MMF Serra da Cantareira, SP [43] Romitteli (2014)
17.9 Secundary SSF Caratinga, M G [ 44] Gaspar (2014)
[ 45] Gaspar (2014) 86.9 Secundary SSF Viçosa, MG [45] Amaro et al., (2013)
38.0 Secundary SSF Viçosa, MG [ 46] Torres et al., (2013)
77.5 Primary MMF General Carneiro, PR [47] Mognon et al., (2013)
35.5 Secundary SSF Pereira Barreto, SP [48] Stucchi (2013)
36.5 Secundary SSF
Caratinga, MG [49] Souza et al., 2012
75.2 Bom Jesus, MG
89.5 Primary MMF General Carneiro, PR [50] Watzlawick et al., (2012)
94.3 Primary
SSF Ubatuba, SP [5] Vieira et al., (2011)
126.7 MMF S, L, Paraitinga, SP
47.9 Secundary MMF General Carneiro, PR [51 ] Amaral et al., (2010)
19.5 Secundary SSF Viçosa, MG [52 ] Ribeiro et al., (2010)
76.7 Primary MMF Apiúna, SC [53] Silveira (2010)
83.3 Primary SSF Viçosa, MG [54] Ribeiro et al., (2009)
45.4 Secundary SSF Cruzeiro, SP [34] Coutinho (2009)
145.3 Primary SSF São Paulo, SP [55] Velasco & Higuchi (2009)
65.9 Secundary MMF S, M, Madalena, RJ [56] Cunha (2009)
68.4
41.8 Secundary SSF Santa Tereza, RS [57] Brun (2004)
65.4
29.8 Secundary SSF Oratórios, MG [58] Lima et al., (2003)
165.0 Primary
MMF General Carneiro, PR
[59] Sanquetta et al., (2002)
70.2 Secundary
28.8 Secundary
Proc. of SPIE Vol. 9998 99981T-9
Downloaded From: http://proceedings.spiedigitallibrary.org/ on 10/28/2016 Terms of Use: http://spiedigitallibrary.org/ss/termsofuse.aspx

Table 3. Published papers of carbon stocks (Mg C ha-1 year-1) in aboveground live biomass (AGLB) for Eucalyptus crop at
different locations in Southeast Brazil.
According to our study, the total amount of carbon sequestered in the whole PSWSP (NF+ EU) was 39.9 Tg C or 145.6
Tg of CO2, and the NF areas were responsible for the largest C stock of the watershed (89%).
Brazil released about 1.6 billion tons of CO2 (1.6 Gt CO2eq) to the atmosphere in 2014 [2] and LULC is the main sector
responsible for GHG emissions, and contributes with 32.7% (0.5 Gt CO2eq or 472.6 million tons of CO2eq) due to
deforestation in the Amazon and Cerrado [2]. On the other hand, PSWSP is contributing to the increase of carbon
sequestration from the atmosphere by means of land-use changes. Instead of losing forests to pasture areas, as it happens
in Amazon, Cerrado and other watersheds in the state of São Paulo, there is an increase in secondary native forests over
areas previously used as pastures at PSWSP.
The regeneration of tropical forests, aside from contributing to carbon sequestration, plays an important role in biodiversity
conservation, in the increase of connectivity between fragmented landscapes, water regulation, nutrient cycling, and may
provide other services, positively interfering on the local agricultural production by helping maintain pollinators, natural
enemies, among others. Since the tree biomass of fragments is widely affected by the amount of surrounding forest, the
connectivity may also have a strong influence on the recovery of carbon stocks [3, 4, 5, 6].
3.3. Economy and sustainability
Husbandry remains the main income generator of the region's agriculture. Despite the reduction in pasture areas, beef and
milk production increased between 1985 and 2015 [24]. Beef production grew from 731 thousand to 2.9 million arrobas,
and milk production jumped from 187 to 206 thousand liters, even with a smaller herd and area [24]. Index that measures
the economic development of the main agricultural activities, the VAP of beef has been growing since the 1990s, and the
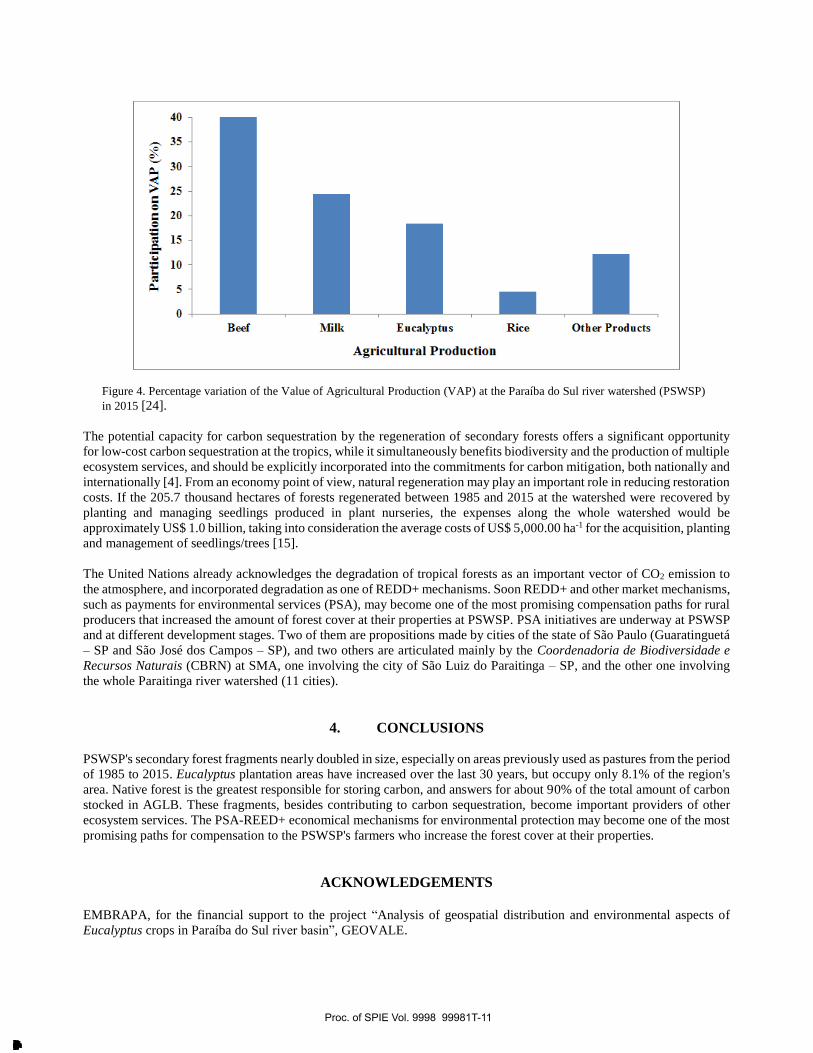
activity is currently the one that contributes the most to the region's income (Figure 4). Milk production's participation in
the VAP, on the other hand, has been decreasing and currently competes with the value of Eucalyptus crop for the second
position in the rank of contributors to agricultural income at the PSWSP (Figure 4). Economically, Eucalyptus-based
forestry featured the strongest technological development at the PSWSP. The VAP of Eucalyptus plantations in 2015 was
about R$163 million [24].
Carbon stock
Mg C ha-1 year-1
Pool
description
Eucalyptus Species Location Source
10.5
–1
ano
–1
.
Aboveground Eucalyptus spp Viçosa, MG [60] Brianezi et al., (2014)
13.2 Above, belowground E. urograndis Jacarei, SP [61] Bassanelli (2013)
9.1 Aboveground E. urograndis Turmalina, MG [62] Santos et al., (2012)
9.3 Aboveground E. grandis Itamarandiba, MG [63] Rocha (2011)
14.2 Above, belowground Eucalyptus spp Centro-Leste, MG [64] Gatto et al., (2011)
8.5 Aboveground E. urograndis Cruzeiro, SP [34] Coutinho (2009)
9.8 Aboveground E. grandis Guanhães, MG [65] Silva et al., (2008)
8.9 Above, belowground E. grandis Viçosa, MG [66] Paixão et al., (2006)
13.5 Above, belowground E. grandis B. do Riacho, ES [67] Maestri et al., (2004)
Proc. of SPIE Vol. 9998 99981T-10
Downloaded From: http://proceedings.spiedigitallibrary.org/ on 10/28/2016 Terms of Use: http://spiedigitallibrary.org/ss/termsofuse.aspx
40
,-, 35\°0ÿ 30
250
200
as 15
10
a 5
0
Beef \Bilk Eucalyptus Rice Other Products
Agricultural Production
Figure 4. Percentage variation of the Value of Agricultural Production (VAP) at the Paraíba do Sul river watershed (PSWSP)
in 2015 [24].
The potential capacity for carbon sequestration by the regeneration of secondary forests offers a significant opportunity
for low-cost carbon sequestration at the tropics, while it simultaneously benefits biodiversity and the production of multiple
ecosystem services, and should be explicitly incorporated into the commitments for carbon mitigation, both nationally and
internationally [4]. From an economy point of view, natural regeneration may play an important role in reducing restoration
costs. If the 205.7 thousand hectares of forests regenerated between 1985 and 2015 at the watershed were recovered by
planting and managing seedlings produced in plant nurseries, the expenses along the whole watershed would be
approximately US$ 1.0 billion, taking into consideration the average costs of US$ 5,000.00 ha-1 for the acquisition, planting
and management of seedlings/trees [15].
The United Nations already acknowledges the degradation of tropical forests as an important vector of CO2 emission to
the atmosphere, and incorporated degradation as one of REDD+ mechanisms. Soon REDD+ and other market mechanisms,
such as payments for environmental services (PSA), may become one of the most promising compensation paths for rural
producers that increased the amount of forest cover at their properties at PSWSP. PSA initiatives are underway at PSWSP
and at different development stages. Two of them are propositions made by cities of the state of São Paulo (Guaratinguetá
– SP and São José dos Campos – SP), and two others are articulated mainly by the Coordenadoria de Biodiversidade e
Recursos Naturais (CBRN) at SMA, one involving the city of São Luiz do Paraitinga – SP, and the other one involving
the whole Paraitinga river watershed (11 cities).
4. CONCLUSIONS
PSWSP's secondary forest fragments nearly doubled in size, especially on areas previously used as pastures from the period
of 1985 to 2015. Eucalyptus plantation areas have increased over the last 30 years, but occupy only 8.1% of the region's
area. Native forest is the greatest responsible for storing carbon, and answers for about 90% of the total amount of carbon
stocked in AGLB. These fragments, besides contributing to carbon sequestration, become important providers of other
ecosystem services. The PSA-REED+ economical mechanisms for environmental protection may become one of the most
promising paths for compensation to the PSWSP's farmers who increase the forest cover at their properties.
ACKNOWLEDGEMENTS
EMBRAPA, for the financial support to the project “Analysis of geospatial distribution and environmental aspects of
Eucalyptus crops in Paraíba do Sul river basin”, GEOVALE.
Proc. of SPIE Vol. 9998 99981T-11
Downloaded From: http://proceedings.spiedigitallibrary.org/ on 10/28/2016 Terms of Use: http://spiedigitallibrary.org/ss/termsofuse.aspx

REFERENCES
[1] Hansen, M. C., Potapov, P. V., Moore, R., Hancher, M., Turubanova, S. A., Tyukavina, A., Thau, D., Stehman, S. V.,
Goetz, S. J., Loveland, T. R., Kommareddy, A., Egorov, A., Chini, L., Justice, C. O. and Townshend, J. R. G., “High-
resolution global maps of 21st-century forest cover change”, Science 342, 850–853 (2013).
[2] Observatório ABC, [Agricultura de Baixa Emissão de Carbono – Invertendo o sinal de carbono da agropecuária
brasileira: uma estimativa do potencial de mitigação de tecnologias do Plano ABC de 2012 a 2023], Fundação Getúlio
Vargas (FGV), São Paulo, 31p (2015).
[3] Poorter, L., Bongers, F., Aide, T. M. et al., “Biomass resilience of Neotropical secondary forests”, Nature 530, 211–
214 (2016).
[4] Chazdon, R. L., Broadbent, E. N., Rozendaal, D. M., Bongers, F., Zambrano, A. M. A., Aide, T. M. and Craven, D.,
“Carbon sequestration potential of second-growth forest regeneration in the Latin American tropics”, Sci. Adv. 2(5),
e1501639 (2016).
[5] Vieira, A. S., Alves, L. F., Duarte-Neto, P. J., Martins, S. C., Veiga, L. G., Scaranello, M. A., Picollo, M. C., Camargo,
P. B., Do Carmo, J. B., Sousa Neto, E., Santos, F. A. M., Joly, C. A. and Martinelli, L. A., “Stocks of carbon and nitrogen
and partitioning between above-and belowground pools in the Brazilian coastal Atlantic Forest elevation range”, Ecol.
Evol. 1(3), 421-434 (2011).
[6] Robinson, S. J. B., van den Berg, E., Meirelles, G. S. and Ostle, N., “Factors influencing early secondary succession
and ecosystem carbon stocks in Brazilian Atlantic Forest”, Biodivers. Conserv. 24(9), 2273-2291 (2015).
[7] Diniz, A. R., Machado, D. L., Pereira, M. G., de Carvalho Balieiro, F. and Menezes, C. E. G., “Biomassa, estoques de
carbono e de nutrientes em estádios sucessionais da Floresta Atlântica, RJ”, Rev. Bras. Ciênc. Agr. 10(3), 443-451 (2015).
[8] Joly, C. A., Metzger, J. P. and Tabarelli, M., “Experiences from the Brazilian Atlantic Forest: ecological findings and
conservation initiatives”, New Phytol. 204, 459–473 (2014).
[9] IBGE, [Indicadores de Desenvolvimento Sustentável], Coordenação de Recursos Naturais e Estudos Ambientais e
Coordenação de Geografia (IBGE), Rio de Janeiro/RJ, 352p (2015).
[10] Pütz, S., Groeneveld, J., Henle, K., Knogge, C., Martensen, A. C., Metz, M. and Huth, A., “Long-term carbon loss in
fragmented Neotropical forests”, Nat. Commun. 5, 5037 (2014).
[11] Lira, P. K., Tambosi, L. R., Ewers, R. M. and Metzger, J. P., “Land-use and land-cover change in Atlantic Forest
landscapes”, Forest Ecol. Manage., 278(15), 80–89 (2012).
[12] Azevedo, J. C., Perera, A. H. and Pinto, M. A., [Forest landscapes and global change: challenges for research and
management], Springer, New York, 75-105 (2014).
[13] Silva, R. F. B., Batistella, M., Moran, E. F. and Lu, D., “Land Changes Fostering Atlantic Forest Transition in Brazil:
Evidence from the Paraíba Valley”, Prof. Geogr., 1-14 (2016).
[14] Rezende, C. L., Uezu, A., Scarano, F. R. and Araujo, D. S. D., “Atlantic forest spontaneous regeneration at land-
scape scale”, Biodiv. Conserv. 24(9), 2255-2272 (2015).
[15] Brancalion, P. H. S., Viani, R. A. G., Strassburg, B. B. N. and Rodrigues, R. R., “Finding the money for tropical forest
restoration”, Unasylva 63, 41–50 (2012).
[16] Eva, H. D., Carboni, S., Achard, F., Stach, N., Durieux, L., Faure, J-F. and Mollicone, D., “Monitoring forest areas
from continental to territorial levels using a sample of medium spatial resolution satellite imagery”, J. Photogramm.
Remote Sens. 65(2), 191–197 (2010).
[17] Itani, M. R., Barros, C. M., Figueiredo, F. E. L., Andrade, M. R. M., Mansor, M. T. C., Mangabeira, R. L. and Carvalho
V. S., [Subsídios ao planejamento ambiental: Unidade de Gerenciamento de Recursos hídricos Paraíba do Sul – UGRHI
02/Subsidies for Environmental Planning: Hydrographic Unit Water of Resources Management of Paraíba do Sul – UGRHI
02], CETESB: Secretaria do Meio Ambiente, São Paulo/SP, 204p (2011).
[18] Leão, R. O. M., [Regressive Evolution of stream channels by sub-surface water flow: geo-hydro-ecological bases for
recovering degraded areas by the controlling of erosion], PhD thesis - Federal University of Rio de Janeiro, Rio de Janeiro,
(2005).
[19] U.S. Geological Survey, “Landsat Processing Details”, <http://landsat.usgs.gov/Landsat_Processing_Details.php>
(23 March 2016).
[20] Adler-Golden, S. M., Matthew, M. W., Bernstein, L. S., Levine, R. Y., Berk, A., Richtsmeier, S. C., Acharya, P. K.,
Anderson, G. P., Felde, G., Gardner, J., Hoke, M., Jeong, L. S., Pukall, B., Ratkowski, A. and Burke, H-H, “Atmospheric
Correction for Short-wave Spectral Imagery Based on MODTRAN4”, Proc. SPIE3753, 61-69 (1999).
[21] Foody, G. M., “Status of land cover classification accuracy assessment”, Remote Sens. Environ. 80(1), 185-201
(2002).
Proc. of SPIE Vol. 9998 99981T-12
Downloaded From: http://proceedings.spiedigitallibrary.org/ on 10/28/2016 Terms of Use: http://spiedigitallibrary.org/ss/termsofuse.aspx

[22] Caprioli, M. and Tarantino, E., “Accuracy Assessment of Per-field Classification Integrating Very Fine Spatial
Resolution Satellite Imagery with Topographic Data”, J. Geospatial Eng. 3(2), 127-134 (2001).
[23] Kronka, F. J. N., [Inventário florestal das áreas reflorestadas do Estado de São Paulo], Instituto Florestal: Secretaria
de Estado do Meio Ambiente, São Paulo, 184p (2002).
[24] Instituto de Economia Agrícola – IEA, “Banco de dados”, <http://www.iea.sp.gov.br/out/bancodedados.html> (10
August 2016).
[25] Ronquim, C. C., Gonçalves, J. M. C., Guilardi, V., Garçon, E. A. M. V. and Aguiar, D. A., [Dinâmica de uso e
cobertura da terra em áreas de produção de café e cana-de-açúcar em municípios paulistas das bacias dos rios Mogi-Guaçu
e Pardo entre 1988 e 2015], Embrapa Monitoramento por Satélite, Campinas/SP, 28p (2015).
[26] Rudorff, B. F. T., Aguiar, D. A., Silva, W. F., Sugawara, L. M., Adami, M. and Moreira, M. A., “Studies on the Rapid
Expansion of Sugarcane for Ethanol Production in São Paulo State (Brazil) Using Landsat Data”, Remote Sens. 2(4), 1057-
1076 (2010).
[27] Bernard, E., Melo, F. P. L. and Pinto, S. R. R., “Challenges and opportunities for biodiversity conservation in the
Atlantic Forest in face of bioethanol expansion”, Trop. Conserv. Sci. 4, 267–275 (2011).
[28] Buainain, A. M., Alves, E., da Silveira, J. M. and Navarro, Z., [O mundo rural no Brasil do século 21: a formação de
um novo padrão agrário e agrícola], Embrapa, Brasília/DF, 35-76 (2014).
[29] Argüello, F. V. P., [Expansão do eucalipto no trecho paulista da bacia hidrográfica Paraíba do Sul], Dissertação de
Mestrado - Universidade de Taubaté, Taubaté/SP, 25p (2010).
[30] Timo, T. P. C., Lyra-Jorge, M. C., Gheler-Costa, C. and Verdade, L. M., “Effect of the plantation age on the use of
Eucalyptus stands by medium to large-sized wild mammals in south-eastern Brazil”, iForest-Biogeosci. Forest. 8(2), 108-
113 (2015).
[31] Menezes, S. J. M. C., Sediyama, G. C., Soares, V. P., Gleriani, J. M. and Andrade, R. G., “Estimativa dos componentes
do balanço de energia e da evapotranspiração em plantios de eucalipto utilizando o algoritmo sebal e imagem landsat 5 –
TM”, Rev. Árvore 35, 649-657 (2011).
[32] Silva, R. F. B., Batistella, M., Moran E. F. “Drivers of land change: Human-environment interactions and the Atlantic
forest transition in the Paraíba Valley, Brazil”. Land Use Pol. 58, 133–144, (2016).
[33] Costa, K. M., [O estoque de carbono na vegetação e no solo de fragmentos florestais em paisagens tropicais],
Dissertação de Mestrado - Universidade de São Paulo, São Paulo, 66p (2015).
[34] Coutinho, R. P., [Estoques de carbono e emissão de N2O no sistema solo-planta em região da Mata Atlântica],
Dissertação de Mestrado - Universidade Federal Rural do Rio de Janeiro, Rio de Janeiro, 57p (2009).
[35] Oliveira, M., Ril, F. L., Perett, C., Capellesso, E. S., Sause, T. L., Budke, J. C., “Biomassa e estoques de carbono em
diferentes sistemas florestais no sul do Brasil”, Perspectiva 40(149), 09-20 (2016).
[36] Barbosa, T. C., [Quantificação de biomassa e carbono da parte aérea em uma área de Mata Atlântica, na Serra da
Cantareira, São Paulo], Tese de Doutorado - Universidade de São Paulo, São Paulo, 99p (2015).
[37] Maas, G. C. B., [Compartimentação do estoque de carbono em floresta ombrófila Mista], Tese de Doutorado -
Universidade Federal do Paraná, Curitiba/PR, 172p (2015).
[38] de Figueiredo, L. T. M., Soares, C. P. B., de Sousa, A. L., Leite, H. G. and da Silva, G. F., “Dinâmica do estoque de
carbono em fuste de árvores de uma floresta estacional semidecidual”. Cerne 21(1), 161-167 (2015).
[39] Lipinski, E. T., [Dinâmica de biomassa e carbono da parte aérea durante 17 anos em um fragmento de floresta
ombrófila mista montana], Trabalho de Conclusão de Curso - Universidade Federal do Paraná, Curitiba/PR, 39p (2015).
[40] Carvalho, F. D., [Modulação do estoque de carbono em paisagens fragmentadas da Mata Atlântica em função dos
efeitos de borda], Dissertação de Mestrado - Universidade de São Paulo, São Paulo, 73p (2015).
[41] Barreto, T. G., Dalla Corte, A. P., Mognon, F., Rodrigues, A. L. and Sanquetta, C. R., “Dinâmica da biomassa e do
carbono em fragmento urbano de floresta ombrófila mista”, Encicl. Biosf. 10(18), 1300-1315 (2014).
[43] Carvalho, L. S., Cerqueira, R. M., da Silva, G. V. and Silva, E. R. M., “Estoque de carbono em um fragmento de
floresta estacional semidecídua no município de Ribeirão Grande, São Paulo”, Bioikos 28(2), 73-85 (2015).
[43] Romitelli, I., [Variabilidade espacial nos estoques de carbono em paisagens fragmentadas da Mata Atlântica],
Dissertação de Mestrado - Universidade de São Paulo, São Paulo, 55p (2014).
[44] Gaspar, R. D. O., [Classificação de estágios sucessionais, estoque e crescimento em carbono de floresta estacional
semidecidual, Vale do Rio Doce, MG], Tese de Doutorado - Universidade Federal de Viçosa, Viçosa/MG, 74p (2013).
[45] Amaro, M. A., Soares, C. P. B., Souza, A. L. D., Leite, H. G. and Silva, G. F. D., “Estoque volumétrico, de biomassa
e de carbono em uma Floresta Estacional Semidecidual em Viçosa, Minas Gerais”, Rev. Árvore 37(5), 849-857 (2013).
Proc. of SPIE Vol. 9998 99981T-13
Downloaded From: http://proceedings.spiedigitallibrary.org/ on 10/28/2016 Terms of Use: http://spiedigitallibrary.org/ss/termsofuse.aspx

[46] Torres, C. M. M. E., Jacovine, L. A. G., Soares, C. P. B., Oliveira Neto, S. N., Santos, R. D. and Castro Neto, F.,
“Quantificação de biomassa e estocagem de carbono em uma floresta estacional semidecidual, no Parque Tecnológico de
Viçosa, MG”, Rev. Árvore 37(4), 647-55 (2013).
[47] Mognon, F., “Dinâmica do estoque de carbono como serviço ambiental prestado por um fragmento de Floresta
Ombrófila Mista Montana localizada no Sul do Estado do Paraná”, Floresta 43(1), 153-164 (2013).
[48] Stucchi, G. B., [Estimativa dos estoques de carbono na parte aérea de reflorestamentos de espécies nativas e
remanescentes florestais], Dissertação de Mestrado - Universidade de São Paulo, São Paulo, 78p (2013).
[49] Souza, A. L., Boina, A., Soares, C. P. B., Vital, B. R., Gaspar, R. O. and Lana, J. M., “Estrutura fitossociológica,
estoques de volume, biomassa, carbono e dióxido de carbono em floresta estacional semidecidual”, Rev. Árvore 36(1),
169-179 (2012).
[50] Watzlawick, L. F., Caldeira, M. V. W., Viera, M., Schumacher, M. V., de Oliveira Godinho, T. and Balbinot, R.,
“Estoque de biomassa e carbono na Floresta Ombrófila Mista Montana, Paraná”, Sci. Forestalis 40(95), 353-362 (2012).
[51] Amaral, L. de P., Ferreira, R. A., Watzlawick, L. F., Genú, A. M., “Análise da distribuição espacial de biomassa e
carbono arbóreo acima do solo em Floresta Ombrófila Mista”, Ambiência 6, 103–114 (2010).
[52] Ribeiro, S. C., Jacovine, L. A. G., Soares, C. P. B., Martins, S. V., Nardelli, A. M. B. and Souza, A. L. D.,
“Quantificação de biomassa e estimativa de estoque de carbono em uma capoeira da Zona da Mata Mineira”, Rev. Árvore
34(3), 495-504 (2010).
[53] Silveira, P., “Estimativa da biomassa e carbono acima do solo em um fragmento de floresta ombrófila densa utilizando
o método da derivação do volume comercial”, Floresta 40(4), 789-800 (2010).
[54] Ribeiro, S. C., Jacovine, L. A. G., Soares, C. P. B., Martins, S. V., Souza, A. L. D. and Nardelli, A. M. B.,
“Quantificação de biomassa e estimativa de estoque de carbono em uma floresta madura no município de Viçosa, Minas
Gerais”, Rev. Árvore 33(5), 917-926 (2009).
[55] Velasco, G. D. N. and Higuchi, N., “Estimativa de sequestro de carbono em mata ciliar: Projeto POMAR, São Paulo
(SP)”, Ambiência - Rev. Setor Ciênc. Agr. Ambient. 5(1), 135–41 (2007).
[56] Cunha, G. M., Gama-Rodrigues, A. C., Gama-Rodrigues, E. F. and Velloso, A. C. X., “Biomassa e estoque de carbono
e nutrientes em florestas montanas da Mata Atlântica na região norte do estado do Rio de Janeiro”, Rev. Bras. Ciênc. Solo
33(5), 1175-1185 (2009).
[57] Brun, E. J., [Biomassa e nutrientes na Floresta Estacional Decidual, em Santa Tereza, RS], Dissertação de Mestrado
- Universidade Federal de Santa Maria, Santa Maria/RS, 136p (2004).
[58] Lima, J. A. S., Carmo, C. A. F. S., Kindel, A. and Motta, P. E. F., [Estimativa de biomassa e estoque de carbono de
uma floresta secundária em Minas Gerais], Embrapa Solos, Rio de Janeiro/RJ, 18p (2003).
[59] Sanquetta, C. R., Watzlawick, L. F., Balbinot, R., Ziliotto, M. A. and Gomes, F. S., [As florestas e o carbono],
Universidade Federal do Paraná, Curitiba/PR, 153-173 (2002).
[60] Brianezi, D., Jacovine, L. A. G., Soares, C. P. B., Gonçalves, W. and da Rocha, S. J. S. S., “Balanço de Emissões e
Remoções de Gases de Efeito Estufa no Campus da Universidade Federal de Viçosa”, Floresta Ambient. 21(2), 182-191
(2014).
[61] Bassanelli, H. R., [Determinação de carbono total em plantações de eucalipto e pastagens], Dissertação de Mestrado
- Universidade de Taubaté, Taubaté/SP, 47p (2013).
[62] Santos, L. C., Carvalho, A. M. M. L., Pereira, B. L. C., Oliveira, A. C., Carneiro, A. D. C. O. and Trugilho, P. F.,
“Propriedades da madeira e estimativas de massa, carbono e energia de clones de Eucalyptus plantados em diferentes
locais”, Rev. Árvore 36(5), 971-980 (2012).
[63] Rocha, M. F. V., [Influência do espaçamento e da idade na produtividade e propriedades da madeira de Eucalyptus
grandis x Eucalyptus camaldulensis para energia], Dissertação de Mestrado - Universidade Federal de Viçosa, Viçosa/MG,
71p (2011).
[64] Gatto, A., Barros, N. F. D., Novais, R. F. D., Silva, I. R. D., Leite, H. G. and Villani, E. M. D. A., “Estoque de carbono
na biomassa de plantações de eucalipto na região centro-leste do estado de Minas Gerais”, Rev. Árvore 35(4), 895-905
(2011).
[65] Silva, R. F., Soares, C. P. B., Jacovine, L. A. G., da Silva, M. L., Leite, H. G. and da Silva, G. F., “Projeção do estoque
de carbono e análise da geração de créditos em povoamentos de eucalipto”, Rev. Árvore 32(6), 979-992 (2008).
[66] Paixão, F. A., Soares, C. P. B., Jacovine, L. A. G., Silva, M. L. D., Leite, H. G. and Silva, G. F. D., “Quantificação
do estoque de carbono e avaliação econômica de diferentes alternativas de manejo em um plantio de eucalipto”, Rev.
Árvore 30(3), 411-420 (2006).
Proc. of SPIE Vol. 9998 99981T-14
Downloaded From: http://proceedings.spiedigitallibrary.org/ on 10/28/2016 Terms of Use: http://spiedigitallibrary.org/ss/termsofuse.aspx