indicators of ecosystem development in resaca restoration...
TRANSCRIPT
Leah McIntosh and Alejandro Fierro-Cabo
Biological Sciences Department
The University of Texas at Brownsville
INDICATORS OF ECOSYSTEM
DEVELOPMENT IN RESACA
RESTORATION BASED ON
THE MACROINVERTEBRATE
COMMUNITY

�Monitor resaca ecosystem development
through the macroinvertebrate community
�One resaca monitored from day zero of
re-flooding
�Use the macroinvertebrate community
composition to assess indicators of
ecosystem development
PURPOSE

� Remnan t s o f R i o G rande channe l ( oxbow l akes )
� Ar t i f i c i a l l y ma in ta i ned w i t h wa te r
� Prov i de va l uab l e f r e shwa te r hab i t a t
� Min ima l r e sea rch on ecosy s tem func t i on
RESACAS
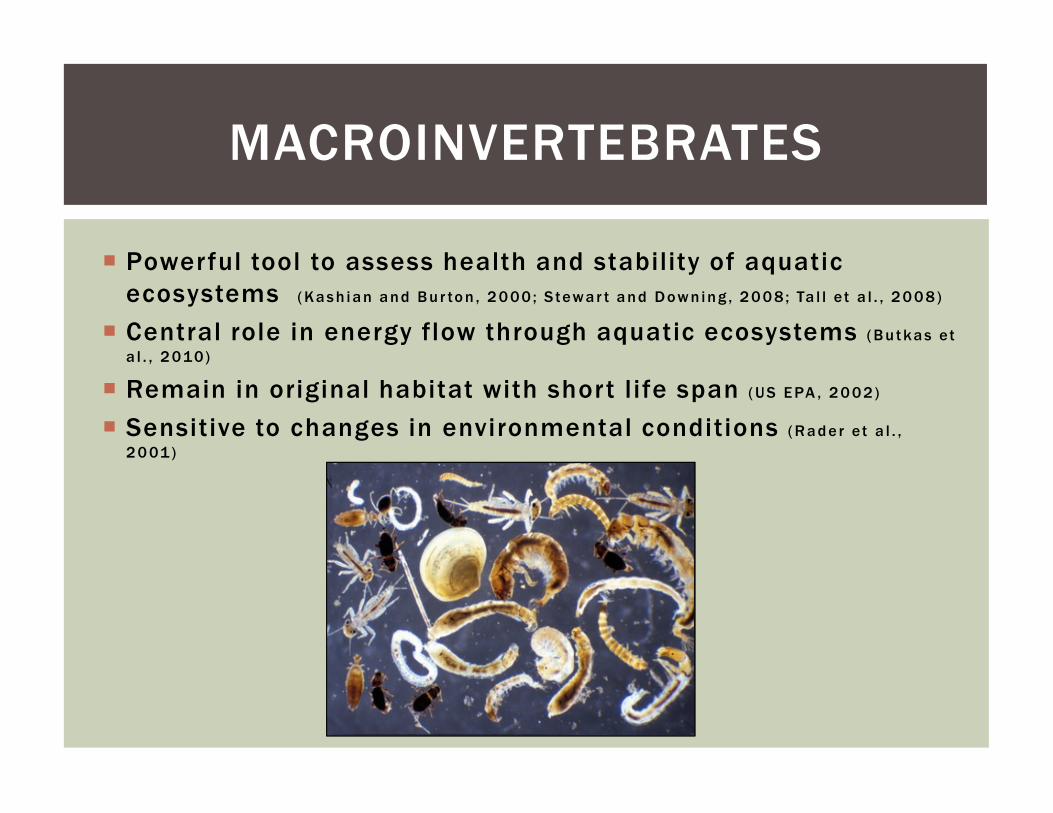
� Powerful tool to assess health and stability of aquatic
ecosystems (Kash ian and Bu r ton , 2000 ; S tewar t and Down ing , 2008; Ta l l e t a l . , 2008)
� Central role in energy flow through aquatic ecosystems (Bu tkas et a l . , 2010)
� Remain in original habitat with short l ife span (US EPA , 2002)
� Sensitive to changes in environmental conditions (Rader e t a l . ,
2001)
MACROINVERTEBRATES

�Resacas in early stages of development have
a different macroinvertebrate community
composition than resacas in later stages of
development
�Macroinvertebrate community can be used as
an indicator of the successional stage of
restored resacas
HYPOTHESES

� Verify if the composition of the macroinvertebrate
community in resacas reflects the continuously
flooded lifetime
�Determine which macroinvertebrate community-
derived metrics are the best site discriminators
OBJECTIVES

STUDY AREA
STUDY AREA
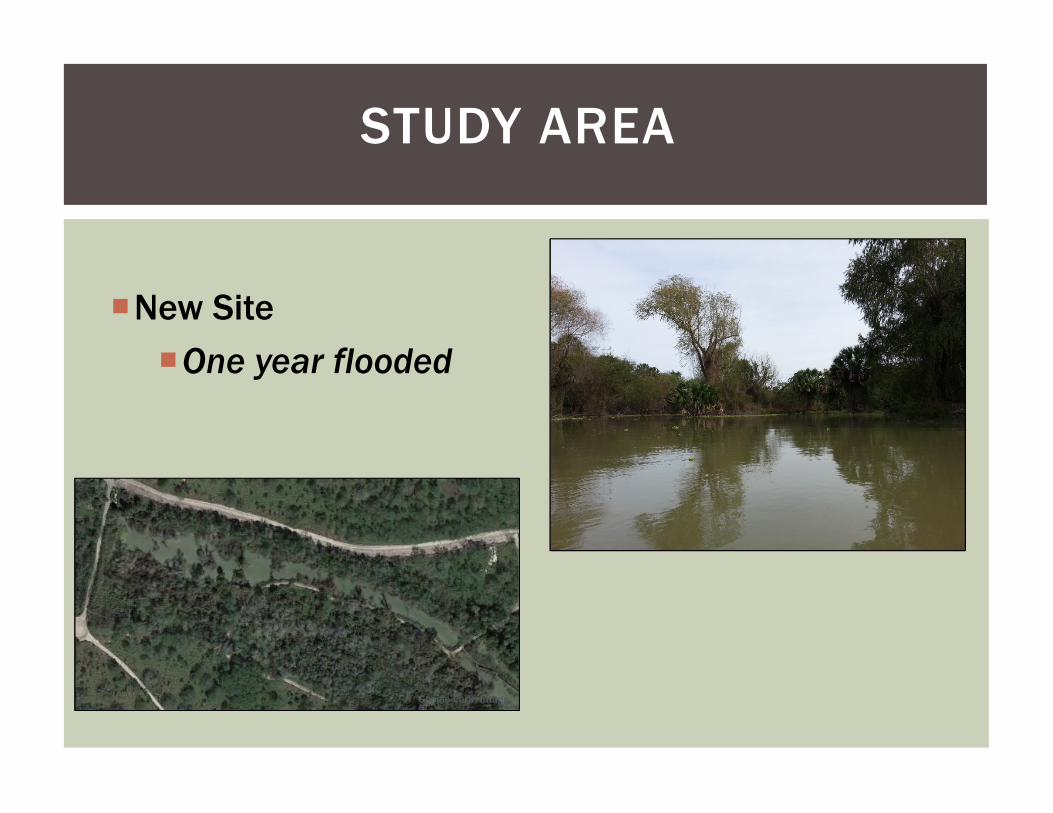
�New Site
�One year flooded
Google Earth Image

STUDY AREA
� Intermediate Site
�Four years flooded
Seth Patterson
STUDY AREA
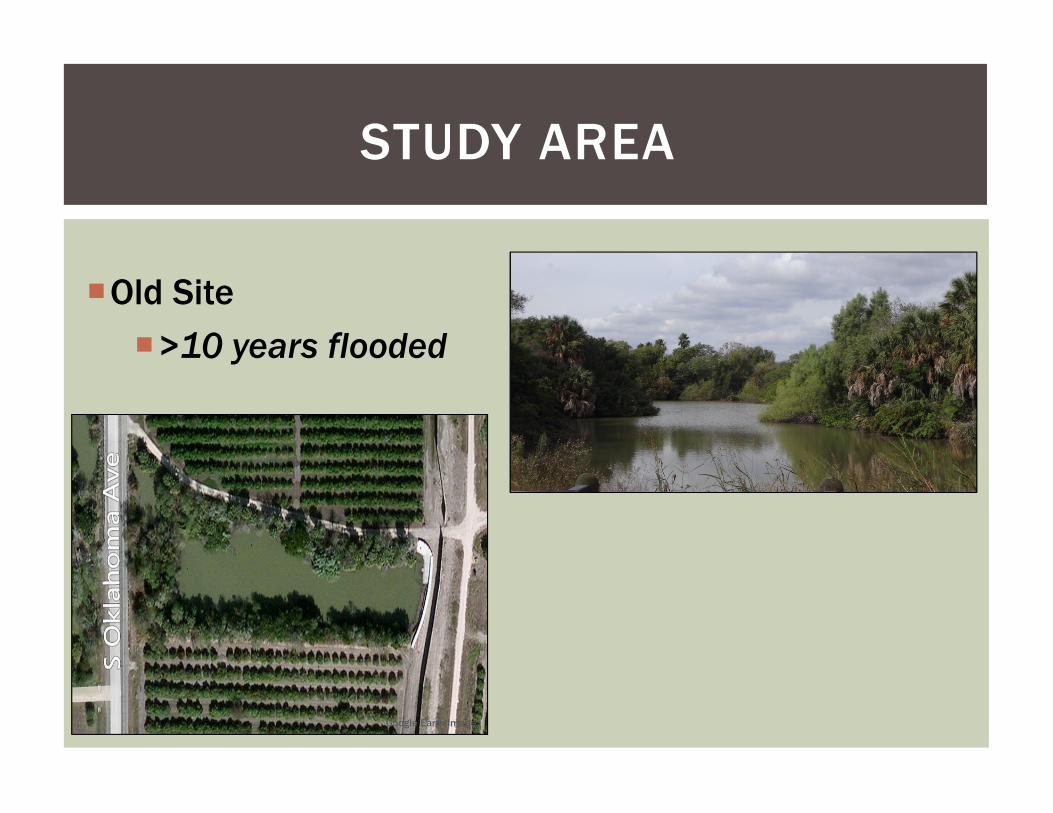
�Old Site
�>10 years flooded
Google Earth Image

� Samples collected from entire community
� Sweep net
� Benthic corer
� Resacas sampled monthly for one year
� Sample location selected randomly
� 5 replicates with 3 subsamples per replicate
� Samples sorted and enumerated to lowest taxa possible
� Water parameters
METHODS
– Temperature
– Specific
Conductivity
– DO
– pH
– Turbidity
(Secchi)
– Chlorophyll-a
– Total P
– Nitrate
– Nitrite
– Ammonia

SEDIMENT CHARACTERISTICS

Site Secchi (cm) pHConductivity
(µs/cm)DO (mg/L) Temp (°C)
New21.6 ± 1.4 8.1 ± 0.1 1216.0 ± 72.4 7.2 ± 0.7 25.4 ± 1.4
Intermediate41.1 ± 3.6 8.3 ± 0.2 1314.6 ± 71.4 9.4 ± 1.0 26.3 ± 1.7
Old26.1 ± 2.1 7.9 ± 0.2 1263.0 ± 47.3 6.6 ± 0.6 24.1 ± 1.7
ENVIRONMENTAL DATA
Siteug chl-a
10cm-1 Carlson's TSI
New 43.0 ± 5.5 66.2
Intermediate 48.2 ± 10 66.5
Old 40.4 ± 3.6 66.5
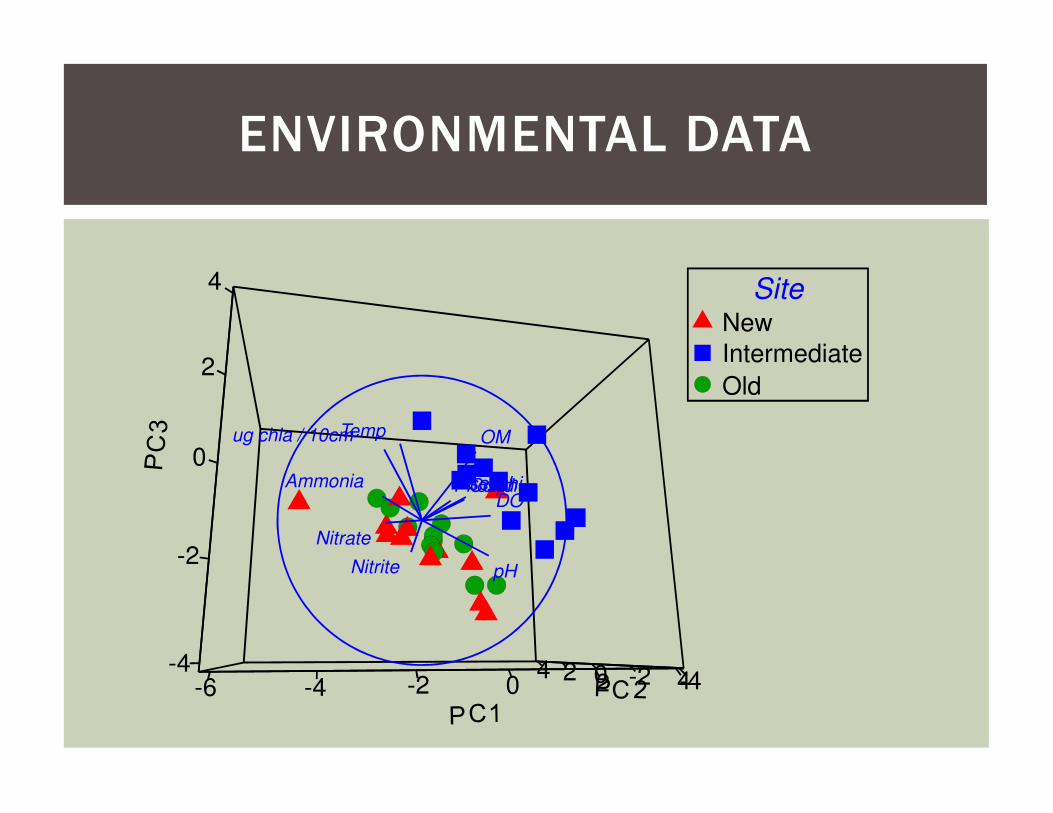
ENVIRONMENTAL DATA
SiteNew
Intermediate
Old
-6 -4 -2 0 2 4-4-2024-4
-2
0
2
4
secchi
pH
ug chla / 10cm
CondDO
Temp
Phosph
Nitrite
Nitrate
Ammonia
OM
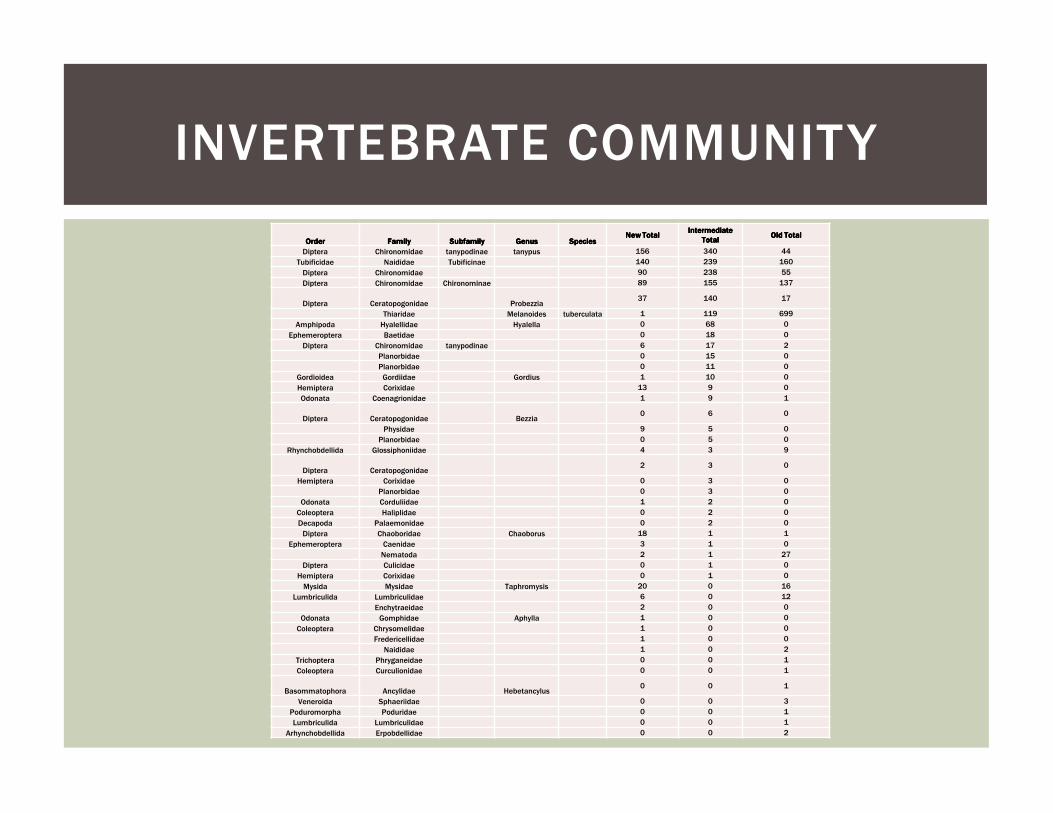
INVERTEBRATE COMMUNITY
OrderOrderOrderOrder FamilyFamilyFamilyFamily SubfamilySubfamilySubfamilySubfamily GenusGenusGenusGenus SpeciesSpeciesSpeciesSpeciesNew TotalNew TotalNew TotalNew Total
Intermediate Intermediate Intermediate Intermediate
TotalTotalTotalTotalOld TotalOld TotalOld TotalOld Total
Diptera Chironomidae tanypodinae tanypus 156 340 44
Tubificidae Naididae Tubificinae 140 239 160
Diptera Chironomidae 90 238 55
Diptera Chironomidae Chironominae 89 155 137
Diptera Ceratopogonidae Probezzia37 140 17
Thiaridae Melanoides tuberculata 1 119 699
Amphipoda Hyalellidae Hyalella 0 68 0
Ephemeroptera Baetidae 0 18 0
Diptera Chironomidae tanypodinae 6 17 2
Planorbidae 0 15 0
Planorbidae 0 11 0
Gordioidea Gordiidae Gordius 1 10 0
Hemiptera Corixidae 13 9 0
Odonata Coenagrionidae 1 9 1
Diptera Ceratopogonidae Bezzia0 6 0
Physidae 9 5 0
Planorbidae 0 5 0
Rhynchobdellida Glossiphoniidae 4 3 9
Diptera Ceratopogonidae2 3 0
Hemiptera Corixidae 0 3 0
Planorbidae 0 3 0
Odonata Corduliidae 1 2 0
Coleoptera Haliplidae 0 2 0
Decapoda Palaemonidae 0 2 0
Diptera Chaoboridae Chaoborus 18 1 1
Ephemeroptera Caenidae 3 1 0
Nematoda 2 1 27
Diptera Culicidae 0 1 0
Hemiptera Corixidae 0 1 0
Mysida Mysidae Taphromysis 20 0 16
Lumbriculida Lumbriculidae 6 0 12
Enchytraeidae 2 0 0
Odonata Gomphidae Aphylla 1 0 0
Coleoptera Chrysomelidae 1 0 0
Fredericellidae 1 0 0
Naididae 1 0 2
Trichoptera Phryganeidae 0 0 1
Coleoptera Curculionidae 0 0 1
Basommatophora Ancylidae Hebetancylus0 0 1
Veneroida Sphaeriidae 0 0 3
Poduromorpha Poduridae 0 0 1
Lumbriculida Lumbriculidae 0 0 1
Arhynchobdellida Erpobdellidae 0 0 2
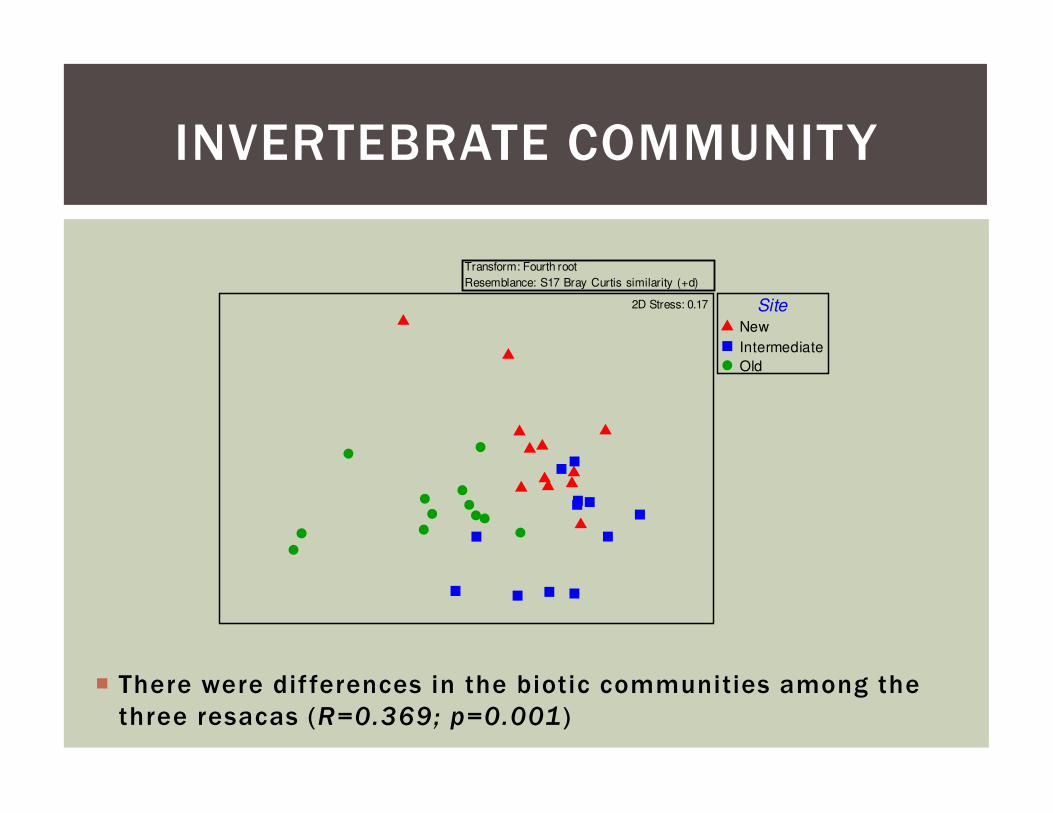
INVERTEBRATE COMMUNITY
� There were dif ferences in the biotic communities among the
three resacas (R=0.369; p=0.001)
Transform: Fourth root
Resemblance: S17 Bray Curtis similarity (+d)
SiteNew
Intermediate
Old
2D Stress: 0.17

INVERTEBRATE COMMUNITY
� Environmental variables were not a significant driver for
dif ferences between the biotic communities (ρ=0.304;
p=0.1)
SiteNew
Intermediate
Old
-6 -4 -2 0 2 4-4-2024-4
-2
0
2
4Transform: Fourth root
Resemblance: S17 Bray Curtis similarity (+d)
2D Stress: 0.17

TAXA DOMINANCE
1 10 100
Species rank
0
20
40
60
Dom
inance %
New
Intermediate
Old

COMMUNITY METRICS
Diversity Indices
Margalef's Richness (d') Pielou's Evenness (J') Shannon Diversity (H')
Va
lue
s
0.0
0.5
1.0
1.5
2.0
2.5
New
Intermediate
Old

Metric New Intermediate Old
Total Abundance 605 1427 1192
Taxa Richness 24 29 21
Family Richness 19 19 16
Diptera taxa 7 9 6
% Chironomidae 56 53 20
% Predators 40.0 38.2 8.6
% Gatherers 54.7 50.4 30.9
% Filterers 3.5 0.1 1.6
% Scrapers 1.7 11.1 58.7
% Shredders 0.2 0.3 0.2
COMMUNITY METRICS
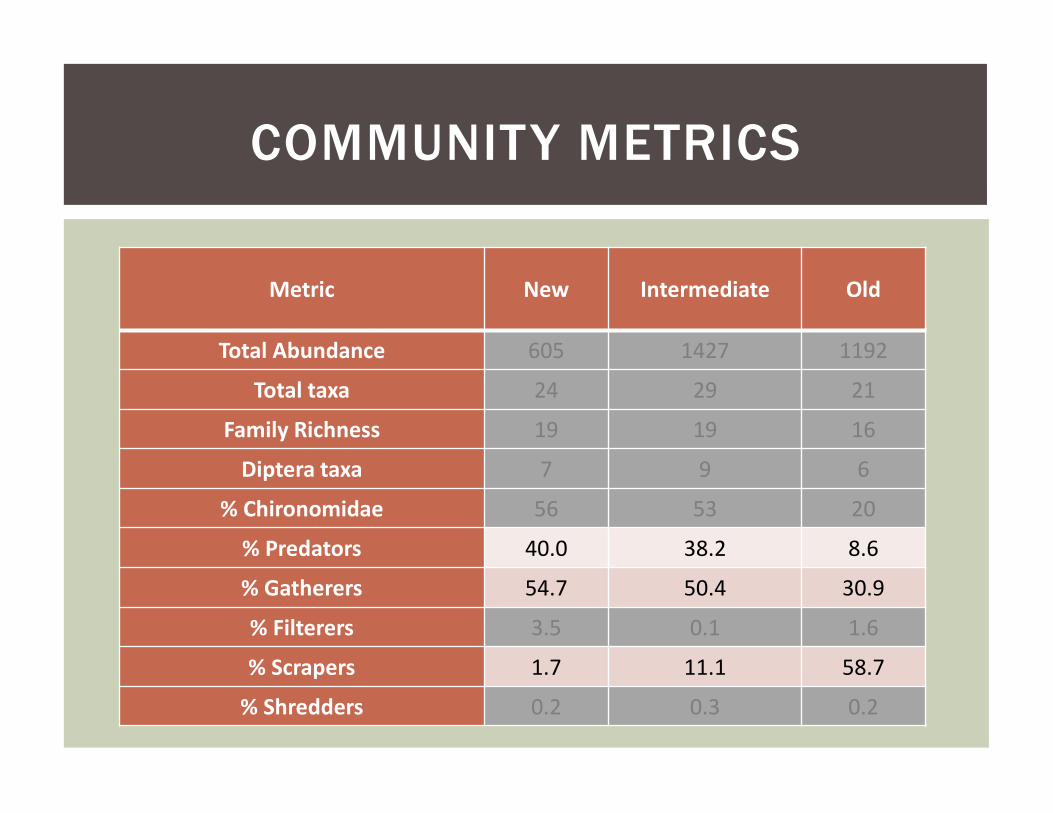
Metric New Intermediate Old
Total Abundance 605 1427 1192
Total taxa 24 29 21
Family Richness 19 19 16
Diptera taxa 7 9 6
% Chironomidae 56 53 20
% Predators 40.0 38.2 8.6
% Gatherers 54.7 50.4 30.9
% Filterers 3.5 0.1 1.6
% Scrapers 1.7 11.1 58.7
% Shredders 0.2 0.3 0.2
COMMUNITY METRICS

COMMUNITY METRICS
Metric NewInterme
diateOld Expected
Richness 24 29 21 ↑↓Ruhi, 2012; Horn, 1974;
Barnes, 1983
% Chironomidae 56 53 20 ↓Canedo-Arguelles &
Rieradevall, 2011;
Barnes, 1983
% Predators 40.0 38.2 8.6 ↑Ruhi et al, 2012; Batzer
& Wissinger, 1996;
Bloechl et al, 2010
% Gatherers 54.7 50.4 30.9 ↑Ruhi et al, 2012; Batzer
& Wissinger 1996
% Filterers 3.5 0.1 1.6
% Scrapers 1.7 11.1 58.7 ↑
% Shredders 0.2 0.3 0.2

� Community differences do not appear to be driven by environmental
factors
� New and intermediate sites are most similar
� Time?
� Metrics that may discriminate between resacas
� Species dominance
� Trophic status
� Decrease in predators, increase in detritivores
� Strongly influenced by exotic gastropod
� System trends toward simplification of the community
� Further research on ecosystem function
CONCLUSIONS

� Special thanks to the Gorgas
Science Foundation for
supporting the resaca
restoration at Sabal Palm
Sanctuary
ACKNOWLEDGEMENTS
� Thank you to fellow students who have provided
valuable field and lab assistance: Rachel Arney, Guillermo Aguilar, Ricky Alexander, Mike Bollinger, Maria
Cooksey, Monica Delgado, Catheline Froehlich, Victor
Garza, John Gray, Liana Lerma, Crystal Martinez, Mario
Marquez, JonRoss Rodriquez, Lydia Roush, Paloma
Rodriguez, Jessica Sahu Teli, Claudia Tamez, Aaron White
� Butkas , K . J . , Vadeboncoeur, Y. and Vander Zanden, M. J . (2010) . Est imat ing benthic inver tebrate product ion in lakes : a comparison of methods and scal ing f rom ind iv idual taxa to the whole - lake level . Aquat . Sc i . 73, 153–169.
� Barnes , L . E . (1983) . The co lonizat ion of bal l -c lay ponds by macroinver tebrates and macrophytes. Freshw. Bio l . 561–578.
� Batzer, D . P. and Wiss inger, S . A . (1996) . Ecology of insect communit ies in nont idalwet lands . Annual Rev iew of Entomology 41 , 75 -100.
� Canedo-Arguel les, M. and Rieradeval l , M. (2011) . Ear ly success ion of the macroinver tebrate community in a shal low lake: Response to changes in the habi tat condi t ion . Limnologica 363–370.
� Kashian, D . R . and Bur ton, T. M. (2000) . A comparison of macroinver tebrates of two Great Lakes coasta l wet lands: test ing potent ia l metr ics for an index of eco logica l integr i ty. J . Gt . Lakes Res . 26, 460–481 .
� Rader, R . B . , Batzer, D . P. and Wiss inger, S . A . (2001) . Bioassessment and Management of Nor th American Freshwater Wet lands . New York : Wi ley.
� Spat ial and temporal pat terns of p ioneer macrofauna in recent ly c reated ponds : taxonomic and funct ional approaches. Hydrobiologia . 61 , 137-151 .
� Stewar t , T. W. and Downing, J . A . (2008) . Macroinver tebrate communit ies and env i ronmental condi t ions in recent ly constructed wet lands . Wet lands 28, 141–150.
� Tal l , L . , Méthot , G . , Armel l in , A . and P inel -A l loul , B . (2008) . B ioassessment of benthic macroinver tebrates in wet land habi tats o f Lake Saint -Pierre (St . Lawrence River ) . J . Gt . Lakes Res . 34, 599–614.
� US EPA (2002) . Methods for evaluat ing wet lands condit ion : #9 Developing an inver tebrate index of b io logica l integr i ty for wet lands.
REFERENCES