rocky mountain trench ecosystem restoration...
TRANSCRIPT
ROCKY MOUNTAIN TRENCH ECOSYSTEM RESTORATION PROGRAMBLUEPRINT FOR ACTION 2013 PROGRESS & LEARNINGS 1997-2013

Publisher Rocky Mountain Trench Ecosystem Restoration Program
Editor / Project Manager Susan Bond
Technical Editor BJ Randall (Randy) Harris
Editorial Consultant Don Gayton
Project Advisor John Krebs
Writers Susan Bond, Mike Gall, Don Gayton, Randy Harris, Brad Munroe, Rob Neil, Hillary Page, Wendy Rockafellow, Scott Witbeck
Photos Jeff Allen, BC Ministry of Forests, Lands and Natural Resource Operations, Susan Bond, Sue Crowley, Brian Dureski, Tim Ennis, Nigel Finney, Don Gayton, Ivan Gayton, Craig Gentle, Glenbow Archives, Randy Harris, Barb Houston, National Archives of Canada, Rob Neil, Hillary Page, Kari Stuart-Smith
Maps Laura Luxton, Mark Schnider
Graphic Design Desktop Graphics
Printing Rocky Mountain Print Solutions
Rocky Mountain Trench Ecosystem Restorationhttp://www.trench-er.com/
http://kaywa.me/m1nVS
Download the Kaywa QR Code Reader (App Store &Android Market) and scan your code!
BLUEPRINT ONLINEA digital edition of Blueprint for Action 2013 is available at: www.trench-er.com.The digital edition contains hyperlinks to original sources and other material referred to in the text.
Hyperlinks were current as of date of publication (December 2013).
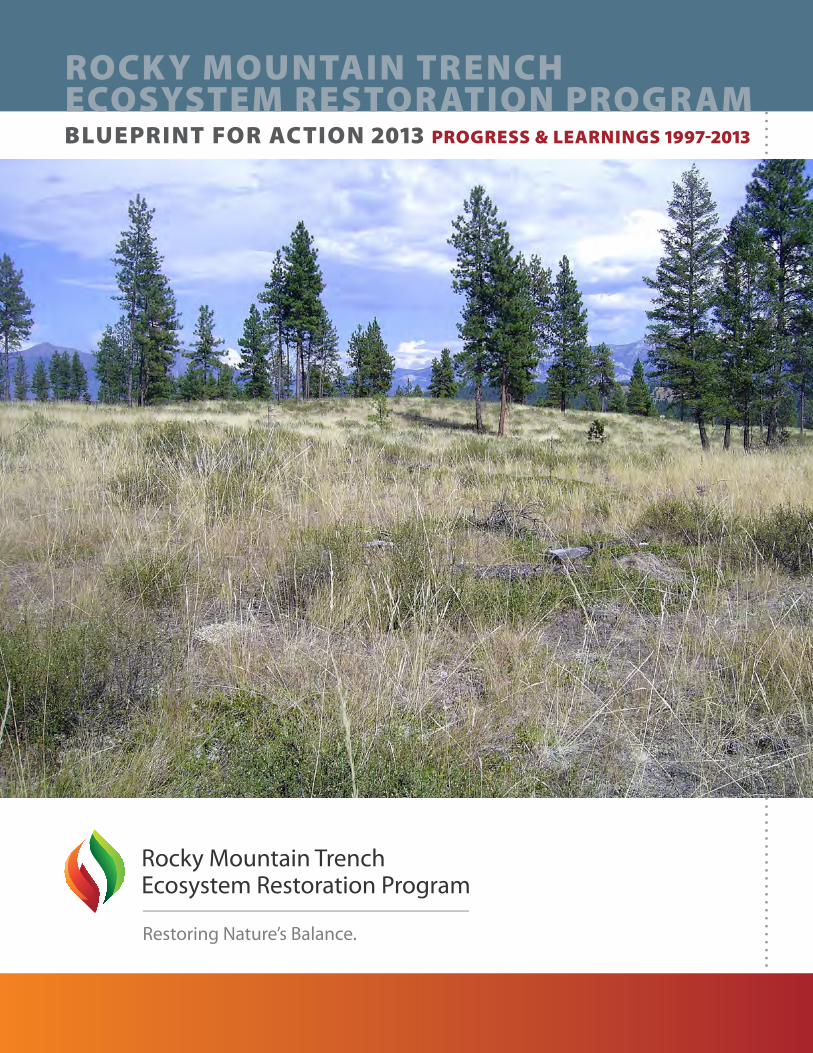
Front cover photo: PIPELINE PASTURE on Waldo North Range Unit after restoration logging. The site, on the northeast side of Koocanusa Reservoir, is grazed by domestic cattle, elk, mule deer and white-tailed deer. (Susan Bond photo)
Blueprint for Action 2013 « 1 »
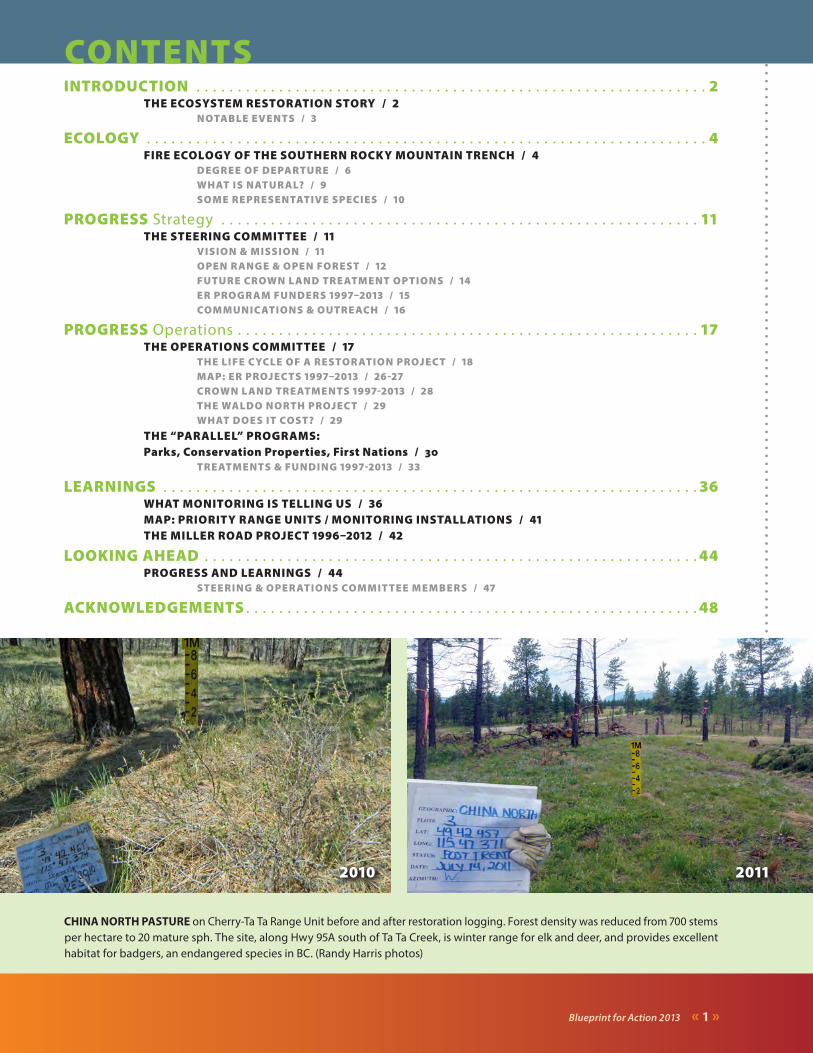
CHINA NORTH PASTURE on Cherry-Ta Ta Range Unit before and after restoration logging. Forest density was reduced from 700 stems per hectare to 20 mature sph. The site, along Hwy 95A south of Ta Ta Creek, is winter range for elk and deer, and provides excellent habitat for badgers, an endangered species in BC. (Randy Harris photos)
20112010
CONTENTSINTRODUCTION . . . . . . . . . . . . . . . . . . . . . . . . . . . . . . . . . . . . . . . . . . . . . . . . . . . . . . . . . . . . . . 2
THE ECOSYSTEM RESTORATION STORY / 2NOTABLE EVENTS / 3
ECOLOGY . . . . . . . . . . . . . . . . . . . . . . . . . . . . . . . . . . . . . . . . . . . . . . . . . . . . . . . . . . . . . . . . . . . . 4FIRE ECOLOGY OF THE SOUTHERN ROCKY MOUNTAIN TRENCH / 4
DEGREE OF DEPARTURE / 6WHAT IS NATUR AL? / 9SOME REPRESENTATIVE SPECIES / 10
PROGRESS Strategy . . . . . . . . . . . . . . . . . . . . . . . . . . . . . . . . . . . . . . . . . . . . . . . . . . . . . . . . . . 11THE STEERING COMMITTEE / 11
VISION & MISSION / 11OPEN R ANGE & OPEN FOREST / 12FUTURE CROWN LAND TREATMENT OPTIONS / 14ER PROGR AM FUNDERS 1997–2013 / 15COMMUNICATIONS & OUTREACH / 16
PROGRESS Operations . . . . . . . . . . . . . . . . . . . . . . . . . . . . . . . . . . . . . . . . . . . . . . . . . . . . . . . . 17THE OPERATIONS COMMITTEE / 17
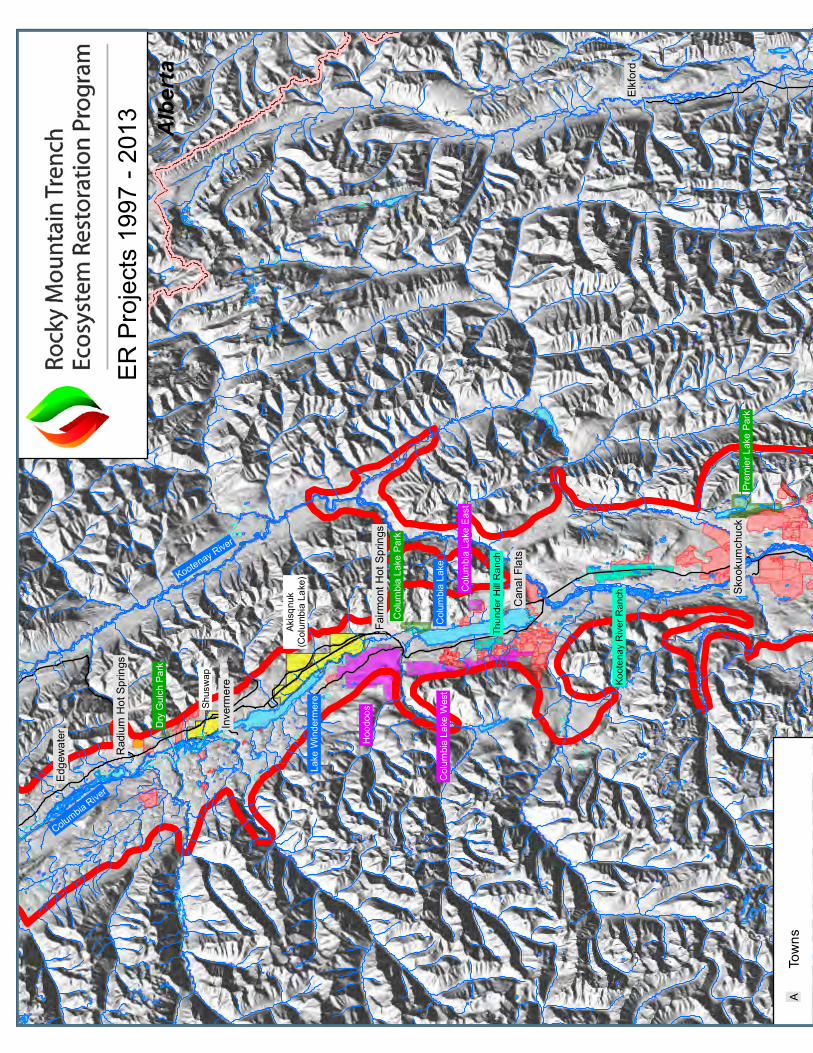
THE LIFE C YCLE OF A RESTOR ATION PROJECT / 18MAP: ER PROJECTS 1997–2013 / 26-27CROWN LAND TREATMENTS 1997-2013 / 28THE WALDO NORTH PROJECT / 29WHAT DOES IT COST? / 29
THE “PARALLEL” PROGRAMS: Parks, Conservation Properties, First Nations / 30
TREATMENTS & FUNDING 1997-2013 / 33
LEARNINGS . . . . . . . . . . . . . . . . . . . . . . . . . . . . . . . . . . . . . . . . . . . . . . . . . . . . . . . . . . . . . . . . . 36WHAT MONITORING IS TELLING US / 36MAP: PRIORITY RANGE UNITS / MONITORING INSTALLATIONS / 41THE MILLER ROAD PROJECT 1996–2012 / 42
LOOKING AHEAD . . . . . . . . . . . . . . . . . . . . . . . . . . . . . . . . . . . . . . . . . . . . . . . . . . . . . . . . . . . . 44PROGRESS AND LEARNINGS / 44
STEERING & OPER ATIONS COMMITTEE MEMBERS / 47
ACKNOWLEDGEMENTS . . . . . . . . . . . . . . . . . . . . . . . . . . . . . . . . . . . . . . . . . . . . . . . . . . . . . . . 48
« 2 » Blueprint for Action 2013
INTRODUCTIONTHE ECOSYSTEM RESTORATION STORY
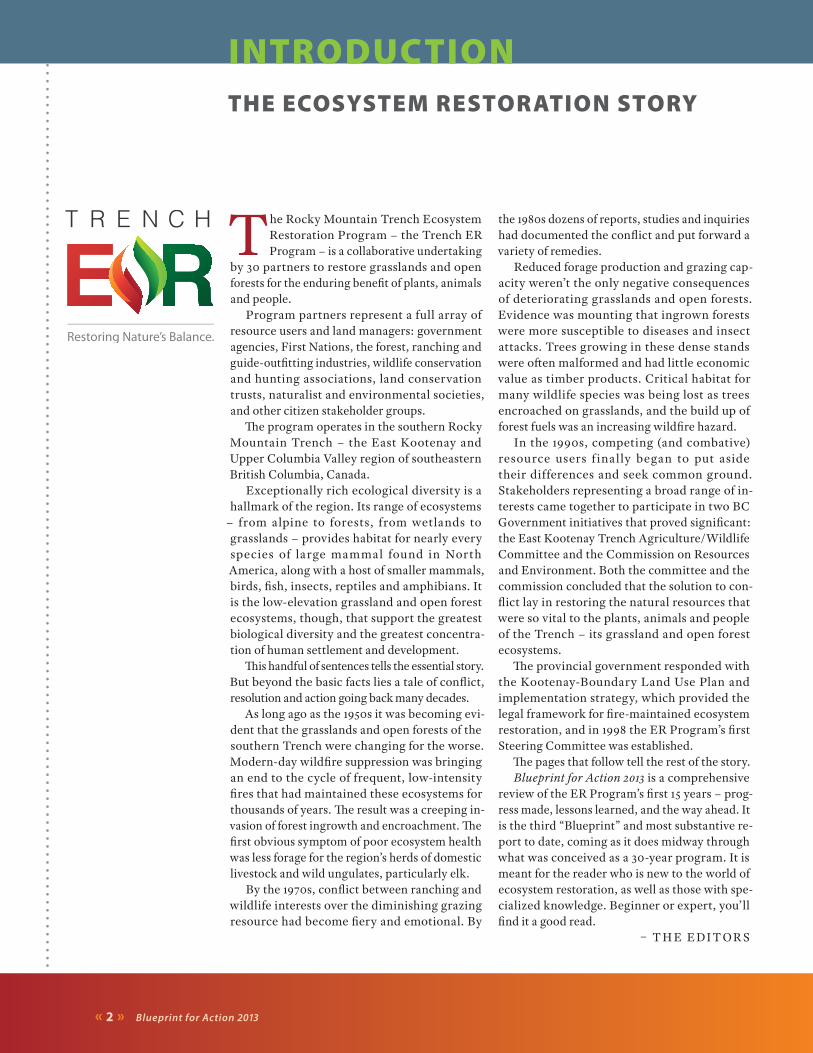
The Rocky Mountain Trench Ecosystem Restoration Program – the Trench ER Program – is a collaborative undertaking
by 30 partners to restore grasslands and open forests for the enduring benefit of plants, animals and people.
Program partners represent a full array of resource users and land managers: government agencies, First Nations, the forest, ranching and guide-outfitting industries, wildlife conservation and hunting associations, land conservation trusts, naturalist and environmental societies, and other citizen stakeholder groups.
The program operates in the southern Rocky Mountain Trench – the East Kootenay and Upper Columbia Valley region of southeastern British Columbia, Canada.
Exceptionally rich ecological diversity is a hallmark of the region. Its range of ecosystems
– from alpine to forests, from wetlands to grasslands – provides habitat for nearly every species of large mammal found in North America, along with a host of smaller mammals, birds, fish, insects, reptiles and amphibians. It is the low-elevation grassland and open forest ecosystems, though, that support the greatest biological diversity and the greatest concentra-tion of human settlement and development.
This handful of sentences tells the essential story. But beyond the basic facts lies a tale of conflict, resolution and action going back many decades.
As long ago as the 1950s it was becoming evi-dent that the grasslands and open forests of the southern Trench were changing for the worse. Modern-day wildfire suppression was bringing an end to the cycle of frequent, low-intensity fires that had maintained these ecosystems for thousands of years. The result was a creeping in-vasion of forest ingrowth and encroachment. The first obvious symptom of poor ecosystem health was less forage for the region’s herds of domestic livestock and wild ungulates, particularly elk.
By the 1970s, conflict between ranching and wildlife interests over the diminishing grazing resource had become fiery and emotional. By
the 1980s dozens of reports, studies and inquiries had documented the conflict and put forward a variety of remedies.
Reduced forage production and grazing cap-acity weren’t the only negative consequences of deteriorating grasslands and open forests. Evidence was mounting that ingrown forests were more susceptible to diseases and insect attacks. Trees growing in these dense stands were often malformed and had little economic value as timber products. Critical habitat for many wildlife species was being lost as trees encroached on grasslands, and the build up of forest fuels was an increasing wildfire hazard.
In the 1990s, competing (and combative) resource users f inally began to put aside their differences and seek common ground. Stakeholders representing a broad range of in-terests came together to participate in two BC Government initiatives that proved significant: the East Kootenay Trench Agriculture/Wildlife Committee and the Commission on Resources and Environment. Both the committee and the commission concluded that the solution to con-flict lay in restoring the natural resources that were so vital to the plants, animals and people of the Trench – its grassland and open forest ecosystems.
The provincial government responded with the Kootenay-Boundary Land Use Plan and implementation strategy, which provided the legal framework for fire-maintained ecosystem restoration, and in 1998 the ER Program’s first Steering Committee was established.
The pages that follow tell the rest of the story.Blueprint for Action 2013 is a comprehensive
review of the ER Program’s first 15 years – prog-ress made, lessons learned, and the way ahead. It is the third “Blueprint” and most substantive re-port to date, coming as it does midway through what was conceived as a 30-year program. It is meant for the reader who is new to the world of ecosystem restoration, as well as those with spe-cialized knowledge. Beginner or expert, you’ll find it a good read.
– T H E E DI T OR S
Blueprint for Action 2013 « 3 »
NOTABLE EVENTS
2006 BC Government announces a prov-ince-wide ecosystem restoration initiative modelled on the Trench ER Program.
Natural resource managers from the Government of Mongolia visit the Trench to learn about grassland/open forest restoration operations.
2007 Randy Harris starts work as the Rocky Mountain Natural Resource District’s first ER Team Leader, a new full-time position.
BC’s first non-renewable forest licences specifically for ecosystem restoration are awarded in the Trench.
2009 University of Mississippi graduate students arrive in the Trench for an intensive three-week internship in hands-on ecosystem restoration.
2011 University of British Columbia professors and graduate students present re cent research on Kootenay fire history and forest stand dynamics to ER Program partners.
ER partners host a record number of restoration field tours for pro-gram funders, college students, wildfire managers, conference delegates and the public.
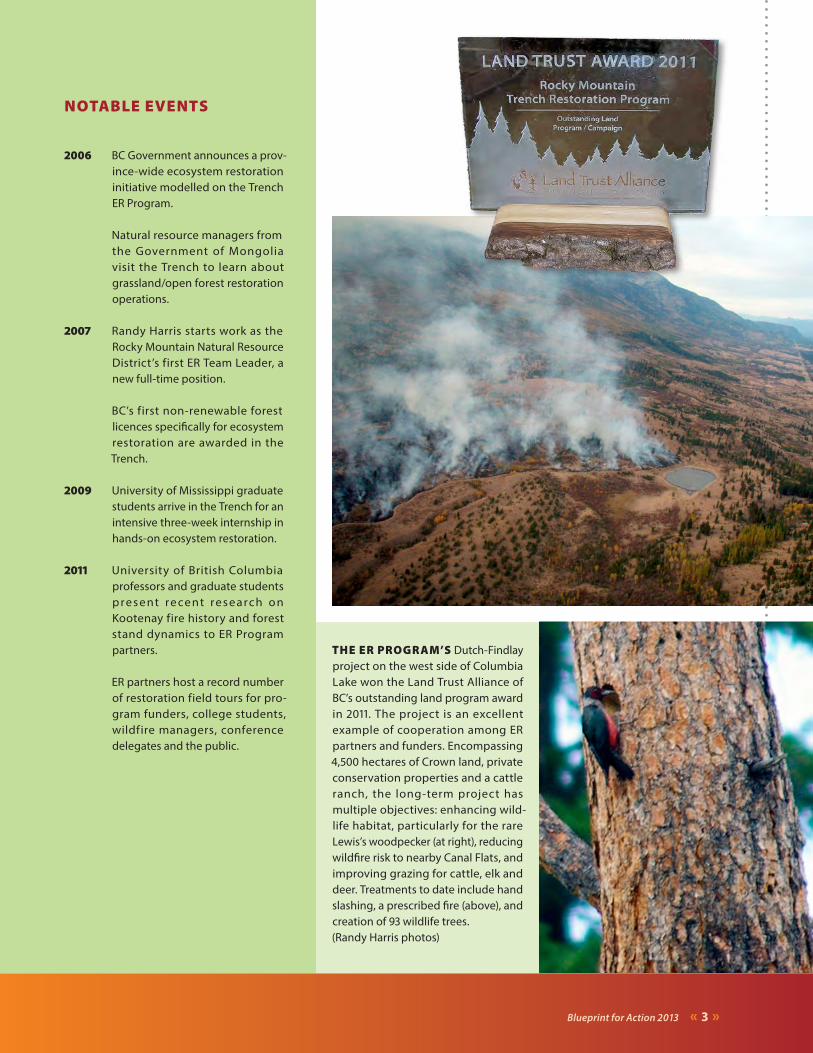
THE ER PROGRAM’S Dutch-Findlay project on the west side of Columbia Lake won the Land Trust Alliance of BC’s outstanding land program award in 2011. The project is an excellent example of cooperation among ER partners and funders. Encompassing 4,500 hectares of Crown land, private conservation properties and a cattle ranch, the long-term project has multiple objectives: enhancing wild-life habitat, particularly for the rare Lewis’s woodpecker (at right), reducing wildfire risk to nearby Canal Flats, and improving grazing for cattle, elk and deer. Treatments to date include hand slashing, a prescribed fire (above), and creation of 93 wildlife trees.(Randy Harris photos)
« 4 » Blueprint for Action 2013
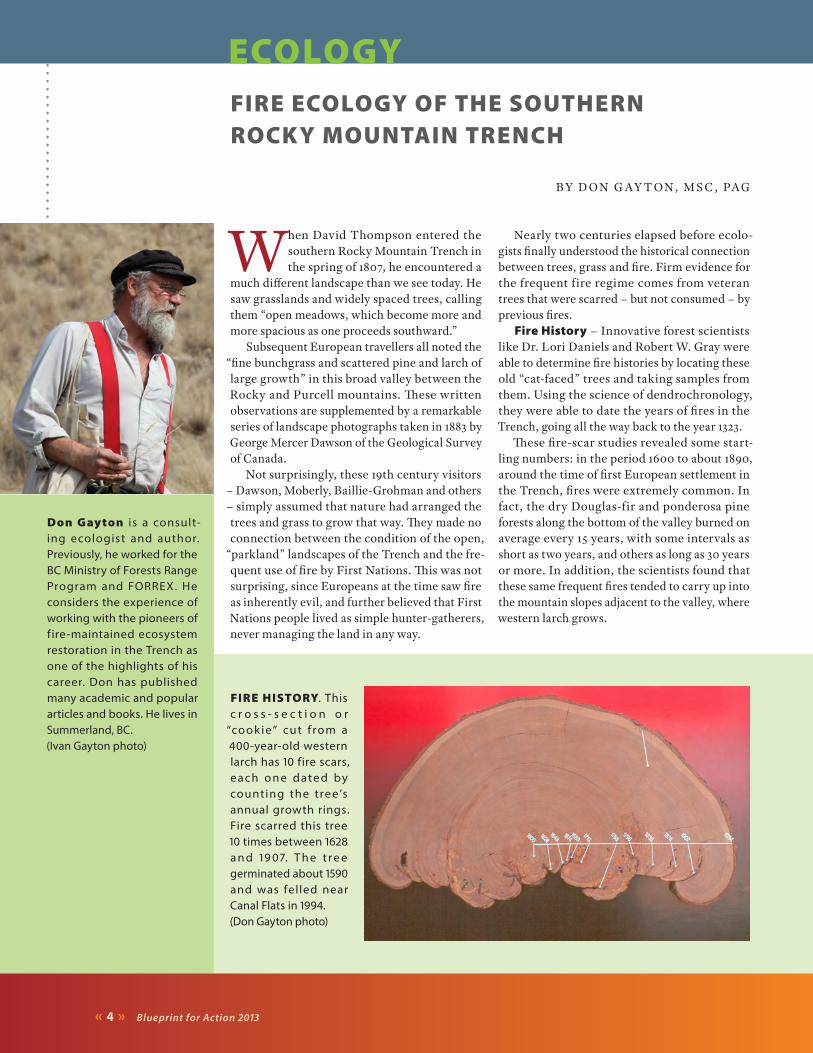
FIRE HISTORY. This c r o s s - s e c t i o n o r
“cook ie” cut f rom a 400-year-old western larch has 10 fire scars, each one date d by counting the tree’s annual growth rings. Fire scarred this tree 10 times between 1628 a n d 19 0 7. T h e t r e e germinated about 1590 and was felled near Canal Flats in 1994.(Don Gayton photo)
FIRE ECOLOGY OF THE SOUTHERN ROCKY MOUNTAIN TRENCH
BY D ON G AY T ON, M S C , PAG
When David Thompson entered the southern Rocky Mountain Trench in the spring of 1807, he encountered a
much different landscape than we see today. He saw grasslands and widely spaced trees, calling them “open meadows, which become more and more spacious as one proceeds southward.”
Subsequent European travellers all noted the “fine bunchgrass and scattered pine and larch of large growth” in this broad valley between the Rocky and Purcell mountains. These written observations are supplemented by a remarkable series of landscape photographs taken in 1883 by George Mercer Dawson of the Geological Survey of Canada.
Not surprisingly, these 19th century visitors – Dawson, Moberly, Baillie-Grohman and others – simply assumed that nature had arranged the trees and grass to grow that way. They made no connection between the condition of the open,
“parkland” landscapes of the Trench and the fre-quent use of fire by First Nations. This was not surprising, since Europeans at the time saw fire as inherently evil, and further believed that First Nations people lived as simple hunter-gatherers, never managing the land in any way.
Nearly two centuries elapsed before ecolo-gists finally understood the historical connection between trees, grass and fire. Firm evidence for the frequent fire regime comes from veteran trees that were scarred – but not consumed – by previous fires.
Fire History – Innovative forest scientists like Dr. Lori Daniels and Robert W. Gray were able to determine fire histories by locating these old “cat-faced” trees and taking samples from them. Using the science of dendrochronology, they were able to date the years of fires in the Trench, going all the way back to the year 1323.
These fire-scar studies revealed some start-ling numbers: in the period 1600 to about 1890, around the time of first European settlement in the Trench, fires were extremely common. In fact, the dry Douglas-fir and ponderosa pine forests along the bottom of the valley burned on average every 15 years, with some intervals as short as two years, and others as long as 30 years or more. In addition, the scientists found that these same frequent fires tended to carry up into the mountain slopes adjacent to the valley, where western larch grows.
ECOLOGY
Don Gayton is a consult-ing ecologist and author. Previously, he worked for the BC Ministry of Forests Range Program and FORREX. He considers the experience of working with the pioneers of fire-maintained ecosystem restoration in the Trench as one of the highlights of his career. Don has published many academic and popular articles and books. He lives in Summerland, BC.(Ivan Gayton photo)
Blueprint for Action 2013 « 5 »
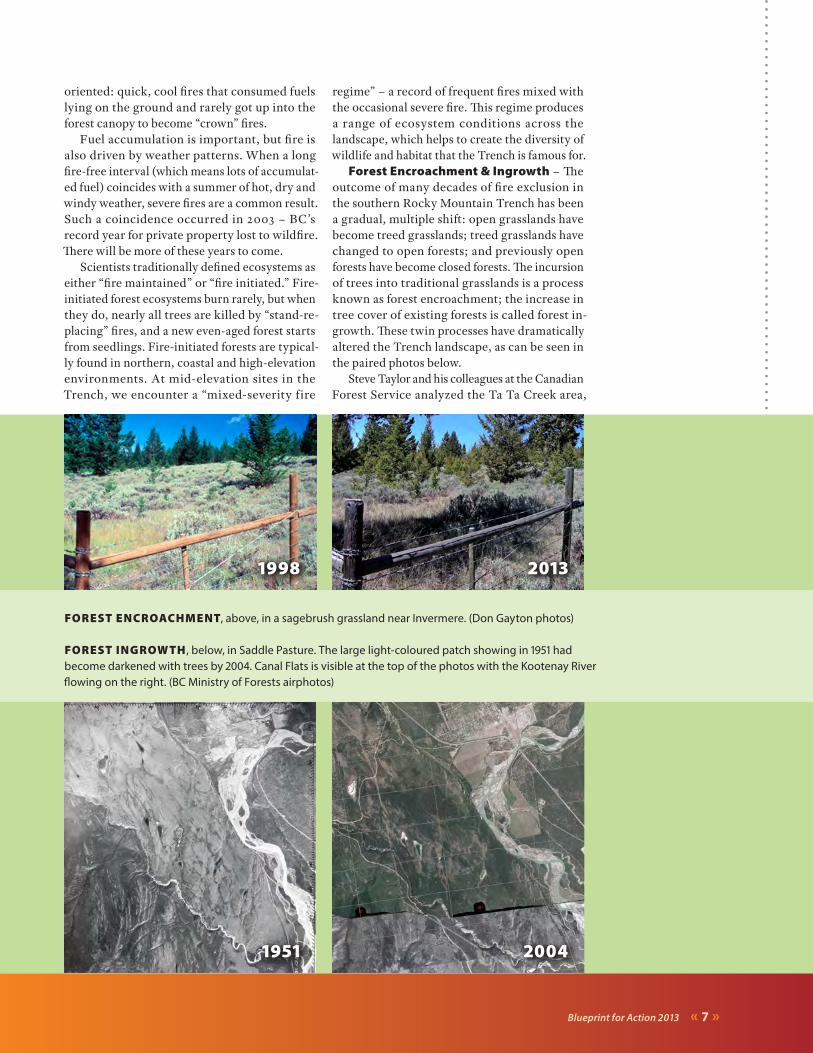
LANDSCAPE CHANGE OVER TIME . The northeastern end of Columbia Lake, headwaters of the Columbia River, by George Mercer Dawson, at left. (National Archives of Canada photo) In the re-take, note how the previously open areas on the middle-ground slopes have become forested and the marshes have advanced. (Randy Harris photo)
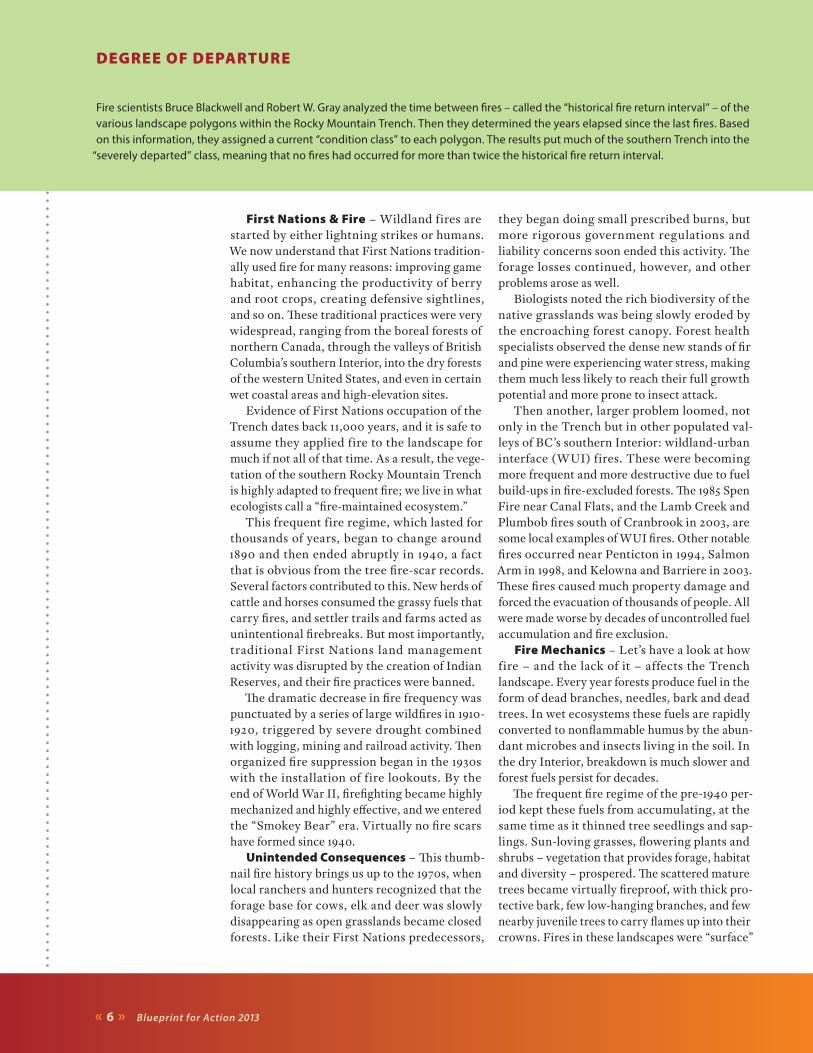
GR ASSLAND CHANGE OVER TIME . Grasslands on the western benches above Columbia Lake, at left, photographed by Herbert Wendell Gleason, who described his viewpoint as “overlooking Ellis and Stoddart ranch.” (Glenbow Archives photo #NC-53-116) A re-take 107 years later shows the grasslands overtaken by forest encroachment. The site is now The Nature Trust of British Columbia’s Hoodoo conservation property. (Rob Neil photo)
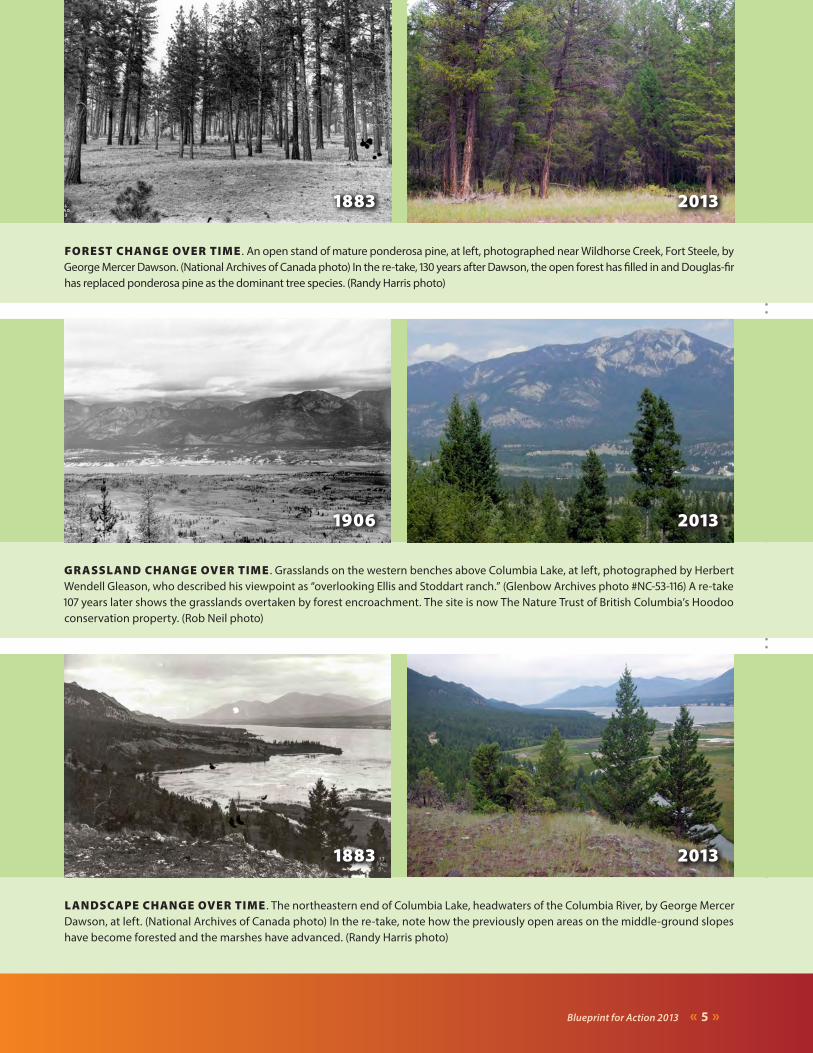
FOREST CHANGE OVER TIME . An open stand of mature ponderosa pine, at left, photographed near Wildhorse Creek, Fort Steele, by George Mercer Dawson. (National Archives of Canada photo) In the re-take, 130 years after Dawson, the open forest has filled in and Douglas-fir has replaced ponderosa pine as the dominant tree species. (Randy Harris photo)
1883
1906
1883
2013
2013
2013
« 6 » Blueprint for Action 2013
DEGREE OF DEPARTURE
Fire scientists Bruce Blackwell and Robert W. Gray analyzed the time between fires – called the “historical fire return interval” – of the various landscape polygons within the Rocky Mountain Trench. Then they determined the years elapsed since the last fires. Based on this information, they assigned a current “condition class” to each polygon. The results put much of the southern Trench into the
“severely departed” class, meaning that no fires had occurred for more than twice the historical fire return interval.
First Nations & Fire – Wildland fires are started by either lightning strikes or humans. We now understand that First Nations tradition-ally used fire for many reasons: improving game habitat, enhancing the productivity of berry and root crops, creating defensive sightlines, and so on. These traditional practices were very widespread, ranging from the boreal forests of northern Canada, through the valleys of British Columbia’s southern Interior, into the dry forests of the western United States, and even in certain wet coastal areas and high-elevation sites.
Evidence of First Nations occupation of the Trench dates back 11,000 years, and it is safe to assume they applied fire to the landscape for much if not all of that time. As a result, the vege-tation of the southern Rocky Mountain Trench is highly adapted to frequent fire; we live in what ecologists call a “fire-maintained ecosystem.”
This frequent fire regime, which lasted for thousands of years, began to change around 1890 and then ended abruptly in 1940, a fact that is obvious from the tree fire-scar records. Several factors contributed to this. New herds of cattle and horses consumed the grassy fuels that carry fires, and settler trails and farms acted as unintentional firebreaks. But most importantly, traditional First Nations land management activity was disrupted by the creation of Indian Reserves, and their fire practices were banned.
The dramatic decrease in fire frequency was punctuated by a series of large wildfires in 1910-1920, triggered by severe drought combined with logging, mining and railroad activity. Then organized fire suppression began in the 1930s with the installation of fire lookouts. By the end of World War II, firefighting became highly mechanized and highly effective, and we entered the “Smokey Bear” era. Virtually no fire scars have formed since 1940.
Unintended Consequences – This thumb-nail fire history brings us up to the 1970s, when local ranchers and hunters recognized that the forage base for cows, elk and deer was slowly disappearing as open grasslands became closed forests. Like their First Nations predecessors,
they began doing small prescribed burns, but more rigorous government regulations and liability concerns soon ended this activity. The forage losses continued, however, and other problems arose as well.
Biologists noted the rich biodiversity of the native grasslands was being slowly eroded by the encroaching forest canopy. Forest health specialists observed the dense new stands of fir and pine were experiencing water stress, making them much less likely to reach their full growth potential and more prone to insect attack.
Then another, larger problem loomed, not only in the Trench but in other populated val-leys of BC’s southern Interior: wildland-urban interface (WUI) fires. These were becoming more frequent and more destructive due to fuel build-ups in fire-excluded forests. The 1985 Spen Fire near Canal Flats, and the Lamb Creek and Plumbob fires south of Cranbrook in 2003, are some local examples of WUI fires. Other notable fires occurred near Penticton in 1994, Salmon Arm in 1998, and Kelowna and Barriere in 2003. These fires caused much property damage and forced the evacuation of thousands of people. All were made worse by decades of uncontrolled fuel accumulation and fire exclusion.
Fire Mechanics – Let’s have a look at how fire – and the lack of it – affects the Trench landscape. Every year forests produce fuel in the form of dead branches, needles, bark and dead trees. In wet ecosystems these fuels are rapidly converted to nonflammable humus by the abun-dant microbes and insects living in the soil. In the dry Interior, breakdown is much slower and forest fuels persist for decades.
The frequent fire regime of the pre-1940 per-iod kept these fuels from accumulating, at the same time as it thinned tree seedlings and sap-lings. Sun-loving grasses, flowering plants and shrubs – vegetation that provides forage, habitat and diversity – prospered. The scattered mature trees became virtually fireproof, with thick pro-tective bark, few low-hanging branches, and few nearby juvenile trees to carry flames up into their crowns. Fires in these landscapes were “surface”
Blueprint for Action 2013 « 7 »
FOREST ENCROACHMENT, above, in a sagebrush grassland near Invermere. (Don Gayton photos)
FOREST INGROWTH , below, in Saddle Pasture. The large light-coloured patch showing in 1951 had become darkened with trees by 2004. Canal Flats is visible at the top of the photos with the Kootenay River flowing on the right. (BC Ministry of Forests airphotos)
oriented: quick, cool fires that consumed fuels lying on the ground and rarely got up into the forest canopy to become “crown” fires.
Fuel accumulation is important, but fire is also driven by weather patterns. When a long fire-free interval (which means lots of accumulat-ed fuel) coincides with a summer of hot, dry and windy weather, severe fires are a common result. Such a coincidence occurred in 2003 – BC’s record year for private property lost to wildfire. There will be more of these years to come.
Scientists traditionally defined ecosystems as either “fire maintained” or “fire initiated.” Fire-initiated forest ecosystems burn rarely, but when they do, nearly all trees are killed by “stand-re-placing” fires, and a new even-aged forest starts from seedlings. Fire-initiated forests are typical-ly found in northern, coastal and high-elevation environments. At mid-elevation sites in the Trench, we encounter a “mixed-severity fire
regime” – a record of frequent fires mixed with the occasional severe fire. This regime produces a range of ecosystem conditions across the landscape, which helps to create the diversity of wildlife and habitat that the Trench is famous for.
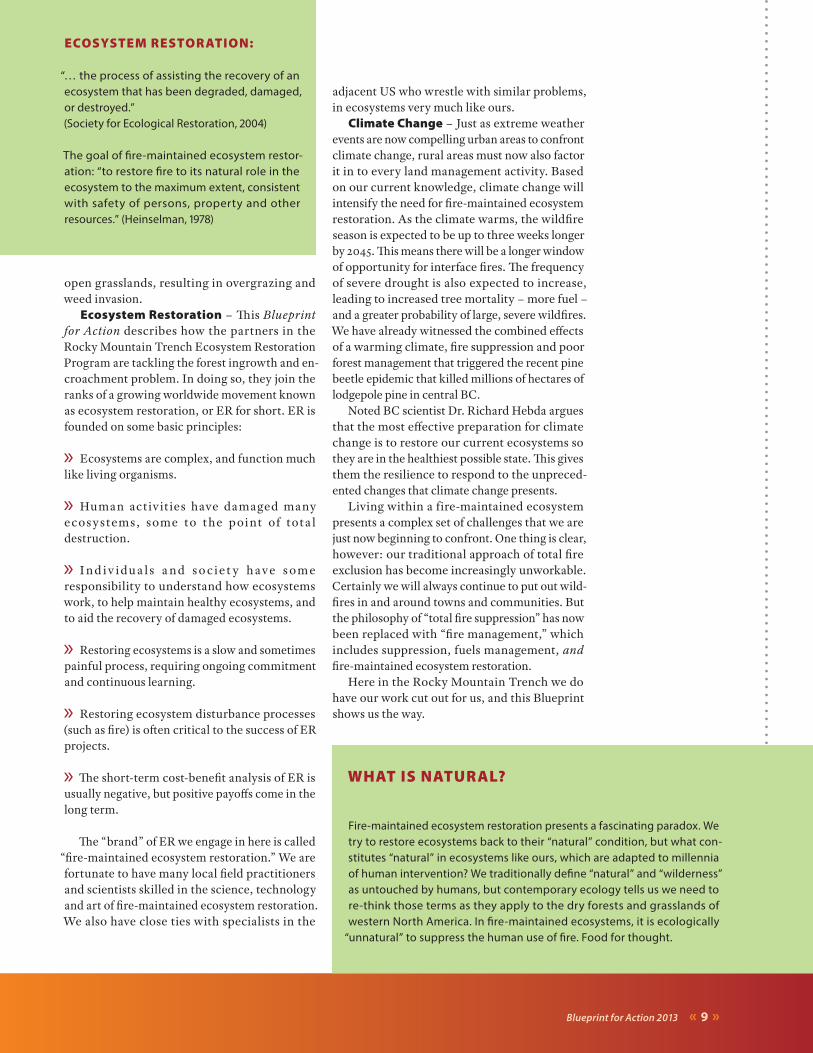
Forest Encroachment & Ingrowth – The outcome of many decades of fire exclusion in the southern Rocky Mountain Trench has been a gradual, multiple shift: open grasslands have become treed grasslands; treed grasslands have changed to open forests; and previously open forests have become closed forests. The incursion of trees into traditional grasslands is a process known as forest encroachment; the increase in tree cover of existing forests is called forest in-growth. These twin processes have dramatically altered the Trench landscape, as can be seen in the paired photos below.
Steve Taylor and his colleagues at the Canadian Forest Service analyzed the Ta Ta Creek area,
2013
2004
1998
1951
« 8 » Blueprint for Action 2013
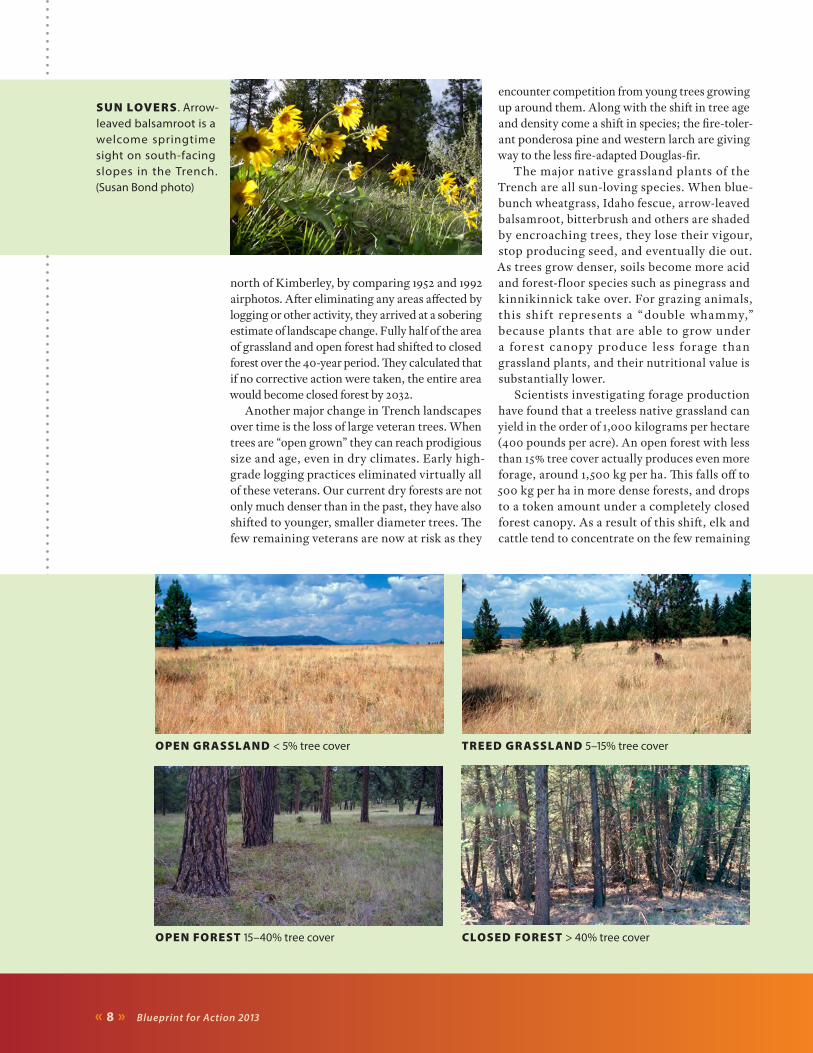
SUN LOVERS . Arrow-leaved balsamroot is a welcome springtime sight on south-facing slopes in the Trench. (Susan Bond photo)
north of Kimberley, by comparing 1952 and 1992 airphotos. After eliminating any areas affected by logging or other activity, they arrived at a sobering estimate of landscape change. Fully half of the area of grassland and open forest had shifted to closed forest over the 40-year period. They calculated that if no corrective action were taken, the entire area would become closed forest by 2032.
Another major change in Trench landscapes over time is the loss of large veteran trees. When trees are “open grown” they can reach prodigious size and age, even in dry climates. Early high-grade logging practices eliminated virtually all of these veterans. Our current dry forests are not only much denser than in the past, they have also shifted to younger, smaller diameter trees. The few remaining veterans are now at risk as they
encounter competition from young trees growing up around them. Along with the shift in tree age and density come a shift in species; the fire-toler-ant ponderosa pine and western larch are giving way to the less fire-adapted Douglas-fir.
The major native grassland plants of the Trench are all sun-loving species. When blue-bunch wheatgrass, Idaho fescue, arrow-leaved balsamroot, bitterbrush and others are shaded by encroaching trees, they lose their vigour, stop producing seed, and eventually die out. As trees grow denser, soils become more acid and forest-f loor species such as pinegrass and kinnikinnick take over. For grazing animals, this shif t represents a “double whammy,” because plants that are able to grow under a forest canopy produce less forage than grassland plants, and their nutritional value is substantially lower.
Scientists investigating forage production have found that a treeless native grassland can yield in the order of 1,000 kilograms per hectare (400 pounds per acre). An open forest with less than 15% tree cover actually produces even more forage, around 1,500 kg per ha. This falls off to 500 kg per ha in more dense forests, and drops to a token amount under a completely closed forest canopy. As a result of this shift, elk and cattle tend to concentrate on the few remaining
OPEN GR ASSLAND < 5% tree cover TREED GR ASSLAND 5–15% tree cover
OPEN FOREST 15–40% tree cover CLOSED FOREST > 40% tree cover
Blueprint for Action 2013 « 9 »
open grasslands, resulting in overgrazing and weed invasion.
Ecosystem Restoration – This Blueprint for Action describes how the partners in the Rocky Mountain Trench Ecosystem Restoration Program are tackling the forest ingrowth and en-croachment problem. In doing so, they join the ranks of a growing worldwide movement known as ecosystem restoration, or ER for short. ER is founded on some basic principles:
» Ecosystems are complex, and function much like living organisms.
» Human activit ies have damaged many ecos ystems, some to t he point of tota l destruction.
» I nd i v idu a l s a nd s o c ie t y h ave s ome responsibility to understand how ecosystems work, to help maintain healthy ecosystems, and to aid the recovery of damaged ecosystems.
» Restoring ecosystems is a slow and sometimes painful process, requiring ongoing commitment and continuous learning.
» Restoring ecosystem disturbance processes (such as fire) is often critical to the success of ER projects.
» The short-term cost-benefit analysis of ER is usually negative, but positive payoffs come in the long term.
The “brand” of ER we engage in here is called “fire-maintained ecosystem restoration.” We are fortunate to have many local field practitioners and scientists skilled in the science, technology and art of fire-maintained ecosystem restoration. We also have close ties with specialists in the
adjacent US who wrestle with similar problems, in ecosystems very much like ours.
Climate Change – Just as extreme weather events are now compelling urban areas to confront climate change, rural areas must now also factor it in to every land management activity. Based on our current knowledge, climate change will intensify the need for fire-maintained ecosystem restoration. As the climate warms, the wildfire season is expected to be up to three weeks longer by 2045. This means there will be a longer window of opportunity for interface fires. The frequency of severe drought is also expected to increase, leading to increased tree mortality – more fuel – and a greater probability of large, severe wildfires. We have already witnessed the combined effects of a warming climate, fire suppression and poor forest management that triggered the recent pine beetle epidemic that killed millions of hectares of lodgepole pine in central BC.
Noted BC scientist Dr. Richard Hebda argues that the most effective preparation for climate change is to restore our current ecosystems so they are in the healthiest possible state. This gives them the resilience to respond to the unpreced-ented changes that climate change presents.
Living within a fire-maintained ecosystem presents a complex set of challenges that we are just now beginning to confront. One thing is clear, however: our traditional approach of total fire exclusion has become increasingly unworkable. Certainly we will always continue to put out wild-fires in and around towns and communities. But the philosophy of “total fire suppression” has now been replaced with “fire management,” which includes suppression, fuels management, and fire-maintained ecosystem restoration.
Here in the Rocky Mountain Trench we do have our work cut out for us, and this Blueprint shows us the way.
ECOSYSTEM RESTORATION:
“… the process of assisting the recovery of an ecosystem that has been degraded, damaged, or destroyed.”(Society for Ecological Restoration, 2004)
The goal of fire-maintained ecosystem restor-ation: “to restore fire to its natural role in the ecosystem to the maximum extent, consistent with safety of persons, property and other resources.” (Heinselman, 1978)
WHAT IS NATURAL?
Fire-maintained ecosystem restoration presents a fascinating paradox. We try to restore ecosystems back to their “natural” condition, but what con-stitutes “natural” in ecosystems like ours, which are adapted to millennia of human intervention? We traditionally define “natural” and “wilderness” as untouched by humans, but contemporary ecology tells us we need to re-think those terms as they apply to the dry forests and grasslands of western North America. In fire-maintained ecosystems, it is ecologically
“unnatural” to suppress the human use of fire. Food for thought.

« 10 » Blueprint for Action 2013
PRAIRIE CROCUS and blades of rough fescue emerge together in early spring on a grassland near Ta Ta Creek. (Susan Bond photo)
PL ANTS
Arrow-leaved balsamroot Balsamorrhiza sagittata
Bitterbrush (antelope-bush) Purshia tridentata
Bluebunch wheatgrass Pseudoroegneria spicata
Idaho fescue Festuca idahoensis
Kinnikinnick (bearberry) Arctostaphylos uva-ursi
Narrow-leaved desert parsley Lomatium triternatum
Needle-and-thread grass Hesperostipa comata
Pinegrass Calamagrostis rubescens
Prairie crocus Anemone patens
Prickly rose Rosa acicularis
Richardson’s (spreading)
needlegrass
Stipa richardsonii
Rough fescue Festuca campestris
Saskatoon Amelanchier alnifolia
Scarlet gaura* Gaura coccinea
Small-flowered penstemon Penstemon procerus
Wild licorice* Glycyrrhiza lepidota
MAMMALS
American badger* Taxidea taxus jeffersonii
Cattle Bos primigenius
Columbian ground squirrel Spermophilus columbianus
Mule deer Odocoileus hemionus
Rocky Mountain bighorn
sheep*
Ovis canadensis
Rocky Mountain elk Cervus elaphus
White-tailed deer Odocoileus virginianus
SELECTED HISTORICAL REFERENCES
» Baillie-Grohman, William. 1900. Fifteen Years’ Sport and Life in the Hunting Grounds of Western America. London: Horace Cox.
» Champlain Society, Toronto. 1916. David Thompson’s narrative of his explorations in western America, 1784-1812. Retrieved August 28, 2013, from: http://archive.org/stream/davidthompsonsna00thom/davidthompsonsna00thom_djvu.txt
» Cole, Douglas & Bradley Lockner, eds. 1989. The Journals of George M. Dawson: Volume 1, 1875-1876; Volume 2, 1877-1878. Vancouver: UBC Press.
» Moberley, Walter. 1866. Reports of Explorations, 1864-1865, to Government of British Columbia: Upper Columbia River.
» Mrs. Algernon St. Maur. 1890. Impressions of a tenderfoot during a journey in search of sport in the far west. London: J. Murray. Retrieved August 28, 2013, from: http://eco.canadiana.ca/view/oocihm.16174/3?r=0&s=1
SOME REPRESENTATIVE SPECIESof Grasslands & Open Forests in the Southern Rocky Mountain Trench
BIRDS
American kestrel Falco sparverius
Columbian sharp-tailed
grouse**
Tympanuchus phasianellus
columbianus
Lewis’s woodpecker* Melanerpes lewis
Long-billed curlew* Numenius americanus
Mountain bluebird Sialia currucoides
Western bluebird Sialia
Western meadowlark Sturnella neglecta
Vesper sparrow Pooecetes gramineus
AMPHIBIANS & REPTILES
(may occur if there are adequate waterbodies)
Columbia spotted frog Rana luteiventris
Western painted turtle* Chrysemys picta bellii
Western toad* Anaxyrus boreas
INSEC TS
(all of the following are butterflies)
Alexandra’s Sulphur Colias alexandra
Persius Duskywing Erynnis persius
Melissa Blue* Lycaeides melissa
Aphrodite Fritilliary Speyeria aphrodite
Common Alpine Erebia epipsodea
Common Ringlet Coenonympha california
*Indicates a rare or at-risk species
**Species extirpated in the East Kootenay
Blueprint for Action 2013 « 11 »
THE STEERING COMMITTEE
The Steering Committee was established by the BC Government in 1998 to plan and deliver a fire-maintained ecosystem
restoration program on designated Crown land in what is now called the Rocky Mountain Natural Resource District.
In the intervening 15 years, the committee’s strategic planning, fund-raising and operation-al activities have evolved into today’s Rocky Mountain Trench Ecosystem Restoration Program.
The founding Steering Committee was con-ceived as a multi-sectoral group representing provincial natural resource agencies, the ranch-ing and forest industries, program funders and a broad range of citizen stakeholder organizations. That governing concept has been maintained and expanded over the years to include rep-resentation by BC Parks, East Kootenay Wildlife Association/BC Wildlife Federation, First Nations, Parks Canada, and Rocky Mountain District’s Range Advisory Committee.
A Changing Strategy – Strategic planning is a fundamental responsibility of the Steering Committee. The committee’s first strategic plan, published in 2000 as A Blueprint for Action, set a
goal of restoring 135,000 hectares to open range or open forest condition by 2030, and main-taining those conditions in perpetuity. Roughly 40% of the total would be restored to open range, 60% to open forest.
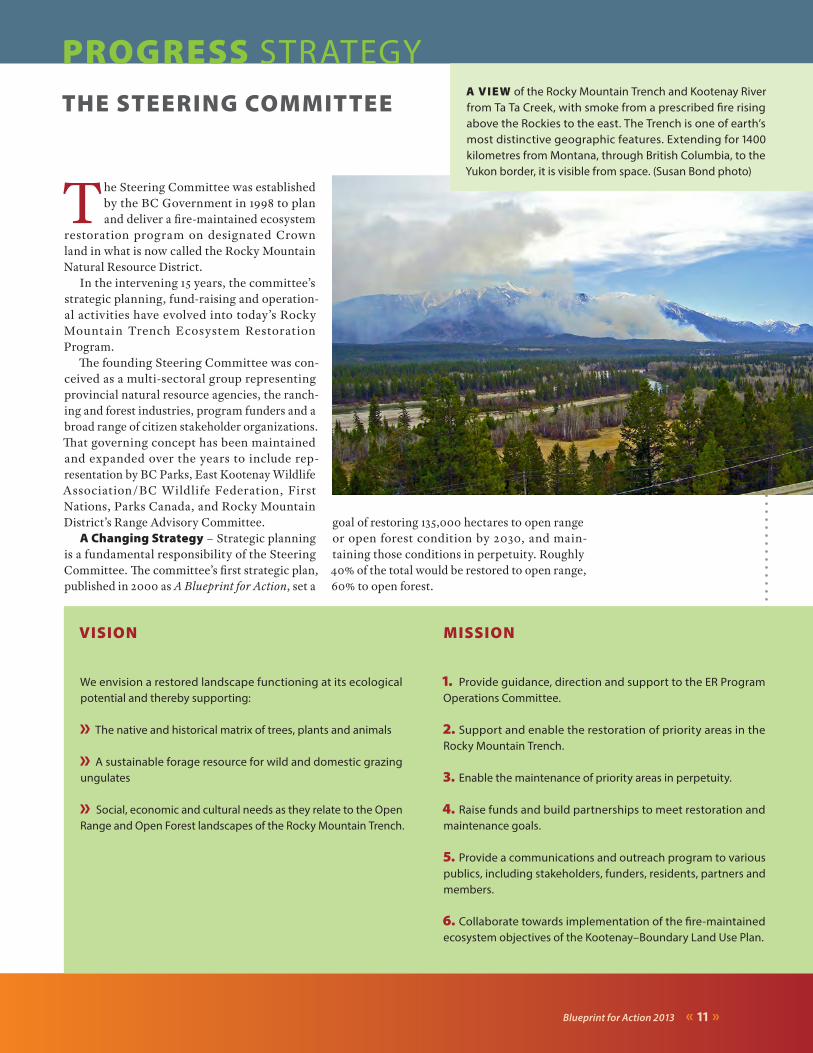
PROGRESS STRATEGYA VIEW of the Rocky Mountain Trench and Kootenay River from Ta Ta Creek, with smoke from a prescribed fire rising above the Rockies to the east. The Trench is one of earth’s most distinctive geographic features. Extending for 1400 kilometres from Montana, through British Columbia, to the Yukon border, it is visible from space. (Susan Bond photo)
VISION
We envision a restored landscape functioning at its ecological potential and thereby supporting:
» The native and historical matrix of trees, plants and animals
» A sustainable forage resource for wild and domestic grazing ungulates
» Social, economic and cultural needs as they relate to the Open Range and Open Forest landscapes of the Rocky Mountain Trench.
MISSION
1. Provide guidance, direction and support to the ER Program Operations Committee.
2. Support and enable the restoration of priority areas in the Rocky Mountain Trench.
3. Enable the maintenance of priority areas in perpetuity.
4. Raise funds and build partnerships to meet restoration and maintenance goals.
5. Provide a communications and outreach program to various publics, including stakeholders, funders, residents, partners and members.
6. Collaborate towards implementation of the fire-maintained ecosystem objectives of the Kootenay–Boundary Land Use Plan.
VISION & MISSION
« 12 » Blueprint for Action 2013
The goal was based on two factors:1. an estimated 114,000 hectares of grassland and open forest converted to closed forest since 1952, and2. an ongoing conversion rate estimated at 3,000 hectares per year.
Annual operating targets for commercial harvesting, slashing and prescribed burning were established to return the 114,000 hectares to their historic condition and halt ongoing conversion.
Six years after formulat-ing this plan, the Steering Committee published Blueprint for Action 2006 to review strat-egy and report on progress.
The original strategy was maintained. Operationally, annual targets for harvesting and slashing had been achieved or exceeded in most years. Prescribed burning targets, however, were falling short by substantial margins and have continued to do so.
As a result, the Steering Committee began taking a hard look at its strategy and is now in the process of making significant changes.
The New Plan – The 2000 strategy was clear, quantifiable and time limited, but the committee has concluded that its scope and timeframe must be revised. The difficulty of meeting prescribed burning targets is largely responsible for changes in strategic direction.
The ER Program’s current operating area is about 109,000 hectares. For planning purposes, it has been divided into “logical burn units” of 350 hectares each. Maintaining the total operat-ing area in open range or open forest condition would require a prescribed fire on each burn unit at least once every 20 years. Such a main-tenance schedule would require 16 prescribed fires every year.
However, operational experience shows that fewer than 4 prescribed fires, on average, are actually completed each year. Smoke control regulations, stringent burn-impact guidelines and current weather patterns are the constrain-ing factors. Available burn windows are so limited, in fact, that using prescribed fire to maintain the entire operating area is no longer considered workable.
Consequently, the Steering Committee is examining alternatives, including reducing the total area under active restoration management.
Under this option, the full range of restoration treatments – including periodic maintenance burns – would be concentrated on the most productive sites, those with the potential to produce the best ecological outcomes. Existing open forest stands with good bunchgrass growth are the obvious choice. Twenty-seven priority range units have been identif ied (page 41) but more work is needed to determine specific high-priority sites within each range unit.
On sites not designated as high priority, de-sired stand density could be achieved through a mix of hand slashing, machine mastication and commercial harvesting.
Fire-maintained Ecosystem Restoration in BC’s Rocky Mountain Trench
Blueprint for actionRocky Mountain Trench
Ecosystem Restoration Steering Committee
pr inciples, str at eGy, proGr ess
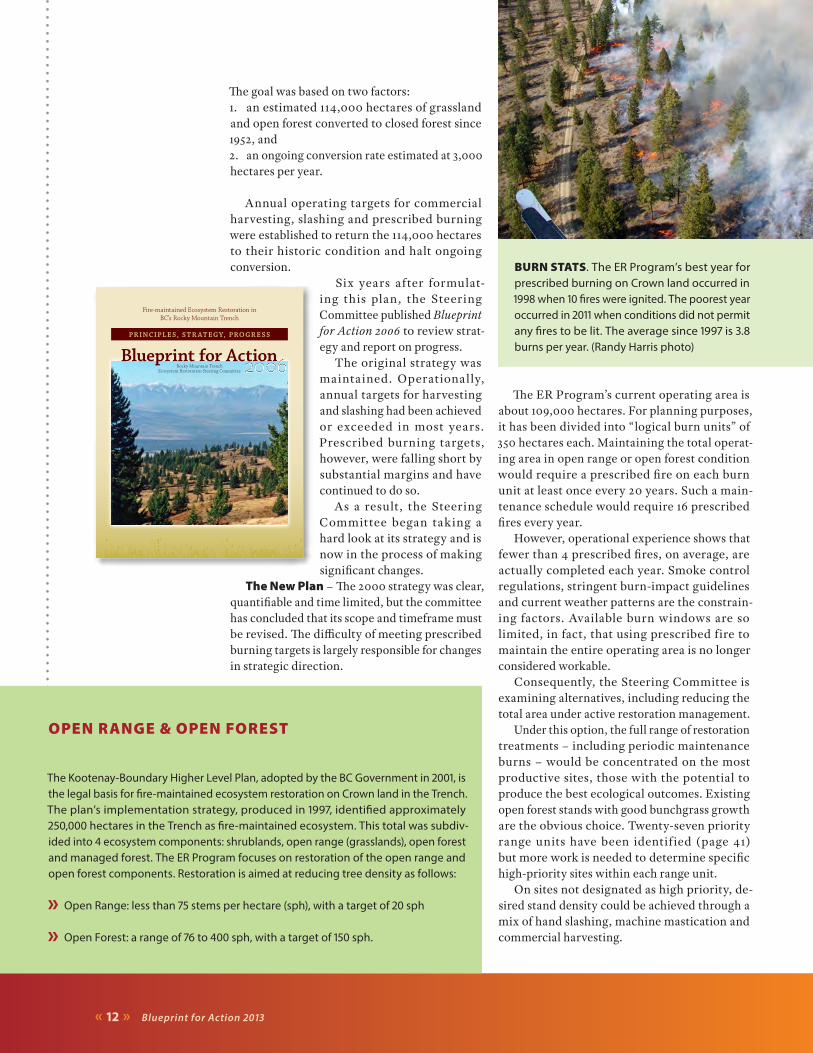
BURN STATS. The ER Program’s best year for prescribed burning on Crown land occurred in 1998 when 10 fires were ignited. The poorest year occurred in 2011 when conditions did not permit any fires to be lit. The average since 1997 is 3.8 burns per year. (Randy Harris photo)
OPEN RANGE & OPEN FOREST
The Kootenay-Boundary Higher Level Plan, adopted by the BC Government in 2001, is the legal basis for fire-maintained ecosystem restoration on Crown land in the Trench. The plan’s implementation strategy, produced in 1997, identified approximately 250,000 hectares in the Trench as fire-maintained ecosystem. This total was subdiv-ided into 4 ecosystem components: shrublands, open range (grasslands), open forest and managed forest. The ER Program focuses on restoration of the open range and open forest components. Restoration is aimed at reducing tree density as follows:
» Open Range: less than 75 stems per hectare (sph), with a target of 20 sph
» Open Forest: a range of 76 to 400 sph, with a target of 150 sph.
Blueprint for Action 2013 « 13 »
Another emerging option, although still at a very early stage, is development of a local bioenergy industry that would utilize marginal wood as feedstock for small-scale heating sys-tems. Low-priority sites could be managed for short-rotation bioenergy production, and this potential market could contribute to program goals by providing an economic incentive to thin ingrown forest stands.
The Steering Committee is taking a cautious approach in revising its restoration strategy and adopting new operational targets. Operational ef-fectiveness while maintaining desired ecological outcomes is key. Criteria and limiting factors for
various treatment options have been developed to aid in setting future targets (page 14).
Wildlife Corridors – Another develop-ment in the committee’s evolving strategic plan involves opening the forest canopy along mid-elevation mountain drainages to provide migration corridors for wild ungulates.
Denser forests in the up-slope side drainages – again, the result of fire exclusion over the past 75 years – provide poor migration routes for wild ungulates. Linking low-elevation winter ranges to spring and summer habitats through restora-tion is expected to facilitate migratory behaviour of elk – and reduce agriculture conf licts and grazing pressure on Trench habitats.
Non-migratory “homesteader” elk that graze year-round in the valley bottom have been a
source of conflict for many decades. As forage on Crown range dwindled, cattle and wild ungulates competed for grazing in ever-diminishing areas, and domestic hayfields provided an accessible and palatable alternative for elk and deer. Restoring the productivity, sustainability and carrying capacity of Crown range was a crucial factor in establishing the ER Program in 1998.
Nevertheless, by 2001 ranchers were install-ing wildlife fencing to keep elk and deer off their hayfields, and by 2010 the Kootenay Elk Management Plan was calling for a 20-40% reduction in elk populations at the south end of the Trench, from Canal Flats to the US border.
The provincial government responded by ex-panding hunting seasons to include open seasons on elk cows and calves in a newly created low-ele-vation management zone in the south Trench. Elk populations were reduced by 35% – from an estimated 12,000 animals in 2008 to about 7,500 today – and antlerless elk open seasons were cancelled in 2013 to avoid further reductions.
Yet, despite the significant decrease in elk numbers, crop damage on private land has persisted. Ironically, more abundant and earlier forage on restored rangeland may be contributing to the continuing presence of homesteader elk.
Thus, a new restoration priority is to open up transitional corridors to higher-elevation summer range. These migration routes will also benefit mule deer and bighorn sheep populations which are at risk due to habitat loss.
The Steering Committee anticipates that grazing pressure on Crown range will be reduced, benefiting domestic livestock, wild un-gulates and other grassland-dependent species.
AN O PE N FO R E ST site on Premier Ridge immediately after machine mastication in 2012. Premier Ridge, adjacent to Premier Lake Provincial Park, is a valuable winter range for elk, deer and bighorn sheep. (Randy Harris photo)
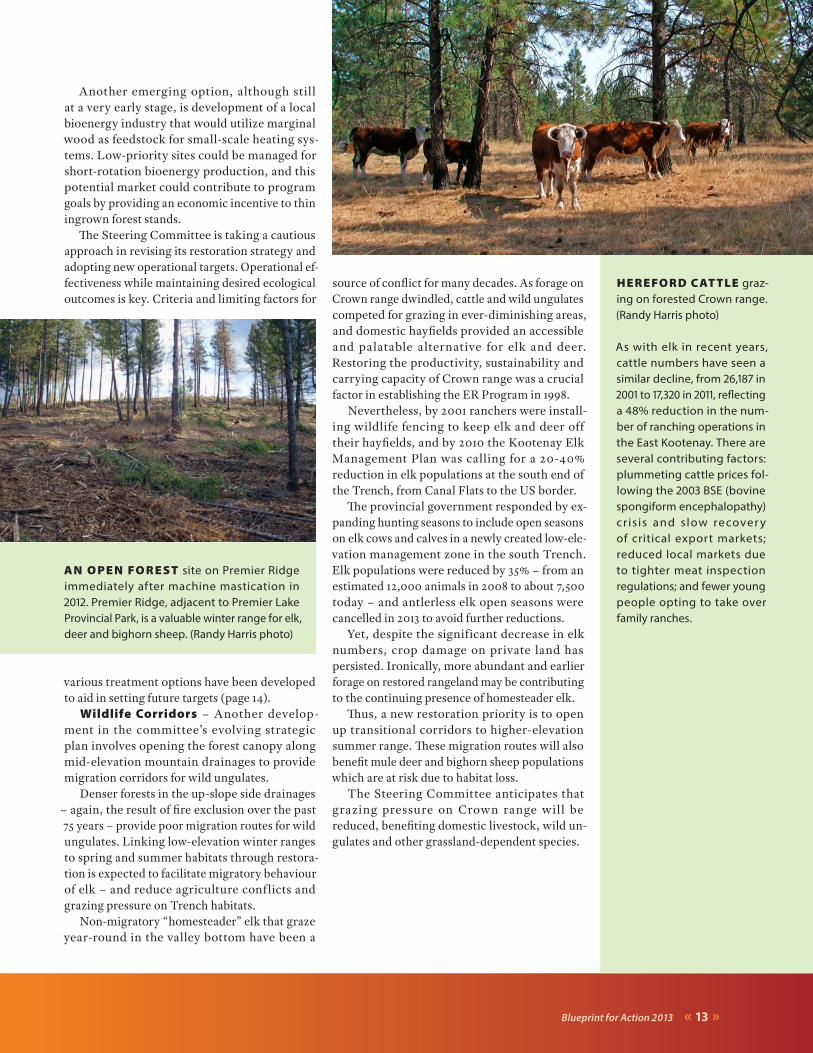
HEREFORD CAT TLE graz-ing on forested Crown range. (Randy Harris photo)
As with elk in recent years, cattle numbers have seen a similar decline, from 26,187 in 2001 to 17,320 in 2011, reflecting a 48% reduction in the num-ber of ranching operations in the East Kootenay. There are several contributing factors: plummeting cattle prices fol-lowing the 2003 BSE (bovine spongiform encephalopathy) cr isis and slow recover y of critical export markets; reduced local markets due to tighter meat inspection regulations; and fewer young people opting to take over family ranches.
« 14 » Blueprint for Action 2013
FUTURE CROWN LAND TREATMENT OPTIONS
Treatment Criteria Limiting Factors
Actual Averages1997-2013
Proposed Future
Treatment Options
Estimated Annual ER
Program Costs
Logging Requires sawlog volume >90m3/ha.
Forest Licence to Cut limited to <5000m3. District’s current allowable annual cut for restoration = 20,000m3/yr. Limited by markets, acceptability of Douglas-fir as pulpwood, ponderosa pine as sawlog.
696 ha/yr 500 ha/yr no direct cost
Slashing/Spacing
Requires stand density <5000 stems/ha, <10cm diameter/stem.
High costs of $1200-$1900/ha. Logistics of burning piles, meeting venting regulations. Larger, denser stands not cost effective. No felling of trees >15cm diameter.
1008 ha/yr 1500 ha/yr $1,125,000
Mastication Stands of any density, any stem size. Use on non-merchantable stands with <75m3/ha sawlog volume.
Front-mounted masticators have issues on stony ground. Debris left on ground has possible effects on high-intensity fires or soil chemistry.
174 ha/yr 750 ha/yr $1,275,000
Prescribed Burning
Site must have defendable secure boundaries, adequate fuel to gen-erate sufficient heat to reduce stocking.
Only 2-3 burn windows per year. High costs of logistics.
921 ha/yr 2100 ha/yr(6 burns
@ 350 ha)
$90,000
Bioenergy Harvest
Stems 10-25cm diameter, stands with little or no bunchgrass on site.
No local bioenergy market as yet. Factors unknown for identifying marketable stands.
– 500 ha/yr Unknown.Ideally, no direct
cost.
TOTALS 2,798 ha/yr 5,350 ha/yr $2,490,000
TARGET OPTION: Treat entire operating area once every 20 yrs = 5,350 ha/yrTARGET OPTION: Treat 50% of operating area once every 20 yrs = 2,675 ha/yr
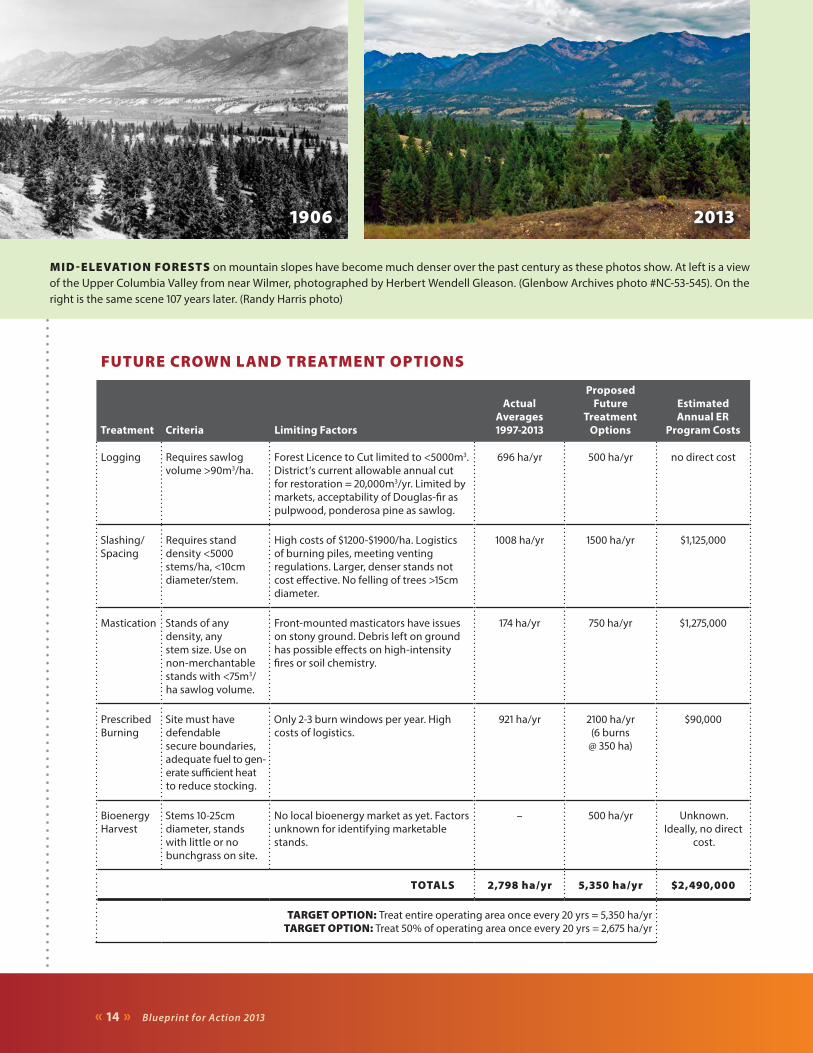
MID - ELEVATION FORESTS on mountain slopes have become much denser over the past century as these photos show. At left is a view of the Upper Columbia Valley from near Wilmer, photographed by Herbert Wendell Gleason. (Glenbow Archives photo #NC-53-545). On the right is the same scene 107 years later. (Randy Harris photo)
1906 2013
Blueprint for Action 2013 « 15 »
ER PROGRAM FUNDERS 1997–2013
The following funding sources have supported ER Program activities on Crown land. Their contributions have paid for on-the-ground restoration and fuel management treatments, scientific research and monitoring, mapping, database development, public outreach and communications. We acknowledge their support with sincere thanks.
Funding Source Total Contribution
Job Opportunities Program $3,460,288
First Nations Emergency Services Society 1,626,767
Land Based Investment Account 1,521,358
Fish and Wildlife Compensation Program – Columbia Region 1,542,137
Community Adjustment Fund 1,221,813
Forest Investment Account 1,085,889
Habitat Conservation Trust Foundation 809,685
Forest Renewal BC 433,490
Grazing Enhancement Fund 422,567
Steering Committee Fund – supplemented by FLNRO 408,052
Columbia Basin Trust (CBT) Environmental Initiatives Program
299,524
Community Gaming Grant 266,000
Rocky Mountain Elk Foundation 231,295
Union of BC Municipalities 203,135
BC Wildfire Management Branch 184,518
BC Ministry of Forests, Lands and Natural Resource Operations (FLNRO)
120,291
Kootenay Livestock Association (KLA) – Ministry of Forests grant
75,564
BC Ministry of Agriculture 49,058
BC Ministry of Environment 49,027
BC Cabinet Land Use Committee 46,300
CBT Grassland & Rangeland Enhancement Program – KLA 40,900
Enhanced Forest Management Program 31,437
Fraser Basin Council BC CLEAR Fund 22,500
Village of Canal Flats 20,000
Premier’s Sheep Fund 19,370
BC Ministry of Transportation and Highways 16,177
Agriculture Environment & Wildlife Fund 16,000
BC Wildlife Federation 16,000
Human Resources Canada 10,033
Small Business Forest Enterprise Program 9,138
TOTAL $14,258,313
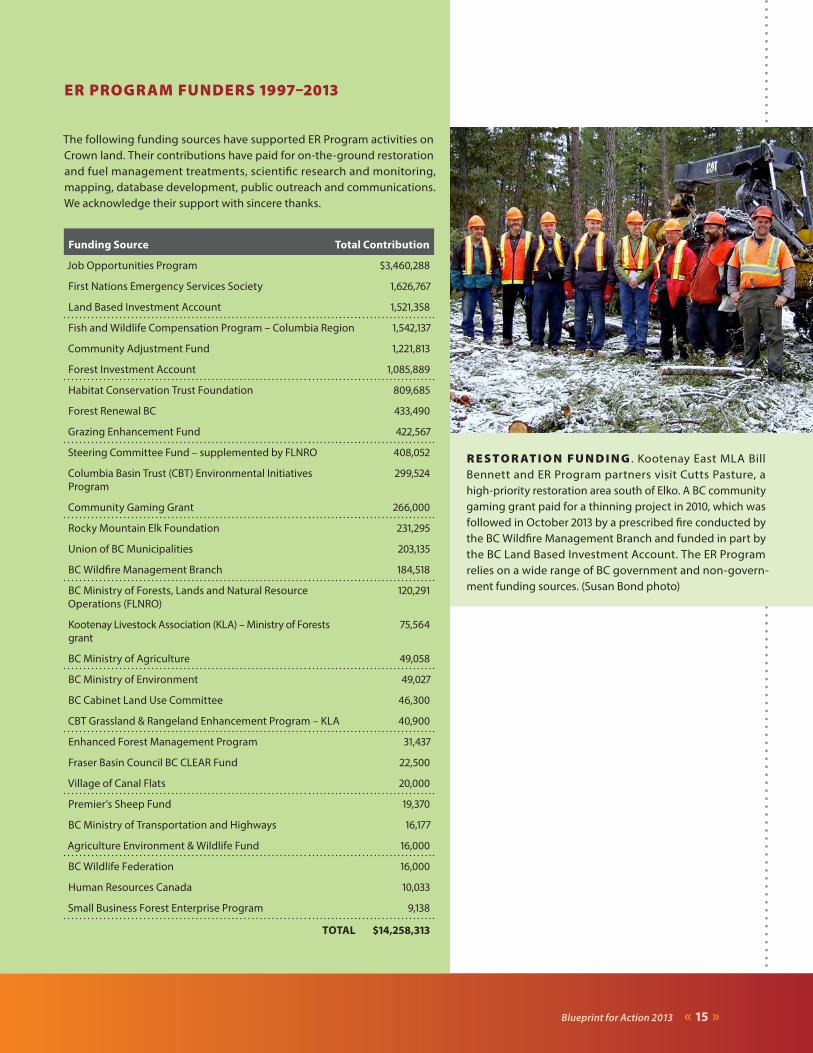
R E S T O R AT I O N F U N D I N G . Kootenay East MLA Bill Bennett and ER Program partners visit Cutts Pasture, a high-priority restoration area south of Elko. A BC community gaming grant paid for a thinning project in 2010, which was followed in October 2013 by a prescribed fire conducted by the BC Wildfire Management Branch and funded in part by the BC Land Based Investment Account. The ER Program relies on a wide range of BC government and non-govern-ment funding sources. (Susan Bond photo)
« 16 » Blueprint for Action 2013
COMMUNICATIONS & OUTREACH
The Steering Committee adopted its first formal communications strat-egy in 2007. Main objectives of the plan included:
» develop a distinct identity for the ER Program
» develop consistent key messages
» increase public support through education and awareness
» maintain and strengthen the partner/stakeholder base through improved internal communication, and
» develop a schools outreach program.
Better external and internal communication was one of four top prior-ities identified by Steering and Operations Committee members at a 2008 governance workshop.
Communication activities began in 2009 with development of two logos and a tagline. This was followed in 2010 by launch of a website that featured a comprehensive online research library of historic and contemporary documents, airphotos and maps related to all aspects of fire-maintained ecosystem restoration in the Trench. As of Fall 2013, the digital library’s collection holds 440 items, all of which can be searched by keyword and downloaded.
Since 2009, the ER Program has also produced print and online news-letters; distributed press releases and articles; hosted field tours for the media, public, college students and program funders; made presenta-tions to local, regional and provincial audiences; installed temporary information signs at restoration sites; produced promotional clothing items; and attended a wide range of public events throughout the Trench.
Nature’s Benefits – a 2012 project comprising brochure, slide show and portable display – focused on the ecological goods and services provided by grasslands and open forests in the East Kootenay and Upper Columbia Valley.
Currently, the ER Program’s communications contractor is developing a curriculum-based program that will introduce Trench ER principles and practices to middle school science classes.
The Steering Committee’s pre-2009 communication activities included two editions of Blueprint for Action, three productions for Knowledge Network’s Westland TV series, and presentations at provincial and international conferences.
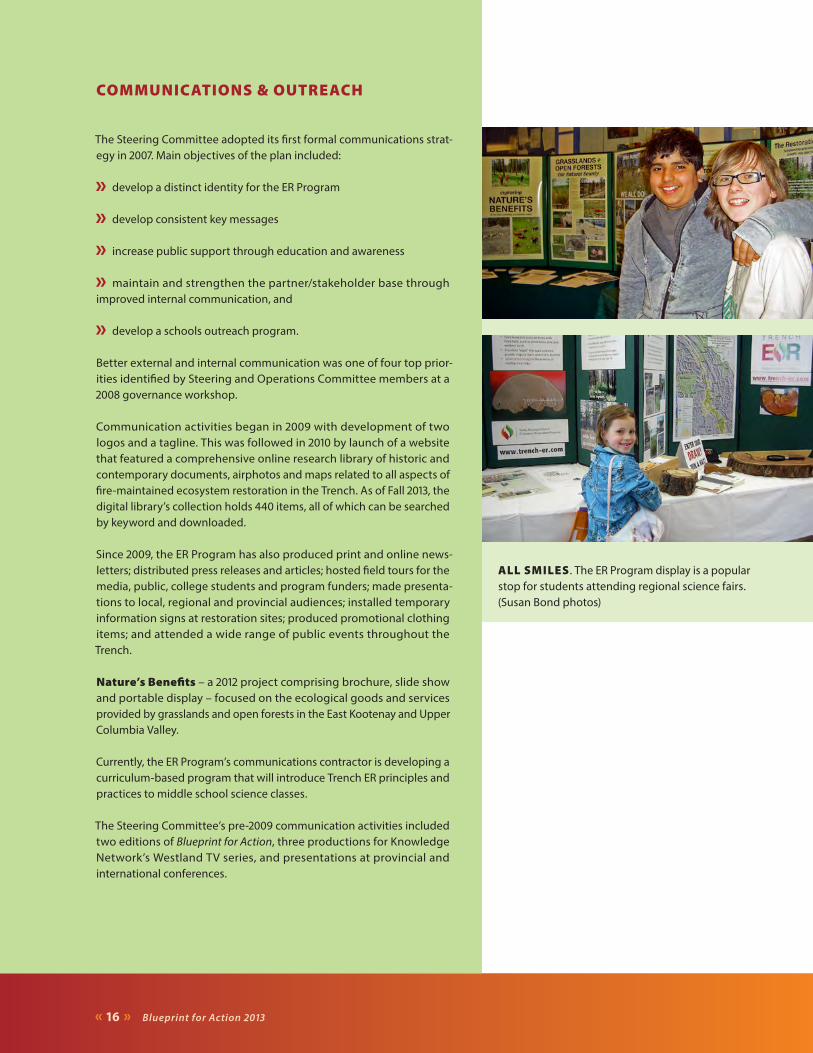
ALL SMILES . The ER Program display is a popular stop for students attending regional science fairs. (Susan Bond photos)
Blueprint for Action 2013 « 17 »
THE OPERATIONS COMMITTEE
BY BJ R A N DA L L H A R R I S , R PF
The ER Program’s Operations Committee plans and del ivers on-the-ground restoration projects. In recent years the
committee has grown in size and scope, a major step forward for effective ecosystem restoration in the Trench.
While the ER Program continues to focus primarily on the Crown landbase, it also en-compasses “parallel” restoration programs in provincial and national parks, on private con-servation properties and First Nations reserves. Most recently, fuel management/wildfire hazard reduction has become yet another parallel pro-gram that the ER Program facilitates under its planning and operational umbrella.
Most government and non-government agen-cies involved with fire-maintained ecosystem restoration in the Trench are now represented on the Ops Committee. Together these partners make for a strong coalition that cooperates on joint projects and manages for common goals across multiple land jurisdictions. The addi-tion of new partners to the program means fire-maintained ecosystems can be restored across the landscape, rather than on a patchy, piecemeal basis.
Ops Committee members also bring pro-fessional know-how and experience to the restoration process. Foresters, technicians, wild-life biologists, agrologists and ecologists each contribute specialized knowledge of the diverse natural resources in fire-maintained ecosystems.
The committee meets three times a year. At the January planning meeting, program
partners propose projects and recommend an annual workplan to the Steering Committee. In March and September they set budgets, discuss policy and priorities, and report out on complet-ed projects.
Fuel Management – As of 2012, local governments implementing wildfire protection plans within a 2 kilometre radius of their com-munities have been invited to the planning meeting so their work can be coordinated with restoration workplans. For instance, more than 90% of the high-priority areas requiring treatment under the Regional District of East Kootenay’s Community Wildfire Protection Plan (CWPP) are within the ER Program’s oper-ating area. First Nations implementing CWPPs in and around reserve lands also participate.
Beyond the 2 km limit of CWPPs, contiguous restoration projects have created large land-scape-level fuel breaks at several locations in the Trench, and more are planned. Fuel breaks across the landscape are effective in stopping “mega” fires, extreme wildfire events which are predicted to increase as climate change progresses.
Reducing wildfire hazard around commun-ities and across the landscape usually requires forest thinning and burning, familiar treatments to the ER Program. With some tweaks, fuel management projects can mesh with restoration objectives. In fact, prescriptions for fuel treat-ment designed to meet ER Program objectives can produce even more effective barriers to the spread of wildfire, and create forest stands that are more resilient to wildfire.
PROGRESS OPERATIONS
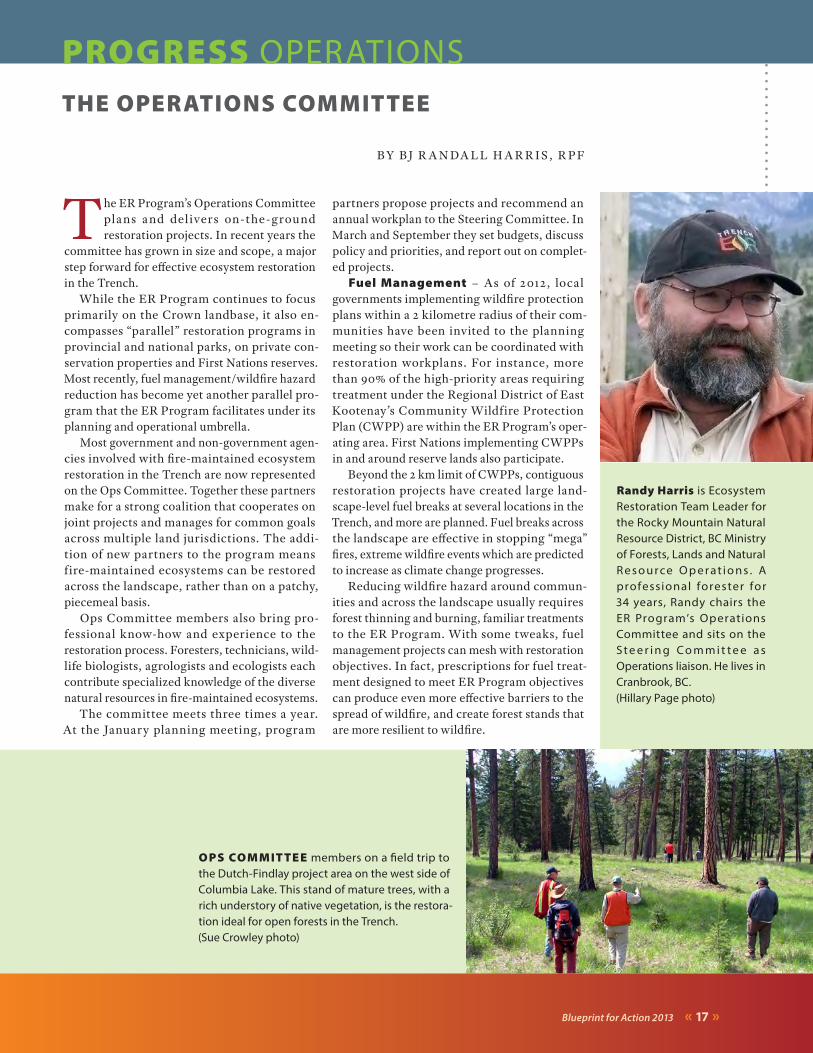
Randy Harris is Ecosystem Restoration Team Leader for the Rocky Mountain Natural Resource District, BC Ministry of Forests, Lands and Natural R e s o urce O p e r at i o ns . A professional forester for 34 years, Randy chairs the ER Program’s Operations Committee and sits on the St e e r i n g C o m m i t t e e a s Operations liaison. He lives in Cranbrook, BC.(Hillary Page photo)
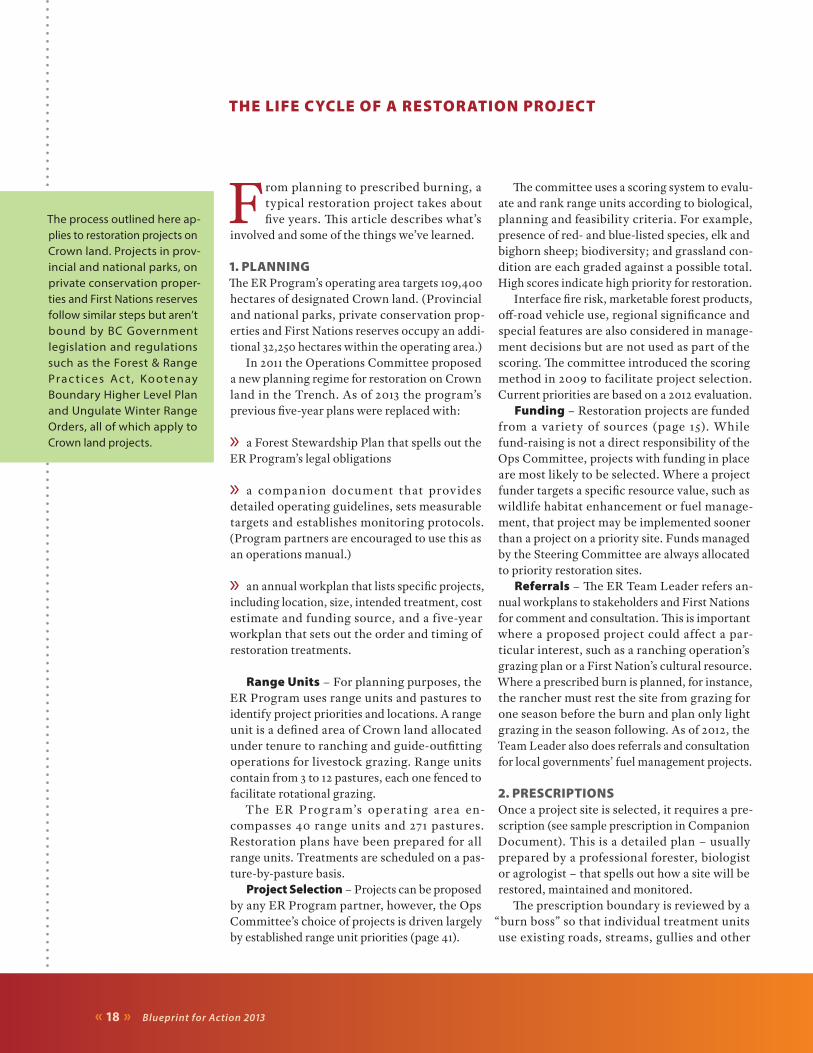
OPS COM M IT TE E members on a field trip to the Dutch-Findlay project area on the west side of Columbia Lake. This stand of mature trees, with a rich understory of native vegetation, is the restora-tion ideal for open forests in the Trench.(Sue Crowley photo)
« 18 » Blueprint for Action 2013
THE LIFE CYCLE OF A RESTORATION PROJECT
From planning to prescribed burning, a typical restoration project takes about five years. This article describes what’s
involved and some of the things we’ve learned.
1. PLANNINGThe ER Program’s operating area targets 109,400 hectares of designated Crown land. (Provincial and national parks, private conservation prop-erties and First Nations reserves occupy an addi-tional 32,250 hectares within the operating area.)
In 2011 the Operations Committee proposed a new planning regime for restoration on Crown land in the Trench. As of 2013 the program’s previous five-year plans were replaced with:
» a Forest Stewardship Plan that spells out the ER Program’s legal obligations
» a companion document that provides detailed operating guidelines, sets measurable targets and establishes monitoring protocols. (Program partners are encouraged to use this as an operations manual.)
» an annual workplan that lists specific projects, including location, size, intended treatment, cost estimate and funding source, and a five-year workplan that sets out the order and timing of restoration treatments.
Range Units – For planning purposes, the ER Program uses range units and pastures to identify project priorities and locations. A range unit is a defined area of Crown land allocated under tenure to ranching and guide-outfitting operations for livestock grazing. Range units contain from 3 to 12 pastures, each one fenced to facilitate rotational grazing.
The ER Program’s operat ing area en-compasses 40 range units and 271 pastures. Restoration plans have been prepared for all range units. Treatments are scheduled on a pas-ture-by-pasture basis.
Project Selection – Projects can be proposed by any ER Program partner, however, the Ops Committee’s choice of projects is driven largely by established range unit priorities (page 41).
The committee uses a scoring system to evalu-ate and rank range units according to biological, planning and feasibility criteria. For example, presence of red- and blue-listed species, elk and bighorn sheep; biodiversity; and grassland con-dition are each graded against a possible total. High scores indicate high priority for restoration.
Interface fire risk, marketable forest products, off-road vehicle use, regional significance and special features are also considered in manage-ment decisions but are not used as part of the scoring. The committee introduced the scoring method in 2009 to facilitate project selection. Current priorities are based on a 2012 evaluation.
Funding – Restoration projects are funded from a variety of sources (page 15). While fund-raising is not a direct responsibility of the Ops Committee, projects with funding in place are most likely to be selected. Where a project funder targets a specific resource value, such as wildlife habitat enhancement or fuel manage-ment, that project may be implemented sooner than a project on a priority site. Funds managed by the Steering Committee are always allocated to priority restoration sites.
Referrals – The ER Team Leader refers an-nual workplans to stakeholders and First Nations for comment and consultation. This is important where a proposed project could affect a par-ticular interest, such as a ranching operation’s grazing plan or a First Nation’s cultural resource. Where a prescribed burn is planned, for instance, the rancher must rest the site from grazing for one season before the burn and plan only light grazing in the season following. As of 2012, the Team Leader also does referrals and consultation for local governments’ fuel management projects.
2. PRESCRIPTIONSOnce a project site is selected, it requires a pre-scription (see sample prescription in Companion Document). This is a detailed plan – usually prepared by a professional forester, biologist or agrologist – that spells out how a site will be restored, maintained and monitored.
The prescription boundary is reviewed by a “burn boss” so that individual treatment units use existing roads, streams, gullies and other
The process outlined here ap-plies to restoration projects on Crown land. Projects in prov-incial and national parks, on private conservation proper-ties and First Nations reserves follow similar steps but aren’t bound by BC Government legislation and regulations such as the Forest & Range Prac t ices Ac t , Ko otenay Boundary Higher Level Plan and Ungulate Winter Range Orders, all of which apply to Crown land projects.
Blueprint for Action 2013 « 19 »
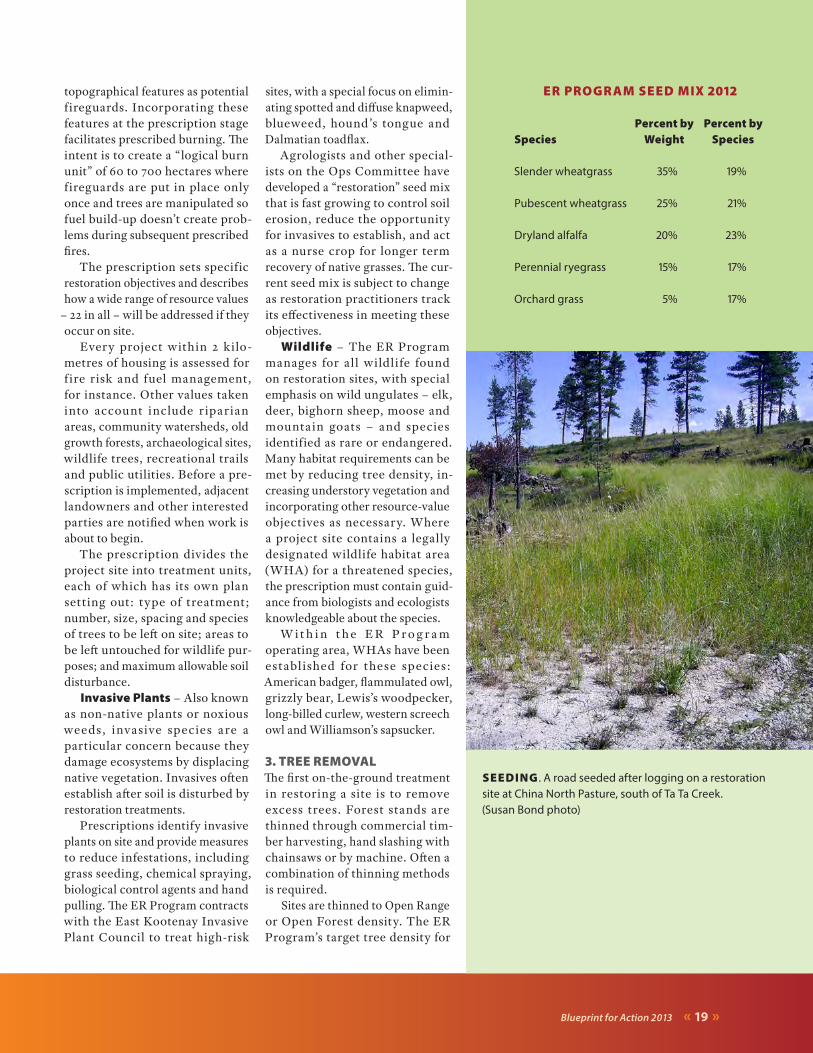
ER PROGRAM SEED MIX 2012
Percent by Percent by Species Weight Species
Slender wheatgrass 35% 19%
Pubescent wheatgrass 25% 21%
Dryland alfalfa 20% 23%
Perennial ryegrass 15% 17%
Orchard grass 5% 17%
topographical features as potential f ireguards. Incorporating these features at the prescription stage facilitates prescribed burning. The intent is to create a “logical burn unit” of 60 to 700 hectares where f ireguards are put in place only once and trees are manipulated so fuel build-up doesn’t create prob-lems during subsequent prescribed fires.
The prescription sets specific restoration objectives and describes how a wide range of resource values
– 22 in all – will be addressed if they occur on site.
Every project within 2 kilo-metres of housing is assessed for f ire risk and fuel management, for instance. Other values taken into account include r iparian areas, community watersheds, old growth forests, archaeological sites, wildlife trees, recreational trails and public utilities. Before a pre-scription is implemented, adjacent landowners and other interested parties are notified when work is about to begin.
The prescription divides the project site into treatment units, each of which has its own plan setting out: type of treatment; number, size, spacing and species of trees to be left on site; areas to be left untouched for wildlife pur-poses; and maximum allowable soil disturbance.
Invasive Plants – Also known as non-native plants or noxious weeds, invasive species are a particular concern because they damage ecosystems by displacing native vegetation. Invasives often establish after soil is disturbed by restoration treatments.
Prescriptions identify invasive plants on site and provide measures to reduce infestations, including grass seeding, chemical spraying, biological control agents and hand pulling. The ER Program contracts with the East Kootenay Invasive Plant Council to treat high-risk
sites, with a special focus on elimin-ating spotted and diffuse knapweed, blueweed, hound’s tongue and Dalmatian toadflax.
Agrologists and other special-ists on the Ops Committee have developed a “restoration” seed mix that is fast growing to control soil erosion, reduce the opportunity for invasives to establish, and act as a nurse crop for longer term recovery of native grasses. The cur-rent seed mix is subject to change as restoration practitioners track its effectiveness in meeting these objectives.
Wildlife – The ER Program manages for all wildlife found on restoration sites, with special emphasis on wild ungulates – elk, deer, bighorn sheep, moose and mountain goats – and species identified as rare or endangered. Many habitat requirements can be met by reducing tree density, in-creasing understory vegetation and incorporating other resource-value objectives as necessary. Where a project site contains a legally designated wildlife habitat area (WHA) for a threatened species, the prescription must contain guid-ance from biologists and ecologists knowledgeable about the species.
W i t h i n t h e E R P r o g r a m operating area, WHAs have been establ ished for these species: American badger, flammulated owl, grizzly bear, Lewis’s woodpecker, long-billed curlew, western screech owl and Williamson’s sapsucker.
3. TREE REMOVALThe first on-the-ground treatment in restoring a site is to remove excess trees. Forest stands are thinned through commercial tim-ber harvesting, hand slashing with chainsaws or by machine. Often a combination of thinning methods is required.
Sites are thinned to Open Range or Open Forest density. The ER Program’s target tree density for
SEEDING . A road seeded after logging on a restoration site at China North Pasture, south of Ta Ta Creek.(Susan Bond photo)
« 20 » Blueprint for Action 2013
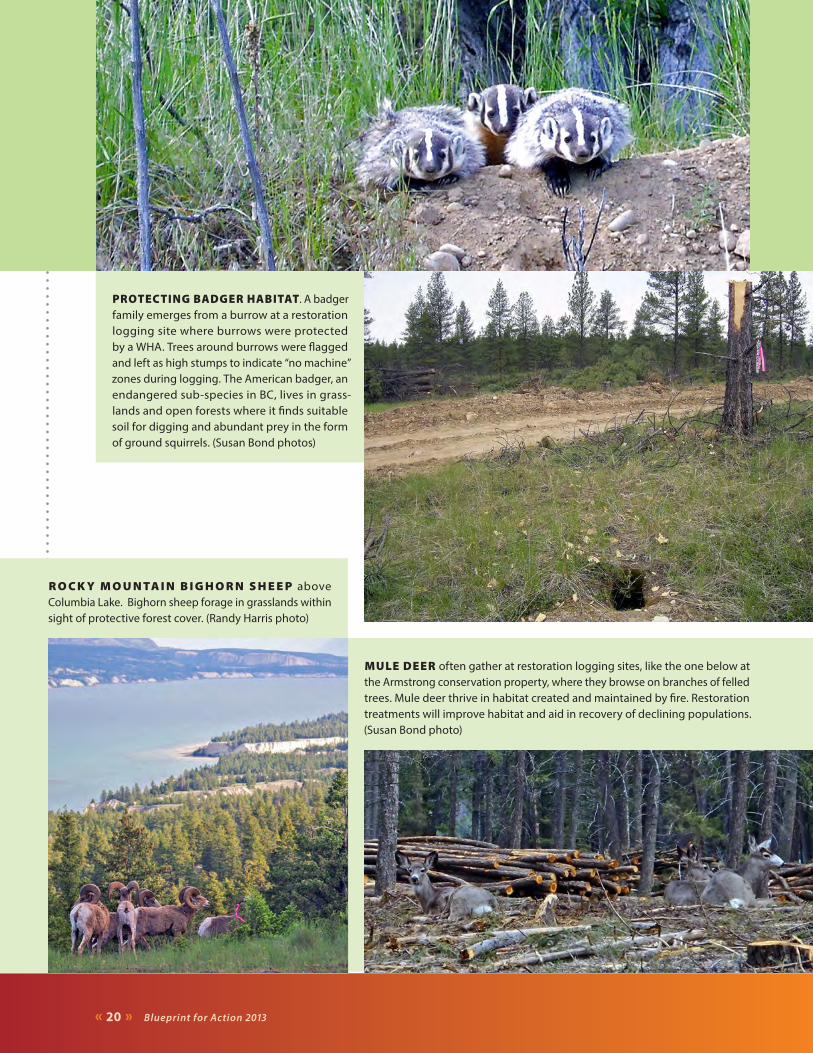
MULE DEER often gather at restoration logging sites, like the one below at the Armstrong conservation property, where they browse on branches of felled trees. Mule deer thrive in habitat created and maintained by fire. Restoration treatments will improve habitat and aid in recovery of declining populations. (Susan Bond photo)
R O C K Y M O U N TA I N B I G H O R N S H E E P above Columbia Lake. Bighorn sheep forage in grasslands within sight of protective forest cover. (Randy Harris photo)
PROTECTING BADGER HABITAT. A badger family emerges from a burrow at a restoration logging site where burrows were protected by a WHA. Trees around burrows were flagged and left as high stumps to indicate “no machine” zones during logging. The American badger, an endangered sub-species in BC, lives in grass-lands and open forests where it finds suitable soil for digging and abundant prey in the form of ground squirrels. (Susan Bond photos)
Blueprint for Action 2013 « 21 »
Open Range sites is 20 stems per hectare, leav-ing a forest canopy of about 10% cover. On Open Forest sites, the target is 150 sph, equal to forest canopy cover of roughly 25% (page 8).
One-third of retained trees in each category must be of the largest diameter found on site. This means, in practice, that remaining trees are the biggest, most mature specimens. Ecosystem restoration sites are exempt from BC’s reforest-ation requirements.
Very occasionally, a young forest stand can be thinned with prescribed fire but the flames usual-ly kill only seedlings under a metre tall and even then, only when there’s a good fuel bed of grass and other fine fuels to generate sufficient heat.
Logging – Most stands require a mechanic-al thinning treatment and the preferred method
– one with no direct cost to the ER Program – is to have the stand logged commercially by companies with a long-term forest tenure or a temporary licence.
The ER Program has been successful in using a special portion of the Rocky Mountain Natural Resource District’s allowable annual cut to direct the issuing of five temporary non-renewable for-est licences (NRFLs) to harvest 2,235 hectares of high-priority treatment areas. This yielded 171,000 cubic metres of wood to help drive the local forest industry.
The ER Program has also experimented with hiring local contractors to log sites but finding buyers for the resulting decked wood has proved difficult. It is much more cost-effective to assess a stand’s timber yield then put it out
to tender as a competitive forestry licence, or to issue an “occupant licence to cut” to an ER Program partner.
Trench Wood – The economics of logging on restoration sites is a major obstacle to commercial thinning. Restoration sites are extremely margin-al wood-growing areas, producing what is known locally as “Trench” wood. Timber volume is low and the predominant species, interior Douglas-fir and ponderosa pine, are of poor quality. Douglas-fir is generally of poor form – short, with a pronounced taper, and many large limbs – mak-ing it of limited value as a sawlog, typically the most valuable timber product. Ponderosa pine is harvested mostly for pulpwood.
For the thinning process to break even, the harvested block should average at least 90 cubic metres of sawlog-sized trees per hec-tare. A cubic metre is the volume of wood in a telephone pole; a logging truck holds about
35m3 on average. A good sta nd should produce at least three logging truckloads of sawlog-sized material per hectare.
I f market condi-tions are r ight and transportation costs
LOGGING . A feller-buncher cuts and piles trees on China North Pasture, at right. This restoration site was harvested by Tembec in 2011 after the company submitted a successful bid for a non-renewable forest licence.(Susan Bond photo)
AFTER THINNING . Indian Springs Pasture, middle and Airport Pasture, bottom. (Brian Dureski photos)
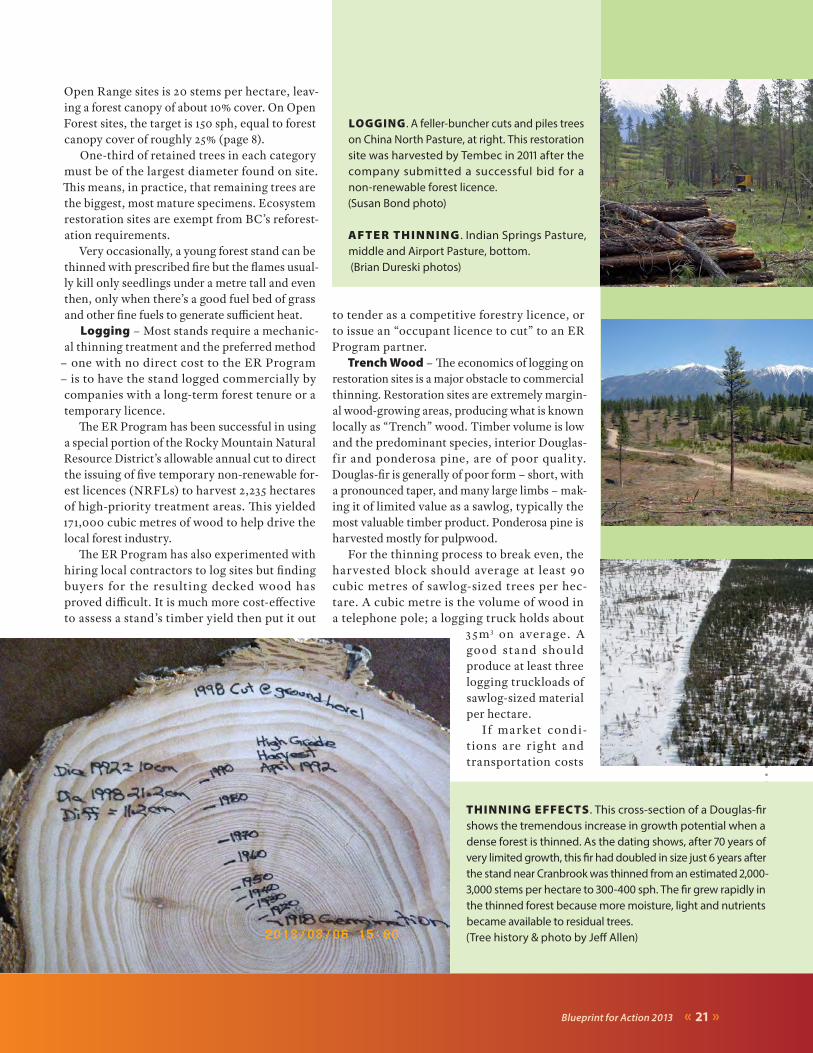
THINNING EFFECTS. This cross-section of a Douglas-fir shows the tremendous increase in growth potential when a dense forest is thinned. As the dating shows, after 70 years of very limited growth, this fir had doubled in size just 6 years after the stand near Cranbrook was thinned from an estimated 2,000-3,000 stems per hectare to 300-400 sph. The fir grew rapidly in the thinned forest because more moisture, light and nutrients became available to residual trees.(Tree history & photo by Jeff Allen)
« 22 » Blueprint for Action 2013
reasonable, trees that don’t meet sawlog stan-dards can be logged and chipped for kraft pulp production at the Skookumchuck pulp mill. Logging debris can be ground as hog fuel to pro-duce electricity at the mill’s co-generation plant. NRFLs issued in 2010-12 were used to produce pulp chips and hog fuel.
On sites where commercial logging is un-economic, the ER Program must find funding to pay for other thinning methods.
Thinning Options – Government employ-ment programs resulting from the 2008 global economic downturn provided the ER Program with millions of dollars in funding – and some valuable lessons. BC forestry companies were especially hard hit by the US housing crisis of the day. Five sawmills in the Trench closed their doors, one permanently, throwing 1,238 people out of work at the time.
The ER Program facilitated successful appli-cations for $4.7 million in provincial and federal funding from the Job Opportunities Program, Community Adjustment Fund and Forest Investment Account. Between September 2008 and April 2010, program partners and others sponsored nine crews of unemployed forestry workers in Radium Hot Springs, Canal Flats, Cranbrook and Jaffray.
Job-creation grants provided 15,741 days of employment for 150 individuals who hand thinned and piled small-diameter trees on nearly 4,000 hectares of ingrown forest stands. Crews also burned piles on 630 hectares, cleared 21 hiking trails and built 2 kilometres of nature trails. Their work opened up a lot of rangeland and provided the ER Program with new insights into crew productivity and
the cost effectiveness of hand slashing versus machine thinning.
Based on this experience, the program has de-veloped a range of options to reduce forest stands where low-volume, non-merchantable wood predominates. There are four major methods.
1. Stands with trees less than 15 centimetres diameter at breast height (cm dbh) and with fewer than 2,000 stems per hectare (sph) can be thinned by hand using chainsaws. (BC’s Worksafe guidelines allow only certified fallers to cut trees over 15cm dbh.) On these sites, the felled trees can be scattered to act as fuel for prescribed burns.
2. Denser stands up to 5,000 sph, with trees under 15cm dbh, can be hand thinned and the trees piled for follow-up pile burning. Burn rings must be raked and grass-seeded to reduce invasive plant growth. This method is more expensive but useful on steep slopes or sensitive soil types or stands. On sites with more than 5,000 sph, or with trees 10-15cm dbh, hand slashing becomes inefficient and too costly.
3. Mastication – using a small skid steer to cut, chip and scatter trees in one pass – works on denser stands if slopes are under 30% and trees under 15cm dbh. Mastication can eradicate both standing trees and piles.
4. M a s t i c a t i o n b y e x c av a t o r - mo u nt e d c h ip p i n g m a c h i ne s o r f r o nt- mo u nt e d mastication machines are options on slopes up to 55% and stems up to 45cm dbh. These machines can usually manoeuvre between
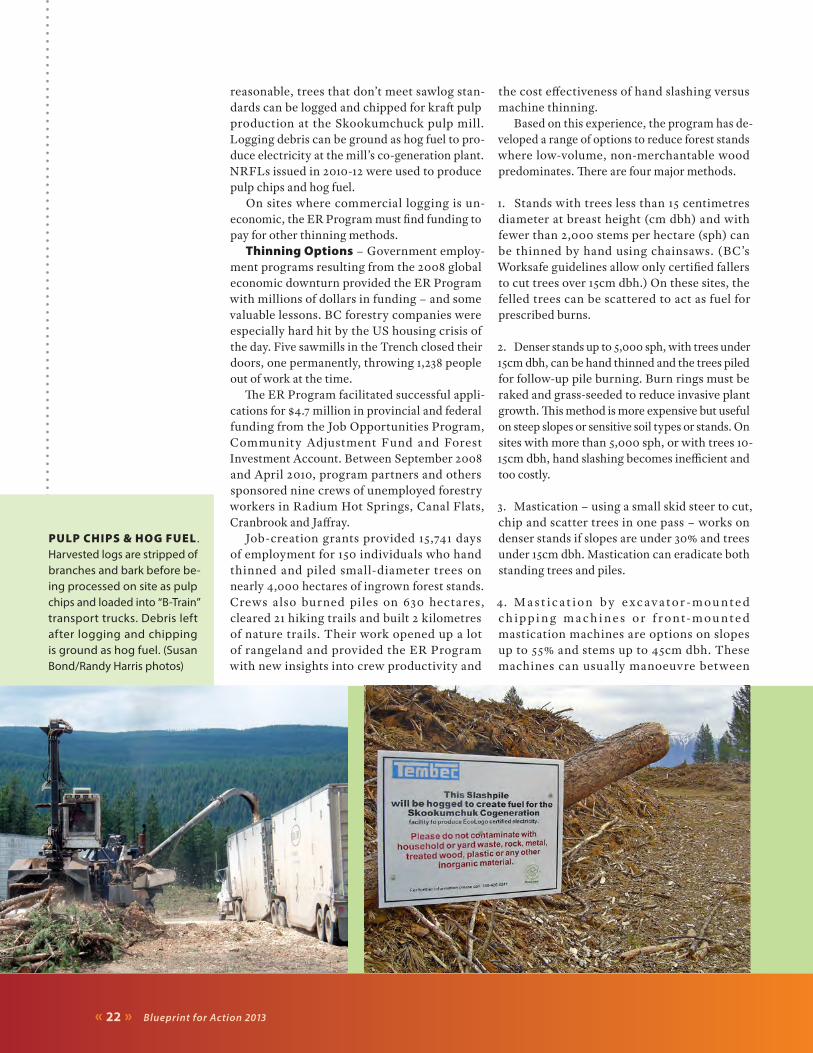
PULP CHIPS & HOG FUEL . Harvested logs are stripped of branches and bark before be-ing processed on site as pulp chips and loaded into “B-Train” transport trucks. Debris left after logging and chipping is ground as hog fuel. (Susan Bond/Randy Harris photos)
Blueprint for Action 2013 « 23 »
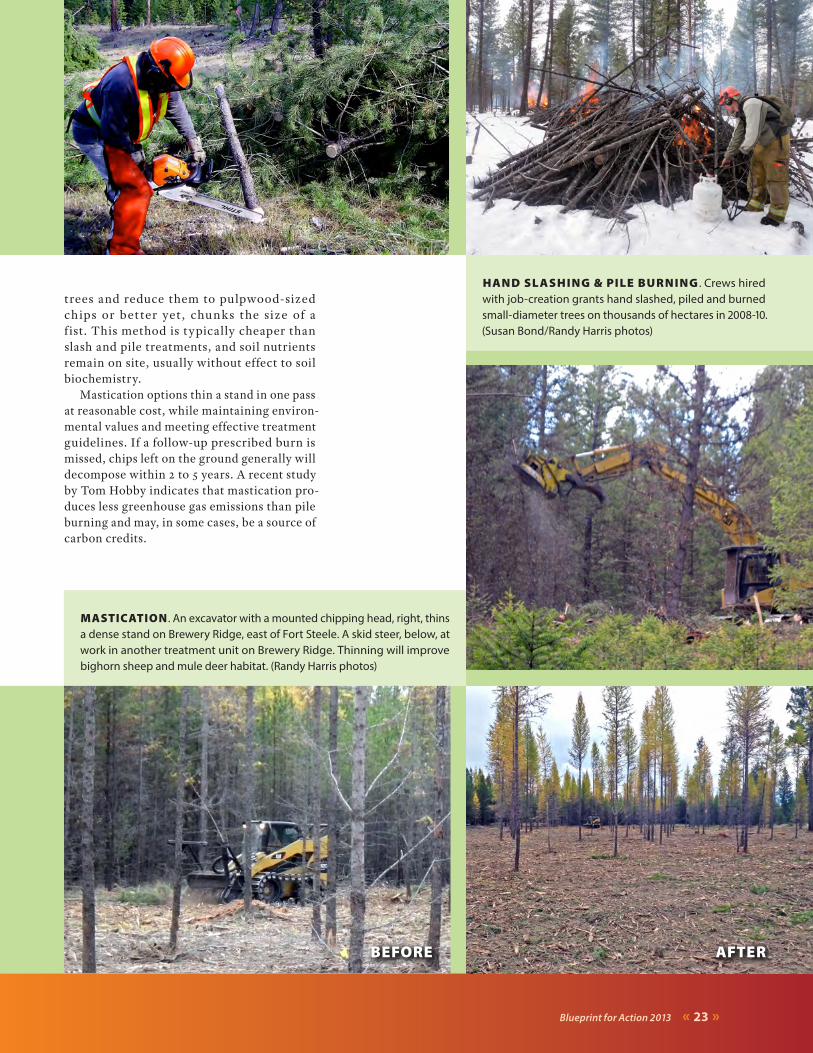
HAND SL ASHING & PILE BURNING . Crews hired with job-creation grants hand slashed, piled and burned small-diameter trees on thousands of hectares in 2008-10. (Susan Bond/Randy Harris photos)
trees and reduce them to pulpwood-sized chips or better yet, chunks the size of a f ist. This method is typically cheaper than slash and pile treatments, and soil nutrients remain on site, usually without effect to soil biochemistry.
Mastication options thin a stand in one pass at reasonable cost, while maintaining environ-mental values and meeting effective treatment guidelines. If a follow-up prescribed burn is missed, chips left on the ground generally will decompose within 2 to 5 years. A recent study by Tom Hobby indicates that mastication pro-duces less greenhouse gas emissions than pile burning and may, in some cases, be a source of carbon credits.
BEFORE AFTER
MASTICATION . An excavator with a mounted chipping head, right, thins a dense stand on Brewery Ridge, east of Fort Steele. A skid steer, below, at work in another treatment unit on Brewery Ridge. Thinning will improve bighorn sheep and mule deer habitat. (Randy Harris photos)
« 24 » Blueprint for Action 2013
Bioenergy – The Rocky Mountain Trench Natural Resources Society, a founding partner in the ER Program, is pursuing alternative markets for Trench wood. Some opportunities exist to export raw logs to nearby US mills but demand, transportation costs and government regula-tions are limiting factors. In 2010, the society launched its first efforts to develop bioenergy as an option to traditional local markets.
Activities to date include a tour of Montana schools participating in Fuels for Schools – a US program that encourages public institutions to convert to wood heat – and a series of workshops on development and operation of small-scale, wood-fired heating systems.
The society has also joined forces with the Cities of Cranbrook and Kimberley, Ktunaxa Nation, aq’am (St. Mary’s Indian Band) and Nupqu Development Corp. to further explore bioenergy opportunities that could make use of Trench wood and provide long-term funding for restoration and community wildfire protection projects.
Public Involvement – Community groups supporting ecosystem restoration and wildlife habitat enhancement are teaming up with ER Program partners to thin ingrown forest stands in the Trench. Numerous volunteer workbees have been sponsored by:
» Lake Windermere District Rod & Gun Club at The Nature Trust of BC’s Hoodoo conservation property and Nature Conservancy of Canada’s Kootenay River Ranch conservation property
» Cranbrook Community Forest Society in the interpretive forest on the outskirts of Cranbrook
» Fernie Rod & Gun Club on the Wigwam Flats near Elko. The Wigwam Flats hand-
slashing project earned the club the BC Wildlife Federation’s prestigious Roderick Haig-Brown Conservation Award.
4. PRESCRIBED BURNINGThe next step in restoring a fire-maintained eco-system site is to re-introduce fire with a prescribed burn – also called a broadcast burn. The first burn typically follows 2 years after a stand has been thinned to Open Range or Open Forest density.
Prescribed burning keeps tree regeneration in check, rejuvenates native grasses and shrubs, recycles nutrients into the soil, and removes debris left after thinning treatments.
Every prescribed fire requires a prescription and a burn plan, prepared by a provincially certi-fied burn boss, that sets out measurable objectives within defined boundaries and describes ignition methods, crew requirements and safety procedures.
Prescribed burns are carried out when fuel conditions favour a low-intensity burn that can be easily controlled within pre-established fireguards, and when venting conditions com-ply with BC Ministry of Environment smoke control regulations. These require that smoke production is either dissipated or carried out of the airshed within 96 hours of light-up.
Challenges – The big challenges to pre-scribed burning are restricted burning “windows” and limited manpower. The ER Program is addressing these by expanding the burning sea-son and turning to BC’s Wildfire Management Branch for expert assistance.
Burns have typically taken place in the month of April, after snowmelt and before new plant growth is too far advanced. The program pulled off successful burns in October 2012 and 2013, and intends to schedule more fall burns to mar-ginally increase the number of burning days each
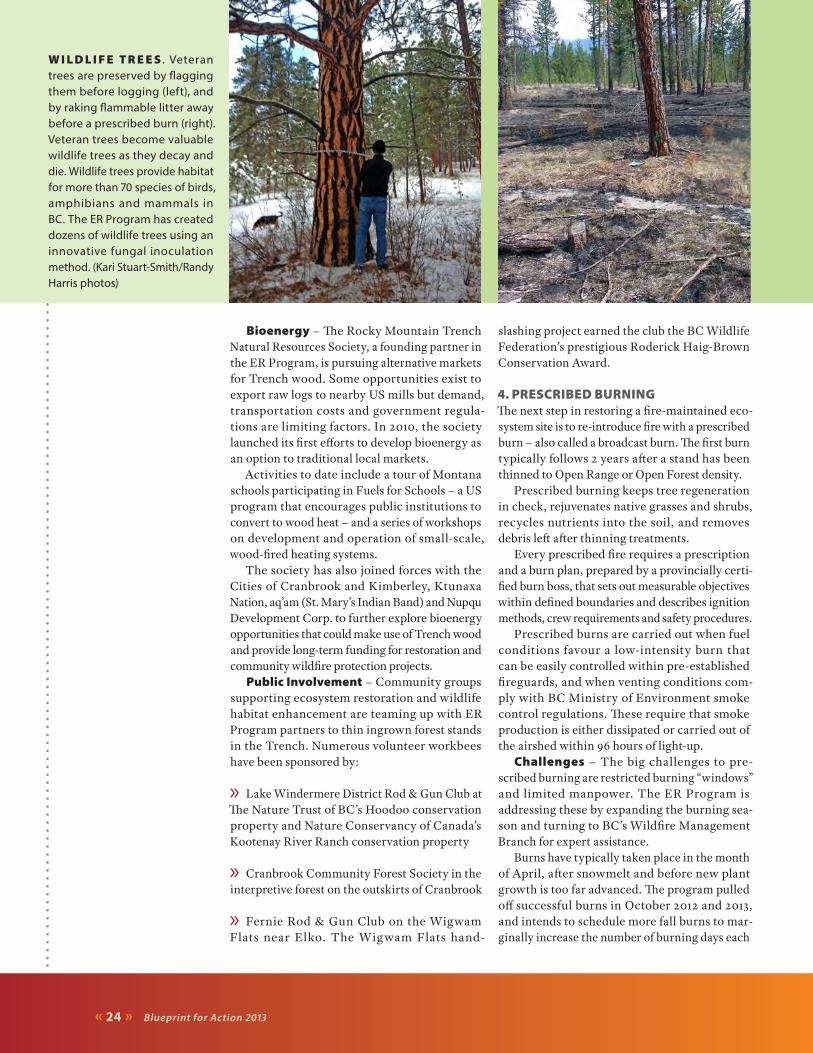
W I L D L I F E T R E E S . Veteran trees are preserved by flagging them before logging (left), and by raking flammable litter away before a prescribed burn (right). Veteran trees become valuable wildlife trees as they decay and die. Wildlife trees provide habitat for more than 70 species of birds, amphibians and mammals in BC. The ER Program has created dozens of wildlife trees using an innovative fungal inoculation method. (Kari Stuart-Smith/Randy Harris photos)
Blueprint for Action 2013 « 25 »
year. Even on a “good” burning day, however, successful ignition of a site can be restricted to a narrow window of a few hours when temper-ature and relative humidity are most favourable.
As of 2013, most fires will be conducted by the Wildfire Management Branch (WMB) which has the necessary crews and expertise. This increase in capacity is critical to the ER Program. An add-ed benefit is that direct costs for a burn will be halved, from $70 per hectare to $27 to $39 per ha. Anticipated changes to BC legislation will allow WMB to conduct burns on non-Crown land, a potential benefit for ER Program partners.
WMB managers see prescribed burning as a good training opportunity. Seasonal firefighting crews also work on local interface fuel projects when they aren’t on fire duty.
Maintenance – Follow-up maintenance burns on a restoration site should mimic the historical fire regime described in the Ecology section. Ideally, maintenance burns should be scheduled every 10 years on sites south of Skookumchuck and every 15 years north of it. To fine tune actual timing of routine mainten-ance, surveys should be done every five years. However the realities of resources and burning windows dictate otherwise.
Weather conditions typically allow burning on only 2 or 3 days in spring and 1 or 2 days in fall. Six to 15 prescribed burns would have to be lit on each favourable day to keep up with the schedule
above, and maintain the entire ER Program operating area. Logistically this is unfeasible, and the smoke production would be huge.
As a consequence, the ER Program will focus on burning only the highest priority sites and only when those sites require a burn. Fires will not be lit unless there is a need to: reduce regenerating trees under one metre high; reduce thatches and mats of grass and herbaceous mat-ter; rejuvenate aging shrubs; or reduce debris after thinning treatments.
Not every hectare will be fully restored as described in Blueprint for Action 2006. For more on the ER Program’s current strategic direction, see page 12.
5. MONITORINGThe Ops Committee is responsible for devel-oping and maintaining a 10-year monitoring workplan. Monitoring restoration sites before and after each treatment is crucial in meas-uring effectiveness and ecological impacts. Monitoring provides valuable feedback on what is happening on the ground and, more im-portantly, assists in refining future restoration prescriptions. At this time, however, the cost of monitoring is not built into each project budget and finding funding for this essential expense can be difficult.
For a full discussion of monitoring, including results to date, see the Learnings section.
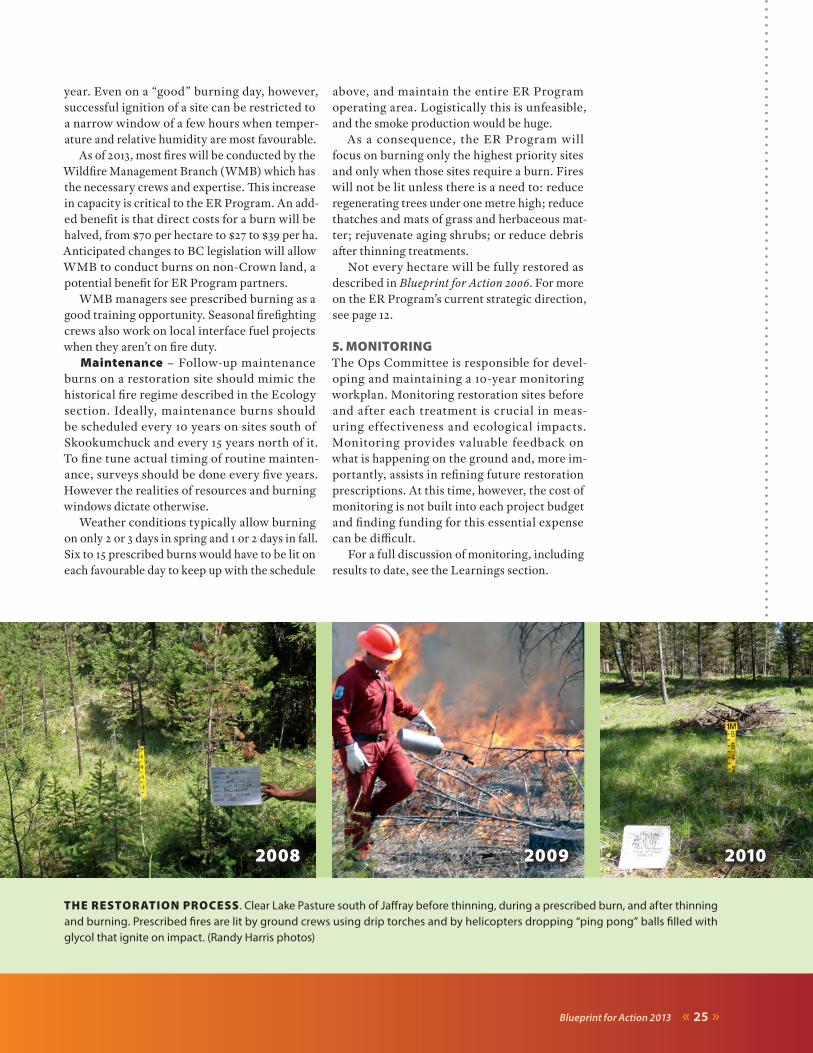
THE RESTORATION PROCESS . Clear Lake Pasture south of Jaffray before thinning, during a prescribed burn, and after thinning and burning. Prescribed fires are lit by ground crews using drip torches and by helicopters dropping “ping pong” balls filled with glycol that ignite on impact. (Randy Harris photos)
2008 2009 2010
Elk
o
Fern
ie
Jaffr
ay
Elk
ford
Cre
ston
Gra
smer
e
Spa
rwoo
d
Edg
ewat
er
Cra
nbro
ok
Kim
berle
y
Inve
rmer
e
Ta T
a C
reek
Fort
Ste
ele
Can
al F
lats
Sko
okum
chuc
k
Rad
ium
Hot
Spr
ings
Fairm
ont H
ot S
prin
gs
Brit
ish
Col
umbi
a
Mon
tana
Idah
o
Alb
erta
CA
NA
DA
U.S
.A.
Map
le L
eaf F
ores
try L
td.
Oct
ober
201
3
Lake
Win
derm
ere
Col
umbi
a La
ke
Kooc
anus
a R
eser
voir
BC
AB
MT
IDW
A OR
aq'a
m(S
t. M
ary'
s)
Toba
cco
Plai
ns
Shus
wap
Akis
qnuk
(Col
umbi
a La
ke)
Dry
Gul
ch P
ark
Prem
ier L
ake
Park
Was
a La
ke P
ark
Moy
ie L
ake
Par
k
Kiko
mun
Cre
ek P
ark
Columbia River
Kootenay River
Kootenay RiverTh
unde
r Hill
Ran
ch
Koot
enay
Riv
er R
anch
Pine
But
te R
anch
Mt B
road
woo
d
Col
umbi
a La
ke W
est
Hoo
doos
Che
rry C
reek
Arm
stro
ng
05
1015
20
kilo
met
res
1:50
0 00
0
Tow
nsA
Hig
hway
s
ER P
rogr
am O
pera
ting
Area
(fire
-mai
ntai
ned
ecos
yste
m)
Prov
inci
al P
ark
Pro
ject
s
Cro
wn
Land
Pro
ject
s
Koot
enay
Nat
iona
l Par
kR
edst
reak
Pro
ject
Indi
an R
eser
ve
Con
serv
atio
n P
rope
rty P
roje
cts,
Nat
ure
Con
serv
ancy
of C
anad
a
Con
serv
atio
n P
rope
rty P
roje
cts,
The
Nat
ure
Trus
t of B
ritis
h C
olum
bia
Col
umbi
a La
ke E
ast
Low
er N
orbu
ry C
reek
Col
umbi
a La
ke P
ark
New
gate
/Ear
l Ran
ch
ER
Pro
ject
s 19
97 -
2013
Elk
o
Fern
ie
Jaffr
ay
Elk
ford
Cre
ston
Gra
smer
e
Spa
rwoo
d
Edg
ewat
er
Cra
nbro
ok
Kim
berle
y
Inve
rmer
e
Ta T
a C
reek
Fort
Ste
ele
Can
al F
lats
Sko
okum
chuc
k
Rad
ium
Hot
Spr
ings
Fairm
ont H
ot S
prin
gs
Brit
ish
Col
umbi
a
Mon
tana
Idah
o
Alb
erta
CA
NA
DA
U.S
.A.
Map
le L
eaf F
ores
try L
td.
Oct
ober
201
3
Lake
Win
derm
ere
Col
umbi
a La
ke
Kooc
anus
a R
eser
voir
BC
AB
MT
IDW
A OR
aq'a
m(S
t. M
ary'
s)
Toba
cco
Plai
ns
Shus
wap
Akis
qnuk
(Col
umbi
a La
ke)
Dry
Gul
ch P
ark
Prem
ier L
ake
Park
Was
a La
ke P
ark
Moy
ie L
ake
Par
k
Kiko
mun
Cre
ek P
ark
Columbia River
Kootenay River
Kootenay RiverTh
unde
r Hill
Ran
ch
Koot
enay
Riv
er R
anch
Pine
But
te R
anch
Mt B
road
woo
d
Col
umbi
a La
ke W
est
Hoo
doos
Che
rry C
reek
Arm
stro
ng
05
1015
20
kilo
met
res
1:50
0 00
0
Tow
nsA
Hig
hway
s
ER P
rogr
am O
pera
ting
Area
(fire
-mai
ntai
ned
ecos
yste
m)
Prov
inci
al P
ark
Pro
ject
s
Cro
wn
Land
Pro
ject
s
Koot
enay
Nat
iona
l Par
kR
edst
reak
Pro
ject
Indi
an R
eser
ve
Con
serv
atio
n P
rope
rty P
roje
cts,
Nat
ure
Con
serv
ancy
of C
anad
a
Con
serv
atio
n P
rope
rty P
roje
cts,
The
Nat
ure
Trus
t of B
ritis
h C
olum
bia
Col
umbi
a La
ke E
ast
Low
er N
orbu
ry C
reek
Col
umbi
a La
ke P
ark
New
gate
/Ear
l Ran
ch
ER
Pro
ject
s 19
97 -
2013
MAP: ER PROJECTS 1997–2013
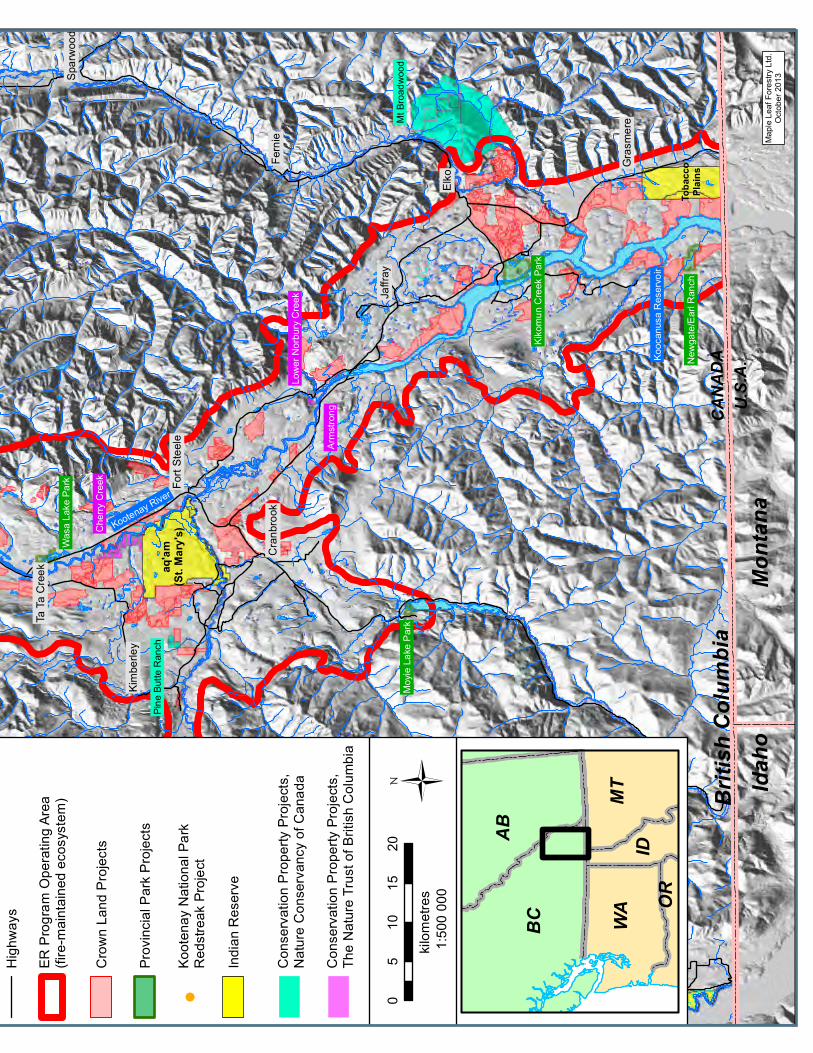
Elk
o
Fern
ie
Jaffr
ay
Elk
ford
Cre
ston
Gra
smer
e
Spa
rwoo
d
Edg
ewat
er
Cra
nbro
ok
Kim
berle
y
Inve
rmer
e
Ta T
a C
reek
Fort
Ste
ele
Can
al F
lats
Sko
okum
chuc
k
Rad
ium
Hot
Spr
ings
Fairm
ont H
ot S
prin
gs
Brit
ish
Col
umbi
a
Mon
tana
Idah
o
Alb
erta
CA
NA
DA
U.S
.A.
Map
le L
eaf F
ores
try L
td.
Oct
ober
201
3
Lake
Win
derm
ere
Col
umbi
a La
ke
Kooc
anus
a R
eser
voir
BC
AB
MT
IDW
A OR
aq'a
m(S
t. M
ary'
s)
Toba
cco
Plai
ns
Shus
wap
Akis
qnuk
(Col
umbi
a La
ke)
Dry
Gul
ch P
ark
Prem
ier L
ake
Park
Was
a La
ke P
ark
Moy
ie L
ake
Par
k
Kiko
mun
Cre
ek P
ark
Columbia River
Kootenay River
Kootenay River
Thun
der H
ill R
anch
Koot
enay
Riv
er R
anch
Pine
But
te R
anch
Mt B
road
woo
d
Col
umbi
a La
ke W
est
Hoo
doos
Che
rry C
reek
Arm
stro
ng
05
1015
20
kilo
met
res
1:50
0 00
0
Tow
nsA
Hig
hway
s
ER P
rogr
am O
pera
ting
Area
(fire
-mai
ntai
ned
ecos
yste
m)
Prov
inci
al P
ark
Pro
ject
s
Cro
wn
Land
Pro
ject
s
Koot
enay
Nat
iona
l Par
kR
edst
reak
Pro
ject
Indi
an R
eser
ve
Con
serv
atio
n P
rope
rty P
roje
cts,
Nat
ure
Con
serv
ancy
of C
anad
a
Con
serv
atio
n P
rope
rty P
roje
cts,
The
Nat
ure
Trus
t of B
ritis
h C
olum
bia
Col
umbi
a La
ke E
ast
Low
er N
orbu
ry C
reek
Col
umbi
a La
ke P
ark
New
gate
/Ear
l Ran
ch
ER
Pro
ject
s 19
97 -
2013
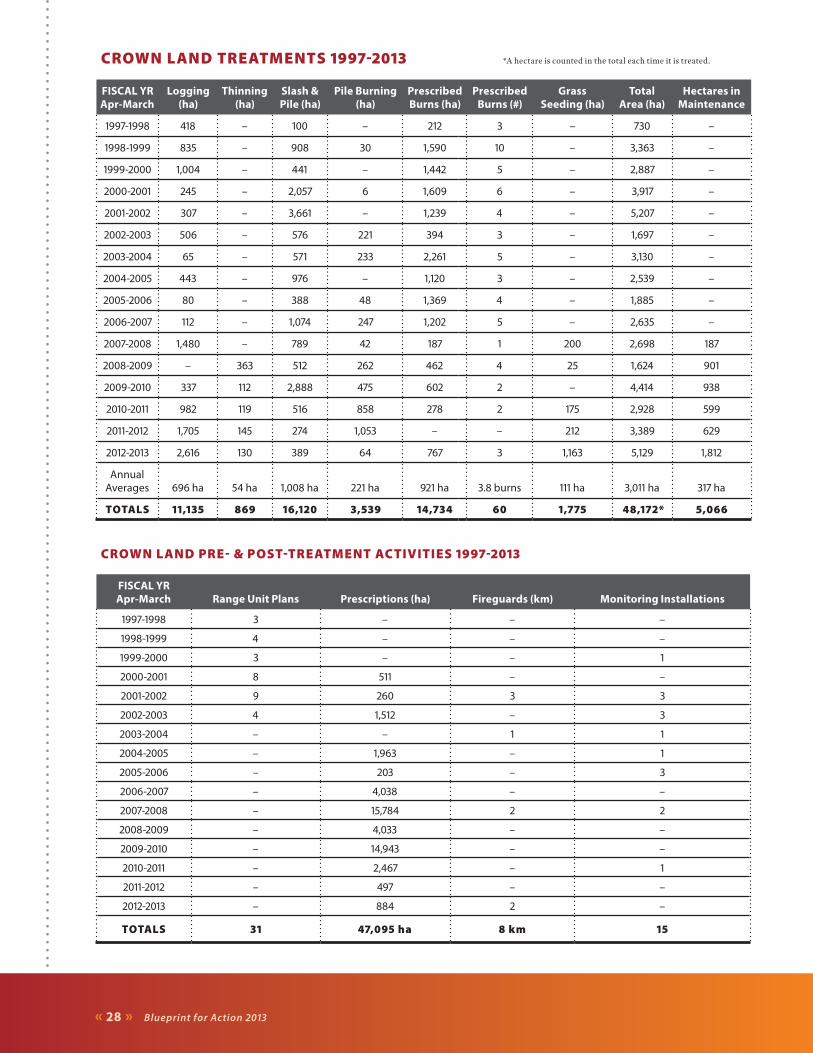
« 28 » Blueprint for Action 2013
CROWN LAND PRE- & POST-TREATMENT ACTIVITIES 1997-2013
FISCAL YR Apr-March Range Unit Plans Prescriptions (ha) Fireguards (km) Monitoring Installations
1997-1998 3 – – –
1998-1999 4 – – –
1999-2000 3 – – 1
2000-2001 8 511 – –
2001-2002 9 260 3 3
2002-2003 4 1,512 – 3
2003-2004 – – 1 1
2004-2005 – 1,963 – 1
2005-2006 – 203 – 3
2006-2007 – 4,038 – –
2007-2008 – 15,784 2 2
2008-2009 – 4,033 – –
2009-2010 – 14,943 – –
2010-2011 – 2,467 – 1
2011-2012 – 497 – –
2012-2013 – 884 2 –
TOTALS 31 47,095 ha 8 km 15
CROWN LAND TREATMENTS 1997-2013 *A hectare is counted in the total each time it is treated.
FISCAL YR Apr-March
Logging (ha)
Thinning(ha)
Slash &Pile (ha)
Pile Burning (ha)
Prescribed Burns (ha)
Prescribed Burns (#)
Grass Seeding (ha)
TotalArea (ha)
Hectares in Maintenance
1997-1998 418 – 100 – 212 3 – 730 –
1998-1999 835 – 908 30 1,590 10 – 3,363 –
1999-2000 1,004 – 441 – 1,442 5 – 2,887 –
2000-2001 245 – 2,057 6 1,609 6 – 3,917 –
2001-2002 307 – 3,661 – 1,239 4 – 5,207 –
2002-2003 506 – 576 221 394 3 – 1,697 –
2003-2004 65 – 571 233 2,261 5 – 3,130 –
2004-2005 443 – 976 – 1,120 3 – 2,539 –
2005-2006 80 – 388 48 1,369 4 – 1,885 –
2006-2007 112 – 1,074 247 1,202 5 – 2,635 –
2007-2008 1,480 – 789 42 187 1 200 2,698 187
2008-2009 – 363 512 262 462 4 25 1,624 901
2009-2010 337 112 2,888 475 602 2 – 4,414 938
2010-2011 982 119 516 858 278 2 175 2,928 599
2011-2012 1,705 145 274 1,053 – – 212 3,389 629
2012-2013 2,616 130 389 64 767 3 1,163 5,129 1,812
Annual Averages 696 ha 54 ha 1,008 ha 221 ha 921 ha 3.8 burns 111 ha 3,011 ha 317 ha
TOTALS 11,135 869 16,120 3,539 14,734 60 1,775 48,172* 5,066
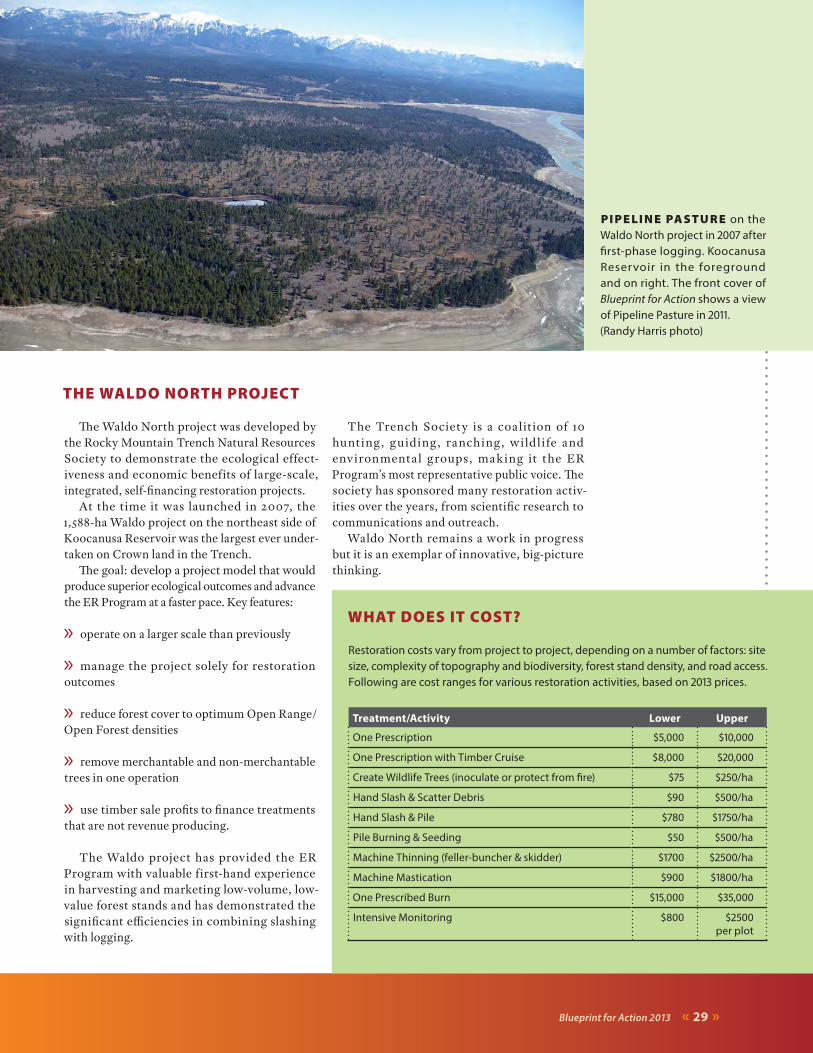
Blueprint for Action 2013 « 29 »
THE WALDO NORTH PROJECT
The Waldo North project was developed by the Rocky Mountain Trench Natural Resources Society to demonstrate the ecological effect-iveness and economic benefits of large-scale, integrated, self-financing restoration projects.
At the time it was launched in 2007, the 1,588-ha Waldo project on the northeast side of Koocanusa Reservoir was the largest ever under-taken on Crown land in the Trench.
The goal: develop a project model that would produce superior ecological outcomes and advance the ER Program at a faster pace. Key features:
» operate on a larger scale than previously
» manage the project solely for restoration outcomes
» reduce forest cover to optimum Open Range/Open Forest densities
» remove merchantable and non-merchantable trees in one operation
» use timber sale profits to finance treatments that are not revenue producing.
The Waldo project has provided the ER Program with valuable first-hand experience in harvesting and marketing low-volume, low-value forest stands and has demonstrated the significant efficiencies in combining slashing with logging.
The Trench Society is a coalition of 10 hunting, guiding, ranching, wildlife and environmental groups, mak ing it the ER Program’s most representative public voice. The society has sponsored many restoration activ-ities over the years, from scientific research to communications and outreach.
Waldo North remains a work in progress but it is an exemplar of innovative, big-picture thinking.
PI PE LI N E PA STU R E on the Waldo North project in 2007 after first-phase logging. Koocanusa Reservoir in the foreground and on right. The front cover of Blueprint for Action shows a view of Pipeline Pasture in 2011.(Randy Harris photo)
WHAT DOES IT COST?
Restoration costs vary from project to project, depending on a number of factors: site size, complexity of topography and biodiversity, forest stand density, and road access. Following are cost ranges for various restoration activities, based on 2013 prices.
Treatment/Activity Lower Upper
One Prescription $5,000 $10,000
One Prescription with Timber Cruise $8,000 $20,000
Create Wildlife Trees (inoculate or protect from fire) $75 $250/ha
Hand Slash & Scatter Debris $90 $500/ha
Hand Slash & Pile $780 $1750/ha
Pile Burning & Seeding $50 $500/ha
Machine Thinning (feller-buncher & skidder) $1700 $2500/ha
Machine Mastication $900 $1800/ha
One Prescribed Burn $15,000 $35,000
Intensive Monitoring $800 $2500 per plot
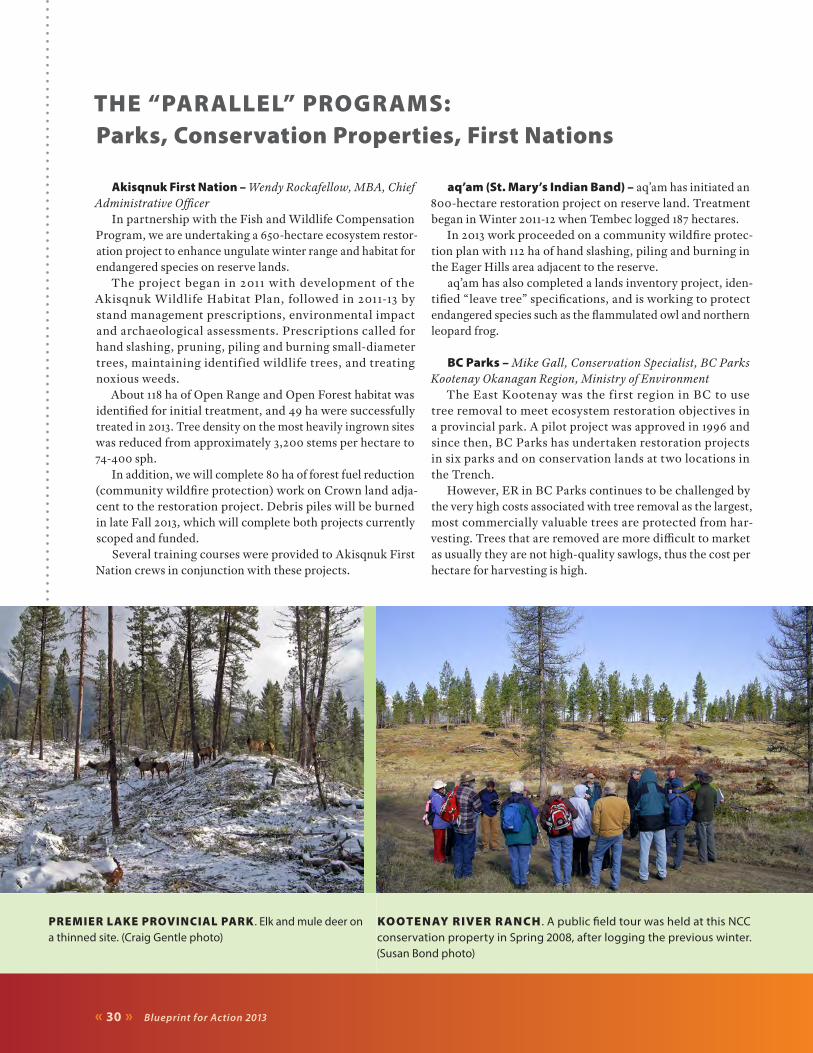
« 30 » Blueprint for Action 2013
THE “PARALLEL” PROGRAMS: Parks, Conservation Properties, First Nations
Akisqnuk First Nation – Wendy Rockafellow, MBA, Chief Administrative Officer
In partnership with the Fish and Wildlife Compensation Program, we are undertaking a 650-hectare ecosystem restor-ation project to enhance ungulate winter range and habitat for endangered species on reserve lands.
The project began in 2011 with development of the Akisqnuk Wildlife Habitat Plan, followed in 2011-13 by stand management prescriptions, environmental impact and archaeological assessments. Prescriptions called for hand slashing, pruning, piling and burning small-diameter trees, maintaining identified wildlife trees, and treating noxious weeds.
About 118 ha of Open Range and Open Forest habitat was identified for initial treatment, and 49 ha were successfully treated in 2013. Tree density on the most heavily ingrown sites was reduced from approximately 3,200 stems per hectare to 74-400 sph.
In addition, we will complete 80 ha of forest fuel reduction (community wildfire protection) work on Crown land adja-cent to the restoration project. Debris piles will be burned in late Fall 2013, which will complete both projects currently scoped and funded.
Several training courses were provided to Akisqnuk First Nation crews in conjunction with these projects.
aq’am (St. Mary’s Indian Band) – aq’am has initiated an 800-hectare restoration project on reserve land. Treatment began in Winter 2011-12 when Tembec logged 187 hectares.
In 2013 work proceeded on a community wildfire protec-tion plan with 112 ha of hand slashing, piling and burning in the Eager Hills area adjacent to the reserve.
aq’am has also completed a lands inventory project, iden-tified “leave tree” specifications, and is working to protect endangered species such as the flammulated owl and northern leopard frog.
BC Parks – Mike Gall, Conservation Specialist, BC Parks Kootenay Okanagan Region, Ministry of Environment
The East Kootenay was the f irst region in BC to use tree removal to meet ecosystem restoration objectives in a provincial park. A pilot project was approved in 1996 and since then, BC Parks has undertaken restoration projects in six parks and on conservation lands at two locations in the Trench.
However, ER in BC Parks continues to be challenged by the very high costs associated with tree removal as the largest, most commercially valuable trees are protected from har-vesting. Trees that are removed are more difficult to market as usually they are not high-quality sawlogs, thus the cost per hectare for harvesting is high.
PREMIER LAKE PROVINCIAL PARK . Elk and mule deer on a thinned site. (Craig Gentle photo)
KOOTENAY RIVER R ANCH . A public field tour was held at this NCC conservation property in Spring 2008, after logging the previous winter. (Susan Bond photo)
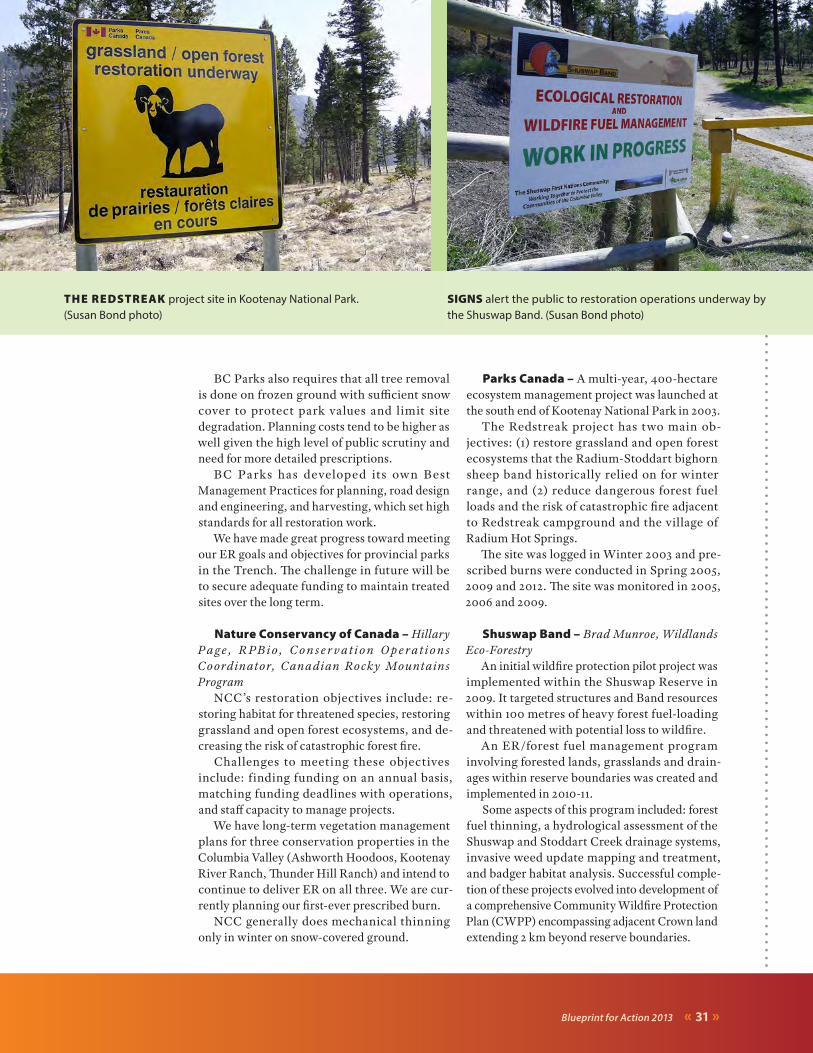
Blueprint for Action 2013 « 31 »
BC Parks also requires that all tree removal is done on frozen ground with sufficient snow cover to protect park values and limit site degradation. Planning costs tend to be higher as well given the high level of public scrutiny and need for more detailed prescriptions.
BC Parks has developed its own Best Management Practices for planning, road design and engineering, and harvesting, which set high standards for all restoration work.
We have made great progress toward meeting our ER goals and objectives for provincial parks in the Trench. The challenge in future will be to secure adequate funding to maintain treated sites over the long term.
Nature Conservancy of Canada – Hillary Page , R PB i o, Co n se r va t i o n O pe ra t i o n s Coordinator, Canadian Rocky Mountains Program
NCC’s restoration objectives include: re-storing habitat for threatened species, restoring grassland and open forest ecosystems, and de-creasing the risk of catastrophic forest fire.
Challenges to meeting these objectives include: finding funding on an annual basis, matching funding deadlines with operations, and staff capacity to manage projects.
We have long-term vegetation management plans for three conservation properties in the Columbia Valley (Ashworth Hoodoos, Kootenay River Ranch, Thunder Hill Ranch) and intend to continue to deliver ER on all three. We are cur-rently planning our first-ever prescribed burn.
NCC generally does mechanical thinning only in winter on snow-covered ground.
Parks Canada – A multi-year, 400-hectare ecosystem management project was launched at the south end of Kootenay National Park in 2003.
The Redstreak project has two main ob-jectives: (1) restore grassland and open forest ecosystems that the Radium-Stoddart bighorn sheep band historically relied on for winter range, and (2) reduce dangerous forest fuel loads and the risk of catastrophic fire adjacent to Redstreak campground and the village of Radium Hot Springs.
The site was logged in Winter 2003 and pre-scribed burns were conducted in Spring 2005, 2009 and 2012. The site was monitored in 2005, 2006 and 2009.
Shuswap Band – Brad Munroe, Wildlands Eco-Forestry
An initial wildfire protection pilot project was implemented within the Shuswap Reserve in 2009. It targeted structures and Band resources within 100 metres of heavy forest fuel-loading and threatened with potential loss to wildfire.
An ER/forest fuel management program involving forested lands, grasslands and drain-ages within reserve boundaries was created and implemented in 2010-11.
Some aspects of this program included: forest fuel thinning, a hydrological assessment of the Shuswap and Stoddart Creek drainage systems, invasive weed update mapping and treatment, and badger habitat analysis. Successful comple-tion of these projects evolved into development of a comprehensive Community Wildfire Protection Plan (CWPP) encompassing adjacent Crown land extending 2 km beyond reserve boundaries.
THE REDSTREAK project site in Kootenay National Park.(Susan Bond photo)
SIGNS alert the public to restoration operations underway by the Shuswap Band. (Susan Bond photo)
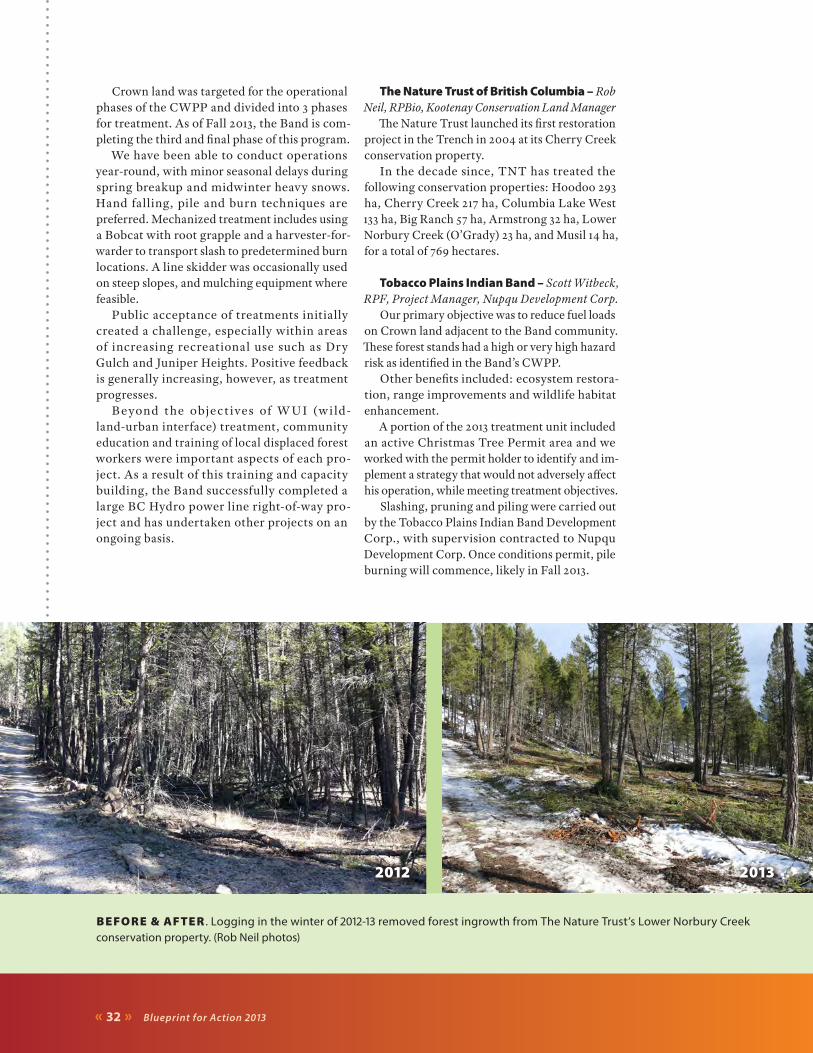
« 32 » Blueprint for Action 2013
Crown land was targeted for the operational phases of the CWPP and divided into 3 phases for treatment. As of Fall 2013, the Band is com-pleting the third and final phase of this program.
We have been able to conduct operations year-round, with minor seasonal delays during spring breakup and midwinter heavy snows. Hand falling, pile and burn techniques are preferred. Mechanized treatment includes using a Bobcat with root grapple and a harvester-for-warder to transport slash to predetermined burn locations. A line skidder was occasionally used on steep slopes, and mulching equipment where feasible.
Public acceptance of treatments initially created a challenge, especially within areas of increasing recreational use such as Dry Gulch and Juniper Heights. Positive feedback is generally increasing, however, as treatment progresses.
Beyond the object ives of W U I (w i ld-land-urban interface) treatment, community education and training of local displaced forest workers were important aspects of each pro-ject. As a result of this training and capacity building, the Band successfully completed a large BC Hydro power line right-of-way pro-ject and has undertaken other projects on an ongoing basis.
The Nature Trust of British Columbia – Rob Neil, RPBio, Kootenay Conservation Land Manager
The Nature Trust launched its first restoration project in the Trench in 2004 at its Cherry Creek conservation property.
In the decade since, TNT has treated the following conservation properties: Hoodoo 293 ha, Cherry Creek 217 ha, Columbia Lake West 133 ha, Big Ranch 57 ha, Armstrong 32 ha, Lower Norbury Creek (O’Grady) 23 ha, and Musil 14 ha, for a total of 769 hectares.
Tobacco Plains Indian Band – Scott Witbeck, RPF, Project Manager, Nupqu Development Corp.
Our primary objective was to reduce fuel loads on Crown land adjacent to the Band community. These forest stands had a high or very high hazard risk as identified in the Band’s CWPP.
Other benefits included: ecosystem restora-tion, range improvements and wildlife habitat enhancement.
A portion of the 2013 treatment unit included an active Christmas Tree Permit area and we worked with the permit holder to identify and im-plement a strategy that would not adversely affect his operation, while meeting treatment objectives.
Slashing, pruning and piling were carried out by the Tobacco Plains Indian Band Development Corp., with supervision contracted to Nupqu Development Corp. Once conditions permit, pile burning will commence, likely in Fall 2013.
BEFORE & AFTER . Logging in the winter of 2012-13 removed forest ingrowth from The Nature Trust’s Lower Norbury Creek conservation property. (Rob Neil photos)
2012 2013
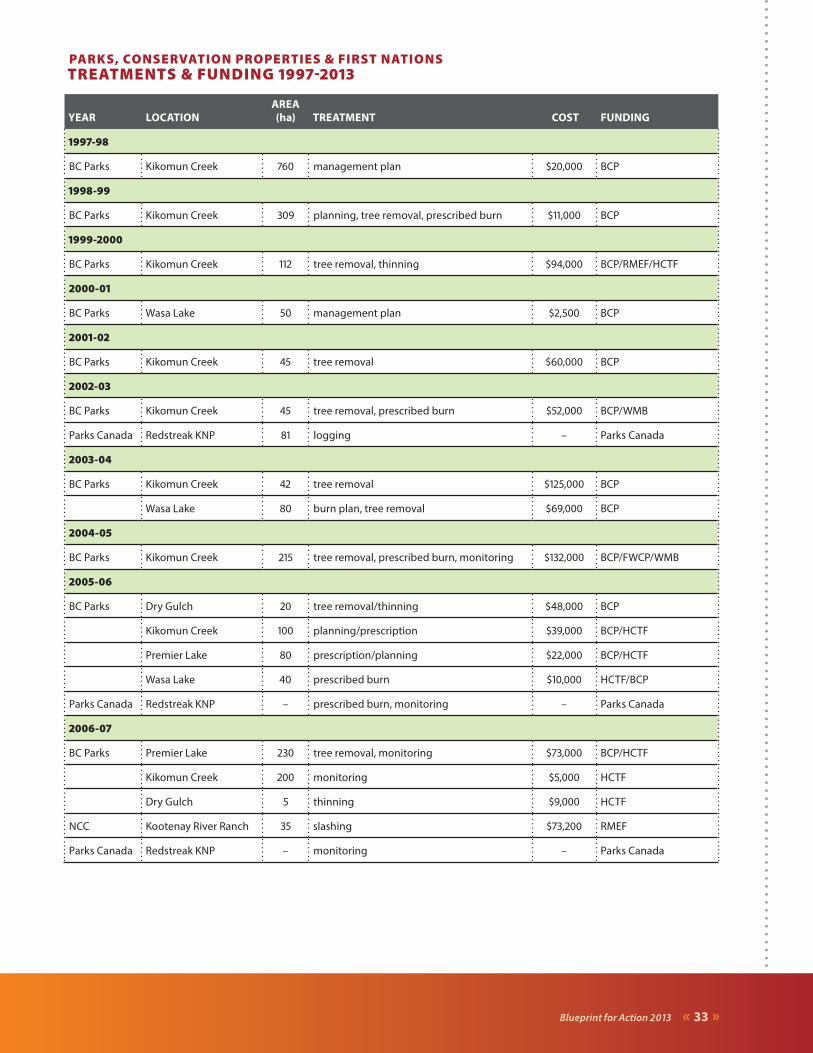
Blueprint for Action 2013 « 33 »
PARKS, CONSERVATION PROPERTIES & FIRST NATIONSTREATMENTS & FUNDING 1997-2013
YEAR LOCATIONAREA (ha) TREATMENT COST FUNDING
1997-98
BC Parks Kikomun Creek 760 management plan $20,000 BCP
1998-99
BC Parks Kikomun Creek 309 planning, tree removal, prescribed burn $11,000 BCP
1999-2000
BC Parks Kikomun Creek 112 tree removal, thinning $94,000 BCP/RMEF/HCTF
2000-01
BC Parks Wasa Lake 50 management plan $2,500 BCP
2001-02
BC Parks Kikomun Creek 45 tree removal $60,000 BCP
2002-03
BC Parks Kikomun Creek 45 tree removal, prescribed burn $52,000 BCP/WMB
Parks Canada Redstreak KNP 81 logging – Parks Canada
2003-04
BC Parks Kikomun Creek 42 tree removal $125,000 BCP
Wasa Lake 80 burn plan, tree removal $69,000 BCP
2004-05
BC Parks Kikomun Creek 215 tree removal, prescribed burn, monitoring $132,000 BCP/FWCP/WMB
2005-06
BC Parks Dry Gulch 20 tree removal/thinning $48,000 BCP
Kikomun Creek 100 planning/prescription $39,000 BCP/HCTF
Premier Lake 80 prescription/planning $22,000 BCP/HCTF
Wasa Lake 40 prescribed burn $10,000 HCTF/BCP
Parks Canada Redstreak KNP – prescribed burn, monitoring – Parks Canada
2006-07
BC Parks Premier Lake 230 tree removal, monitoring $73,000 BCP/HCTF
Kikomun Creek 200 monitoring $5,000 HCTF
Dry Gulch 5 thinning $9,000 HCTF
NCC Kootenay River Ranch 35 slashing $73,200 RMEF
Parks Canada Redstreak KNP – monitoring – Parks Canada

« 34 » Blueprint for Action 2013
YEAR LOCATIONAREA (ha) TREATMENT COST FUNDING
2007-08
BC Parks Premier Lake 140 prescription, planning, tree removal $432,000 BCP/ HCTF
Moyie Lake 20 tree removal $80,000 BCP
Kikomun 23 thinning/mastication $52,000 BCP/ HCTF
NCC Kootenay River Ranch 35 pile slash $30,000 RMEF
2008-09
BC Parks Kikomun Creek 90 prescribed burn, monitoring $62,500 HCTF
Premier Lake 90 tree removal, burn plan $237,350 BCP/ HCTF
Wycliffe Corridor CL 80 prescription $8,200 HCTF
Newgate/Earl Ranch CL 100 prescription $6,000 HCTF
NCC Kootenay River Ranch 23 slash & pile
43 burn slash piles
50 rehab burn piles $83,000 RMEF/BCTPL
Pine Butte Ranch 22 trees create wildlife trees $10,371 FWCP
2009-10
BC Parks Premier Lake 157 burn plan, thinnning/salvage, tree removal $272,500 HCTF/BCP/JOP/LBI
Kikomun Creek 35 thinning $90,000 JOP/LBI
NCC Kootenay River Ranch 87 slash & pile $62,385 CBT/JOP
Thunder Hill Ranch 48 slash & pile in-kind JOP
19 trees create wildlife trees $12,500 CBT
Parks Canada Redstreak KNP 100 prescribed burn $65,000 Parks Canada
– monitoring – Parks Canada
Shuswap Reserve ~35 planning/forest thinning $99,500 NRC/SB
2010-11
BC Parks Premier Lake 60 prescribed burn, tree removal $144,000 HCTF/BCP
Moyie Lake 20 tree removal $32,000 BCP
NCC Kootenay River Ranch 28 mastication $36,257 CBT
Thunder Hill Ranch 40 burn slash piles $38,100 RDEK/CBT
Shuswap Reserve ~350 forest thinning/ER $2 million CAF/SB
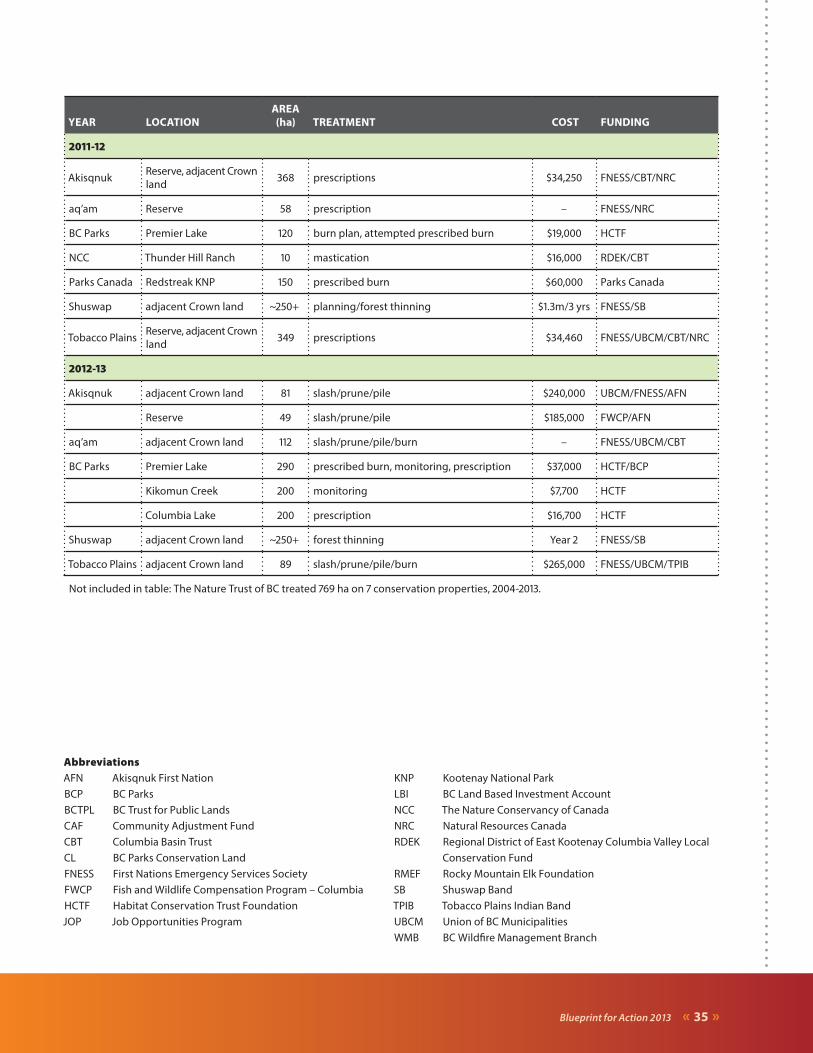
Blueprint for Action 2013 « 35 »
AbbreviationsAFN Akisqnuk First Nation KNP Kootenay National ParkBCP BC Parks LBI BC Land Based Investment AccountBCTPL BC Trust for Public Lands NCC The Nature Conservancy of CanadaCAF Community Adjustment Fund NRC Natural Resources CanadaCBT Columbia Basin Trust RDEK Regional District of East Kootenay Columbia Valley Local
Conservation FundCL BC Parks Conservation LandFNESS First Nations Emergency Services Society RMEF Rocky Mountain Elk FoundationFWCP Fish and Wildlife Compensation Program – Columbia SB Shuswap BandHCTF Habitat Conservation Trust Foundation TPIB Tobacco Plains Indian BandJOP Job Opportunities Program UBCM Union of BC Municipalities
WMB BC Wildfire Management Branch
YEAR LOCATIONAREA (ha) TREATMENT COST FUNDING
2011-12
Akisqnuk Reserve, adjacent Crown land 368 prescriptions $34,250 FNESS/CBT/NRC
aq’am Reserve 58 prescription – FNESS/NRC
BC Parks Premier Lake 120 burn plan, attempted prescribed burn $19,000 HCTF
NCC Thunder Hill Ranch 10 mastication $16,000 RDEK/CBT
Parks Canada Redstreak KNP 150 prescribed burn $60,000 Parks Canada
Shuswap adjacent Crown land ~250+ planning/forest thinning $1.3m/3 yrs FNESS/SB
Tobacco Plains Reserve, adjacent Crown land 349 prescriptions $34,460 FNESS/UBCM/CBT/NRC
2012-13
Akisqnuk adjacent Crown land 81 slash/prune/pile $240,000 UBCM/FNESS/AFN
Reserve 49 slash/prune/pile $185,000 FWCP/AFN
aq’am adjacent Crown land 112 slash/prune/pile/burn – FNESS/UBCM/CBT
BC Parks Premier Lake 290 prescribed burn, monitoring, prescription $37,000 HCTF/BCP
Kikomun Creek 200 monitoring $7,700 HCTF
Columbia Lake 200 prescription $16,700 HCTF
Shuswap adjacent Crown land ~250+ forest thinning Year 2 FNESS/SB
Tobacco Plains adjacent Crown land 89 slash/prune/pile/burn $265,000 FNESS/UBCM/TPIB
Not included in table: The Nature Trust of BC treated 769 ha on 7 conservation properties, 2004-2013.
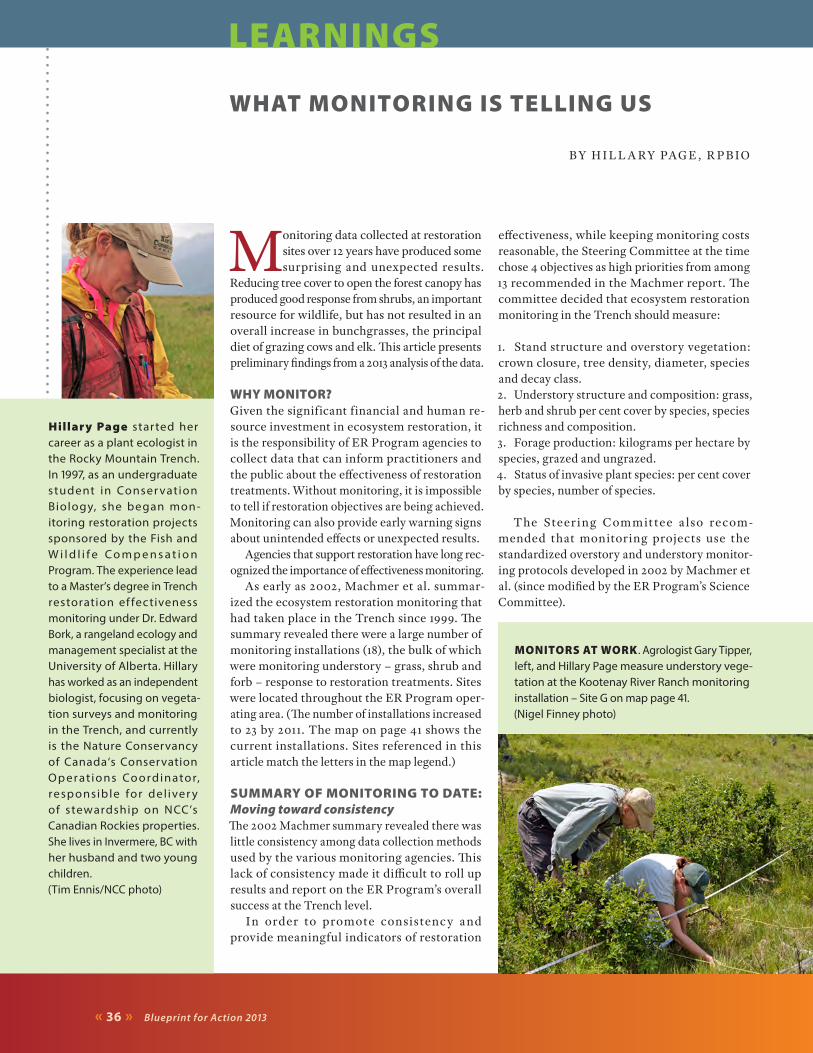
« 36 » Blueprint for Action 2013
LEARNINGS
WHAT MONITORING IS TELLING US
BY H I L L A RY PAG E , R PBIO
Monitoring data collected at restoration sites over 12 years have produced some surprising and unexpected results.
Reducing tree cover to open the forest canopy has produced good response from shrubs, an important resource for wildlife, but has not resulted in an overall increase in bunchgrasses, the principal diet of grazing cows and elk. This article presents preliminary findings from a 2013 analysis of the data.
WHY MONITOR?Given the significant financial and human re-source investment in ecosystem restoration, it is the responsibility of ER Program agencies to collect data that can inform practitioners and the public about the effectiveness of restoration treatments. Without monitoring, it is impossible to tell if restoration objectives are being achieved. Monitoring can also provide early warning signs about unintended effects or unexpected results.
Agencies that support restoration have long rec-ognized the importance of effectiveness monitoring.
As early as 2002, Machmer et al. summar-ized the ecosystem restoration monitoring that had taken place in the Trench since 1999. The summary revealed there were a large number of monitoring installations (18), the bulk of which were monitoring understory – grass, shrub and forb – response to restoration treatments. Sites were located throughout the ER Program oper-ating area. (The number of installations increased to 23 by 2011. The map on page 41 shows the current installations. Sites referenced in this article match the letters in the map legend.)
SUMMARY OF MONITORING TO DATE: Moving toward consistencyThe 2002 Machmer summary revealed there was little consistency among data collection methods used by the various monitoring agencies. This lack of consistency made it difficult to roll up results and report on the ER Program’s overall success at the Trench level.
In order to promote consistenc y and provide meaningful indicators of restoration
effectiveness, while keeping monitoring costs reasonable, the Steering Committee at the time chose 4 objectives as high priorities from among 13 recommended in the Machmer report. The committee decided that ecosystem restoration monitoring in the Trench should measure:
1. Stand structure and overstory vegetation: crown closure, tree density, diameter, species and decay class.2. Understory structure and composition: grass, herb and shrub per cent cover by species, species richness and composition.3. Forage production: kilograms per hectare by species, grazed and ungrazed.4. Status of invasive plant species: per cent cover by species, number of species.
The Steer ing Committee a lso recom-mended that monitoring projects use the standardized overstory and understory monitor-ing protocols developed in 2002 by Machmer et al. (since modified by the ER Program’s Science Committee).
Hillary Page started her career as a plant ecologist in the Rocky Mountain Trench. In 1997, as an undergraduate student in Conser vation Biology, she began mon-itoring restoration projects sponsored by the Fish and W i l d l i f e C o m p e n s a t i o n Program. The experience lead to a Master’s degree in Trench restoration ef fectiveness monitoring under Dr. Edward Bork, a rangeland ecology and management specialist at the University of Alberta. Hillary has worked as an independent biologist, focusing on vegeta-tion surveys and monitoring in the Trench, and currently is the Nature Conservancy of Canada‘s Conservation Op erat ions Co ordinator, responsible for del iver y of stewardship on NCC’s Canadian Rockies properties. She lives in Invermere, BC with her husband and two young children.(Tim Ennis/NCC photo)
MONITORS AT WORK . Agrologist Gary Tipper, left, and Hillary Page measure understory vege-tation at the Kootenay River Ranch monitoring installation – Site G on map page 41.(Nigel Finney photo)
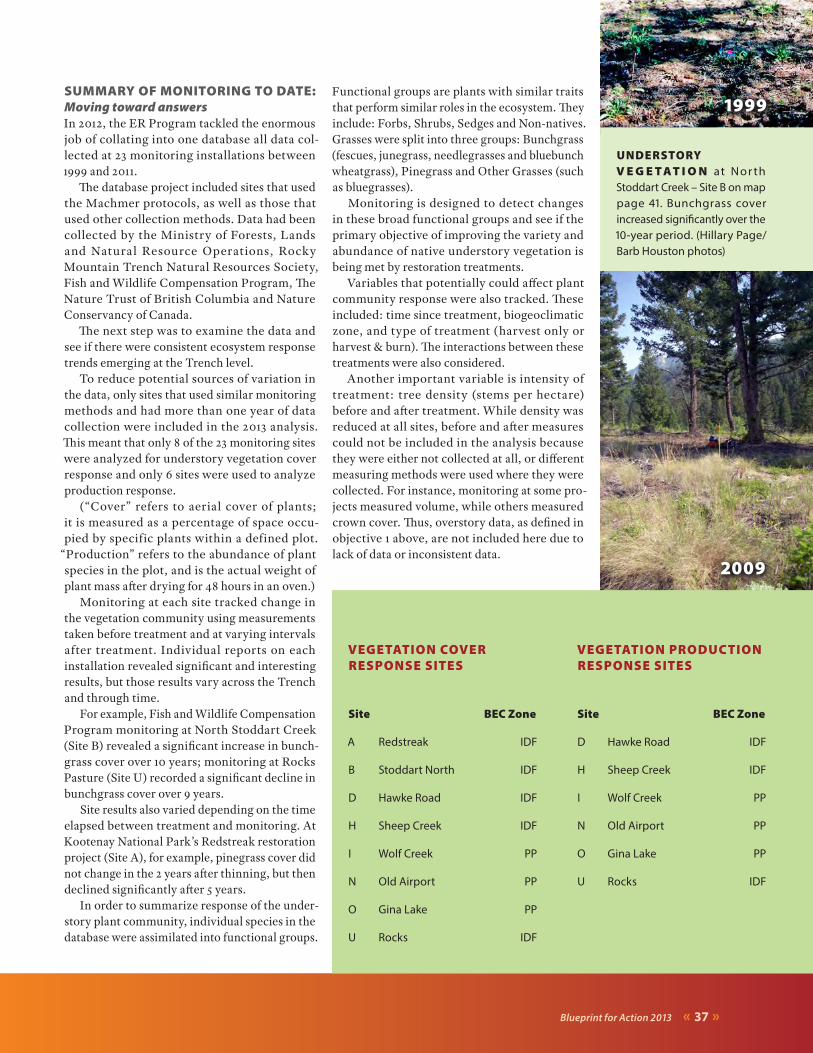
Blueprint for Action 2013 « 37 »
UNDERSTORY V E G E T A T I O N at Nor th Stoddart Creek – Site B on map page 41. Bunchgrass cover increased significantly over the 10-year period. (Hillary Page/Barb Houston photos)
2009
1999SUMMARY OF MONITORING TO DATE: Moving toward answersIn 2012, the ER Program tackled the enormous job of collating into one database all data col-lected at 23 monitoring installations between 1999 and 2011.
The database project included sites that used the Machmer protocols, as well as those that used other collection methods. Data had been collected by the Ministry of Forests, Lands and Natural Resource Operations, Rocky Mountain Trench Natural Resources Society, Fish and Wildlife Compensation Program, The Nature Trust of British Columbia and Nature Conservancy of Canada.
The next step was to examine the data and see if there were consistent ecosystem response trends emerging at the Trench level.
To reduce potential sources of variation in the data, only sites that used similar monitoring methods and had more than one year of data collection were included in the 2013 analysis. This meant that only 8 of the 23 monitoring sites were analyzed for understory vegetation cover response and only 6 sites were used to analyze production response.
(“Cover” refers to aerial cover of plants; it is measured as a percentage of space occu-pied by specific plants within a defined plot.
“Production” refers to the abundance of plant species in the plot, and is the actual weight of plant mass after drying for 48 hours in an oven.)
Monitoring at each site tracked change in the vegetation community using measurements taken before treatment and at varying intervals after treatment. Individual reports on each installation revealed significant and interesting results, but those results vary across the Trench and through time.
For example, Fish and Wildlife Compensation Program monitoring at North Stoddart Creek (Site B) revealed a significant increase in bunch-grass cover over 10 years; monitoring at Rocks Pasture (Site U) recorded a significant decline in bunchgrass cover over 9 years.
Site results also varied depending on the time elapsed between treatment and monitoring. At Kootenay National Park’s Redstreak restoration project (Site A), for example, pinegrass cover did not change in the 2 years after thinning, but then declined significantly after 5 years.
In order to summarize response of the under-story plant community, individual species in the database were assimilated into functional groups.
Functional groups are plants with similar traits that perform similar roles in the ecosystem. They include: Forbs, Shrubs, Sedges and Non-natives. Grasses were split into three groups: Bunchgrass (fescues, junegrass, needlegrasses and bluebunch wheatgrass), Pinegrass and Other Grasses (such as bluegrasses).
Monitoring is designed to detect changes in these broad functional groups and see if the primary objective of improving the variety and abundance of native understory vegetation is being met by restoration treatments.
Variables that potentially could affect plant community response were also tracked. These included: time since treatment, biogeoclimatic zone, and type of treatment (harvest only or harvest & burn). The interactions between these treatments were also considered.
Another important variable is intensity of treatment: tree density (stems per hectare) before and after treatment. While density was reduced at all sites, before and after measures could not be included in the analysis because they were either not collected at all, or different measuring methods were used where they were collected. For instance, monitoring at some pro-jects measured volume, while others measured crown cover. Thus, overstory data, as defined in objective 1 above, are not included here due to lack of data or inconsistent data.
VEGETATION COVER RESPONSE SITES
Site BEC Zone
A Redstreak IDF
B Stoddart North IDF
D Hawke Road IDF
H Sheep Creek IDF
I Wolf Creek PP
N Old Airport PP
O Gina Lake PP
U Rocks IDF
VEGETATION PRODUCTION RESPONSE SITES
Site BEC Zone
D Hawke Road IDF
H Sheep Creek IDF
I Wolf Creek PP
N Old Airport PP
O Gina Lake PP
U Rocks IDF
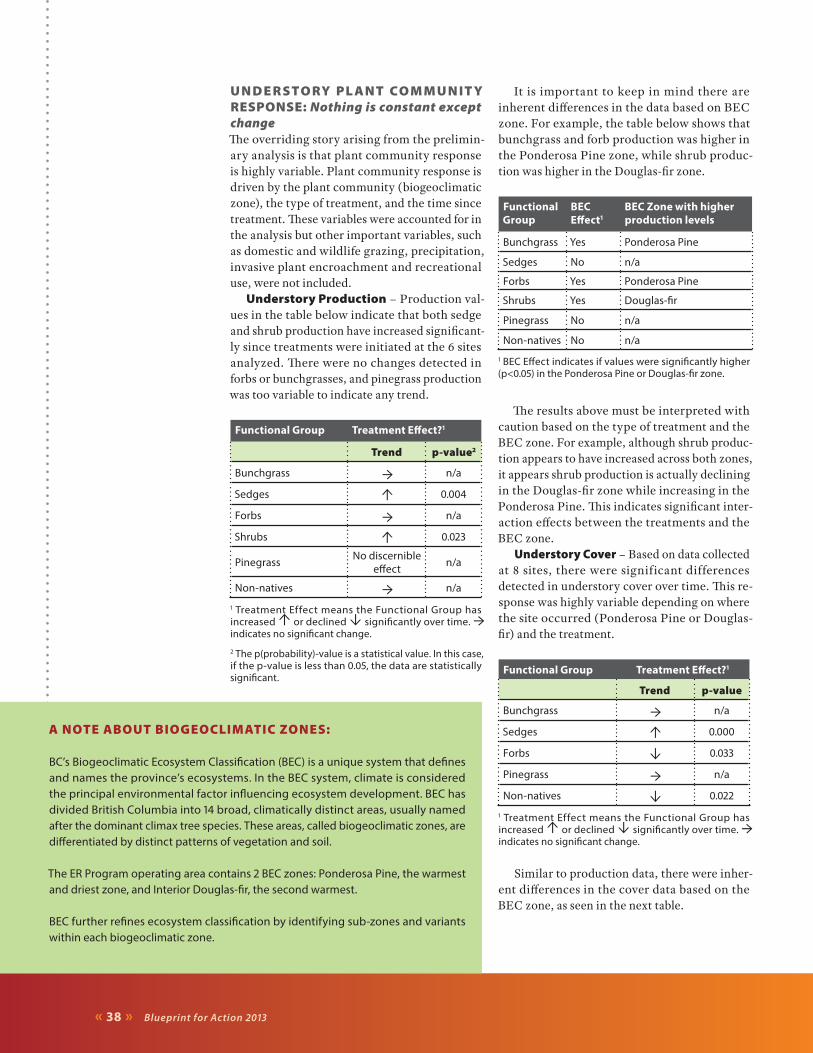
« 38 » Blueprint for Action 2013
U N D E R STO RY PL ANT CO M M U N IT Y RESPONSE: Nothing is constant except changeThe overriding story arising from the prelimin-ary analysis is that plant community response is highly variable. Plant community response is driven by the plant community (biogeoclimatic zone), the type of treatment, and the time since treatment. These variables were accounted for in the analysis but other important variables, such as domestic and wildlife grazing, precipitation, invasive plant encroachment and recreational use, were not included.
Understory Production – Production val-ues in the table below indicate that both sedge and shrub production have increased significant-ly since treatments were initiated at the 6 sites analyzed. There were no changes detected in forbs or bunchgrasses, and pinegrass production was too variable to indicate any trend.
Functional Group Treatment Effect?1
Trend p-value2
Bunchgrass → n/a
Sedges ↑ 0.004
Forbs → n/a
Shrubs ↑ 0.023
Pinegrass No discernible effect n/a
Non-natives → n/a
1 Treatment Effect means the Functional Group has increased ↑ or declined ↓ significantly over time. → indicates no significant change.
2 The p(probability)-value is a statistical value. In this case, if the p-value is less than 0.05, the data are statistically significant.
It is important to keep in mind there are inherent differences in the data based on BEC zone. For example, the table below shows that bunchgrass and forb production was higher in the Ponderosa Pine zone, while shrub produc-tion was higher in the Douglas-fir zone.
Functional Group
BEC Effect1
BEC Zone with higher production levels
Bunchgrass Yes Ponderosa Pine
Sedges No n/a
Forbs Yes Ponderosa Pine
Shrubs Yes Douglas-fir
Pinegrass No n/a
Non-natives No n/a
1 BEC Effect indicates if values were significantly higher (p<0.05) in the Ponderosa Pine or Douglas-fir zone.
The results above must be interpreted with caution based on the type of treatment and the BEC zone. For example, although shrub produc-tion appears to have increased across both zones, it appears shrub production is actually declining in the Douglas-fir zone while increasing in the Ponderosa Pine. This indicates significant inter-action effects between the treatments and the BEC zone.
Understory Cover – Based on data collected at 8 sites, there were significant differences detected in understory cover over time. This re-sponse was highly variable depending on where the site occurred (Ponderosa Pine or Douglas-fir) and the treatment.
Functional Group Treatment Effect?1
Trend p-value
Bunchgrass → n/a
Sedges ↑ 0.000
Forbs ↓ 0.033
Pinegrass → n/a
Non-natives ↓ 0.022
1 Treatment Effect means the Functional Group has increased ↑ or declined ↓ significantly over time. → indicates no significant change.
Similar to production data, there were inher-ent differences in the cover data based on the BEC zone, as seen in the next table.
A NOTE ABOUT BIOGEOCLIMATIC ZONES:
BC’s Biogeoclimatic Ecosystem Classification (BEC) is a unique system that defines and names the province’s ecosystems. In the BEC system, climate is considered the principal environmental factor influencing ecosystem development. BEC has divided British Columbia into 14 broad, climatically distinct areas, usually named after the dominant climax tree species. These areas, called biogeoclimatic zones, are differentiated by distinct patterns of vegetation and soil.
The ER Program operating area contains 2 BEC zones: Ponderosa Pine, the warmest and driest zone, and Interior Douglas-fir, the second warmest.
BEC further refines ecosystem classification by identifying sub-zones and variants within each biogeoclimatic zone.
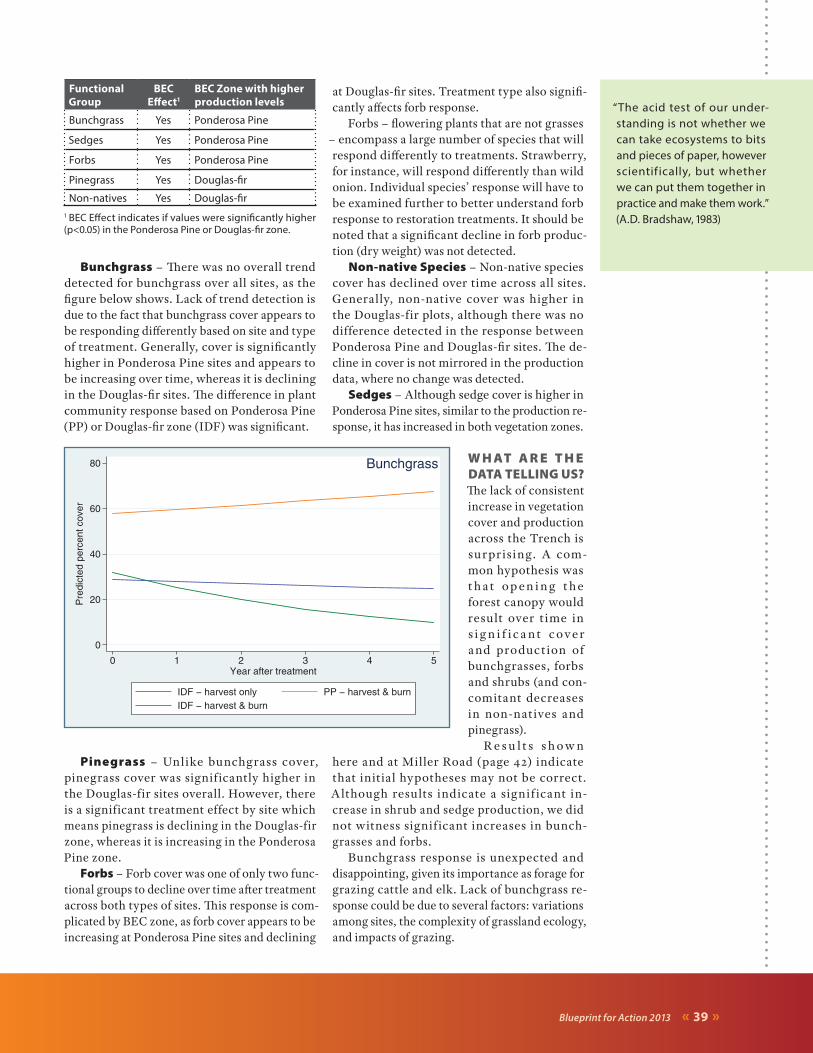
Blueprint for Action 2013 « 39 »
Functional Group
BEC Effect1
BEC Zone with higher production levels
Bunchgrass Yes Ponderosa Pine
Sedges Yes Ponderosa Pine
Forbs Yes Ponderosa Pine
Pinegrass Yes Douglas-fir
Non-natives Yes Douglas-fir1 BEC Effect indicates if values were significantly higher (p<0.05) in the Ponderosa Pine or Douglas-fir zone.
Bunchgrass – There was no overall trend detected for bunchgrass over all sites, as the figure below shows. Lack of trend detection is due to the fact that bunchgrass cover appears to be responding differently based on site and type of treatment. Generally, cover is significantly higher in Ponderosa Pine sites and appears to be increasing over time, whereas it is declining in the Douglas-fir sites. The difference in plant community response based on Ponderosa Pine (PP) or Douglas-fir zone (IDF) was significant.
0
20
40
60
80
Pre
dict
ed p
erce
nt c
over
0 1 2 3 4 5Year after treatment
IDF − harvest only PP − harvest & burnIDF − harvest & burn
Bunchgrass
Pinegrass – Unlike bunchgrass cover, pinegrass cover was signif icantly higher in the Douglas-fir sites overall. However, there is a significant treatment effect by site which means pinegrass is declining in the Douglas-fir zone, whereas it is increasing in the Ponderosa Pine zone.
Forbs – Forb cover was one of only two func-tional groups to decline over time after treatment across both types of sites. This response is com-plicated by BEC zone, as forb cover appears to be increasing at Ponderosa Pine sites and declining
at Douglas-fir sites. Treatment type also signifi-cantly affects forb response.
Forbs – flowering plants that are not grasses – encompass a large number of species that will respond differently to treatments. Strawberry, for instance, will respond differently than wild onion. Individual species’ response will have to be examined further to better understand forb response to restoration treatments. It should be noted that a significant decline in forb produc-tion (dry weight) was not detected.
Non-native Species – Non-native species cover has declined over time across all sites. Generally, non-native cover was higher in the Douglas-fir plots, although there was no difference detected in the response between Ponderosa Pine and Douglas-fir sites. The de-cline in cover is not mirrored in the production data, where no change was detected.
Sedges – Although sedge cover is higher in Ponderosa Pine sites, similar to the production re-sponse, it has increased in both vegetation zones.
W H AT A R E T H E DATA TELLING US?The lack of consistent increase in vegetation cover and production across the Trench is surpr ising. A com-mon hypothesis was t h a t o p e n i n g t h e forest canopy would result over t ime in s i g n i f i c a n t c o v e r and product ion of bunchgrasses, forbs and shrubs (and con-comitant decreases in non-natives and pinegrass).
R e s u l t s s h o w n here and at Miller Road (page 42) indicate that initial hypotheses may not be correct. Although results indicate a signif icant in-crease in shrub and sedge production, we did not witness signif icant increases in bunch-grasses and forbs.
Bunchgrass response is unexpected and disappointing, given its importance as forage for grazing cattle and elk. Lack of bunchgrass re-sponse could be due to several factors: variations among sites, the complexity of grassland ecology, and impacts of grazing.
“The acid test of our under-standing is not whether we can take ecosystems to bits and pieces of paper, however scientif ically, but whether we can put them together in practice and make them work.” (A.D. Bradshaw, 1983)
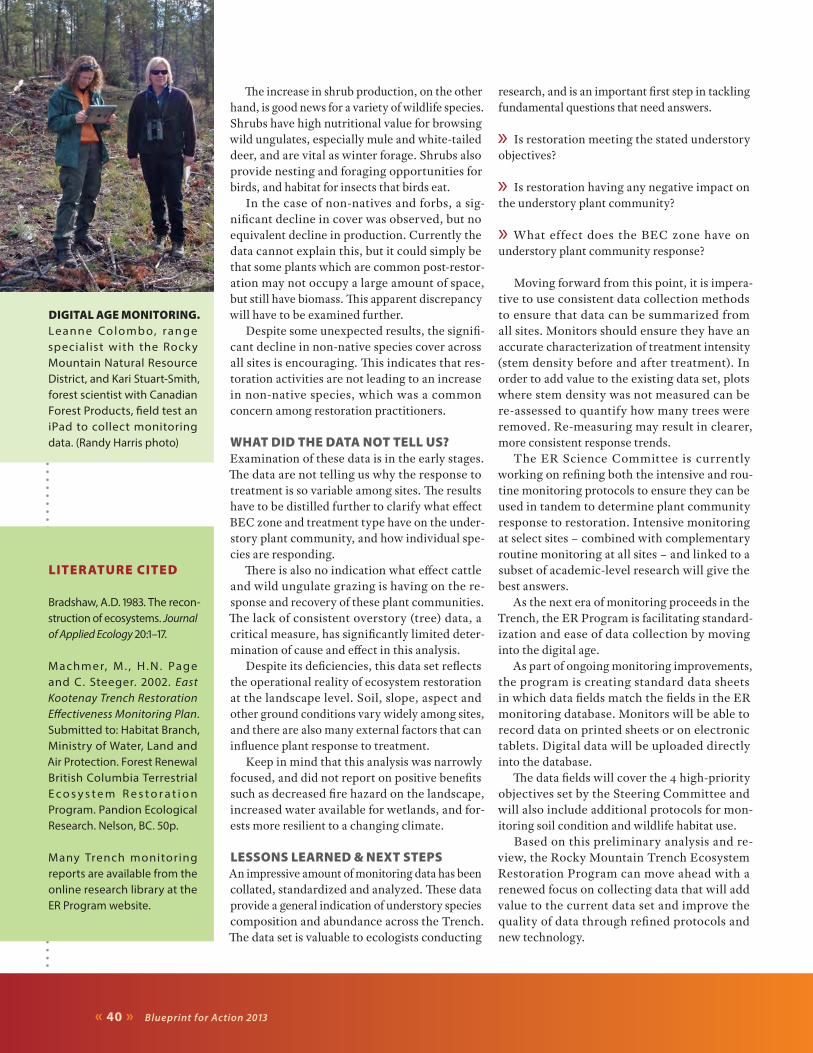
« 40 » Blueprint for Action 2013
The increase in shrub production, on the other hand, is good news for a variety of wildlife species. Shrubs have high nutritional value for browsing wild ungulates, especially mule and white-tailed deer, and are vital as winter forage. Shrubs also provide nesting and foraging opportunities for birds, and habitat for insects that birds eat.
In the case of non-natives and forbs, a sig-nificant decline in cover was observed, but no equivalent decline in production. Currently the data cannot explain this, but it could simply be that some plants which are common post-restor-ation may not occupy a large amount of space, but still have biomass. This apparent discrepancy will have to be examined further.
Despite some unexpected results, the signifi-cant decline in non-native species cover across all sites is encouraging. This indicates that res-toration activities are not leading to an increase in non-native species, which was a common concern among restoration practitioners.
WHAT DID THE DATA NOT TELL US?Examination of these data is in the early stages. The data are not telling us why the response to treatment is so variable among sites. The results have to be distilled further to clarify what effect BEC zone and treatment type have on the under-story plant community, and how individual spe-cies are responding.
There is also no indication what effect cattle and wild ungulate grazing is having on the re-sponse and recovery of these plant communities. The lack of consistent overstory (tree) data, a critical measure, has significantly limited deter-mination of cause and effect in this analysis.
Despite its deficiencies, this data set reflects the operational reality of ecosystem restoration at the landscape level. Soil, slope, aspect and other ground conditions vary widely among sites, and there are also many external factors that can influence plant response to treatment.
Keep in mind that this analysis was narrowly focused, and did not report on positive benefits such as decreased fire hazard on the landscape, increased water available for wetlands, and for-ests more resilient to a changing climate.
LESSONS LEARNED & NEXT STEPSAn impressive amount of monitoring data has been collated, standardized and analyzed. These data provide a general indication of understory species composition and abundance across the Trench. The data set is valuable to ecologists conducting
research, and is an important first step in tackling fundamental questions that need answers.
» Is restoration meeting the stated understory objectives?
» Is restoration having any negative impact on the understory plant community?
» What effect does the BEC zone have on understory plant community response?
Moving forward from this point, it is impera-tive to use consistent data collection methods to ensure that data can be summarized from all sites. Monitors should ensure they have an accurate characterization of treatment intensity (stem density before and after treatment). In order to add value to the existing data set, plots where stem density was not measured can be re-assessed to quantify how many trees were removed. Re-measuring may result in clearer, more consistent response trends.
The ER Science Committee is currently working on refining both the intensive and rou-tine monitoring protocols to ensure they can be used in tandem to determine plant community response to restoration. Intensive monitoring at select sites – combined with complementary routine monitoring at all sites – and linked to a subset of academic-level research will give the best answers.
As the next era of monitoring proceeds in the Trench, the ER Program is facilitating standard-ization and ease of data collection by moving into the digital age.
As part of ongoing monitoring improvements, the program is creating standard data sheets in which data fields match the fields in the ER monitoring database. Monitors will be able to record data on printed sheets or on electronic tablets. Digital data will be uploaded directly into the database.
The data fields will cover the 4 high-priority objectives set by the Steering Committee and will also include additional protocols for mon-itoring soil condition and wildlife habitat use.
Based on this preliminary analysis and re-view, the Rocky Mountain Trench Ecosystem Restoration Program can move ahead with a renewed focus on collecting data that will add value to the current data set and improve the quality of data through refined protocols and new technology.
LITERATURE CITED
Bradshaw, A.D. 1983. The recon-struction of ecosystems. Journal of Applied Ecology 20:1–17.
Machmer, M . , H . N . Page and C. Steeger. 2002. East Kootenay Trench Restoration Effectiveness Monitoring Plan. Submitted to: Habitat Branch, Ministry of Water, Land and Air Protection. Forest Renewal British Columbia Terrestrial E c o s y s t e m R e s t o r a t i o n Program. Pandion Ecological Research. Nelson, BC. 50p.
Many Trench monitoring reports are available from the online research library at the ER Program website.
DIGITAL AGE MONITORING. Leanne Colombo, range specialist with the Rocky Mountain Natural Resource District, and Kari Stuart-Smith, forest scientist with Canadian Forest Products, field test an iPad to collect monitoring data. (Randy Harris photo)
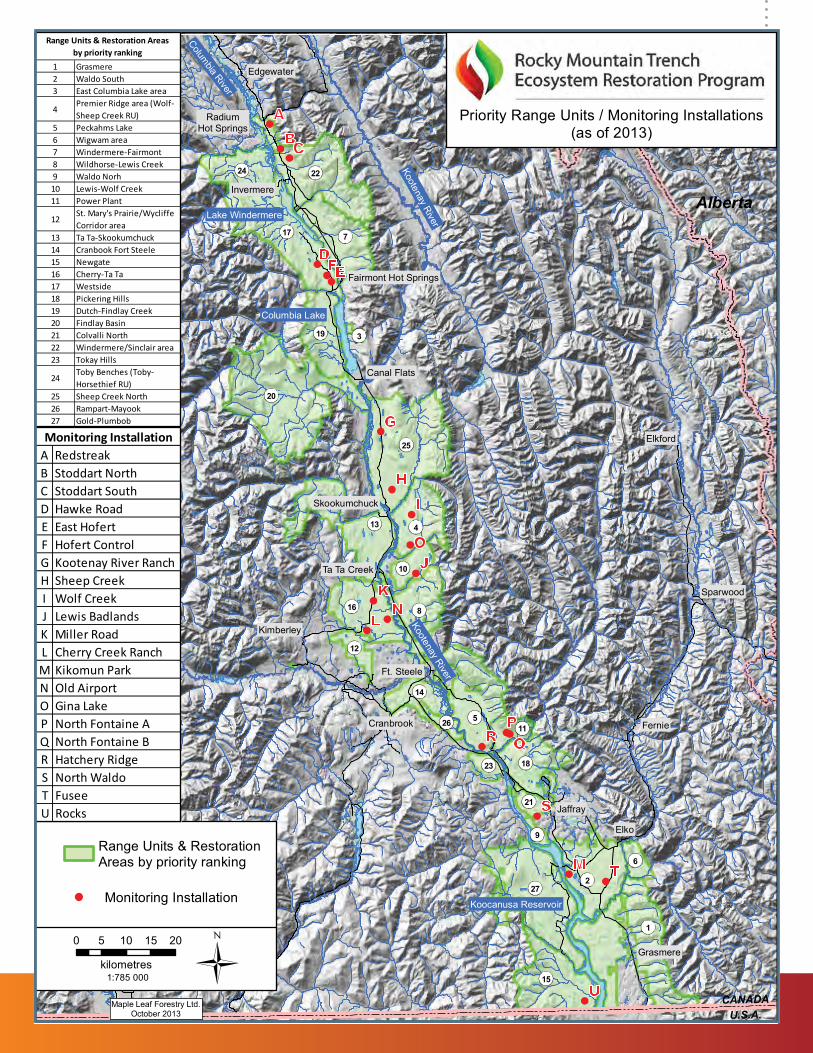
Blueprint for Action 2013 « 41 »
20
25
1
27
17
22
13
5
15
2
7
16 8
4
19
18
24
14
10
11
12
6
23
21
26
9
3
L
G
PQ
T
U
M
S
R
O
N
J
K
IH
EFD
CBA
Alberta
CANADAU.S.A.
Maple Leaf Forestry Ltd.October 2013
Lake Windermere
Columbia Lake
Koocanusa Reservoir
Columbia River
Kootenay River
Kootenay River
Edgewater
RadiumHot Springs
Invermere
Fairmont Hot Springs
Canal Flats
Skookumchuck
Kimberley
Cranbrook
Jaffray
Elko
Fernie
Sparwood
Elkford
0 5 10 15 20
kilometres1:785 000
Range Units & RestorationAreas by priority ranking
Monitoring Installation
Priority Range Units / Monitoring Installations(as of 2013)
A RedstreakB Stoddart NorthC Stoddart SouthD Hawke RoadE East HofertF Hofert ControlG Kootenay River RanchH Sheep CreekI Wolf CreekJ Lewis BadlandsK Miller RoadL Cherry Creek RanchM Kikomun ParkN Old AirportO Gina LakeP North Fontaine AQ North Fontaine BR Hatchery RidgeS North WaldoT FuseeU Rocks
Monitoring Installation
1 Grasmere2 Waldo South3 East Columbia Lake area
4Premier Ridge area (Wolf-Sheep Creek RU)
5 Peckahms Lake6 Wigwam area7 Windermere-Fairmont8 Wildhorse-Lewis Creek9 Waldo Norh10 Lewis-Wolf Creek11 Power Plant
12St. Mary's Prairie/Wycliffe Corridor area
13 Ta Ta-Skookumchuck14 Cranbook Fort Steele15 Newgate16 Cherry-Ta Ta17 Westside18 Pickering Hills19 Dutch-Findlay Creek20 Findlay Basin21 Colvalli North22 Windermere/Sinclair area23 Tokay Hills
24Toby Benches (Toby-Horsethief RU)
25 Sheep Creek North26 Rampart-Mayook27 Gold-Plumbob
Range Units & Restoration Areas by priority ranking
Grasmere
Ft. Steele
Ta Ta CreekMAP: PRIORITY RANGE UNITS / MONITORING INSTALLATIONS
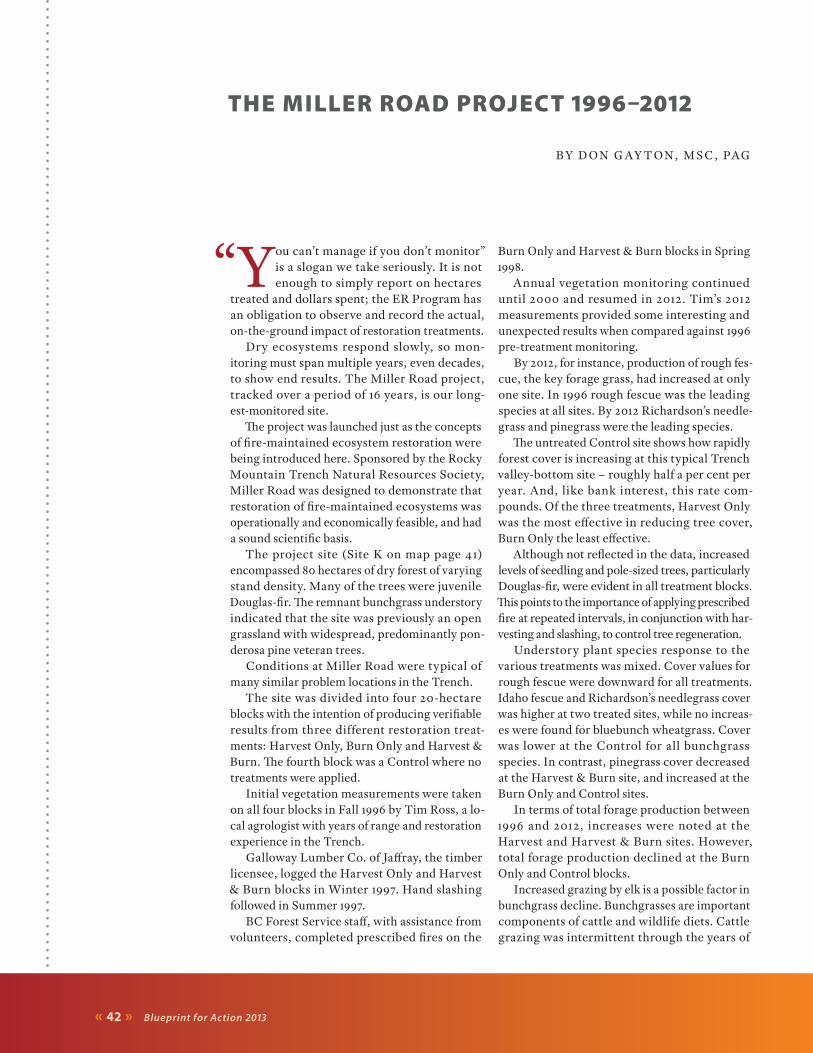
« 42 » Blueprint for Action 2013
THE MILLER ROAD PROJECT 1996–2012
BY D ON G AY T ON, M S C , PAG
“You can’t manage if you don’t monitor” is a slogan we take seriously. It is not enough to simply report on hectares
treated and dollars spent; the ER Program has an obligation to observe and record the actual, on-the-ground impact of restoration treatments.
Dry ecosystems respond slowly, so mon-itoring must span multiple years, even decades, to show end results. The Miller Road project, tracked over a period of 16 years, is our long-est-monitored site.
The project was launched just as the concepts of fire-maintained ecosystem restoration were being introduced here. Sponsored by the Rocky Mountain Trench Natural Resources Society, Miller Road was designed to demonstrate that restoration of fire-maintained ecosystems was operationally and economically feasible, and had a sound scientific basis.
The project site (Site K on map page 41) encompassed 80 hectares of dry forest of varying stand density. Many of the trees were juvenile Douglas-fir. The remnant bunchgrass understory indicated that the site was previously an open grassland with widespread, predominantly pon-derosa pine veteran trees.
Conditions at Miller Road were typical of many similar problem locations in the Trench.
The site was divided into four 20-hectare blocks with the intention of producing verifiable results from three different restoration treat-ments: Harvest Only, Burn Only and Harvest & Burn. The fourth block was a Control where no treatments were applied.
Initial vegetation measurements were taken on all four blocks in Fall 1996 by Tim Ross, a lo-cal agrologist with years of range and restoration experience in the Trench.
Galloway Lumber Co. of Jaffray, the timber licensee, logged the Harvest Only and Harvest & Burn blocks in Winter 1997. Hand slashing followed in Summer 1997.
BC Forest Service staff, with assistance from volunteers, completed prescribed fires on the
Burn Only and Harvest & Burn blocks in Spring 1998.
Annual vegetation monitoring continued until 2000 and resumed in 2012. Tim’s 2012 measurements provided some interesting and unexpected results when compared against 1996 pre-treatment monitoring.
By 2012, for instance, production of rough fes-cue, the key forage grass, had increased at only one site. In 1996 rough fescue was the leading species at all sites. By 2012 Richardson’s needle-grass and pinegrass were the leading species.
The untreated Control site shows how rapidly forest cover is increasing at this typical Trench valley-bottom site – roughly half a per cent per year. And, like bank interest, this rate com-pounds. Of the three treatments, Harvest Only was the most effective in reducing tree cover, Burn Only the least effective.
Although not reflected in the data, increased levels of seedling and pole-sized trees, particularly Douglas-fir, were evident in all treatment blocks. This points to the importance of applying prescribed fire at repeated intervals, in conjunction with har-vesting and slashing, to control tree regeneration.
Understory plant species response to the various treatments was mixed. Cover values for rough fescue were downward for all treatments. Idaho fescue and Richardson’s needlegrass cover was higher at two treated sites, while no increas-es were found for bluebunch wheatgrass. Cover was lower at the Control for all bunchgrass species. In contrast, pinegrass cover decreased at the Harvest & Burn site, and increased at the Burn Only and Control sites.
In terms of total forage production between 1996 and 2012, increases were noted at the Harvest and Harvest & Burn sites. However, total forage production declined at the Burn Only and Control blocks.
Increased grazing by elk is a possible factor in bunchgrass decline. Bunchgrasses are important components of cattle and wildlife diets. Cattle grazing was intermittent through the years of
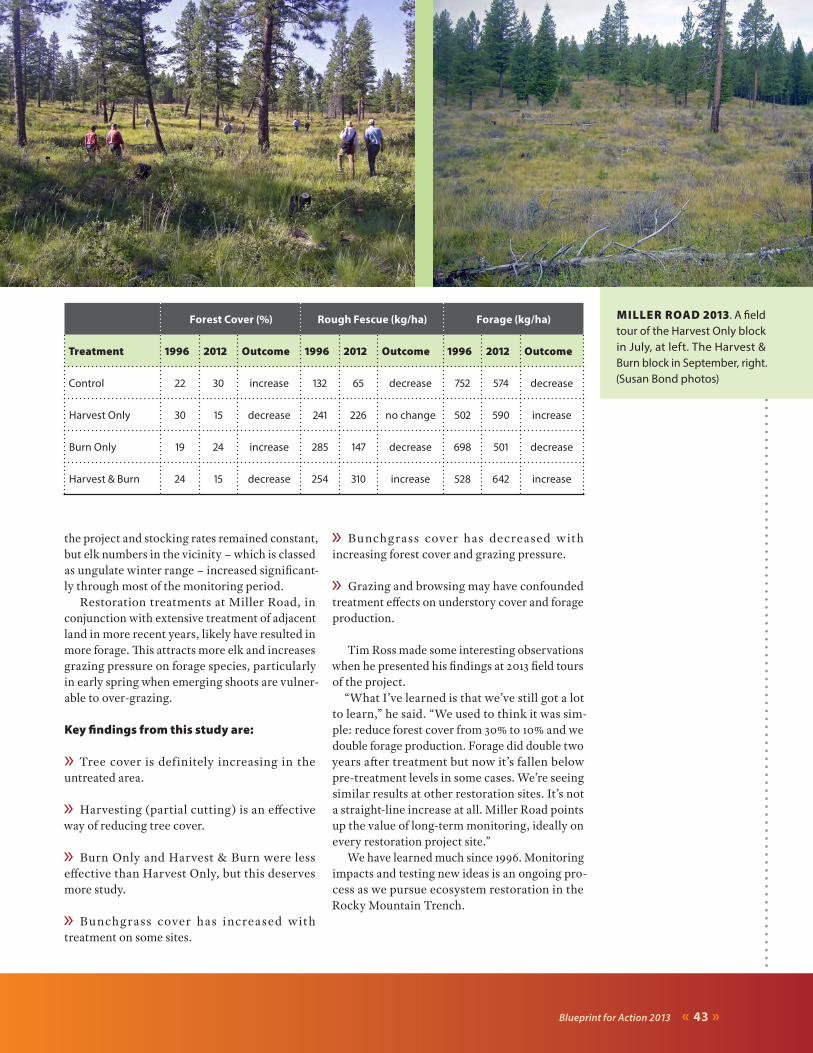
Blueprint for Action 2013 « 43 »
the project and stocking rates remained constant, but elk numbers in the vicinity – which is classed as ungulate winter range – increased significant-ly through most of the monitoring period.
Restoration treatments at Miller Road, in conjunction with extensive treatment of adjacent land in more recent years, likely have resulted in more forage. This attracts more elk and increases grazing pressure on forage species, particularly in early spring when emerging shoots are vulner-able to over-grazing.
Key findings from this study are:
» Tree cover is definitely increasing in the untreated area.
» Harvesting (partial cutting) is an effective way of reducing tree cover.
» Burn Only and Harvest & Burn were less effective than Harvest Only, but this deserves more study.
» Bunchg rass cover has increased w ith treatment on some sites.
» Bunchgrass cover has decreased with increasing forest cover and grazing pressure.
» Grazing and browsing may have confounded treatment effects on understory cover and forage production.
Tim Ross made some interesting observations when he presented his findings at 2013 field tours of the project.
“What I’ve learned is that we’ve still got a lot to learn,” he said. “We used to think it was sim-ple: reduce forest cover from 30% to 10% and we double forage production. Forage did double two years after treatment but now it’s fallen below pre-treatment levels in some cases. We’re seeing similar results at other restoration sites. It’s not a straight-line increase at all. Miller Road points up the value of long-term monitoring, ideally on every restoration project site.”
We have learned much since 1996. Monitoring impacts and testing new ideas is an ongoing pro-cess as we pursue ecosystem restoration in the Rocky Mountain Trench.
MILLER ROAD 2013. A field tour of the Harvest Only block in July, at left. The Harvest & Burn block in September, right. (Susan Bond photos)
Forest Cover (%) Rough Fescue (kg/ha) Forage (kg/ha)
Treatment 1996 2012 Outcome 1996 2012 Outcome 1996 2012 Outcome
Control 22 30 increase 132 65 decrease 752 574 decrease
Harvest Only 30 15 decrease 241 226 no change 502 590 increase
Burn Only 19 24 increase 285 147 decrease 698 501 decrease
Harvest & Burn 24 15 decrease 254 310 increase 528 642 increase
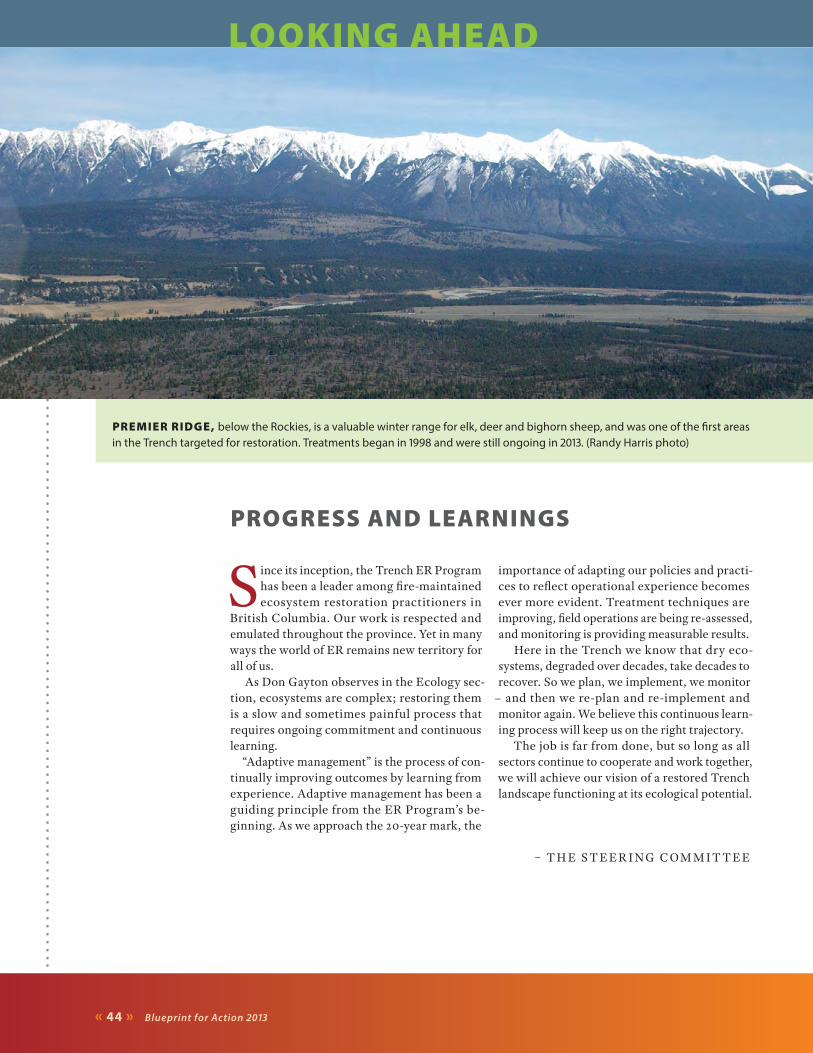
« 44 » Blueprint for Action 2013
PREMIER RIDGE, below the Rockies, is a valuable winter range for elk, deer and bighorn sheep, and was one of the first areas in the Trench targeted for restoration. Treatments began in 1998 and were still ongoing in 2013. (Randy Harris photo)
PROGRESS AND LEARNINGS
Since its inception, the Trench ER Program has been a leader among fire-maintained ecosystem restoration practitioners in
British Columbia. Our work is respected and emulated throughout the province. Yet in many ways the world of ER remains new territory for all of us.
As Don Gayton observes in the Ecology sec-tion, ecosystems are complex; restoring them is a slow and sometimes painful process that requires ongoing commitment and continuous learning.
“Adaptive management” is the process of con-tinually improving outcomes by learning from experience. Adaptive management has been a guiding principle from the ER Program’s be-ginning. As we approach the 20-year mark, the
importance of adapting our policies and practi-ces to reflect operational experience becomes ever more evident. Treatment techniques are improving, field operations are being re-assessed, and monitoring is providing measurable results.
Here in the Trench we know that dry eco-systems, degraded over decades, take decades to recover. So we plan, we implement, we monitor
– and then we re-plan and re-implement and monitor again. We believe this continuous learn-ing process will keep us on the right trajectory.
The job is far from done, but so long as all sectors continue to cooperate and work together, we will achieve our vision of a restored Trench landscape functioning at its ecological potential.
– T H E S T E E R I NG COM M I T T E E
LOOKING AHEAD

Blueprint for Action 2013 « 45 »
NEW INITIATIVESAn evolving strategy, recent monitoring results, and concerns about restoration logging impacts all require new initiatives, guided by the princi-ples of adaptive management. Over the next five years (2014-2018), the Steering Committee will pursue the following:
Strategy » Identify and prioritize specific Open Range
and Open Forest sites for full restoration treatment and continuing maintenance. » Identify mid-elevation wildlife migration
corridors for restoration. » Continue to refine our range of treatments in
response to emerging technologies and markets.
Monitoring » All future intensive monitoring plots will
follow the new protocol, and all data will be entered consistently in the ER Program monitoring database. » Re -mea su re most e x ist i ng i ntensive
monitoring plots to gather: 1) BEC site series data, and 2) actual counts of trees removed and trees retained. » Carry out a meta analysis of existing intensive
data so that dissimilar methods of data collection will yield trends in vegetation response to treatment.
» The meta analysis will consider variables such as treatment timing, time elapsed since treatment, number of trees removed, and prescribed burn intensity. » Re-write the routine monitoring protocol to
more closely match the intensive protocol so that data from both routine and intensive monitoring plots can be entered in the ER Program database.
Operations » Adopt the Best Management Practices to be
recommended by the Operations Committee. Restoration logging practices have sometimes produced unacceptable outcomes related to soil disturbance and erosion, invasive plants, residual debris, and rehabilitation of roads, landings and skid trails. A new sub-committee of the Ops Committee is in process of developing a set of best management practices to address these issues. The intent is to produce an illustrated handbook for use by restoration prescription writers, harvesting planners, and logging and other contractors. As the Best Management Practices project progresses, developments will be reported in future issues of the ER Program newsletter and posted on the website.
ONGOING INITIATIVES
Adaptive Management » Promote best planning, implementation,
monitoring and management practices that incorporate current science, local and traditional knowledge and resources, eff iciency and effectiveness.
Advocacy » Advocate for improvements to existing
practices, policies and legislation related to ecosystem restoration. » Serve as a conduit for taking problems/issues
raised by the Operations Committee forward for resolution at higher management levels.
Communication » P r o m o t e p u b l i c e d u c a t i o n a n d
communication about the objectives and benefits of ecosystem restoration by maintaining an outreach/communications plan. » Release an annual report to partners,
stakeholders and the public summarizing the accomplishments of the previous year.
Planning & Operations » Integrate all land management objectives –
including First Nations traditional knowledge – within fire-maintained ecosystems.
» Carry out consultation, collaboration and discussion leading to broad-based support of ecosystem restoration objectives and methods. » P romote s y ner g ie s a mong a genc ie s ,
stakeholder groups and First Nations by sharing knowledge, funding, resources and equipment.
Program Participation » Invite membership by interested agencies,
organizations, funding sources and First Nations that use or promote ecosystem restoration as a land management tool.
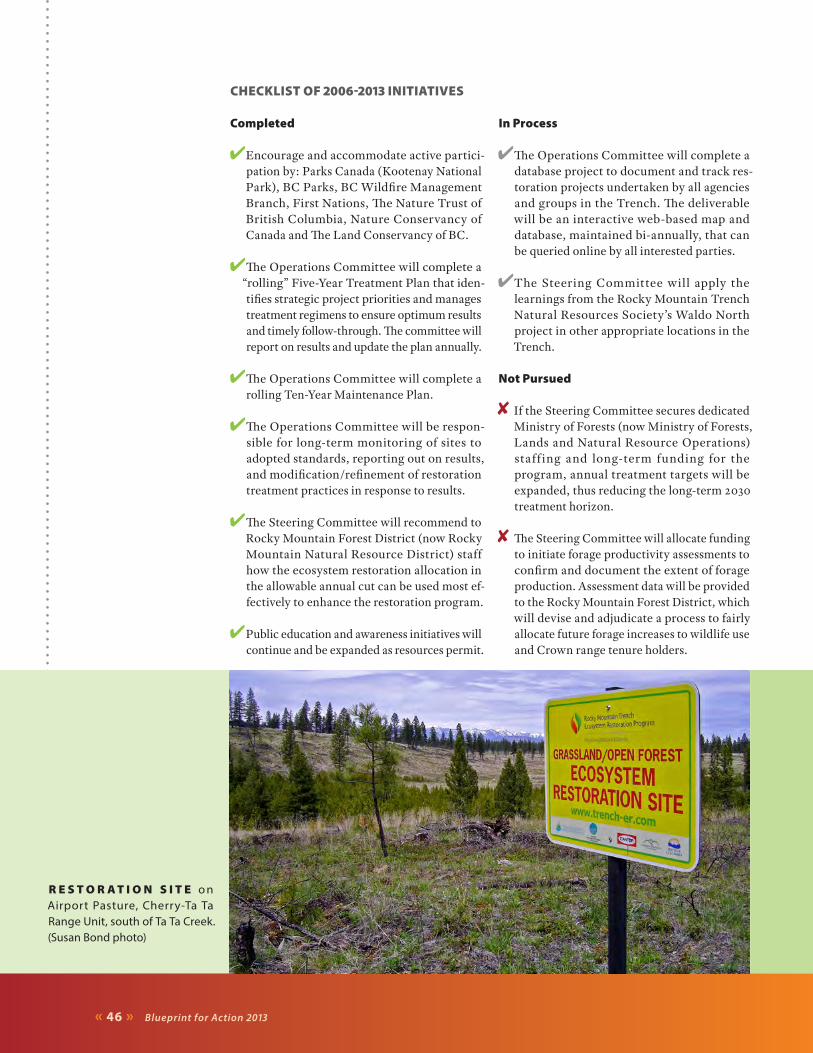
« 46 » Blueprint for Action 2013
CHECKLIST OF 2006-2013 INITIATIVES
Completed
✔Encourage and accommodate active partici-pation by: Parks Canada (Kootenay National Park), BC Parks, BC Wildfire Management Branch, First Nations, The Nature Trust of British Columbia, Nature Conservancy of Canada and The Land Conservancy of BC.
✔ The Operations Committee will complete a “rolling” Five-Year Treatment Plan that iden-tifies strategic project priorities and manages treatment regimens to ensure optimum results and timely follow-through. The committee will report on results and update the plan annually.
✔ The Operations Committee will complete a rolling Ten-Year Maintenance Plan.
✔ The Operations Committee will be respon-sible for long-term monitoring of sites to adopted standards, reporting out on results, and modification/refinement of restoration treatment practices in response to results.
✔ The Steering Committee will recommend to Rocky Mountain Forest District (now Rocky Mountain Natural Resource District) staff how the ecosystem restoration allocation in the allowable annual cut can be used most ef-fectively to enhance the restoration program.
✔ Public education and awareness initiatives will continue and be expanded as resources permit.
In Process
✔ The Operations Committee will complete a database project to document and track res-toration projects undertaken by all agencies and groups in the Trench. The deliverable will be an interactive web-based map and database, maintained bi-annually, that can be queried online by all interested parties.
✔ The Steering Committee will apply the learnings from the Rocky Mountain Trench Natural Resources Society’s Waldo North project in other appropriate locations in the Trench.
Not Pursued
✘ If the Steering Committee secures dedicated Ministry of Forests (now Ministry of Forests, Lands and Natural Resource Operations) staff ing and long-term funding for the program, annual treatment targets will be expanded, thus reducing the long-term 2030 treatment horizon.
✘ The Steering Committee will allocate funding to initiate forage productivity assessments to confirm and document the extent of forage production. Assessment data will be provided to the Rocky Mountain Forest District, which will devise and adjudicate a process to fairly allocate future forage increases to wildlife use and Crown range tenure holders.
R E S T O R A T I O N S I T E o n Airport Pasture, Cherry-Ta Ta Range Unit, south of Ta Ta Creek. (Susan Bond photo)

Blueprint for Action 2013 « 47 »
STEERING & OPERATIONS COMMITTEE MEMBERS
STEERING COMMITTEE MEMBERS 1998-2013(current member in bold, followed by previous members)
BC Ministry of Forests, Lands and Natural Resource Operations (FLNRO)Rocky Mountain Natural Resource District
» Chair: Steve Jablanczy, Jamie Kroschel, Ray Morello, Greg Anderson » Team Leader Ecosystem Restoration: Randy Harris
Fish & Wildlife Branch » John Krebs, Doug Martin, Dave Dunbar,
Irene Teske, Bob ForbesResearch Branch (no longer represented)
» Andre ArsenaultAdditional BC Ministries
» Ministry of Agriculture: Greg Tegart » Ministry of Environment/BC Parks and
Protected Areas (position not currently filled)First Nations
» Ktunaxa Nation Council (position not currently filled)
» aq’am/St. Mary’s Indian Band (no longer represented): Julie Couse, Brian Watson » Shuswap Band Council (position not currently
filled)Funders
» Fish and Wildlife Compensation Program (now represented by FLNRO): John Krebs
Industry » Canadian Forest Products/Canfor (previously
Tembec, Crestbrook Forest Industries): Grant Neville, Ken Streloff, Chris Stagg, Brian Dureski, Lloyd Havens » Kootenay Livestock Association: Jordy Thibeault,
Mike Malmberg, Lee HolmStakeholders
» East Kootenay Wildlife Association/BC Wildlife Federation: Mark Hall, Andy Pezderic, Glynn Killins
» FORREX (no longer represented): Don Gayton » Parks Canada: Jed Cochrane, Rick Kubian,
Derek Petersen, Kris McCleary, Edward Abbott » Range Advisory Committee: Lonnie Jones » Rocky Mountain Trench Natural Resources
Society: Dan Murphy, Maurice Hansen (representing Cranbrook Archery Club, Cranbrook Community Forest Society, East Kootenay Wildlife Association, Kootenay Livestock Association, Rocky Mountain Naturalists, Southern Guides & Outfitters Association, The Land Conservancy of BC, Waldo Stockbreeders Association, Wildsight, Windermere District Farmers Institute)
OPERATIONS COMMITTEE MEMBERS 1998-2013(current member in bold, followed by previous members)
» Chair: Randy Harris, Sue Crowley, Denis Petryshen, Darrell Regimbald, Dave White, Tom Hedin
» BC Ministry of Agriculture: Darrell Smith » BC Ministry of Environment: Sue Crowley, Irene
Teske, Gary Tipper » BC Ministry of Forests, Lands and Natural
Resource Operations: Randy Harris, Rick Fraser, Allana Oestreich, Dean Draper, Brent Lucas, Lloyd Bell, Paul White, Ray Morello, Denis Petryshen, Phil Burk, Darrell Regimbald, Dave White, Tom Hedin
» BC Parks: Mike Gall » BC Range Branch: Kenric Walburger,
Shawna Larade, Rae Haddow, Jodie Kekula, Rieva McCuaig, Anne Skinner
» BC Timber Sales: Gerry Grady » BC Wildfire Management Branch: Mike Morrow,
Dennis Heigh, Peter Hisch, Mike Daigle
» Canadian Forest Products/Canfor (previously Tembec, Crestbrook Forest Industries): Ken Streloff, Kori Vernier, Steve Temple, Barry Benson
» Fish and Wildlife Compensation Program: Larry Ingham, Doug Adama
» Galloway Lumber Company: Randy Byford, Cam Donaldson
» Grassland & Rangeland Enhancement Program: Brian Zak
» Kinbasket Development Corporation: Brad Munroe
» Ktunaxa Nation Council: Dan Wiggle » Nupqu Development Corporation:
Scott Witbeck, Brian Watson, Bill Redhead » Rocky Mountain Trench Natural Resources
Society: Dan Murphy, Maurice Hansen » The Nature Conservancy of Canada:
Hillary Page, Gary Tipper » The Nature Trust of British Columbia: Rob Neil
« 48 » Blueprint for Action 2013
SINCERE THANKS TO THE FOLLOWING FOR THEIR HELP IN MAKING THIS A BETTER PUBLICATION.
Jeff Allen, RPF
Trish Barnes
Mike Black, RPF
Leanne Colombo
Lori D. Daniels, PhD
Cam Gillies, PhD
Robert W. Gray
Gregory A. Greene, MSc, PhD candidate
Maurice Hansen
Mike Morrow, RFT
Dean Nicholson
Penny Ohanjanian, MSc, RPBio
Tim Ross, PAg, MSc, CRMC
Patrick Stent, RPBio
Dave Struthers, PAg, BSc
Kari Stuart-Smith, PhD, RPBio
Kenric Walburger, PhD, PAg
ACKNOWLEDGEMENTS
The Rocky Mountain Trench Ecosystem Restoration Program gratefully acknow-ledges the support of Columbia Basin Trust which delivers social, economic and environmental benefits to the residents of the Columbia Basin.
The Rocky Mountain Trench Ecosystem Restoration Program recognizes the Habitat Conservation Trust Foundation – and anglers, hunters, trappers and guides who contribute to the Trust – for making a significant financial contribution to support Blueprint for Action 2013. Without such support, this project would not have been possible.
This project is funded by the Fish and Wildlife Compensation Program (FWCP) in the Columbia region on behalf of its partners BC Hydro, the Province of BC, First Nations, and community groups, who work together to conserve and enhance fish and wildlife impacted by the construction of BC Hydro dams.
Ministry of Forests, Lands andNatural Resource Operations

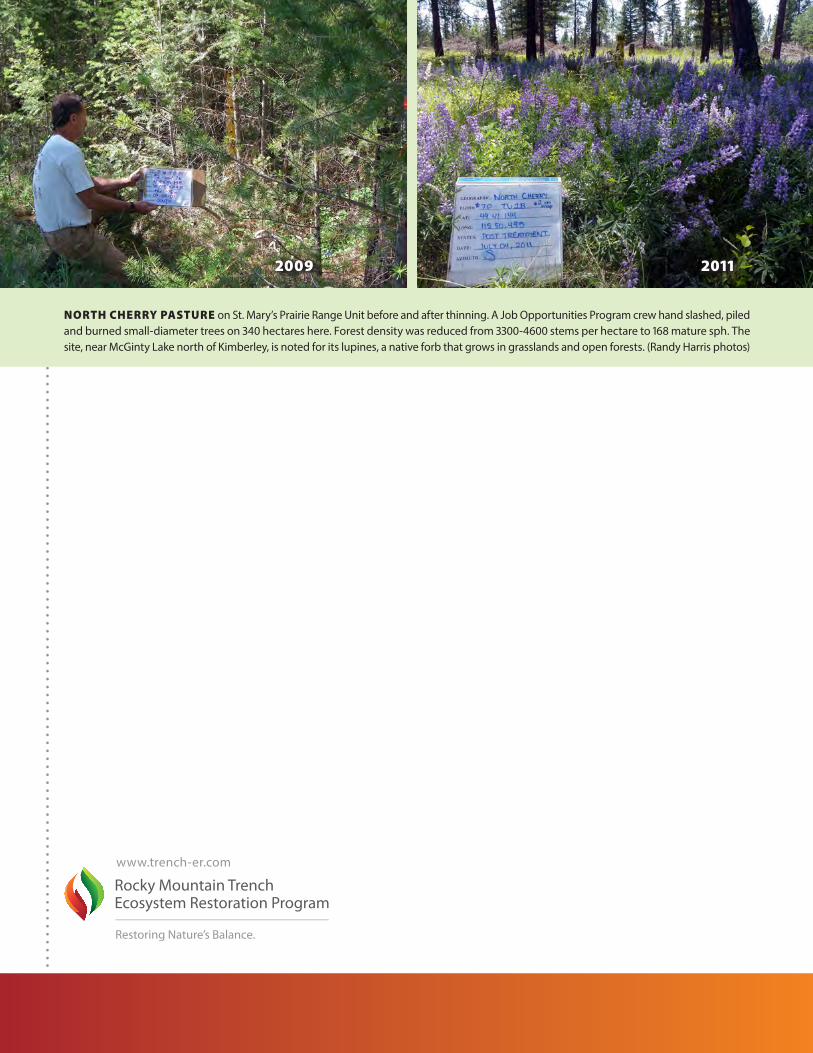
20112009
NORTH CHERRY PASTURE on St. Mary’s Prairie Range Unit before and after thinning. A Job Opportunities Program crew hand slashed, piled and burned small-diameter trees on 340 hectares here. Forest density was reduced from 3300-4600 stems per hectare to 168 mature sph. The site, near McGinty Lake north of Kimberley, is noted for its lupines, a native forb that grows in grasslands and open forests. (Randy Harris photos)
www.trench-er.com