implosion report dc convention center - nist
TRANSCRIPT

NIST Technical Note 1542
Propagation and Detection of Radio Signals Before, During, and After the Implosion of a Large Convention Center Christopher L. Holloway
Galen Koepke Dennis Camell Kate A. Remley Susan A. Schima Mike McKinley Robert T. Johnk


U.S. Department of Commerce Carlos M. Gutierrez, Secretary Technology Administration Robert Cresanti, Under Secretary of Commerce for Technology National Institute of Standards and Technology William Jeffrey, Director
NIST Technical Note 1542 Propagation and Detection of Radio Signals Before, During and After the Implosion of a Large Convention Center Christopher L. Holloway Christopher L. Holloway Galen Koepke Dennis Camell Kate A. Remley Susan A. Schima Mike McKinley Robert. T. Johnk Electromagnetics Division National Institute of Standards and Technology 325 Broadway Boulder, CO 80305 June 2006

Certain commercial entities, equipment, or materials may be identified in this document in order to describe an experimental
procedure or concept adequately. Such identification is not intended to imply recommendation or endorsement by the
National Institute of Standards and Technology, nor is it intended to imply that the entities, materials, or equipment
are necessarily the best available for the purpose.
National Institute of Standards and Technology Technical Note 1542Natl. Inst. Stand. Technol. Tech. Note 1542, 123 pages (June 2006)
CODEN: NTNOEF
U.S. Government Printing OfficeWashington: 2005
For sale by the Superintendent of Documents, U.S. Government Printing OfficeInternet bookstore: gpo.gov Phone: 202-512-1800 Fax: 202-512-2250
Mail: Stop SSOP, Washington, DC 20402-0001

iii
Contents Executive Summary ................................................................................................. iv
1. Introduction.......................................................................................................... 1 2. Convention Center Description .......................................................................... 3 3. Frequency Bands.................................................................................................. 4 4. Transmitters ......................................................................................................... 6 5. Receiving Antenna and Measurement System .................................................. 7 6. Experimental Set-Up ........................................................................................... 8 7. Experimental Results........................................................................................... 10 7.1 Radio Mapping of Convention Center: Measured Signal Strengths........ 11 7.2 Radio Mapping of Convention Center: Statistical Distributions of Signal Strength................................................................................... 12 7.3 Pre-implosion Radio Signal Measurements with Transmitters at Fixed Sites...................................................................................... 13 7.3.1 Signal Strength Measurements for Fixed Transmit Sites ......... 14 7.3.2 Statistical Distributions of Signal Strength for Fixed Transmit Sites ...................................................................... 15 7.4 Implosion Radio-Signal Measurements with Transmitters at Fixed Sites with Fixed and Mobile Receiving Sites .......................... 18 7.5 Field Tests of the Debris Radiator Concept............................................. 21 8. Recovery of Transmitters.................................................................................... 23 9. Summary of Results and Conclusion ................................................................. 23 10. References ........................................................................................................... 27

iv
Executive Summary This is the third in a series of NIST technical notes (TN) on propagation and detection of radio signals in large buildings before, during, and after implosion. The first and second NIST Tech Notes (NIST TN 1540 and NIST TN 1541) described similar experiments carried out on a 13-story apartment building in New Orleans, LA, and on a large sports stadium (Veteran’s Stadium in Philadelphia, PA), respectively. These data will give first responders a better understanding of what to expect from the radio-propagation environment in disaster situations. The goals of this work are twofold: (1) to create a large, public-domain data set describing the attenuation in various building types of radio signals in public safety and cellular telephone bands, and (2) to investigate various schemes for detecting signals from first responders with radios or from civilians with cell phones who are trapped in voids in a totally or partially collapsed building. With the above goals in mind, measurements were carried out on a large convention center (the Washington DC Convention Center) in Washington, DC. Frequencies near public safety and cell phone bands (approximately 50 MHz, 150 MHz, 225 MHz, 450 MHz, 900 MHz, and 1.8 GHz) were chosen for these experiments. Radio transmitters similar to those used by first responders were used. An automated system to measure signal strength was developed. Three different types of signal-strength experiments were performed. First, we carried out a “radio-mapping” experiment that provided data on how well radio signals at the different frequencies coupled into the convention center. From this we determined the field strength variability throughout the convention center. This experiment involved carrying a set of transmitters tuned to the various frequencies throughout the convention center, while recording the received signal at a fixed receive site located outside the large structure. Transmitters were also carried around the perimeter of the structure with a fixed receiving site on the outside. These measurements were carried out a few days before the convention center was imploded. Results show that:
The mean interior to exterior signal attenuation ranged from 58 to 69 dB. The median interior to exterior signal attenuation ranged from 57 to 66 dB. The standard deviation for interior to exterior signal attenuation ranged from 11 to
15 dB, depending on frequency. These results indicate the variability in signal level that a communication-system user might encounter throughout a structure of this type. Second, radios in protective cases were placed in fixed sites throughout the convention center. Received signals were collected external to the structure before, during, and after the implosion. Our receiving sites in this case were both fixed and mobile. A mobile cart was pulled around the perimeter of the convention center both before and after the implosion, enabling direct comparison of signal strength as a function of azimuth angle through the standing convention center and the resulting pile of rubble. Results show that:
Some transmitter signals experienced large attenuation (some greater than 40 dB, at the noise floor of our receivers), while other transmitter signals increased during the implosion, depending on the receiving site and location of the transmitter cache.

v
Large amounts of building rubble caused at least 30 to 40 dB of signal attenuation. The true attenuation was not established in several cases since we measured only noise.
Thus, if someone were trapped under such a rubble pile and tried to communicate with an emergency responder with a two-way radio or cell phone, their communication link would have to overcome at least 30 to 40 dB of attenuation. It is interesting to note that the increase in signal attenuation after the collapse of the convention center was not as large as we expected based on results observed during the apartment building implosion (60 to 80 dB). We attribute this to massive amounts of concrete and steel in the standing convention center that attenuated signals propagating through the interior of the convention center. While the implosion certainly moved and compacted these massive beams, there were still large voids remaining in the rubble pile, leaving us with a propagation environment similar to that of the convention center’s initial standing state. The apartment building, however, went from a relatively open structure to a very dense pile of rubble that had a more pronounced effect on the signals. The overall attenuation in the convention center was also about 10 dB less than was measured at Veterans’ Stadium. The third set of experiments used metallic “debris radiators” to attempt to detect signals from transmitters buried underneath the rubble pile. The goal was to investigate whether radio signals from transmitter(s) under rubble might couple onto metallic construction material such as pipes or conduit, and radiate signals to the edges of the rubble pile. Results show that:
• When the transmit antenna from a buried transmitter is replaced by a metallic cable attached through an impedance tuning network, the received signal strength increased significantly in some cases but remained unchanged in other cases.
• Signals could be received from all buried transmitters through either a direct connection
to the metallic debris through a matching network or through a directional receive antenna placed in close proximity to the debris radiator.
• A directional receive antenna in close proximity to a debris radiator generally had higher
received signal levels than did signals acquired using direct connection to the metallic debris.
This NIST Technical Note is the third in a series of reports detailing implosion experiments performed by NIST in order (a) to better understand the first responder’s radio propagation environment and (b) to investigate new methods for weak-signal detection. The first set of implosion experiments was performed in an apartment building in New Orleans and the second set was performed in a large sport stadium in Philadelphia, PA. The results of those experiments are the subject of separate NIST TNs. Besides implosion experiments, NIST has also performed radio-mapping experiments in various other large structures, including apartment and office buildings, sports stadiums, stores, malls, hotels, a convention center, and warehouses. The results of the signal-strength measurements and statistical distribution for these radio-mapping experiments will also be published separately.

1
Propagation and Detection of Radio Signals Before, During and After the Implosion of a Large Convention Center
Christopher L. Holloway, Galen Koepke, Dennis Camell, Kate A. Remley, Susan A. Schima, Mike McKinley, and Robert T. Johnk
Electromagnetics Division
National Institute of Standards and Technology 325 Broadway, Boulder, CO 80305
In this report, we investigated radio communications problems faced by emergency responders (firefighters and police) in disaster situations such as collapsed buildings. A fundamental challenge to communications into and out of large buildings is the strong attenuation of radio signals caused by losses and scattering in the building materials and structure. We designed experiments that took advantage of building demolitions in an effort to quantify radio-signal attenuation through standing and collapsed structures. We also investigated various schemes for detecting signals from firefighters and civilians with portable radios or cell phones who are trapped in voids in these collapsed buildings. We placed RF transmitters, similar to those used by first responders, in various locations in these buildings and performed measurements before, during, and after the building was imploded. The transmitters were tuned to frequencies near public safety and cell phone bands. Once the building was down, we measured the signals from the buried transmitters in the building to investigate weak-signal detection schemes that involved searching with directional antennas and connecting instruments to some of the metal debris located on the perimeter of the collapsed building. This report summarizes the third in a series of such experiments, performed in a large convention center (the Washington DC Convention Center) in Washington, DC. We describe the experiments, detail the measurement system, show primary results of the data we collected, and discuss some of the interesting propagation effects we observed. Key words: building implosion; building shielding and coupling; collapsed buildings; emergency responders; radio communications; radio propagation experiments; weak-signal detection 1. Introduction When emergency responders enter large structures (e.g., apartment and office buildings, sports stadiums, stores, malls, hotels, convention centers, and warehouses) communication to individuals on the outside is often impaired. Cell phone and mobile-radio signal strength is reduced due to attenuation caused by propagation through the building materials and scattering by the building geometry [1-7]. Here, we report on a National Institute of Standards and Technology (NIST) project to investigate the communications problems faced by first responders (firefighters and police) in disaster situations such as collapsed buildings. As part of this effort, we are investigating the

2
propagation and coupling of radio waves into large structures. We are also investigating various schemes for detecting first responders and civilians with portable radios or cell phones who are trapped in voids of a collapsed or partially collapsed building. Buildings scheduled for implosion provide the ideal research environment for investigating radio-wave propagation conditions in fully or partially collapsed structures. The rapid change in the building structure during an implosion was also favorable to our experimental time frame. We could perform one complete set of experiments within about a two-week period as opposed to several months during a conventional demolition. Working in cooperation with demolition and implosion contractors, we identified a high-rise apartment building in New Orleans as the site of our first set of experiments. A summary of this work appears in references [5] and [6]. Experiments were also carried out at a second site, a large sports stadium (Veterans’ Stadium) in Philadelphia, PA. A summary of the second set of experiments is found in reference [7]. This current report summarizes our third implosion experiment. The data discussed here were collected during the implosion of the Washington Convention Center in Washington, DC, in December 2004. The experiments reported here were performed before, during, and after the implosion of the large structure and are essentially measurements of the reduction in radio signal strength caused by propagation through the structure. In order to study the radio characteristics of the building at the various frequencies of interest to first responders, frequencies near public-safety and cell phone bands (approximately 50 MHz, 150 MHz, 225 MHz, 450 MHz, 900 MHz, and 1.8 GHz) were chosen. A detailed description of the transmitters we used are described in detail in Section 4. Three types of data were collected in the experiment. The first set of data, which we refer to as a “radio mapping,” was collected a few days before the structure was imploded. This involved carrying transmitters (or radios) tuned to various frequencies throughout the convention center while recording the received signal at a site located outside the convention center. The reference for these data was a direct, unobstructed line-of-sight signal-strength measurement with the transmitters external to the convention center and in front of the receiving antennas. The purpose of the radio-mapping measurements was to investigate how the signals at the different frequencies couple into the convention center, and to determine the field strength variability throughout the convention center. The second set of data was gathered from radios placed at fixed sites throughout the convention center. Received signals were collected before, during, and after the implosion. The receiving systems in this case were both at fixed sites and mobile. The mobile receiving system consisted of measurement instruments and antennas mounted on a modified garden cart. A detailed description of the measurement system and antennas is given in Section 5. The cart was pulled around the perimeter of the convention center both before and after the implosion, enabling direct comparison of signal strength as a function of azimuth angle (a) through the standing convention center and (b) through the resulting pile of rubble after the collapse. We collected the third set of data by monitoring signals coupled to metallic debris located in the proximity of transmitters buried in the collapsed building. These metallic “debris radiators” (a set

3
of cables laid to investigate the concept) ran through the rubble and were exposed at the perimeter of the collapsed building. The idea is that when a large structure collapses, metal objects (electrical wires, metal piping, re-bar, venting pipe, etc.) are protruding from the rubble. These objects may improve radio reception by coupling radio signals to searchers on the outside. Our studies utilized pre-laid steel cables to emulate metallic debris in the collapsed building. Use of pre-laid cable helps to ensure that we can test the debris radiator concept even if we were not able to make measurements in close proximity to the debris pile for safety reasons. In this experiment, unlike those in references [5-7], we investigated whether improved signal reception could be obtained by replacing a radio’s transmit antenna with metallic debris connected through an impedance-matching network. The purpose of the matching network is to increase efficiency in coupling a signal to the metallic debris. We compared measurements from transmitters that had standard omnidirectional antennas and those that used the debris radiator. On the receiver side, we performed similar comparative experiments. We measured the signals from the buried transmitters using instruments physically connected to the metallic debris through impedance tuners, using standard receive antennas, and using directional antennas. As in our past studies, measurements show that improvement in received signal level can range from zero to several orders of magnitude when debris radiators are used. This report summarizes a set of experiments in a large convention center in Washington, DC, formally known as the Washington DC Convention Center (see Figure 1), and is organized as follows. Details of the convention center layout are presented in Section 2. Section 3 describes the frequencies used in these experiments. Section 4 discusses the transmitters, and Section 5 describes the automated measurement system used in the radio-mapping and propagation measurements. In Section 6, our experimental procedures are discussed. In Section 7, we present the data collected at various stages of the experiment. Section 8 briefly discusses the recovery of the transmitters after the implosion. Finally, in Section 9, we summarize the results of these experiments and discuss some of the interesting propagation effects observed. 2. Convention Center Description The structure for the radio propagation experiments discussed in this report was the Washington DC Convention Center (see Figure 1). The two-level structure was constructed of reinforced concrete, steel, and standard interior finish materials. Figures 1 through 4 show details of the original convention center and some of the preparations and partial demolition of the different sections of the convention center. As shown in Figures 1 and 2, the convention center had two large levels with three levels of offices. Significant demolition was already completed when we arrived two weeks before the implosion; all plumbing fixtures, most glass windows and doors, and other contents had been removed. Material had been judiciously removed from certain structural parts of the lower levels, including stairwells and elevator shafts, to facilitate a proper collapse during the implosion. Figure 1 shows the approximate locations of the four transmitter sites and three receive sites for the experiment.

4
3. Frequency Bands An overview of the frequencies used by the public-safety community nationwide (federal, state, and local) is given in Table 1, which shows a broad range of frequencies ranging from 30 MHz to 4.9 GHz. The modulation scheme has historically been analog FM, but this is slowly changing to digital as Project 25 radios come online [8]. The modulation bandwidth in the VHF and UHF bands has been 25 kHz, but due to the need for additional communications channels in an already crowded spectrum, most new bandwidth allocations are 12.5 kHz. The older bandwidth allocations will gradually be required to move to narrow bandwidths to increase the user density even further. The crowded spectrum and limited bandwidth are also pushing the move to higher frequency bands in order to support new data-intensive technologies. The cellular phone bands are summarized in Table 2. As shown in Table 1, frequencies currently used by public safety and other emergency responders and cellular telephones are typically below 2 GHz. New frequency allocations and systems including higher frequencies (e.g., around 4.9 GHz) will become increasingly important in the future, but in the present study, we concentrated on the major communications bands in use today. We chose six frequency bands below 2 GHz, from about 50 MHz to just above 1800 MHz. These include four VHF bands typically used for analog FM voice, one band used for multiple technologies (analog FM voice, digital trunked FM, and cellular telephone), and one band near the digital cellular telephone band.
Table 1. Public safety community frequencies.
Frequency band (MHz)
Description
30-50 Used mainly by highway patrols for long-distance propagation. This band is currently being phased out.
150-174 Local police and fire. Lower frequency preferred because of its better long-distance propagation quality.
406-470 Used by federal officers and others. 700-800 Used in urban areas. 800-869 Primarily urban usage.
4900 A newly allocated band just coming on line with 50 MHz bandwidth for sending images and data.

5
Table 2. Cellular phone frequencies.
Frequency band (MHz)
Description
800 AMPS or analog systems 1900 PCS or digital system
In designing an experiment to investigate the propagation characteristics into large buildings at these different frequency bands, we chose frequencies very close, but not identical, to the above bands. If frequencies were chosen in the public safety or commercial land-mobile bands, interference to the public safety and cellular systems could possibly occur. Conversely, these existing systems could interfere with our experimental setup. In addition, obtaining frequency authorizations in these bands for our experiments would have been problematic due to the intense crowding of the spectrum. To circumvent these issues, we were able to receive temporary authorization to use frequencies in the U.S. government frequency bands adjacent to these public safety bands. Table 3 lists the frequency bands that were used in the experiments. The lower four bands correspond to the frequencies used by the public-safety community; 902 MHz can be associated with several services including both public safety and cellular phones; the highest frequency is near the digital cellular phone band.
Table 3. Frequency bands used in the experiments.
Frequency band (MHz)
Description
49 Simulate a public safety band 162 Simulate a public safety band 226 Simulate a public safety band 448 Simulate a public safety band 902 Simulate a public safety or cellular phone band 1830 Simulate a cellular phone band

6
Table 4. Frequency sets and grouping used in the experiments.
Band
(MHz)
Location A: Labeled TX1
(MHz)
Location B: Labeled TX2
(MHz)
Location C: Labeled TX3
(MHz)
Location D: Labeled TX4
(MHz) 49 49.78 49.66 49.72 49.78 162 162.09 163.30 165.575 173.50 226 226.40 226.50 226.60 226.70 448 448.30 448.40 448.70 448.60 902 -- 902.45 -- 902.75 1830 -- 1831.00 1831.5 --
Cable Experiment: 448
448.70 448.80
For the fixed transmitter experiments, where signals were monitored before, during, and after the implosion, twenty transmitters operating at different frequencies within the above six bands (listed in Table 3) were placed at four different locations in the convention center (see Figure 1). The twenty different frequencies used in this experiment are listed in Table 4. The first location had only four different bands, the second location had all six bands, the third location had only four different frequency bands, and the fourth location had five different bands. The second and fourth location had an additional 448 MHz band transmitter (labeled as cable experiment in Table 4). These two transmitters were connected directly to a cable through an impedance matching network and not to an antenna. The cable was then run outside the convention center. This was done for the debris radiator experiments, details of which are given in a later section. A description of the transmitters is given in the next section. 4. Transmitters The design requirements for the transmitters used in the experiments discussed here were that they should (1) transmit at the frequencies listed in the tables above, (2) operate continuously for 12 hours, (3) be sufficiently robust to have a high probability of surviving the building collapse, and (4) be relatively inexpensive in the event that they were destroyed by the building collapse. To accomplish this, two different types of transmitters were chosen. For the four lower frequency bands (the VHF/UHF public-safety bands), off-the-shelf amateur radios were modified. The modifications included (a) reprogramming the frequency synthesizer to permit transmitting at government frequencies, (b) disabling the transmitter time-out mode in order to allow for continuous transmission, and (c) connecting a large external battery pack. The specifications of these modified radios then had to be reported to the National Telecommunications and Information Administration (NTIA) frequency coordinator in order to gain approval for use in government frequency bands. With the larger battery packs, the modified radios could transmit continuously for 12 to 18 hours. The extended transmitting time required us to provide additional cooling since the radios were designed for typical communications, that is, to transmit intermittently with cooling time between transmissions. This was accomplished with cooling fans.

7
The stability and radiated power from these inexpensive radios was measured over a 24-hour period. This measurement was performed in the NIST reverberation chamber, and is discussed below. The modified radios and battery packs were placed in durable orange plastic cases to provide some protection from debris during the implosion. These cases obviously could not withstand a crushing load of debris, so careful placement in the building was key to their survival. Figure 5 shows the final arrangement of modified transmitters used for the lower four frequency bands. This figure shows one modified transmitter placed in an orange plastic case. Commercial transmitters were available for the two higher frequency bands (900 and 1800 MHz). These off-the-shelf transmitters were already in plastic protective cases and could transmit continuously for 12 hours. Figure 6 shows these transmitters. Note that the cases for the higher-frequency transmitters were not orange, but grey. To ensure that the plastic protective cases did not affect the total radiated power and radiation pattern of the transmitters, measurements of these two quantities were taken in the NIST reverberation and fully anechoic chambers. Measurements of the total radiated power both with and without the plastic cases indicated that the cases had minimal effect on the total radiated power. Radiated power patterns of the transmitters in the protective cases were also measured to ensure that the cases did not adversely affect the radiation patterns. The transmitters were placed in the NIST anechoic chamber (see Figure 7) for these pattern measurements. Figures 8 through 10 illustrate the results for 164 MHz, 225 MHz, and 448 MHz. These figures show that the radiation patterns of the transmitters in the protective cases were very similar to the dipole type pattern that the radio would produce in free space. 5. Receiving Antenna and Measurement System The receiving system is sketched in Figure 11. We assembled four antennas on a 4-meter mast, as illustrated. The radio-frequency output from each antenna was fed through a 4:1 broadband power combiner. This arrangement gave us a single input to the portable spectrum analyzers, which could then scan over all the frequencies of interest without switching antennas. The four antennas were chosen to be optimal (or at least practical) for each of the frequency bands we were measuring. The selected antennas were an end-fed vertical omnidirectional antenna for 50 MHz, a log-periodic-dipole-array (LPDA) used for the 160, 225, and 450 MHz bands, and Yagi-Uda arrays for 900 and 1830 MHz. This assembly could then be mounted on a fixed tripod at one of the listening sites, or it could be inserted into the modified garden cart for portable measurements (see Figures 11 and 12). The receiving sites contained, in addition to the antenna system, a generator, uninterruptible power supply (UPS), spectrum analyzer, global positioning system (GPS) receiver, computer, and associated cabling. Photos of the antenna assembly mounted on a tripod and mounted on the mobile cart are shown in Figure 12. As shown in Figure 11, the measurement system consists of a portable spectrum analyzer, GPS receiver, and a laptop computer. The data collection process was automated using a graphical programming language. This software was designed to control the analyzer, collect, process, and save data at the maximum throughput of the equipment. The software controlled the spectrum

8
analyzer via an IEEE-488 interface bus and the GPS receiver via a serial interface. The GPS information was recorded to track the position of the mobile cart during the perimeter measurements around the building. The software was written to maximize throughput of the data collection process and to run for an undefined time interval. This was achieved by running parallel processes of collecting, processing, and saving the data for post-collection processing. The data were continuously read from the spectrum analyzer at its optimal settings and stored in data buffers. These buffers were read and processed for each signal and displayed for operator viewing. The processed data were then stored in additional buffers to be re-sorted and saved to a file on disk. The initial setup of the parameters for the spectrum analyzer determined the quality of optimization for this process. There were several instrument parameters that were critical during the setup, including the analyzer sweep time, resolution bandwidth, and frequency span of the spectrum analyzer trace. The number and spread of the test frequencies in a particular band influenced the allowed range of adjustment for these parameters. These two factors also influenced the number of traces necessary to cover all the test frequencies. Interference from signals in the adjacent spectrum influenced the instrument setup and data collection speed by forcing smaller resolution bandwidths. The reference level for each trace was also checked and adjusted during the measurement to improve the resolution and accuracy of the power level reading. All of these factors had some effect on the sampling rate. The sampling rate of the complete measurement sequence was the major factor in how much spatial resolution we had during walk-through or field-mapping experiments (we also had some flexibility in our walking speed) and the time resolution for recording the signals during the implosion. The time resolution of the measured data determined how much detail we could record for the rapid changes in signal strength as the building collapsed. Even though we were concerned primarily with the before and after values, we hoped to record the signals with enough detail to correlate the movement of the structure during the implosion to our received signals. We used three different models of spectrum analyzers, each having a different sampling rate, ranging from about 2 to 7 s, to measure all 20 frequencies in the 6 frequency bands. The frequencies were spaced such that we could utilize one spectrum analyzer trace for each band. These rates were achieved only after optimizing the instrument control and data transfer processes mentioned above. The data from the spectrum analyzer trace were saved in binary format to disk (to allow us to reprocess the raw data at a later time if needed); they were then processed to extract the signals at each particular frequency. These results were then put into a spreadsheet file and saved with other measurement information. The sampling rates were sufficient for the field-mapping experiments (if we did not walk too fast) but very few samples could be recorded during the actual implosion. 6. Experimental Set-Up As mentioned above, three types of data were collected in the experiments discussed here. The first set of data, which is referred to here as a “radio mapping,” was collected a few days before

9
the building was imploded. This involved carrying transmitters (or radios) tuned to various frequencies through the interior and exterior of the convention center while recording the received signal from a site located outside the convention center. The purpose of these measurements was to investigate how signals at the different frequencies couple into the convention center and to determine the variability in field strength throughout the convention center. Also, by carrying the transmitters around the exterior perimeter of the convention center, the amount (or level) of signal blockage caused by the convention center from one side to the other could be investigated. For the radio mapping experiments, three fixed receiving sites (as described above in Section 5) were assembled on the perimeter of the convention center (see Figure 1 and Figures 13 through 15). Receiving site RX 1 was placed approximate 23 m (75 ft) from the northwest perimeter of the convention center (Figure 13). Receiving site RX 2 was placed approximate 23 m (75 ft) from the northeast perimeter of the convention center (Figure 14). Receiving site RX 3 was placed approximate 15 m (50 ft) from the southeast perimeter of the convention center (Figure 15). The measurement equipment at each of these sites was placed in custom-made plywood containers wrapped in plastic for protection from the weather and the implosion (see, Figures 13-15). During this experiment, the transmitters were carried throughout the convention center and the received signal levels were recorded. Measurements were performed with the receiving antennas polarized in the vertical direction (with respect to the ground). As the received signal was recorded, the locations of the transmitters in the convention center were also recorded. For the second data set, radios were placed at four different fixed locations in the convention center where they would have a high likelihood of surviving the implosion. These four sites are labeled as “TX 1”, “TX 2”, “TX 3”, and “TX 4” in Figure 1. Received signals were collected before, during, and after the implosion. These receiving sites are the same locations as described above. After a careful analysis of the building, the following four sites were chosen: (1) in a circular vent pipe near the center of the lower level of the convention center (site TX 1: see Figure 16); (2) in a control room in the northeast corner on the lower level of the convention center (site TX 2, see Figure 17); (3) on the ground level near the west end of the south side in an office area of the convention center (site TX 3, see Figure 18); and (4) in another control room on an intermediate level in the north west corner of the convention center (site TX 4, see Figure 19). A few comments are in order about these locations. The circular vent pipe (TX 1) was chosen such that the transmitters had a high likelihood of survival as well as ensuring that a large amount of building rubble would cover the transmitters after the implosion. The two transmitter sites placed in the control rooms near the perimeter of the convention center (sites TX 2 and TX 4) were chosen in order to have a large dynamic range in the signals after the implosion. That is, data collected at a location near those corners of the convention center would have less attenuation from rubble as compared to data collected at other locations on the perimeter. Since only part of the structure was to be imploded, the third site (TX 3) was chosen at a location in the convention center where the structure would remain intact. These various transmitter sites gave us a reasonable range of propagation conditions to study; completely buried deep in the interior, buried near the perimeter, and interior adjacent to the rubble but not buried. Previous experiments [5, 7] involved the complete destruction of the building and hence did not offer

10
these options. To protect all the transmitters from implosion dust, all were wrapped in blast cloth, a fabric used to contain shrapnel from the explosions. Plywood was also placed near the transmitters located at sites TX 1, TX 2, and TX 4. This was done to give added protection to the transmitters from flying shrapnel. The receiving instruments, which monitored these transmitters planted in the building, were at both fixed locations and mobile. Three fixed receiving sites were used to collect data before, during, and after the implosion. These three sites were placed around the perimeter of the convention center and are the same receiving sites used for the field-mapping experiments. Since these locations were close to the structure and well within the danger zone during the implosion, the instruments were unmanned and had to be fully automated and protected from flying debris. The three receiving stations are shown in Figures 1, 13, 14, and 15. The mobile receiving system consisted of measurement instruments placed on a cart (see Figure 20) as described in section 5. The cart was pulled around the perimeter of the building structure both before and after the implosion, enabling direct comparison of signal strength through the standing building and later through the rubble as a function of azimuth angle (which is discussed later). We collected a third set of data to investigate the use of so-called “debris radiators.” This set of data was collected by first using antennas and then connecting a portable spectrum analyzer through a tunable impedance-matching network to metal in the building rubble. This experiment was designed to investigate the possibility of detecting radio signals from a buried transmitter that might couple onto metal objects such as electrical wires, metal pipes, re-bar, venting ducts, etc., and carry signals out to the edges of the rubble pile. We designed this experiment differently from the corresponding experiments discussed in references [5, 7]. To simulate the best-case scenario, the experiments in references [5, 7] were designed to ensure that there was an unbroken metallic object (a metal cable) placed near transmitters that would lead to the outside of the buildings. The small antenna on the transmitter radiated the signal, which then coupled to the cable. In the experiments in the convention center, we attached the steel cables directly to the transmitter’s antenna port via an impedance-matching network. We intended for this to simulate the possibility of trapped first responders touching the antenna or somehow connecting a radio or cell phone to metal objects in their immediate area. The two transmitters at sites TX 2 and TX 4 (see Figure 1) were used for the cable experiment. At site TX 2 a transmitter operating at a frequency of 448.70 MHz was connected to the cable, and at site TX 4 a transmitter operating at a frequency of 448.80 MHz was connected to the cable. The cables were then run about 10 m beyond the convention center perimeter (see Figures 21 and 22). The 10 m distance was anticipated to be beyond the point where the building debris would lie after the implosion so that we would have safe access to the cable ends. 7. Experimental Results In this section the measured data are presented. This section is divided into several subsections, with each subsection covering the different types of experiments performed in the effort.

11
7.1 Radio Mapping of Convention Center: Measured Signal Strengths The six different frequencies listed in Table 5 are the ones used in the radio mapping, or “walk-through”, experiments. The three receiving stations at the sites discussed above are used in these experiments. To calibrate the system, the transmitting units were turned on at a location outside the convention center, which had a line-of-sight (LOS) to the receiving antennas. In all these experiments, the LOS location where the transmitters were initially turned on was chosen to be approximately 15 m in front of receiving site RX 2. After all six transmitters were turned on, the units were carried either around the perimeter or through the interior of the convention center. At various points both inside and outside the convention center, the transmitter locations were recorded in the data file.
Table 5. Frequencies used in the convention center walk-through experiments.
Frequency band (MHz)
Description
49.60 Simulates a public safety band 162.09 Simulates a public safety band 226.40 Simulates a public safety band 448.30 Simulates a public safety band 902.45 Simulates a public safety or cellular phone band 1830.00 Simulates a cellular phone band
Figures 23 through 28 show the received signal strengths for the data collected at receiving site RX 1 during the building walk-throughs. The horizontal axis is labeled location. These numbers are actually locators in the data files. These reference locator numbers correspond to different locations within (or on the outside) of the convention center. Lab books recorded which location each number corresponds to. Each figure shows one of the six frequencies used in this test. The results in these figures have been normalized to the peak received signal at their respective frequencies. The peak values occurred at the line-of-sight reference location. The reference location for the data located at receiving site RX 1 was a location approximately 15 m in front of receiving site RX 1 (this location was against the outside northwest wall of the convention center). Similarly, Figures 29-34 show the received signal strengths for the data collected at receiving site RX 2 during the building walk-throughs. Each figure shows one of the six frequencies used in this test. The results in these figures have been normalized to the peak received signal at their respective frequencies. The peak values occurred at a line-of-sight reference location. The reference location for the data located at receiving site RX 2 was a location approximately 10 m in front of receiving site RX 2 (this location was against the outside northeast wall of the convention center). Figures 35 through 40 show the received signal strengths for the data collected at receiving site RX 3 during the building walk-throughs. Again, each figure shows one of the six frequencies

12
used in this test. The results in these figures have been normalized to the peak received signal at their respective frequencies. The peak values occurred at a line-of-sight reference location. The reference location for the data located at receiving site RX 3 was a location approximately 10 m in front of receiving site RX 3 (this location was against the outside southeast wall of the convention center). From the graphs in Figures 22 through 40, we can see a large variability in the received signal as the transmitters were moved throughout the convention center. These results show that this structure induced anywhere from about 40 to nearly 80 dB of signal attenuation. This 40 to 80 dB indicates the additional design margins that would be required in a link budget analysis of a communication system in order to achieve communication into a large building of this type. 7.2 Radio Mapping of Convention Center: Statistical Distributions of Signal Strength The results in the previous section illustrate that the field strengths varied by as much as 80 dB throughout the convention center. In communication systems design, the variability of the field strength is as important as the field strength itself. Knowing the variability allows the system designer to develop devices for first responders that must be capable of operating in an environment with large dynamic range in signal strength. In this section, some statistics of the field strength variability inside the convention center are investigated. The first set of data analyzed was collected for receiving site RX 1 when we carried the transmitters throughout the convention center (data in Figures 23 through 28). The histograms (2 dB bin size) for this dataset are shown in Figure 41. Table 6 summarizes the mean and median of received signal strength and the standard deviation for each frequency obtained from receiving site RX 1. The next set of data analyzed was collected for receiving site RX 2 when we carried the transmitters throughout the convention center (data in Figures 29 through 34). The histograms (2 dB bin size) for this dataset are shown in Figure 42. Table 7 summarizes the mean and median of received signal strength and the standard deviation for each frequency obtained from receiving site RX2. The next set of data analyzed was collected for receiving site RX 3 when we carried the transmitters throughout the convention center (data in Figures 35 through 40). The histograms (2 dB bin size) for this dataset are shown in Figure 43. Table 8 summarizes the mean and median of received signal strength and the standard deviation for each frequency obtained from receiving site RX3.

13
Table 6. Mean, median, and standard deviation of the normalized received signal strengths obtained from receiving site RX 1.
Frequency
(MHz) Mean (dB)
Median (dB)
Standard deviation (dB)
49.60 -62.35 -64.13 12.60 162.09 -61.04 -62.99 12.25 226.40 -66.17 -66.61 14.53 448.30 -56.72 -57.56 14.95 902.45 -64.20 -66.23 14.98 1830.00 -58.57 -61.27 11.16
Table 7. Mean, median, and standard deviation of the normalized received signal strengths obtained from receiving site RX 2.
Frequency
(MHz) Mean (dB)
Median (dB)
Standard deviation (dB)
49.60 -51.53 -52.68 14.51 162.09 -63.20 -66.32 13.98 226.40 -59.34 -60.34 14.77 448.30 -58.55 -58.95 13.83 902.45 -56.45 -57.94 14.40 1830.00 -56.61 -60.15 15.01
Table 8. Mean, median, and standard deviation of the normalized received signal strengths obtained from receiving site RX 3.
Frequency
(MHz) Mean (dB)
Median (dB)
Standard deviation (dB)
49.60 -67.05 -69.24 15.77 162.09 -67.23 -70.01 14.58 226.40 -64.83 -66.03 16.37 448.30 -59.55 -60.66 16.02 902.45 -69.11 -70.76 15.05 1830.00 -59.23 -61.71 11.95
7.3 Pre-implosion Radio Signal Measurements with Transmitters at Fixed Sites Before the implosion, and before we secured the specially prepared transmitter sets at the selected interior locations, we placed one identical set of transmitters (to avoid depleting the sealed batteries of the final transmitter sets) sequentially at each of these locations and recorded a set of baseline measurements around the exterior of the building. The data were collected by

14
using the receiving equipment mounted on the mobile cart. The cart was pulled around the perimeter of the convention center in a clockwise direction. In these measurements, we started the cart at the intersection of New York Ave. and 9th St. (see Figure 1), headed south on 9th St., right onto H St., headed west on H St., right on 11th St., headed north on 11th St., right on New York Ave., then returning to 9th St. The received power for each frequency and the GPS location of the cart were recorded at the maximum sample rate as the cart was moved. These data essentially show the azimuth radiation pattern of the building for each of the interior transmitter locations. One objective of these measurements is to get an indication of how directive are the signals emanating from the structure and are there possible benefits to be gained from moving the receiving system around the perimeter in search of stronger signals. We will see in the data that follow that there can be dramatic variation in the signal strength at different receive locations on the perimeter. This could possibly make a difference in a search and recovery operation, especially if the signals are very weak. 7.3.1 Signal-Strength Measurements for Fixed Transmit Sites Figures 44 and 45 show the variability in the received signal strength around the perimeter of the convention center for all six frequencies for transmitters located at fixed site TX 1. These two figures are for horizontally and vertically polarized receiving antennas, respectively. It should be noted that as the cart was pulled around the building, the antennas on the cart were always pointed toward the center of the convention center. Figures 46 and 47 show the data in Figure 44 and 45 normalized with respect to the overall (either horizontal or vertical polarization) maximum received signal. That is, each frequency is normalized to its maximum level for all data recorded during both perimeter travels of the receiving cart. We should note that this normalization reference includes a certain unknown amount of attenuation, caused by the structure between the transmit site and the location of best coupling on the exterior perimeter, which we cannot remove. These two plots show the relative variability in the signal strength as the cart is moved around the convention center. From these plots, we see that the presence of the convention center structural material causes the signal to vary by as much as 50 dB around the convention center perimeter. Figures 48 and 49 show the variability in the received signal strength around the perimeter of the convention center for all six frequencies for transmitters located at fixed site TX 2. These two figures are for horizontally and vertically polarized receiving antennas, respectively. Again, as the cart was pulled around the building, the antennas on the cart were always pointed toward the center of the convention center. Figures 50 and 51 show the data in Figure 48 and 49 normalized with respect to the maximum received signal. That is, each frequency is normalized to its maximum level as described above. Figures 50 and 51 show the relative variability in the signal strength as the cart is moved around the convention center. In these plots, we see that the presence of the convention center structural material causes the signal to vary by as much as 40 dB around the convention center perimeter. Figures 52 and 53 show the variability in the received signal strength around the perimeter of the convention center for all six frequencies for transmitters located at fixed site TX 3. These two figures are for horizontally and vertically polarized receiving antennas, respectively. As above, the antennas on the cart were always pointed toward the center of the convention center. Figures
15
54 and 55 show the data in Figure 52 and 53 normalized with respect to the maximum received signal. From these plots, we see that the convention center structural material causes the signal to vary by as much as 70 dB around the convention center perimeter. Figures 56 and 57 show the variability in the received signal strength around the perimeter of the convention center for all six frequencies for transmitters located at fixed site TX 4. These two figures are for horizontally and vertically polarized receiving antennas, respectively. Figures 58 and 59 show the data in Figures 56 and 57 normalized with respect to the maximum received signal. These two plots show the relative variability in the signal strength as the cart is moved around the convention center. We see that the convention center structural material causes the signal to vary by as much as 50 dB around the convention center perimeter. 7.3.2 Statistical Distributions of Signal Strength for Fixed Transmit Sites The results in the previous section illustrate that the pre-implosion received field strengths varied by as much as 50 to 70 dB around the perimeter of the convention center. In this section, some statistics of the field strength variability around the perimeter are investigated. The first set of data analyzed is for fixed transmitter site TX 1 (data in Figures 46 and 47). The histograms (2 dB bin size) for this dataset are shown in Figures 60 and 61, for horizontally and vertically polarized receiving antennas, respectively. Note that the histograms were generated from the normalized data. This presents the typical variability that would be seen for a communication system carried around the perimeter. Tables 9 and 10 summarize the mean and median received signal strength and the standard deviation for each frequency. Once again, this is not the total attenuation resulting from coupling into the convention center, but only the signal variability a communication system would experience. The next set of data analyzed is for fixed transmitter site TX 2 (normalized data in Figures 50 and 51). The histograms (2 dB bin size) for this dataset are shown in Figures 62 and 63, for horizontally and vertically polarized receiving antennas, respectively. Note the histograms were generated from the normalized data. This would be the actual variability that would be seen for a communication system carried around the perimeter. Tables 11 and 12 summarize the mean and median received signal strength and the standard deviation for each frequency. The next set of data analyzed is for fixed transmitter site TX 3 (normalized data in Figures 54 and 55). The histograms (2 dB bin size) for this dataset are shown in Figures 64 and 65, for horizontally and vertically receiving antennas, respectively. Note that the histograms were generated from the normalized data. Tables 12 and 13 summarize the mean and median received signal strength and the standard deviation for each frequency. The next set of data analyzed is for fixed transmitter site TX 4 (normalized data in Figures 58 and 59). The histograms (2 dB bin size) for this dataset are shown in Figures 66 and 67, for horizontally and vertically polarized receiving antennas, respectively. Note the histograms were generated from the normalized data. Tables 14 and 15 summarize the mean and median received signal strength and the standard deviation for each frequency.

16
Table 9. Mean, median, and standard deviation of the pre-implosion received signal
strengths from perimeter measurements for fixed transmitter site TX 1 for horizontally polarized receiving antennas.
Frequency
(MHz) Mean (dB)
Median (dB)
Standard deviation (dB)
49.60 -15.12 -16.60 5.57 162.09 -32.00 -34.99 8.36 226.40 -35.21 -36.28 11.39 448.30 -25.04 -27.10 8.73 902.45 -22.08 -25.00 7.45 1830.00 -22.97 -25.81 6.27
Table 10. Mean, median, and standard deviation of the pre-implosion received signal strengths from perimeter measurements for fixed transmitter site TX 1 for vertically
polarized receiving antennas.
Frequency (MHz)
Mean (dB)
Median (dB)
Standard deviation (dB)
49.60 -13.38 -14.87 5.06 162.09 -28.43 -28.89 6.36 226.40 -24.86 -24.21 8.80 448.30 -20.91 -21.27 7.17 902.45 -19.86 -22.23 7.07 1830.00 -20.72 -23.94 6.44
Table 11. Mean, median, and standard deviation of the pre-implosion received signal
strengths from perimeter measurements for fixed transmitter site TX 2 for horizontally polarized receiving antennas.
Frequency
(MHz) Mean (dB)
Median (dB)
Standard deviation (dB)
49.60 -20.59 -19.47 7.53 162.09 -20.49 -24.04 6.98 226.40 -22.88 -29.33 10.06 448.30 -28.07 -33.52 11.46 902.45 -20.94 -25.31 7.73 1830.00 -17.35 -19.52 4.66

17
Table 12. Mean, median, and standard deviation of the pre-implosion received signal strengths from perimeter measurements for fixed transmitter site TX 2 for vertically
polarized receiving antennas.
Frequency (MHz)
Mean (dB)
Median (dB)
Standard deviation (dB)
49.60 -29.05 -34.64 10.23 162.09 -23.31 -25.85 5.97 226.40 -24.53 -29.98 10.26 448.30 -29.25 -35.09 11.06 902.45 -22.73 -27.09 8.42 1830.00 -23.89 -27.09 7.01
Table 13. Mean, median, and standard deviation of the pre-implosion received signal strengths from perimeter measurements for fixed transmitter site TX 3 for horizontally
polarized receiving antennas.
Frequency (MHz)
Mean (dB)
Median (dB)
Standard deviation (dB)
49.60 -23.05 -22.85 5.95 162.09 -50.82 -56.01 12.83 226.40 -61.73 -67.48 16.81 448.30 -54.53 -62.16 17.33 902.45 -40.90 -47.11 12.59 1830.00 -39.82 -44.88 10.41
Table 14. Mean, median, and standard deviation of the pre-implosion received signal strengths from perimeter measurements for fixed transmitter site TX 3 for vertically
polarized receiving antennas.
Frequency (MHz)
Mean (dB)
Median (dB)
Standard deviation (dB)
49.60 -27.78 -29.44 5.30 162.09 -41.63 -45.44 9.21 226.40 -54.36 -59.64 13.81 448.30 -46.91 -51.85 14.51 902.45 -51.77 -57.94 12.71 1830.00 -42.18 -47.83 10.60

18
Table 15. Mean, median, and standard deviation of the pre-implosion received signal strengths from perimeter measurements for fixed transmitter site TX 4 for horizontally
polarized receiving antennas.
Frequency (MHz)
Mean (dB)
Median (dB)
Standard deviation (dB)
49.60 -21.20 -22.36 5.44 162.09 -33.36 -35.39 6.89 226.40 -34.69 -34.83 9.27 448.30 -42.86 -45.28 8.59 902.45 -30.44 -32.58 6.45 1830.00 -24.66 -25.96 4.72
Table 16. Mean, median, and standard deviation of the pre-implosion received signal strengths from perimeter measurements for fixed transmitter site TX 4 for vertically
polarized receiving antennas.
Frequency (MHz)
Mean (dB)
Median (dB)
Standard deviation (dB)
49.60 -22.30 -23.94 4.91 162.09 -38.45 -40.42 7.37 226.40 -40.72 -43.78 10.17 448.30 -38.38 -40.45 8.60 902.45 -29.59 -32.31 6.40 1830.00 -28.50 -30.28 5.75
7.4 Implosion Radio-Signal Measurements with Transmitters at Fixed Sites with Fixed and Mobile Receiving Sites On the day of the implosion, the fixed receiver sites discussed in Section 6 were assembled and the data collection programs were turned on two hours before the implosion. The transmitters at the four fixed locations in the convention center (see discussion in Section 6) were also turned on two hours before the implosion. Figures 68-71 show the pre- and post-implosion data for the fixed receiver located at receiving site RX 1. Each of these four figures corresponds to one of the four fixed transmitter sites. The implosion occurred at around 7:30 a.m., and this is indicated in the figures by an abrupt change in the signal levels. This receiving site was closest to transmitting site TX 4. From these figures we see that depending on the location of the transmitters, the building collapse caused the signals to increase, to decrease, or in some cases to stay basically the same. From Figure 68, it is seen that the 49.60 MHz transmitter was very weak before and after the implosion. This is due to the fact that the transmitters were placed in a metal vent pipe at TX 1,
19
and the lowest-frequency signals had difficulty coupling out of the pipe. Notice the impulsive nature (or spikes) in the signal strengths for the 162.09 MHz transmitter located at transmitter location TX 1. These spikes were due to a strong intermittent ambient signal adjacent to the test frequency. (We should note that this signal did not present a significant interference problem until the day of the implosion, when it was present in most of our measurements at 162.09 MHz. We include all the measurements in this report for completeness since the data prior to the implosion day appears to be valid.) From Figure 69, we see basically no change in the received signal at receiving site RX 1 for the transmitters at site TX 2. This is due to the fact that before and after the implosion large amounts of building materials were in the path between this receiving location and the transmitters. Results that follow will show that the transmitters at site TX 2 are indeed operational even though the signals were in the noise at RX 1. We see dramatic increase in the received signals from site TX 3 (Figure 70). This is due to the fact that, following the implosion, a large portion of the convention center fell and fewer building materials were in the direct path between these transmitters and the receiving site. The results in Figure 71 show little change. This is due to the fact that the direct propagation path from the transmitters at site TX 4 and the receiving location was unaltered by the implosion. Figures 72 through 75 show the pre- and post-implosion data for the fixed receiver located at receiving site RX 2. Each of these four figures corresponds to one of the four fixed transmitter sites. The implosion occurred at around 7:30 a.m., and this is indicated in the figures by the dramatic change in the signal levels. This receiving site was very close to transmitter site TX 2 and was farthest from transmitting sites TX 1, TX 3, and TX 4. There is a large portion of the convention center between transmitter sites TX 1, TX 3, and TX 4 and the receiver. We see in Figures 72, 74, and 75 that signals from these transmitters are very weak. In Figure 72, we see that some of the signals from TX 1 decreased while some stayed the same. Similar to the data at RX 1, we see the strong effects of the interfering ambient signal in the 162.09 MHz data. Interesting results are observed in Figure 73. These data are from the transmitters that are very close to this receiving location. In these results we see that the signal variability changed dramatically after the implosion. We do not have a good explanation for this effect. The debris of the building was complete over these transmitters so there was a dramatic change in possible multipath signals but we are unsure how this would affect the received signals at a fixed location. From Figure 74 we see that most of the signals from TX 3 increased, except for the 169.575 MHz signals, which decreased. In Figure 75, we see that some of the signals from TX 4 decreased while others stayed the same. Note that transmitter site TX 4 was the furthest from this receiving site. Figures 76 through 79 show the pre- and post-implosion data for the fixed receiver located at receiving site RX 3. Each of these four figures corresponds to one of the four fixed transmitter sites. Once again, after the implosion occurred there was a dramatic change in the signal levels. The effects of the interfering ambient signal are again very pronounced in the 162.09 MHz data of Figure 76. (All three spectrum analyzers had identical bandwidth settings and hence were equally susceptible to the strong ambient signal.) The data in these figures exhibited some interesting variations during the implosion. Notice that Figures 76 and 78 show change in the received signals, while the results in Figures 77 and 79 show virtually no change after the implosion. This is due to the fact that the transmitters at sites TX 2 and TX 4 were on the far side

20
of the building from RX 3 and their signals were too weak to show above the analyzer noise floor. This implosion was designed to create a partial collapse of the convention center, but leaving strategic parts of the building standing in order to protect adjacent buildings from the blast, as shown in the photographs in Figures 80 through 83. Fortunately for these experiments, a partial collapse represented a realistic scenario for simulating first-responder communications. Figure 80 shows the convention center collapsing, Figures 81 and 82 show the partially collapsed convention center after the implosion, and Figure 83 shows the change in the landscape as seen at each of the receiving sites before and after the implosion. After the implosion, the mobile cart was used to move a receiving system around the perimeter of the convention center to record the transmitted signals. Figure 84 shows the mobile cart being used for the post-implosion measurements. The path used was generally the same path as that used in the cart measurements before the implosion (except for dodging a few obstacles). That is, we started the cart at the intersection of New York Ave. and 9th St. (see Figure 1), headed south on 9th St., right onto H St., headed west on H St., right on 11th St., headed north on 11th St., right on New York Ave, and returning to 9th St. We collected three sets of measurement data. The first measurements were performed with the receiving antenna for the five higher frequency bands horizontally polarized. Figures 85 through 88 show the received signal strengths for the transmitters at the four different transmitting sites, respectively. By comparing these figures to the results in Figures 44, 48, 52, and 56 (the pre-implosion measurements), the effects of the convention center collapse on the signal strength can be investigated. In order to better compare the pre- and post-implosion measurements, the two datasets are overlaid with respect to the compass bearings derived from the GPS cart location. Figures 89 through 108 show the comparison of these datasets arranged by frequency and transmit site. Note that the azimuth angles on the horizontal axis correspond to the compass bearings with respect to the geometric center of the building. This means that 0° (and 360°) is due north which is midway on New York Ave., proceeding clockwise 90° is due east or midway on 9th St., 180° is south or midway on H St., and 270° is, of course, due west on 11th St. (Figure 1). We should also add that because of the building layout, the distance from the center of the building was not constant. In these comparisons, we see a wide range of effects from the partial collapse. The data show increased signal strength (Figure 95), little change in signal strength (for example, Figures 90, 91, 94, 106), or in many cases, an additional 20 to 40 dB of attenuation after the collapse, depending on location. As seen in previous charts, the 162.09 MHz post-blast data in Figure 93 are likely corrupted by the strong ambient signal. The next two sets of measurements were performed with the receiving antenna for the five higher frequency bands, vertically polarized. Figures 109 through 112 show the receiver signal strengths for the transmitters at the four different transmitting sites for the first set of vertical perimeter measurements. By comparing these figures to the results in Figures 45, 49, 53, and 57 (the pre-implosion measurements), the effect of the convention center collapse on the signal strength can be investigated. Once again, in order to better compare the pre- and post-implosion measurements, the two datasets are overlaid with respect to the GPS cart location. Figures 113 through 132 show the comparison of these data sets arranged by frequency and transmit site. Similar to the horizontally polarized measurements above, we see a wide range of effects from
21
the partial collapse. The data show increased signal strength (Figure 119), little change in signal strength (for example, Figures 114, 115, 128, 130), or in many cases, an additional 20 to 40 dB of attenuation after the collapse, depending on location. Thus, if someone were trapped under a similar rubble pile and tried to communicate with an emergency responder by two-way radio or cell phone, it is likely that their communication link would have to overcome an additional signal attenuation of 20 to 40 dB. 7.5 Field Tests of the Debris Radiator Concept Our goal in testing the debris radiator concept is to investigate whether the use of metallic debris found at the site of a building collapse or partial collapse can more efficiently guide a radio-frequency signal through the debris pile than a radio or cell phone’s built-in antenna. In collapsed building scenarios, a great deal of metallic debris is often present, including long metallic objects such as conduit, wiring, and pipes. One goal of this study was to see whether received signal levels could be improved by utilizing metallic debris in place of the normal communications antenna(s). As we did in the New Orleans [5] and Philadelphia [7] implosion experiments, we maximized our chances of a useful outcome by simulating the best-case scenario of a metallic object running continuously from a radio to a receive site. To do this, we laid stranded steel cables from two of the transmit sites to the edge of what would be the debris pile after implosion. Using pre-placed cables meant that even if post-blast safety considerations kept us from getting close to the collapsed building, we could still acquire useful data. Two cables were run, one from Transmit site TX 2 and one from Transmit site TX 4, see Figures 1, 21, 22 and 133. We measured signals in the 450 MHz frequency band from all four transmitters after the building implosion using a spectrum analyzer and three types of receiving antennas: (1) a standard omnidirectional “rubber duck” antenna; (2) a directional, log-periodic antenna with a gain of approximately ten (that is, the received signal in the direction of the array was ten times stronger than with an omni-directional antenna); and (3) direct connection to the steel cables through an impedance tuner. We repeated each measurement at least twice. Figures 134 and 135 show the post-implosion measurements being made at the two sites. In this experiment, unlike the previous two, we also tested whether using debris as a transmit antenna would improve chances of signal reception outside the debris pile. We replaced the omnidirectional “rubber duck” antenna on two of the transmitters with an impedance matching network, which was in turn attached to the stranded steel cable. Use of the impedance matching network improved the coupling efficiency of the radio wave signal to the metallic debris. Next to each transmitter that used the cable antenna, we placed transmitters that used standard “rubber duck” omnidirectional antennas. The four transmitters were tuned to similar frequencies. See Figure 133 for the experimental set-up. This experiment allowed us to compare received signal strength with and without use of the debris radiator antenna.

22
Table 17 shows the results of our measurements. The first column denotes the type of receive antenna used, while the columns correspond to the various transmit antennas. Post-implosion measurements at locations close to the debris pile show signal levels ranging from -60 to -103 dBm, higher levels than seen in our previous experiments. As found in the New Orleans and Philadelphia implosion experiments, Table 17 shows that use of the directional receiving antenna in close proximity to the debris radiator generally resulted in a higher received signal level than use of direct connection at the receiver. Direct connection signal levels ranged from 18 to 24 dB lower than measured signal with the directional antenna. Use of a more highly directional antenna could improve reception even further, but at the expense of having to aim the antenna more precisely, a factor which should be considered during search and rescue operations. Use of the cable as a transmit antenna increased the received signal level at site TX 2 when compared to the use of the omnidirectional transmit antenna. But at site TX 4, little difference was seen between the two types of transmit antennas. One possible explanation is the strong received signal level from site TX 4. We may have received signal directly over the air even though the transmitter was connected to the cable. The experiments discussed here demonstrate that the debris radiator concept may provide a “last resort” method for improving wireless communications for someone trapped in a void in a collapsed building. In particular, using debris to replace transmit antennas may be advantageous in weak-signal conditions. Experiments such as these give us an understanding of what conditions will make debris radiators most effective. Table 17. Summary of data collected from debris radiator experiments: Transmit (TX) antennas consisted of cables (“Cable”) through impedance matching networks or to omnidirectional antennas (“Omni”). Receive (RX) antennas consisted of direct connection to a matching network/cable, an omnidirectional antenna, or a directional, log-periodic array.
Site near TX2 Site near TX4
RX antenna type
TX Cable 2 448.7 MHz
(dBm)
TX Omni 448.4 MHz
(dBm)
TX Cable 4 448.8 MHz
(dBm)
TX Omni 448.6 MHz
(dBm) Direct
connection (dBm)
–94 ± 3 dB –97 ± 1 dB –78 ± 1 dB –78 ± 3 dB
Omni antenna (dBm)
–83 ± 1 dB –97 ± 6 dB –68 ± 3 dB –71 ± 3 dB
Directional antenna (dBm)
–70 ± 2 dB –78 ± 1 dB –– –60 ± 3

23
8. Recovery of Transmitters During removal of the imploded debris, the demolition contractor recovered the transmitters that were placed in the building. We requested this for two reasons. First, this equipment may be refurbished and used in following projects and secondly, so we could examine them to determine if they were damaged or destroyed by the implosion. We were particularly interested to determine if each transmitter continued to operate following the blast. This was needed to determine that if a signal from a particular transmitter was not detected after the implosion, it was a result of the signal attenuation through the rubble and not a result of the transmitter being destroyed. All the transmitters were recovered from the imploded convention center in operational condition. 9. Summary of Results and Conclusion This report summarizes radio propagation measurements performed before, during, and after the implosion of the Washington DC Convention Center. Three different types of experiments were performed during this effort. The first set of data, radio mapping, was collected a few days before the convention center was imploded. This involved carrying transmitters tuned to various frequencies through the convention center while recording the received signal at a site located outside the structure, as mentioned above. The purpose of these measurements was to investigate how the signals at the different frequencies couple into the convention center and to determine the field strength variability throughout the building. The results in Section 7.1 show that the field strengths varied significantly throughout the convention center. In designing communication systems, the variability of the field strength is as important as the field strength itself. The results show large variability with sometimes small changes in physical position (Figures 23 through 40) and are easiest to interpret by examining the histograms in Figures 41 through 43. These distributions may be used to estimate how reliable a particular communication system would be in this environment. For instance, to be 50 % reliable, the communications link would have to overcome the median attenuation (for example, 60 dB) at that frequency. A robust 100 % reliable system would have to of course overcome all the attenuation present, and this easily ranges up to 80 dB or more. The results in Section 7.2 show how the mean, median, and standard deviation of the signals varied with both frequency and location of transmitters and receiver. These attenuation numbers were obtained by normalizing the signal to outside LOS values. Therefore, these data indicate the additional design margins that may be required in a link budget analysis of a communication system in order to achieve reliable communication into a large structure of this type. These numbers can be compared to the implosion experiments performed in a 13-floor apartment building near New Orleans [5] and a large sport stadium in Philadelphia, PA [7]. The results in the convention center are similar to those obtained in these other large building experiments. While, the stadium offers about 20 dB more shielding (or larger attenuation) of the radio signals than that of the apartment building, the convention center offers approximately 10 dB less shielding than the stadium.

24
There are a number of other interesting studies and measurements published in the literature related to the attenuation of radio-frequency signals into buildings and through building materials [5, 7, 9-18]. Many, if not most, of these studies concentrated on frequencies allocated to cellular and personal communications systems near 850 and 1900 MHz and the higher gigahertz bands using measurement scenarios that model some part of the commercial cellular network including building interiors. While direct comparison of these results to our measurements is not possible, since each building and experimental setup is different, we can comment generally on how our data compare with the results in the literature. A comprehensive review of earlier (pre-1991) building attenuation studies is given by Molkdar [11]. The author notes that the statistics of the received signal strengths depend strongly on the structural design, building materials, and contents of the building. The surrounding environment (i.e., adjacent structures) also had an effect. Results for building attenuation or penetration loss were tabulated for several distinct categories, including residential (–2 to 24 dB), office building in suburban areas (1.5 to 36 dB), and office building in urban areas (2 to 38 dB). Again, these results were for the higher cellular frequencies. Devasirvatham et al. [10] claimed that the statistics of signal attenuation within the interior of a large commercial stone and masonry building for four different frequencies (850 MHz, 1.9 GHz, 4.9 GHz, and 5.8 GHz) were nearly the same. They reported path losses ranging from 20 dB to nearly 70 dB and standard deviations from 3 to 9 dB. In more recent experiments, Ju et al. [12] show attenuation (path loss) between locations within an office building ranging from 20 to 80 dB at 1800 MHz with 15 to 35 dB from floor to floor. Tarng et al. [13] measured attenuation between floors in another office structure ranging from 20 to 47 dB at 900 MHz. The attenuation values of Ju et al. and Tarng et al. are similar to our measurements, but again, the measurement setups are quite different. Walker [14] measured attenuation into several different buildings at 850 MHz and showed average attenuation that ranged from 15 to 20 dB with standard deviations ranging from 5 to 11 dB. These buildings were illuminated by multiple cellular transmitters at distant locations, and the exterior and interior signal strength measurements were extensively averaged. Davidson et al. [15] also measured building penetration loss using cellular base transmitters some distance from the buildings (similar to Walker [14]). These measurements favored the side of the building facing the transmitter. The mean attenuation of all the buildings measured was 10.8 dB at 900 MHz and 10.2 dB at 1500 MHz, with standard deviations of 5.8 dB and 5.6 dB, respectively. In similar measurements, Tanis et al. [16] reported attenuation ranging from 16 to 19 dB for 880 MHz and 1922 MHz. The measurements of Loew et al. [17] are more similar to our configuration. They measured the path loss from a street-level transmitter near the building (both line-of-sight and shadowed by another structure) to various points within multistory commercial structures. These measurements showed mean attenuation of as much as 22 dB to 33 dB for 912 MHz and 1920 MHz for specific buildings. Standard deviations varied from 8.8 to 14.5 dB. In one of the few studies at the lower VHF frequencies, Rice [18] measured several structures and reported a mean penetration loss of 24.8 dB at 35 MHz with a standard deviation of 14 dB and 23 dB loss at 150 MHz with a standard deviation of 12 dB. We see there is huge variability in the experimental setup and objectives, the definition of the reference measurement, the building properties, and the surrounding environment in the various studies of building penetration loss. However, there is a consistent message in the data, namely

25
that there is always some attenuating effect on the radio-frequency energy caused by the building. This attenuation is usually on the order of 10 to 30 dB but in certain situations can climb as high as 80 dB or more. In the second type of data collection, radio transmitters were placed in four fixed sites throughout the convention center interior. Signals received at listening stations exterior to the convention center were collected before, during, and after the implosion. The implosion is indicated in Figures 68 through 79 by the dramatic change in the signal levels. These results show that some signals experienced large amounts of additional attenuation, while other signals actually increased (less attenuation) after the implosion. This is an indication of how the mass of the structure moved during the implosion, with some regions being compacted and other regions becoming more open, and also how the signals at various frequencies interacted with the debris. Our receiving sites for these measurements were both fixed and mobile. A receiving system mounted on a modified garden cart was pulled around the perimeter of the convention center both before and after the implosion, enabling direct comparison of signal strength as a function of azimuth angle around the standing building and the resulting pile of rubble. Measurements for the transmitters in the different sites were made before the implosion such that a pre- and post-signal strength comparison could be made. In these comparisons, we see a wide range of effects from the partial collapse. The data show increased signal strength, or little change in signal strength, but in many cases, we see an additional 20 to 40 dB of attenuation after the collapse, depending on location. Thus, if someone is trapped under such a rubble pile and is trying to communicate with an emergency responder with a two-way radio or cell phone, their communication link may have to overcome 20 to 40 dB of additional attenuation caused by the building collapse. It is interesting to note that the increases in signal attenuation after the collapse of the convention center were not as large as observed during the apartment building implosion (60 to 70 dB, see ref. [5]). This can be explained by the fact the convention center had such massive amounts of concrete and steel throughout the convention center that the signal propagating through the interior of the convention center prior to the implosion behaved similarly to the signal propagating through the partially collapsed rubble piles. The apartment building, on the other hand, was very open (or essentially gutted) prior to the implosion and extremely compact afterwards. The overall attenuation in the convention center was also about 10 dB less than we measured at the Veterans’ Stadium [7]. The third set of data, referred to as “debris radiators,” was collected by connecting instruments to the convention center rubble and by using a directional antenna connected to our instruments placed in proximity of metallic debris. The purpose of this experiment was to investigate the probability of detecting radio signals from transmitter(s) under the rubble that might couple onto these metal objects and radiate signals to the edges of the rubble pile. Use of debris radiators may improve reception of signals emitted from deep within a convention center in collapsed building or other weak-signal scenarios. When the transmit antenna from a buried transmitter is replaced by a metallic cable attached through an impedance tuning network, the received signal strength increased significantly in some cases, but remained unchanged in other cases. Signals could be received from all buried transmitters by either a direct connection to the metallic debris through a matching network or a directional receive antenna placed in close proximity to the debris

26
radiator. A directional receive antenna in close proximity to a debris radiator generally had higher received signal levels than did signals acquired from direct connection to the metallic debris. The results in this report are the third in a series of reports detailing implosion experiments performed by NIST in order to better understand the first responder’s radio propagation environment and to investigate new methods for weak-signal detection. The first set of implosion experiments was performed in an apartment building in New Orleans, and the second set was performed in a large sport stadium (the “Veterans Stadium”) in Philadelphia, PA. Besides implosion experiments, NIST has also performed radio-mapping experiments in various other large structures, including apartment and office buildings, sports stadiums, stores, malls, hotels, a convention center, and warehouses. The results of the signal-strength measurements and statistical distribution for these radio-mapping experiments will also be published separately.
————————— This work was sponsored by the U.S. Department of Justice and the U.S. Department of Homeland Security through the Office of Law Enforcement Standards of NIST. We thank Mike Amann, Terri Anderson, and Bill Zell of Wrecking Corporation of America and Steven R. Pettigrew and Jeffrey S. Sizemore of Demolition Dynamics for their assistance during this experiment. Without their help, this experiment would not have been possible. We also thank members of the technical staff of the Electromagnetics Division 818, who pulled together the equipment in a short time, and Dennis Friday, Perry Wilson, and Mike Kelley for managerial support.

27
10. References [1] Statement of Requirements: Background on Public Safety Wireless Communications, The
SAFECOM Program, Department of Homeland Security, Vol. 1, March 10, 2004. [2] M. Worrell and A. MacFarlane, Phoenix Fire Department Radio System Safety Project,
Phoenix Fire Dept. Final Report, Oct. 8, 2004, http://www.ci.phoenix.az.us/FIRE/radioreport.pdf. [3] 9/11 Commission Report, National Commission on Terrorist Attacks Upon the United
States, 2004. [4] Final Report for September 11, 2001 New York World Trade Center terrorist attack,
Wireless Emergency Response Team (WERT), Oct. 2001. [5] C.L. Holloway, G. Koepke, D. Camell, K.A. Remley, D.F. Williams, S. Schima, S.
Canales, and D.T. Tamura, “Propagation and Detection of Radio Signals Before, During and After the Implosion of a Thirteen Story Apartment Building,” NIST Technical Note 1540, Boulder, CO, May 2005.
[6] C.L. Holloway, G. Koepke, D. Camell, K.A. Remley, and D.F. Williams, “Radio
Propagation Measurements During a Building Collapse: Applications for First Responders,” Proc. Intl. Symp. Advanced Radio Tech., Boulder, CO, March 2005, pp. 61-63.
[7] C.L. Holloway, G. Koepke, D. Camell, K.A. Remley, D.F. Williams, S. Schima, and
D.T. Tamura, “Propagation and Detection of Radio Signals Before, During and After the Implosion of a Large Sports Stadium (Veterans' Stadium in Philadelphia),” NIST Technical Note 1541, Boulder, CO, October 2005.
[8] APCO International, APCO Project 25 Standards for Public Safety Digital Radio, Aug.
1995, http://www.apcointl.org/frequency/project25/information.html#documents. [9] Rubinstein, T.N., “Clutter losses and environmental noise characteristics associated with
various LULC categories,” IEEE Trans. Broadcasting, 44(3): 286-293; Sept. 1998. [10] D.M.J. Devasirvatham, C. Banerjee, R.R. Murray, and D.A. Rappaport, “Four-frequency
radiowave propagation measurements of the indoor environment in a large metropolitan commercial building,” Proc. GLOBECOM 1991, Phoenix, AZ, 2-5 Dec. 1991, pp. 1282-1286.
[11] D. Molkdar, “Review on radio propagation into and within building,” IEE Proceeding-H,
38(1): 61-73; Feb. 1991.

28
[12] K.M. Ju, C.C. Chiang, H.S. Liaw, S.L. Her, “Radio propagation in office building at 1.8 GHz,” Proc. 7th IEEE Intl. Symp. on Personal, Indoor and Mobile Radio Communications, Taipei, 15-18 Oct., 1996, pp. 766-770.
[13] J.H. Tarng and D.W. Perng, “Modeling and measurement of UHF radio propagating
through floors in a multifloored building,” Proc. IEE, Microwave Antennas Propagat., 144(5): 359-363; Oct. 1997.
[14] E. Walker, “Penetration of radio signals into building in the cellular radio environment,”
Bell Syst. Tech. J., 62(9), Nov. 1983. [15] A. Davidson and C. Hill, “Measurement of building penetration into medium buildings at
900 and 1500 MHz,” IEEE Trans. Veh. Technol., 46(1): 161-168; Feb. 1997. [16] W.J. Tanis and G.J. Pilato, “Building penetration characteristics of 880 MHz and 1922
MHz radio waves,” Proc. 43th IEEE Veh. Technol. Conf., Secaucus, NJ, 18-20 May 1993, pp. 206-209.
[17] L.H. Loew, Y. Lo, M.G. Lafin, and E.E. Pol, “Building penetration measurements from
low-height base stations at 912, 1920, and 5990 MHz,” NTIA Report 95-325, National Telecommunications and Information Administration, Sept. 1995.
[18] L.P. Rice, “Radio transmission into buildings at 35 and 150 mc,” Bell Syst. Tech. J., pp.
197-210, Jan. 1959.

29
Figure 1. Overhead view of Washington DC Convention Center. (Image courtesy of the United States Geological Survey)

30
Figure 2. Pre-implosion Washington DC Convention Center.
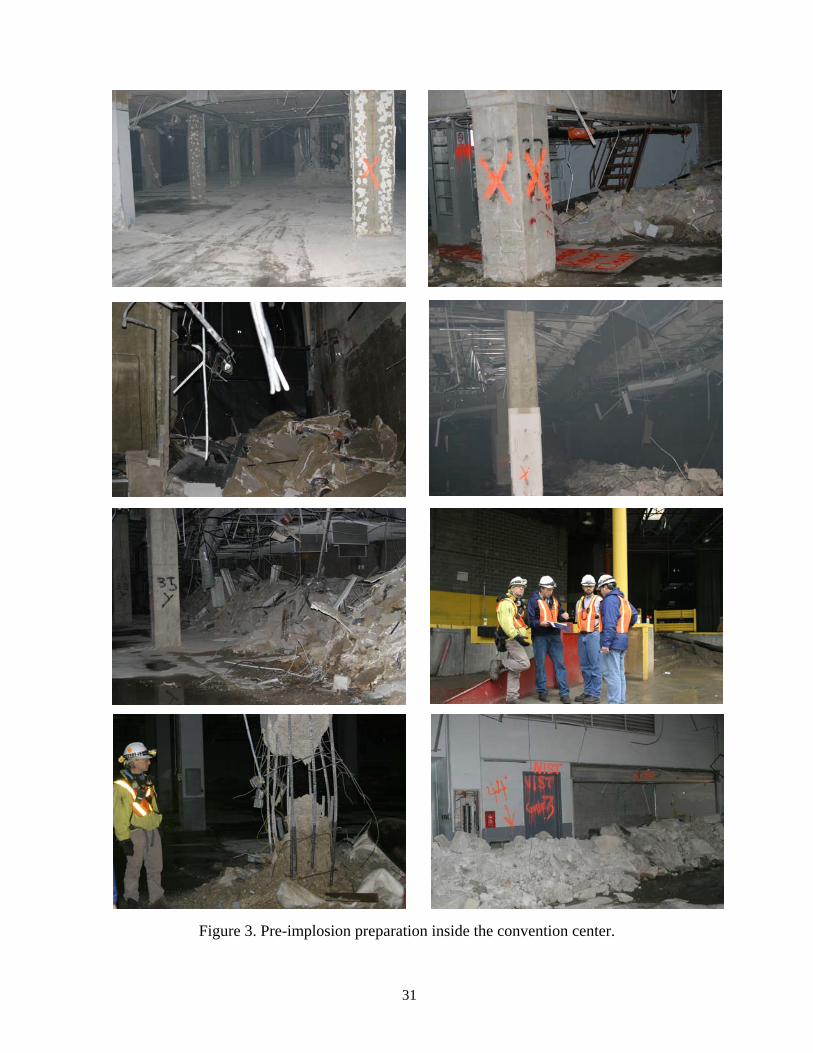
31
Figure 3. Pre-implosion preparation inside the convention center.

32
Figure 4. Pre-implosion preparation inside the convention center.
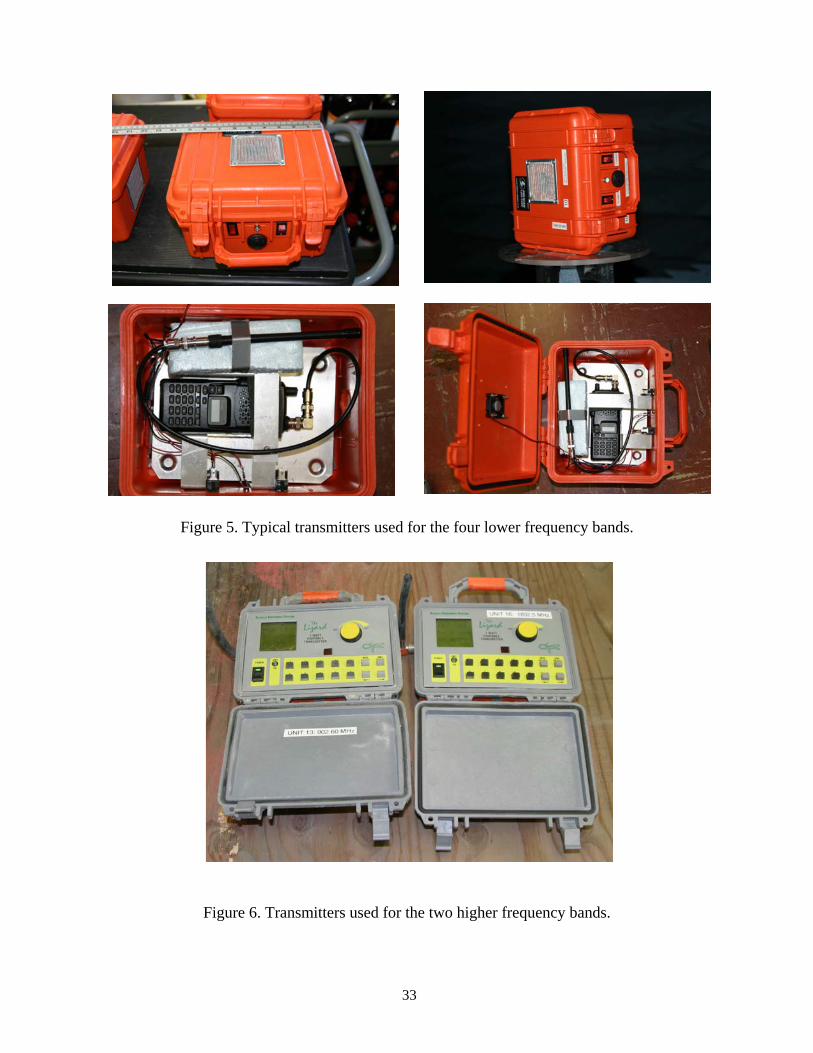
33
Figure 5. Typical transmitters used for the four lower frequency bands.
Figure 6. Transmitters used for the two higher frequency bands.

34
Figure 7. Transmitter in the NIST Boulder anechoic chamber.

35
0 30 60 90 120 150 180 210 240 270 300 330 360Angle (degrees)
-30
-29
-28
-27
-26
-25
-24
-23
-22
-21
-20
-19
-18
-17
-16
-15
|E| (
dB)
Plane 1Plane 2Plane 3
Front or Top of Box
Figure 8. Radiation pattern of a 164 MHz transmitter in a protective case.
Front or Top of Box
0 30 60 90 120 150 180 210 240 270 300 330 360Angle (degrees)
-44-43-42-41-40-39-38-37-36-35-34-33-32-31-30-29-28-27-26-25-24-23-22
|E| (
dB)
Plane 1Plane 2Plane 3
Figure 9. Radiation pattern of a 225 MHz transmitter in a protective case.

36
Front or Top of Box
0 30 60 90 120 150 180 210 240 270 300 330 360Angle (degrees)
-64-62-60-58-56-54-52-50-48-46-44-42-40-38-36-34-32-30-28-26-24-22-20-18
|E| (
dB)
Plane 1Plane 2Plane 3
Figure 10. Radiation pattern of a 448 MHz transmitter in a protective case.
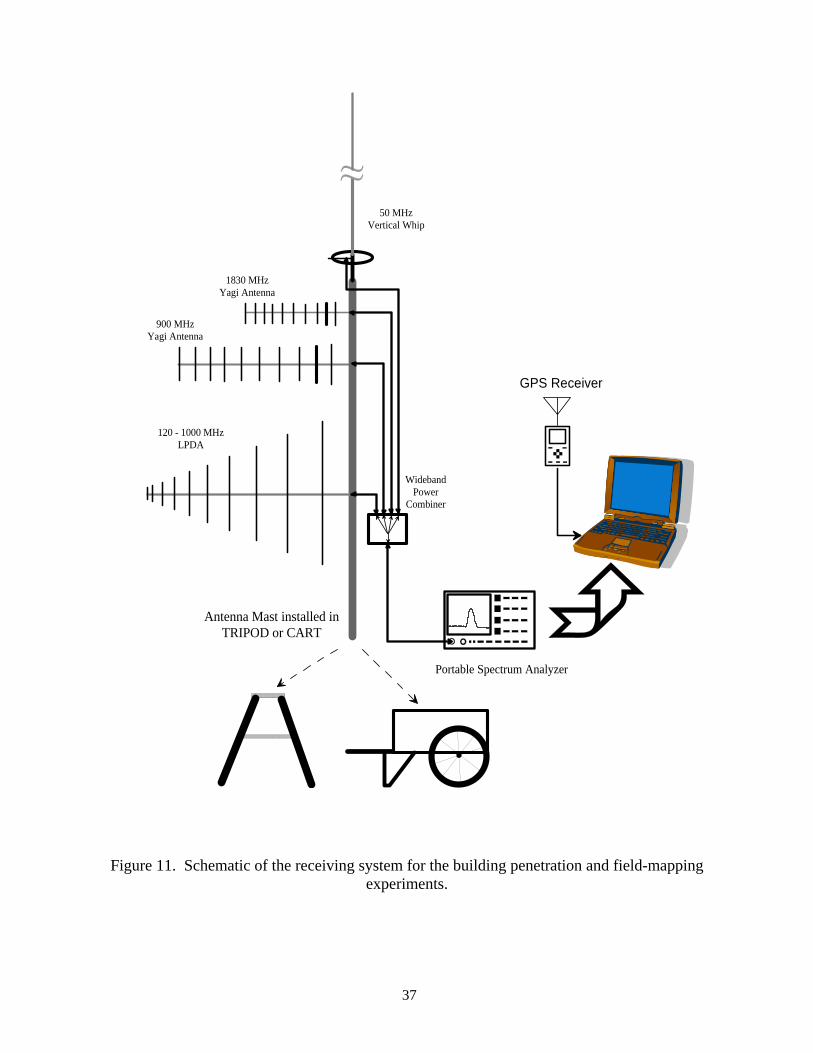
37
Figure 11. Schematic of the receiving system for the building penetration and field-mapping experiments.
WidebandPower
Combiner
50 MHzVertical Whip
1830 MHzYagi Antenna
900 MHzYagi Antenna
120 - 1000 MHzLPDA
Portable Spectrum Analyzer
Antenna Mast installed inTRIPOD or CART
GPS Receiver

38
Figure 12. Photos of the antenna system mounted on a tripod and mounted to the mobile cart. The receiving instruments are protected inside the container near the tripod and inside the cart
assembly when portable.

39
Figure 13. Fixed receiving site RX 1: northwest site. This site was used for both the radio mapping experiments (staffed) and for the implosion experiments (unstaffed).

40
Figure 14. Fixed receiving site RX 2: northeast site. This site was used for both the radio mapping experiments (staffed) and for the implosion experiments (unstaffed).

41
Figure 15. Fixed receiving site RX 3: southeast site. This site was used for both the radio mapping experiments (staffed) and for the implosion experiments (unstaffed).

42
Figure 16. Fixed transmitter location TX 1; lower lever of the convention center.
TX 1 Location

43
Figure 17. Fixed transmitter location TX 2; northeast corner in lower level.
TX 2 Location

44
Figure 18. Fixed transmitter location TX 3; an intermediate level (office area) of the convention center.
TX 3 Location

45
Figure 19. Fixed transmitter location TX 4; northwest corner on ground level.
TX 4 Location

46
Figure 20. Mobile measurement cart.

47
Figure 21. Cable on northeast side of the convention center. This cable was run from the
transmitter site (TX 2) to the outside of the building structure.
Cable connect to transmitter

48
Figure 22. Cable on northwest side of the convention center. This cable was run from the transmitter site (TX 4) to the outside of the building structure.
Cable connect to transmitter

49
0 1000 2000 3000 4000 5000 6000
Location
-100
-80
-60
-40
-20
0N
orm
aliz
ed P
ower
(dB
)
Inside:Upper level
Inside:Lower level
Inside:South offices
Transmitters on:LOS to RX2
Outside:LOS to RX1
Figure 23. Convention Center walk-through for receiving site RX1 at 49.6 MHz.
0 1000 2000 3000 4000 5000 6000
Location
-100
-80
-60
-40
-20
0
Nor
mal
ized
Pow
er (d
B)
Inside:Upper level
Inside:Lower level
Inside:South offices
Transmitters on:LOS to RX2
Outside:LOS to RX1
Figure 24. Convention Center walk-through for receiving site RX1 at 162.09 MHz.

50
0 1000 2000 3000 4000 5000 6000
Location
-110
-100
-90
-80
-70
-60
-50
-40
-30
-20
-10
0N
orm
aliz
ed P
ower
(dB
)
Inside:Upper level Inside:
Lower level
Inside:South offices
Transmitters on:LOS to RX2
Outside:LOS to RX1
Figure 25. Convention Center walk-through for receiving site RX1 at 226.40 MHz.
0 1000 2000 3000 4000 5000 6000Location
-110
-100
-90
-80
-70
-60
-50
-40
-30
-20
-10
0
Nor
mal
ized
Pow
er (d
B)
Inside:Upper level Inside:
Lower levelInside:South offices
Transmitters on:LOS to RX2
Outside:LOS to RX1
Figure 26. Convention Center walk-through for receiving site RX1 at 448.30 MHz.

51
0 1000 2000 3000 4000 5000 6000
Location
-110
-100
-90
-80
-70
-60
-50
-40
-30
-20
-10
0
Nor
mal
ized
Pow
er (d
B)
Inside:Upper level
Inside:Lower level
Inside:South offices
Transmitters on:LOS to RX2
Outside:LOS to RX1
Figure 27. Convention Center walk-through for receiving site RX1 at 902.45 MHz.
0 1000 2000 3000 4000 5000Location
-100
-90
-80
-70
-60
-50
-40
-30
-20
-10
0
Nor
mal
ized
Pow
er (d
B)
Inside:Upper level Inside:
Lower level
Inside:South offices
Transmitters on:LOS to RX2
Outside:LOS to RX1
Figure 28. Convention Center walk-through for receiving site RX1 at 1830.00 MHz.

52
0 1000 2000 3000 4000 5000 6000 7000
Location
-100
-80
-60
-40
-20
0
Nor
mal
ized
Pow
er (d
B)
Inside:Upper level Inside:
Lower level
Inside:South offices
Transmitters on:LOS to RX2 Transmitters off:
LOS to RX2
Figure 29. Convention Center walk-through for receiving site RX2 at 49.6 MHz.
0 1000 2000 3000 4000 5000 6000 7000Location
-100
-80
-60
-40
-20
0
Nor
mal
ized
Pow
er (d
B)
Inside:Upper level Inside:
Lower level
Inside:South offices
Transmitters on:LOS to RX2 Transmitters off:
LOS to RX2
Figure 30. Convention Center walk-through for receiving site RX2 at 162.09 MHz.

53
0 1000 2000 3000 4000 5000 6000
Location
-100
-80
-60
-40
-20
0N
orm
aliz
ed P
ower
(dB
)Inside:Upper level Inside:
Lower levelInside:South offices
Transmitters on:LOS to RX2
Transmitters off:LOS to RX2
Figure 31. Convention Center walk-through for receiving site RX2 at 226.40 MHz.
0 1000 2000 3000 4000 5000 6000Location
-100
-80
-60
-40
-20
0
Nor
mal
ized
Pow
er (d
B)
Inside:Upper level Inside:
Lower level
Inside:South offices
Transmitters on:LOS to RX2
Transmitters off:LOS to RX2
Figure 32. Convention Center walk-through for receiving site RX2 at 448.30 MHz.

54
0 1000 2000 3000 4000 5000 6000 7000Location
-100
-80
-60
-40
-20
0N
orm
aliz
ed P
ower
(dB
)Inside:Upper level Inside:
Lower level
Inside:South offices
Transmitters on:LOS to RX2
Transmitters off:LOS to RX2
Figure 33. Convention Center walk-through for receiving site RX2 at 902.45 MHz.
0 1000 2000 3000 4000 5000 6000 7000Location
-100
-80
-60
-40
-20
0
Nor
mal
ized
Pow
er (d
B)
Inside:Upper level Inside:
Lower levelInside:South offices
Transmitters on:LOS to RX2
Transmitters off:LOS to RX2
Figure 34. Convention Center walk-through for receiving site RX2 at 1830.00 MHz.

55
0 1000 2000 3000 4000 5000 6000 7000
Location
-100
-80
-60
-40
-20
0
Nor
mal
ized
Pow
er (d
B)
Inside:Upper level
Inside:Lower level
Inside:South offices
Transmitters on:LOS to RX2 LOS to RX3
Figure 35. Convention Center walk-through for receiving site RX3 at 49.6 MHz.
0 1000 2000 3000 4000 5000 6000 7000
Location
-100
-80
-60
-40
-20
0
Nor
mal
ized
Pow
er (d
B)
Inside:Upper level Inside:
Lower level
Inside:South offices
Transmitters on:LOS to RX2 LOS to RX3
Figure 36. Convention Center walk-through for receiving site RX3 at 162.09 MHz.

56
0 1000 2000 3000 4000 5000 6000
Location
-110
-100
-90
-80
-70
-60
-50
-40
-30
-20
-10
0
Nor
mal
ized
Pow
er (d
B)
Inside:Upper level Inside:
Lower level
Inside:South offices
Transmitters on:LOS to RX2 LOS to RX3
Figure 37. Convention Center walk-through for receiving site RX3 at 226.40 MHz.
0 1000 2000 3000 4000 5000 6000 7000Location
-100
-80
-60
-40
-20
0
Nor
mal
ized
Pow
er (d
B)
Inside:Upper level Inside:
Lower level
Inside:South offices
Transmitters on:LOS to RX2 LOS to RX3
Figure 38. Convention Center walk-through for receiving site RX3 at 448.30 MHz.

57
0 1000 2000 3000 4000 5000 6000
Location
-110
-100
-90
-80
-70
-60
-50
-40
-30
-20
-10
0
Nor
mal
ized
Pow
er (d
B)
Inside:Upper level Inside:
Lower level
Inside:South offices
Transmitters on:LOS to RX2 LOS to RX3
Figure 39. Convention Center walk-through for receiving site RX3 at 902.45 MHz.
0 1000 2000 3000 4000 5000Location
-100
-80
-60
-40
-20
0
Nor
mal
ized
Pow
er (d
B)
Inside:Upper level Inside:
Lower level
Inside:South offices
Transmitters on:LOS to RX2 LOS to RX3
a
Figure 40. Convention Center walk-through for receiving site RX3 at 1830.00 MHz.

58
(a) (b)
(c) (d)
(e) (f) Figure 41. Histograms for the data collected during walk-throughs at receiving site RX 1.
-100 -90 -80 -70 -60 -50 -40 -30 -20 -10 0Power (dB)
0
200
400
600
N
Frequency: 162.09 MHzMean: -61.04Median: -62.99Std Dev: 12.25
-100 -90 -80 -70 -60 -50 -40 -30 -20 -10 0Power (dB)
0
100
200
300
400
N
Frequency: 448.3 MHzMean: -56.72Median: -57.56Std Dev: 14.95
-100 -90 -80 -70 -60 -50 -40 -30 -20 -10 0Power (dB)
0
100
200
300
400
N
Frequency: 226.4 MHzMean: -66.17Median: -66.61Std Dev: 14.52
-100 -90 -80 -70 -60 -50 -40 -30 -20 -10 0Power (dB)
0
200
400
600
800
1000
NFrequency: 49.6 MHzMean: -62.35Median: -64.13Std Dev: 12.60
-100 -90 -80 -70 -60 -50 -40 -30 -20 -10 0Power (dB)
0
200
400
600
800
N
Frequency: 902.45 MHzMean: -64.20Median: -66.23Std Dev: 14.98
-100 -90 -80 -70 -60 -50 -40 -30 -20 -10 0Power (dB)
0
200
400
600
800
1000
N
Frequency: 1830 MHzMean: -58.57Median: -61.27Std Dev: 11.16

59
(a) (b)
(c) (d)
(f) (f) Figure 42. Histograms for the data collected during walk-throughs at receiving site RX 2.
-100 -90 -80 -70 -60 -50 -40 -30 -20 -10 0Power (dB)
0
200
400
600
NFrequency: 49.6 MHzMean: -51.83Median: -52.68Std Dev: 14.51
-100 -90 -80 -70 -60 -50 -40 -30 -20 -10 0Power (dB)
0
100
200
300
400
500
N
Frequency: 162.09 MHzMean: -63.20Median: -66.32Std Dev: 13.98
-100 -90 -80 -70 -60 -50 -40 -30 -20 -10 0Power (dB)
0
100
200
300
400
N
Frequency: 226.4 MHzMean: -59.34Median: -60.34Std Dev: 14.77
-100 -90 -80 -70 -60 -50 -40 -30 -20 -10 0Power (dB)
0
100
200
300
400
N
Frequency: 448.3 MHzMean: -58.55Median: -58.95Std Dev: 13.83
-100 -90 -80 -70 -60 -50 -40 -30 -20 -10 0Power (dB)
0
200
400
600
N
Frequency: 902.45 MHzMean: -56.45Median: -57.94Std Dev: 14.40
-100 -90 -80 -70 -60 -50 -40 -30 -20 -10 0Power (dB)
0
200
400
600
800
1000
N
Frequency: 1830 MHzMean: -56.61Median: -60.15Std Dev: 15.01

60
(a) (b)
(c) (d)
(g) (f) Figure 43. Histograms for the data collected during walk-throughs at receiving site RX 3.
-100 -90 -80 -70 -60 -50 -40 -30 -20 -10 0Power (dB)
0
200
400
600
800
NFrequency: 49.6 MHzMean: -67.05Median: -69.24Std Dev: 15.77
-100 -90 -80 -70 -60 -50 -40 -30 -20 -10 0Power (dB)
0
200
400
600
N
Frequency: 162.09 MHzMean: -67.23Median: -70.01Std Dev: 14.58
-100 -90 -80 -70 -60 -50 -40 -30 -20 -10 0Power (dB)
0
100
200
300
400
N
Frequency: 226.4 MHzMean: -64.83Median: -66.03Std Dev: 16.37
-100 -90 -80 -70 -60 -50 -40 -30 -20 -10 0Power (dB)
0
100
200
300
400
N
Frequency: 448.3 MHzMean: -59.55Median: -60.66Std Dev: 16.02
-100 -90 -80 -70 -60 -50 -40 -30 -20 -10 0Power (dB)
0
100
200
300
400
500
N
Frequency: 902.45 MHzMean: -69.11Median: -70.76Std Dev: 15.05
-100 -90 -80 -70 -60 -50 -40 -30 -20 -10 0Power (dB)
0
200
400
600
800
N
Frequency: 1830 MHzMean: -59.23Median: -61.71Std Dev: 11.95

61
0 50 100 150 200 250Location
-110
-100
-90
-80
-70
-60
-50
-40
-30
Pow
er (d
Bm
)
49.60 MHz162.09 MHz226.40 MHz448.30 MHz902.45 MHz1830.00 MHz
9th & New York
New
Yor
k &
9th
New
Yor
k &
11t
h
11th
& H
stre
et
a
a
9th
& H
stre
et
Figure 44. Signal strength measurements around the perimeter of the convention center for the transmitters located at fixed site TX 1 and horizontal polarized receiving antennas. The streets on the perimeter of the convention center are labeled.
0 50 100 150 200 250Location
-110
-100
-90
-80
-70
-60
-50
-40
-30
Pow
er (d
Bm)
49.60 MHz162.09 MHz226.40 MHz448.30 MHz902.45 MHz1830.00 MHz
9th & New York
New
Yor
k &
9th
New
Yor
k &
11t
h
11th
& H
stre
et
a
a
9th
& H
stre
et
Figure 45. Signal strength measurements around the perimeter of the convention center for the transmitters located at fixed site TX 1 and vertical polarized receiving antennas. The streets on the perimeter of the convention center are labeled.

62
0 50 100 150 200 250
Location
-100
-90
-80
-70
-60
-50
-40
-30
-20
-10
0
Nor
mal
ized
Pow
er (d
B)
49.60 MHz162.09 MHz226.40 MHz448.30 MHz902.45 MHz1830.00 MHz
9th & New York
New
Yor
k &
9th
New
Yor
k &
11t
h
11th
& H
stre
et
a
a
9th & H street
Figure 46. Normalized signal strength measurements around the perimeter of the convention center for the transmitters located at fixed site TX 1 and horizontal polarized receiving antennas. The streets on the perimeter of the convention center are labeled.
0 50 100 150 200 250
Location
-100
-90
-80
-70
-60
-50
-40
-30
-20
-10
0
Nor
mal
ized
Pow
er (d
B)
49.60 MHz162.09 MHz226.40 MHz448.30 MHz902.45 MHz1830.00 MHz
9th & New York
New
Yor
k &
9th
New
Yor
k &
11t
h
11th
& H
stre
et
a
a
9th & H street
Figure 47. Normalized signal strength measurements around the perimeter of the convention center for the transmitters located at fixed site TX 1 and vertical polarized receiving antennas. The streets on the perimeter of the convention center are labeled.

63
0 50 100 150 200 250Location
-110
-100
-90
-80
-70
-60
-50
-40
-30
Pow
er (d
Bm)
49.60 MHz162.09 MHz226.40 MHz448.30 MHz902.45 MHz1830.00 MHz
9th & New York
New
Yor
k &
9th
New
Yor
k &
11t
h
11th
& H
stre
eta
a
9th
& H
stre
et
Figure 48. Signal strength measurements around the perimeter of the convention center for the transmitters located at fixed site TX 2 and horizontal polarized receiving antennas. The streets on the perimeter of the convention center are labeled.
0 50 100 150 200 250Location
-110
-100
-90
-80
-70
-60
-50
-40
-30
Pow
er (d
Bm)
49.60 MHz162.09 MHz226.40 MHz448.30 MHz902.45 MHz1830.00 MHz
9th & New York
New
Yor
k &
9th
New
Yor
k &
11t
h
11th
& H
stre
et
a
a
9th
& H
stre
et
Figure 49. Signal strength measurements around the perimeter of the convention center for the transmitters located at fixed site TX 2 and vertical polarized receiving antennas. The streets on the perimeter of the convention center are labeled.

64
0 50 100 150 200 250
Location
-100
-90
-80
-70
-60
-50
-40
-30
-20
-10
0
Nor
mal
ized
Pow
er (d
B)
49.60 MHz162.09 MHz226.40 MHz448.30 MHz902.45 MHz1830.00 MHz
9th & New York
New
Yor
k &
9th
New
Yor
k &
11t
h
11th
& H
stre
et
a
a
9th & H street
Figure 50. Normalized signal strength measurements around the perimeter of the convention center for the transmitters located at fixed site TX 2 and horizontal polarized receiving antennas. The streets on the perimeter of the convention center are labeled.
0 50 100 150 200 250Location
-100
-90
-80
-70
-60
-50
-40
-30
-20
-10
0
Nor
mal
ized
Pow
er (d
B)
49.60 MHz162.09 MHz226.40 MHz448.30 MHz902.45 MHz1830.00 MHz
9th & New York
New
Yor
k &
9th
New
Yor
k &
11t
h
11th
& H
stre
et
a
a
9th & H street
Figure 51. Normalized signal strength measurements around the perimeter of the convention center for the transmitters located at fixed site TX 2 and vertical polarized receiving antennas. The streets on the perimeter of the convention center are labeled.

65
0 50 100 150 200 250Location
-110
-100
-90
-80
-70
-60
-50
-40
-30
-20
Pow
er (d
Bm)
49.60 MHz162.09 MHz226.40 MHz448.30 MHz902.45 MHz1830.00 MHz
9th & New York
New
Yor
k &
9th
New
York
& 1
1th
9th
& H
stre
eta
a
Figure 52. Signal strength measurements around the perimeter of the convention center for the transmitters located at fixed site TX 3 and horizontal polarized receiving antennas. The streets on the perimeter of the convention center are labeled.
0 50 100 150 200 250Location
-110
-100
-90
-80
-70
-60
-50
-40
-30
-20
Pow
er (d
Bm)
49.60 MHz162.09 MHz226.40 MHz448.30 MHz902.45 MHz1830.00 MHz
9th & New York
New
York
& 9
th
11th
& H
stre
et
a
a
9th
& H
stre
et
New
York
& 1
1th
Figure 53. Signal strength measurements around the perimeter of the convention center for the transmitters located at fixed site TX 3 and vertical polarized receiving antennas. The streets on the perimeter of the convention center are labeled.

66
0 50 100 150 200 250
Location
-100
-90
-80
-70
-60
-50
-40
-30
-20
-10
0
Nor
mal
ized
Pow
er (d
B)
49.60 MHz162.09 MHz226.40 MHz448.30 MHz902.45 MHz1830.00 MHz
9th & New York
New
Yor
k &
9th
New
York
& 11
th
11th
& H
stre
et
a
a
9th & H street
Figure 54. Normalized signal strength measurements around the perimeter of the convention center for the transmitters located at fixed site TX 3 and horizontal polarized receiving antennas. The streets on the perimeter of the convention center are labeled.
0 50 100 150 200 250Location
-100
-90
-80
-70
-60
-50
-40
-30
-20
-10
0
Nor
mal
ized
Pow
er (d
B)
49.60 MHz162.09 MHz226.40 MHz448.30 MHz902.45 MHz1830.00 MHz
9th & New YorkNe
w Yo
rk &
9th
New
York
& 11
th11
th &
H s
treet
a
a
9th
& H
stre
et
Figure 55. Normalized signal strength measurements around the perimeter of the convention
center for the transmitters located at fixed site TX 3 and vertical polarized receiving antennas. The streets on the perimeter of the convention center are labeled.

67
0 50 100 150 200 250Location
-110
-100
-90
-80
-70
-60
-50
-40
-30
Pow
er (d
Bm
)
49.60 MHz162.09 MHz226.40 MHz448.30 MHz902.45 MHz1830.00 MHz
9th & New York
New
Yor
k &
9th
New
Yor
k &
11t
h
11th
& H
stre
et
a
a
9th
& H
stre
et
Figure 56. Signal strength measurements around the perimeter of the convention center for the transmitters located at fixed site TX 4 and horizontal polarized receiving antennas. The streets on the perimeter of the convention center are labeled.
0 50 100 150 200 250 300Location
-110
-100
-90
-80
-70
-60
-50
-40
-30
-20
Pow
er (d
Bm)
49.60 MHz162.09 MHz226.40 MHz448.30 MHz902.45 MHz1830.00 MHz
9th & New York
New
Yor
k &
9th
New
York
& 1
1th
11th
& H
stre
et
a
a
9th
& H
stre
et
Figure 57. Signal strength measurements around the perimeter of the convention center for the transmitters located at fixed site TX 4 and vertical polarized receiving antennas. The streets on the perimeter of the convention center are labeled.

68
0 50 100 150 200 250
Location
-100
-90
-80
-70
-60
-50
-40
-30
-20
-10
0
Nor
mal
ized
Pow
er (d
B)
49.60 MHz162.09 MHz226.40 MHz448.30 MHz902.45 MHz1830.00 MHz
9th & New York
New
Yor
k &
9th
New
Yor
k &
11t
h
11th
& H
stre
et
a
a
9th
& H
stre
et
Figure 58. Normalized signal strength measurements around the perimeter of the convention center for the transmitters located at fixed site TX 4 and horizontal polarized receiving antennas. The streets on the perimeter of the convention center are labeled.
0 50 100 150 200 250 300Location
-100
-90
-80
-70
-60
-50
-40
-30
-20
-10
0
Nor
mal
ized
Pow
er (d
B)
49.60 MHz162.09 MHz226.40 MHz448.30 MHz902.45 MHz1830.00 MHz
9th & New York
New
Yor
k &
9th
New
Yor
k &
11th
11th
& H
stre
et
a
a
9th
& H
stre
et
Figure 59. Normalized signal strength measurements around the perimeter of the convention center for the transmitters located at fixed site TX 4 and vertical polarized receiving antennas. The streets on the perimeter of the convention center are labeled.

69
(a) (b)
(c) (d)
(e) (f) Figure 60. Histograms for the normalized perimeter measurements for site TX 1 fixed
transmitters and horizontally polarized receiving antennas.
-100 -90 -80 -70 -60 -50 -40 -30 -20 -10 0Power (dB)
0
20
40
60
80
N
Frequency: 49.6MHzMean: -15.12Median: -16.6Std Dev: 5.57
-100 -90 -80 -70 -60 -50 -40 -30 -20 -10 0Power (dB)
0
10
20
30
40
N
Frequency: 162.09MHzMean: -32.43Median: -34.99Std Dev: 8.36
-100 -90 -80 -70 -60 -50 -40 -30 -20 -10 0Power (dB)
0
10
20
30
40
50
N
Frequency: 226.4MHzMean: -35.21Median: -36.28Std Dev: 11.39
-100 -90 -80 -70 -60 -50 -40 -30 -20 -10 0Power (dB)
0
10
20
30
40
50
N
Frequency: 448.3MHzMean: -25.04Median: -27.1Std Dev: 8.73
-100 -90 -80 -70 -60 -50 -40 -30 -20 -10 0Power (dB)
0
20
40
60
80
N
Frequency: 902.45MHzMean: -22.08Median: -25.0Std Dev: 7.45
-100 -90 -80 -70 -60 -50 -40 -30 -20 -10 0Power (dB)
0
40
80
120
N
Frequency: 1830MHzMean: -22.97Median: -25.81Std Dev: 6.27

70
(a) (b)
(c) (d)
(e) (f) Figure 61. Histograms for the normalized perimeter measurements for site TX 1 fixed
transmitters and vertically polarized receiving antennas.
-100 -90 -80 -70 -60 -50 -40 -30 -20 -10 0Power (dB)
0
20
40
60
N
Frequency: 49.6MHzMean: -13.38Median: -14.87Std Dev: 5.06
-100 -90 -80 -70 -60 -50 -40 -30 -20 -10 0Power (dB)
0
10
20
30
40
N
Frequency: 162.09MHzMean: -28.43Median: -28.89Std Dev: 6.36
-100 -90 -80 -70 -60 -50 -40 -30 -20 -10 0Power (dB)
0
10
20
30
40
N
Frequency: 226.4MHzMean: -24.86Median: -24.21Std Dev: 8.80
-100 -90 -80 -70 -60 -50 -40 -30 -20 -10 0Power (dB)
0
10
20
30
40
N
Frequency: 448.3MHzMean: -20.91Median: -21.27Std Dev: 7.17
-100 -90 -80 -70 -60 -50 -40 -30 -20 -10 0Power (dB)
0
10
20
30
40
50
N
Frequency: 902.45MHzMean: -19.86Median: -22.23Std Dev: 7.07
-100 -90 -80 -70 -60 -50 -40 -30 -20 -10 0Power (dB)
0
20
40
60
80
100
N
Frequency: 1830MHzMean: -20.72Median: -23.94Std Dev: 6.44

71
(a) (b)
(c) (d)
(e) (f) Figure 62. Histograms for the normalized perimeter measurements for site TX 2 fixed
transmitters and horizontally polarized receiving antennas.
-100 -90 -80 -70 -60 -50 -40 -30 -20 -10 0Power (dB)
0
20
40
60
N
Frequency: 49.6MHzMean: -20.59Median: -19.47Std Dev: 7.53
-100 -90 -80 -70 -60 -50 -40 -30 -20 -10 0Power (dB)
0
20
40
60
80
N
Frequency: 162.09MHzMean: -20.49Median: -24.04Std Dev: 6.98
-100 -90 -80 -70 -60 -50 -40 -30 -20 -10 0Power (dB)
0
20
40
60
80
100
N
Frequency: 226.4MHzMean: -22.88Median: -29.33Std Dev: 10.08
-100 -90 -80 -70 -60 -50 -40 -30 -20 -10 0Power (dB)
0
20
40
60
N
Frequency: 448.3MHzMean: -28.07Median: -33.52Std Dev: 11.46
-100 -90 -80 -70 -60 -50 -40 -30 -20 -10 0Power (dB)
0
20
40
60
80
100
N
Frequency: 902.45MHzMean: -20.94Median: -25.31Std Dev: 7.73
-100 -90 -80 -70 -60 -50 -40 -30 -20 -10 0Power (dB)
0
20
40
60
80
100
N
Frequency: 1830MHzMean: -17.35Median: -19.52Std Dev: 4.66

72
(a) (b)
(c) (d)
(e) (f) Figure 63. Histograms for the normalized perimeter measurements for site TX 2 fixed
transmitters and vertically polarized receiving antennas.
-100 -90 -80 -70 -60 -50 -40 -30 -20 -10 0Power (dB)
0
20
40
60
80
N
Frequency: 49.6MHzMean: -29.05Median: -34.64Std Dev: 10.23
-100 -90 -80 -70 -60 -50 -40 -30 -20 -10 0Power (dB)
0
20
40
60
80
100
N
Frequency: 162.09MHzMean: -23.21Median: -25.85Std Dev: 5.97
-100 -90 -80 -70 -60 -50 -40 -30 -20 -10 0Power (dB)
0
40
80
120
N
Frequency: 226.4MHzMean: -24.53Median: -29.98Std Dev: 10.26
-100 -90 -80 -70 -60 -50 -40 -30 -20 -10 0Power (dB)
0
20
40
60
80
N
Frequency: 448.3MHzMean: -29.25Median: -35.09Std Dev: 11.06
-100 -90 -80 -70 -60 -50 -40 -30 -20 -10 0Power (dB)
0
20
40
60
80
100
N
Frequency: 902.45MHzMean: -22.73Median: -27.09Std Dev: 8.42
-100 -90 -80 -70 -60 -50 -40 -30 -20 -10 0Power (dB)
0
20
40
60
80
N
Frequency: 1830MHzMean: -23.89Median: -27.09Std Dev: 7.01

73
(a) (b)
(c) (d)
(e) (f) Figure 64. Histograms for the normalized perimeter measurements for site TX 3 fixed
transmitters and horizontally polarized receiving antennas.
-100 -90 -80 -70 -60 -50 -40 -30 -20 -10 0Power (dB)
0
10
20
30
40
50
N
Frequency: 49.6MHzMean: -23.05Median: -22.85Std Dev: 5.95
-100 -90 -80 -70 -60 -50 -40 -30 -20 -10 0Power (dB)
0
20
40
60
80
100
N
Frequency: 162.09MHzMean: -50.82Median: -56.01Std Dev: 12.83
-100 -90 -80 -70 -60 -50 -40 -30 -20 -10 0Power (dB)
0
10
20
30
40
50
N
Frequency: 226.4MHzMean: -61.73Median: -67.48Std Dev: 16.81
-100 -90 -80 -70 -60 -50 -40 -30 -20 -10 0Power (dB)
0
10
20
30
40
N
Frequency: 448.3MHzMean: -54.53
Median: -62.16Std Dev: 17.33
-100 -90 -80 -70 -60 -50 -40 -30 -20 -10 0Power (dB)
0
20
40
60
80
N
Frequency: 902.45MHzMean: -40.90Median: -47.11Std Dev: 12.59
-100 -90 -80 -70 -60 -50 -40 -30 -20 -10 0Power (dB)
0
20
40
60
80
100
N
Frequency: 1830MHzMean: -39.82Median: -44.88Std Dev: 10.41

74
(a) (b)
(c) (d)
(e) (f) Figure 65. Histograms for the normalized perimeter measurements for site TX 3 fixed
transmitters and vertically polarized receiving antennas.
-100 -90 -80 -70 -60 -50 -40 -30 -20 -10 0Power (dB)
0
20
40
60
80
N
Frequency: 49.6MHzMean: -27.78Median: -29.41Std Dev: 5.30
-100 -90 -80 -70 -60 -50 -40 -30 -20 -10 0Power (dB)
0
20
40
60
80
N
Frequency: 162.09MHzMean: -41.63Median: -45.44Std Dev: 9.21
-100 -90 -80 -70 -60 -50 -40 -30 -20 -10 0Power (dB)
0
10
20
30
40
50
N
Frequency: 226.4MHzMean: -54.36
Median: -59.64Std Dev: 13.81
-100 -90 -80 -70 -60 -50 -40 -30 -20 -10 0Power (dB)
0
10
20
30
40
N
Frequency: 448.3MHzMean: -46.91Median: -51.85Std Dev: 14.51
-100 -90 -80 -70 -60 -50 -40 -30 -20 -10 0Power (dB)
0
20
40
60
80
N
Frequency: 902.45MHzMean: -51.74
Median: -57.94Std Dev: 12.71
-100 -90 -80 -70 -60 -50 -40 -30 -20 -10 0Power (dB)
0
20
40
60
80
100
N
Frequency: 1830MHzMean: -42.18Median: -47.83Std Dev: 10.06

75
(a) (b)
(c) (d)
(e) (f) Figure 66. Histograms for the normalized perimeter measurements for site TX 4 fixed
transmitters and horizontally polarized receiving antennas.
-100 -90 -80 -70 -60 -50 -40 -30 -20 -10 0Power (dB)
0
20
40
60
N
Frequency: 49.6MHzMean: -21.20Median: -22.36Std Dev: 5.44
-100 -90 -80 -70 -60 -50 -40 -30 -20 -10 0Power (dB)
0
20
40
60
80
N
Frequency: 162.09MHzMean: -33.36Median: -35.39Std Dev: 6.89
-100 -90 -80 -70 -60 -50 -40 -30 -20 -10 0Power (dB)
0
10
20
30
40
50
N
Frequency: 226.4MHzMean: -34.69Median: -34.83Std Dev: 9.27
-100 -90 -80 -70 -60 -50 -40 -30 -20 -10 0Power (dB)
0
10
20
30
40
50
N
Frequency: 448.3MHzMean: -42.86Median: -45.28Std Dev: 8.59
-100 -90 -80 -70 -60 -50 -40 -30 -20 -10 0Power (dB)
0
20
40
60
80
100
N
Frequency: 902.45MHzMean: -30.44Median: -32.58Std Dev: 6.45
-100 -90 -80 -70 -60 -50 -40 -30 -20 -10 0Power (dB)
0
40
80
120
160
N
Frequency: 1830MHzMean: -24.60Median: -25.96Std Dev: 4.72

76
(a) (b)
(c) (d)
(e) (f) Figure 67. Histograms for the normalized perimeter measurements for site TX 4 fixed
transmitters and vertically polarized receiving antennas.
-100 -90 -80 -70 -60 -50 -40 -30 -20 -10 0Power (dB)
0
20
40
60
80
100
N
Frequency: 49.6MHzMean: -22.30Median: -23.84Std Dev: 4.91
-100 -90 -80 -70 -60 -50 -40 -30 -20 -10 0Power (dB)
0
20
40
60
80
N
Frequency: 162.09MHzMean: -38.45Median: -40.42Std Dev: 7.37
-100 -90 -80 -70 -60 -50 -40 -30 -20 -10 0Power (dB)
0
20
40
60
80
N
Frequency: 226.4MHzMean: -40.72Median: -43.78Std Dev: 10.17
-100 -90 -80 -70 -60 -50 -40 -30 -20 -10 0Power (dB)
0
20
40
60
80
100
N
Frequency: 448.3MHzMean: -38.38Median: -40.45Std Dev: 8.60
-100 -90 -80 -70 -60 -50 -40 -30 -20 -10 0Power (dB)
0
40
80
120
160
N
Frequency: 902.45MHzMean: -29.95Median: -32.31Std Dev: 6.40
-100 -90 -80 -70 -60 -50 -40 -30 -20 -10 0Power (dB)
0
40
80
120
160
200
N
Frequency: 1830MHzMean: -28.50Median: -30.28Std Dev: 5.75
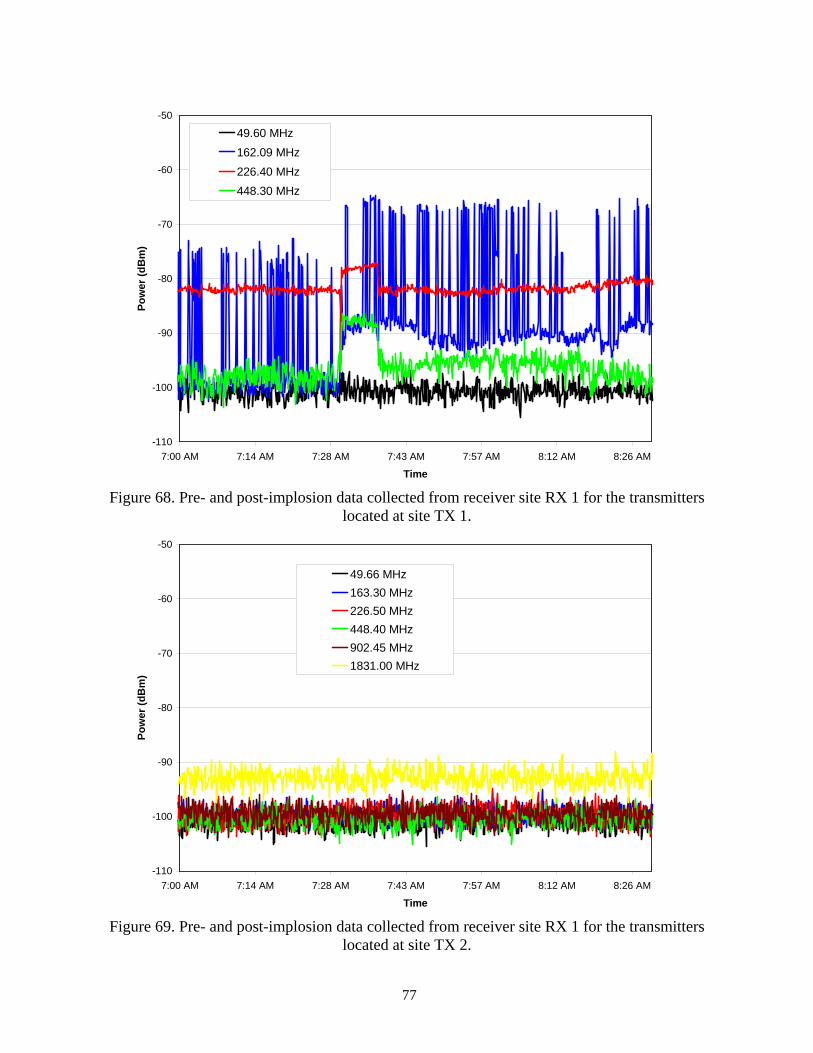
77
-110
-100
-90
-80
-70
-60
-50
7:00 AM 7:14 AM 7:28 AM 7:43 AM 7:57 AM 8:12 AM 8:26 AM
Time
Pow
er (d
Bm
)49.60 MHz 162.09 MHz 226.40 MHz 448.30 MHz
Figure 68. Pre- and post-implosion data collected from receiver site RX 1 for the transmitters
located at site TX 1.
-110
-100
-90
-80
-70
-60
-50
7:00 AM 7:14 AM 7:28 AM 7:43 AM 7:57 AM 8:12 AM 8:26 AM
Time
Pow
er (d
Bm
)
49.66 MHz 163.30 MHz226.50 MHz 448.40 MHz 902.45 MHz 1831.00 MHz
Figure 69. Pre- and post-implosion data collected from receiver site RX 1 for the transmitters
located at site TX 2.

78
-110
-100
-90
-80
-70
-60
-50
7:00 AM 7:14 AM 7:28 AM 7:43 AM 7:57 AM 8:12 AM 8:26 AM
Time
Pow
er (d
Bm
)49.72 MHz
169.575 MHz
226.60 MHz
448.50 MHz
1831.50 MHz
Figure 70. Pre- and post-implosion data collected from receiver site RX 1 for the transmitters
located at site TX 3.
-110
-100
-90
-80
-70
-60
-50
5:00 AM 5:28 AM 5:57 AM 6:26 AM 6:55 AM 7:24 AM 7:52 AM 8:21 AM
Time
Pow
er (d
Bm
)
49.78 MHz173.50 MHz226.70 MHz448.60 MHz902.75 MHz1832.00 MHz
Figure 71. Pre- and post-implosion data collected from receiver site RX 1 for the transmitters
located at site TX 4.

79
-110
-100
-90
-80
-70
-60
-50
5:00 AM 5:28 AM 5:57 AM 6:26 AM 6:55 AM 7:24 AM 7:52 AM 8:21 AM
Time
Pow
er (d
Bm
)49.60 MHz162.09 MHz 226.40 MHz448.30 MHz
Figure 72. Pre- and post-implosion data collected from receiver site RX 2 for the transmitters
located at site TX 1.
-110
-100
-90
-80
-70
-60
-50
5:00 AM 5:28 AM 5:57 AM 6:26 AM 6:55 AM 7:24 AM 7:52 AM 8:21 AM
Time
Pow
er (d
Bm
)
49.66 MHz163.30 MHz226.50 MHz448.40 MHz902.45 MHz1831.00 MHz
Figure 73. Pre- and post-implosion data collected from receiver site RX 2 for the transmitters
located at site TX 2.

80
-110
-100
-90
-80
-70
-60
-50
5:00 AM 5:28 AM 5:57 AM 6:26 AM 6:55 AM 7:24 AM 7:52 AM 8:21 AM
Time
Pow
er (d
Bm
)49.72 MHz169.575 MHz226.60 MHz448.50 MHz1831.50 MHz
Figure 74. Pre- and post-implosion data collected from receiver site RX 2 for the transmitters
located at site TX 3.
-110
-100
-90
-80
-70
-60
-50
5:00 AM 5:28 AM 5:57 AM 6:26 AM 6:55 AM 7:24 AM 7:52 AM 8:21 AM
Time
Pow
er (d
Bm
)
49.78 MHz173.50 MHz226.70 MHz448.60 MHz902.75 MHz1832.00 MHz
Figure 75. Pre- and post-implosion data collected from receiver site RX 2 for the transmitters
located at site TX 4.

81
-110
-100
-90
-80
-70
-60
-50
5:00 AM 5:28 AM 5:57 AM 6:26 AM 6:55 AM 7:24 AM 7:52 AM 8:21 AM
Time
Pow
er (d
Bm
)49.60 MHz162.09 MHz226.40 MHz448.30 MHz
Figure 76. Pre- and post-implosion data collected from receiver site RX 3 for the transmitters
located at site TX 1.
-110
-100
-90
-80
-70
-60
-50
5:00 AM 5:28 AM 5:57 AM 6:26 AM 6:55 AM 7:24 AM 7:52 AM 8:21 AM
Time
Pow
er (d
Bm
)
49.66 MHz163.30 MHz226.50 MHz448.40 MHz902.45 MHz1831.00 MHz
Figure 77. Pre- and post-implosion data collected from receiver site RX 3 for the transmitters
located at site TX 2.

82
-110
-100
-90
-80
-70
-60
-50
5:00 AM 5:28 AM 5:57 AM 6:26 AM 6:55 AM 7:24 AM 7:52 AM 8:21 AM
Time
Pow
er (d
Bm
)49.72 MHz
169.575 MHz
226.60 MHz
448.50 MHz
1831.50 MHz
Figure 78. Pre- and post-implosion data collected from receiver site RX 3 for the transmitters
located at site TX 3.
-110
-100
-90
-80
-70
-60
-50
5:00 AM 5:28 AM 5:57 AM 6:26 AM 6:55 AM 7:24 AM 7:52 AM 8:21 AM
Time
Pow
er (d
Bm
)
49.78 MHz173.50 MHz226.70 MHz448.60 MHz902.75 MHz1832.00 MHz
Figure 79. Pre- and post-implosion data collected from receiver site RX 3 for the transmitters
located at site TX 4.

83
Figure 80. The convention center collapses during the implosion sequence.

84
Figure 81. Photos of partially collapsed convention center after the implosion.

85
Figure 82. Photos of partially collapsed convention center after the implosion.

86
(a)
(b)
(c)
Figure 83. Receiving sites before and after implosion (a) site RX 1, (b) site RX 2, and (c) site RX 3.

87
Figure 84. Illustration of measurements with mobile cart.

88
0 10 20 30 40 50 60 70 80 90 100 110Location
-110
-100
-90
-80
-70
-60
-50
-40
-30
Pow
er (d
Bm)
49.60 MHz162.09 MHz226.40 MHz448.30 MHz
9th & New York
New
Yor
k &
9th
New
Yor
k &
11t
h
11th
& H
stre
eta
a
9th & H street
Figure 85. Post-implosion mobile cart perimeter measurements for the transmitters at transmitter site TX 1 for horizontally polarized receiving antennas.
0 10 20 30 40 50 60 70 80 90 100 110Location
-110
-100
-90
-80
-70
-60
-50
-40
-30
Pow
er (d
Bm)
49.66 MHz163.30 MHz226.50 MHz448.40 MHz902.45 MHz1831.00 MHz
9th & New York
New
Yor
k &
9th
New
Yor
k &
11t
h
11th
& H
stre
et
a
a
9th & H street
Figure 86. Post-implosion mobile cart perimeter measurements for the transmitters at transmitter site TX 2 for horizontally polarized receiving antennas.

89
0 10 20 30 40 50 60 70 80 90 100 110Location
-110
-100
-90
-80
-70
-60
-50
-40
-30
Pow
er (d
Bm)
49.72 MHz169.575 MHz226.60 MHz448.50 MHz1831.50 MHz
9th & New York
New
Yor
k &
9th
New
Yor
k &
11t
h
11th
& H
stre
eta
a
9th & H street
Figure 87. Post-implosion mobile cart perimeter measurements for the transmitters at transmitter site TX 3 for horizontally polarized receiving antennas.
0 10 20 30 40 50 60 70 80 90 100 110Location
-110
-100
-90
-80
-70
-60
-50
-40
-30
Pow
er (d
Bm)
49.78 MHz173.50 MHz226.70 MHz448.60 MHz902.75 MHz1832.00 MHz
9th & New York
New
Yor
k &
9th
New
Yor
k &
11t
h
11th
& H
stre
et
a
a
9th & H street
Figure 88. Post-implosion mobile cart perimeter measurements for the transmitters at transmitter site TX 4 for horizontally polarized receiving antennas.

90
0
45
90
135
180
225
270
315
-110 -90 -70 -50(dBm)
Washington DC Convention Center49.6 MHz-Hpol-PreBlast-Site TX 149.6 MHz-Hpol-PostBlast-Site TX 1
Perimeter Signal Strength around DC Convention CtrBefore and After Implosion vs. Compass Bearing0 = North, 90 = East, 180 = South, 270 = West
a
Figure 89. Comparison of pre- and post-implosion mobile cart perimeter measurements for the transmitters at site TX 1 for horizontally polarized receiving antennas: 49 MHz band.
0
45
90
135
180
225
270
315
-110 -90 -70 -50(dBm)
Washington DC Convention Center49.6 MHz-Hpol-PreBlast-Site TX 249.66 MHz-Hpol-PostBlast-Site TX 2
Perimeter Signal Strength around DC Convention CtrBefore and After Implosion vs. Compass Bearing0 = North, 90 = East, 180 = South, 270 = West
a
Figure 90. Comparison of pre- and post-implosion mobile cart perimeter measurements for the transmitters at site TX 2 for horizontally polarized receiving antennas: 49 MHz band.

91
0
45
90
135
180
225
270
315
-110 -90 -70 -50(dBm)
Washington DC Convention Center49.6 MHz-Hpol-PreBlast-Site TX 349.72 MHz-Hpol-PostBlast-Site TX 3
Perimeter Signal Strength around DC Convention CtrBefore and After Implosion vs. Compass Bearing0 = North, 90 = East, 180 = South, 270 = West
a
Figure 91. Comparison of pre- and post-implosion mobile cart perimeter measurements for the transmitters at site TX 3 for horizontally polarized receiving antennas: 49 MHz band.
0
45
90
135
180
225
270
315
-110 -90 -70 -50(dBm)
Washington DC Convention Center49.6 MHz-Hpol-PreBlast-Site TX 449.78 MHz-Hpol-PostBlast-Site TX 4
Perimeter Signal Strength around DC Convention CtrBefore and After Implosion vs. Compass Bearing0 = North, 90 = East, 180 = South, 270 = West
a
Figure 92. Comparison of pre- and post-implosion mobile cart perimeter measurements for the transmitters at site TX 4 for horizontally polarized receiving antennas: 49 MHz band.

92
0
45
90
135
180
225
270
315
-110 -90 -70 -50(dBm)
Washington DC Convention Center162.09 MHz-Hpol-PreBlast-Site TX 1162.09 MHz-Hpol-PostBlast-Site TX 1
Perimeter Signal Strength around DC Convention CtrBefore and After Implosion vs. Compass Bearing0 = North, 90 = East, 180 = South, 270 = West
a
Figure 93. Comparison of pre- and post-implosion mobile cart perimeter measurements for the transmitters at site TX 1 for horizontally polarized receiving antennas: 160 MHz band.
0
45
90
135
180
225
270
315
-110 -90 -70 -50(dBm)
Washington DC Convention Center162.09 MHz-Hpol-PreBlast-Site TX 2163.3 MHz-Hpol-PostBlast-Site TX 2
Perimeter Signal Strength around DC Convention CtrBefore and After Implosion vs. Compass Bearing0 = North, 90 = East, 180 = South, 270 = West
a
Figure 94. Comparison of pre- and post-implosion mobile cart perimeter measurements for the transmitters at site TX 2 for horizontally polarized receiving antennas: 160 MHz band.

93
0
45
90
135
180
225
270
315
-110 -90 -70 -50(dBm)
Washington DC Convention Center162.09 MHz-Hpol-PreBlast-Site TX 3169.575 MHz-Hpol-PostBlast-Site TX 3
Perimeter Signal Strength around DC Convention CtrBefore and After Implosion vs. Compass Bearing0 = North, 90 = East, 180 = South, 270 = West
a
Figure 95. Comparison of pre- and post-implosion mobile cart perimeter measurements for the transmitters at site TX 3 for horizontally polarized receiving antennas: 160 MHz band.
0
45
90
135
180
225
270
315
-110 -90 -70 -50(dBm)
Washington DC Convention Center162.09 MHz-Hpol-PreBlast-Site TX 4173.5 MHz-Hpol-PostBlast-Site TX 4
Perimeter Signal Strength around DC Convention CtrBefore and After Implosion vs. Compass Bearing0 = North, 90 = East, 180 = South, 270 = West
a
Figure 96. Comparison of pre- and post-implosion mobile cart perimeter measurements for the
transmitters at site TX 4 for horizontally polarized receiving antennas: 160 MHz band.

94
0
45
90
135
180
225
270
315
-110 -90 -70 -50(dBm)
Washington DC Convention Center226.4 MHz-Hpol-PreBlast-Site TX 1226.4 MHz-Hpol-PostBlast-Site TX 1
Perimeter Signal Strength around DC Convention CtrBefore and After Implosion vs. Compass Bearing0 = North, 90 = East, 180 = South, 270 = West
a
Figure 97. Comparison of pre- and post-implosion mobile cart perimeter measurements for the transmitters at site TX 1 for horizontally polarized receiving antennas: 225 MHz band.
0
45
90
135
180
225
270
315
-110 -90 -70 -50(dBm)
Washington DC Convention Center226.4 MHz-Hpol-PreBlast-Site TX 2226.5 MHz-Hpol-PostBlast-Site TX 2
Perimeter Signal Strength around DC Convention CtrBefore and After Implosion vs. Compass Bearing0 = North, 90 = East, 180 = South, 270 = West
a
Figure 98. Comparison of pre- and post-implosion mobile cart perimeter measurements for the transmitters at site TX 2 for horizontally polarized receiving antennas: 225 MHz band.
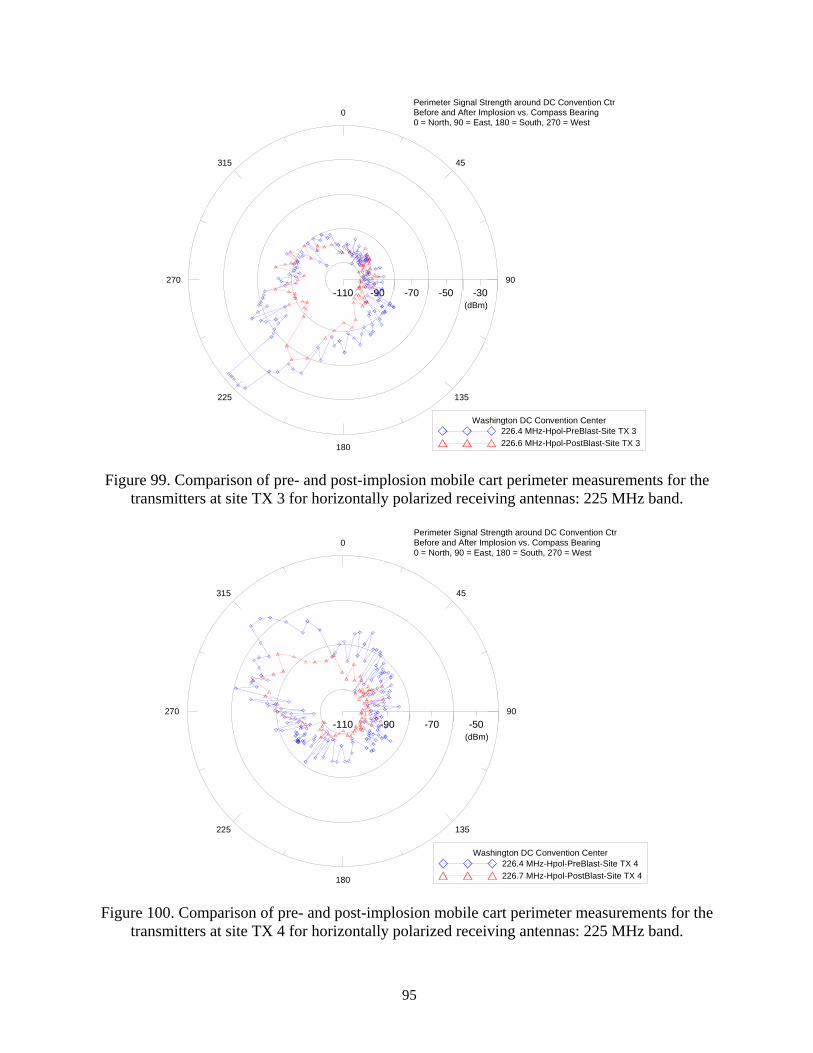
95
0
45
90
135
180
225
270
315
-110 -90 -70 -50 -30(dBm)
Washington DC Convention Center226.4 MHz-Hpol-PreBlast-Site TX 3226.6 MHz-Hpol-PostBlast-Site TX 3
Perimeter Signal Strength around DC Convention CtrBefore and After Implosion vs. Compass Bearing0 = North, 90 = East, 180 = South, 270 = West
a
Figure 99. Comparison of pre- and post-implosion mobile cart perimeter measurements for the transmitters at site TX 3 for horizontally polarized receiving antennas: 225 MHz band.
0
45
90
135
180
225
270
315
-110 -90 -70 -50(dBm)
Washington DC Convention Center226.4 MHz-Hpol-PreBlast-Site TX 4226.7 MHz-Hpol-PostBlast-Site TX 4
Perimeter Signal Strength around DC Convention CtrBefore and After Implosion vs. Compass Bearing0 = North, 90 = East, 180 = South, 270 = West
a
Figure 100. Comparison of pre- and post-implosion mobile cart perimeter measurements for the transmitters at site TX 4 for horizontally polarized receiving antennas: 225 MHz band.

96
0
45
90
135
180
225
270
315
-110 -90 -70 -50(dBm)
Washington DC Convention Center448.3 MHz-Hpol-PreBlast-Site TX 1448.3 MHz-Hpol-PostBlast-Site TX 1
Perimeter Signal Strength around DC Convention CtrBefore and After Implosion vs. Compass Bearing0 = North, 90 = East, 180 = South, 270 = West
a
Figure 101. Comparison of pre- and post-implosion mobile cart perimeter measurements for the transmitters at site TX 1 for horizontally polarized receiving antennas: 450 MHz band.
0
45
90
135
180
225
270
315
-110 -90 -70 -50(dBm)
Washington DC Convention Center448.4 MHz-Hpol-PostBlast-Site TX 2448.3 MHz-Hpol-PreBlast-Site TX 2
Perimeter Signal Strength around DC Convention CtrBefore and After Implosion vs. Compass Bearing0 = North, 90 = East, 180 = South, 270 = West
a
Figure 102. Comparison of pre- and post-implosion mobile cart perimeter measurements for the transmitters at site TX 2 for horizontally polarized receiving antennas: 450 MHz band.

97
0
45
90
135
180
225
270
315
-110 -90 -70 -50 -30(dBm)
Washington DC Convention Center448.3 MHz-Hpol-PreBlast-Site TX 3448.5 MHz-Hpol-PostBlast-Site TX 3
Perimeter Signal Strength around DC Convention CtrBefore and After Implosion vs. Compass Bearing0 = North, 90 = East, 180 = South, 270 = West
a
Figure 103. Comparison of pre- and post-implosion mobile cart perimeter measurements for the transmitters at site TX 3 for horizontally polarized receiving antennas: 450 MHz band.
0
45
90
135
180
225
270
315
-110 -90 -70 -50(dBm)
Washington DC Convention Center448.3 MHz-Hpol-PreBlast-Site TX 4448.6 MHz-Hpol-PostBlast-Site TX 4
Perimeter Signal Strength around DC Convention CtrBefore and After Implosion vs. Compass Bearing0 = North, 90 = East, 180 = South, 270 = West
a
Figure 104. Comparison of pre- and post-implosion mobile cart perimeter measurements for the transmitters at site TX 4 for horizontally polarized receiving antennas: 450 MHz band.

98
0
45
90
135
180
225
270
315
-110 -90 -70 -50(dBm)
Washington DC Convention Center902.45 MHz-Hpol-PostBlast-Site TX 2902.45 MHz-Hpol-PreBlast-Site TX 2
Perimeter Signal Strength around DC Convention CtrBefore and After Implosion vs. Compass Bearing0 = North, 90 = East, 180 = South, 270 = West
a
Figure 105. Comparison of pre- and post-implosion mobile cart perimeter measurements for the transmitters at site TX 2 for horizontally polarized receiving antennas: 900 MHz band.
0
45
90
135
180
225
270
315
-110 -90 -70 -50(dBm)
Washington DC Convention Center902.45 MHz-Hpol-PreBlast-Site TX 4902.75 MHz-Hpol-PostBlast-Site TX 4
Perimeter Signal Strength around DC Convention CtrBefore and After Implosion vs. Compass Bearing0 = North, 90 = East, 180 = South, 270 = West
a
Figure 106. Comparison of pre- and post-implosion mobile cart perimeter measurements for the transmitters at site TX 4 for horizontally polarized receiving antennas: 900 MHz band.

99
0
45
90
135
180
225
270
315
-110 -90 -70 -50(dBm)
Washington DC Convention Center1830 MHz-Hpol-PreBlast-Site TX 21831 MHz-Hpol-PostBlast-Site TX 2
Perimeter Signal Strength around DC Convention CtrBefore and After Implosion vs. Compass Bearing0 = North, 90 = East, 180 = South, 270 = West
a
Figure 107. Comparison of pre- and post-implosion mobile cart perimeter measurements for the
transmitters at site TX 2 for horizontally polarized receiving antennas: 1800 MHz band.
0
45
90
135
180
225
270
315
-110 -90 -70 -50(dBm)
Washington DC Convention Center1830 MHz-Hpol-PreBlast-Site TX 31831.5 MHz-Hpol-PostBlast-Site TX 3
Perimeter Signal Strength around DC Convention CtrBefore and After Implosion vs. Compass Bearing0 = North, 90 = East, 180 = South, 270 = West
a
Figure 108. Comparison of pre- and post-implosion mobile cart perimeter measurements for the transmitters at site TX 3 for horizontally polarized receiving antennas: 1800 MHz band.

100
100 110 120 130 140 150 160 170 180 190 200 210Location
-110
-100
-90
-80
-70
-60
-50
-40
-30
Pow
er (d
Bm)
49.60 MHz162.09 MHz226.40 MHz448.30 MHz
9th & New York
New
Yor
k &
9th
New
Yor
k &
11t
h
11th
& H
stre
eta
a
9th & H street
Figure 109. Post-implosion mobile cart perimeter measurements for the transmitters at transmitter site TX 1 for vertically polarized receiving antennas.
100 110 120 130 140 150 160 170 180 190 200 210Location
-110
-100
-90
-80
-70
-60
-50
-40
-30
Pow
er (d
Bm)
49.66 MHz163.30 MHz226.50 MHz448.40 MHz902.45 MHz1831.00 MHz
9th & New York
New
Yor
k &
9th
New
Yor
k &
11t
h
11th
& H
stre
et
a
a
9th
& H
stre
et
Figure 110. Post-implosion mobile cart perimeter measurements for the transmitters at transmitter site TX 2 for vertically polarized receiving antennas.
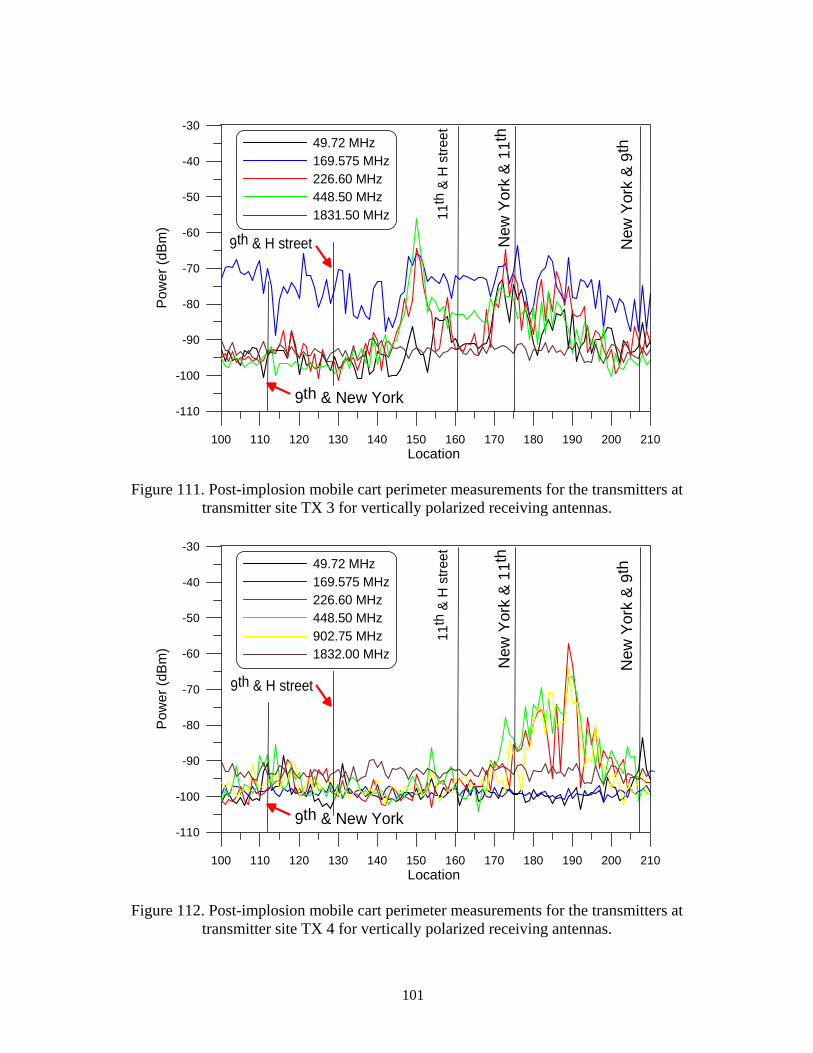
101
100 110 120 130 140 150 160 170 180 190 200 210Location
-110
-100
-90
-80
-70
-60
-50
-40
-30
Pow
er (d
Bm)
49.72 MHz169.575 MHz226.60 MHz448.50 MHz1831.50 MHz
9th & New York
New
Yor
k &
9th
New
Yor
k &
11t
h
11th
& H
stre
eta
a
9th & H street
Figure 111. Post-implosion mobile cart perimeter measurements for the transmitters at transmitter site TX 3 for vertically polarized receiving antennas.
100 110 120 130 140 150 160 170 180 190 200 210Location
-110
-100
-90
-80
-70
-60
-50
-40
-30
Pow
er (d
Bm)
49.72 MHz169.575 MHz226.60 MHz448.50 MHz902.75 MHz1832.00 MHz
9th & New York
New
Yor
k &
9th
New
Yor
k &
11t
h
11th
& H
stre
et
a
a
9th & H street
Figure 112. Post-implosion mobile cart perimeter measurements for the transmitters at transmitter site TX 4 for vertically polarized receiving antennas.

102
0
45
90
135
180
225
270
315
-110 -90 -70 -50(dBm)
Washington DC Convention Center49.6 MHz-Vpol-PostBlast-Site TX 149.6 MHz-Vpol-PreBlast-Site TX 1
Perimeter Signal Strength around DC Convention CtrBefore and After Implosion vs. Compass Bearing0 = North, 90 = East, 180 = South, 270 = West
a
Figure 113. Comparison of pre- and post-implosion mobile cart perimeter measurements for the transmitters at site TX 1 for vertically polarized receiving antennas: 49 MHz band.
0
45
90
135
180
225
270
315
-110 -90 -70 -50(dBm)
Washington DC Convention Center49.6 MHz-Vpol-PreBlast-Site TX 249.66 MHz-Vpol-PostBlast-Site TX 2
Perimeter Signal Strength around DC Convention CtrBefore and After Implosion vs. Compass Bearing0 = North, 90 = East, 180 = South, 270 = West
a
Figure 114. Comparison of pre- and post-implosion mobile cart perimeter measurements for the transmitters at site TX 2 for vertically polarized receiving antennas: 49 MHz band.

103
0
45
90
135
180
225
270
315
-110 -90 -70 -50(dBm)
Washington DC Convention Center49.6 MHz-Vpol-PreBlast-Site TX 349.72 MHz-Vpol-PostBlast-Site TX 3
Perimeter Signal Strength around DC Convention CtrBefore and After Implosion vs. Compass Bearing0 = North, 90 = East, 180 = South, 270 = West
a
Figure 115. Comparison of pre- and post-implosion mobile cart perimeter measurements for the
transmitters at site TX 3 for vertically polarized receiving antennas: 49 MHz band.
0
45
90
135
180
225
270
315
-110 -90 -70 -50(dBm)
Washington DC Convention Center49.6 MHz-Vpol-PreBlast-Site TX 449.78 MHz-Vpol-PostBlast-Site TX 4
Perimeter Signal Strength around DC Convention CtrBefore and After Implosion vs. Compass Bearing0 = North, 90 = East, 180 = South, 270 = West
a
Figure 116. Comparison of pre- and post-implosion mobile cart perimeter measurements for the transmitters at site TX 4 for vertically polarized receiving antennas: 49 MHz band.

104
0
45
90
135
180
225
270
315
-110 -90 -70 -50(dBm)
Washington DC Convention Center162.09 MHz-Vpol-PreBlast-Site TX 1162.09 MHz-Vpol-PostBlast-Site TX 1
Perimeter Signal Strength around DC Convention CtrBefore and After Implosion vs. Compass Bearing0 = North, 90 = East, 180 = South, 270 = West
a
Figure 117. Comparison of pre- and post-implosion mobile cart perimeter measurements for the transmitters at site TX 1 for vertically polarized receiving antennas: 160 MHz band.
0
45
90
135
180
225
270
315
-110 -90 -70 -50(dBm)
Washington DC Convention Center162.09 MHz-Vpol-PreBlast-Site TX 2163.3 MHz-Vpol-PostBlast-Site TX 2
Perimeter Signal Strength around DC Convention CtrBefore and After Implosion vs. Compass Bearing0 = North, 90 = East, 180 = South, 270 = West
a
Figure 118. Comparison of pre- and post-implosion mobile cart perimeter measurements for the transmitters at site TX 2 for vertically polarized receiving antennas: 160 MHz band.

105
0
45
90
135
180
225
270
315
-110 -90 -70 -50(dBm)
Washington DC Convention Center169.575 MHz-Vpol-PostBlast-Site TX 3162.09 MHz-Vpol-PreBlast-Site TX 3
Perimeter Signal Strength around DC Convention CtrBefore and After Implosion vs. Compass Bearing0 = North, 90 = East, 180 = South, 270 = West
a
Figure 119. Comparison of pre- and post-implosion mobile cart perimeter measurements for the transmitters at site TX 3 for vertically polarized receiving antennas: 160 MHz band.
0
45
90
135
180
225
270
315
-110 -90 -70 -50(dBm)
Washington DC Convention Center162.09 MHz-Vpol-PreBlast-Site TX 4173.5 MHz-Vpol-PostBlast-Site TX 4
Perimeter Signal Strength around DC Convention CtrBefore and After Implosion vs. Compass Bearing0 = North, 90 = East, 180 = South, 270 = West
a
Figure 120. Comparison of pre- and post-implosion mobile cart perimeter measurements for the transmitters at site TX 4 for vertically polarized receiving antennas: 160 MHz band.

106
0
45
90
135
180
225
270
315
-110 -90 -70 -50(dBm)
Washington DC Convention Center226.4 MHz-Vpol-PreBlast-Site TX 1226.4 MHz-Vpol-PostBlast-Site TX 1
Perimeter Signal Strength around DC Convention CtrBefore and After Implosion vs. Compass Bearing0 = North, 90 = East, 180 = South, 270 = West
a
Figure 121. Comparison of pre- and post-implosion mobile cart perimeter measurements for the transmitters at site TX 1 for vertically polarized receiving antennas: 225 MHz band.
0
45
90
135
180
225
270
315
-110 -90 -70 -50(dBm)
Washington DC Convention Center226.4 MHz-Vpol-PreBlast-Site TX 2226.5 MHz-Vpol-PostBlast-Site TX 2
Perimeter Signal Strength around DC Convention CtrBefore and After Implosion vs. Compass Bearing0 = North, 90 = East, 180 = South, 270 = West
a
Figure 122. Comparison of pre- and post-implosion mobile cart perimeter measurements for the transmitters at site TX 2 for vertically polarized receiving antennas: 225 MHz band.

107
0
45
90
135
180
225
270
315
-110 -90 -70 -50 -30(dBm)
Washington DC Convention Center226.4 MHz-Vpol-PreBlast-Site TX 3226.6 MHz-Vpol-PostBlast-Site TX 3
Perimeter Signal Strength around DC Convention CtrBefore and After Implosion vs. Compass Bearing0 = North, 90 = East, 180 = South, 270 = West
a
Figure 123. Comparison of pre- and post-implosion mobile cart perimeter measurements for the transmitters at site TX 3 for vertically polarized receiving antennas: 225 MHz band.
0
45
90
135
180
225
270
315
-110 -90 -70 -50(dBm)
Washington DC Convention Center226.4 MHz-Vpol-PreBlast-Site TX 4226.7 MHz-Vpol-PostBlast-Site TX 4
Perimeter Signal Strength around DC Convention CtrBefore and After Implosion vs. Compass Bearing0 = North, 90 = East, 180 = South, 270 = West
a
Figure 124. Comparison of pre- and post-implosion mobile cart perimeter measurements for the transmitters at site TX 4 for vertically polarized receiving antennas: 225 MHz band.

108
0
45
90
135
180
225
270
315
-110 -90 -70 -50(dBm)
Washington DC Convention Center448.3 MHz-Vpol-PostBlast-Site TX 1448.3 MHz-Vpol-PreBlast-Site TX 1
Perimeter Signal Strength around DC Convention CtrBefore and After Implosion vs. Compass Bearing0 = North, 90 = East, 180 = South, 270 = West
a
Figure 125. Comparison of pre- and post-implosion mobile cart perimeter measurements for the transmitters at site TX 1 for vertically polarized receiving antennas: 450 MHz band.
0
45
90
135
180
225
270
315
-110 -90 -70 -50(dBm)
Washington DC Convention Center448.3 MHz-Vpol-PreBlast-Site TX 2448.4 MHz-Vpol-PostBlast-Site TX 2
Perimeter Signal Strength around DC Convention CtrBefore and After Implosion vs. Compass Bearing0 = North, 90 = East, 180 = South, 270 = West
a
Figure 126. Comparison of pre- and post-implosion mobile cart perimeter measurements for the transmitters at site TX 2 for vertically polarized receiving antennas: 450 MHz band.

109
0
45
90
135
180
225
270
315
-110 -90 -70 -50 -30(dBm)
Washington DC Convention Center448.3 MHz-Vpol-PreBlast-Site TX 3448.5 MHz-Vpol-PostBlast-Site TX 3
Perimeter Signal Strength around DC Convention CtrBefore and After Implosion vs. Compass Bearing0 = North, 90 = East, 180 = South, 270 = West
a
Figure 127. Comparison of pre- and post-implosion mobile cart perimeter measurements for the transmitters at site TX 3 for vertically polarized receiving antennas: 450 MHz band.
0
45
90
135
180
225
270
315
-110 -90 -70 -50(dBm)
Washington DC Convention Center448.3 MHz-Vpol-PreBlast-Site TX 4448.6 MHz-Vpol-PostBlast-Site TX 4
Perimeter Signal Strength around DC Convention CtrBefore and After Implosion vs. Compass Bearing0 = North, 90 = East, 180 = South, 270 = West
a
Figure 128. Comparison of pre- and post-implosion mobile cart perimeter measurements for the
transmitters at site TX 4 for vertically polarized receiving antennas: 450 MHz band.

110
0
45
90
135
180
225
270
315
-110 -90 -70 -50(dBm)
Washington DC Convention Center902.45 MHz-Vpol-PreBlast-Site TX 2902.45 MHz-Vpol-PostBlast-Site TX 2
Perimeter Signal Strength around DC Convention CtrBefore and After Implosion vs. Compass Bearing0 = North, 90 = East, 180 = South, 270 = West
a
Figure 129. Comparison of pre- and post-implosion mobile cart perimeter measurements for the transmitters at site TX 2 for vertically polarized receiving antennas: 900 MHz band.
0
45
90
135
180
225
270
315
-110 -90 -70 -50(dBm)
Washington DC Convention Center902.45 MHz-Vpol-PreBlast-Site TX 4902.75 MHz-Vpol-PostBlast-Site TX 4
Perimeter Signal Strength around DC Convention CtrBefore and After Implosion vs. Compass Bearing0 = North, 90 = East, 180 = South, 270 = West
a
Figure 130. Comparison of pre- and post-implosion mobile cart perimeter measurements for the transmitters at site TX 4 for vertically polarized receiving antennas: 900 MHz band.

111
0
45
90
135
180
225
270
315
-110 -90 -70 -50(dBm)
Washington DC Convention Center1830 MHz-Vpol-PreBlast-Site TX 21831 MHz-Vpol-PostBlast-Site TX 2
Perimeter Signal Strength around DC Convention CtrBefore and After Implosion vs. Compass Bearing0 = North, 90 = East, 180 = South, 270 = West
a
Figure 131. Comparison of pre- and post-implosion mobile cart perimeter measurements for the transmitters at site TX 2 for vertically polarized receiving antennas: 1800 MHz band.
0
45
90
135
180
225
270
315
-110 -90 -70 -50(dBm)
Washington DC Convention Center1830 MHz-Vpol-PreBlast-Site TX 31831.5 MHz-Vpol-PostBlast-Site TX 3
Perimeter Signal Strength around DC Convention CtrBefore and After Implosion vs. Compass Bearing0 = North, 90 = East, 180 = South, 270 = West
a
Figure 132. Comparison of pre- and post-implosion mobile cart perimeter measurements for the transmitters at site TX 3 for vertically polarized receiving antennas: 1800 MHz band.

112
TX 2448.4 MHz
RXDebrispile
TX 1448.7 MHz
Impedancematch
Impedancematch
Directionalantenna
Omniantenna
1
2
3
Figure 133. Debris radiator tests. Two transmitters tuned to slightly different frequencies were buried in the rubble. Transmitter 1 (TX 1) was connected through an impedance tuner to a long cable that ran to the edge of the debris pile. Transmitter 2 (TX 2) transmitted through a standard omnidirectional antenna. Three types of receive antenna were used: (1) a standard omnidirectional antenna; (2) direct connection through an impedance tuner; (3) a directional antenna. Measured results are given in Table 17.

113
Figure 134. Near receiving site RX 1 and transmit site TX 4. Debris radiator tests are carried out using a spectrum analyzer, a communications receiver, and several types of receive antennas.

114
Figure 135. Near receiving site RX 2 and transmit site TX 2. Debris radiator tests similar to those in Figure 1 are carried out. Note the orange painted cable at the left side of the photo.

115
NIST Technical Publications
Periodical
Journal of Research of the National Institute of Standards and TechnologyCReports NIST research and development in metrology and related fields of physical science, engineering, applied mathematics, statistics, biotechnology, and information technology. Papers cover a broad range of subjects, with major emphasis on measurement methodology and the basic technology underlying standardization. Also included from time to time are survey articles on topics closely related to the Institute's technical and scientific programs. Issued six times a year. Nonperiodicals MonographsCMajor contributions to the technical literature on various subjects related to the Institute's scientific and technical activities. HandbooksCRecommended codes of engineering and industrial practice (including safety codes) developed in cooperation with interested industries, professional organizations, and regulatory bodies. Special PublicationsCInclude proceedings of conferences sponsored by NIST, NIST annual reports, and other special publications appropriate to this grouping such as wall charts, pocket cards, and bibliographies. National Standard Reference Data SeriesCProvides quantitative data on the physical and chemical properties of materials, compiled from the world's literature and critically evaluated. Developed under a worldwide program coordinated by NIST under the authority of the National Standard Data Act (Public Law 90-396). NOTE: The Journal of Physical and Chemical Reference Data (JPCRD) is published bimonthly for NIST by the American Institute of Physics (AlP). Subscription orders and renewals are available from AIP, P.O. Box 503284, St. Louis, MO 63150-3284. Building Science SeriesCDisseminates technical information developed at the Institute on building materials, components, systems, and whole structures. The series presents research results, test methods, and performance criteria related to the structural and environmental functions and the durability and safety characteristics of building elements and systems. Technical NotesCStudies or reports which are complete in themselves but restrictive in their treatment of a subject. Analogous to monographs but not so comprehensive in scope or definitive in treatment of the subject area. Often serve as a vehicle for final reports of work performed at NIST under the sponsorship of other government agencies. Voluntary Product StandardsCDeveloped under procedures published by the Department of Commerce in Part 10, Title 15, of the Code of Federal Regulations. The standards establish nationally recognized requirements for products, and provide all concerned interests with a basis for common understanding of the characteristics of the products. NIST administers this program in support of the efforts of private-sector standardizing organizations. Order the following NIST publicationsCFIPS and NISTIRsCfrom the National Technical Information Service, Springfield, VA 22161. Federal Information Processing Standards Publications (FIPS PUB)CPublications in this series collectively constitute the Federal Information Processing Standards Register. The Register serves as the official source of information in the Federal Government regarding standards issued by NIST pursuant to the Federal Property and Administrative Services Act of 1949 as amended, Public Law 89-306 (79 Stat. 1127), and as implemented by Executive Order 11717 (38 FR 12315, dated May 11,1973) and Part 6 of Title 15 CFR (Code of Federal Regulations). NIST Interagency or Internal Reports (NISTIR)CThe series includes interim or final reports on work performed by NIST for outside sponsors (both government and nongovernment). In general, initial distribution is handled by the sponsor; public distribution is handled by sales through the National Technical Information Service, Springfield, VA 22161, in hard copy, electronic media, or microfiche form. NISTIRs may also report results of NIST projects of transitory or limited interest, including those that will be published subsequently in more comprehensive form.

116
U.S. Department of Commerce National Bureau of Standards and Technology 325 Broadway Boulder, CO 80305-3328 Official Business Penalty for Private Use $300