impact of air pollution on population health1 · 3 health effects of air pollution in hong kong...
TRANSCRIPT
The impact of air pollution on population health, health care and community costs
Submission to the chairman and honourable members of the Legco Environmental Affairs Panel
Anthony J Hedley, Sarah M McGhee, Chit-Ming Wong
Department of Community Medicine
School of Public Health The University of Hong Kong
November 27, 2006
CB(1) 331/06-07(03)
2
Key points • There is incontrovertible evidence from the worldwide literature that air pollution causes
damage to body tissues (especially the eyes, nasal passages, lungs, blood vessels and heart) and causes severe illness episodes and shortening of life expectancy. Longer term effects of pollution cause cardiopulmonary problems and also increase the risk of lung cancer. Long term studies from overseas show that pollution impairs normal development of lung function in young people, so that by the time they reach maturity at around age 18 years old they have suboptimal lung growth – a lifetime defect with major implications for health experience and life-expectancy.
• In Hong Kong analyses of environmental health clearly show that short term effects of pollution have a very large impact on diseases of the lungs, blood vessels and heart. Long term studies of population health overseas give bigger estimates of effects than short term analyses. Most of the current evidence in Hong Kong is based only on short term effects which are likely to under-estimate the total health impact of air pollution on our population.
• There is evidence that pollutants entering the blood circulation of a pregnant mother
damage the unborn infant. Effects of pollution on the growth and health of unborn infants, reported from the mainland and overseas, have not yet been investigated in Hong Kong.
• The mechanisms by which air pollution harms population health is being demonstrated by human clinical studies, population surveys, and animal toxicological tests and other experimental analyses. Harmful effects include widespread inflammation in the body, increased susceptibility to infection, development of atherosclerosis in blood vessels and interference with the normal neuro-electrical control of the heart. Illnesses resulting from exposure to pollution include exacerbations of asthma; heart attacks; strokes; lung and other respiratory infections; acute and chronic bronchitic symptoms, and eye and skin irritation.
• Health related community costs of air pollution in Hong Kong are conservatively valued
at $2 billion for health care and lost productivity and about $19 billion for intangible costs related to willingness-to-pay to avoid serious illness or death from air pollution.
• There is evidence that pollutants from the combustion of fossil fuels from power generation,
road traffic and industrial plants all contribute to these health risks, including particulates, gaseous pollutants, with a wide range of chemicals components including metals.
• Prevention of the health effects of pollution must include a comprehensive approach to
pollution abatement from several sources. The World Health Organization Air Quality Guidelines provide a framework for immediate action. They are based on the best evidence worldwide of pollution related health impacts, including those from Hong Kong and other Asian regions. Further delays in initiating and achieving major reductions in air pollutant concentrations will be accountable in terms of life long damage to young people, severe losses of health related quality of life and premature deaths.
• We have demonstrated that poor health outcomes are avoidable through interventions
which improve air quality. Public health research in Hong Kong has provided one of the very few demonstrations of the large scale population benefits which have resulted from improvements in air quality. The 1990 restriction of sulphur in fuel led to health gains for thousands of school children, and a reduction of 600 deaths per year in those aged 46 and over.
3
Health effects of air pollution in Hong Kong Although most studies of air pollution effects on health have been conducted in the US, Europe and other developed regions, there is now a substantial body of high quality research which demonstrates the relationship between concentrations of air pollutants and health outcomes in many Asian countries and regions. Hong Kong public health research on air pollution, from the University of Hong Kong and the Chinese University of Hong Kong, has made an important contribution to this evidence base. This was recognized by the global review process which led to the formulation of the World Health Organization Air Quality Guidelines, launched on October 5, 2006. (Attachment 1) It is important to acknowledge that the decision analysis in the WHO review was strongly influenced by analyses conducted in Hong Kong and other parts of Asia. Which pollutants are harmful to health? In terms of environmental management, reduction of the level of emissions is clearly a key measure. However in assessing public health effects we need to focus on the daily concentrations of pollutants in the air breathed by individuals in the population. The pollutants which are commonly used as indicators of the harmful effects of emissions from different sources are the combustion products of fossil fuels and include particulates, nitrogen oxides, sulphur oxides, and the secondary pollutant ozone. Other chemicals implicated in health effects include transition metals and volatile organic compounds. Particulates include elemental and organic carbon compounds, nitrates, sulphates, acids and metals. The easiest pollutants to measure and those which are used as “criteria pollutants” to estimate health effects include respirable suspended particulates (RSP or PM10), nitrogen dioxide (NO2), sulphur dioxide (SO2) and ozone (O3). At present there is no conclusive evidence that either one single pollutant or a particular component of particulates is responsible for the observed harmful effects. From a public health viewpoint this emphasizes the need to control sources of emissions rather than attempt to focus exclusively on individual pollutant species. In Hong Kong and other centres in China all four criteria pollutants show significant associations with adverse health effects. However for adverse health outcomes in terms of hospital admissions and deaths risk estimates are consistently higher for nitrogen dioxide and sulphur dioxide than for particulates. Again this emphasizes the need to address sources of pollution in this region rather than place too much emphasis on any one pollutant. What is the relationship between pollutant concentrations and health effects in Hong Kong? In Hong Kong all four criteria pollutants (Respiratory Suspended Particulates (RSP) estimated as PM10, NO2, SO2 and O3) are associated with increased daily risks of hospitalization and death at the current prevailing daily levels of pollution. In studies of the short term (daily) events attributable to pollution, the excess risk estimates for illness episodes, hospital admissions and deaths, for each pollutant, typically lie in the range 0.5% to 1.5% per ten micrograms of pollutant per cubic metre.
4
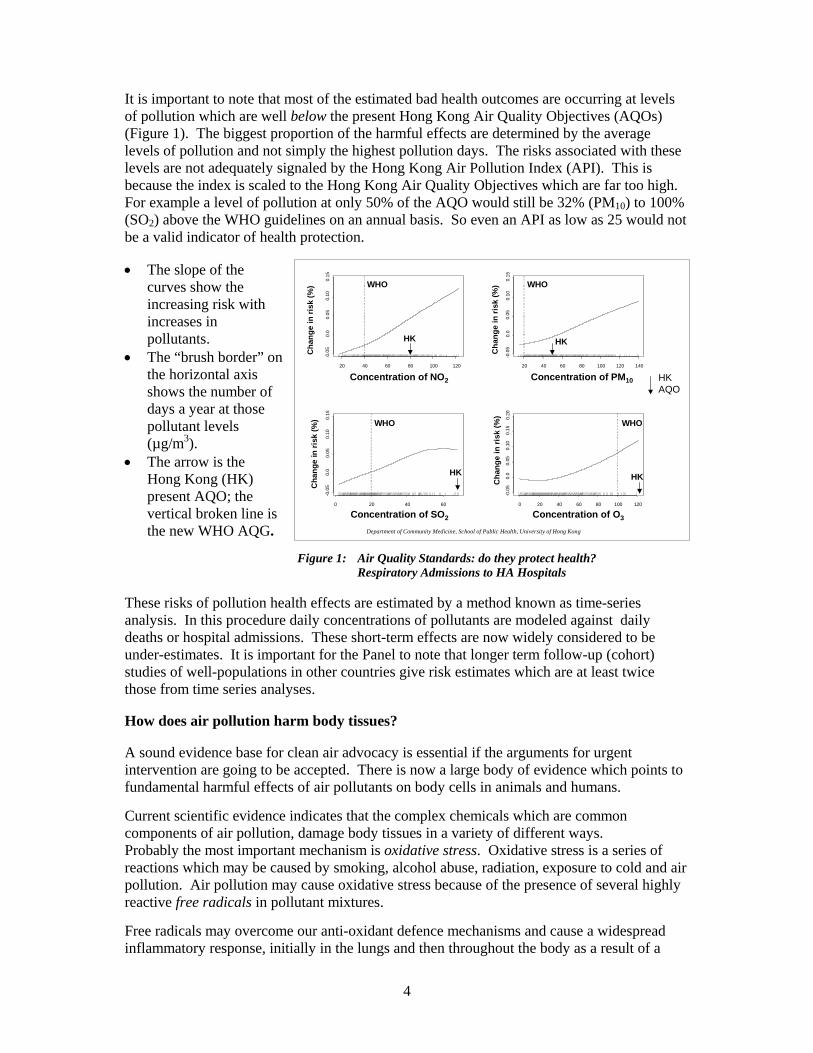
It is important to note that most of the estimated bad health outcomes are occurring at levels of pollution which are well below the present Hong Kong Air Quality Objectives (AQOs) (Figure 1). The biggest proportion of the harmful effects are determined by the average levels of pollution and not simply the highest pollution days. The risks associated with these levels are not adequately signaled by the Hong Kong Air Pollution Index (API). This is because the index is scaled to the Hong Kong Air Quality Objectives which are far too high. For example a level of pollution at only 50% of the AQO would still be 32% (PM10) to 100% (SO2) above the WHO guidelines on an annual basis. So even an API as low as 25 would not be a valid indicator of health protection. • The slope of the
curves show the increasing risk with increases in pollutants.
• The “brush border” on the horizontal axis shows the number of days a year at those pollutant levels (µg/m3).
• The arrow is the Hong Kong (HK) present AQO; the vertical broken line is the new WHO AQG.
Figure 1: Air Quality Standards: do they protect health?
Respiratory Admissions to HA Hospitals These risks of pollution health effects are estimated by a method known as time-series analysis. In this procedure daily concentrations of pollutants are modeled against daily deaths or hospital admissions. These short-term effects are now widely considered to be under-estimates. It is important for the Panel to note that longer term follow-up (cohort) studies of well-populations in other countries give risk estimates which are at least twice those from time series analyses. How does air pollution harm body tissues? A sound evidence base for clean air advocacy is essential if the arguments for urgent intervention are going to be accepted. There is now a large body of evidence which points to fundamental harmful effects of air pollutants on body cells in animals and humans. Current scientific evidence indicates that the complex chemicals which are common components of air pollution, damage body tissues in a variety of different ways. Probably the most important mechanism is oxidative stress. Oxidative stress is a series of reactions which may be caused by smoking, alcohol abuse, radiation, exposure to cold and air pollution. Air pollution may cause oxidative stress because of the presence of several highly reactive free radicals in pollutant mixtures. Free radicals may overcome our anti-oxidant defence mechanisms and cause a widespread inflammatory response, initially in the lungs and then throughout the body as a result of a
Department of Community Medicine, School of Public Health, University of Hong Kong
20 40 60 80 100 120
-0.0
50.
00.
050.
100.
15
0 20 40 60
-0.0
50.
00.
050.
100.
15
20 40 60 80 100 120 140
-0.0
50.
00.
050.
100.
150 20 40 60 80 100 120
-0.0
50.
00.
050.
100.
150.
20
Concentration of NO2
Concentration of SO2 Concentration of O3
Concentration of PM10
Cha
nge
in ri
sk (%
)
Cha
nge
in ri
sk (%
)
Cha
nge
in ri
sk (%
)
Cha
nge
in ri
sk (%
)
HK AQO
WHO WHO
WHO WHO
HK HK
HK HK

5
secondary wave of inflammatory cells. Common pollutants in urban air pollution include nitrogen dioxide, ozone and particulates. All of these have been clearly shown to cause or trigger oxidative stress and the inflammatory cell response. Our lungs have a very large surface area (sometimes approximated to the size of a tennis court) and they are the first target of inhaled environmental pollutants. In apparently healthy subjects the antioxidant defences in the lung may be robust, but there is likely to be a wide range of different degrees of susceptibility. Those people with existing health problems such as asthma may already have deficient lung defences. Who is most affected by air pollutants? Air pollution concentrations, which are currently typical of the Hong Kong environment, cause serious health problems in a large minority of the Hong Kong population. It is likely that everyone in Hong Kong is affected to some extent by ambient pollution with increased levels of inflammatory cells in their circulation and body tissues. We know from experimental studies in humans that when people move to geographical areas with much lower pollution the body markers of inflammation decline. Typically we find that the health risks are bigger at the extremes of life, in young children and older people from middle age (eg 45 years plus) onwards, and those who have other health risks such as active or passive smoking, poor nutrition, heart or lung disease, or any factor which impairs the immune system. Studies carried out by the University of Hong Kong and Chinese University of Hong Kong have shown that young children in areas of higher pollution suffer more episodes of bronchitic symptoms and impaired lung function compared with those in less polluted regions. There is clear evidence that the burden of respiratory health problems in children across the whole HKSAR would decline with air quality improvement. Between January 1996 and December 2002, hospital discharge diagnoses and mortality statistics showed that:
• Acute lung infections in the young, exacerbations of asthma and chronic respiratory problems at all ages were strongly associated with the four criteria pollutants in Hong Kong.
• Cardiovascular diseases (heart attacks and stroke) were also strongly associated with
pollutant concentrations when analyzed for hospital admissions and deaths across all ages, not only in the elderly.
Hong Kong has, almost by chance, one of the best pieces of evidence on the health gains which can be achieved by different groups in the population through air quality improvements from analyses of the 1990 fuel restriction on sulphur: The Hong Kong Air Quality Intervention 1990 On Sunday July 1st 1990 a new Ordinance restricted the sulphur content of fuel to 0.5% by weight. The impact of this very modest intervention on both the environment and population health was immediate and beneficial:

6
Environmental Impact: • Levels of sulphur dioxide (SO2) fell by about 80% in Kwai Tsing district and by about
50% territory wide. These reductions were maintained and eventually improved on until 2000 when an increasing trend in SO2 is again observed.
Concentrations of the transition metals Nickel and Vanadium also showed a sharp decline and this was also maintained until 2000-2004 when a significant upward trend is observed.
Health gains: • Following the intervention there was a marked improvement in the respiratory health of
primary school children (and their mothers) with reduction of bronchitic symptoms such as cough, phlegm and wheeze. Tests of lung function showed an improvement over a two year period with children in Kwai Tsing Kwai Chung/Tsing Yi improving to the level of health of children in the less polluted Southern District. Thousands of young children benefited from this reduction in one group of pollutants from sulphur rich fuels.
There was a marked effect on mortality patterns, mainly from cardiovascular and lung disease, with a 2.2% downturn in the trend in annual numbers of deaths. This was equivalent to 600 deaths avoided each year over the 5 years following the intervention. The reduction in mortality risks was seen at all ages over the age of 45 and the reduction in respiratory causes of death was greatest in the 46-64 year group. (Attachment 2)
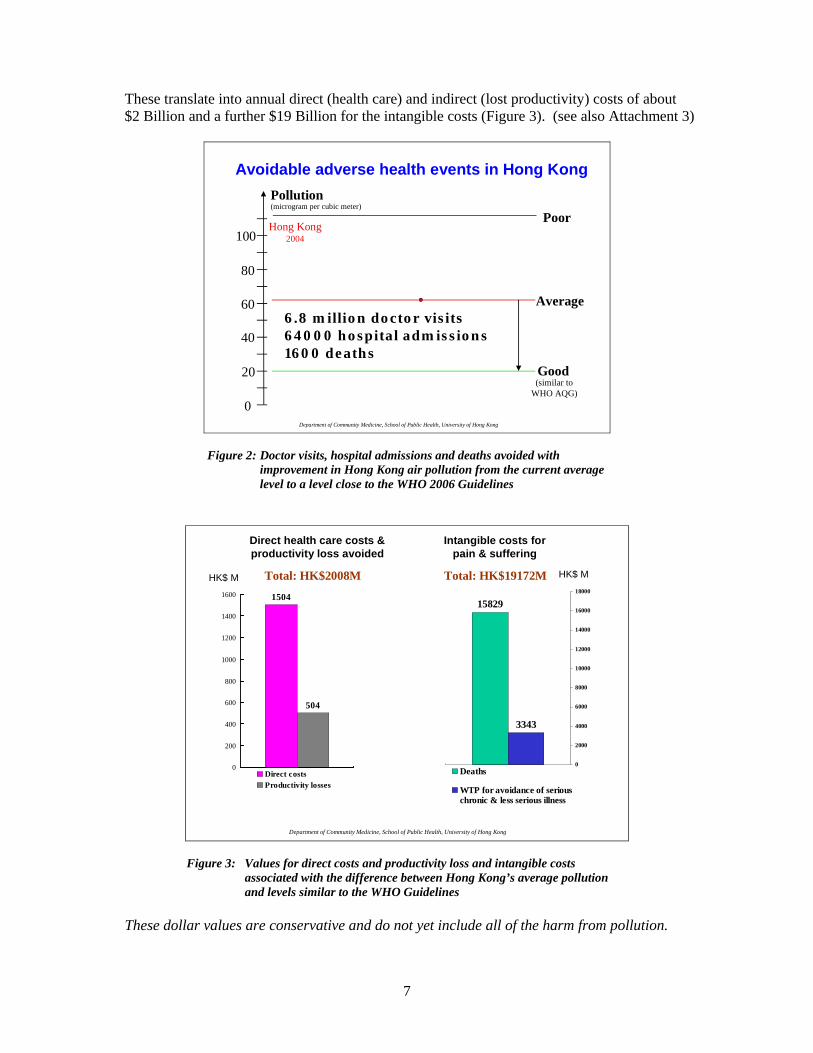
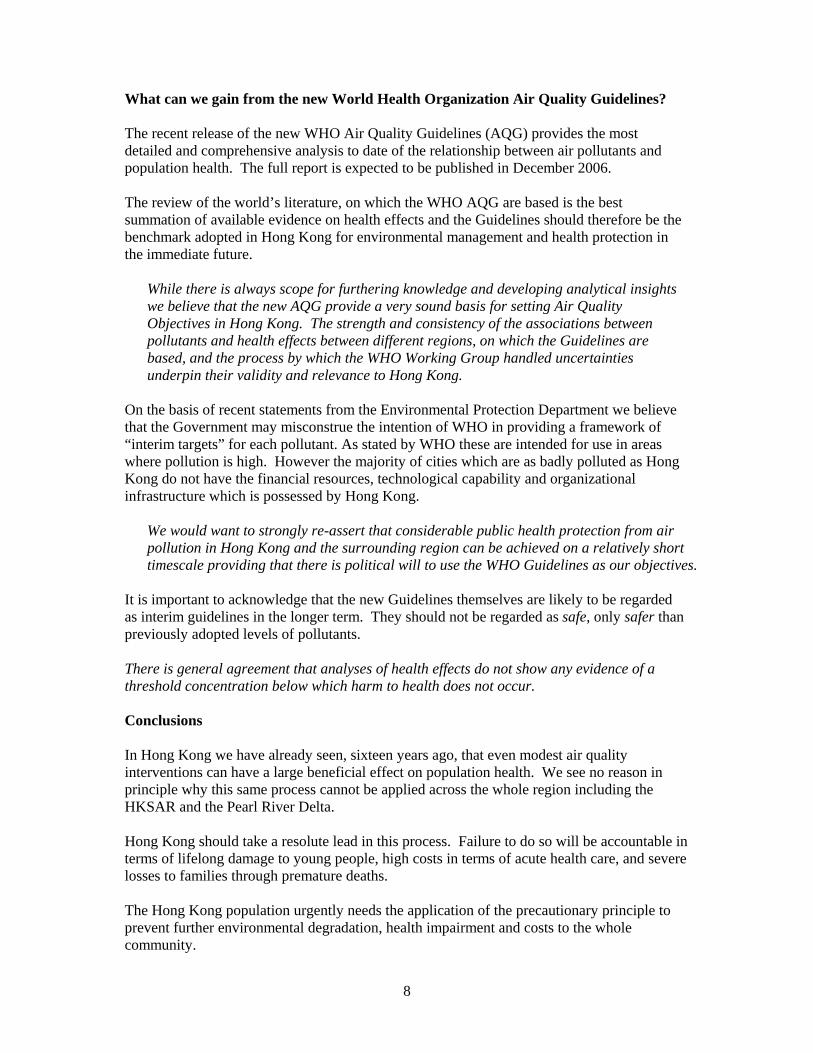
The current situation 2006: Despite claims by the Government there is little if any evidence of substantial and sustained improvements in air quality in Hong Kong in the past 6 years. There are several problems: (a) Any proportional reductions in concentrations are small in relation to the high average levels; (b) Uncertainties in the data (omissions of monitoring data and yearly fluctuations in pollutants are not properly taken into account; (c) Trends in emissions from power generation, marine and civil aviation sources (58% of the total) are upwards and (d) Extrapolation from current trends in pollutant levels indicate that there will be no reasonable health protection from air pollution in Hong Kong in the foreseeable future. What are the community costs of air pollution? We can use the risk estimates to calculate the numbers of bad health outcomes and then put a dollar value on the resulting financial stress on the individuals and families affected, the health care system and employers who lose the services of the workforce through illness or premature death. Additional costs, known as intangible costs, can be valued as the willingness-to-pay to avoid daily respiratory symptoms (such as cough), a serious illness episode requiring hospital admission, and a death due to pollution. We estimate each year that the difference between Hong Kong’s average pollution levels and much lower levels which are close to the new WHO Guidelines is the cause of a large scale epidemic of disease (Figure 2)
• 6.8 million doctor visits for respiratory complaints alone, • over 60,000 hospital bed days and • about 1600 deaths.
7
These translate into annual direct (health care) and indirect (lost productivity) costs of about $2 Billion and a further $19 Billion for the intangible costs (Figure 3). (see also Attachment 3)
Department of Community Medicine, School of Public Health, University of Hong Kong
Poor
Avoidable adverse health events in Hong Kong
0
20
40
60
80
100
(microgram per cubic meter)Pollution
Hong Kong2004
Good
Average6.8 million doctor visits64000 hospital admissions1600 deaths
(similar toWHO AQG)
Figure 2: Doctor visits, hospital admissions and deaths avoided with improvement in Hong Kong air pollution from the current average level to a level close to the WHO 2006 Guidelines
Department of Community Medicine, School of Public Health, University of Hong Kong
1504
504
0
200
400
600
800
1000
1200
1400
1600
Direct costsProductivity losses
HK$ M Total: HK$2008M
Direct health care costs & productivity loss avoided
3343
15829
0
2000
4000
6000
8000
10000
12000
14000
16000
18000
Deaths
WTP for avoidance of seriouschronic & less serious illness
Total: HK$19172M
Intangible costs for pain & suffering
HK$ M
Figure 3: Values for direct costs and productivity loss and intangible costs associated with the difference between Hong Kong’s average pollution and levels similar to the WHO Guidelines
These dollar values are conservative and do not yet include all of the harm from pollution.
8
What can we gain from the new World Health Organization Air Quality Guidelines? The recent release of the new WHO Air Quality Guidelines (AQG) provides the most detailed and comprehensive analysis to date of the relationship between air pollutants and population health. The full report is expected to be published in December 2006. The review of the world’s literature, on which the WHO AQG are based is the best summation of available evidence on health effects and the Guidelines should therefore be the benchmark adopted in Hong Kong for environmental management and health protection in the immediate future.
While there is always scope for furthering knowledge and developing analytical insights we believe that the new AQG provide a very sound basis for setting Air Quality Objectives in Hong Kong. The strength and consistency of the associations between pollutants and health effects between different regions, on which the Guidelines are based, and the process by which the WHO Working Group handled uncertainties underpin their validity and relevance to Hong Kong.
On the basis of recent statements from the Environmental Protection Department we believe that the Government may misconstrue the intention of WHO in providing a framework of “interim targets” for each pollutant. As stated by WHO these are intended for use in areas where pollution is high. However the majority of cities which are as badly polluted as Hong Kong do not have the financial resources, technological capability and organizational infrastructure which is possessed by Hong Kong.
We would want to strongly re-assert that considerable public health protection from air pollution in Hong Kong and the surrounding region can be achieved on a relatively short timescale providing that there is political will to use the WHO Guidelines as our objectives.
It is important to acknowledge that the new Guidelines themselves are likely to be regarded as interim guidelines in the longer term. They should not be regarded as safe, only safer than previously adopted levels of pollutants. There is general agreement that analyses of health effects do not show any evidence of a threshold concentration below which harm to health does not occur. Conclusions In Hong Kong we have already seen, sixteen years ago, that even modest air quality interventions can have a large beneficial effect on population health. We see no reason in principle why this same process cannot be applied across the whole region including the HKSAR and the Pearl River Delta. Hong Kong should take a resolute lead in this process. Failure to do so will be accountable in terms of lifelong damage to young people, high costs in terms of acute health care, and severe losses to families through premature deaths. The Hong Kong population urgently needs the application of the precautionary principle to prevent further environmental degradation, health impairment and costs to the whole community.

ARTICLES
1646 THE LANCET • Vol 360 • November 23, 2002 • www.thelancet.com
Summary
Background In July, 1990, a restriction was introduced overone weekend that required all power plants and road vehiclesin Hong Kong to use fuel oil with a sulphur content of notmore than 0·5% by weight. This intervention led to animmediate fall in ambient sulphur dioxide (SO2). Weassessed the effect of this intervention on mortality over thenext 5 years.
Methods Changes in trends in deaths were estimated by aPoisson regression model of deaths each month between1985 and 1995. Changes in seasonal deaths immediatelyafter the intervention were measured by the increase indeaths from warm to cool season. We also estimated theannual proportional change in number of deaths before andafter the intervention. We used age-specific death rates toestimate person-years of life gained.
Findings In the first 12 months after introduction of therestriction, a substantial reduction in seasonal deaths wasnoted, followed by a peak in the cool-season death ratebetween 13 and 24 months, returning to the expectedpattern during years 3–5. Compared with predictions, theintervention led to a significant decline in the average annualtrend in deaths from all causes (2·1%; p=0·001), respiratory(3·9%; p=0·0014) and cardiovascular (2·0%; p=0·0214)diseases, but not from other causes. The average gain in lifeexpectancy per year of exposure to the lower pollutantconcentration was 20 days (females) to 41 days (males).
Interpretation Pollution resulting from sulphur-rich fuels hasan effect on death rates, especially respiratory andcardiovascular deaths. The outcome of the Hong Kongintervention provides direct evidence that control of thispollution has immediate and long-term health benefits.
Lancet 2002; 360: 1646–52
IntroductionThe association between air pollution and health effectsincluding death has been established from reports onhigh-pollution incidents,1 time-series analyses,2 and cohortstudies.3,4 The strongest evidence is for respirableparticulates (PM10),5 but many researchers have reportedassociations with gaseous pollutants, especially sulphurdioxide (SO2).6 Questions remain about the public-healtheffect of air pollution, particularly about death rates andlife expectancy.7,8 Very few opportunities have arisen to doepidemiological studies of the effects of interventions or ofindividual components of pollution.
Absence of data from intervention studies means thatinconsistencies between studies on the importance ofparticulates or gases in pollutant mixtures, as causes ofhealth problems and premature deaths, have not beenresolved. One difficulty relevant to assessment of thepublic-health and economic analyses is the issue ofmortality displacement or so-called harvesting.9,10 Dodeaths associated with fluctuations in pollutantconcentrations arise mainly in sick or highly vulnerablegroups of people, who would have died anyway in theshort term, or are there longer-term effects fromexposures? Time-series and cohort studies have bothinvestigated the relation between pollution and years oflife lost, but each has inherent limitations.
SO2 has been described as a pollutant of public-healthconcern. The US Clean Air Act Amendments of 1990proposed a reduction of 10 million tonnes of SO2
emissions by 2010, with the aim to reduce SO2, sulphateparticulates, and acid precipitation.11 In the first half of1990, ambient monthly SO2 concentrations monitored inHong Kong ranged from 3 �g/m3 to 145 �g/m3 betweenthe least and most polluted districts, with a regional meanof 37 �g/m3. On July 1, 1990, all power plants and roadvehicles in Hong Kong were restricted to use of fuel oilwith a sulphur content of not more than 0·5% by weight.12
This intervention led to an immediate improvement in airquality, which was associated with a fall in SO2 andsulphate in respirable particulates by up to 80% and 41%,respectively, in the most polluted areas. No great changein any of the other main pollutants was recorded.
In the 2 years after the intervention we showed areduction of chronic bronchitic symptoms13 and bronchialhyper-responsiveness14 in young children. We aimed toassess the immediate and longer-term effect of the air-quality intervention on deaths in the Hong Kongpopulation.
MethodsProceduresFrom July, 1985, to June, 1995, we obtained data fordeaths per month from all causes, respiratory disease(international classification of diseases 9th revision [ICD9]460–519), cardiovascular disease (ICD9 390–459), andneoplasms (ICD9 140–239), and other causes (ICD9
Cardiorespiratory and all-cause mortality after restrictions onsulphur content of fuel in Hong Kong: an intervention study
Anthony Johnson Hedley, Chit-Ming Wong, Thuan Quoc Thach, Stefan Ma, Tai-Hing Lam, Hugh Ross Anderson
Department of Community Medicine, University of Hong Kong,Pokfulam, Hong Kong (Prof A J Hedley MD, C-M Wong PhD, T Q Thach PhD, S Ma MStat, Prof T-H Lam MD); and Department ofPublic Health Sciences, St George’s Hospital Medical School,University of London, London, UK (Prof H R Anderson MD)
Correspondence to: Prof A J Hedley, Department of CommunityMedicine, University of Hong Kong, 5/F Academic and AdministrationBlock, Faculty of Medicine Building, 21 Sassoon Road, Pokfulam,Hong Kong(e-mail: [email protected])
Attachment 2

ARTICLES
THE LANCET • Vol 360 • November 23, 2002 • www.thelancet.com 1647
001–009; 140–161; 163–246; 280–294; 320–326;520–629; 710–719) from the Census and StatisticsDepartment databases.15 We stratified these data into threegroups by age: 15–64 years; 65 and older; and all ages.
Air-pollutant concentrations were obtained from theEnvironmental Protection Department16 for the period1988–95. From five stations with almost complete data(97%), we plotted monthly mean concentrations of SO2,sulphate in respirable particulates, nitrogen dioxide(NO2), ozone (O3; two stations only), and PM10 toinvestigate changes in concentrations of pollutants at eachstation 2 years before and 5 years after introduction of thefuel regulations. Daily pollutant concentrations measuredby the five stations showed an average correlation of r=0·5(range 0·3–0·7). A further three stations had useable datafor 1 year before and up to 3 years after the intervention.The average correlation for all eight stations was r=0·4(0·1–0·7) over the period 1990–92.
We used District Board resident populations toestimate the population covered by the differentmonitoring stations. We estimated that five stationscovered 54% of the population, and all eight, 73%.
We assessed the overall change from baseline in averagemonthly concentration of each pollutant, bycorresponding month and station for 5 years after theintervention. We applied a two-tailed t test to establishwhether the means of the 5-year differences (maximumn=300) for each pollutant were different from zero.
Statistical analysisWe obtained a measure (�) of change in death rates,relative to the mean, in the warm (April–September) orcool (October–March) seasons, by three methods. Wefirst obtained monthly expected values from a linearregression model of monthly deaths. Second, we fitted aPoisson regression with observed/expected deaths as thedependent variable and a pair of ��sine and ��cosineterms as the independent variables to model one cycle peryear, where � and � are coefficients to be estimated fromthe regression. This model is sufficient to show the majorwarm to cool season changes. Third, we calculated thevalue of �, using the equation shown in the panel, with95% CIs. We did this calculation for every year after theintervention and for every cause of death by all ages andspecific age-groups, and compared the values with thosederived from the period before the intervention.17
We used the Poisson regression to model monthlydeaths as a dependent variable,18 taking into account
trends, seasonality (by pairs of sine and cosine terms,allowing for one to three cycles per year to capture themain seasonal variations per year), temperature, andrelative humidity, with stratification into two 5-yearperiods, before and after the intervention. We used thecoefficient from the regression model to derive theaverage annual change in number of deaths in each of thetwo 5-year periods. We calculated the relative change inthese estimates between the two periods, by causes ofdeath and age-groups, with an interaction termrepresenting the relative change in trend between the twoperiods. This term directly indicates the effect of theintervention in terms of average annual reduction inmortality.
We investigated differences in deaths over 5 yearsbetween districts with and without sustained reductions inSO2 versus baseline. These districts were grouped inaccordance with their reduction in SO2 up to 2·5 yearsafter the intervention, as indicated by eight monitoringstations. Over this period, the average change at the fourstations with a consistently sustained reduction in SO2
over 2·5 years was a 52·8% decrease versus an 8·7%increase at the four stations with reductions for shorterperiods. These two groups of districts were defined ashigh and low SO2 reduction areas. We assessed excess riskof death with Poisson regression on monthly death rates.Covariates included time trend, seasonality (sine andcosine terms), temperature and humidity, and a dummyvariable for 5 years before and after the intervention.
We used age at death before intervention (1985–90) tocalculate potential years of life lost due to death from allcauses and cardiorespiratory disease, on the basis of lifeexpectancy in those years. We calculated years of life thatwere saved by the intervention by applying the relativechange in trend for deaths after the intervention to theyears of life lost before the intervention.
We used differences in age-specific death rates, basedon the population at the midpoint of two 2-year periodsimmediately before and after the intervention, to calculatechange in life expectancy per year of exposure to thereduced pollutant levels, expressed per 10 �g/m3 of SO2.Furthermore, we estimated gain in life expectancy withthe annual relative risk per 10 �g/m3 SO2, for ahypothetical cohort of people age 25–100 years.8 Weobtained numbers of survivors for each 5-year age-group(25–29, 30–34, 35–39, etc) from the 1991 Hong Konglife-table.
All tests of significance are two tailed unless otherwisestated.
Role of the funding sourceThe sponsors had no role in study design, data collection,data analysis, data interpretation, or writing of the report.
Baseline* After intervention
1 year† 2·5 years‡ 5 years§
Mean (SD) Mean (SD) Absolute Relative Mean (SD) Absolute Relative Mean (SD) Absolute Relative p¶(�g/m3) (�g/m3) change change (%) (�g/m3) change change (%) (�g/m3) change change (%)
PollutantSO2 44·2 (40·1) 20·8 (9·9) –23·4 –53·0 22·3 (10·8) –21·9 –49·6 24·5 (12·2) –19·7 –44·7 <0·0001SO4 RSP 8·9 (3·2) 6·9 (2·0) –2·0 –22·9 7·9 (2·8) –1·0 –11·7 8·9 (3·1) 0·0 –0·3 0·896NO2 54·7 (22·8) 48·1 (12·0) –6·7 –12·2 52·8 (15·1) –1·9 –3·5 54·7 (14·7) 0·0 –0·1 0·205O3 18·5 (7·5) 21·3 (9·1) 2·8 15·2 22·1 (10·2) 3·6 19·6 23·8 (11·4) 5·2 28·3 <0·0001PM10 59·8 (17·0) 59·8 (16·9) 0·0 0·0 61·7 (17·4) 1·9 3·2 60·2 (17·6) 0·4 0·6 0·926
SO4 RSP=sulphate in respirable particulates. *July, 1989, to June, 1990. †July, 1990, to June, 1991. ‡July, 1990, to December, 1992. §July, 1990, to June, 1995.¶For difference from baseline concentration to corresponding month and stations over the 5 years after the intervention.
Table 1: Mean (SD) concentration of pollutants based on five stations at baseline and after intervention with mean absolute andrelative changes
Equation used to calculate �
�=√�2+�2

ARTICLES
1648 THE LANCET • Vol 360 • November 23, 2002 • www.thelancet.com
ResultsIn the first year after introduction of the intervention,mean fall in SO2 concentration at five stations was 53%(table 1). Reduction in SO2 concentration was sustainedbetween 35% and 53% (mean 45%) of the mean valuebefore the intervention, over 5 years. At eight stations forwhich complete data were available for up to 2·5 years,the average reduction in SO2 concentration over thisperiod was 50%.
Mean concentration of sulphate in respirableparticulates at five stations for 2 years before theintervention was 8·9 �g/m3. This concentration fell by15–23% for 2 years but rose again to between 110% and114% of the concentration before 1990 in years 3–5 afterthe intervention (data not shown). No significant changein mean concentration of PM10 (p=0·926) and NO2
(p=0·205)—but a significant increase of O3 (p<0·0001)—was noted over the 5 years after the restriction on fuelsulphur content (figure 1).
Over the 5 years before the intervention, number ofdeaths per month showed a stable seasonal pattern for allcauses and cardiorespiratory diseases. In the year after therestriction on fuel sulphur content was introduced, theexpected cool season peak was absent (figure 2).
The noted seasonal mortality cycle closely fitted themodel for the 5 years before introduction of theintervention. In the first 12 months after the intervention,amplitude of the cycle was low compared with thatpredicted because of a striking reduction in deaths in thecool season (figure 3). This fall was associated with areduction in the warm to cool season mortality gradient,for every age-group, for all causes, respiratory, andcardiovascular deaths. For example, the seasonalpercentage increase for all causes and all ages declinedfrom the average 5-year baseline of 10·3% to 4·2% andrespiratory deaths from 20·3% to 5·3% (table 2). Inpeople aged 65 or older, seasonal deaths for all causesdeclined from 14·7% to 6·1% and respiratory deaths from22·7% to 5·4%. No consistent change in seasonal patternof deaths in any age-group for neoplasms or other causeswas noted. In the second 12 months a striking rebound indeaths in the cool season deaths arose, followed by agradual return during years 3–5 to the seasonal patternbefore intervention.
The reduction in cool-season deaths in the first yearafter the intervention showed a consistent pattern across
the eight stations, except in one district, which onlycontributed 1·3% of total deaths covered by air-pollutantmonitoring.
The average annual proportional change in number ofdeaths, for all causes and all ages, was an increase of 3·5%per year in 1985–90, in accordance with the increase insize and ageing of the population. After the intervention
80
60
40
20
0
12
8
4
0Pollu
tant
con
cent
ratio
n (�
g/m
3)
SO
4 concentration (�g/m
3)
1988
Year1989
19901991
19921993
19941995
PM10NO2SO4SO2O3
Figure 1: Average of pollutant concentrations at fivemonitoring stations Vertical line represents date of introduction of fuel regulation.
1000
750
500
250
0
Mon
thly
dea
ths
July,1985
July,1990
June,1995
Neoplasms and other causes
1000
750
500
250
0
Respiratory
1000
750
500
250
0
Cardiovascular
4000
3000
2000
1000
0
All causes
NeoplasmsOther causes
Figure 2: Number of deaths per month for all ages from July, 1985, to June, 1995, for all causes, respiratory,cardiovascular, and neoplasms and other causesVertical line represents date of introduction of fuel regulation.

ARTICLES
THE LANCET • Vol 360 • November 23, 2002 • www.thelancet.com 1649
was introduced, the average annual percentage change(increase) in deaths for 1990–95 declined for all causes,respiratory, and cardiovascular deaths compared with the5 years before the intervention (table 3). For all causesand all ages, the average annual percentage change indeath rates over 5 years showed a decline of 2·1% (95%CI 0·9–3·3), and for those aged 65 years or older the
reduction was 2·8% (1·4–4·2). The biggest relativechange was seen for respiratory deaths for the 15–64 age-group (4·8%; 1·2–8·3), with a smaller but significantchange for cardiovascular deaths of 2·0% for all ages and2·4% for those aged 65 years or older. No significant(p>0·05) post-intervention difference in annual rate ofchange was found at any age for deaths from neoplasmsincluding lung cancer, or from other causes at age olderthan 65 or all ages (table 3).
A greater decline in mortality was noted in areas with ahigher reduction in SO2 during the first 2·5 years(–3·27%; 95% CI –7·10 to 0·83) than in areas with lessreduction (1·35%; –3·63 to 6·61; p=0·08 one tailed test ofsignificance, for reduction in average deaths between thetwo districts).
Estimated deaths and mean potential life years lost, forall causes and all ages, in 1985–90, based on the post-intervention decline in annual proportional change indeaths of 2·1%, was 600 deaths per year associated with10 268 person-years of life per year.
Age-standardised death rates for all causes declinedduring the 10-year period of the study. The decline wasgreatest after the intervention, with a correspondingincrease in life expectancy. In the 1991 population ofHong Kong, of about 5·8 million, person-years of lifegained were 667 095 for males and 308 614 for femalesover the 2 years after the intervention, which represents anaverage lifetime gain, adjusted for the baseline trend, of 31 days (0·085 years) for each individual in thepopulation, or 15 days per 10 �g/m3 reduction in SO2 peryear of exposure.
On the basis of age-specific death rates, the estimate ofgain in life expectancy (after 15 years of exposure to thelower pollutant concentrations) for men age 25 years andolder is 0·73 years per 10 �g/m3 reduction in SO2. In analternative approach described by Brunekreef,8 using the15-year relative risk of 1·18 obtained from our model ofchange in death rates, the estimate for a 25-year-old manis 2·58 years per 10 �g/m3 reduction in SO2.
An appendix with further webtables and figures isavailable on our website.19
DiscussionAfter introduction of the air-quality intervention in HongKong, in addition to the 45% average reduction in SO2
over 5 years, we noted that sulphate in respirableparticulates had sustained reduction up to 2 years, butconcentrations rose again and stabilised as part of aregional pattern of sulphate pollution in southern China.No comparable reductions or downward trends in theother main pollutants, PM10, NO2 and O3, were recorded.These immediate changes in concentration of sulphur-derived pollutants were associated with the seasonalmortality cycle in the first year, and the estimated changein the proportional mortality trend based on 5-yearanalysis also suggested that reduction of SO2
concentration had an important longer-term effect ondeath rates.
We reported an immediate reduction in cool-seasondeaths, which suggested that in the first year, many peoplesurvived who would have otherwise died. The rebound incool-season deaths in the second year, followed by areturn to the pre-intervention seasonal cyclical pattern,suggested that these later deaths arose in susceptiblepeople whose death had been delayed by the air-qualityimprovement. This finding, which is the reverse of thepostulated occurrence of harvesting and which was closelyrelated to the reduction in sulphur oxides, lends supportto the hypothesis that a proportion of the deaths
1000
800
900
700
600
500
Mon
thly
dea
ths
1990–91
Neoplasms
600
500
300
400
200
100
Respiratory
1000
800
900
700
600
500
Cardiovascular
3000
2500
2000
1500
All causes
BaselineJuly, 1990, to June, 1995
1991–92 1992–93 1993–94 1994–95
Figure 3: Annual cycle of monthly deaths for all ages, forbaseline and for each year after the intervention (July, 1990),for all causes, respiratory, cardiovascular, and neoplasmsMid-point of each period at January. Horizontal lines indicate meanmonthly deaths.
ARTICLES
1650 THE LANCET • Vol 360 • November 23, 2002 • www.thelancet.com
associated with air-pollution episodes are in individualswho are frail and already have a short life-expectancy.
In addition to short-term seasonal fluctuations in deathrates, we recorded a decline in the average annualproportional increase in deaths in the period after theintervention, which also provides evidence of a longer-term benefit from removal of sulphur. As with the earlyeffect on seasonal deaths, the largest decline over 5 yearswas for respiratory deaths. Reduction in risk for overallmortality was greater in districts that had large reductionsin SO2 than in those that did not.
Differences in age-specific death rates before and afterthe intervention suggest that it led to an average gain inlife expectancy for men aged 25–100 years of 0·73 yearsfor 15 years’ exposure per 10 �g/m3 reduction in SO2. Fora man aged 25–29 years, the lifetime gain would be 1·14 years. Brunekreef 8 applied a relative risk of 1·10—derived from US cohort studies, with relative risk per 10 �g/m3 for PM10 ranging from 1·074 to 1·173—to the
1992 life-table for people aged 25–100 years to obtain anestimated gain of 1·51 years for a 25-year old Dutch manwith 15 years of exposure. This finding indicates theexpected difference in life expectancy betweenpopulations living in polluted or clean air. On the basis ofthe relative risk of 1·18 from our Poisson regression, thecomparable gain in life expectancy per 10 �g/m3 SO2 for a25-year old Hong Kong man is 2·58 years. The short-term analysis of changes in risk of death could haveunderestimated the benefits, in terms of life expectancy, ofthe restriction on sulphur in fuel.
Further benefits arising from reductions in the otherpollutants, including respirable particulates and the othergaseous pollutants, could be expected in addition to thosederived from sulphur sources. The strong associationbetween reduced risk of death and the acute fall in sulphuroxides contrasts strikingly with the conclusions of otheranalyses—based on time series and cohort studies—of SO2
and deaths in the USA and the Netherlands. Schwartz20
Cool season increase in mortality (%) (95% CI)
All causes Respiratory Cardiovascular Neoplasms Other causes
PeriodBaseline(July, 1985, to June, 1990) 10·2 (9·5 to 11·0) 20·3 (18·4 to 22·2) 18·0 (16·6 to 19·4) 1·1 (–0·3 to 2·4) 4·2 (2·9 to 5·6)Year 1(July, 1990, to June, 1991) 4·2 (2·5 to 5·8) 5·3 (1·2 to 9·4) 12·3 (9·2 to 15·4) 2·8 (–0·2 to 5·8) 3·7 (0·7 to 6·6)Year 2(July, 1991, to June, 1992) 14·6 (13·0 to 16·2) 27·7 (23·9 to 31·5) 24·1 (21·2 to 27·1) 1·1 (–1·9 to 4·0) 3·6 (0·7 to 6·6)Year 3(July, 1992, to June, 1993) 12·5 (10·8 to 14·1) 26·6 (22·8 to 30·4) 20·1 (17·0 to 23·2) 2·0 (–0·9 to 4·9) 4·9 (2·0 to 7·8)Year 4(July, 1993, to June, 1994) 11·3 (9·6 to 12·9) 17·2 (13·3 to 21·0) 19·8 (16·7 to 22·9) 2·7 (–0·2 to 5·5) 6·8 (3·9 to 9·7)Year 5(July, 1994, to June, 1995) 11·3 (9·7 to 12·9) 24·2 (20·4 to 28·1) 21·4 (18·4 to 24·4) 2·1 (–0·7 to 5·0) 5·1 (2·2 to 7·9)
Table 2: Cool season increase in mortality and 95% CI for all ages after intervention compared with mean (baseline) for all causes,respiratory, and cardiovascular, neoplasms, and other causes
Average annual proportional change (%) (95% CI)* Relative change (%) (95% CI) per year
Pre-intervention Post-intervention From pre-intervention to Intrapolated to 10 �g/m3
post-intervention period† change in SO2‡
All causesAge 15–64 years 0·65 (–0·01 to 1·31) –1·16 (–1·83 to –0·48) –1·75 (–2·98 to –0·50) –0·89Age 65 years and older 5·40 (4·93 to 5·88) 2·40 (1·96 to 2·83) –2·81 (–4·20 to –1·39) –1·44All ages 3·50 (3·12 to 3·88) 1·20 (0·84 to 1·56) –2·11 (–3·32 to –0·89) –1·08
RespiratoryAge 15–64 years 2·28 (0·12 to 4·44) –3·36 (–5·64 to –1·07) –4·80 (–8·28 to –1·18) –2·47Age 65 years and older 7·79 (6·75 to 8·83) 2·91 (1·97 to 3·85) –4·17 (–6·59 to –1·69) –2·14All ages 6·55 (5·62 to 7·48) 1·88 (1·02 to 2·74) –3·94 (–6·23 to –1·60) –2·02
CardiovascularAge 15–64 years –1·33 (–2·78 to 0·12) –3·12 (–4·64 to –1·59) –1·64 (–3·95 to 0·72) –0·84Age 65 years and older 4·17 (3·36 to 4·99) 1·81 (1·04 to 2·57) –2·44 (–4·20 to –0·65) –1·25All ages 2·79 (2·08 to 3·49) 0·77 (0·09 to 1·45) –2·01 (–3·66 to –0·33) –1·03
Neoplasm, without lung cancerAge 15–64 years 0·73 (–0·47 to 1·94) –0·64 (1·90 to 0·63) –1·34 (–2·95 to 0·30) –0·68Age 65 years and older 3·53 (2·16 to 4·91) 4·53 (3·44 to 5·64) 1·06 (–0·64 to 2·79) 0·54All ages 2·04 (1·03 to 3·05) 2·16 (1·34 to 2·99) 0·17 (–1·08 to 1·44) 0·09
Lung cancerAge 15–64 years –0·48 (–2·54 to 1·63) –0·52 (–2·62 to 1·63) 0·17 (–2·67 to 3·08) 0·09Age 65 years and older 5·41 (3·60 to 7·25) 3·00 (1·32 to 4·70) –2·16 (–4·40 to 0·12) –1·10All ages 3·12 (1·82 to 4·43) 1·83 (0·50 to 3·19) –1·08 (–2·89 to 0·77) –0·55
Other causesAge 15–64 years 0·73 (–0·29 to 1·76) –1·28 (–2·42 to –0·13) –1·95 (–3·43 to –0·45) –0·99Age 65 years and older 3·99 (2·88 to 5·16) 3·53 (2·46 to 4·62) –0·50 (–2·04 to 1·06) –0·25All ages 2·41 (1·51 to 3·31) 1·55 (0·70 to 2·41) –0·85 (–2·06 to 0·37) –0·43
*Estimate obtained from fitting of the Poisson regression model in the stratified pre-intervention and post-intervention period. †Estimated by the intervention by trendinteraction term in the Poisson regression model. ‡Estimates derived from column 4, which show reduction in excess risk (relative proportional change) after theintervention. Reduction in excess risk was converted to be associated with 10 µg/m3 by the log linear assumption.
Table 3: Average annual percentage change in mortality and 95% CI before and after the intervention, with relative change in annualtrend from before to after the intervention
efficiency could be reduced at low ambient concentrations,and penetration to the lungs is high with oral breathing,and little experimental data on the effects of usual ambientconcentrations of SO2 on healthy people is reported. Athigh concentrations, SO2 alters nasal and tracheo bronchialmucociliary clearance rates in both human beings andanimals.29 Bronchoconstriction happens in people withasthma and in those with hyper-reactive airways, but afterthe air-quality intervention in Hong Kong, the decline inbronchial hyper-responsiveness in children without asthmaor wheezing,14 and chronic bronchitic symptoms inchildren13 and adults,30 provided evidence that importantcomponents of ambient pollutant mixtures derived fromsulphur were greatly reduced.
However, the apparent benefits of the reduction in SO2
could have been attributable to other combustion productsthat are not generated by low-sulphur fuels. Changes inconcentration of SO2 after the fuel regulation wasintroduced could simply be an indicator of otherqualitative changes in fuel and products of combustion,with reduction in another unidentified agent that causesthe health effects. Concentrations of PM10 were unchangedafter the intervention, but SO2 could be a modifier of theeffect of respirable particulates. SO2 is converted tosulphuric acid, which can be carried into small airways byrespirable particulates and impair lung function inchildren,31 but no monitoring data are available for freesulphuric acid across the period of intervention.
The benefits to health resulting from the 1990industrial fuel intervention were achieved with only amoderate effect on overall production costs.32 As a resultof licensing controls, high sulphur fuels have been bannedin Hong Kong since 1990, and in 2000 SO2
concentrations were maintained at below 20 �g/m3, morethan 50% below pre-intervention concentrations. Use ofultra-low sulphur (0·005%) diesel fuel for public andprivate transport, conversions to alternative fuels, andtightening of legislation is continuing.
ContributorsA J Hedley and C-M Wong had the idea for and directed the study jointly.T Q Thach and S Ma analysed data. A J Hedley, C-M Wong, T-H Lam,and H R Anderson discussed and interpreted data. A J Hedley and C-M Wong wrote the report, with reviews and contributions from H R Anderson and T-H Lam.
Conflict of interest statementNone declared.
AcknowledgmentsThis work is in part the result of a collaboration between the University ofHong Kong and St George’s Hospital Medical School, supported by theBritish Council and the Hong Kong Research Grants Council, and aRoyal Society/Ho Kan Tong visiting professorship to Professor Anderson.We thank Robert Law (director) and Chin Wan Tse (assistant director),from the Hong Kong Environmental Protection Department, for airpollution data and advice; the Census and Statistics Department formortality data; Patsy Chau and Eric Chan for statistical analysis; andMarie Chi for data management.
References1 Anderson HR. Health effects of air pollution episodes. In: Holgate S,
Koren HS, Samet JM, Maynard RL, eds. Air pollution and health.San Diego: Academic Press, 1999: 461–82.
2 Pope CA, Dockery DW, Schwartz J. Review of epidemiologic evidenceof health effects of particulate air pollution. Inhal Toxicol 1995; 7:1–18.
3 Pope CA III, Thun MJ, Namboodri M, et al. Particulate air pollutionas a predictor of mortality in a prospective study of US adults. Am J Respir Crit Care Med 1995; 151: 669–74.
4 Abbey DE, Nishino N, McDonnell WF, et al. Long term inhalableparticles and other air pollutants related to mortality in non-smokers.Am J Respir Crit Care Med 1999; 159: 373–82.
ARTICLES
THE LANCET • Vol 360 • November 23, 2002 • www.thelancet.com 1651
concluded that there was no association between SO2 anddeath rates after modelling SO2 and total suspendedparticles separately for season and year, and controlling forclimatic and other factors. The estimated unconfoundedeffect of SO2 on daily deaths was not significantly differentfrom zero and particulates showed the strongest effect ondaily deaths when their association with SO2 was weakest.In the Netherlands21 two approaches based on time-seriesanalyses, and trends in death rates over periods when SO2
concentrations varied, also led to the conclusion that SO2
is not a causal agent in mortality associated with airpollution. Furthermore, criticisms of the hypothesis thatrespirable particulates are the main component ofpollution mixtures that cause deaths have been extensivelyreviewed and refuted in view of new analyses of data fromUS cities, and associations between SO2 and NO2 and dailydeaths are weak and inconsistent.5 By contrast, strongassociations with respirable particulates and cardio-respiratory deaths were reported. However, results of othertime-series analyses have shown strong associationsbetween SO2 and daily deaths in Europe.6,22 Associationsbetween SO2 and deaths23 and hospital admissions24 intime-series analyses in Hong Kong are closely similar tothose in London, UK.25,26
In a time-series analysis on air pollution and deaths,23
the strongest effects we noted were for gases includingSO2, rather than respirable particulates. Katsouyanni andcolleagues6 also recorded evidence for an independenteffect of both SO2 and particulates in 12 European cities.The effects for SO2 were similar or stronger than for PM10,and these researchers suggested that this effect might bethe result of more complex pollutant mixtures and lowerparticulate concentrations in Europe than the USA;however in Hong Kong, respirable particulateconcentrations are high and about twice those in London,UK.24
Public-health policy on air-quality improvement wouldbe strengthened by better data on the effect of pollutionon life expectancy.7 Even if one pollutant greatly affectsdeath rates, do increases in deaths from pollution episodesarise only in susceptible individuals with pre-existingdisease, whose life expectancy is already short? The issueof mortality displacement is important for epidemiologicalstudies based on time-series, because if susceptible peopledie early on in the pollution episode, death rates after theepisode will be lower than expected. The resulting averagedeath rate over time could fail to show an associationbetween pollution and death rates.27
Time-series analyses have been used to investigatemortality displacement on different time scales after apollution episode.9,10 Results of these analyses suggest thatalthough some harvesting takes place for pneumonia, thehealth effects from a pollution episode continue andactually increase over long periods for respiratory andcardiovascular disease. The conclusion of these analyseswas that deaths were displaced by at least 2 months, butthat the limitation of the time-series approach does notallow the effects beyond that period to be defined. Resultsof cohort studies suggest an effect of 1 year or more, andKünzli and colleagues28 conclude that time-series studiesunderestimate deaths, and that the effect of air pollutionshould be based on prospective cohort studies.
The outcome of our study could be challenged ongrounds of biological plausibility. The mechanismunderlying the immediate health benefits arising from useof low sulphur fuel is unknown. SO2 is a chemical irritant,but in support of an argument against a role for SO2,Schwartz20 cites the finding that 80% of ambient SO2 isremoved by the nose and exhaled. However, scrubbing

ARTICLES
1652 THE LANCET • Vol 360 • November 23, 2002 • www.thelancet.com
5 Samet JM, Dominici F, Curriero FC, Coursac I, Zeger SL. Fineparticulate air pollution and mortality in 20 US cities 1987–94. N Engl J Med 2000; 343: 1742–49.
6 Katsouyanni K, Touloumi G, Spix C, et al. Short term effects ofambient sulphur dioxide and particulate matter on mortality in 12European cities: results from time series data from the APHEAproject. BMJ 1997; 314: 1658–63.
7 Brunekreef B, Hoek G. Beyond the body count: air pollution anddeath. Am J Epidemiol 2000; 151: 449–51.
8 Brunekreef B. Air pollution and life expectancy: is there a relation? Occ Environ Med 1997; 54: 781–84.
9 Zeger SL, Dominici F, Samet J. Harvesting-resistant estimates of airpollution effects on mortality. Epidemiology 1999; 10: 171–75.
10 Schwartz J. Harvesting and long term exposure effects in the relationbetween air pollution and mortality. Am J Epidemiol 2000; 151:440–48.
11 Ostro BD, Chestnut LG, Mills DM, Watkins AM. Estimating theeffects of air pollutants on the population: human health benefits ofsulfate aerosol reductions under Title IV of the 1990 Clean Air ActAmendments. In: Holgate S, Koren HS, Samet JM, Maynard RL, eds.Air pollution and health. San Diego: Academic Press, 1999: 899–915.
12 Hong Kong Government. Air pollution control (fuel restriction)regulations 1990: air pollution control ordinance (chapter 311)—gazette 4/1990. Hong Kong: Government Printer, 1990.
13 Peters J, Hedley AJ, Wong CM, et al. Effects of an ambient airpollution intervention and environmental tobacco smoke on children’s respiratory health in Hong Kong. Int J Epidemiol 1996; 25:821–28.
14 Wong CM, Lam TH, Peters J, et al. Comparison between twodistricts of the effects of an air pollution intervention on bronchialresponsiveness in primary school children in Hong Kong. J Epidemiol Community Health 1998; 52: 571–78.
15 Census and Statistics Department. Hong Kong Special AdministrativeRegion. 1985–1995 known death microdata sets. Available viahttp://www.info.gov.hk/censtatd/home.html (accessed June 5, 2002).
16 Environmental Protection Department. Air quality in Hong Kong1988–95. Hong Kong: Air Services Group, Environmental ProtectionDepartment. http://www.epd-asg.gov.hk. (accessed June 5, 2002).
17 Gemmell I, McLoone P, Boddy FA, Dickinson GJ, Watt GCM.Seasonal variation in mortality in Scotland. Int J Epidemiol 2000; 29:274–79.
18 Kuhn L, Davidson LL, Durkin MS. Use of Poisson regression andtime series analysis for detecting changes over time in rates of childinjury following a prevention program. Am J Epidemiol 1994; 140:943–55.
19 Hedley AJ. Lancet appendix.http://www.hku.hk/cmd/ajh/lancet/index.html (accessed Nov 22,2002).
20 Schwartz J. Daily deaths are associated with combustion particlesrather than SO2 in Philadelphia. Occup Environ Med 2000; 57:692–97.
21 Buringh E, Fischer P, Hoek G. Is SO2 a causative factor for the PM-associated mortality risks in the Netherlands? Inhal Toxicol 2000; 12 (suppl 1): 55–60.
22 Derriennic F, Richardson S, Mollie A, Lellouch J. Short-term effectsof sulphur dioxide pollution on mortality in two French cities.Int J Epidemiol 1989; 18: 186–97.
23 Wong CM, Ma S, Hedley AJ, Lam TH. Effect of air pollution on daily mortality in Hong Kong. Environ Health Perspect 2001; 109:335–40.
24 Wong CM, Atkinson WR, Anderson HR, et al. A tale of two cities:effects of air pollution on hospital admissions in Hong Kong andLondon compared. Environ Health Perspect 2002; 110: 67–77.
25 Anderson HR, Ponce de Leon A, Bland JM, Bland JM, Bower JS,Strachan DP. Air pollution and daily mortality in London: 1987–92.BMJ 1996; 312: 649–50.
26 Atkinson RW, Bremner SA, Anderson HR, Strachan DP, Bland JM,de Leon AP. Short term associations between emergency hospitaladmissions for respiratory and cardiovascular disease and outdoor airpollution in London. Arch Environ Health 1999; 54: 398–411.
27 McMichael AJ, Anderson HR, Brunekreef B, Cohen AJ. Inappropriateuse of daily mortality analyses to estimate longer-term mortality effectsof air pollution. Int J Epidemiol 1998; 27: 450–53.
28 Künzli N, Medina S, Kaiser R, Quenel P, Horak F Jr, Studnicka M.Assessment of deaths attributable to air pollution: should we use riskestimates based on time series or cohort studies? Am J Epidemiol 2001;153: 1050–55.
29 Schlesinger RB. Toxicology of sulphur oxides. In: Holgate S, Koren HS, Samet JM, Maynard RL, eds. Air pollution and health.San Diego: Academic Press, 1999: 585–602.
30 Wong CM, Hu ZG, Lam TH, Hedley AJ, Peters J. Effects of ambientair pollution and environmental tobacco smoke on respiratory healthof non-smoking women in Hong Kong. Int J Epidemiol 1999; 28:859–64.
31 Spengler JD, Koutrakis P, Dockery DW, Raizenne M, Speizer FE.Health effects of acid aerosols on North American children: airpollution exposures. Environ Health Perspect 1996; 104: 492–99.
32 Barron WF, Liu J, Lam TH, Wong CM, Peters J, Hedley AJ. Costsand benefits of air quality improvement in Hong Kong. Contemp Econ Policy 1995; 13: 105–17.