image lab software for the gs-900 densitometer · to export the data, use the other options in the...
TRANSCRIPT

Image Lab™ Software for the GS-900™ DensitometerQuick Start Guide
Catalog # 170-9690

Copyright © 2013 by Bio-Rad Laboratories, Inc. All rights reserved.
Bio-Rad Technical SupportFor help and technical advice, please contact the Bio-Rad Technical Support department. In the United States, the Technical Support department is open Monday–Friday, 5:00 AM–5:00 PM, Pacific time.
Phone: 1-800-424-6723 Fax: 1-510-741-5802 Email: [email protected] (for U.S. and international customers)
Online technical support and worldwide contact information are available at www.consult.bio-rad.com.
Legal NoticesNo part of this publication may be reproduced or transmitted in any form or by any means, electronic or mechanical, including photocopy, recording, or any information storage or retrieval system, without permission in writing from Bio-Rad Laboratories.
Bio-Rad reserves the right to modify its products and services at any time. This instruction manual is subject to change without notice. Although prepared to ensure accuracy, Bio-Rad assumes no liability for errors, or for any damages resulting from the application or use of this information.
Precision Plus Protein™ standards are sold under license from Life Technologies Corporation, Carlsbad, CA for use only by the buyer of the product. The buyer is not authorized to sell or resell this product or its components.

Image Lab Software for the GS-900 Densitometer | iii
Table of Contents
Procedure for Image Acquisition and Analysis . . . . . . . . . . . . . . . . . . . . . . . . . . . . . . . . . . . . . . . . . . . . . . . . . . . 1
Overview . . . . . . . . . . . . . . . . . . . . . . . . . . . . . . . . . . . . . . . . . . . . . . . . . . . . . . . . . . . . . . . . . . . . . . . . . . . 1
1. Protocol Setup and Image Acquisition . . . . . . . . . . . . . . . . . . . . . . . . . . . . . . . . . . . . . . . . . . . . . . . . . . . 1
2. Image Adjustment . . . . . . . . . . . . . . . . . . . . . . . . . . . . . . . . . . . . . . . . . . . . . . . . . . . . . . . . . . . . . . . . . . 3
3. Lane and Band Detection . . . . . . . . . . . . . . . . . . . . . . . . . . . . . . . . . . . . . . . . . . . . . . . . . . . . . . . . . . . . 4
3.1. Lane Detection . . . . . . . . . . . . . . . . . . . . . . . . . . . . . . . . . . . . . . . . . . . . . . . . . . . . . . . . . . . . . . . 5
3.2. Band Detection and Analysis . . . . . . . . . . . . . . . . . . . . . . . . . . . . . . . . . . . . . . . . . . . . . . . . . . . . . 7
4. Molecular Weight Analysis . . . . . . . . . . . . . . . . . . . . . . . . . . . . . . . . . . . . . . . . . . . . . . . . . . . . . . . . . . . . 9
5. Result and Report Generation . . . . . . . . . . . . . . . . . . . . . . . . . . . . . . . . . . . . . . . . . . . . . . . . . . . . . . . . 11

Image Lab Software for the GS-900 Densitometer | 1
Procedure for Image Acquisition and Analysis
OverviewThe procedure described here is for first-time gel imaging and analysis with the GS-900™ densitometer. It involves the following five steps (click for details):
1. Protocol setup and acquisition
2. Image adjustment
3. Lane and band detection
4. Molecular weight analysis
5. Result and report generation
1. Protocol Setup and Image Acquisition1. Click New Protocol to open the Protocol Setup window. Set the acquisition settings,
then click Preview Gel to preview your gel image.
Select the application
Change the scan resolution
Select the gel type (sets scan area)

2 | Image Lab Software for the GS-900 Densitometer
2. In the Preview view, select the region to scan by dragging the edges and corners of the red box. Click Run Protocol to scan your gel.
Note: At any time during image adjustment and analysis:
■■ Click Undo in the header to undo any changes.
■■ Click View > Operation History for a list of all actions performed during image adjustment and analysis. To revert to a previous state, click on the action.
The Operations History and Undo capabilities are cleared each time the file is saved.
Drag corners to set scan area
3. The gel image appears, and the options in the Analysis Tool Box (at left) are activated. Use these options to adjust the gel image and to detect and analyze gel lanes and bands.
Image adjustment (Step 2)
Lane and band detection (Step 3)
Molecular weight analysis (Step 4)

Image Lab Software for the GS-900 Densitometer | 3
2. Image AdjustmentIn the Analysis Tool Box, click Image Tools. Use these tools to flip, rotate, or crop the gel image. To return to the Analysis Tool Box, click the arrow.
Click to return to the Analysis Tool Box
1. To crop a gel image, click Crop and adjust the red box to the desired crop window. Right-click within the box and click Crop to crop the image.
Drag to adjust crop window
Right-click and click Crop

4 | Image Lab Software for the GS-900 Densitometer
2. To adjust the image contrast or brightness, click the Image Transform icon. Use the High, Low, and Gamma sliders to optimize the image for presentation. The image transform has no effect on the data; it changes only the appearance of the image.
Use these options to adjust image brightness and contrast
3. Lane and Band DetectionIn the Analysis Tool Box, click Lane and Bands to access a set of lane and band detection tools. To return to the Analysis Tool Box, click the arrow.

Image Lab Software for the GS-900 Densitometer | 5
3.1. Lane Detection1. In the Lane tab, under Lane Finder, click Automatic to automatically detect lanes.
a. To add a lane, click Add. The new lane is highlighted in red. Drag the lane to its new position, then right-click to set its position.
2. Options to adjust All Lanes or a Single Lane are enabled. Click outside the gel image to set any changes.
a. To resize or adjust all lane frames proportionally and at the same time, click Resize or Adjust (under All Lanes). Drag a corner or side of the frame to make the desired changes.
b. To adjust the position of a lane, click Move (under Single Lane). Select the lane and move it to its new position.
c. To adjust the curvature of a lane, click Bend (under Single Lane). Click within the lane and drag points at the top, bottom, or center of the lane to adjust its curvature.
d. To adjust the width of lanes, click Width under (All Lanes or Single Lane) and use the boxes to define the lane width. Alternatively, define the lane width in the mm box and click Apply.
Detect lanes in the gel image
Make changes to all lanes
Make changes to single lanes
Select the change, then click to select the lane; active lanes are highlighted in red

6 | Image Lab Software for the GS-900 Densitometer
3. Perform background subtraction using the options in the Background Subtraction box.
a. Define the size of the rolling disk used to determine the amount of background subtracted from your lanes. Set the disk size in mm (1–99; reduce the size to subtract more background). Click Apply. To adjust the background for a single lane, select the Apply to individual lane checkbox.
b. To visualize the background in a lane, click Lane Profile. In the Lane Profile window, the profile appears in red (OD, intensity) and the background in gray. Use the options in this window to include/exclude the background and view other lanes. Click to select a lane within the gel image; the selected lane is highlighted in red.
c. To convert disk size between Image Lab (in mm) and Quantity One® (in pixels) software, use the following equations:
Image Lab disk size = (Quantity One disk size x 4) / (1,000/Image Lab scanner resolution)
Quantity One disk size = (Image Lab disk size x 1,000 / Image Lab scanner resolution) / 4
Lane profile
Background
Display options

Image Lab Software for the GS-900 Densitometer | 7
3.2. Band Detection and AnalysisWith lanes and background determined, use the options under the Bands tab to detect and analyze bands.
1. Click Detect Bands... to open the Band Detection window:
a. Set detection sensitivity using preset or custom options. Band detection in Image Lab is controlled by a single sensitivity parameter (1–100), which is a composite of the various parameters from Quantity One.
b. Apply the sensitivity setting to all or individual lanes using the options under Apply To, then click Detect.
Set detection sensitivity
Magnification options
Adjust bands
8 | Image Lab Software for the GS-900 Densitometer
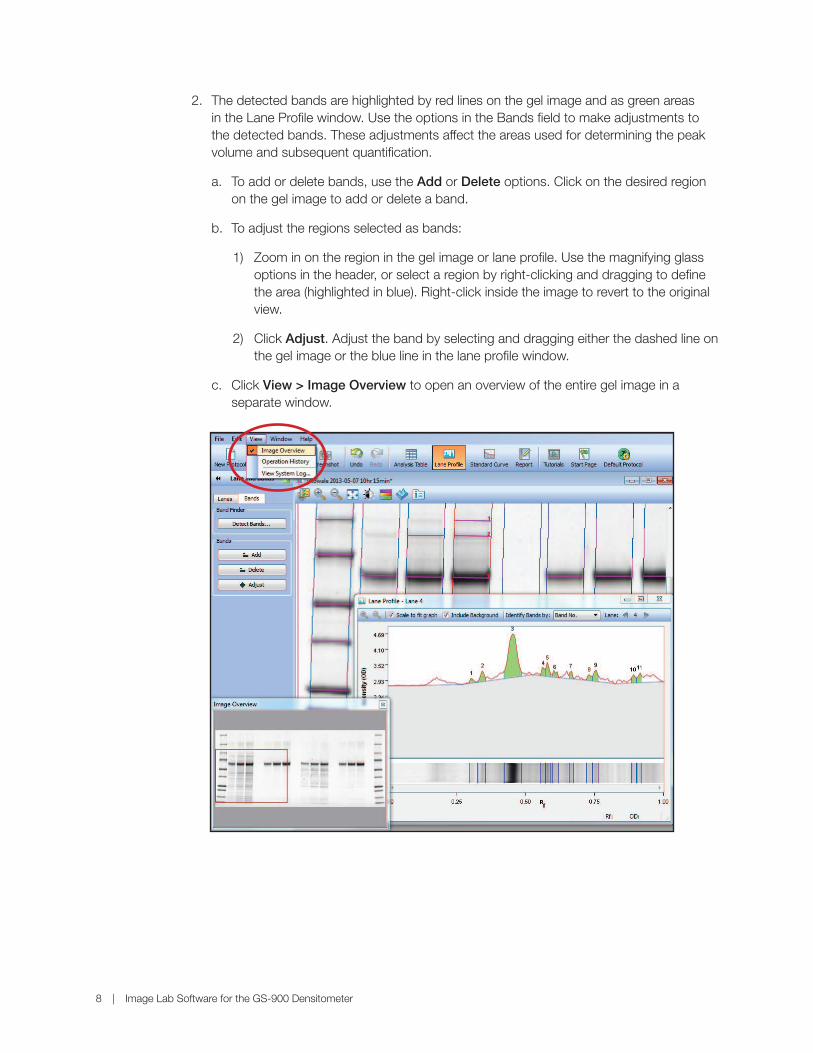
2. The detected bands are highlighted by red lines on the gel image and as green areas in the Lane Profile window. Use the options in the Bands field to make adjustments to the detected bands. These adjustments affect the areas used for determining the peak volume and subsequent quantification.
a. To add or delete bands, use the Add or Delete options. Click on the desired region on the gel image to add or delete a band.
b. To adjust the regions selected as bands:
1) Zoom in on the region in the gel image or lane profile. Use the magnifying glass options in the header, or select a region by right-clicking and dragging to define the area (highlighted in blue). Right-click inside the image to revert to the original view.
2) Click Adjust. Adjust the band by selecting and dragging either the dashed line on the gel image or the blue line in the lane profile window.
c. Click View > Image Overview to open an overview of the entire gel image in a separate window.

Image Lab Software for the GS-900 Densitometer | 9
4. Molecular Weight AnalysisIn the Analysis Tool Box, click MW Analysis Tools. Use these options to select the protein standard and regression method used for mass determination.
1. Select the protein standard used. Under Standards, click Change.... In the Manage Standards window, select the protein standard used in your gel and click OK. If the standard does not appear, click New to create and save the new standard.

10 | Image Lab Software for the GS-900 Densitometer
2. Identify the lane(s) containing the standard. Under Standard Lanes, either:
a. Select the box at the bottom of each standard lane in the gel image, or...
b. Enter the number of the lane(s) in the Standard Lanes window (for example, “first” to designate first lane, “last” to designate last lane, or numerals indicating the lanes).
3. Select the regression method for estimating molecular weight. Review the results by clicking Standard Curve in the menu bar.

Image Lab Software for the GS-900 Densitometer | 11
5. Result and Report Generation1. Click Analysis Table in the menu bar to open a table of analysis results. Scroll through
the data, or click in the gel image to view the data for a lane.
2. Click the Display Options icon to customize the data shown.
3. To export the data, use the other options in the table header.
Display options
Measurements tab: select the data shown
Display tab: set precision of the values
Note: To obtain results with Image Lab software that are equivalent to those obtained with Quantity One (for example, a purity analysis defined by percent band), use the same background subtraction, band detection, lane width, and band integration as defined in the lane profile window (described above).

12 | Image Lab Software for the GS-900 Densitometer
4. To generate a report containing the gel image and its associated data, click Report in the menu bar. Click the Display Options icon to select the items displayed in the report; click OK to regenerate the report with the new selections.

Life ScienceGroup
Sig 1212
Bio-Rad Laboratories, Inc.
Web site www.bio-rad.com USA 800 424 6723 Australia 61 2 9914 2800 Austria 01 877 89 01 Belgium 09 385 55 11 Brazil 55 11 5044 5699 Canada 905 364 3435 China 86 21 6169 8500 Czech Republic 420 241 430 532 Denmark 44 52 10 00 Finland 09 804 22 00 France 01 47 95 69 65 Germany 089 31 884 0 Greece 30 210 9532 220 Hong Kong 852 2789 3300 Hungary 36 1 459 6100 India 91 124 4029300 Israel 03 963 6050 Italy 39 02 216091 Japan 03 6361 7000 Korea 82 2 3473 4460 Mexico 52 555 488 7670 The Netherlands 0318 540666 New Zealand 64 9 415 2280 Norway 23 38 41 30 Poland 48 22 331 99 99 Portugal 351 21 472 7700 Russia 7 495 721 14 04 Singapore 65 6415 3188 South Africa 27 861 246 723 Spain 34 91 590 5200 Sweden 08 555 12700 Switzerland 026 674 55 05 Taiwan 886 2 2578 7189 Thailand 800 88 22 88 United Kingdom 020 8328 2000
Bulletin 6421 Rev A US/EG 0513