high school graduation rates
TRANSCRIPT

ANNUAL UPDATE
2016
A REPORT BY:Civic EnterprisesEveryone Graduates Center at the School of Education at Johns Hopkins University
LEAD SPONSOR:AT&T
SUPPORTING SPONSORS:Target
State Farm
Building a Grad Nation:Progress and Challenge in Raising High School Graduation Rates


A Report by:Civic EnterprisesEveryone Graduates Center at the School of Education at Johns Hopkins UniversityIn Partnership with:Alliance for Excellent EducationAmerica’s Promise AllianceAuthored by:Jennifer L. DePaoliRobert BalfanzJohn BridgelandData Analysis by:Vaughan ByrnesMark PiersonEdited by:Erin IngramKathleen McMahonJoanna Hornig FoxMary Maushard
Annual Update 2016
Building a Grad Nation:Progress and Challenge in Raising High School Graduation Rates

Annual Update 2016 Building a Grad Nation4
TABLE OF CONTENTS
Letter from General and Mrs. Powell................................................................................................................................. 7
Executive Summary ............................................................................................................................................................. 9
Progress and Challenge on the Road to 90 .................................................................................................................... 13
The National Picture .......................................................................................................................................................... 15
Roadblocks on the Path to 90 .......................................................................................................................................... 23
The Nation Continues the Push to 90 .............................................................................................................................. 34
Setting the Record Straight on High School Graduation Rates .................................................................................... 37
Extended-Year Graduation Rates .................................................................................................................................... 42
Policy Recommendations to Reach 90 for All ................................................................................................................ 45
Including Homeless Students .......................................................................................................................................... 47
Acknowledgments ............................................................................................................................................................ 51
AppendicesAppendix A: Four-Year Adjusted Cohort Graduation Rates (ACGR), by State and Subgroup, 2013-14 .......................... 52
Appendix B: Adjusted Cohort Graduation Rate (ACGR) Change from 2010-11 to 2013-14, by State ............................. 54
Appendix C: Adjusted Cohort Graduation Rate (ACGR) Gaps, by Subgroup and State, 2013-14................................... 55
Appendix D: Adjusted Cohort Graduation Rate (ACGR) Gap Change, by Subgroup and State from 2010-11 to 2013-14 ............................................................................................................................. 58
Appendix E: Estimated Non-Low-Income Adjusted Cohort Graduation Rate (ACGR), Low-Income ACGR, Gap between Low-Income and Non-Low-Income, and Gap Change, by State, from 2012-13 to 2013-14 ............................................................................................................................. 60
Appendix F: Adjusted Cohort Graduation Rate (ACGR), by State, Percent Low-Income, ACGR Low-Income, ACGR Estimated Non-Low-Income, Gap between Low-Income and Non-Low-Income, and Gap Change, by State from 2011-2014 .................................................................. 62
Appendix G: Adjusted Cohort Graduation Rate (ACGR, 2013-14) for Students with Disabilities (SWD) versus Non-SWD ............................................................................................................................... 64
Appendix H: Number of High Schools by Different Levels of Promoting Power, 2002-2014 ........................................... 66
Appendix I: Change of High Schools with Promoting Power of 60 Percent or Less by Locale, 2002-2014 ................... 67
Appendix J: Large High Schools and Students Enrollment by Race/Ethnicity with a 2014 Adjusted Cohort Graduation Rate (ACGR) 67 Percent or Below, 2014 ....................................................... 68
Appendix K: 2014 State On-Pace/Off-Pace to 90 Percent ACGR by Class of 2020 ........................................................ 70
Appendix L: ESSA High Schools with ACGR 67 Percent or Below, by State and Type, 2014 ......................................... 72
Appendix M: Number of Non-Graduates by State and School Type, 2014 ...................................................................... 74
Appendix N: Number and Percentages of Regular High Schools by Type (District, Charter, Virtual), 2014 ..................... 76
Appendix O: Number and Percentages of Alternative High Schools by Type (District, Charter, Virtual), 2014 ................................................................................................................................................. 78
Appendix P: Number and Percentages of Special Education High Schools by Type (District, Charter, Virtual), 2014 ................................................................................................................................... 80
Appendix Q: Number and Percentages of Vocational High Schools by Type (District, Charter, Virtual), 2014 ................................................................................................................................................. 82
Appendix R: Four-Year Adjusted Cohort Graduation Rate (ACGR) Data Links, by State ................................................. 84
Appendix S: Frequently Used Terms and Definitions ....................................................................................................... 86
Appendix T: Graduation Rate FAQ ................................................................................................................................... 87
Appendix U: Civic Marshall Plan Principles ...................................................................................................................... 90

Annual Update 2016 Building a Grad NationAnnual Update 2016 Building a Grad Nation 5
TablesTable 1. Estimated Additional Graduates Needed to Reach a National 90 Percent Graduation Rate ....................19
Table 2. Estimated Number of Additional Graduates Needed to Reach a 90 Percent Graduation Rate (ACGR) for each Subgroup, by State, 2013-14 .........................................................................................20
Table 3. States with the Highest Percentage of Low-Graduation-Rate High Schools, 2014 ..................................25
Table 4. States with the Highest Percentage of Low-Graduation-Rate High Schools that were Alternative Schools, 2013-14 .....................................................................................................................27
Table 5. States with the Highest Percentage of Non-Graduates Coming from Alternative High Schools, 2013-14 ..............................................................................................................................28
Table 6. States with the Highest Percentage of Low-Graduation-Rate High Schools that were Charter Schools, 2013-14 ..........................................................................................................................28
Table 7. States with the Highest Percentages of Non-Graduates Coming from Charter Schools, 2013-14 ..........29
Table 8. States with the Highest Percentage of Low-Graduation-Rate High Schools that were Virtual Schools, 2013-14 ............................................................................................................................29
Table 9. States with the Highest Percentage of Non-Graduates Coming from Virtual Schools, 2013-14 ..............30
Table 10. Percentage of Total Alternative District High Schools with ACGR of 67 Percent or Below in Select States, 2013-14 ................................................................................................................30
Table 11. Percentage of Total Alternative Charter Schools with ACGR of 67 percent or Below in Select States, 2013-14 ..............................................................................................................................31
Table 12. Percentage of Total Regular Virtual Schools with ACGR of 67 Percent or Below in Select States, 2013-14 .........................................................................................................................................32
Table 13. Low-Graduation-Rate High Schools, High-Graduation-Rate High Schools, and Average ACGR, by School Type, 2014 ....................................................................................................................32
Table 14. Changes in Cohort Size, Ninth Grade Enrollment, and ACGR Graduates Over Time, by State ................40
Table 15. Extended-Year Graduation Rates by State, 2011-2014 ............................................................................43
FiguresFigure 1. U.S. ACGR Ranges by State, 2013-14 ......................................................................................................15
Figure 2. Averaged Freshman Graduation Rate (AFGR) and Four-Year Adjusted Cohort Graduation Rate (ACGR), 2002-2014 ...........................................................................................................................16
Figure 3. Adjusted Cohort Graduation Rate (ACGR) for Black, Hispanic, and White Students from 2010-11 to 2013-14 ..................................................................................................................................16
Figure 4. 2013-14 ACGR for Low-Income Students .................................................................................................17
Figure 5. 2014 State On-Pace/Off-Pace to 90 Percent ACGR by the Class of 2020 ...............................................18
Figure 6. Estimated Number of Additional Graduates Needed to Reach a 90 Percent Graduation Rate (ACGR) by State, 2013-14 .........................................................................................................................19
Figure 7. Students in Large High Schools (i.e., with 300 or more students) with ACGR of 67 Percent or Less .......24
Figure 8. Percent of High Schools with a Graduation Rate of 67 Percent or Below by Locale Type (2013-14) ................................................................................................................................24
Figure 9. Percent of High Schools with a Graduation Rate of 85 Percent and Above by Locale Type (2013-14) ................................................................................................................................25
Figure 10. Percentage of High Schools (enrolling 100 or more students) with ACGR 67 Percent or Less, 2013-14...........................................................................................................................26
Figure 11. Percent of Test-Takers Meeting the ACT College & Career Readiness Benchmarks ................................37
Figure 12. AP Test-Taking and Graduation Rates 2004-2013 .....................................................................................38
Figure 13. AP Exam Trends for Low-Income Students 2006-2013 ............................................................................38
Figure 14. Class of 2014 On-time (Four-year) State High School Graduation Rates (by poverty and housing status) .................................................................................................................48

Executive Summary Progress and Challenge in Raising High School Graduation Rates
Annual Update 2016 Building a Grad Nation6

Annual Update 2016 Building a Grad NationAnnual Update 2016 Building a Grad Nation 7
Progress and Challenge in Raising High School Graduation Rates Letter from General and Mrs. Powell
Letter from General and Mrs. Powell
A decade ago, we helped to launch the GradNation campaign, a national effort to put more young people on the path to success in school, work and life by increasing high school graduation rates. We are happy that this year, once again, graduation rates have continued to rise. As a result of progress made in the past decade, nearly 2 million additional young people have graduated from high school. These young people have strengthened their chances for productive, engaged, meaningful and long lives, which is a huge benefit to them, their families, their communities, and the nation.
This progress is the result of years of hard work on the part of millions of students, parents and educators who have kept this issue front and center. Thousands of dedicated leaders of nonprofits and businesses, schools and school districts, states and communities have kept at it, working to improve educational outcomes, provide struggling students with the support they need in and outside of school, and build better data and stronger accountability systems.
As pleased as we are with the progress, our work is hardly done. Despite new heights in graduation rates, for the first time in four years, the nation is slightly off the pace needed to reach a 90 percent on-time graduation rate by 2020. This is an early-warning call to action that cannot be ignored.
As this Building a Grad Nation report shows, persistent graduation rate gaps hold back large numbers of minority, low-income, homeless, Limited English Proficient (LEP) and disabled students across our nation. These students continue to graduate at significantly lower rates than their peers in nearly every state, leaving them poorly prepared for the next steps of college and career and at a significant disadvantage in today’s demanding workforce. As we get closer to 2020, we must focus our attention on achieving a 90 percent graduation rate for all students. We cannot meet our obligations as a nation of opportunity until we give every young person, regardless of background, race, or life circumstances, the chance to succeed.
We continue to believe our goals are critical and achievable. We have as evidence the strong and steady progress made over the past decade. We have seen communities rally around schools and students. We have seen an increasing commitment to high standards. We have seen improved capacity to use data not only to track progress, but to provide well-informed and timely interventions when students begin to struggle and fall off track.
As we move forward, this spirit of collaboration, commitment to excellence, and smart use of all the tools available can help us overcome barriers and lift all students toward success. Now that we know progress is possible, we must double down on what works and continue to innovate to overcome the challenges ahead. Now is not the time to let up on the gas.
Together, we can and must build a nation in which all students have the opportunity to reach their American dream.
General Colin L. Powell, USA (Ret.) Founding Chair, America’s Promise Alliance
Alma J. Powell Chair, America’s Promise Alliance

Executive Summary Progress and Challenge in Raising High School Graduation Rates
Annual Update 2016 Building a Grad Nation8

Annual Update 2016 Building a Grad NationAnnual Update 2016 Building a Grad Nation 9
Progress and Challenge in Raising High School Graduation Rates Executive Summary
The National PictureWhen the Adjusted Cohort Graduation Rate (ACGR) hit 80 percent in 2012, we calculated that the national graduation rate would need to increase by roughly 1.2 percentage points per year to achieve 90 percent by the Class of 2020. Between 2013 and 2014, the nation missed this mark, and will now have to average closer to 1.3 percentage points over the next six years to reach the goal.
At the state level:
§ Of the 47 states reporting ACGR since 2011, Iowa became the first state to reach 90 percent, and 20 other states are on pace to reach a 90 percent gradua-tion rate. Five of these on-pace states – Nebraska, New Jersey, New Hampshire, Texas, and Wisconsin – are within two percentage points of the goal. The majority of these on-pace states started within 10 to 12 points of the goal and steadily climbed each year.
§ When solely examining rates of increase between 2013 and 2014 – the last two years of federally reported data – seven additional states exceeded the pace needed to get them to 90 percent. These states will have to maintain this accelerated pace to achieve the goal.
§ Twenty-one remaining states are currently off track to reaching 90 percent by 2020. Of these states, most started with graduation rates in the 60s and 70s in 2011, and have been unable to meet the higher rate of growth needed to get them to the 90 percent mark. One-quarter of these states, however, started in 2011 with graduation rates in the 80s (Hawaii, North Dakota, Ohio, Pennsylvania, South Dakota, and Wyoming), but have since seen stagnation, and even backsliding, that has put them off pace to the goal.
Executive SummaryThe nation has achieved an 82.3 percent high school graduation rate – a new record high – and had another year of significant gains for nearly all student subgroups. These gains have been made possible by the schools, districts, and states that prioritized raising their graduation rates and made sure more students leave high school equipped with a high-quality diploma. Over the past decade, a majority of states increased the number of students graduating high school on time, and put themselves in good position to reach a 90 percent high school graduation rate by the Class of 2020. At the same time, the number of high schools failing to graduate one-third or more of students has been reduced, meaning fewer students are attending high schools where graduation is not the norm.
All of this progress, however, is tempered by the fact that this year the national rate of improve-ment – 0.9 percentage points – puts the nation off pace to reach the 90 percent goal, and marked the first time since 2011 the national graduation rate increased by less than one point. There are also very real concerns that too many of our most vulnerable students remain in low-gradua-tion-rate schools, and that the alternative pathways that have been created to meet their needs may, in many cases, not be up to the task. Additionally, questions have been raised about the validity of rising graduation rates and whether the increasing number of high school diplomas being earned is translating into success in postsecondary education and careers. In this year’s Building a Grad Nation report, we examine these issues further and explore both the important progress the nation has made and the considerable challenges that remain.

Annual Update 2016 Building a Grad Nation10
Executive Summary Progress and Challenge in Raising High School Graduation Rates
The state-level data also showed troubling trends for student subgroups:
§ Sixteen states had graduation rates below 70 percent for low-income or Black students, and 11 states had graduation rates below 70 percent for Hispanic/Latino students.
§ Thirty-five states graduated less than 70 percent of English Language Learners, and 33 had graduation rates below 70 percent for students with disabilities.
§ Nearly half of 2014 graduates came from low-income families, but only 74.6 percent of all low-income students graduated compared to 89 percent of non-low-income students.
For both the nation and individual states, getting on pace to 90 percent and honoring America’s commitment to equality of opportunity will require raising graduation rates for all student subgroups, not just those already on pace. Altogether, raising the graduation rate from its current 82.3 percent to 90 percent would require graduating an additional 284,591 students. To graduate this additional number of students equitably, schools, districts, and states will have to focus on getting significantly more students of color, students with disabilities, English Language Learners, and low-income students on track to earning a diploma.
Roadblocks on the Path to 90In previous Building a Grad Nation reports, we highlighted roadblocks that will prevent the nation from reaching a 90 percent graduation rate if not addressed. This year’s report focuses on five major roadblocks, including complacency in states that have graduation rates in the 80s and have stagnated. A failure to understand that students who are not graduating need the greatest supports; seeing graduation for all students as someone else’s concern and passing vulnerable students off to others; not maintaining strong graduation rate accountability under ESSA; and creating different types of diploma pathways for different groups of students. Though there is clear evidence of these roadblocks across the country, none have yet reached a critical mass. Therefore, as a nation, we must remain keenly aware of these challenges and move forward armed with the knowledge to overcome these barriers successfully.
America’s Low-Graduation-Rate High SchoolsLow-graduation-rate high schools – those graduating 67 percent or less of students – are on the decline, but there are still significant numbers of them across the country. These high schools tend to enroll larger populations of Black, Hispanic/Latino, and low-income students, and it is therefore critical that low-graduation-rate high schools be targeted for additional reforms and support. The new Every Student Succeeds Act of 2015 (ESSA) requires just this, prompting states to use evidence-based approaches to improve the high schools enrolling 100 or more students with an ACGR of 67 percent or less. Keeping in line with the new legislation, we examined the schools that meet the ESSA definition for low-performing high schools to see where they are and what kind of high schools tend to fall into this category. Some of our findings include:
§ Nationwide, there are four high-graduation-rate high schools (85 percent ACGR and above) for every one low-graduation-rate high school (67 percent ACGR and below).
§ Twenty-four percent of all high schools were located in cities, but urban areas were home to more than half of 2014 low-graduation-rate high schools. Just 17 percent of high schools graduating 85 percent or more of students were in cities in 2014.
§ Forty-one percent of low-graduation-rate high schools were regular public schools (non-charter) in 2014. Seven percent of regular district high schools, or roughly 1,000 schools nationwide, were low-gradu-ation-rate schools. The number of low-graduation-rate regular public high schools across states ranges from zero in Delaware, Hawaii, and Kentucky to more than 276 in New York and 203 in Florida. In eight states, low-graduation-rate high schools represent more than one-quarter of all schools, and in two of those states – Alaska and New Mexico – low-graduation-rate high schools represent 40 percent or more of all schools.
The number of alternative, charter, and virtual schools is growing. These schools are disproportionately represented among low-graduation-rate high schools and are substan-tial producers of non-graduates in a number of states:
§ Twenty-eight percent of low-graduation-rate high schools were alternative high schools (geared toward meeting the needs of “at-risk” students), and 10 percent of all non-graduating students came from this type of school. In all, 57 percent of alternative high schools nationwide were low-graduation-rate high schools, while only eight percent of alternative

Annual Update 2016 Building a Grad NationAnnual Update 2016 Building a Grad Nation 11
Progress and Challenge in Raising High School Graduation Rates Executive Summary
number of students taking the ACT, SAT, and AP courses has increased over time. The number of students passing at least one AP course has increased, while ACT and SAT exam scores have stagnated. This clearly shows that more effort is needed to ensure all high school graduates are fully ready for postsecondary schooling, but it is not evidence that standards have been lowered as high school graduation rates have risen.
The second part of this examination explored trends in state graduation rate reporting and student enrollment. It revealed little to no initial proof at the state level that increases in graduation rates have been driven by removing students from the cohort rather than graduating more students. A more thorough examination needs to be performed to determine if this is happening at school or district levels.
Finally, we examine available evidence on how many students are graduating from high school in five or six rather than four years. Examining extended-year gradua-tion rates across all states currently reporting them reveals that, on average, measuring students graduating in five years led to an additional three percentage point increase in the overall graduation rate, and including students who graduated in six years added an additional percentage point. These factors can have a significant impact on how schools, districts, and states are assessed on graduating students, and therefore, deserve more in-depth study and attention to help understand the reality of high school graduation rates.
Policy RecommendationsTo move the needle to 90 percent by the Class of 2020 and help ensure accuracy in graduation rate reporting, we recommend the following:
§ Set clear definitions and give graduation rates the weight they deserve in ESSA. ESSA requires evidence-based, targeted intervention in schools with “consistently underperforming” student subgroups, but should more clearly define what this means to ensure that schools and districts are held accountable for graduating traditionally underserved students.
§ Resolve issues in graduation rate collection and reporting regulations. A lack of clarity in federal graduation rate guidelines provides room for states to calculate high school graduation rates in different manners. These issues of clarity and variability hold meaningful consequences for comparability across states and accuracy in graduation rate reporting, and they must be resolved to make sure states are not straying from the intent of the law.
schools were high-graduation rate high schools. Alternative high schools had an average graduation rate of just 52 percent.
§ Twenty-six percent of low-graduation-rate high schools were charter schools and 12 percent of non-graduates came from charter schools. Thirty percent of charter schools reporting ACGR in 2014 were low-grad-uation-rate high schools, and 44 percent were high-graduation-rate high schools. Charter schools had an average graduation rate of 70 percent, meaning the depth of low performance in the low-graduation-rate high schools is drastically pulling down the overall performance of these schools.
§ Virtual schools made up seven percent of low-grad-uation-rate high schools and produced four percent of non-graduates; however, roughly 87 percent of virtual schools were low-graduation-rate high schools in 2014. Only four percent were high-gradua-tion-rate high schools.
Though alternative, charter, and virtual schools collec-tively make up only about 14 percent of high schools and enroll just eight percent of high school students, they make up around 50 percent of low-graduation-rate high schools nationwide and produce 20 percent of non-graduates. It should be noted that many of these schools exist to serve a vulnerable student population, and therefore deal with significant challenges that can make it difficult to get students on track to graduation in four years. That is why we are calling on states to mandate the reporting of five- and six-year graduation rates, which would provide a better understanding of how these high schools are really doing in getting students to graduation. Beyond that, the analysis in this report indicates that too many of the growing number of alternative, charter, and virtual high schools are not graduating high percentages of students in four years. It is vital that we meaningfully examine all of the nation’s low-graduation-rate high schools to ensure that all students are being given the opportunities and support they need to succeed in life.
Setting the Record Straight on High School Graduation RatesAs the national high school graduation rate continues to rise, questions have been raised about whether this growth is real and if it leads to postsecondary success for students. To begin investigating these questions, this report first examined indicators of high school rigor and college readiness, including high school exit exams, ACT and SAT test-taking and scores, and AP course-taking and passing rates. These indicators show that the

Annual Update 2016 Building a Grad Nation
Executive Summary Progress and Challenge in Raising High School Graduation Rates
Annual Update 2016 Building a Grad Nation12
§ Provide real pathways to engage students who have fallen off track. Students who have fallen off track to graduation need the things that all students need to be successful: positive relationships with caring adults, strong and tailored instruction, opportunities to engage in learning experiences that connect school to careers and life beyond, and the support and resources to help them figure out what they want to do once they have earned their diploma. These should be at the core of any school or program, particularly those serving vulnerable student populations.
§ Create evidence-based plans to improve low-grad-uation-rate high schools. With the new ESSA require-ment that states intervene in high schools graduating 67 percent or less of students, it is vital that state leaders support schools and districts in creating and imple-menting evidence-based plans to improve low-gradua-tion-rate high schools.
§ Require the reporting of extended-year graduation rates. This report shows that, on average, reporting five- and six-year graduation rates leads to additional per-centage point gains in overall graduation rates. Reporting these extended-year graduation rates would provide a more accurate picture of who is and is not graduating.
§ Ensure alternative, charter, and virtual schools are included in state accountability and improvement systems. ESSA requires that any school failing to graduate one-third or more if its students be identified for comprehensive improvement and support. In light of this report’s finding that alternative, charter, and virtual schools make up only about 10 percent of high schools, yet make up more than 50 percent of low-grad-uation-rate high schools nationwide, states should not be permitted to exclude alternative, charter, and virtual schools from the statewide accountability and improve-ment system required under ESSA.

Annual Update 2016 Building a Grad NationAnnual Update 2016 Building a Grad Nation 13Annual Update 2016 Building a Grad Nation
Progress and Challenge in Raising High School Graduation Rates Progress and Challenge
I n 2014, the nation once again reached a record high graduation rate – 82.3 percent – and moved closer to the GradNation campaign goal of graduating 90
percent of high school students by the Class of 2020. Graduation rates rose for all student subgroups, and the number of low-graduation-rate high schools and students enrolled in them dropped again, indicating that this progress has had far-reaching benefits for all students.
This progress, however, has not come without its chal-lenges. After three years of being on track to hitting the 90 percent goal, the nation narrowly missed the mark in 2014. It also became the first time since 2011 (when the federal Adjusted Cohort Graduation Rate was first reported by the majority of states), the national graduation rate failed to increase by more than a percentage point. More concerning are the persistent graduation rate gaps between White students and their Black and Latino peers, low-income and non-low-income students, and students with and without disabilities that clearly reflect the troubling disparities certain student subgroups face on the path to earning a high school diploma. It will not be enough to reach 90 percent on the backs of the most advantaged students. If the GradNation goal is to truly be reached, then we must ensure all students, particularly those facing the most adversity, have access to the educational oppor-tunities, resources, and supports they need to successfully stay on track to graduate.
Rising high school graduation rates have also come under intense scrutiny in recent years, as more people question whether or not the gains are real or if districts and states are getting creative about the way they count their graduates. There are also concerns regarding students being “pushed out” of their initial high school, forcing those who continue on to enroll in credit recovery and second-chance programs that may be less rigorous and less likely to prepare students for life beyond high school. And increasing graduation rates across the nation are not always translating into more students who are well prepared for postsecondary education and careers.
These concerns are real and must be addressed. When it comes to increasing high school graduation rates nation-wide, it is clear that important progress has been made and there is genuine cause to celebrate. At the same time, it is evident that in pockets across the country, there is a need to re-examine whether the decisions being made are ultimately in the best interests of students.
That is why, this year’s Building a Grad Nation annual update focuses on two key areas. First, we look at the national picture to see the states that are on and off track to reaching the 90 percent goal and what it will take to get all student subgroups to that goal. Second, we examine the greatest threats to achieving the 90 percent goal – paying particular attention to the schools and districts responsible for producing the greatest numbers of non-graduates – and ensuring that states and districts are raising graduation rates the right way. This report also attempts to address the concerns about graduation rates by analyzing trends in graduation requirements, exit exams, AP course-taking and exam passing rates, and student demographic changes as high school graduation rates continue to rise. By investigating these big ques-tions, this report aims to contribute to the conversation and body of research around high school graduation rates. It also raises issues of further concern to make sure states and districts are giving all students the chance to earn a high quality diploma that lays the groundwork for success in college, career, and life.
Progress and Challenge on the Road to 90

The National Picture Progress and Challenge in Raising High School Graduation Rates
Annual Update 2016 Building a Grad Nation14

Progress and Challenge in Raising High School Graduation Rates The National Picture
Annual Update 2016 Building a Grad NationAnnual Update 2016 Building a Grad Nation 15
The state-level data also show troubling trends for key student subgroups:
§ Sixteen states had low-income student graduation rates below 70 percent.
§ Sixteen states graduated less than 70 percent of Black students.
§ Eleven states had Hispanic/Latino graduation rates below 70 percent.
§ Thirty-three states graduated less than 70 percent of students with disabilities (SWD), and six of those states graduated less than 50 percent of these students.
§ In 35 states, English Language Learners (ELLs) gradu-ated at rates less than 70 percent, and seven of those states had ELL graduation rates under 50 percent.
There is also early evidence that graduation rates for homeless students, a new student subgroup to be measured by all states under the Every Student Succeeds Act, are often among the lowest of all student subgroups.
T he latest state-level 2013-14 Adjusted Cohort Graduation Rate (ACGR) data revealed that more than half of states were within range of a 90 percent graduation rate.
§ Iowa became the first state to surpass the 90 percent mark, achieving a graduation rate of 90.5 percent.
§ Twenty-nine of 50 states equaled or exceeded the national average (82.3 percent), and five of those states – Nebraska, New Jersey, New Hampshire, Texas, and Wisconsin – were within two percentage points of reaching the 90 percent goal.
§ Six states – California, Hawaii, Minnesota, Ohio, Rhode Island, and South Carolina – had rates between 80 and 82 percent, placing them just below the national average.
§ Fourteen states, with graduation rates between 70 and 79 percent, still have much further work to do, and one state – New Mexico – still remains more than 13 points behind the national average.
The National Picture
Figure 1. U.S. ACGR Ranges by State, 2013-14
WA
MT ND
SD
NE
KS
OHINIL
TN
WV
PA
NY
VA
NC
SC
GA
WI
MN
IA
MO
AR
LAMS AL
MI
OK
KY
OR
ID
CANV
UTCO
WY
AZNM
TX
HI
MEVT
NHMARI
CT
NJDEMD
DC
FL
AK
Map Key:
60-69%
70-79%
80-85%
86-90%
The National Picture Progress and Challenge in Raising High School Graduation Rates
Annual Update 2016 Building a Grad Nation16
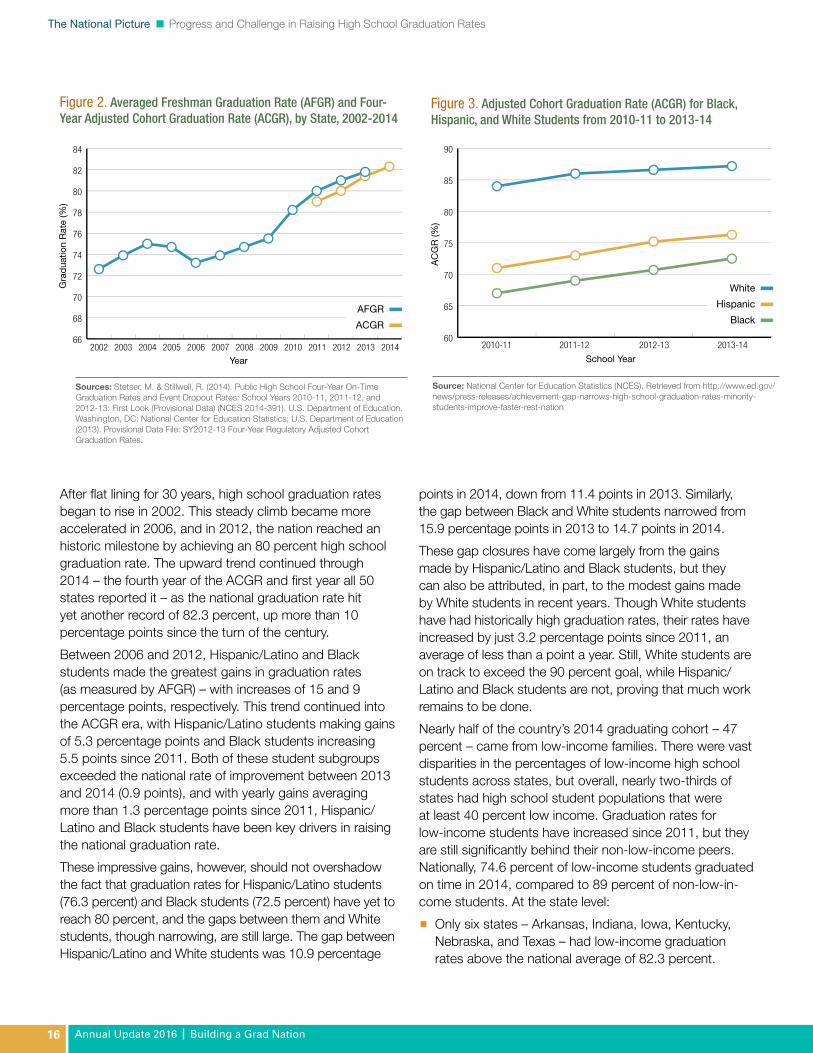
After flat lining for 30 years, high school graduation rates began to rise in 2002. This steady climb became more accelerated in 2006, and in 2012, the nation reached an historic milestone by achieving an 80 percent high school graduation rate. The upward trend continued through 2014 – the fourth year of the ACGR and first year all 50 states reported it – as the national graduation rate hit yet another record of 82.3 percent, up more than 10 percentage points since the turn of the century.
Between 2006 and 2012, Hispanic/Latino and Black students made the greatest gains in graduation rates (as measured by AFGR) – with increases of 15 and 9 percentage points, respectively. This trend continued into the ACGR era, with Hispanic/Latino students making gains of 5.3 percentage points and Black students increasing 5.5 points since 2011. Both of these student subgroups exceeded the national rate of improvement between 2013 and 2014 (0.9 points), and with yearly gains averaging more than 1.3 percentage points since 2011, Hispanic/Latino and Black students have been key drivers in raising the national graduation rate.
These impressive gains, however, should not overshadow the fact that graduation rates for Hispanic/Latino students (76.3 percent) and Black students (72.5 percent) have yet to reach 80 percent, and the gaps between them and White students, though narrowing, are still large. The gap between Hispanic/Latino and White students was 10.9 percentage
points in 2014, down from 11.4 points in 2013. Similarly, the gap between Black and White students narrowed from 15.9 percentage points in 2013 to 14.7 points in 2014.
These gap closures have come largely from the gains made by Hispanic/Latino and Black students, but they can also be attributed, in part, to the modest gains made by White students in recent years. Though White students have had historically high graduation rates, their rates have increased by just 3.2 percentage points since 2011, an average of less than a point a year. Still, White students are on track to exceed the 90 percent goal, while Hispanic/Latino and Black students are not, proving that much work remains to be done.
Nearly half of the country’s 2014 graduating cohort – 47 percent – came from low-income families. There were vast disparities in the percentages of low-income high school students across states, but overall, nearly two-thirds of states had high school student populations that were at least 40 percent low income. Graduation rates for low-income students have increased since 2011, but they are still significantly behind their non-low-income peers. Nationally, 74.6 percent of low-income students graduated on time in 2014, compared to 89 percent of non-low-in-come students. At the state level:
§ Only six states – Arkansas, Indiana, Iowa, Kentucky, Nebraska, and Texas – had low-income graduation rates above the national average of 82.3 percent.
66
68
70
72
74
76
78
80
82
84
2002 2003 2004 2005 2006 2007 2008 2009 2010 2011 2012 2013 2014
Figure 2. Averaged Freshman Graduation Rate (AFGR) and Four-Year Adjusted Cohort Graduation Rate (ACGR), by State, 2002-2014
Sources: Stetser, M. & Stillwell, R. (2014). Public High School Four-Year On-Time Graduation Rates and Event Dropout Rates: School Years 2010-11, 2011-12, and 2012-13: First Look (Provisional Data) (NCES 2014-391). U.S. Department of Education. Washington, DC: National Center for Education Statistics; U.S. Department of Education (2013). Provisional Data File: SY2012-13 Four-Year Regulatory Adjusted Cohort Graduation Rates.
AFGR
ACGR
Gra
dua
tion
Rat
e (%
)
Year
Figure 3. Adjusted Cohort Graduation Rate (ACGR) for Black, Hispanic, and White Students from 2010-11 to 2013-14
Source: National Center for Education Statistics (NCES). Retrieved from http://www.ed.gov/news/press-releases/achievement-gap-narrows-high-school-graduation-rates-minority-students-improve-faster-rest-nation
2010-11 2011-12 2012-13 2013-1460
65
70
75
80
85
90
White
Hispanic
Black
AC
GR
(%)
School Year

Progress and Challenge in Raising High School Graduation Rates The National Picture
Annual Update 2016 Building a Grad NationAnnual Update 2016 Building a Grad Nation 17
less than a point to 82.3 percent. For the U.S. to achieve the 90 percent goal, it will now need to average nearly 1.3 percentage points per year through 2020.
Using a four-year (2011 to 2014) metric to gauge average growth, 20 states have put themselves on pace to reach 90 percent by 2020. The majority of these states started within 10 to 12 points of the goal in 2011 and steadily climbed each year. All of the four-year on-pace states now have graduation rates greater than 83 percent and must maintain around a one-point-per-year pace to meet the goal.
Looking solely at graduation rate increases from 2013 to 2014, seven other states experienced one-year growth that exceeded the pace needed to get them to 90 percent. Five of these states – Illinois, Kentucky, South Carolina, Tennessee, and Vermont – reported 2014 graduation rates of 80 percent or higher; two other states, Mississippi and Oregon, have rates of 77.6 and 72 percent, respectively, and must achieve a much steeper growth rate to stay on pace.
It is no surprise that a number of the 21 states not on track to achieving 90 percent by 2020 started with graduation rates in the 60s and 70s in 2011 and have been unable to attain a rate of growth that would put them on pace to reaching the national goal. What is surprising, however, is that about a quarter of the off-pace states recorded graduation rates of 80 percent or higher in 2011. All of these states – Hawaii, North Dakota, Ohio, Pennsylvania, South Dakota, and Wyoming – started from a positive place, but none have been
§ Nearly one-third of states graduated less than 70 percent of their low-income students.
§ The graduation rate gap between low-income and non-low-income students ranges from a high of 25.6 percentage points in South Dakota to a low of 4.0 percentage points in Indiana. In nearly half of all states, the gap between low-income students and their more affluent peers was 15 percentage points or more, and in 18 other states, the gap was at least 10 points. Only eight states had a low-income/non-low-income gradua-tion rate gap less than 10 percentage points.1
Clearly, this is a segment of students that must be addressed if the country is to graduate 90 percent of all students.
Who’s On Track to the 90 Percent Goal?Starting in 2011, when ACGR was first reported by 47 states, it was calculated that the nation would need to raise the grad rate by approximately 1.2 percentage points every year to reach the 90 percent goal by the Class of 2020. This rate was exceeded in 2013, as the nation reported an 81.4 percent graduation rate, an increase of 1.4 points. In 2014, despite setting another record high graduation rate, the nation fell below this threshold, rising
1 For more information on the low-income/non-low-income graduation gap, as well as the graduation rate gap between special education and non-special-ed-ucation students, please see the 2016 Building a Grad Nation Data Brief (www.gradnation.org) and Appendix E, F, and G in this report.
WA
MT ND
SD
NE
KS
OHINIL
TN
WV
PA
NY
VA
NC
SC
GA
WI
MN
IA
MO
AR
LAMS AL
MI
OK
KY
OR
ID
CANV
UTCO
WY
AZNM
TX
HI
MEVT
NHMARI
CT
NJDEMD
DC
FL
AK
79% and below
90% and above
85%-89%
80%-84%
ACGR Range
Figure 4. 2013-14 ACGR for Low-Income Students

The National Picture Progress and Challenge in Raising High School Graduation Rates
Annual Update 2016 Building a Grad Nation18
Figure 5. 2014 State On-Pace/Off-Pace to 90 Percent ACGR by the Class of 2020
WA
MT ND
SD
NE
KS
OHINIL
TN
WV
PA
NY
VA
NC
SC
GA
WI
MN
IA
MO
AR
LAMS AL
MI
OK
KY
OR
ID
CANV
UTCO
WY
AZNM
TX
HI
MEVT
NHMARI
CT
NJDEMD
DC
FL
AK
Note: Kentucky and Oklahoma first reported ACGR in 2013, so only one-year (2012-13 to 2013-14) pace data is available for these states. Idaho first reported ACGR in 2014, so no pace data is available for this state.
Sources: Reproduced from the United States Department of Education (2015). Provisional Data Files: SY2010-11 and SY2013-14 Four-Year Regulatory Adjusted Cohort Graduation Rates.
Map Key:
Met 90 percent goal
Off-pace to 90
No pace data available
Met or Exceeded Pace Needed from 2011 to 2014
Met or Exceeded Pace Needed from 2013 to 2014
able to move forward in a meaningful way. In fact, all have seen graduation rate decreases within the four-year ACGR time period. This stagnation, and backsliding in some cases, shows that, for many states, having the 90 percent goal within view makes it no easier to reach.
The Path to 90 PercentLooking at graduation rates through a different lens – the number of students versus the percentage – helps provide a clear view of just how big, and in many cases, small, the challenge is to reach 90 percent. At the national level, raising the current graduation rate of 82.3 percent to 90 percent means graduating an additional 284,591 students.2 To put it another way, all of the additional students nationwide needed to graduate over the next six years to reach the goal would fit into about three Rose Bowl stadiums. When pictured this way, the goal appears that much more attainable.
But simply getting to 90 percent nationally is not enough. It is critical to advancing equal opportunity that all student subgroups, especially those who have traditionally been underserved, reach a 90 percent graduation rate. As seen
2 Calculation based on 2013-14 cohort counts; assumes constant cohort counts.
in Table 1, it is clear that, for many student subgroups, this will be a far greater challenge.
§ For the nation to achieve a 90 percent graduation rate among its low-income students (current ACGR of 74.6 percent), about 264,000, or roughly 93 percent, of the additional graduates will need to be from this subgroup.
§ For students with disabilities to achieve a 90 percent rate, about 117,000, or 41 percent, of the additional graduates in the Class of 2020 will need to be special education students.
§ Twenty-three percent, or about 65,000 additional grad-uates, would need to be English Language Learners.
§ For Black students to achieve a 90 percent graduation rate by 2020, about 102,000 students, or nearly 40 percent, need to be from this subgroup, and about the same percentage will need to be Hispanic/Latino.
Within each state, the numbers tell a similar story. The number of additional graduates needed to reach 90 percent varies widely.3 The state breakdown clearly shows
3 In 2014, Iowa was the only state to reach a 90 percent graduation rate and therefore, does not have additional graduates needed to reach 90 percent; how-ever, it does have additional graduates needed to reach 90 in various subgroups.

Progress and Challenge in Raising High School Graduation Rates The National Picture
Annual Update 2016 Building a Grad NationAnnual Update 2016 Building a Grad Nation 19
Figure 5. 2014 State On-Pace/Off-Pace to 90 Percent ACGR by the Class of 2020
WA
MT ND
SD
NE
KS
OHINIL
TN
WV
PA
NY
VA
NC
SC
GA
WI
MN
IA
MO
AR
LAMS AL
MI
OK
KY
OR
ID
CANV
UTCO
WY
AZNM
TX
HI
MEVT
NHMARI
CT
NJDEMD
DC
FL
AK
Figure 6. Estimated Number of Additional Graduates Needed to Reach a 90 Percent Adjusted Cohort Graduation Rate (ACGR) by State, 2013-14
Sources: U.S. Department of Education (2015). Provisional data file: SY2013-14 State Level Four-Year Regulatory Adjusted Cohort Graduation Rates (ACGR).
National Total: 284,591
Map Key:
0-5,000
5,000-10,000
10,000-20,000
20,000 or more
N/A
that, in most places, reaching the goal means engaging a relatively small number of students and makes the path forward appear that much more attainable. However, the challenge most states need to contend with is ensuring not only that their overall graduation rate is raised to 90
percent, but that various student subgroups are also hitting that mark. This is especially true for students with disabilities and Black, Hispanic/Latino, and low-income students in nearly every state with significant populations of these student subgroups.
Table 1. Estimated Number of Additional Graduates Needed to Reach a 90 Percent National Adjusted Cohort Graduation Rate (ACGR), 2013-14
2013-14 284,591 8,278 2,360 102,384 110,391 64,123 5,711 117,706 264,607 65,267
Coho
rt Ye
ar
All S
tude
nts (
N)
Amer
ican
Indi
an/A
lask
a Na
tive
(N)
Asia
n/Pa
cific
Islan
der (
N)Bl
ack
(N)
Hisp
anic
(N)
Stud
ents
with
Disa
bilit
ies (
N)
Whi
te (N
)
Low
-Inco
me
(N)
Two
or M
ore
Iden
titie
s (N)
Limite
d En
glish
Pro
ficie
ncy (
N)
Note. The number of additional graduates needed to reach 90 percent graduation rate(s) for all students and each subgroup was calculated using the aggregated 2013-14 state level ACGR file (i.e., for the state level cohort sizes) and the 2013-14 graduation rates. The Asian/Pacific Islander column represents either the value reported by the state to the Department of Education for the major racial and ethnic group “Asian/Pacific Islander” or an aggregation of values reported by the state for
the major racial and ethnic groups “Asian,” “Native Hawaiian/Other Pacific Islander or Pacific Islander,” and “Filipino.” (California is the only state currently using the major racial and ethnic group “Filipino.”)Sources: U.S. Department of Education (2015). Provisional data file: SY2013-14 State Level Four-Year Regulatory Adjusted Cohort Graduation Rates (ACGR).

The National Picture Progress and Challenge in Raising High School Graduation Rates
Annual Update 2016 Building a Grad Nation20
Alabama 12 † 1,189 96 697 22 1,204 2,377 89
Alaska 789 † 80 129 586 137 538 1,176 443
Arizona 1,114 † 866 6,369 2,653 † 1,996 6,260 651
Arkansas 9 42 667 175 157 12 211 1,249 93
California 705 - 7,630 32,225 2,683 828 15,506 46,162 23,402
Colorado 156 231 657 4,236 2,419 193 2,106 7,098 2,083
Connecticut 7 - 654 1,235 - 42 1,399 2,319 428
Delaware 0 - 208 66 25 0 277 403 40
Florida 118 82 11,257 7,979 7,250 † 8,175 21,133 5,036
Georgia 61 † 11,733 3,320 5,691 416 7,372 15,257 1,920
Hawaii 9 † 38 98 187 † 422 738 244
Idaho 104 93 45 704 1,923 80 603 2,385 262
Illinois 34 - 3,450 2,810 - 151 3,775 7,701 1,087
Indiana 12 8 1,331 390 - 116 1,469 1,272 179
Iowa 18 - 173 216 - 33 613 773 77
Kansas 63 4 350 593 419 84 595 2,280 370
Kentucky 5 14 564 84 519 40 702 1,488 122
Louisiana 42 16 5,075 298 2,355 64 2,406 5,789 198
Maine 9 - 45 40 393 25 479 868 55
Maryland 7 - 2,200 885 - - 1,608 2,679 438
Massachusetts 23 - 1,015 2,257 - 90 2,967 4,362 1,365
Michigan 255 75 5,821 1,407 6,250 368 4,993 13,049 833
Minnesota 584 † 1,932 1,087 1,831 † 2,768 5,592 1,115
Mississippi 13 2 3,121 72 917 18 1,880 3,454 53
Missouri 21 - 1,739 273 - 31 1,144 2,629 204
Montana 298 10 2 35 153 † 173 709 121
Nebraska 58 133 123 235 - 18 448 604 221
Nevada 145 319 1,283 3,237 1,727 254 2,112 4,759 1,539
New Hampshire 3 2 18 72 192 † 501 585 59
New Jersey 6 - 1,974 2,032 - - 2,260 3,250 724
Amer
ican
Indi
an/
Alas
ka N
ative
(N)
Hisp
anic
(N)
Low-In
com
e (N
)
Asian
/Pac
ific
Islan
der (
N)
Blac
k (N
)
Stud
ents
with
Disa
bilit
ies (N
)
Whi
te (N
)
Limite
d En
glish
Profi
cienc
y (N)
Two
or M
ore
Id
entit
ies (N
)
Table 2. Estimated Number of Additional Graduates Needed to Reach a 90 Percent Adjusted Cohort Graduation Rate (ACGR) for each Subgroup, by State, 2013-14
STATE

Progress and Challenge in Raising High School Graduation Rates The National Picture
Annual Update 2016 Building a Grad NationAnnual Update 2016 Building a Grad Nation 21
Low-In
com
e (N
)
Limite
d En
glish
Profi
cienc
y (N)
New Mexico 809 † 181 3,398 1,043 † 1,078 3,994 1,861
New York 268 † 10,533 12,166 2,180 153 11,761 20,790 6,494
North Carolina 173 † 3,025 1,513 1,725 279 2,652 5,739 997
North Dakota 153 14 32 27 - † 172 356 44
Ohio 34 † 6,032 992 3,551 697 4,470 11,442 541
Oklahoma 531 23 608 644 1,253 132 778 2,347 338
Oregon 309 214 341 2,142 4,826 452 2,453 6,472 1,036
Pennsylvania 17 † 3,688 2,146 406 227 3,871 7,140 767
Rhode Island 18 13 178 433 369 41 748 1,188 201
South Carolina 48 † 2,656 347 2,090 † 2,576 4,385 293
South Dakota 441 34 35 54 113 19 265 738 73
Tennessee 18 - 2,029 323 - † 1,736 3,225 267
Texas 41 - 2,535 7,187 - - 3,734 8,042 4,696
Utah 148 110 122 1,132 1,106 33 847 1,832 533
Vermont 4 2 17 10 85 24 196 334 19
Virginia † - 2,575 1,406 419 † 4,071 4,538 1,666
Washington 386 913 825 3,044 4,439 602 3,119 9,100 1,570
West Virginia 7 - 108 2 973 13 640 1,263 1
Wisconsin 103 † 1,609 627 - † 1,572 2,609 382
Wyoming 89 7 19 141 518 18 265 671 40
Totals 8,278 2,360 102,384 110,391 64,123 5,711 117,706 264,607 65,267
Note. † = Not applicable: Data are not expected to be reported by the SEA for SY2013-14. The number of additional graduates needed to reach 90 percent graduation rate(s) for all students and each subgroup was calculated using the aggregated 2013-14 state level ACGR file (i.e., for the state level cohort sizes) and the 2013-14 graduation rates. Because these groups are overlapping and a student can be in more than one subgroup, estimates for each group sum to greater than the state and national totals and percentages sum to greater than 100 percent. The Asian/Pacific Islander column represents either the value reported by the state to the Department of Education for the major racial and ethnic group “Asian/Pacific Islander” or an aggregation of values reported by the state for the major racial and ethnic groups “Asian,” “Native Hawaiian/Other Pacific Islander or Pacific Islander,” and “Filipino.” (California is the only state currently using the major racial and ethnic group “Filipino.”)Sources: U.S. Department of Education (2015). Provisional data file: SY2013-14 State Level Four-Year Regulatory Adjusted Cohort Graduation Rates (ACGR).
Amer
ican
Indi
an/
Alas
ka N
ative
(N)
Hisp
anic
(N)
Low-In
com
e (N
)
Asian
/Pac
ific
Islan
der (
N)
Blac
k (N
)
Stud
ents
with
Disa
bilit
ies (N
)
Whi
te (N
)
Limite
d En
glish
Profi
cienc
y (N)
Two
or M
ore
Id
entit
ies (N
)
Table 2. Estimated Number of Additional Graduates Needed to Reach a 90 Percent Adjusted Cohort Graduation Rate (ACGR) for each Subgroup, by State, 2013-14continued
STATE

Annual Update 2016 Building a Grad Nation
The National Picture Progress and Challenge in Raising High School Graduation Rates
Annual Update 2016 Building a Grad Nation22

Progress and Challenge in Raising High School Graduation Rates Roadblocks on the Path to 90 Percent
Annual Update 2016 Building a Grad NationAnnual Update 2016 Building a Grad Nation 23Annual Update 2016 Building a Grad Nation
R eaching the 90 percent goal will depend greatly on addressing several significant issues of concern. First among these is identifying the high schools with
persistently low graduation rates, examining what types of schools fall into this category, and exploring the state poli-cies that may be contributing to the continued existence of many of these low-performing schools. As states and school systems continue to diversify through the growth of alternative, charter, and virtual schools – many of which operate as credit recovery or dropout prevention programs – it is necessary to take a closer look at when and where these schools are part of the solution or a wrong turn on the path to 90 percent graduation rates for all students.
Second, there is a need to look more closely at the policies and practices that threaten to undermine the collection and reporting of high school graduation rates, push students off track to graduation, and lower the standards and quality of a high school diploma. It is clear that most educators and administrators are doing what is right to raise graduation rates and help students stay on track, but it is also important to acknowledge that there is evidence that this is not always the case. It is also evident that a lack of clarity in federal graduation rate definitions provides the space for states and districts to get creative about their graduation rate calculations and reporting.
In this section, we explore these issues, not to point fingers or cast blame, but to reveal the challenges ahead in raising graduation rates and reinforce the need to tighten up the policies and practices that are not in the best interests of our nation’s young people.
Identifying America’s Low-Performing High SchoolsHistorically, the Building a Grad Nation report has used the promoting power metric (comparing the number of seniors enrolled in a high school to the number of freshmen four years earlier) to determine the schools that produce large numbers of dropouts. With ACGR now being reported by all 50 states, we switch to using this common graduation rate metric to identify the schools where one-third or more of students (i.e., 67 percent or less) are not graduating on time. This also parallels language in the Every Student Succeeds Act (ESSA), the newly reauthorized version of the Elementary and Secondary Education Act, which
requires states to take action to improve high schools graduating 67 percent or less of students.1
To keep in line with ESSA, we are also moving from looking solely at the large high schools (300 or more students) producing significant numbers of non-graduates to further examining the high schools enrolling 100 or more students that reported an ACGR of 67 percent or less (i.e., “ESSA high schools”). This is an expansion from our analysis in previous Building a Grad Nation reports and allows us to capture what is happening in both the large high schools, as well as many small rural schools and the alternative, charter, and virtual high schools that have emerged in recent years to serve students who have fallen off track.
In our examination of various school types (e.g., alternative, charter, virtual), we also use the number of non-graduates (students who do not graduate in four years, whether due to dropping out, requiring additional time, or being enrolled in an extended-year program) to further identify the types of schools not graduating students on time.
Who is enrolled in America’s large, low-graduation-rate high schools?There are now approximately 1,000 large high schools4 nationwide with graduation rates of 67 percent or less, and a little more than 900,000 students attending them. This is a sharp reduction from the more than 2,000 schools and 2.6 million students enrolled in them in 2002. This significant decline is all the more important because these schools have educated so many low-income, Black, and Hispanic/Latino students with some of the historically lowest graduation rates in the nation.
Unfortunately, these students are still represented in high schools with graduation rates of 67 percent or less. Of the roughly 924,000 students in large low-graduation-rate high schools in 2014, 65 percent were low income and 63 percent were Black or Hispanic/Latino (the latest data available show that Black students were 16 percent and Hispanic students were 24 percent of the population enrolled in public schools in 20132). In several states, Black and Hispanic/Latino students comprised significant populations at large, low-graduation-rate high schools:
4 “Large” high schools are defined here as enrolling 300 or more students.
Roadblocks on the Path to 90 Percent

Roadblocks on the Path to 90 Percent Progress and Challenge in Raising High School Graduation Rates
Annual Update 2016 Building a Grad Nation24
§ In 15 states, Black students made up more than 40 percent of enrollment in schools with a graduation rate of 67 percent or less. Four of these states – Maryland, Mississippi, Tennessee, and Virginia – had Black student populations of greater than 75 percent in these high schools.
§ In nine states – California, Colorado, Connecticut, Iowa, Massachusetts, Nevada, New Jersey, New York, and Rhode Island – Hispanic/Latino students made up more than 40 percent of student enrollment in large high schools with a 67 percent or less graduation rate.
§ The data on low-income students in large, low-grad-uation-rate high schools is even more concerning. In 41 states, low-income students made up more than 40 percent of enrollment in these schools, and in 12 of those states, enrollment of low-income students was greater than 75 percent.
The large concentrations of Black, Hispanic/Latino, and low-income students in low-graduation-rate high schools reflects long-standing trends and speaks, in part, to persistent levels of segregation, both racial and economic, in schools across the country. Research has shown the benefits of socioeconomic and racial integration for all students3, but with large populations of students of color and low-income students clustered into the nation’s low-graduation-rate schools, it is clear that these benefits are not reaching many of the students who need them the most.
Where are the high- and low-graduation-rate schools?While there are just 1,000 large, low-graduation rate high schools nationwide (which represent 7.5 percent of all large high schools), when expanded out to high schools with a student enrollment of 100 or more students, that number more than doubles to 2,397 (13 percent of all such schools). Of these schools, more than 50 percent are located in cities, while roughly one-quarter can be found in suburban areas.5 Given that only a quarter of all high schools enrolling 100 or more students were found in cities, this shows a troublesome concentration of low-graduation-rate high schools in urban centers.
On the other hand, there are more than 11,000 (60.7 percent) high schools across the country that graduated 85 percent or more of students in 2014. This means that for every low-graduation-rate high school in the nation there are more than four high-graduation-rate high schools. Of these high-graduation-rate high schools, nearly 40 percent were small high schools in rural areas, and close to 30 percent were found in suburban areas. Just 17 percent of these high-performing high schools were located in cities.
5 NCES now uses “urban-centric locale codes” to classify school district locales. The new locale codes are “based on an address’s proximity to an urbanized area” and classify territories into four major types: city, suburban, town, and rural. Cities and suburbs also have subcategories based on their size – large, midsize, and small – and towns and rural areas have subcategories based on their distance from an urbanized area – fringe, distant, and remote. For more information on NCES’ urban-centric locale codes, please see https://nces.ed.gov/ccd/rural_locales.asp
Figure 7. Students in Large High Schools (i.e., with 300 or more students) with ACGR of 67 Percent or Less
0
10
20
30
40
50
60
70
Am. In
dian/
Alas
ka N
ative
Asian
Hisp
anic
Blac
k
Whit
e
Pacif
ic Isl
ande
rTw
o or M
ore E
thnic
ities
Low-
Incom
e
1.41%3.48%
26.63%
36.03%
29.88%
.30%2.27%
65.36%
Per
cent
(%)
Student Group
54%
12%
26%
8%
Cities
Rural
Suburbs
Towns
Figure 8. Percent of High Schools with a Graduation Rate of 67 Percent or Below by Locale Type (2013-14)
Note. The high schools in the above table have a total enrollment of 100 students or more where their high school graduation rate is 67 percent or below.Sources: U.S. Department of Education, National Center for Education Statistics. (1998-2015). Public Elementary/Secondary School Universe Surveys. U.S. Department of Education through provisional data file of SY2013-14 School Level Four-Year Regulatory Adjusted Cohort Graduation Rates.

Progress and Challenge in Raising High School Graduation Rates Roadblocks on the Path to 90 Percent
Annual Update 2016 Building a Grad NationAnnual Update 2016 Building a Grad Nation 25
Note. The high schools in the above table have a total enrollment of 100 students or more where their high school graduation rate is 85 percent or above.Sources: U.S. Department of Education, National Center for Education Statistics. (1998-2015). Public Elementary/Secondary School Universe Surveys. U.S. Department of Education through provisional data file of SY2013-14 School Level Four-Year Regulatory Adjusted Cohort Graduation Rates.
17%
39%29%
16%Cities
Rural
Suburbs
Towns
Figure 9. Percent of High Schools with a Graduation Rate of 85 Percent or Above by Locale Type (2013-14)
Perc
enta
ge o
f
Low-G
rad-
Rate
High
Sch
ools
Table 3. States with the Highest Percentage of Low-Graduation-Rate High Schools, 2014
High
Sch
ools
67%
and
Below
Tota
l Hig
h Sc
hools
Alaska 53 122 43%
New Mexico* 62 154 40%
Florida 203 687 30%
Arizona 110 375 29%
Georgia 121 432 28%
Nevada 32 117 27%
Colorado 94 357 26%
Oregon 63 257 25%
New York 276 1,165 24%
Delaware 10 44 23%
Washington 98 430 23%
Idaho 35 172 20%
Note. The above calculations are based on counts of high schools enrolling 100 or more students.*New Mexico did not federally report school-level data in 2013-14, so 2012-13 data was used.Sources: U.S. Department of Education, National Center for Education Statistics. (1998-2015). Public Elementary/Secondary School Universe Surveys. U.S. Department of Education through provisional data file of SY2013-14 School Level Four-Year Regulatory Adjusted Cohort Graduation Rates.
Pinpointing the ESSA low-graduation-rate high schoolsThe number of high schools enrolling 100 students or more and graduating 67 percent or less of students in each state varies greatly, from one each in Maine and West Virginia to 203 in Florida and 276 in New York. Other large states, like California and Ohio, have significant numbers of high schools at or below 67 percent, while smaller states obviously tend to have much fewer.
The number of low-graduation-rate high schools in each state is largely correlated with the student enrollment and number of high schools in the state; however, this is not always the case, which makes examining the percentage of high schools at or below 67 percent in each state helpful. As Table 3 shows, three states, Alaska, New Mexico, and Nevada, fall on the low end of the spectrum in terms of the number of high schools in the state and high schools at 67 percent or below, but the percentage of these schools within each state is among the highest of all states.
Overall, the percentage of low-graduation-rate high schools in states breaks down as follows:
§ In two states – Alaska and New Mexico – more than 40 percent of high schools graduate 67 percent or less of students.
§ Between 20 and 40 percent of high schools in 10 states – Florida, Arizona, Georgia, Nevada, Colorado, Oregon, New York, Delaware, Washington, and Idaho – fail to graduate one-third or more of students.
With the exception of Delaware, it is notable that all of the states in which 20 percent or more of high schools are low-graduation-rate high schools, have high school graduation rates well below the national average ranging from 68 to 78 percent. Clearly these states, will need to significantly improve their low-graduation-rate high schools in order to get on pace to 90 percent by 2020.
Nationally, there were about 526,000 non-graduates coming from ESSA high schools in 2014. The number of students not graduating on time with their cohort ranged from 760 in Vermont to slightly less than 47,000 in California. Nationwide, 33 percent of all non-graduates in 2014 were enrolled in high schools with a graduation rate of 67 percent or less. The number of non-graduates in each state coming from these high schools also varies greatly. In Alaska and Ohio, for example, 56 and 57 percent of non-graduates, respectively, came from each state’s low-graduation-rate high schools, while in Hawaii, Maine, North Carolina, Virginia, and West Virginia, five percent or less of non-graduates came from these schools. In most states, the greater the number of low-graduation-rate high schools, the higher the percentage of non-graduates there are coming from these
STATE

Roadblocks on the Path to 90 Percent Progress and Challenge in Raising High School Graduation Rates
Annual Update 2016 Building a Grad Nation26
type – district-run alternative, charter alternative, virtual alternative, regular charter, and regular virtual – to under-stand how these schools are doing as well. Examining low-graduation-rate high schools in this manner allows for a clearer picture of where the high schools failing to graduate one-third or more of students are, and thereby enables analysis of what policies and practices may be contributing to their low graduation rates.
Regular District High SchoolsRegular high schools, according to the NCES definition, include any high school that does not fall into the alternative, special education, or vocational categories. These high schools make up the greatest number of high schools, with more than 16,000 regular high schools classified as district, charter, and virtual high schools nationwide. Of the nation’s regular high schools, the overwhelming majority, 15,132, were district non-charter schools, while roughly 1,500 were charter schools and fewer than 200 were virtual schools. In this section, we only address “district” high schools, or those that are operated by a public school district and are neither a charter nor a virtual high school.
schools; however, some states, like California and Texas, fall on the high end of states in terms of the number of 67 percent or less high schools, but land in the middle in the percentage of non-graduates attending these schools (in part because many of the schools with graduation rates below 67 percent are smaller, alternative schools).
What types of schools are the high schools at or below 67 percent?To better understand the schools that are graduating 67 percent or less of students, we have broken down these schools into four categories: regular, alternative, charter, and virtual schools. There is overlap across these categories because charter and virtual schools can be considered either regular or alternative based on their school mission and the types of students they serve. We removed all charter and virtual schools from our regular school calculations in order to see how more traditional public high schools are faring compared to the subsets of more specialized schools. For alternative, charter, and virtual schools, we examine their totals overall, regardless of overlap, and we also break them down further by
Sources: U.S. Department of Education, National Center for Education Statistics. (1998-2015). Public Elementary/Secondary School Universe Surveys. U.S. Department of Education through provisional data file of SY2013-14 School Level Four-Year Regulatory Adjusted Cohort Graduation Rates.
WA
MT ND
SD
NE
KS
OHINIL
TN
WV
PA
NY
VA
NC
SC
GA
WI
MN
IA
MO
AR
LAMS AL
MI
OK
KY
OR
ID
CANV
UTCO
WY
AZNM
TX
HI
MEVT
NHMARI
CT
NJDEMD
DC
FL
AK
Figure 10. Percentage of High Schools (enrolling 100 or more students) with ACGR 67 Percent or Less, 2013-14
Map Key:
0-9.9%
10-19.9%
20-29.9%
30-39.9%
40% or more

Progress and Challenge in Raising High School Graduation Rates Roadblocks on the Path to 90 Percent
Annual Update 2016 Building a Grad NationAnnual Update 2016 Building a Grad Nation 27
WA
MT ND
SD
NE
KS
OHINIL
TN
WV
PA
NY
VA
NC
SC
GA
WI
MN
IA
MO
AR
LAMS AL
MI
OK
KY
OR
ID
CANV
UTCO
WY
AZNM
TX
HI
MEVT
NHMARI
CT
NJDEMD
DC
FL
AK
often serve as either temporary or permanent facilities to educate students who for many reasons – disciplinary problems, pregnancy, chronic absenteeism, needing to work to support themselves and families, and others – are either sent or choose to continue their schooling outside of traditional high schools. Some alternative high schools, moreover, offer flexible scheduling, performance-based courses, more personalized instruction, or health services which may not be offered in a student’s regular high school, and hence, may enable them to remain in school and on track to graduate.
Though these schools, in some cases, may be the last best hope for students who have struggled to stay on track, there is concern that some students are inappro-priately pushed into alternative high schools. Because these schools can be less rigorous or offer fewer college and career preparatory courses than their traditional counterparts, we need to question if these schools, while helping students stay in school, are truly preparing them for life beyond high school or whether they are putting already vulnerable young people onto a path to a more limited future. The question is especially salient as alter-native high schools enroll a disproportionate percentage of low-income and minority students. In 2014, 56 percent of students attending alternative high schools were from low-income backgrounds, as compared to 48 percent of students at regular schools. Sixty percent of students at alternative high schools were of minority backgrounds, as compared to 40 percent of students at regular schools.
Alternative high schools comprised about six percent of all high schools enrolling 100 students or more in 2014, but 28 percent of high schools reporting a graduation rate of 67 percent or less. Of the roughly 2,400 high schools graduating 67 percent or less of students, 28 percent were considered alternative schools.
In 10 states, 50 percent or more of low-graduation-rate high schools were alternative schools in 2014 (see Table 4). In Kentucky, 100 percent of schools reporting a graduation rate of 67 percent or less were alternative schools, and in Texas, nearly 90 percent of high schools graduating two-thirds or fewer of students were alternative schools. Altogether, there were 21 states in which alterna-tive schools made up more than 20 percent of low-grad-uation-rate high schools, meaning that in nearly half of states, at least one out of every five low-graduation-rate high school was an alternative school.
When examining it in terms of 2014 non-graduates, 10 percent of non-graduates nationwide came from alterna-tive high schools. But in a sub-set of states, alternative
Regular district high schools made up about 84 percent of high schools enrolling 100 students or more in 2014 nationwide, but about 41 percent of low-graduation-rate high schools. In all, about seven percent of regular district high schools had graduation rates of 67 percent or less. This puts a laser-like focus on the roughly 1,000 regular district high schools that have low-graduation rates. And in states, where the percentage of these schools ranges from zero to 33 percent, it provides a clear road map of where state resources should be focused for improvement.
Alternative High SchoolsAlternative high schools have been in existence for decades, but the number of these schools, established to meet the needs of “at-risk” students, has grown substan-tially since the early 2000s. Between 2001 and 2014, the number of alternative high schools nationwide increased by roughly a third, rising from 2,135 to 2,783. The over-whelming majority of alternative schools are operated by the school district within which they are located, though a small percentage, 10 and 2 percent, respectively, were charter or virtual schools. Alternative high schools
Table 4. States with the Highest Percentage of Low-Graduation-Rate High Schools that were Alternative Schools, 2013-14
Kentucky 87.5% 100%
Texas 88.3% 88%
Washington 78.2% 72%
Idaho 77.3% 71%
Iowa 90.5% 64%
Virginia 85.3% 60%
Michigan 78.6% 58%
North Carolina 83.9% 55%
Utah 83.9% 54%
Colorado 77.3% 50%
Florida 76.1% 49%
Minnesota 81.2% 46%
Note. The high schools in the above table have a total enrollment of 100 students or more. These alternative school calculations include all alternative schools, including charter and virtual schools that fall into NCES’ alternative typology.Sources: U.S. Department of Education, National Center for Education Statistics. (1998-2015). Public Elementary/Secondary School Universe Surveys. U.S. Department of Education through provisional data file of SY2013-14 School Level Four-Year Regulatory Adjusted Cohort Graduation Rates.
Stat
e Le
vel A
CGR
for
All S
tude
nts,
2013
-14
% o
f Hig
h Sc
hools
with
ACGR
of 6
7 Pe
rcen
t or
Less
that
wer
e Alte
rnat
ive
High
Sch
ools
STATE

Roadblocks on the Path to 90 Percent Progress and Challenge in Raising High School Graduation Rates
Annual Update 2016 Building a Grad Nation28
Charter SchoolsSince the early 2000s, charter schools - privately-man-aged public schools - have become a significant part of the national education landscape and now exist in all but seven states.6 Laws on who can authorize charter schools vary by state, but these schools are usually overseen by local school districts, state boards of education, or other state-approved entities. It is estimated that about 40 percent of all charter schools are operated by large for-profit or non-profit charter management organizations, some of which manage networks of schools in several states. The other 60 percent of charter schools are locally run by individuals or small groups within the community.4 Most charter schools serve elementary or middle school students, but the number of charter high schools has been rapidly rising in recent years, more than tripling from 409 in 2001 to 1,495 in 2014. Around eight percent of high schools reporting ACGR in 2014 were charter schools.
Of the high schools graduating 67 percent or less of students, 26 percent were charter schools in 2014. In
6 The only states that do not currently have charter schools are Kentucky, Montana, Nebraska, North Dakota, South Dakota, Vermont, and West Virginia. Alabama adopted charter school laws in 2015, and thus, did not have operating charter schools at the time of graduation rate reporting in 2014.
high schools are the source of significant numbers of non-graduates. Eleven states had 15 percent or more of non-graduating students come from alternative schools (see Table 5). In Idaho, Alaska, and Colorado, at least one out of every three non-graduates in the state attended an alternative high school. In Florida, Michigan, Washington and Utah more than one in four non-graduates come from alternative schools.
Each of the six states with the greatest percentage of non-graduates coming from alternative schools have grad-uation rates in the 70s, well below the national average. On one hand, it can be argued that alternative schools, which are specifically designed to educate only students who have struggled in traditional schools and face a wide range of life challenges, are much less likely to graduate 90 percent or more of their students. On the other hand, it is just as possible that arguments for lower outcomes due to serving more challenging students becomes self-per-petuating and leads to lower four-year graduation rates for traditionally underserved students. In states where large numbers of students are ending their high school years in alternative schools with graduation rates below 67 percent, it is difficult to see how those states can achieve 90 percent graduation rates for all students.
% o
f Hig
h Sc
hools
67%
or L
ess A
CGR
that
wer
e Ch
arte
r
Scho
ols
Table 6. States with the Highest Percentage of Low-Graduation-Rate High Schools that were Charter Schools, 2013-14
Hawaii 100%
Arizona 73%
Indiana 60%
Ohio 59%
California 51%
Pennsylvania 46%
Texas 44%
Wisconsin 41%
New Hampshire 33%
Oregon 33%
South Carolina 33%
Utah 31%
Delaware 30%
Minnesota 30%
Note. The high schools in the above table have a total enrollment of 100 students or more. These calculations include all charter schools, both brick-and-mortar and virtual schools.Sources: U.S. Department of Education, National Center for Education Statistics. (1998-2015). Public Elementary/Secondary School Universe Surveys. U.S. Department of Education through provisional data file of SY2013-14 School Level Four-Year Regulatory Adjusted Cohort Graduation Rates.
STATE
Stat
e Le
vel A
CGR
for
All S
tude
nts,
2013
-14
Perc
enta
ge o
f Non
-Gra
duat
es
Com
ing
from
Alte
rnat
ive
High
Sch
ools
Alaska 71.1% 38%
Idaho 77.3% 35%
Colorado 77.3% 30%
Florida 76.1% 29%
Michigan 78.6% 29%
Washington 78.2% 27%
Utah 83.9% 26%
Texas 88.3% 20%
Minnesota 81.2% 19%
Kentucky 87.5% 18%
Iowa 90.5% 15%
Note. The high schools in the above table have a total enrollment of 100 students or more. These alternative school calculations include all alternative schools, including charter and virtual schools that fall into NCES’ alternative typology.Sources: U.S. Department of Education, National Center for Education Statistics. (1998-2015). Public Elementary/Secondary School Universe Surveys. U.S. Department of Education through provisional data file of SY2013-14 School Level Four-Year Regulatory Adjusted Cohort Graduation Rates.
Table 5. States with the Highest Percentage of Non-Graduates Coming from Alternative High Schools, 2013-14
STATE

Progress and Challenge in Raising High School Graduation Rates Roadblocks on the Path to 90 Percent
Annual Update 2016 Building a Grad NationAnnual Update 2016 Building a Grad Nation 29
Virtual SchoolsVirtual schools – schools where instruction is carried out completely online – have also greatly increased in recent years, and the number of students enrolled in full-time, online schools has grown exponentially since the early 2000s.5 Full-time virtual schools currently exist in 30 states and the District of Columbia, but public schools and districts in every state offer some type of online course-work. Many virtual schools are similar to charter schools – managed by non-profit or for-profit “chains,” operating in multiple states, and funded by state tax dollars. Florida, one of the earliest adopters of virtual education, however, has taken the state-run approach in its Florida Virtual School, which enrolls students statewide in both individual courses and a full-time program. Like other states, it also allows school districts or charter operators to offer local part- or full-time digital programs.
Despite their presence in more than half of states, 2013-14 was the first year virtual school status was included in National Center for Education Statistics (NCES) high school graduation rate data, and not all states reported their online schools as virtual schools, making it difficult to track these schools with 100 percent precision. In an attempt to include as many virtual schools as possible in our analysis, we count both those schools
In terms of non-graduates, 12 percent nationwide came from charter schools in 2014. This national average, however is the result of wide disparities across states. In some states, large numbers of non-grads come from charter high schools and in others, few, if any. In Ohio, four out of every 10 non-graduates came from a charter school, and nearly that number came from charter high schools in Arizona. Ten states, in all, exceeded the 12 percent national average of non-graduates coming from charter high schools (see Appendix M for all state data).
% o
f Hig
h Sc
hools
with 6
7 pe
rcen
t
or le
ss A
CGR
that
were V
irtua
l Sch
ools
Table 8. States with the Highest Percentage of Low-Graduation-Rate High Schools that were Virtual Schools, 2013-14
Kansas 44%
New Hampshire 33%
Idaho 29%
South Carolina 28%
Pennsylvania 22%
Colorado 19%
Utah 19%
Iowa 18%
Indiana 17%
South Dakota 17%
Ohio 15%
Note. The high schools in the above table have a total enrollment of 100 students or more. These calculations include all virtual schools, including both district-operated and charter schools.Sources: U.S. Department of Education, National Center for Education Statistics. (1998-2015). Public Elementary/Secondary School Universe Surveys. U.S. Department of Education through provisional data file of SY2013-14 School Level Four-Year Regulatory Adjusted Cohort Graduation Rates.
STATE
Perc
enta
ge o
f
Non-
Grad
uate
s
Com
ing
from
Ch
arte
r Sch
ools
Perc
enta
ge o
f all
High
Sch
ool S
tude
nts
in C
harte
r Sch
ools
Table 7. States with the Highest Percentages of Non-Graduates Coming from Charter Schools, 2013-14
Ohio 43% 8%
Arizona 37% 14%
Idaho 25% 7%
California 24% 9%
Pennsylvania 21% 9%
Florida 20% 6%
Indiana 19% 4%
Colorado 18% 8%
Minnesota 16% 5%
Oregon 14% 6%
Note. The high schools in the above table have a total enrollment of 100 students or more. These calculations include all charter schools, both brick-and-mortar and virtual schools.Sources: U.S. Department of Education, National Center for Education Statistics. (1998-2015). Public Elementary/Secondary School Universe Surveys. U.S. Department of Education through provisional data file of SY2013-14 School Level Four-Year Regulatory Adjusted Cohort Graduation Rates.
STATE
several states that number was much higher (Table 6). Hawaii, for example, has only four low-graduation-rate high schools enrolling 100 or more students, but all of them are charter schools, and two of the four serve more than 500 students. In Arizona, 80 of the state’s 110 high schools graduating 67 percent or less of students were charter schools, meaning roughly three out of every four students attending a low-graduation-rate school in that state were enrolled in a charter school. In three other states – Indiana, Ohio, and California – more than half of low-graduation-rate high schools were charter schools, and in nine other states, charter schools made up 30 percent or more of failing high schools (see Appendix L for all state data).

Roadblocks on the Path to 90 Percent Progress and Challenge in Raising High School Graduation Rates
Annual Update 2016 Building a Grad Nation30
The Big Picture on Alternative, Charter, and Virtual SchoolsWhen breaking down alternative, charter, and virtual schools further, we see an even clearer picture of how these schools are doing at graduating students on time.
Alternative District High SchoolsOf the 1,156 alternative high schools enrolling more than 100 students and reporting ACGR in 2014, 85 percent were district schools and about 14 percent were charter schools. Less than one percent of alternative high schools were virtual schools.
There were 972 alternative district high schools in 37 states, with enrollments of 100 or more students, reporting ACGR in 2014. Nationally, 58 percent of these schools had graduation rates of 67 percent or less. Seventeen states had more than 10 district alternative high schools, and in those states, only two – California and North Carolina – had significant percentages of these schools, 86 and 57 percent, respectively, with graduation rates above 67 percent. The remaining 15 states with more than 10 district alternative schools each saw more than 70 percent of these high schools fail to achieve
categorized as virtual in NCES counts, as well as schools in states not reporting virtual status with “cyber,” “virtual,” “online,” or “digital” in their names.
There were just 200 virtual schools reporting ACGR in 2014, making up just one percent of all high schools, but seven percent of low-graduation-rate high schools nationwide. The number of virtual high schools in each state is still relatively small, but in five states, they comprised 20 percent or more of low-graduation-rate high schools. In a state like New Hampshire, which had only three high schools with a graduation rate of 67 percent or less, this percentage is somewhat deceiving, but in others, like Colorado and Ohio, these percentages translate into a significant number of low-graduation-rate virtual schools (see Appendix L for all state data).
Nationally, four percent of non-graduates came from virtual schools in 2014, a seemingly small amount, but still quite significant given the relatively low number of these schools across the county. In Ohio, almost three in ten non-graduates came from the state’s 27 virtual schools, and all but seven of Ohio’s virtual schools have graduation rates below 50 percent. Similarly, in Idaho, one-quarter of the state’s non-graduates came from its 12 virtual schools, only one of which has a graduation rate greater than 32 percent (see Appendix M for all state data).
Alte
rnat
ive D
istric
t Hig
h
Scho
ols 6
7% o
r Belo
w
Tota
l Alte
rnat
ive
Dist
rict H
igh
Scho
ols
% o
f Alte
rnat
ive D
istric
t Hig
h
Scho
ols 6
7% o
r Belo
w
Minnesota 28 28 100%
Florida 60 61 98%
New York 19 20 95%
Idaho 23 25 92%
Michigan 87 96 91%
Alaska 14 16 88%
Utah 14 16 88%
Colorado 34 39 87%
Maryland 10 12 83%
Washington 71 97 73%
Texas 39 57 68%
Note. The high schools in the above table have a total enrollment of 100 students or more.Sources: U.S. Department of Education, National Center for Education Statistics. (1998-2015). Public Elementary/Secondary School Universe Surveys. U.S. Department of Education through provisional data file of SY2013-14 School Level Four-Year Regulatory Adjusted Cohort Graduation Rates.
Table 10. Percentage of Total Alternative District High Schools with ACGR of 67 Percent or Below in Select States, 2013-14
STATE
Ohio 26%
Idaho 25%
Pennsylvania 14%
Colorado 12%
Kansas 11%
Minnesota 11%
Arizona 10%
South Carolina 10%
Note. The high schools in the above table have a total enrollment of 100 students or more. These calculations include all virtual schools, including both district-operated and charter schools.Sources: U.S. Department of Education, National Center for Education Statistics. (1998-2015). Public Elementary/Secondary School Universe Surveys. U.S. Department of Education through provisional data file of SY2013-14 School Level Four-Year Regulatory Adjusted Cohort Graduation Rates.
Table 9. States with the Highest Percentage of Non-Graduates Coming from Virtual Schools, 2013-14
Perc
enta
ge o
f
Non-
Grad
uate
s
Com
ing
from
Vi
rtual
Scho
ols
STATE

Progress and Challenge in Raising High School Graduation Rates Roadblocks on the Path to 90 Percent
Annual Update 2016 Building a Grad NationAnnual Update 2016 Building a Grad Nation 31
Idaho, Maryland, Nevada, South Dakota, and Texas – all alternative virtual schools had graduation rates of 67 percent or less, while in the two other states, Michigan and Washington, all but one of each state’s alternative virtual high schools were below 67 percent (see Appendix O for all state data).
Overall, whether they are regular, charter, or virtual alternative, these schools graduate 67 percent or less of students in the majority of cases where they exist. There are two positive outliers worthy of further investigation: one, California, where the vast majority of alternative schools with graduation rates above 67 percent are located, and two, Louisiana, which is the only state in which most charter alternative schools have graduation rates above 67 percent.
Regular Charter SchoolsAcross the country, there were 1,295 regular charter high schools, with enrollment of 100 students or more, reporting ACGR in 2014. Of these schools, nearly one-third had graduation rates of 67 percent or less. Twenty-six states had more than 10 regular charter schools enrolling 100 or more students and reporting ACGR in 2014. These states show a mix of success and failure in terms of high school graduation in the charter sector. In Arkansas and New Jersey, none of their regular charter high schools fell below a 67 percent graduation rate, and in Idaho and South Carolina, just one of these schools was a low-graduation-rate high school. Half of the low-graduation-rate charter high schools are concentrated in just three states: California with 89, Arizona with 67, and Ohio with 56. Within these states, these school counts represent different concentrations of low-graduation-rate high schools. In Ohio, the state’s 56 low-graduation-rate charter schools compromise 77 percent of all charter high schools in Ohio. California’s 89 low-graduation-rate charter schools equate to 28 percent of all charter high schools in the state, and in Arizona, the state’s 67 low-graduation-rate charter schools comprise 45 percent of all charter high schools. This suggests that some of the challenge is a lack of quality control in a sub-set of states. On the other hand, there are 23 states where 20 percent or more of the charter high schools have low graduation rates, suggesting some more widespread issues, as well, which need to be examined (see Appendix N for all state data).
graduation rates above 67 percent. Table 10 contains data for a select number of these states (see Appendix O for all state data).
In Minnesota, for example, 100 percent of the state’s 28 alternative district high schools had a graduation rate of 67 percent or less in 2014, so a student in the state that is placed into an alternative school is de facto being placed into a high school where graduation is not the norm. In Florida, New York, Idaho, and Michigan, at least nine out of ten alternative high schools fail to graduate one-third or more of students in four years.
Alternative Charter High Schools Nationwide, 156 alternative charter high schools, with enrollment of 100 students or more, reported ACGR in 2014. Of these schools, 72 percent had graduation rates of 67 percent or less. Only five states – Colorado, Florida, Louisiana, Michigan, and Texas – had more than 10 alternative charter schools, and in just one of those states, Louisiana, were alternative charter schools seeing some level of success at graduating students on time.
% o
f Alte
rnat
ive D
istric
t Hig
h
Scho
ols 6
7% o
r Belo
w
Alte
rnat
ive C
harte
r Hig
h
Scho
ols 6
7% o
r Belo
w
Tota
l Alte
rnat
ive
Char
ter H
igh
Scho
ols
% o
f Alte
rnat
ive C
harte
r
High
Sch
ools
67%
or B
elow
Florida 42 42 100%
Colorado 11 12 92%
Michigan 12 13 92%
Texas 34 58 59%
Louisiana 2 13 15%
Note. The high schools in the above table have a total enrollment of 100 students or more.Sources: U.S. Department of Education, National Center for Education Statistics. (1998-2015). Public Elementary/Secondary School Universe Surveys. U.S. Department of Education through provisional data file of SY2013-14 School Level Four-Year Regulatory Adjusted Cohort Graduation Rates.
Table 11. Percentage of Total Alternative Charter Schools with ACGR of 67 Percent or Below in Select States, 2013-14
STATE
Alternative Virtual High SchoolsNationwide, there were just 21 alternative virtual high schools in 10 states reporting ACGR in 2014. Michigan was home to a third (7) of these schools, while Idaho (3) and Washington (3) together, made up nearly another third of alternative virtual high schools. Colorado had two alternative virtual high schools, and Alaska, California, Maryland, Nevada, South Dakota, and Texas each had one. In eight of these states – Alaska, California, Colorado,

Roadblocks on the Path to 90 Percent Progress and Challenge in Raising High School Graduation Rates
Annual Update 2016 Building a Grad Nation32
public high schools (non-charter/non-virtual) rank highest among these schools, with just seven percent of these schools graduating 67 percent or less of students, 64 percent graduating 85 percent or more of students, and an average graduation rate of 85 percent. On the other end of the spectrum, 87 percent of virtual schools had low graduation rates, only four percent had high graduation rates, and altogether, these schools had an average graduation rate of 40 percent. Similarly, more than half of alternative high schools were low-graduation-rate schools, while just eight percent graduated 85 percent or more of students. On average, alternative schools averaged a graduation rate of just 52 percent. Charter schools, shown to have mixed performance outcomes across states, also had mixed results in terms of graduation rates, with more than three in ten charter schools reporting graduation rates of 67 percent or less and 44 percent with graduation rates of 85 percent and above. This suggests that more than any other school type, charter high schools tend to either do very well or very poorly in graduating their students. Thus, the challenge is to keep and spread the successful models while finding means to reform or replace the struggling ones. The depth of low performance in a sub-set of charters can be seen in the fact that the 30 percent of low-graduation-rate charter schools pull down the average graduation rate for charter high schools to 70 percent, even though 44 percent of charter high schools have graduation rates above 85 percent.
Regular Virtual SchoolsIn 2014, there were 178 regular virtual schools in 24 states, enrolling 100 students or more and reporting high school graduation rates. Nationwide, 87 percent of these schools reported an ACGR of 67 percent or less. There were only seven states with at least 10 regular virtual schools enrolling more than 100 students and reporting ACGR. In these states, at least 60 percent of regular virtual schools are failing to graduate one-third or more of students, and in two of those states, Arizona and Ohio, 100 percent of
Arizona 11 11 100%
Ohio 19 19 100%
Colorado 16 17 94%
California 16 18 89%
Pennsylvania 11 14 79%
Florida 14 21 67%
Wisconsin 6 10 60%
Note. The high schools in the above table have a total enrollment of 100 students or more.Sources: U.S. Department of Education, National Center for Education Statistics. (1998-2015). Public Elementary/Secondary School Universe Surveys. U.S. Depart-ment of Education through provisional data file of SY2013-14 School Level Four-Year Regulatory Adjusted Cohort Graduation Rates.
Table 12. Percentage of Total Regular Virtual Schools with ACGR of 67 Percent or Below in Select States, 2013-14
Regu
lar Vi
rtual
Scho
ols
67%
or B
elow
Tota
l Reg
ular
Virtu
al
High
Sch
ools
% o
f Reg
ular
Virtu
al
Scho
ols 6
7% o
r Belo
w
STATE
Regular 7% 64% 85%
Alternative 57% 8% 52%
Charter 30% 44% 70%
Virtual 87% 4% 40%
Note. The high schools in the above table have a total enrollment of 100 students or more. “Regular” includes only district-run public schools that are non-charter and non-virtual. “Alternative” includes only district-operated alternative high schools. “Charter” includes only regular (non-alternative), non-virtual charter schools. “Virtual” includes only regular (non-alternative) virtual schools.Sources: U.S. Department of Education, National Center for Education Statistics. (1998-2015). Public Elementary/Secondary School Universe Surveys. U.S. Department of Education through provisional data file of SY2013-14 School Level Four-Year Regulatory Adjusted Cohort Graduation Rates.
Scho
ol Ty
pe
Perc
ent o
f Sch
ools
67%
and
Belo
w
Perc
ent o
f Hig
h Sc
hools
85%
and
Abo
ve
Aver
age A
CGR
Table 13. Low-Graduation-Rate High Schools, High-Graduation-Rate High Schools, and Average ACGR, by School Type, 2014
regular virtual high schools have graduation rates of 67 percent or less. Broadening our criteria to all states with any number of virtual schools reporting ACGR in 2014 shows that 100 percent of regular virtual schools in half of these states did not graduate one-third or more of students (see Appendix N for all state data). Here the evidence is clear: in most cases, virtual high schools are not succeeding in graduating high percentages of students, and there is compelling evidence that, as currently designed and operated, many represent a wrong turn on the path to 90 percent graduation rates for all students.
Comparing School TypesComparing school types provides one final perspective on how regular, alternative, charter, and virtual schools are faring on graduation rate measures (Table 13). Regular

Progress and Challenge in Raising High School Graduation Rates Roadblocks on the Path to 90 Percent
Annual Update 2016 Building a Grad NationAnnual Update 2016 Building a Grad Nation 33
minority students. There are also virtual high schools with high graduation rates. The data, however, is clear, that, in too many cases, this is currently not the result. Charter and virtual high schools are over-represented among the nation’s low-graduation-rate high schools. In some states, they have become one of the biggest sources of non-graduates. Further analysis needs to be conducted to determine if successful charter high schools are available to students where regular high schools have low graduation rates, or if students in low-performing regular high schools are simply being given the choice to attend a low-graduation-rate charter school.
Virtual schools, and some “dropout recovery” charter schools have also been questioned over whether they sacrifice higher standards for quick credit earning and recovery. If these schools are little more than places to recoup missing credit as fast as possible, with little to no measurable learning, it begs the question as to whether they are able to offer students the kind of coursework that would allow them to successfully enter into postsecondary education or a lifelong career path. Simply offering a path to a diploma is no longer enough, and these schools must prepare students for life beyond high school if they are to be a true alternative for already vulnerable students.
Finally, alternative, charter, and virtual schools, in some states, fall through the cracks in district and state accountability systems. In particular, this occurs when they are authorized by entities other than the school district in which they are located or draw students from. In these cases it can be harder to hold these schools accountable for outcomes7 and may also provide a tempting means for school districts seeking to raise graduation rates to meet their own accountability pressures. In most states, students who transfer from district schools to alternative, charter, or virtual schools that are not authorized by the school district but rather administratively operate as their own local education authority (LEA) are not only removed from the cohort of their initial school (where, in fact, they may have fallen off track to graduation), but they are also removed from the school district’s cohort as well.
7 See former Tennessee education commissioner, Kevin Huffman’s account of the challenges involved in closing the perpetually failing K12 virtual school in his state: https://www.the74million.org/article/an-ed-commissioners-confession-how-i-tried-and-failed-to-close-the-worst-school-in-tennessee
ConClusionThough alternative, charter, and virtual schools collectively make up only about 14 percent of high schools and enroll just eight percent of high school students, they make up around 50 percent of low-graduation-rate high schools nationwide. In many states, these various high school options have become popular pathways for students that have struggled to stay on track in traditional high schools. Therefore, it is critical that issues surrounding these schools be addressed.
Alternative high schools, by definition, are meant to provide a different path to graduation for students who, for various reasons, have been deemed “at-risk.” So for many of our nation’s most vulnerable students the intent of these schools is to provide a second chance. One issue we may be contending with in assessing alternative schools on four-year graduation rates is that we may be missing out on the number of graduates coming from these schools that may take five or more years to earn their diploma. Collecting extended-year graduation rates – something we discuss later in this report – could provide a valuable tool to more adequately measure the success of alternative schools.
Based on currently available data, however, it is evident that a significant number of alternative schools do not graduate students on time. Right now, we are faced with the fact that these “second chance” pathways are only leading to four-year graduation for fewer than two out of every three students they serve. If any number of those students were to otherwise drop out, then it can be considered a small success. However, it is critical that we are also paying attention to whether these schools are offering a curriculum that allows students to move beyond high school successfully. And with so many of these schools serving students facing considerable challenges, it is essential that alternative schools are places where these students can learn to deal with these issues in a produc-tive manner while continuing their academic studies, and not just places to send students to remove them from their regular high school.
For charter and virtual schools, which are there expressly to provide choice to students, and make the case that through greater autonomy and flexibility, they can provide better outcomes than a student’s assigned or chosen district school, then we need to ensure that the choice they are being given is a worthy one. There are charter high schools with strong outcomes for low-income and
Perc
ent o
f Hig
h Sc
hools
85%
and
Abo
ve
Aver
age A
CGR
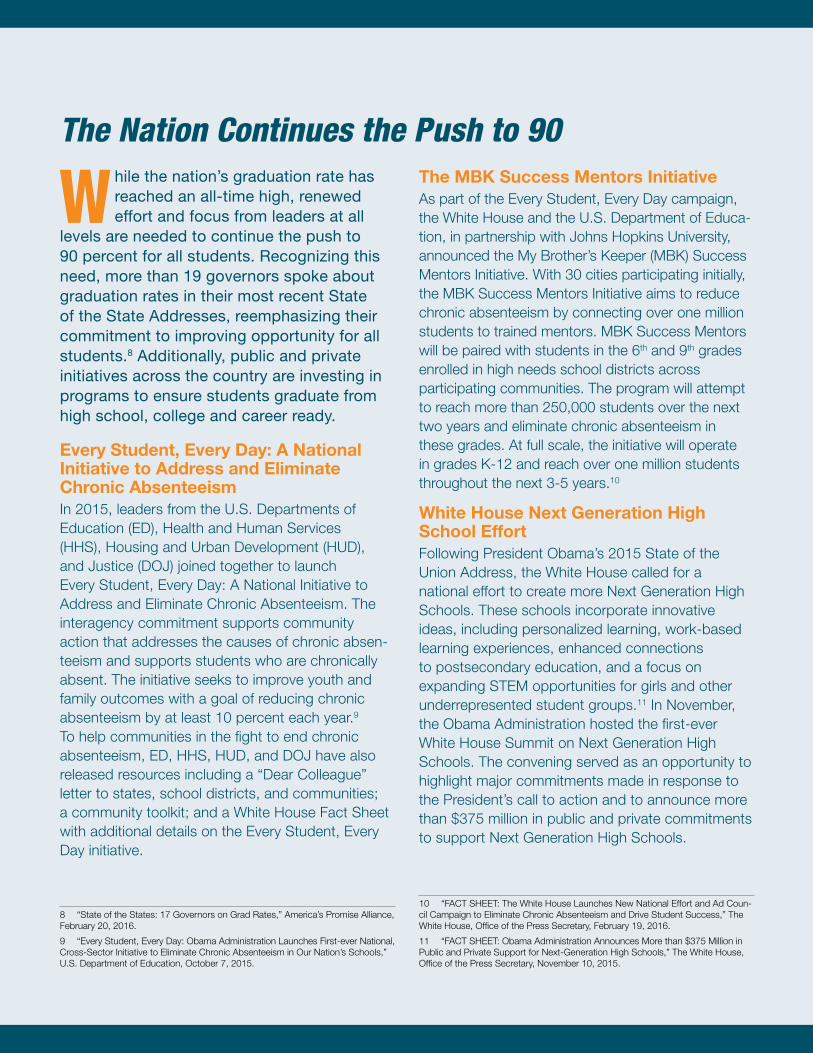
Executive Summary Progress and Challenge in Raising High School Graduation Rates
Annual Update 2016 Building a Grad Nation34
The MBK Success Mentors InitiativeAs part of the Every Student, Every Day campaign, the White House and the U.S. Department of Educa-tion, in partnership with Johns Hopkins University, announced the My Brother’s Keeper (MBK) Success Mentors Initiative. With 30 cities participating initially, the MBK Success Mentors Initiative aims to reduce chronic absenteeism by connecting over one million students to trained mentors. MBK Success Mentors will be paired with students in the 6th and 9th grades enrolled in high needs school districts across participating communities. The program will attempt to reach more than 250,000 students over the next two years and eliminate chronic absenteeism in these grades. At full scale, the initiative will operate in grades K-12 and reach over one million students throughout the next 3-5 years.10
White House Next Generation High School EffortFollowing President Obama’s 2015 State of the Union Address, the White House called for a national effort to create more Next Generation High Schools. These schools incorporate innovative ideas, including personalized learning, work-based learning experiences, enhanced connections to postsecondary education, and a focus on expanding STEM opportunities for girls and other underrepresented student groups.11 In November, the Obama Administration hosted the first-ever White House Summit on Next Generation High Schools. The convening served as an opportunity to highlight major commitments made in response to the President’s call to action and to announce more than $375 million in public and private commitments to support Next Generation High Schools.
10 “FACT SHEET: The White House Launches New National Effort and Ad Coun-cil Campaign to Eliminate Chronic Absenteeism and Drive Student Success,” The White House, Office of the Press Secretary, February 19, 2016.
11 “FACT SHEET: Obama Administration Announces More than $375 Million in Public and Private Support for Next-Generation High Schools,” The White House, Office of the Press Secretary, November 10, 2015.
W hile the nation’s graduation rate has reached an all-time high, renewed effort and focus from leaders at all
levels are needed to continue the push to 90 percent for all students. Recognizing this need, more than 19 governors spoke about graduation rates in their most recent State of the State Addresses, reemphasizing their commitment to improving opportunity for all students.8 Additionally, public and private initiatives across the country are investing in programs to ensure students graduate from high school, college and career ready.
Every Student, Every Day: A National Initiative to Address and Eliminate Chronic AbsenteeismIn 2015, leaders from the U.S. Departments of Education (ED), Health and Human Services (HHS), Housing and Urban Development (HUD), and Justice (DOJ) joined together to launch Every Student, Every Day: A National Initiative to Address and Eliminate Chronic Absenteeism. The interagency commitment supports community action that addresses the causes of chronic absen-teeism and supports students who are chronically absent. The initiative seeks to improve youth and family outcomes with a goal of reducing chronic absenteeism by at least 10 percent each year.9 To help communities in the fight to end chronic absenteeism, ED, HHS, HUD, and DOJ have also released resources including a “Dear Colleague” letter to states, school districts, and communities; a community toolkit; and a White House Fact Sheet with additional details on the Every Student, Every Day initiative.
8 “State of the States: 17 Governors on Grad Rates,” America’s Promise Alliance, February 20, 2016.
9 “Every Student, Every Day: Obama Administration Launches First-ever National, Cross-Sector Initiative to Eliminate Chronic Absenteeism in Our Nation’s Schools,” U.S. Department of Education, October 7, 2015.
The Nation Continues the Push to 90

Progress and Challenge in Raising High School Graduation Rates Chapter Title
Annual Update 2016 Building a Grad NationAnnual Update 2016 Building a Grad Nation 35
XQ: The Super School ProjectIn September 2015, the Emerson Collective launched the XQ: The Super School Project, a national competi-tion designed to inspire teams of educators, students, and community leaders to develop new models of high schools through innovative approaches that better engage students in their learning. Nearly 700 teams from 45 states have submitted proposals to reimagine high school to be more successful at preparing students for college and career in an ever-changing economy. Emerson Collective will provide a fund of $50 million for at least five schools over the next five years to become Super Schools. XQ will announce winners in August 2016.
AT&T Aspire Mentoring Academy and Connect to Success CompetitionAT&T is driving innovation in education to promote student success in school and beyond through its signature philanthropic initiative, AT&T Aspire. In 2012, AT&T launched the Aspire Mentoring Academy, an initiative that connects AT&T employees with students to help them discover their career passions and potential. The initiative was created with an objective of reaching one million hours of mentoring by the end of 2016 – a goal that was reached in January 2016. Another initiative launched as part of AT&T Aspire is the Connect to Success competition. This competition will provide up to $10 million to selected organizations that focus on supporting high school students in their quest to graduate. Winners will use the funding to implement high-quality programs that expand proven interventions and serve students who are at risk of not graduating across the United States. This is the fourth in a series of competitive funding programs for Aspire. Their results continue to grow, but data from a select group of previous awardees show that 10th and 11th grade students who participated in these programs outper-formed their matched comparison peers in on-track-to-graduate status by more than 12 percent.12
12 [1] On Track Indicator (OTI) identifies students who are expected to graduate on time if they’ve earned enough credits to move to the next grade level, and have no more than one failing grade in a core course per semester.
Public Media’s “American Graduate: Let’s Make It Happen” InitiativeIn 2011, the Corporation for Public Broadcasting and 25 stations together launched American Graduate, public media’s long-term commitment to help improve understanding and community-based solutions to the dropout crisis. Today, more than 100 stations are working with more than 1700 partners across the country. Through public affairs and docu-mentaries, feature films and town halls, local forums and partnerships, as well as innovative classroom resources and teaching tools for every age group, American Graduate public media stations are playing their part in the community to improve youth outcomes – from preschool through high school graduation, college and career success. Stations have garnered over $15 million in new local philan-thropic support to help continue this important work.
GradNation State ActivationIn 2015, the GradNation State Activation initiative was launched as a collaboration between Ameri-ca’s Promise Alliance and Pearson to support the GradNation campaign goal of a 90 percent on-time high school graduation rate. The three-year initiative focuses on increasing graduation rates by investing in three key things: encouraging statewide innovation and collaboration, sharing that knowledge and replicating what works, and developing successful models all states can replicate. Three grantees received $200,000 grants to prepare more young people with the skills necessary to graduate from high school and succeed in college, work and life. They are located in Arizona (WestEd), Massachusetts (MA Department of Elementary and Secondary Education) and Minnesota (Minnesota Alliance With Youth).

Annual Update 2016 Building a Grad Nation
Executive Summary Progress and Challenge in Raising High School Graduation Rates
Annual Update 2016 Building a Grad Nation36

Progress and Challenge in Raising High School Graduation Rates Setting the Record Straight
Annual Update 2016 Building a Grad NationAnnual Update 2016 Building a Grad Nation 37Annual Update 2016 Building a Grad Nation
however, there is limited longitudinal data available that could shed light on this question of standards for gradua-tion in 2016.
Another way to approach this question is to look at rates of taking and overall scores over time on benchmark tests such as the SAT and ACT, standardized tests widely used for college admission in the United States.
Since 2009, scores on the ACT College and Career Readiness Benchmark have on the whole either held fairly steady or increased slightly, even as the percentage of graduates taking the ACT exam has continued to rise. (In 2005, approximately 40 percent of graduates took the ACT, rising to approximately 59 percent in 2015)6. Notwithstanding the lack of greater progress in boosting ACT scores during this period, it is important to note that these flat lining levels of college readiness metrics do tell us that outcomes are not being weakened as more students graduate. As the country turns more students who would otherwise have dropped out of high school into graduates, one would expect test scores on the ACT and SAT to decline if graduation rates were increasing because standards were being lowered. The evidence does not support this case.
A s the national high school graduation rate continues to rise, the question continues to be asked if schools have lowered their standards in order
to graduate more students, or if schools are genuinely helping more students meet a high academic bar, and graduate ready for the next steps of college and career. This is an important question, and one that deserves careful consideration. There are several measures that can be studied in order to get more information on this topic.
As of 2016, only 14 states still require their students to pass an exit exam in order to graduate, making this measure somewhat outdated. However, it is important to note that the most recent graduation rates available and reported here are from 2014. The most rapid rise in graduation rates occurred from 2006 to 2014 during an era when states were increasing graduation requirements and the peak years of exit and end of course examina-tions. Thus, graduation rates rose even as it was getting more difficult to graduate. Most states are now beginning to implement new standards (such as those aligned with Common Core, or other college-ready metrics) as ways to measure the readiness of their students for graduation. Since most of these tests are still in the early stages,
Setting the Record Straight on High School Graduation Rates
0%
10%
20%
30%
40%
50%
60%
70%
2009 2010 2011 2012 2013 2009 2010 2011 2012 2013
Figure 11. Percent of Test-Takers Meeting the ACT College & Career Readiness Benchmarks
Total Test Takers Low-Income Test Takers
English Reading Math Science

Setting the Record Straight Progress and Challenge in Raising High School Graduation Rates
Annual Update 2016 Building a Grad Nation38
encouraging since these students have frequently had less exposure than their non-low-income peers to rigorous and advanced academics. The increased participation of this demographic signals a positive trend.
The gap between the number of students taking an AP course and the number that pass at least one AP exam is somewhat concerning, however. Some amount of gap is expected between the numbers of students taking the exams, and the numbers of those who pass at least one. Given the demands of the labor market for more highly educated and trained employees than a generation ago, it is increasingly important to help students leave high school as prepared as possible to take on college-level work, and AP courses are one way to expose them to both rigorous academics, as well as an opportunity to get a head start on their college requirements.
Minority students have also historically had less access to rigorous academic courses like APs. Between 2004 and 2014, rates of AP course-taking for Black students rose at a slightly faster rate than their overall population in the student body, indicating their rate of course-taking was rising, even if only slightly. Hispanic/Latino student rates of AP course-taking, however, have remained more or less flat over that time period.7 This is especially noteworthy given that the percentage of Hispanic/Latino students as a proportion of the overall student population has been rising. As we think about setting high academic standards for graduation, we must also ensure that all students have the opportunity to be challenged academically, and to prepare for the next steps of college and career.
SAT scores show similar flat lining rates. In 2009, 44 percent of students who took the SAT met the College Board’s College and Career Readiness Standards, followed by 44 percent in 2010, and 43 percent in 2011, 2012, and 201313. Again, while this does not demonstrate increased rigor, it also does not substantiate the concern that standards are being lowered to allow more and more students to reach graduation.
Another way to measure the “college readiness” of graduating students is the number of passing scores in Advanced Placement (AP) courses and exams. AP courses are generally considered to have the rigor of a college level course, and a score of 3 or higher on an AP exam can be used for college credit. This makes it a useful proxy to see if students are being held to high academic standards, and still achieving at that level.
Since 2004, the total number of graduates taking an AP course has risen from 558,993 in 2004 to over one million in 2013. The number of students passing at least one AP course has risen in tandem, from 351,647 in 2004 to 607,505 in 201314.
This trend also holds true for low-income students, who historically take AP courses and exams at far lower rates than their non-low-income peers15. Rising rates of AP course- and exam-taking for low-income students is also
13 Data derives from College Board, 2013 SAT Report on College & Career Readiness: pg. 3, http://media.collegeboard.com/homeOrg/content/pdf/sat-re-port-college-career-readiness-2013.pdf
14 Data derives from College Board, Annual AP Report to the Nation years 2005-2014, http://research.collegeboard.org/programs/ap/data/nation
15 Data, shown in below graphic, derives from the College Board, Annual AP Report to the Nation years 2007-2014, http://research.collegeboard.org/programs/ap/data/nation
200620052004 2007 2008 2009 2010 2011 2012 201373.27575 73.9 74.9 75.5 78.2 79 80 81.4
0
200,000
400,000
600,000
800,000
1,000,000
1,200,000
2006 2007 2008 2009 2010 2011 2012 201342% 42.4% 43% 44.6% 47.5% 48.1% 49.6% 51%
0
50,000
100,000
150,000
200,000
250,000
300,000
Figure 12. AP Test-Taking and Graduation Rates 2004-2013 Figure 13. AP Exam Trends for Low-Income Students 2006-2013
Year and Graduation Rate Year and percentage of Public K-12 Students who Qualified for Free or Reduced-Price Lunch
# of Graduate Passing at Least 1 AP Course
# of Graduates Taking at Least 1 AP Course
# of Economically Disadvantaged Graduates Passing at Least 1 AP Course
# of Economically Disadvantaged Graduates Taking at Least 1 AP Course

Progress and Challenge in Raising High School Graduation Rates Setting the Record Straight
Annual Update 2016 Building a Grad NationAnnual Update 2016 Building a Grad Nation 39
required to reconcile duplicate enrollments, as worth the effort. In this case, more accurate data, not looser defini-tions, could lead to a shrinking adjusted cohort.
Answering this question in full requires an investigative report at a level far deeper than this. It would also have to be conducted at the district level, as it is school districts that mostly manage the record keeping and reporting that determines if students are excluded from a cohort. However, inspection of data at the state level sheds some light on this issue and suggests at least the extent to which removing students from the cohort is a significant factor in raising graduation rates.
The accompanying table shows, for each of the 50 states, the size of its ACGR cohorts for the classes of 2011 and 2014 as well as the size of their actual 9th grade enrollments in 2007-08 and 2010-11, the years in which those two cohorts entered 9th grade. This enables us to compare a count of 9th grade students (usually taken by October 1st) with the adjusted cohort for that grade (constructed later), which is adjusted for students who have transferred in or out of the cohort over the four-year period. If substantial numbers of students were removed from the cohort after the fact, in an increasing fashion, this would lead to increased graduation rates over time. It would also lead, however, to the adjusted cohort becoming smaller over time compared to reported 9th grade enrollments.
In general, 9th grade enrollments were shrinking for virtually all states over this time period, as the overall number of high school students declined nationwide. Counter to increasingly stated concerns that graduation rate increases are not real, there are only six states in which the cohort size shrank at a more substantial rate than did overall 9th grade enrollment, and in these states it is a relatively small difference. In 34 other states, changes in the ACGR cohort over time were similar in size to concurrent changes in 9th grade enrollment. For a further nine states, the ACGR cohorts actually grew in size or shrank at a much slower rate than that at which 9th grade enrollment was decreasing. Thus, while inappro-priately removing students from cohorts may be a cause of inflated graduation rates in individual school districts, it is likely not an issue on the larger scale or a serious question mark on the national trend of rising graduation rates.
Overall, the measures available to us to answer this question demonstrate increasing numbers of students participating in rigorous coursework, and taking and achieving on the corre-sponding exams. The data also do not support the premise that schools are lowering their standards for graduation, as we would then expect to see falling rates of passing scores on benchmark exams like the SATs and ACTs. This does not mean that all high school graduates are leaving high school prepared to succeed in college and career. In fact, it is clear that too many are not. But what the existing data reviewed here show is that as more students are graduating, the percentage graduating college and career ready is not declining. We will have a more comprehensive look at the relationship between high school and college and career readiness in a forthcoming report.
50 Ways to Leave Your Cohort?Since the first federally mandated public release of Adjusted Cohort Graduation Rates in 2011, graduation rates have continued to rise steadily at the national level, as well as for most states. While this upward trend has, for the most part, been received as positive news, it has, in parallel, been accompanied by some healthy skepticism. A natural concern is that the steady rise of graduation rates, in response to a federal mandate and increased public scrutiny, may be due, in part, to educational organizations inflating their numbers through the choices they make in establishing the rules used to calculate their adjusted cohort graduation rate. Specifically, districts and states might have succeeded in elevating their graduation rates through looser definitions of who is and is not counted. For example, states can vary as to how long a student has to be enrolled to be counted as an official 9th grader. They can also vary on the level and type of documentation required to remove students from the cohort. There is also likely state-to-state variation in the extent to which significant numbers of high school students are removed from the cohort because they transfer to private schools (including those that are unaccredited) or homes-chooling, neither of which has graduation rate accountability. Finally, particularly at the start of federal graduation rate accountability, some districts may have had the needed incentive to create accurate enrollment data. In areas of high mobility, some districts may have had students enrolled in multiple high schools, the high school they were assigned to at the end of 8th grade, the high school they attended briefly in September, and a third high school they ended up actually attending for the majority of 9th grade. Prior to graduation rate accountability, districts may not have viewed the work

Setting the Record Straight Progress and Challenge in Raising High School Graduation Rates
Annual Update 2016 Building a Grad Nation40
Cohort stable or growing but 9th Grade Enrollment shrinking
Delaware 78.5 87.0 8.5 10116 9423 -7% 11479 11380 -1% 7941 8193 3%
Missouri 81.3 87.3 6.0 75727 65327 -14% 79020 72827 -8% 61528 57017 -7%
Georgia 67.5 72.5 5.0 130481 121593 -7% 147106 145043 -1% 88075 88155 0%
Arkansas 80.7 86.9 6.2 35994 34422 -4% 37819 37807 -0% 29047 29926 3%
Alabama 72.0 86.3 14.3 60758 54125 -11% 65495 61041 -7% 43746 46721 7%
Oregon 67.7 72.0 4.3 47510 45142 -5% 44611 43977 -1% 32141 32493 1%
Cohort stable or growing but 9th Grade Enrollment shrinking
Minnesota 76.9 81.2 4.3 70918 65053 -8% 67434 63934 -5% 54508 52804 -3%
New Hampshire 86.1 88.1 2.0 16327 15193 -7% 17532 16764 -4% 14056 13380 -5%
New Mexico 63.0 68.5 5.5 25450 24235 -5% 29861 28961 -3% 16034 16611 4%
West Virginia 76.5 84.5 8.0 21192 19793 -7% 23946 22785 -5% 16212 16719 3%
Maine 83.8 86.5 2.7 14472 13178 -9% 14800 13660 -8% 12126 11398 -6%
Kansas 83.0 85.7 2.7 36343 35290 -3% 37569 36920 -2% 30165 30236 0%
Tennessee 85.5 87.2 1.7 72871 69503 -5% 78874 75986 -4% 62305 60621 -3%
Montana 82.2 85.4 3.2 11495 10855 -6% 12134 11569 -5% 9449 9273 -2%
Alaska 68.0 71.1 3.1 10564 9871 -7% 10719 10023 -6% 7184 7022 -2%
Iowa 88.3 90.5 2.2 35644 33918 -5% 38819 36818 -5% 31474 30709 -2%
Rhode Island 77.3 80.8 3.5 12000 11333 -6% 13580 12768 -6% 9276 9151 -1%
Pennsylvania 82.6 85.5 2.9 148542 139204 -6% 158065 147421 -7% 122696 119019 -3%
Massachusetts 83.4 86.1 2.7 74528 73257 -2% 79558 77787 -2% 62156 63074 1%
Connecticut 83.0 87.0 4.0 45221 43050 -5% 48459 45867 -5% 37533 37466 -0%
Maryland 82.8 86.4 3.6 67552 64897 -4% 76188 72696 -5% 55947 56065 0%
North Carolina 77.9 83.9 6.0 109568 109132 -0% 127448 126015 -1% 85353 91562 7%
South Carolina 73.6 80.1 6.5 55172 50897 -8% 66363 60503 -9% 40607 40743 0%
Wisconsin 87.0 88.6 1.6 70366 66098 -6% 73741 68378 -7% 61218 58589 -4%
California 76.3 81.0 4.7 446679 432850 -3% 527210 501913 -5% 340816 350609 3%
Mississippi 73.7 77.6 3.9 35014 32988 -6% 41807 38666 -8% 25805 25595 -1%
Nebraska 86.0 89.7 3.7 22604 21806 -4% 23829 22567 -5% 19428 19556 1%
New Jersey 83.2 88.6 5.4 108933 105650 -3% 108173 102997 -5% 90600 93606 3%
South Dakota 83.4 82.7 -0.7 9236 9256 0% 10457 10291 -2% 7702 7658 -1%
ACGR
201
1
ACGR
201
4
Chan
ge in
ACG
R
ACGR
Coh
ort 2
011
ACGR
Coh
ort 2
014
Chan
ge in
ACG
R Co
hort
9th
Grad
e En
rollm
ent 2
007-
089t
h Gr
ade
Enro
llmen
t 201
0-11
Chan
ge in
9th
Gra
de E
nroll
men
t
ACGR
Gra
duat
es 2
011
ACGR
Gra
duat
es 2
014
Chan
ge in
ACG
R Gr
adua
tes
Table 14. Changes in Cohort Size, Ninth Grade Enrollment, and ACGR Graduates Over Time, by State
STATE
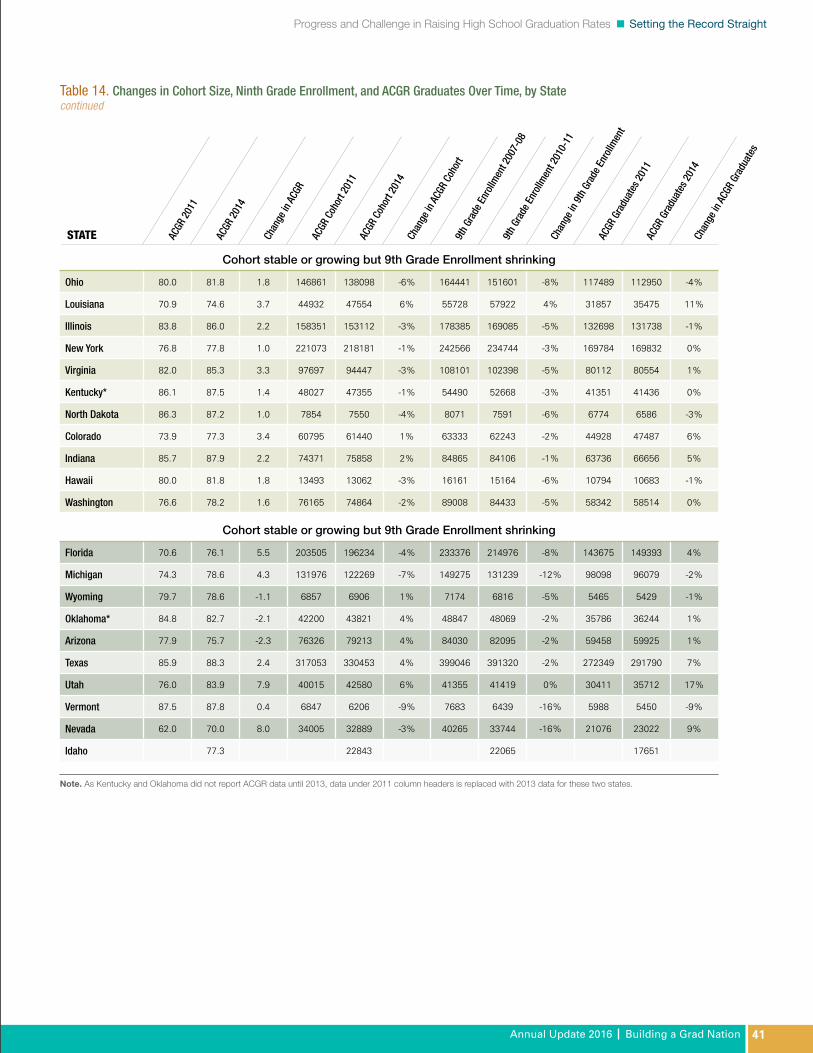
Progress and Challenge in Raising High School Graduation Rates Setting the Record Straight
Annual Update 2016 Building a Grad NationAnnual Update 2016 Building a Grad Nation 41
ACGR
201
1
ACGR
201
4
Chan
ge in
ACG
R
ACGR
Coh
ort 2
011
ACGR
Coh
ort 2
014
Chan
ge in
ACG
R Co
hort
9th
Grad
e En
rollm
ent 2
007-
089t
h Gr
ade
Enro
llmen
t 201
0-11
Chan
ge in
9th
Gra
de E
nroll
men
t
ACGR
Gra
duat
es 2
011
ACGR
Gra
duat
es 2
014
ACGR
Gra
duat
es 2
014
Chan
ge in
ACG
R Gr
adua
tes
Chan
ge in
ACG
R Gr
adua
tes
Table 14. Changes in Cohort Size, Ninth Grade Enrollment, and ACGR Graduates Over Time, by State
Cohort stable or growing but 9th Grade Enrollment shrinking
Ohio 80.0 81.8 1.8 146861 138098 -6% 164441 151601 -8% 117489 112950 -4%
Louisiana 70.9 74.6 3.7 44932 47554 6% 55728 57922 4% 31857 35475 11%
Illinois 83.8 86.0 2.2 158351 153112 -3% 178385 169085 -5% 132698 131738 -1%
New York 76.8 77.8 1.0 221073 218181 -1% 242566 234744 -3% 169784 169832 0%
Virginia 82.0 85.3 3.3 97697 94447 -3% 108101 102398 -5% 80112 80554 1%
Kentucky* 86.1 87.5 1.4 48027 47355 -1% 54490 52668 -3% 41351 41436 0%
North Dakota 86.3 87.2 1.0 7854 7550 -4% 8071 7591 -6% 6774 6586 -3%
Colorado 73.9 77.3 3.4 60795 61440 1% 63333 62243 -2% 44928 47487 6%
Indiana 85.7 87.9 2.2 74371 75858 2% 84865 84106 -1% 63736 66656 5%
Hawaii 80.0 81.8 1.8 13493 13062 -3% 16161 15164 -6% 10794 10683 -1%
Washington 76.6 78.2 1.6 76165 74864 -2% 89008 84433 -5% 58342 58514 0%
Cohort stable or growing but 9th Grade Enrollment shrinking
Florida 70.6 76.1 5.5 203505 196234 -4% 233376 214976 -8% 143675 149393 4%
Michigan 74.3 78.6 4.3 131976 122269 -7% 149275 131239 -12% 98098 96079 -2%
Wyoming 79.7 78.6 -1.1 6857 6906 1% 7174 6816 -5% 5465 5429 -1%
Oklahoma* 84.8 82.7 -2.1 42200 43821 4% 48847 48069 -2% 35786 36244 1%
Arizona 77.9 75.7 -2.3 76326 79213 4% 84030 82095 -2% 59458 59925 1%
Texas 85.9 88.3 2.4 317053 330453 4% 399046 391320 -2% 272349 291790 7%
Utah 76.0 83.9 7.9 40015 42580 6% 41355 41419 0% 30411 35712 17%
Vermont 87.5 87.8 0.4 6847 6206 -9% 7683 6439 -16% 5988 5450 -9%
Nevada 62.0 70.0 8.0 34005 32889 -3% 40265 33744 -16% 21076 23022 9%
Idaho 77.3 22843 22065 17651
Note. As Kentucky and Oklahoma did not report ACGR data until 2013, data under 2011 column headers is replaced with 2013 data for these two states.
continued
STATE

Executive Summary Progress and Challenge in Raising High School Graduation Rates
Annual Update 2016 Building a Grad Nation42
overall rates are still below 80 percent). Six-year rates were available for 23 cohorts from a total of 13 states showing on average an additional gain of one percent in the sixth year. This average sixth-year increase was remarkably consistent across states, with only two to three cohorts/states deviating above or below the one percent rise. Extended seven-year rates were available for only six cohorts from three states, and averaged a more marginal gain of 0.6 percent in the third year past the expected time of graduation.
When considering this impact in terms of the most recent national graduation rate, it would mean that the overall rate for the graduating Class of 2014, reported as 82.3 percent after four years of high school, would, in the end, be closer to 86-87 percent when factoring in those students who will manage to earn a diploma with some additional years of schooling. Ideally, all students would earn a high school diploma within the expected four years, but not all are the same. Some students face greater challenges in completing high school and will require more time to do so. These extend-ed-year rates, though limited in the proportion of students to which they pertain and the impact they can make on overall rates, should still be taken as positive news. They show that should the nation reach the goal of having 90 percent of all students graduate high school by 2020 as measured by the adjusted four-year cohort graduation rate, the actual graduation rate will likely have surpassed that goal.
As the nation continues to work toward a graduation rate of 90 percent by the Class of 2020, an added consideration
is the impact of extended-year graduation rates. While most students graduate within the expected four years of high school, and the research shows that failing to graduate within four years increases a student’s risk of never completing high school, some students require an additional year or two of high school to earn a diploma. The current analysis and discussion around high school graduation rates, and on adjusted cohort graduation rates, has focused almost solely on the four-year rates that treat all students who have not earned a diploma within four years as non-graduates.
Additional students, however, do succeed in completing high school within one or two more years of schooling, meaning that the true and final gradu-ation rates for each cohort will be somewhat higher than are at-first reported. States are only required to federally report four-year graduation rates, but some states publicly release extended-year rates through their own department of education websites. Those rates, presented in the accompanying table, can allow us to estimate the added impact of fifth and sixth years.
As seen in the table, five-year extended graduation rates were available for 31 states, across 73 grad-uating cohorts over four years. On average, the additional year of schooling led to a three percent increase in overall graduation rates. The distribution around this average was roughly even, with about one-third of states having lower increases of one to two percentage points, and about one-third of states having larger increases of roughly four or more percentage points. Those states in which fifth-year gains are the greatest tend to be where overall rates lag the farthest behind (those whose
Extended-Year Graduation Rates

Progress and Challenge in Raising High School Graduation Rates Chapter Title
Annual Update 2016 Building a Grad NationAnnual Update 2016 Building a Grad Nation 43
Alaska 2013 71.8 76.3 4.5
Arizona 2012 76.0 80.0 4.0
Arizona 2013 75.1 79.3 4.2
Arizona 2014 75.8 80.2 4.4
Colorado 2011 74.0 78.7 80.1 80.9 4.7 1.4 0.8
Colorado 2012 75.4 80.1 81.2 82.2 4.7 1.1 1.0
Colorado 2013 76.9 81.2 82.5 4.3 1.3
Colorado 2014 77.3 81.7 4.4
Connecticut 2012 84.8 87.5 2.7
Georgia 2012 69.7 71.6 1.9
Illinois 2012 82.0 87.0 5.0
Illinois 2013 83.2 87.5 4.3
Illinois 2014 86.0 88.0 2.0
Iowa 2011 88.3 91.5 3.2
Iowa 2012 89.0 92.3 3.3
Kansas 2012 84.9 86.1 1.2
Kansas 2013 85.7 86.7 1.0
Kentucky 2013 86.1 88.0 1.9
Kentucky 2014 87.5 89.0 1.5
Maine 2012 85.3 87.4 87.7 2.1 0.3
Maine 2013 86.4 88.8 2.4
Maryland 2012 84.0 87.5 3.5
Maryland 2013 85.0 88.7 3.7
Maryland 2014 86.4 88.7 2.3
Massachusetts 2012 85.0 87.7 2.7
Massachusetts 2013 85.0 87.7 2.7
Michigan 2012 76.2 79.8 80.7 3.6 0.9
Michigan 2013 77.0 80.4 3.5
Minnesota 2012 77.9 81.4 82.9 3.6 1.5
Minnesota 2013 79.8 83.2 3.4
Mississippi 2011 73.7 75.2 1.5
Montana 2012 84.0 84.0 0.0
Montana 2013 84.4 85.8 1.4
Nebraska 2011 86.1 88.6 89.7 90.3 2.5 1.1 0.6
Nebraska 2012 87.6 90.3 91.1 91.7 2.7 0.8 0.6
Nebraska 2013 88.5 91.0 92.1 2.5 1.1
Nebraska 2014 89.7 91.8 2.1
Table 15. Extended-Year Graduation Rates by State, 2011-2014
Year
Gra
d Ra
te
4-Ye
ar G
rad
Rate
5-Ye
ar G
rad
Rate
6-Ye
ar G
rad
Rate
7-Ye
ar G
rad
Rate
4-5 Y
ear G
ains
5-6 Y
ear G
ains
6-7 Y
ear G
ains
STATE

Executive Summary Progress and Challenge in Raising High School Graduation Rates
Annual Update 2016 Building a Grad Nation44
New Jersey 2012 86.5 88.8 2.3
New Mexico 2011 63.0 72.1 73.5 9.1 1.4
New Mexico 2012 70.4 74.0 74.4 3.6 0.4
New Mexico 2013 70.3 71.4 1.1
New York 2012 74.0 79.9 81.5 5.9 1.6
New York 2013 74.9 81.1 6.2
North Carolina 2013 82.5 84.9 2.4
North Carolina 2014 83.9 86.3 2.4
North Dakota 2011 86.3 87.6 88.4 88.7 1.4 0.7 0.3
North Dakota 2012 87.1 88.5 89.1 89.3 1.4 0.6 0.2
North Dakota 2013 87.2 88.6 89.1 1.4 0.5
North Dakota 2014 87.2 88.6 1.4
Oregon 2011 67.7 72.4 4.7
Oregon 2012 68.4 73.2 4.8
Oregon 2013 68.7 75.9 7.2
Oregon 2014 72.0 76.5 4.5
Pennsylvania 2011 83.0 83.4 83.3 0.4 -0.1
Pennsylvania 2012 83.5 84.3 88.9 0.8 4.6
Pennsylvania 2013 85.5 88.5 2.9
Rhode Island 2012 77.1 80.9 81.9 3.8 1.0
Rhode Island 2013 79.7 83.9 4.2
South Carolina 2014 80.1 81.9 1.8
Texas 2011 85.9 89.1 89.8 3.2 0.7
Texas 2012 87.7 90.4 90.9 2.7 0.5
Texas 2013 88.0 90.4 2.4
Washington 2012 77.0 78.8 1.8
Washington 2013 76.4 79.9 3.5
Washington 2014 78.2 81.1 2.9
West Virginia 2012 79.3 80.2 0.9
West Virginia 2013 81.4 83.0 1.6
West Virginia 2014 84.5 85.0 0.5
Wisconsin 2012 87.5 90.8 91.5 3.3 0.7
Wisconsin 2013 88.0 91.3 3.3
Wyoming 2012 78.9 81.3 81.9 2.4 0.6
Wyoming 2013 77.6 80.3 2.7
Average Rise In ACGR: 33% 1.0 0.6
Table 15. Extended-Year Graduation Rates by State, 2011-2014
Year
Gra
d Ra
te
4-Ye
ar G
rad
Rate
5-Ye
ar G
rad
Rate
6-Ye
ar G
rad
Rate
7-Ye
ar G
rad
Rate
4-5 Y
ear G
ains
5-6 Y
ear G
ains
6-7 Y
ear G
ains
STATE
continued

Annual Update 2016 Building a Grad NationAnnual Update 2016 Building a Grad Nation 45
Progress and Challenge in Raising High School Graduation Rates Policy Recommendations
“gold standard” that would provide a uniform and trans-parent rate across states. ACGR, which assigns a single student identifier to better track students, has proven itself to be far superior to its predecessors, but as pointed out in this report and elsewhere, it is not without its issues.
When the U.S. Department of Education released the 2008 regulations, it set a general formula for calculation of ACGR, but it did not provide strict definitions for the components of the formula. This has led to some serious discrepancies in everything from how states and districts define students who transfer out – into another school, across state borders, into homeschooling, or juvenile detention centers – to what counts as a “regular” diploma. States also control how they identify student subgroups; thus, providing another factor of inconsistency when looking at students with disabilities, those with immigrant status, and students identified as economically disadvan-taged or Limited English Proficient.
These issues of clarity and variability hold meaningful consequences for comparability across states, and more importantly, they have allowed states to take creative liberties with the ways they choose to calculate ACGR. The U.S. Department of Education needs to hold states and districts accountable for inflating graduation rate counts and provide clear definitions to prevent states from straying from the intent of the law.
Create evidence-based plans to improve low-grad-uation-rate high schools. With the ESSA requirement that states intervene in schools graduating less than 67 percent of students, it is vital that state leaders support districts in creating and implementing evidence-based plans to improve struggling high schools. Unlike the low-performing schools requirements set out by No Child Left Behind, ESSA does not prescribe “one-size-fits-all” solutions, including school closure or firing teachers or the principal, to turn around poorly performing schools. This should allow schools and districts a greater level of flexibility in choosing the best strategy for improvement.
Given the fact that low-performing schools dispropor-tionately tend to be in disadvantaged areas, have limited resources, and employ fewer high-quality teachers, this new flexibility should give schools the chance to address these inequities and provide students greater engagement opportunities, rather than being punished
Although the nation has made impressive progress in boosting high school graduation rates, moving the needle to 90 and above nationally will not be without its challenges. Though significant steps to raise graduation rates have been taken since the turn of the century, there are still far too many students who disengage from school, schools that struggle to graduate students on time, and state and district policies that promote questionable prac-tices. We see the following recommendations as being critical policy and practice changes that can help ensure accuracy in reporting graduation rates and improvement in low-graduation-rate high schools.
Set clear definitions and give graduation rates the weight they deserve in ESSA. As we go to press, a committee named by the U.S. Department of Education is debating draft regulations to guide implementation of the Every Student Succeeds Act (ESSA). ESSA, as passed, requires states to give “substantial weight” to graduation rates as one measure of accountability for high schools, but it does not address how much weight they must be given in state accountability. Under No Child Left Behind waivers, high school graduation rates count as less than 25 percent in eleven state accountability systems. It is imperative that these new regulations require states to give graduation rates the weight they deserve.
ESSA also requires evidence-based, targeted intervention in schools with “consistently underperforming” subgroups of students, but it leaves it up to states to determine what groups of students fall into this category. ESSA regulations must clarify the definition of “consistently underperforming” and ensure that schools and districts are held accountable for graduating traditionally underserved students and that appropriate interventions are applied when they do not.
ESSA also compels states to take action to improve high schools that fail one-third or more of students (i.e., 67 percent or lower graduation rate). Regulations should require states to use the four-year ACGR to identify these high schools, and to take it further, should allow states to raise the cut-off rate above 67 percent to include even more low-performing high schools for intervention.
Get the cohort rate right. When the U.S. Department of Education began requiring states to report high school graduation rates using the four-year Adjusted Cohort Graduation Rate, the new measure was deemed to be the
6-7 Y
ear G
ains Policy Recommendations to Reach 90 for All

Annual Update 2016 Building a Grad Nation46
Policy Recommendations Progress and Challenge in Raising High School Graduation Rates
Provide real pathways for re-engagement. Alternative schools and programs – including those run by school districts, charter schools, and virtual schools – have became increasingly popular routes for students who, for many reasons, have not had success in more traditional four-year high schools. In some cases, these schools have also become the last best option for students who have been pushed out of their home school for discipline issues, lack of credits, chronic absenteeism, or other reasons. Unfortunately, as this report shows, many of these schools are not succeeding in creating pathways to graduation for substantial numbers of their students, and in too many, graduation is not the norm. It is critical then, that states take a much closer look at these programs and determine whether they truly offer vulnerable students a valuable pathway towards graduation, or if they are simply places for schools and districts to push students to remove them from their books. Students who have fallen off track to graduation need more than quick credit recovery; they need the things that make all students successful: to be able to build positive relationships with caring adults, strong and tailored instruction, opportunities to engage in learning experiences that connect school to life beyond, and the support and resources to help them figure out what they want to do once they have earned their diploma. These should be at the core of any “alter-native” school or program if they are to meet the needs of the students they serve.
for them. It is imperative, then, that school and district leaders thoughtfully consider the needs of low-gradua-tion-rate high schools and find ways to meet them. These strategies should embrace evidence-based tactics that take a “whole child” approach – focusing on meeting social and emotional needs in addition to academic ones. Some examples of this include: ensuring that social and emotional learning is part of the curriculum and age appropriate throughout K-12; implementing early warning systems to track students’ attendance, behavior, and course performance and providing supports when students fall off track; developing strong adult and near-peer relationships through proven in-school and out-of-school mentoring programs; building relationships with businesses and community institutions to provide students with engagement opportunities; and partnering with health care providers and social service agencies to bring vital resources into the school.
Require the reporting of extended-year graduation rates. Ideally, all students would graduate high school in four years; however, we know that this is not always possible. In the case of some dual enrollment, early college, and similar programs, as well as for special education students and others with extenuating circum-stances, graduating in four years is not always part of the plan. But the fact that these students may not graduate in four years does not mean they are not graduating at all, and therefore, as pointed out earlier in this report, requiring states to report extended-year graduation rates would provide a more accurate picture of who is and is not graduating. With 31 states already reporting five-year graduation rates and 13 of those reporting six-year rates as well, the nation is already well on its way to meeting this requirement. If all states were to report these figures federally, it would allow us to see where students are taking a little longer to earn their diplomas, and where they are truly falling short of the mark.
Ensure alternative, charter, and virtual schools are included in state accountability and improvement systems. ESSA requires that any school failing to graduate one-third or more of its students be identified for comprehensive improvement and support. In light of this report’s finding that alternative, charter, and virtual schools make up only about 14 percent of high schools, yet make up more than 50 percent of low-graduation-rate high schools nationwide, states should not be permitted to exclude alternative, charter, and virtual schools from the statewide accountability and improvement system required under ESSA. Effective alternative schools serving vulnerable student populations should be praised; ineffec-tive alternative schools should be held accountable.

Progress and Challenge in Raising High School Graduation Rates Chapter Title
Annual Update 2016 Building a Grad NationAnnual Update 2016 Building a Grad Nation 47
Chicago launched Voices of Youth Count, a multi-year research effort aimed at capturing the scope of runaway and youth homelessness in the United States. Through rigorous independent research, the initiative will seek to establish an accurate estimate of the number of unaccompanied homeless and runaway youth across the country. Voices of Youth Count hopes to create a better understanding of the causes and consequences of youth homelessness.
Through the public media initiative, American Graduate: Let’s Make It Happen, made possible by the Corporation for Public Broadcasting (CPB), local public broadcasting organizations are also raising awareness of this issue. One of the initiative’s films, The Homestretch, which was funded by CPB and premiered as part of the PBS Indepen-dent Lens series, shared the experiences of three Chicago homeless teenagers and the pressures of high school and life alone on the streets as they struggled to build a brighter future. Local stations hosted local screenings and forums to discuss the issues explored in the film, including juvenile justice, immigration and foster care, and the search for community supports to survive, and the journey to high school graduation.
In an encouraging move, The Every Student Succeeds Act of 2015 requires all states to track graduation rates for homeless students, in the same way they track rates for low-income, minority, ELL, and Special Education students. This new mandate opens the door to create accountability, set national goals for this subgroup, and focus the attention of schools, communities, and lawmakers on this important issue. Going forward, this group of students needs and deserves much greater attention to help them reach their full potential. In that spirit, the GradNation campaign will report on graduation rates for this student subgroup as states release the newly required data, and seek to help these students get the supports and services they need in order to persist in school through these difficult circumstances.
Homeless students are an extraordi-narily vulnerable, and rapidly growing, demographic of American students.
During the 2013-14 school year, more than 1.36 million homeless students were identified in public schools, representing an eight percent increase from the previous year, and more than a 100 percent increase from 2006-07. These numbers are likely undercounts, given how difficult homeless students are to identify. Students experiencing homelessness struggle to stay in school, perform well in school, and maintain stable connections with the adults and peers around them. Ultimately, these students are more likely to fall off track, and eventually leave school altogether.
Currently, only five states (Colorado, Kansas, Virginia, Washington State, and Wyoming), report the graduation rates of homeless students. In those five states, homeless students lag significantly behind their peers, including economically disadvantaged students. It is essential that schools, districts, and states place more focus on early identification of these students so they can be connected to the supports that can help them persist in school, and regain stable housing.
Homeless students have to this point remained highly invisible within the school community. They are extremely difficult to identify for a host of reasons, but especially due to the stigma that comes with home-lessness, and their subsequent unwillingness and fear to self-identify. This invisibility contributes greatly to their struggles to stay in school and on track. If their status is not known, they cannot be connected to the people, organizations, and supports that could help them weather the storm, reconnect to housing, and persist in school through this difficult time.
There are efforts underway to improve identification of homeless students, and to shed light on this critical issue in communities across the United States. For example, Chapin Hall at the University of
Including Homeless Students

Executive Summary Progress and Challenge in Raising High School Graduation Rates
Annual Update 2016 Building a Grad Nation48
77.3%
64.2%
52.7%
Colorado Kansas Virginia Washington State Wyoming0%
10%
20%
30%
40%
50%
60%
70%
80%
90%
100%
85.8%
77.2%
68.4%
89.9%
81.8%
70.4%77.2%
66.4%
46.1%
78.6%
65.4%
53%
Figure 14. Class of 2014 On-time (Four-year) State High School Graduation Rates (by poverty status)
Source: Colorado Department of Education, 2013–14 State Policy Report: Dropout Prevention and Student Engagement; Kansas State Department of Education, State Level 2013–14 Graduation and Dropout Data—State-level Four- and Five-year Adjusted Cohort Graduation Rates by Subgroup (Public Schools Only); Kansas State Department of Education, Four-year and Five-year Adjusted Cohort Graduation Rates 2014–15 Fact Sheet; Virginia Department of Education, State-level Cohort Report, Four Year Rate—
Class of 2014; Washington Office of Superintendent of Public Instruction, Graduation and Dropout Statistics Annual Report, April 2015; Washington Office of Superintendent of Public Instruction, Bulletin No. 072–11 Assessment and Student Information—Attachment 2 Class of 2011 Adjusted Cohort Graduation Rate Calculations: Wyoming Department of Education, “Wyoming State Graduation Rates: Federally Adjusted Graduation Rates for the 2013-14 Cohort,” http://edu.wyoming.gov/data/graduation-rates.
All Students Economically Disadvantaged Homeless

Annual Update 2016 Building a Grad NationAnnual Update 2016 Building a Grad Nation 49
Progress and Challenge in Raising High School Graduation Rates Conclusion
ConclusionThe nation has made great progress in raising high school graduation rates, and much of this progress has been driven by improved outcomes for low-income and minority students. Yet, to reach a 90 percent graduation rate for all students, much work remains. In this report, we iden-tified a set of potential roadblocks on the path to 90. The first is complacency. As more states work their way to graduation rates in the 80s, it will be important that their attention does not wander to other issues. As the most recent data show, a set of states crossed the 80 percent threshold several years ago, but have since stagnated, or even slid backwards. The second potential roadblock is the failure to understand that, in many cases, the students who are still not graduating are those in the need of the most support – students who live in concentrated poverty, students with disabilities, and English Language Learners. The third is to see graduating all students as someone else’s concern. There is some evidence that growing numbers of high schools see working with struggling students as the province of alternative or virtual schools, yet the evidence is clear that despite some examples of success, these sectors are not currently producing schools with high graduation rates. The forth roadblock is masking the problem. As ESSA returns more authority to states, it is essential that they continue strong graduation rate accountability, enact tight definitions of who is counted, and a laser focus on reforming or replacing low-graduation-rate high schools of all types – regular, charter, alternative, and virtual. The fifth is backsliding and creating multiple types of high school diplomas with varying levels of rigor and access to college and career options rather than continuing to push forward to ensure that all students graduate fully prepared for postsecondary schooling and/or training.
This report has shown that while all these roadblocks can be seen on the horizon, none has yet reached a critical mass that is preventing the nation from moving forward and reaching a 90 percent graduation rate. Yet at the state level, it is clear that these issues are posing increasing challenges. Several states have high percentages of high schools that are low-graduation-rate high schools or are increasingly sending students who fall off track to alternative schools with low graduation rates. Some have invested too heavily in virtual schools, only to find that they are falling short of their promise to provide students with a successful path to graduation, and a number of other states have charter high schools that are too often falling on the less successful end of the charter school spectrum. Thus, the challenge before us is to use this knowledge and the examples we have of what works to overcome these barriers successfully.
Graduating high school is a critical life step that cannot be underestimated and has significant value to individuals, the economy, and our society. Research shows that individuals who leave school without earning a high school diploma have worse health, economic, legal, and civic outcomes. Students without diplomas cost taxpayers and society billions every year and repre-sent so much lost potential in an economy and country that needs their talents. The ripple effect of this failure can be seen in cities, towns, and rural areas across America, and is especially prominent in places where large numbers of students are not graduating on time, or at all. To reverse the downward trajectory that so many students who drop out find themselves on, we must double down on our investment in their education, re-engage those who have fallen off track, and do whatever it takes to ensure students are earning a high-quality diploma that can take them into postsecondary education and careers successfully. Only when these goals are met, will the nation’s larger goals of equal opportunity, economic vitality, and civic engagement be met. The health of our democracy depends on it.

Executive Summary Progress and Challenge in Raising High School Graduation Rates
Annual Update 2016 Building a Grad Nation50

Annual Update 2016 Building a Grad NationAnnual Update 2016 Building a Grad Nation 51
Progress and Challenge in Raising High School Graduation Rates Acknowledgements
AcknowledgementsA special thanks to each of the co-convening GradNation organizations: America’s Promise Alli-ance, the Alliance for Excellent Education, Civic Enterprises, and the Everyone Graduates Center at the School of Education at Johns Hopkins University, and to all of the partner organizations of GradNation. In particular, we express sincere gratitude for the America’s Promise Alliance Trustees, without whom the GradNation Campaign would not be possible.
Thank you to Jason Amos, Phillip Lovell, and Bob Wise of the Alliance for Excellent Education; John Gomperts, Melinda Hudson, Stefanie Weiss, Rick Cruz, Tanya Tucker, Donna Anderson, Daria Hall, Stefanie Cruz, and Maya Grigorovich-Barksy of America’s Promise Alliance; and Jon Zaff of the Center for Promise.
We are especially grateful for the significant contributions to this report from Joanna Fox, Oscar Volpe, and Mary Maushard of the Everyone Graduates Center; and for the boundless energy and enthusiasm of the Civic Enterprises team, Bruce Reed, Kathleen McMahon, Erin Ingram, Hina Samnani, Matthew Atwell, and Sam Hutchison. Without the hard work and dedication of these teams, this report would not be possible.
It is with the utmost gratitude that we give thanks to our lead sponsor, AT&T and its AT&T Aspire initiative. Thank you to Charlene Lake, Nicole Anderson, Kelem Butts, Cathy Friese, and Jessica Abensour for your support and dedication over the years. We would also like to thank our supporting sponsors, Target and State Farm, for their sustained support over many years, especially Laysha Ward and Jody Warden of Target and Chris Stiles of State Farm. We are so grateful for the continued leadership, initiatives, and investments of these three companies.
We also give special thanks to the Corporation for Public Broadcasting, its CEO Patricia de Stacy Harrison, and Debra Sanchez, Stephanie Aaronson, and Kimberly Bowser, for their leadership on American Graduate: Let’s Make It Happen.
Lastly, thanks to the many respondents from the schools and school districts across the country that contributed their wisdom and expertise to helping us shape particular sections of this report.

Appendices Progress and Challenge in Raising High School Graduation Rates
Annual Update 2016 Building a Grad Nation52
Alabama 86.3% 87.7% 91.0% 83.8% 85.0% 82.4% 87.8% 64.4% 67.3% 81.5% - -
Alaska 71.1% 54.9% 74.0% 66.1% 70.4% 68.8% 78.5% 41.9% 32.2% 59.6% - -
Arizona 75.7% 62.6% 83.4% 71.0% 70.3% - 82.3% 63.3% 18.1% 69.9% - -
Arkansas 86.9% 85.8% 84.7% 81.0% 84.5% 87.5% 89.3% 83.1% 84.1% 82.7% 89.0% 69.0%
California 81.0% 71.0% 91.8% 68.0% 77.0% 83.0% 88.0% 62.0% 65.0% 76.0% 92.0% 80.0%
Colorado 77.3% 60.8% 83.9% 69.0% 66.7% 79.7% 83.2% 54.6% 58.7% 64.2% 85.0% 73.0%
Connecticut 87.0% 84.7% 93.1% 78.6% 74.0% 83.5% 92.2% 65.2% 63.0% 75.9% 93.0% 75.0%
Delaware 87.0% 89.5% 92.8% 83.1% 83.6% 89.7% 89.5% 67.7% 77.3% 81.0% 93.0% >=50.0%
Florida 76.1% 73.8% 89.2% 64.7% 75.0% - 81.7% 55.1% 55.8% 67.8% 89.2% -
Georgia 72.5% 67.0% 82.8% 65.2% 64.0% 76.9% 79.7% 36.5% 43.9% 62.5% - -
Hawaii 81.8% 72.0% 82.8% 76.1% 75.9% - 79.9% 59.1% 52.9% 77.6% - -
Idaho 77.3% 56.3% 78.8% 75.0% 70.3% 69.2% 79.2% 59.2% 74.7% 71.3% 79.0% 77.0%
Illinois 86.0% 82.1% 94.1% 77.2% 81.3% 86.0% 90.1% 71.8% 71.7% 78.5% 94.2% 88.0%
Indiana 87.9% 84.3% 89.4% 75.0% 83.2% 85.5% 90.4% 73.4% 79.8% 85.4% 90.0% 83.0%
Iowa 90.5% 78.3% 90.3% 78.6% 81.7% 85.8% 92.2% 76.4% 83.1% 84.1% 91.0% 80.0%
Kansas 85.7% 75.6% 89.6% 76.5% 78.7% 84.1% 88.3% 76.7% 75.3% 76.9% 90.0% 78.0%
Kentucky 87.5% 83.8% 88.8% 79.4% 84.4% 85.1% 88.7% 70.8% 65.6% 84.0% 89.0% 85.0%
Louisiana 74.6% 79.7% 89.1% 67.9% 73.0% 74.0% 80.3% 42.8% 49.8% 68.8% 89.0% 89.0%
Maine 86.5% 80.4% 94.6% 79.2% 72.1% 78.6% 87.0% 71.0% 72.1% 77.8% 94.0% >=50.0%
Maryland 86.4% 86.8% 94.9% 80.5% 77.5% 90.0% 91.9% 63.5% 54.1% 77.8% 95.3% 76.0%
Massachusetts 86.1% 75.9% 91.9% 74.9% 69.2% 83.8% 90.9% 69.1% 63.4% 76.0% 92.1% 85.0%
Michigan 78.6% 64.8% 88.7% 64.5% 68.8% 74.2% 82.9% 55.1% 68.2% 65.6% 89.1% 79.0%
Minnesota 81.2% 50.6% 81.7% 60.4% 63.2% - 86.3% 58.4% 63.7% 65.9% - -
Mississippi 77.6% 66.1% 89.4% 71.5% 79.7% 76.2% 84.0% 28.1% 66.5% 70.9% 91.0% >=50.0%
Missouri 87.3% 83.5% 90.3% 74.8% 79.9% 86.8% 90.4% 75.3% 64.3% 80.4% 91.0% 84.0%
Montana 85.4% 65.0% 84.8% 88.6% 80.8% - 88.3% 75.8% 58.6% 75.4% 88.0% 75.0%
Nebraska 89.7% 68.8% 78.0% 80.9% 82.8% 87.2% 92.8% 72.1% 60.4% 82.4% 78.0% 77.0%
Nevada 70.0% 52.3% 82.5% 53.9% 64.6% 75.7% 76.9% 27.6% 28.6% 63.6% 84.0% 74.0%
New Hampshire 88.1% 84.4% 89.6% 83.8% 76.6% - 88.6% 71.5% 75.1% 77.2% 90.0% >=50.0%
New Jersey 88.6% 85.9% 96.0% 78.9% 80.6% 91.2% 93.5% 76.6% 71.1% 79.6% 96.2% 89.0%
New Mexico 68.5% 61.4% 83.5% 62.4% 66.9% - 74.7% 56.5% 63.9% 62.3% - -
New York 77.8% 65.5% 83.6% 64.5% 63.9% 75.7% 88.0% 51.8% 37.1% 68.8% - -
North Carolina 83.9% 79.4% 91.3% 79.9% 77.4% 82.7% 87.1% 64.4% 51.7% 78.0% - -
North Dakota 87.2% 66.2% 85.4% 76.4% 74.4% - 90.2% 69.9% 64.3% 72.1% 85.0% -
Appendix A: Four-Year Adjusted Cohort Graduation Rates (ACGR), by State and Subgroup, 2013-14
All S
tude
nts
Amer
ican
Indi
an /
Alas
ka
Nativ
e or
Nat
ive A
mer
ican
Asian
/ Pa
cific I
sland
er 1
Bl
ack
(not
Hisp
anic)
or A
frica
n Am
erica
n Hi
span
ic / L
atin
o
Limite
d En
glish
Pro
ficien
t
(LEP
) Stu
dent
s
Mul
ticul
tura
l or M
ultie
thni
c
or M
ultir
acial
Econ
omica
lly
Disa
dvan
tage
d St
uden
ts
Whi
te (n
ot H
ispan
ic)
or C
auca
sian
Asian
Child
ren
with
Disa
bilit
ies (I
DEA)
Nativ
e Ha
waiia
n /
Othe
r Pac
ific I
sland
er
or P
acifi
c Isla
nder
Major Racial and Ethnic Groups Special Populations Asian/Pacific Islander Detail 2
STATE

Progress and Challenge in Raising High School Graduation Rates Appendices
Annual Update 2016 Building a Grad NationAnnual Update 2016 Building a Grad Nation 53
Ohio 81.8% 74.3% 88.1% 62.7% 69.2% 75.6% 86.6% 68.4% 66.4% 69.2% - -
Oklahoma 82.7% 82.4% 87.8% 75.7% 77.6% 84.3% 84.8% 77.2% 59.1% 78.2% 90.0% 72.0%
Oregon 72.0% 53.6% 83.5% 60.2% 65.0% 69.8% 74.3% 51.1% 51.7% 64.2% 86.0% 69.0%
Pennsylvania 85.5% 82.0% 90.6% 72.9% 71.4% 78.0% 89.6% 71.1% 64.8% 76.8% 90.6% 80.0%
Rhode Island 80.8% 57.4% 87.9% 71.8% 71.8% 71.8% 85.0% 60.0% 72.4% 71.1% 88.0% 84.0%
South Carolina 80.1% 74.3% 88.0% 76.0% 76.9% - 82.8% 43.2% 73.4% 72.5% - -
South Dakota 82.7% 47.0% 79.9% 73.3% 70.6% 76.1% 88.5% 59.4% 57.0% 65.2% 81.0% >=50.0%
Tennessee 87.2% 81.4% 92.6% 78.6% 81.4% - 90.9% 69.0% 73.5% 82.2% 93.0% 92.0%
Texas 88.3% 87.1% 94.6% 84.2% 85.5% 91.2% 93.0% 77.5% 71.5% 85.2% 95.0% 89.0%
Utah 83.9% 65.6% 85.1% 68.8% 72.9% 85.2% 86.6% 68.2% 62.2% 73.5% 86.0% 84.0%
Vermont 87.8% >=50.0% 89.6% 75.4% 77.7% 75.6% 88.6% 70.3% 69.2% 77.6% 89.0% -
Virginia 85.3% - 90.5% 78.5% 75.9% - 89.2% 53.2% 48.2% 75.1% 91.0% -
Washington 78.2% 57.2% 84.5% 68.0% 67.5% 75.8% 80.9% 55.8% 53.8% 66.8% 87.0% 65.0%
West Virginia 84.5% 59.1% 94.7% 79.4% 88.6% 74.4% 84.7% 70.3% 89.5% 80.1% 95.0% -
Wisconsin 88.6% 80.6% 90.1% 66.1% 78.1% - 92.9% 69.0% 64.0% 77.9% - -
Wyoming 78.6% 47.4% 85.1% 69.2% 72.1% 72.8% 80.9% 61.8% 65.2% 65.4% 86.0% >=50.0%
†Not applicable: Data are not expected to be reported by the SEA for SY2012-13.1 The Asian/Pacific Islander column represents either the value reported by the state to the Department of Education for the major racial
and ethnic group “Asian/Pacific Islander” or an aggregation of values reported by the state for the major racial and ethnic groups “Asian,” “Native Hawaiian/Other Pacific Islander or Pacific Islander,” and “Filipino.” (California is the only state currently using the major racial and ethnic group “Filipino.”)
2 Disaggregated reporting for Adjusted Cohort Graduation Rates is done according to the provisions outlined within each state’s Accountablity Workbook. Accordingly, not every state uses major racial and ethnic groups which enable further disaggregation of Asian American/Pacific Islander (AAPI) populations.
>= Indicates that the value has been blurred, and is greater than or equal to the listed value.
Source: Reproduced from the United States Department of Education (2015). Provisional Data File: SY2013-14 Four-Year Regulatory Adjusted Cohort Graduation Rates; Data Notes for Provisional SY2013-14 Four-Year Regulatory Adjusted Cohort Graduation Rates. Retrieved November 6, 2015 from http://eddataexpress.ed.gov/state-tables-main.cfmNotes: There continues to be some variance in how it is implemented in each state, particularly for children with disabilities and limited English proficient students, leading to some accounting differences between states.
The Asian/Pacific Islander column represents either the value reported by the state to the Department of Education for the major racial and ethnic group “Asian / Pacific Islander” or an aggregation of values reported by the state for the major racial and ethnic groups “Asian”, “Native Hawaiian / Ohter Pacific Islander or Pacific Islander” and “Filipino”. Values reported in the Asian/Pacific Islander column which represent the U. S. Department of Education aggregation of other values reported by the state have been presented in Italic type. (California is the only state currently using the major racial and ethnic group “Filipino”.)
State specific notes: BIE did not submit data to the department.
Puerto Rico reports a 3-year Adjusted Cohort Graduation Rate, so they are excluded from this table.
California, Georgia, Missouri, and Texas submitted their data late; therefore their data have not gone through ED’s standard data quality review
Since the close of the SY1314 reporting window, Pennsylvania has resubmitted data to EDFacts, this table does not represent their most recent submissions.
Appendix A: Four-Year Adjusted Cohort Graduation Rates (ACGR), by State and Subgroup, 2013-14
All S
tude
nts
Amer
ican
Indi
an /
Alas
ka
Nativ
e or
Nat
ive A
mer
ican
Asian
/ Pa
cific I
sland
er 1
Bl
ack
(not
Hisp
anic)
or A
frica
nAm
erica
n Hi
span
ic / L
atin
o
Limite
d En
glish
Pro
ficien
t
(LEP
) Stu
dent
s
Mul
ticul
tura
l or M
ultie
thni
c
or M
ultir
acial
Econ
omica
lly
Disa
dvan
tage
d St
uden
ts
Whi
te (n
ot H
ispan
ic)
or C
auca
sian
Asian
Child
ren
with
Disa
bilit
ies (I
DEA)
Nativ
e Ha
waiia
n /
Othe
r Pac
ific I
sland
er
or P
acifi
c Isla
nder
Nativ
e Ha
waiia
n /
Othe
r Pac
ific I
sland
er
or P
acifi
c Isla
nder
Major Racial and Ethnic Groups Special Populations Asian/Pacific Islander Detail 2
continued
STATE

Appendices Progress and Challenge in Raising High School Graduation Rates
Annual Update 2016 Building a Grad Nation54
STATE STATE
4 or more Percentage Points
Alabama 86.3% 14.3
Delaware 87.0% 9.0
Nevada 70.0% 8.0
Utah 83.9% 7.9
West Virginia 84.5% 6.5
Missouri 87.3% 6.3
South Carolina 80.0% 6.0
Arkansas 86.9% 5.9
North Carolina 83.9% 5.9
New Jersey 88.6% 5.6
Georgia 72.5% 5.5
New Mexico 68.5% 5.5
Florida 76.1% 5.1
California 81.0% 5.0
Michigan 78.6% 4.6
Minnesota 81.2% 4.2
Connecticut 87.0% 4.0
Oregon 72.0% 4.0
2-3.9 Percentage Points
Rhode Island 80.8% 3.8
Nebraska 89.7% 3.7
Louisiana 74.6% 3.6
Maryland 86.4% 3.4
Montana 85.4% 3.4
Colorado 77.3% 3.3
Virginia 85.3% 3.3
Alaska 71.1% 3.1
2-3.9 Percentage Points (continued)
Massachusetts 86.1% 3.1
Kansas 85.7% 2.7
Mississippi 77.6% 2.6
Iowa 90.5% 2.5
Maine 86.5% 2.5
Pennsylvania 85.5% 2.5
Texas 88.3% 2.3
Washington 78.2% 2.2
New Hampshire 88.1% 2.1
Illinois 86.0% 2.0
1-1.9 Percentage Points
Indiana 87.9% 1.9
Hawaii 81.8% 1.8
Ohio 81.8% 1.8
Wisconsin 88.6% 1.6
North Dakota 87.2% 1.2
Tennessee 87.2% 1.2
0 Percentage Point or Less
New York 77.8% 0.8
Vermont 87.8% 0.8
South Dakota 82.7% -0.3
Wyoming 78.6% -1.4
Arizona 75.7% -2.3
Non-Reporting or No Comparison
Idaho 77.3%
Kentucky 87.5%
Oklahoma 82.7%
ACGR
, 201
4 (%
)
ACGR
, 201
4 (%
)
ACGR
Per
cent
age
Poin
t Cha
nge
from
201
1-20
14
ACGR
Per
cent
age
Poin
t Cha
nge
from
201
1-20
14
Note. Washington, DC is not included in this table. ACGR Percentage Point Change from 2011-2014 = The 2013-14 ACGR minus the 2010-11 ACGR; therefore, positive values indicate an increase in graduation rate.
Sources: Reproduced from the United States Department of Education (2015). Provisional Data Files: SY2010-11 and SY2013-14 Four-Year Regulatory Adjusted Cohort Graduation Rates.
Appendix B: Adjusted Cohort Graduation Rate (ACGR) Change from 2010-11 to 2013-14, by State

Progress and Challenge in Raising High School Graduation Rates Appendices
Annual Update 2016 Building a Grad NationAnnual Update 2016 Building a Grad Nation 55
STATE STATE
Wisconsin 92.9% 66.1% 26.8
Minnesota 86.3% 60.4% 25.9
Ohio 86.6% 62.7% 23.9
New York 88.0% 64.5% 23.5
Nevada 76.9% 53.9% 23.0
California 88.0% 68.0% 20.0
Michigan 82.9% 64.5% 18.4
Utah 86.6% 68.8% 17.9
Florida 81.7% 64.7% 17.0
Pennsylvania 89.6% 72.9% 16.7
Massachusetts 90.9% 74.9% 16.0
Missouri 90.4% 74.8% 15.6
Indiana 90.4% 75.0% 15.4
South Dakota 88.5% 73.3% 15.2
New Jersey 93.5% 78.9% 14.6
Georgia 79.7% 65.2% 14.5
Colorado 83.2% 69.0% 14.2
Oregon 74.3% 60.2% 14.1
North Dakota 90.2% 76.4% 13.8
Connecticut 92.2% 78.6% 13.6
Iowa 92.2% 78.6% 13.6
Rhode Island 85.0% 71.8% 13.2
Vermont 88.5% 75.4% 13.1
Illinois 90.1% 77.2% 12.9
Washington 80.9% 68.0% 12.9
Mississippi 84.0% 71.5% 12.5
Alaska 78.5% 66.1% 12.4
Louisiana 80.3% 67.9% 12.4
New Mexico 74.7% 62.4% 12.3
Tennessee 90.9% 78.6% 12.3
Nebraska 92.8% 80.9% 11.9
Kansas 88.3% 76.5% 11.8
Wyoming 80.8% 69.2% 11.6
Maryland 91.9% 80.5% 11.4
Arizona 82.3% 71.0% 11.3
Virginia 89.2% 78.5% 10.7
Kentucky 88.7% 79.4% 9.3
Oklahoma 84.8% 75.7% 9.1
Texas 93.0% 84.2% 8.8
Arkansas 89.3% 81.0% 8.3
Maine 87.0% 79.2% 7.8
North Carolina 87.1% 79.9% 7.2
South Carolina 82.8% 76.0% 6.8
Delaware 89.5% 83.1% 6.4
West Virginia 84.7% 79.4% 5.3
New Hampshire 88.6% 83.8% 4.8
Idaho 79.2% 75.0% 4.2
Alabama 87.8% 83.8% 4.0
Hawaii 79.9% 76.1% 3.8
Montana 88.3% 88.6% -0.3
Whi
te S
tude
nts
Rate
(%)
Whi
te S
tude
nts
Rate
(%)
Afric
an A
mer
ican
Stud
ents
Rat
e (%
)
Afric
an A
mer
ican
Stud
ents
Rat
e (%
)
Perc
enta
ge P
oint
Diffe
renc
e (%
)
Perc
enta
ge P
oint
Diffe
renc
e (%
)
Appendix C: Adjusted Cohort Graduation Rate (ACGR) Gaps, by Subgroup and State, 2013-14

Appendices Progress and Challenge in Raising High School Graduation Rates
Annual Update 2016 Building a Grad Nation56
New York 88.0% 63.9% 24.1
Minnesota 86.3% 63.2% 23.1
Massachusetts 90.9% 69.2% 21.7
Connecticut 92.2% 74.0% 18.2
Pennsylvania 89.6% 71.4% 18.2
South Dakota 88.5% 70.6% 17.9
Ohio 86.6% 69.2% 17.4
Colorado 83.2% 66.7% 16.5
North Dakota 90.2% 74.4% 15.8
Georgia 79.7% 64.0% 15.7
Maine 87.0% 72.1% 14.9
Wisconsin 92.9% 78.1% 14.8
Maryland 91.9% 77.5% 14.4
Michigan 82.9% 68.8% 14.1
Utah 86.6% 72.9% 13.7
Washington 80.9% 67.5% 13.4
Virginia 89.2% 75.9% 13.3
Rhode Island 85.0% 71.8% 13.3
New Jersey 93.5% 80.6% 12.9
Nevada 76.9% 64.6% 12.3
New Hampshire 88.6% 76.6% 12.0
Arizona 82.3% 70.3% 12.0
California 88.0% 77.0% 11.0
Vermont 88.5% 77.7% 10.9
Iowa 92.2% 81.7% 10.5
Missouri 90.4% 79.9% 10.5
Nebraska 92.8% 82.8% 10.0
North Carolina 87.1% 77.4% 9.7
Kansas 88.3% 78.7% 9.6
Tennessee 90.9% 81.4% 9.5
Oregon 74.3% 65.0% 9.3
Idaho 79.2% 70.3% 8.9
Illinois 90.1% 81.3% 8.8
Wyoming 80.8% 72.1% 8.7
Alaska 78.5% 70.4% 8.1
New Mexico 74.7% 66.9% 7.8
Texas 93.0% 85.5% 7.5
Montana 88.3% 80.8% 7.5
Louisiana 80.3% 73.0% 7.3
Indiana 90.4% 83.2% 7.2
Oklahoma 84.8% 77.6% 7.2
Florida 81.7% 75.0% 6.7
Delaware 89.5% 83.6% 5.9
South Carolina 82.8% 76.9% 5.9
Arkansas 89.3% 84.5% 4.8
Mississippi 84.0% 79.7% 4.3
Kentucky 88.7% 84.4% 4.3
Hawaii 79.9% 75.9% 4.0
Alabama 87.8% 85.0% 2.8
West Virginia 84.7% 88.6% -3.9
Whi
te S
tude
nts
Rate
(%)
Whi
te S
tude
nts
Rate
(%)
Hisp
anic
Stud
ents
Rate
(%)
Hisp
anic
Stud
ents
Rate
(%)
Perc
enta
ge P
oint
Diffe
renc
e (%
)
Perc
enta
ge P
oint
Diffe
renc
e (%
)
STATE STATE
Appendix C: Adjusted Cohort Graduation Rate (ACGR) Gaps, by Subgroup and State, 2013-14continued

Progress and Challenge in Raising High School Graduation Rates Appendices
Annual Update 2016 Building a Grad NationAnnual Update 2016 Building a Grad Nation 57
Arizona 75.7% 18.1% 57.6
Nevada 70.0% 28.6% 41.4
New York 77.8% 37.1% 40.7
Alaska 71.1% 32.2% 38.9
Virginia 85.3% 48.2% 37.1
Maryland 86.4% 54.1% 32.3
North Carolina 83.9% 51.7% 32.2
Nebraska 89.7% 60.4% 29.4
Hawaii 81.8% 52.9% 28.9
Georgia 72.5% 43.9% 28.6
Montana 85.4% 58.6% 26.9
South Dakota 82.7% 57.0% 25.7
Louisiana 74.6% 49.8% 24.8
Wisconsin 88.6% 64.0% 24.6
Washington 78.2% 53.8% 24.4
Connecticut 87.0% 63.0% 24.0
Oklahoma 82.7% 59.1% 23.6
Missouri 87.3% 64.3% 23.0
North Dakota 87.2% 64.3% 22.9
Massachusetts 86.1% 63.4% 22.7
Kentucky 87.5% 65.6% 21.9
Utah 83.9% 62.2% 21.7
Pennsylvania 85.5% 64.8% 20.7
Florida 76.1% 55.8% 20.3
Oregon 72.0% 51.7% 20.3
Alabama 86.3% 67.3% 19.0
Colorado 77.3% 58.7% 18.6
Vermont 87.8% 69.2% 18.6
Minnesota 81.2% 63.7% 17.5
New Jersey 88.6% 71.1% 17.5
Texas 88.3% 71.5% 16.8
California 81.0% 65.0% 16.0
Ohio 81.8% 66.4% 15.4
Maine 86.5% 72.1% 14.4
Illinois 86.0% 71.7% 14.3
Tennessee 87.2% 73.5% 13.7
Wyoming 78.6% 65.2% 13.4
New Hampshire 88.1% 75.1% 13.0
Mississippi 77.6% 66.5% 11.1
Michigan 78.6% 68.2% 10.4
Kansas 85.7% 75.3% 10.4
Delaware 87.0% 77.3% 9.7
Rhode Island 80.8% 72.4% 8.4
Indiana 87.9% 79.8% 8.1
Iowa 90.5% 83.1% 7.4
South Carolina 80.0% 73.4% 6.7
New Mexico 68.5% 63.9% 4.6
Arkansas 86.9% 84.1% 2.8
Idaho 77.3% 74.7% 2.6
West Virginia 84.5% 89.5% -5.0
Whi
te S
tude
nts
Rate
(%)
Whi
te S
tude
nts
Rate
(%)
Limite
d En
glish
Profi
cienc
y (L
EP)R
ate
(%)
Limite
d En
glish
Profi
cienc
y (L
EP)R
ate
(%)
Perc
enta
ge P
oint
Diffe
renc
e (%
)
Perc
enta
ge P
oint
Diffe
renc
e (%
)
STATE STATE
Appendix C: Adjusted Cohort Graduation Rate (ACGR) Gaps, by Subgroup and State, 2013-14continued

Appendices Progress and Challenge in Raising High School Graduation Rates
Annual Update 2016 Building a Grad Nation58
Appendices Progress and Challenge in Raising High School Graduation Rates
StateWyoming 12.4 1.3%
Alabama 11.0 35.4%
New Hampshire 9.1 1.9%
Minnesota 9.1 9.9%
Nebraska 8.1 6.2%
South Dakota 6.8 2.2%
New Jersey 6.4 16.8%
Pennsylvania 6.3 15.2%
Nevada 5.0 10.4%
Michigan 4.6 18.4%
Connecticut 4.4 13.3%
Montana 4.3 1.1%
North Carolina 3.8 27.3%
Missouri 3.4 17.0%
Iowa 3.4 4.5%
Arkansas 2.7 21.6%
Delaware 2.6 31.7%
Virginia 2.3 23.7%
Kansas 2.2 7.4%
Texas 2.2 13.1%
North Dakota 2.2 3.1%
Ohio 2.1 15.9%
Illinois 2.1 17.6%
Massachusetts 2.0 9.2%
California 2.0 7.0%
Oregon 1.9 2.5%
Rhode Island 1.8 8.6%
Colorado 1.8 5.1%
Maryland 1.6 35.7%
Mississippi 1.5 50.5%
Georgia 1.5 38.3%
Utah 1.1 1.4%
Washington 1.1 4.4%
New Mexico 0.7 2.6%
Louisiana 0.6 45.3%
Wisconsin 0.2 10.2%
South Carolina 0.2 36.4%
Florida 0.0 22.7%
West Virginia -0.3 5.2%
Arizona -0.3 5.7%
Alaska -0.4 3.4%
Maine -0.8 2.9%
Tennessee -1.3 25.6%
New York -1.5 18.9%
Indiana -2.4 11.7%
Hawaii -2.8 2.1%
Vermont -9.1 1.8%
Idaho † 1.3%
Oklahoma † 9.7%
Kentucky † 11.0%
State
Minnesota 9.9 6.1%
Utah 9.3 15.6%
Alabama 9.2 3.5%
Connecticut 6.8 17.9%
New Mexico 6.2 57.9%
Nebraska 6.0 15.0%
Nevada 5.7 37.3%
Massachusetts 5.3 14.8%
Delaware 5.1 10.8%
Alaska 4.9 6.7%
Pennsylvania 4.8 8.2%
Colorado 4.5 29.6%
Iowa 4.5 7.7%
North Carolina 4.3 10.9%
Wisconsin 4.2 8.0%
South Dakota 4.1 3.0%
New Jersey 4.1 20.4%
California 4.0 50.3%
Kansas 3.4 14.9%
Illinois 3.2 21.1%
Michigan 2.9 5.3%
Oregon 2.7 18.8%
Mississippi 2.7 2.1%
Washington 2.6 16.0%
Maryland 2.6 10.9%
Texas 2.5 47.9%
Georgia 2.3 10.3%
Arkansas 2.2 9.2%
South Carolina 2.1 5.1%
New Hampshire 2.0 3.5%
Rhode Island 1.8 20.9%
Virginia 1.7 10.5%
Ohio 1.6 3.4%
Arizona 1.0 40.8%
West Virginia 0.9 0.9%
Missouri 0.5 4.0%
Tennessee 0.5 5.4%
Florida 0.3 27.1%
Indiana -0.2 7.6%
Louisiana -0.3 3.5%
Montana -0.5 3.5%
Wyoming -0.7 11.4%
New York -1.1 21.4%
North Dakota -1.8 2.3%
Hawaii -5.0 5.3%
Vermont -6.9 1.4%
Maine -17.9 1.6%
Kentucky † 3.1%
Oklahoma † 11.9%
Idaho † 15.6%
ACGR
Gap
Clo
sure
bet
wee
n
Whi
te a
nd B
lack
Stu
dent
s
from
201
1 to
201
4
ACGR
Gap
Clo
sure
bet
wee
n
Whi
te a
nd H
ispan
ic St
uden
ts
from
201
1 to
201
4
Perc
ent o
f Bla
ck S
tude
nts
with
in th
e Co
hort
in 2
014
Perc
ent o
f Hisp
anic
Stud
ents
with
in th
e Co
hort
in 2
014
Appendix D: Adjusted Cohort Graduation Rate (ACGR) Gap Change, by Subgroup and State from 2010-11 to 2013-14
State
Alabama 20.1 8.7%
Louisiana 10.2 10.1%
Indiana 6.5 11.7%
Wyoming 6.2 13.6%
Florida 6.0 11.9%
Oregon 5.1 13.8%
New Mexico 4.0 12.7%
West Virginia 3.8 16.4%
Iowa 3.8 13.2%
Illinois 3.8 13.5%
Montana 3.4 11.2%
Maryland 3.1 9.4%
New York 3.0 14.1%
Virginia 2.8 11.7%
Delaware 2.7 13.2%
Mississippi 2.5 9.1%
Maine 2.5 17.6%
Arkansas 2.2 8.9%
North Dakota 1.7 11.4%
North Carolina 1.5 9.4%
Utah 1.3 9.1%
Kansas 1.0 12.7%
Georgia 1.0 11.2%
Tennessee 0.8 11.9%
Vermont 0.5 16.0%
New Hampshire 0.4 17.9%
Wisconsin 0.4 11.3%
Missouri 0.0 11.5%
Massachusetts 0.0 19.4%
Ohio -0.4 14.9%
Connecticut -0.8 13.1%
Alaska -1.2 11.3%
Arizona -1.4 9.4%
Michigan -1.5 11.5%
Nebraska -1.6 11.5%
Hawaii -1.7 10.5%
Colorado -1.7 9.7%
Minnesota -1.8 13.3%
South Carolina -1.8 10.6%
Texas -1.8 9.0%
Rhode Island -1.8 22.0%
New Jersey -2.0 15.9%
California -2.0 11.2%
Pennsylvania -2.4 14.5%
Washington -2.4 10.8%
Nevada -3.4 9.9%
South Dakota -4.4 9.2%
Oklahoma † 13.9%
Kentucky † 7.5%
Idaho † 8.6%
ACGR
Gap
Clo
sure
bet
wee
n
All a
nd S
tude
nts w
ith
Disa
bilit
ies f
rom
201
1 to
201
4
Perc
ent o
f Stu
dent
s with
Disa
bilit
ies w
ithin
the
Coho
rt in
201
4

Progress and Challenge in Raising High School Graduation Rates Appendices
Annual Update 2016 Building a Grad NationAnnual Update 2016 Building a Grad Nation 59
Appendix D: Adjusted Cohort Graduation Rate (ACGR) Gap Change, by Subgroup and State from 2010-11 to 2013-14
StatePercentage Points (%) Percent (%)
Alabama 17.0 0.7%
Ohio 11.6 1.6%
Texas 11.2 7.6%
Iowa 10.6 3.3%
Utah 9.3 4.5%
Minnesota 7.5 6.4%
Georgia 6.4 3.4%
South Carolina 5.3 3.4%
Indiana 4.9 2.3%
Nebraska 4.6 3.4%
Wyoming 4.6 2.3%
Massachusetts 4.3 7.0%
Delaware 3.3 3.4%
Louisiana 3.2 1.0%
Kansas 2.6 7.1%
New Mexico 2.4 28.1%
Colorado 2.4 10.8%
Arkansas 2.2 4.6%
North Dakota 2.1 2.3%
Illinois 1.7 3.9%
Michigan 1.6 3.1%
Tennessee 1.3 2.3%
Washington 0.6 5.1%
Rhode Island 0.6 10.1%
New Hampshire 0.0 2.6%
California 0.0 19.0%
Connecticut -0.0 3.7%
Pennsylvania -0.7 2.2%
West Virginia -1.0 0.7%
Montana -1.9 3.6%
North Carolina -2.2 2.4%
Florida -2.3 7.5%
New Jersey -2.5 3.6%
South Dakota -2.7 2.4%
Mississippi -3.1 0.7%
Maryland -3.3 1.9%
Wisconsin -3.6 2.2%
Missouri -4.0 1.2%
Oregon -4.3 5.9%
Arizona -4.6 1.1%
Nevada -8.4 7.3%
Maine -8.4 2.2%
Hawaii -8.9 5.0%
New York -9.7 5.6%
Virginia -10.1 4.2%
Alaska -11.9 7.8%
Vermont -13.6 1.5%
Idaho † 7.5%
Kentucky † 1.0%
Oklahoma † 2.5%
ACGR
Gap
Clo
sure
bet
wee
n
All a
nd S
tude
nts w
ith
Disa
bilit
ies f
rom
201
1 to
201
4
ACGR
Gap
Clo
sure
bet
wee
n
All a
nd L
imite
d En
glish
Profi
cient
(LEP
) Stu
dent
s
from
201
1 to
201
4
Perc
ent o
f Stu
dent
s with
Disa
bilit
ies w
ithin
the
Coho
rt in
201
4
Perc
ent o
f Lim
ited
Engl
ish
Profi
cient
(LEP
) Stu
dent
s
with
in th
e Co
hort
in 2
014
StatePercentage Points (%) Percent (%)
Connecticut 8.9 38.2%
Alabama 5.2 51.4%
West Virginia 4.6 64.5%
Indiana 4.4 35.7%
Minnesota 3.7 35.2%
Iowa 3.6 38.6%
Pennsylvania 3.3 38.2%
New Hampshire 3.1 30.1%
New Jersey 3.0 29.4%
Massachusetts 2.9 42.6%
Florida 2.7 48.5%
Nevada 2.5 52.5%
Ohio 2.4 39.6%
Maine 2.3 49.8%
Wisconsin 2.3 32.6%
Arkansas 1.8 49.7%
Virginia 1.8 32.2%
Illinois 1.5 43.7%
Rhode Island 1.3 55.5%
Louisiana 1.2 53.9%
Kansas 1.2 49.3%
North Carolina 1.1 43.6%
California 1.0 66.9%
Tennessee 1.0 59.5%
Delaware 1.0 47.6%
Montana 1.0 44.7%
Hawaii 0.8 45.6%
New Mexico 0.8 56.7%
Wyoming 0.8 39.4%
Nebraska 0.7 36.6%
Utah 0.6 26.1%
Alaska 0.5 39.2%
Maryland 0.4 33.8%
Vermont -0.2 43.5%
South Carolina -0.5 48.3%
Mississippi -0.7 54.2%
Arizona -0.8 39.3%
Oregon -0.8 54.9%
Missouri -0.9 40.6%
New York 44.9%
Texas -1.1 50.3%
Colorado -1.1 44.8%
Washington -1.4 46.3%
South Dakota -1.5 31.7%
Georgia -2.0 45.0%
Michigan -2.0 43.0%
North Dakota -5.1 26.3%
Kentucky † 51.3%
Oklahoma † 45.4%
Idaho † 55.8%
ACGR
Gap
Clo
sure
bet
wee
n
All a
nd L
ow-In
com
e St
uden
ts
from
201
1 to
201
4Pe
rcen
t of L
ow-In
com
e
Stud
ents
with
in th
e
Coho
rt in
201
4
continued

Appendices Progress and Challenge in Raising High School Graduation Rates
Annual Update 2016 Building a Grad Nation60
Alabama 88.7% 91.4% 2.7 71.8% 81.5% 9.70 16.9 9.9 7.0
Alaska 79.6% 78.5% -1.1 59.5% 59.6% 0.10 20.1 18.9 1.2
Arizona 79.0% 79.5% 0.5 69.4% 69.9% 0.50 9.6 9.6 0.0
Arkansas 89.5% 91.1% 1.6 80.3% 82.7% 2.40 9.2 8.4 0.8
California 90.2% 91.1% 0.9 74.8% 76.0% 1.20 15.4 15.1 0.3
Colorado 87.0% 87.9% 0.9 63.7% 64.2% 0.50 23.3 23.7 -0.4
Connecticut 93.3% 93.9% 0.6 72.1% 75.9% 3.80 21.2 18.0 3.2
Delaware 86.4% 92.4% 6.0 74.2% 81.0% 6.80 12.2 11.4 0.8
Florida 83.0% 83.9% 0.9 67.0% 67.8% 0.80 16.0 16.1 -0.1
Georgia 79.8% 80.7% 0.9 63.8% 62.5% -1.30 16.0 18.2 -2.2
Hawaii 85.8% 85.3% -0.5 78.2% 77.6% -0.60 7.6 7.7 -0.1
Idaho † 84.9% † † 71.3% † † 13.6 †
Illinois 90.6% 91.8% 1.2 73.0% 78.5% 5.50 17.6 13.3 4.3
Indiana 89.4% 89.3% -0.0 82.7% 85.3% 2.60 6.7 4.0 2.6
Iowa 95.4% 94.5% -0.9 80.4% 84.1% 3.70 15.0 10.4 4.6
Kansas 94.2% 94.3% 0.0 76.6% 76.9% 0.30 17.6 17.4 0.3
Kentucky 86.8% 91.2% 4.4 85.4% 84.0% -1.40 1.4 7.2 -5.8
Louisiana 79.9% 81.4% 1.5 67.7% 68.8% 1.10 12.2 12.6 -0.4
Maine 95.1% 95.1% 0.0 76.9% 77.8% 0.90 18.2 17.3 0.9
Maryland 89.6% 90.8% 1.2 75.8% 77.8% 2.00 13.8 13.0 0.8
Massachusetts 93.1% 93.6% 0.5 73.6% 76.0% 2.40 19.5 17.6 1.9
Michigan 87.0% 88.4% 1.4 63.9% 65.6% 1.70 23.1 22.8 0.3
Minnesota 87.9% 89.5% 1.6 63.8% 65.9% 2.10 24.1 23.6 0.5
Mississippi 81.5% 85.5% 4.0 70.2% 70.9% 0.70 11.3 14.6 -3.3
Missouri 90.7% 92.0% 1.3 78.0% 80.4% 2.40 12.7 11.6 1.1
Montana 92.1% 93.5% 1.4 74.5% 75.4% 0.90 17.6 18.1 -0.5
Nebraska 92.8% 93.9% 1.1 80.9% 82.4% 1.50 11.9 11.5 0.4
Nevada 77.5% 77.2% -0.3 64.0% 63.5% -0.50 13.5 13.7 -0.2
Estim
ated
Non
-Low
-Inco
me
2013
ACG
R (%
)
Estim
ated
Non
-Low
-Inco
me
2014
ACG
R (%
)
Perc
enta
ge P
oint
Cha
nge
of
Non-
Low
-Inco
me A
CGR
2013
-14
Low
-Inco
me
2013
ACG
R (%
)Lo
w-In
com
e 20
14 A
CGR
(%)
Perc
enta
ge P
oint
Cha
nge
of
Low
-Inco
me A
CGR
2013
-14
Gap
betw
een
Non-
Low
-Inco
me
and
Low
-Inco
me A
CGR
(Per
cent
age
Poin
ts),
2013
Gap
betw
een
Non-
Low
-Inco
me
and
Low
-Inco
me A
CGR
(Per
cent
age
Poin
ts),
2014
Gap
Chan
ge b
etw
een
Non-
Low
-Inco
me
and
Low
-Inco
me
ACGR
(Per
cent
age
Poin
ts),
2013
-201
4
Appendix E: Estimated Non-Low-Income Adjusted Cohort Graduation Rate (ACGR), Low-Income ACGR, Gap between Low-Income and Non-Low-Income, and Gap Change, by State, from 2012-13 to 2013-14
STATE
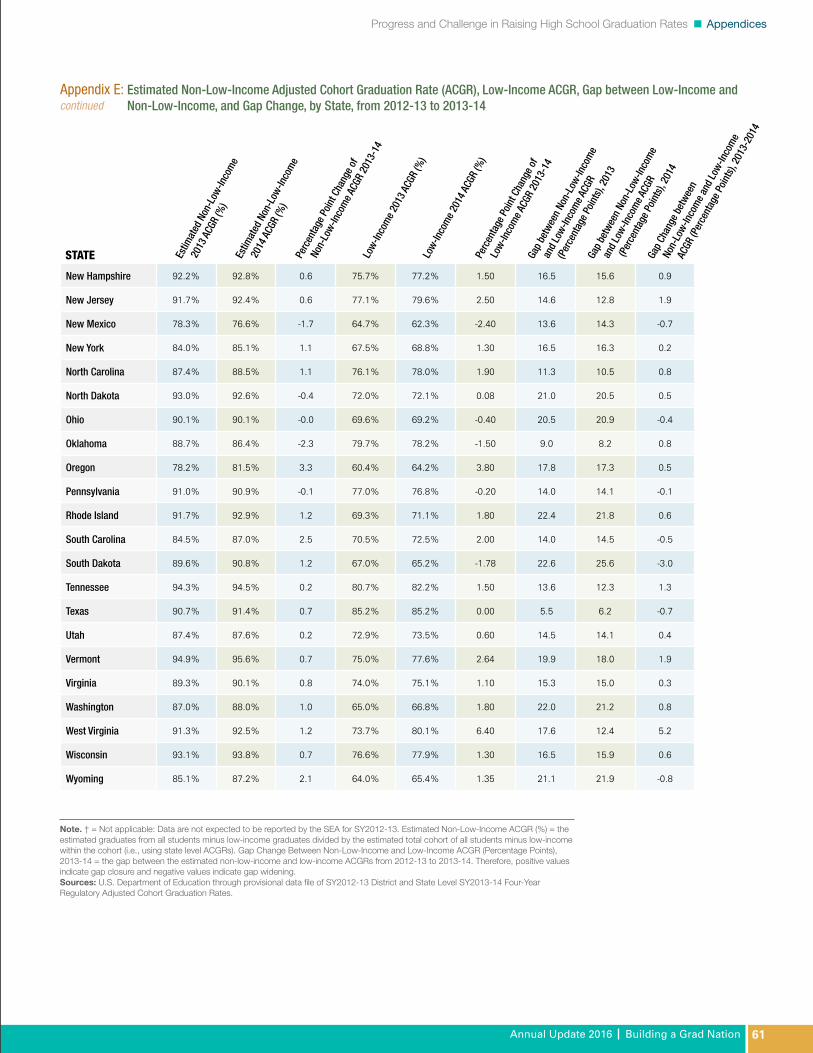
Progress and Challenge in Raising High School Graduation Rates Appendices
Annual Update 2016 Building a Grad NationAnnual Update 2016 Building a Grad Nation 61
New Hampshire 92.2% 92.8% 0.6 75.7% 77.2% 1.50 16.5 15.6 0.9
New Jersey 91.7% 92.4% 0.6 77.1% 79.6% 2.50 14.6 12.8 1.9
New Mexico 78.3% 76.6% -1.7 64.7% 62.3% -2.40 13.6 14.3 -0.7
New York 84.0% 85.1% 1.1 67.5% 68.8% 1.30 16.5 16.3 0.2
North Carolina 87.4% 88.5% 1.1 76.1% 78.0% 1.90 11.3 10.5 0.8
North Dakota 93.0% 92.6% -0.4 72.0% 72.1% 0.08 21.0 20.5 0.5
Ohio 90.1% 90.1% -0.0 69.6% 69.2% -0.40 20.5 20.9 -0.4
Oklahoma 88.7% 86.4% -2.3 79.7% 78.2% -1.50 9.0 8.2 0.8
Oregon 78.2% 81.5% 3.3 60.4% 64.2% 3.80 17.8 17.3 0.5
Pennsylvania 91.0% 90.9% -0.1 77.0% 76.8% -0.20 14.0 14.1 -0.1
Rhode Island 91.7% 92.9% 1.2 69.3% 71.1% 1.80 22.4 21.8 0.6
South Carolina 84.5% 87.0% 2.5 70.5% 72.5% 2.00 14.0 14.5 -0.5
South Dakota 89.6% 90.8% 1.2 67.0% 65.2% -1.78 22.6 25.6 -3.0
Tennessee 94.3% 94.5% 0.2 80.7% 82.2% 1.50 13.6 12.3 1.3
Texas 90.7% 91.4% 0.7 85.2% 85.2% 0.00 5.5 6.2 -0.7
Utah 87.4% 87.6% 0.2 72.9% 73.5% 0.60 14.5 14.1 0.4
Vermont 94.9% 95.6% 0.7 75.0% 77.6% 2.64 19.9 18.0 1.9
Virginia 89.3% 90.1% 0.8 74.0% 75.1% 1.10 15.3 15.0 0.3
Washington 87.0% 88.0% 1.0 65.0% 66.8% 1.80 22.0 21.2 0.8
West Virginia 91.3% 92.5% 1.2 73.7% 80.1% 6.40 17.6 12.4 5.2
Wisconsin 93.1% 93.8% 0.7 76.6% 77.9% 1.30 16.5 15.9 0.6
Wyoming 85.1% 87.2% 2.1 64.0% 65.4% 1.35 21.1 21.9 -0.8
Note. † = Not applicable: Data are not expected to be reported by the SEA for SY2012-13. Estimated Non-Low-Income ACGR (%) = the estimated graduates from all students minus low-income graduates divided by the estimated total cohort of all students minus low-income within the cohort (i.e., using state level ACGRs). Gap Change Between Non-Low-Income and Low-Income ACGR (Percentage Points), 2013-14 = the gap between the estimated non-low-income and low-income ACGRs from 2012-13 to 2013-14. Therefore, positive values indicate gap closure and negative values indicate gap widening.Sources: U.S. Department of Education through provisional data file of SY2012-13 District and State Level SY2013-14 Four-Year Regulatory Adjusted Cohort Graduation Rates.
Estim
ated
Non
-Low
-Inco
me
2013
ACG
R (%
)
Estim
ated
Non
-Low
-Inco
me
2014
ACG
R (%
)
Perc
enta
ge P
oint
Cha
nge
of
Non-
Low
-Inco
me A
CGR
2013
-14
Low
-Inco
me
2013
ACG
R (%
)Lo
w-In
com
e 20
14 A
CGR
(%)
Perc
enta
ge P
oint
Cha
nge
of
Low
-Inco
me A
CGR
2013
-14
Gap
betw
een
Non-
Low
-Inco
me
and
Low
-Inco
me A
CGR
(Per
cent
age
Poin
ts),
2013
Gap
betw
een
Non-
Low
-Inco
me
and
Low
-Inco
me A
CGR
(Per
cent
age
Poin
ts),
2014
Gap
Chan
ge b
etw
een
Non-
Low
-Inco
me
and
Low
-Inco
me
ACGR
(Per
cent
age
Poin
ts),
2013
-201
4
Appendix E: Estimated Non-Low-Income Adjusted Cohort Graduation Rate (ACGR), Low-Income ACGR, Gap between Low-Income and Non-Low-Income, and Gap Change, by State, from 2012-13 to 2013-14
STATE
continued
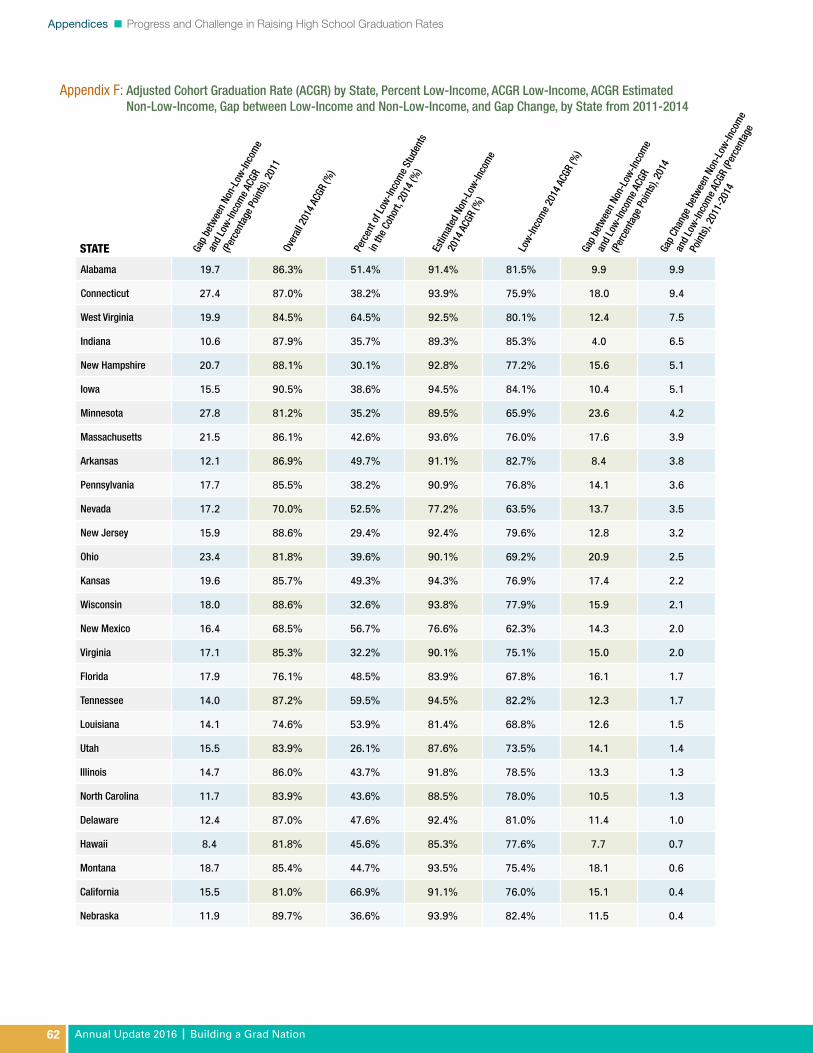
Appendices Progress and Challenge in Raising High School Graduation Rates
Annual Update 2016 Building a Grad Nation62
Alabama 19.7 86.3% 51.4% 91.4% 81.5% 9.9 9.9
Connecticut 27.4 87.0% 38.2% 93.9% 75.9% 18.0 9.4
West Virginia 19.9 84.5% 64.5% 92.5% 80.1% 12.4 7.5
Indiana 10.6 87.9% 35.7% 89.3% 85.3% 4.0 6.5
New Hampshire 20.7 88.1% 30.1% 92.8% 77.2% 15.6 5.1
Iowa 15.5 90.5% 38.6% 94.5% 84.1% 10.4 5.1
Minnesota 27.8 81.2% 35.2% 89.5% 65.9% 23.6 4.2
Massachusetts 21.5 86.1% 42.6% 93.6% 76.0% 17.6 3.9
Arkansas 12.1 86.9% 49.7% 91.1% 82.7% 8.4 3.8
Pennsylvania 17.7 85.5% 38.2% 90.9% 76.8% 14.1 3.6
Nevada 17.2 70.0% 52.5% 77.2% 63.5% 13.7 3.5
New Jersey 15.9 88.6% 29.4% 92.4% 79.6% 12.8 3.2
Ohio 23.4 81.8% 39.6% 90.1% 69.2% 20.9 2.5
Kansas 19.6 85.7% 49.3% 94.3% 76.9% 17.4 2.2
Wisconsin 18.0 88.6% 32.6% 93.8% 77.9% 15.9 2.1
New Mexico 16.4 68.5% 56.7% 76.6% 62.3% 14.3 2.0
Virginia 17.1 85.3% 32.2% 90.1% 75.1% 15.0 2.0
Florida 17.9 76.1% 48.5% 83.9% 67.8% 16.1 1.7
Tennessee 14.0 87.2% 59.5% 94.5% 82.2% 12.3 1.7
Louisiana 14.1 74.6% 53.9% 81.4% 68.8% 12.6 1.5
Utah 15.5 83.9% 26.1% 87.6% 73.5% 14.1 1.4
Illinois 14.7 86.0% 43.7% 91.8% 78.5% 13.3 1.3
North Carolina 11.7 83.9% 43.6% 88.5% 78.0% 10.5 1.3
Delaware 12.4 87.0% 47.6% 92.4% 81.0% 11.4 1.0
Hawaii 8.4 81.8% 45.6% 85.3% 77.6% 7.7 0.7
Montana 18.7 85.4% 44.7% 93.5% 75.4% 18.1 0.6
California 15.5 81.0% 66.9% 91.1% 76.0% 15.1 0.4
Nebraska 11.9 89.7% 36.6% 93.9% 82.4% 11.5 0.4
Gap
betw
een
Non-
Low
-Inco
me
and
Low
-Inco
me A
CGR
(Per
cent
age
Poin
ts),
2011
Over
all 2
014
ACGR
(%)
Perc
ent o
f Low
-Inco
me
Stud
ents
in th
e Co
hort,
201
4 (%
)
Estim
ated
Non
-Low
-Inco
me
2014
ACG
R (%
)
Low
-Inco
me
2014
ACG
R (%
)Ga
p be
twee
n No
n-Lo
w-In
com
e
and
Low
-Inco
me A
CGR
(Per
cent
age
Poin
ts),
2014
Gap
Chan
ge b
etw
een
Non-
Low
-Inco
me
and
Low
-Inco
me A
CGR
(Per
cent
age
Poin
ts),
2011
-201
4
Appendix F: Adjusted Cohort Graduation Rate (ACGR) by State, Percent Low-Income, ACGR Low-Income, ACGR Estimated Non-Low-Income, Gap between Low-Income and Non-Low-Income, and Gap Change, by State from 2011-2014
STATE

Progress and Challenge in Raising High School Graduation Rates Appendices
Annual Update 2016 Building a Grad NationAnnual Update 2016 Building a Grad Nation 63
Rhode Island 22.1 80.8% 55.5% 92.9% 71.1% 21.8 0.3
Wyoming 21.7 78.6% 39.4% 87.2% 65.4% 21.9 -0.2
Maryland 12.6 86.4% 33.8% 90.8% 77.8% 13.0 -0.4
Alaska 18.3 71.1% 39.2% 78.5% 59.6% 18.9 -0.6
South Carolina 13.3 80.0% 48.3% 87.0% 72.5% 14.5 -1.2
Arizona 7.9 75.7% 39.3% 79.5% 69.9% 9.6 -1.6
Vermont 16.3 87.8% 43.5% 95.6% 77.6% 18.0 -1.7
Missouri 9.8 87.3% 40.6% 92.0% 80.4% 11.6 -1.8
Mississippi 12.5 77.6% 54.2% 85.5% 70.9% 14.6 -2.1
Texas 3.7 88.3% 50.3% 91.4% 85.2% 6.2 -2.5
New York 13.2 77.8% 44.9% 85.1% 68.8% 16.3 -3.1
Georgia 15.0 72.5% 45.0% 80.7% 62.5% 18.2 -3.1
South Dakota 22.2 82.7% 31.7% 90.8% 65.2% 25.6 -3.4
Oregon 13.7 72.0% 54.9% 81.5% 64.2% 17.3 -3.6
Washington 17.4 78.2% 46.3% 88.0% 66.8% 21.2 -3.8
Maine 13.4 86.5% 49.8% 95.1% 77.8% 17.3 -3.9
Michigan 18.7 78.6% 43.0% 88.4% 65.6% 22.8 -4.2
Colorado 19.1 77.3% 44.8% 87.9% 64.2% 23.7 -4.6
North Dakota 13.4 87.2% 26.3% 92.6% 72.1% 20.5 -7.1
Oklahoma † 82.7% 45.4% 86.4% 78.2% 8.2 †
Idaho † 77.3% 55.8% 84.9% 71.3% 13.6 †
Kentucky † 87.5% 51.3% 91.2% 84.0% 7.2 †
Sources: U.S. Department of Education through provisional data file of SY2010-11 and SY 2013-14 State Level Four-Year Regulatory Adjusted Cohort Graduation Rates and Cohort Counts. Retrieved on November 6, 2015 from http://eddataexpress.ed.gov/state-tables-main.cfm.
Gap
betw
een
Non-
Low
-Inco
me
and
Low
-Inco
me A
CGR
(Per
cent
age
Poin
ts),
2011
Over
all 2
014
ACGR
(%)
Perc
ent o
f Low
-Inco
me
Stud
ents
in th
e Co
hort,
201
4 (%
)
Estim
ated
Non
-Low
-Inco
me
2014
ACG
R (%
)
Low
-Inco
me
2014
ACG
R (%
)Ga
p be
twee
n No
n-Lo
w-In
com
e
and
Low
-Inco
me A
CGR
(Per
cent
age
Poin
ts),
2014
Gap
Chan
ge b
etw
een
Non-
Low
-Inco
me
and
Low
-Inco
me A
CGR
(Per
cent
age
Poin
ts),
2011
-201
4
Gap
Chan
ge b
etw
een
Non-
Low
-Inco
me
and
Low
-Inco
me A
CGR
(Per
cent
age
Poin
ts),
2011
-201
4
Appendix F: Adjusted Cohort Graduation Rate (ACGR) by State, Percent Low-Income, ACGR Low-Income, ACGR Estimated Non-Low-Income,Gap between Low-Income and Non-Low-Income, and Gap Change, by State from 2011-2014
STATE
continued

Appendices Progress and Challenge in Raising High School Graduation Rates
Annual Update 2016 Building a Grad Nation64
Appendix G: Adjusted Cohort Graduation Rate (ACGR, 2013-14) for Students with Disabilities (SWD) versus Non-SWD
Perc
ent o
f Stu
dent
s with
Disa
bilit
ies w
ithin
the
2014
Coho
rt (%
)
2014
ACG
R fo
r all
Stud
ents
(%)
Estim
ated
Non
-SW
D 20
14
ACGR
(%)
Appe
ndix
G: S
WD
2014
ACGR
(%)
Gap
betw
een
Non-
SWD
and
SWD
2014
ACG
R
(Per
cent
age
Poin
ts)
Arkansas 8.9% 86.9% 87.3% 83.1% 4.2
Oklahoma 13.9% 82.7% 83.6% 77.2% 6.4
Kansas 12.7% 85.7% 87.0% 76.7% 10.3
Montana 11.2% 85.4% 86.6% 75.8% 10.8
Texas 9.0% 88.3% 89.4% 77.5% 11.9
Missouri 11.5% 87.3% 88.9% 75.3% 13.6
Arizona 9.4% 75.7% 77.0% 63.3% 13.7
New Mexico 12.7% 68.5% 70.2% 56.5% 13.7
New Jersey 15.9% 88.6% 90.9% 76.6% 14.3
Ohio 14.9% 81.8% 84.1% 68.4% 15.7
Iowa 13.2% 90.5% 92.7% 76.3% 16.4
Indiana 11.7% 87.9% 89.8% 73.4% 16.4
Illinois 13.5% 86.0% 88.2% 71.8% 16.4
Pennsylvania 14.5% 85.5% 87.9% 71.1% 16.8
West Virginia 16.4% 84.5% 87.3% 70.3% 17.0
Utah 9.1% 83.9% 85.5% 68.2% 17.3
Kentucky 7.5% 87.5% 88.9% 70.8% 18.1
Maine 17.6% 86.5% 89.8% 71.0% 18.9
Wyoming 13.6% 78.6% 81.2% 61.8% 19.4
North Dakota 11.4% 87.2% 89.4% 69.9% 19.5
Idaho 8.6% 77.3% 79.0% 59.2% 19.8
Nebraska 11.5% 89.7% 92.0% 72.1% 19.9
New Hampshire 17.9% 88.1% 91.7% 71.5% 20.2
Tennessee 11.9% 87.2% 89.7% 69.0% 20.7
Vermont 16.0% 87.8% 91.1% 70.3% 20.9
Massachusetts 19.4% 86.1% 90.2% 69.1% 21.1
California 11.2% 81.0% 83.4% 62.0% 21.4
North Carolina 9.4% 83.9% 85.9% 64.4% 21.5
Wisconsin 11.3% 88.6% 91.1% 69.0% 22.1
Delaware 13.2% 87.0% 89.9% 67.7% 22.3
STATE

Progress and Challenge in Raising High School Graduation Rates Appendices
Annual Update 2016 Building a Grad NationAnnual Update 2016 Building a Grad Nation 65
Appendix G: Adjusted Cohort Graduation Rate (ACGR, 2013-14) for Students with Disabilities (SWD) versus Non-SWD
Perc
ent o
f Stu
dent
s with
Disa
bilit
ies w
ithin
the
2014
Coho
rt (%
)
2014
ACG
R fo
r all
Stud
ents
(%)
Estim
ated
Non
-SW
D 20
14
ACGR
(%)
Appe
ndix
G: S
WD
2014
ACGR
(%)
Gap
betw
een
Non-
SWD
and
SWD
2014
ACG
R
(Per
cent
age
Poin
ts)
Florida 11.9% 76.1% 78.9% 55.1% 23.8
Alabama 8.7% 86.3% 88.4% 64.4% 24.0
Oregon 13.8% 72.0% 75.3% 51.1% 24.2
Connecticut 13.1% 87.0% 90.3% 65.2% 25.1
Washington 10.8% 78.2% 80.9% 55.8% 25.1
Colorado 9.7% 77.3% 79.7% 54.6% 25.1
Maryland 9.4% 86.4% 88.8% 63.5% 25.3
Hawaii 10.5% 81.8% 84.5% 59.1% 25.3
South Dakota 9.2% 82.7% 85.1% 59.4% 25.7
Minnesota 13.3% 81.2% 84.7% 58.4% 26.3
Michigan 11.5% 78.6% 81.7% 55.1% 26.6
Rhode Island 22.0% 80.8% 86.7% 60.0% 26.7
New York 14.1% 77.8% 82.1% 51.8% 30.3
Alaska 11.3% 71.1% 74.8% 41.9% 33.0
Louisiana 10.1% 74.6% 78.2% 42.8% 35.4
Virginia 11.7% 85.3% 89.5% 53.1% 36.4
Georgia 11.2% 72.5% 77.0% 36.5% 40.5
South Carolina 10.6% 80.0% 84.4% 43.2% 41.2
Nevada 9.9% 70.0% 74.7% 27.6% 47.1
Mississippi 9.1% 77.6% 82.6% 28.1% 54.5
Note. Total Cohort Size (N) = the sum of all students in the 9th grade cohort in the district level ACGR file listed below. Percent of Students with Disabilities within the Cohort (%) = the number of SWD students divided by the total cohort size within each state. Estimated Non-SWD ACGR (%) = the estimated graduates from all students minus SWD graduates divided by the estimated total cohort of all students minus SWD within the cohort (i.e., using state level ACGRs). SWD ACGR (%) = the actual state level ACGR from 2013-14. Gap between Non-SWD and SWD 2013 ACGR (Percentage Points) = the estimated non-SWD ACGR minus the SWD ACGR.Sources: U.S. Department of Education through provisional data file of SY2013-14 District and State Level Four-Year Regulatory Adjusted Cohort Graduation Rates.
STATE
continued

Appendices Progress and Challenge in Raising High School Graduation Rates
Annual Update 2016 Building a Grad Nation66
Appendix H: Number of High Schools by Different Levels of Promoting Power, 2002-2014
100+%90%10%0% 40% 70%20% 50% 80%30% 60%
Promoting Power Deciles
Num
ber
of H
igh
Sch
ools
2002 2012 2013 2014
0
500
1000
1500
2000
2500
3000
3500
Promoting Power Deciles
Class
2002 2012 2013 2014
0% 6 11 5 4
10% 36 10 10 9
20% 95 43 32 33
30% 253 130 108 99
40% 540 306 297 226
50% 1,077 747 590 584
60% 1,751 1,413 1,316 1,225
70% 2,278 2,320 2,405 2,294
80% 2,534 3,064 3,132 3,275
90% 2,049 2,923 3,098 3,233
100+% 510 1,650 1,714 1,828
Totals 11,129 12,617 12,707 12,810
Note. Figures include regular and vocational high schools with 300 or more students.Source: U.S. Department of Education, National Center for Education Statistics. (1998-2015). Public Elementary/Secondary School Universe Surveys.
Number of High Schools by Different Levels of Promoting Power, 2002-2014

Progress and Challenge in Raising High School Graduation Rates Appendices
Annual Update 2016 Building a Grad NationAnnual Update 2016 Building a Grad Nation 67
Appendix I: Change of High Schools with Promoting Power of 60 Percent or Less by Locale, 2002-2014
Locale
Num
ber
of H
Igh
Sch
ools
Cities Suburbs Towns Rural
2002 2012 2013 2014
905
714
619582
477
267 242 229 247
123 119 94
378
255
166137
0
100
200
300
400
500
600
700
800
900
1000
166
267
378
477
582
Change of High Schools with Promoting Power of 60 Percent or Less by Locale, 2002-2014
Class Cities Suburbs Towns Rural
2002 905 477 247 378
2012 714 267 123 255
2013 619 242 119 166
2014 582 229 94 137
Change from 2002 to 2013
Change (N) -323 -248 -153 -241
Change (%) -36% -52% -62% -64%
Note: In 2006, NCES changed the definition of “Rural” from population size, to proximity to urban areas referred to as the “urban-centric” classification system.Source: U.S. Department of Education, National Center for Education Statistics. (1998-2015). Public Elementary/Secondary School Universe Surveys.

Appendices Progress and Challenge in Raising High School Graduation Rates
Annual Update 2016 Building a Grad Nation68
Alabama 6 5,383 1.54% 3.27% 5.18% 53.59% 35.24% 0.20% 0.97% 59.39%
Alaska 3 1,263 92.79% 0.48% 0.40% 0.24% 5.62% 0.00% 0.48% 76.41%
Arizona 38 31,952 11.38% 2.42% 34.38% 6.02% 42.56% 0.46% 2.77% 45.83%
Arkansas 16 11,179 0.72% 2.20% 20.99% 36.37% 35.59% 1.00% 3.12% 69.76%
California 95 83,583 0.94% 4.00% 53.17% 12.93% 25.47% 0.64% 2.85% 67.94%
Colorado 26 24,466 0.85% 3.02% 48.48% 7.93% 36.96% 0.29% 2.48% 52.80%
Connecticut 7 7,528 0.08% 2.21% 52.22% 30.71% 12.73% 0.24% 1.82% 80.95%
Delaware 1 330 0.61% 2.12% 12.73% 26.67% 57.88% 0.00% 0.00% 29.39%
District Of Columbia 13 7,429 0.15% 0.26% 7.61% 91.22% 0.54% 0.04% 0.19% 99.48%
Florida 39 42,581 0.43% 1.48% 27.94% 29.47% 37.63% 0.10% 2.95% 66.68%
Georgia 90 98,741 0.18% 2.58% 13.48% 62.61% 18.93% 0.19% 2.04% 81.62%
Hawaii 2 1,303 0.92% 12.43% 5.76% 3.22% 54.18% 14.97% 8.52% 13.74%
Idaho 6 6,155 1.04% 1.15% 11.08% 0.96% 84.40% 0.32% 1.04% 41.92%
Illinois 22 28,625 0.30% 1.33% 31.94% 47.31% 16.58% 0.09% 2.45% 75.74%
Indiana 20 18,724 0.28% 1.00% 10.01% 36.30% 47.82% 0.05% 4.53% 62.07%
Iowa 1 658 0.00% 15.20% 51.22% 4.41% 27.20% 0.91% 1.06% 67.17%
Kansas 8 10,810 0.83% 4.45% 29.12% 12.69% 49.50% 0.15% 3.26% 37.63%
Louisiana 38 32,029 0.59% 1.50% 5.76% 57.79% 33.59% 0.09% 0.67% 70.94%
Maryland 18 13,155 0.30% 1.37% 14.00% 80.27% 3.56% 0.08% 0.43% 74.97%
Massachusetts 23 18,395 0.40% 3.20% 47.58% 30.12% 16.37% 0.21% 2.12% 79.47%
Michigan 22 17,183 0.85% 2.14% 8.27% 45.00% 41.80% 0.13% 1.80% 68.64%
Minnesota 10 7,286 2.44% 3.42% 8.74% 17.40% 66.84% 0.11% 1.04% 47.43%
Mississippi 37 23,381 0.04% 0.33% 0.89% 82.04% 16.43% 0.00% 0.28% 86.42%
Missouri 11 8,606 0.34% 3.31% 13.76% 63.54% 17.22% 0.15% 1.68% 77.21%
Montana 1 543 97.05% 0.00% 1.47% 0.00% 0.55% 0.00% 0.92% 99.45%
Nebraska 1 1,597 1.82% 12.02% 19.79% 14.34% 44.33% 0.06% 7.64% 63.43%
Nevada 17 30,834 0.80% 4.22% 46.33% 15.20% 28.81% 1.26% 3.38% 59.53%
New Hampshire 2 921 0.33% 0.33% 1.63% 1.30% 93.27% 0.22% 2.93% 44.95%
New Jersey 21 20,752 0.06% 1.72% 44.57% 50.65% 2.82% 0.08% 0.10% 79.08%
New York 189 137,762 0.77% 9.12% 42.73% 36.82% 10.01% 0.00% 0.55% 74.62%
Estim
ated
Hig
h Sc
hools
with A
CGR
below
67%
(N)
Asian
Pacifi
c Isla
nder
Estim
ated
Stu
dent
s Enr
ollm
ent
at H
igh
Scho
ols w
ith A
CGR
below
67%
(N)
Am. I
ndian
/Alas
ka N
ative
Whi
te
Hisp
anic
Two
or M
ore
Ethn
icitie
sLo
w-Inco
me
Blac
k
Appendix J: Large High Schools (i.e., 300 or more students) and Student Enrollment by Race/Ethnicity with Adjusted Cohort Graduation Rate (ACGR) 67 Percent or Below, 2014
STATE

Progress and Challenge in Raising High School Graduation Rates Appendices
Annual Update 2016 Building a Grad NationAnnual Update 2016 Building a Grad Nation 69
North Carolina 3 1,957 2.30% 0.66% 33.11% 49.26% 12.06% 0.36% 2.25% 77.67%
North Dakota 2 1,555 32.99% 0.77% 2.70% 3.92% 58.78% 0.19% 0.64% 37.17%
Ohio 55 69,029 0.25% 1.73% 6.07% 35.95% 52.04% 0.07% 3.90% 33.08%
Oklahoma 16 17,947 8.38% 1.89% 21.25% 16.43% 46.29% 0.16% 5.60% 48.96%
Oregon 35 26,204 2.74% 2.30% 17.05% 3.61% 69.26% 0.64% 4.40% 40.12%
Pennsylvania 32 44,157 0.24% 2.01% 18.46% 33.05% 43.44% 0.06% 2.73% 60.25%
Rhode Island 3 3,589 0.78% 5.66% 49.99% 14.41% 25.36% 0.59% 3.23% 73.67%
South Carolina 12 14,667 0.27% 0.70% 6.51% 32.70% 57.69% 0.16% 1.97% 56.04%
South Dakota 1 430 97.91% 0.00% 0.00% 0.00% 1.86% 0.00% 0.23% 98.60%
Tennessee 16 10,788 0.05% 0.39% 7.97% 85.80% 5.32% 0.03% 0.44% 89.16%
Texas 5 4,108 0.56% 3.07% 28.58% 48.88% 18.01% 0.15% 0.75% 70.42%
Utah 7 6,136 0.37% 3.16% 15.94% 2.23% 73.44% 3.52% 1.34% 42.57%
Vermont 1 339 0.29% 0.88% 2.06% 1.18% 93.51% 0.00% 2.06% 51.03%
Virginia 4 2,306 0.13% 0.48% 3.95% 78.06% 16.31% 0.17% 0.91% 71.34%
Washington 14 10,218 1.28% 10.88% 24.09% 9.53% 41.53% 2.81% 9.86% 53.09%
West Virginia 1 721 0.00% 0.55% 0.00% 0.69% 98.61% 0.00% 0.14% 44.11%
Wisconsin 17 16,208 0.90% 3.68% 17.38% 48.22% 28.50% 0.01% 1.30% 67.16%
Wyoming 2 805 1.12% 0.99% 20.12% 0.75% 75.65% 0.25% 1.12% 18.51%
Totals (N) All High Schools in the Sample
12,880 13,900,000 113,874 720,990 3,095,109 2,206,759 7,387,586 50,131 344,592 6,245,495
Totals (N) <67% 1,009 924,318 13,075 32,140 246,166 333,071 276,145 2,771 20,950 604,119
Percent Per Group (%) <67% 1.41% 3.48% 26.63% 36.03% 29.88% 0.30% 2.27% 65.36%
Percent of <67% of the Total Sample 11.48% 4.46% 7.95% 15.09% 3.74% 5.53% 6.08% 44.93%
Note. Figures include regular and vocational high schools with 300 or more students with an Adjusted Cohort Graduation Rate (ACGR, 2014) below 67 percent. Each racial/ethnic group for students attending these schools were divided by the total number of students attending schools that meet the criteria in the previous sentence. Of the schools that reported a school level graduation rate in 2013-14, 1,009 of them had an ACGR below 67 percent. The estimated total enrollment at these schools was 924,318 students. Of the total enrollment of students who attended these schools, 36 percent were Black, 27 percent were Hispanic, 30 percent were White, 3 percent were Asian, 2 percent were reported as having two or more ethnic/racial identities, 1 percent were American Indian or Alaska Native, and .3 percent were Pacific Islander (note. these figures were rounded to the nearest ones place value).Sources: U.S. Department of Education, National Center for Education Statistics. (1998-2015). Public Elementary/Secondary School Universe Surveys. U.S. Department of Education through provisional data file of SY2013-14 School Level Four-Year Regulatory Adjusted Cohort Graduation Rates.
Estim
ated
Hig
h Sc
hools
with A
CGR
below
67%
(N)
Asian
Pacifi
c Isla
nder
Estim
ated
Stu
dent
s Enr
ollm
ent
at H
igh
Scho
ols w
ith A
CGR
below
67%
(N)
Am. I
ndian
/Alas
ka N
ative
Whi
te
Hisp
anic
Two
or M
ore
Ethn
icitie
s
Two
or M
ore
Ethn
icitie
s
Low-In
com
e
Low-In
com
e
Blac
k
Appendix J: Large High Schools (i.e., 300 or more students) and Student Enrollment by Race/Ethnicity with Adjusted Cohort Graduation Rate (ACGR) 67 Percent or Below, 2014
STATE
continued

Appendices Progress and Challenge in Raising High School Graduation Rates
Annual Update 2016 Building a Grad Nation70
ACGR
, 201
4 (%
)
4-Ye
ar (2
011
to
2014
) Pac
e
ACGR
, 201
3 (%
)
ACGR
Cha
nge
2013
to 2
014
(1-y
r pac
e)
ACGR
Cha
nge
2011
to 2
014
Dist
ance
to 9
0
Pace
Nee
ded
to
Get t
o 90
Met 90 percent goal
Iowa 89.7% 90.5% 0.8% 2.5 0.6 -0.5% -0.1%
Met of Exceeded Pace Needed from 2011 to 2014
Alabama 80.0% 86.3% 6.3% 14.3 3.6 3.7% 0.6%
Arkansas 84.9% 86.9% 2.0% 5.9 1.5 3.1% 0.5%
Connecticut 85.5% 87.0% 1.5% 4.0 1.0 3.0% 0.5%
Delaware 80.4% 87.0% 6.6% 9.0 2.3 3.0% 0.5%
Indiana 87.0% 87.9% 0.9% 1.9 0.5 2.1% 0.4%
Kansas 85.7% 85.7% 0.0% 2.7 0.7 4.3% 0.7%
Maine 86.4% 86.5% 0.1% 2.5 0.6 3.5% 0.6%
Maryland 85.0% 86.4% 1.4% 3.4 0.9 3.6% 0.6%
Massachusetts 85.0% 86.1% 1.1% 3.1 0.8 3.9% 0.7%
Missouri 85.7% 87.3% 1.6% 6.3 1.6 2.7% 0.5%
Montana 84.4% 85.4% 1.0% 3.4 0.9 4.6% 0.8%
Nebraska 88.5% 89.7% 1.2% 3.7 0.9 0.3% 0.1%
New Hampshire 87.3% 88.1% 0.8% 2.1 0.5 1.9% 0.3%
New Jersey 87.5% 88.6% 1.1% 5.6 1.4 1.4% 0.2%
North Carolina 82.5% 83.9% 1.4% 5.9 1.5 6.1% 1.0%
Texas 88.0% 88.3% 0.3% 2.3 0.6 1.7% 0.3%
Utah 83.0% 83.9% 0.9% 7.9 2.0 6.1% 1.0%
Virginia 84.5% 85.3% 0.8% 3.3 0.8 4.7% 0.8%
West Virginia 81.4% 84.5% 3.1% 6.5 1.6 5.5% 0.9%
Wisconsin 88.0% 88.6% 0.6% 1.6 0.4 1.4% 0.2%
Off-pace to 90
Alaska 71.8% 71.1% -0.7% 3.1 0.8 18.9% 3.2%
Arizona 75.1% 75.7% 0.6% -2.3 -0.6 14.3% 2.4%
California 80.4% 81.0% 0.6% 5.0 1.3 9.0% 1.5%
Colorado 76.9% 77.3% 0.4% 3.3 0.8 12.7% 2.1%
Florida 75.6% 76.1% 0.5% 5.1 1.3 13.9% 2.3%
Georgia 71.7% 72.5% 0.8% 5.5 1.4 17.5% 2.9%
Hawaii 82.4% 81.8% -0.6% 1.8 0.4 8.2% 1.4%
Louisiana 73.5% 74.6% 1.1% 3.6 0.9 15.4% 2.6%
Michigan 77.0% 78.6% 1.6% 4.6 1.1 11.4% 1.9%
Appendix K: 2014 State On-Pace/Off-Pace to 90 Percent ACGR by Class of 2020
STATE

Progress and Challenge in Raising High School Graduation Rates Appendices
Annual Update 2016 Building a Grad NationAnnual Update 2016 Building a Grad Nation 71
ACGR
, 201
4 (%
)
4-Ye
ar (2
011
to
2014
) Pac
e
ACGR
, 201
3 (%
)
ACGR
Cha
nge
2013
to 2
014
(1-y
r pac
e)
ACGR
Cha
nge
2011
to 2
014
Dist
ance
to 9
0
Pace
Nee
ded
to
Get t
o 90
Pace
Nee
ded
to
Get t
o 90
Appendix K: 2014 State On-Pace/Off-Pace to 90 Percent ACGR by Class of 2020
Off-pace to 90
Minnesota 79.8% 81.2% 1.4% 4.2 1.0 8.8% 1.5%
Nevada 70.7% 70.0% -0.7% 8.0 2.0 20.0% 3.3%
New Mexico 70.3% 68.5% -1.8% 5.5 1.4 21.5% 3.6%
New York 76.8% 77.8% 1.0% 0.8 0.2 12.2% 2.0%
North Dakota 87.5% 87.2% -0.3% 1.2 0.3 2.8% 0.5%
Ohio 82.2% 81.8% -0.4% 1.8 0.4 8.2% 1.4%
Oklahoma 84.8% 82.7% -2.1% n/a n/a 7.3% 1.2%
Pennsylvania 86.0% 85.5% -0.5% 2.5 0.6 4.5% 0.8%
Rhode Island 79.7% 80.8% 1.1% 3.8 0.9 9.2% 1.5%
South Dakota 82.7% 82.7% 0.0% -0.3 -0.1 7.3% 1.2%
Washington 76.4% 78.2% 1.8% 2.2 0.6 11.8% 2.0%
Wyoming 77.0% 78.6% 1.6% -1.4 -0.3 11.4% 1.9%
Met or Exceeded Pace Needed from 2013 to 2014
Illinois 83.2% 86.0% 2.8% 2.0 0.5 4.0% 0.7%
Kentucky 86.1% 87.5% 1.4% 0.0 2.5% 0.4%
Mississippi 75.5% 77.6% 2.1% 2.6 0.6 12.4% 2.1%
Oregon 68.7% 72.0% 3.3% 4.0 1.0 18.0% 3.0%
South Carolina 77.6% 80.0% 2.4% 6.0 1.5 10.0% 1.7%
Tennessee 86.3% 87.2% 0.9% 1.2 0.3 2.8% 0.5%
Vermont 86.6% 87.8% 1.2% 0.8 0.2 2.2% 0.4%
No Pace Data AvailableIdaho 77.3% 77.3% n/a n/a 12.7% 2.1%
Note: Kentucky and Oklahoma first reported ACGR in 2013, so only one-year (2012-13 to 2013-14) pace data is available for these states. Idaho first reported ACGR in 2014, so no pace data is available for this state.Sources: Reproduced from the United States Department of Education (2015). Provisional Data Files: SY2010-11 and SY2013-14 Four-Year Regulatory Adjusted Cohort Graduation Rates.
STATE
continued

Appendices Progress and Challenge in Raising High School Graduation Rates
Annual Update 2016 Building a Grad Nation72
Alabama 10 0% 0% 0% 20% 6%
Alaska 53 11% 2% 0% 32% 56%
Arizona 110 73% 10% 2% 5% 48%
Arkansas 22 5% 0% 0% 18% 13%
California 203 51% 8% 0% 25% 30%
Colorado 94 28% 19% 1% 50% 52%
Connecticut 12 8% 0% 0% 8% 20%
Delaware 10 30% 0% 0% 20% 7%
District Of Columbia 19 47% 0% 0% 11% 83%
Florida 203 28% 5% 2% 49% 41%
Georgia 121 7% 1% 0% 8% 45%
Hawaii 4 100% 0% 0% 0% 3%
Idaho 35 29% 29% 0% 71% 54%
Illinois 29 24% 3% 0% 0% 19%
Indiana 35 60% 17% 0% 3% 30%
Iowa 11 0% 18% 0% 64% 19%
Kansas 16 19% 44% 0% 0% 23%
Kentucky 13 0% 0% 0% 100% 17%
Louisiana 56 18% 2% 2% 14% 33%
Maine 1 0% 0% 0% 0% 1%
Maryland 36 8% 3% 3% 31% 24%
Massachusetts 41 12% 0% 5% 10% 34%
Michigan 180 18% 7% 0% 58% 41%
Minnesota 63 30% 14% 2% 46% 40%
Mississippi 43 0% 0% 0% 0% 31%
Missouri 19 21% 0% 5% 0% 19%
Montana 6 0% 0% 0% 0% 10%
Nebraska 3 0% 0% 0% 0% 7%
Nevada 32 28% 13% 0% 28% 46%
New Hampshire 3 33% 33% 0% 0% 6%
Virtu
al Sc
hool
% o
f Non
-Gra
duat
es
Com
ing
from
Sch
ools
At o
r Belo
w 67%
ACGR
- 20
14
Num
ber o
f Sch
ools
At o
r Belo
w 67%
ACGR
- 20
14
Char
ter S
choo
l
Voca
tiona
l Sch
ool
Alte
rnat
ive S
choo
l
Appendix L: ESSA High Schools (i.e., 100 or more students) with ACGR 67 Percent or Below, by State and Type, 2014
STATE

Progress and Challenge in Raising High School Graduation Rates Appendices
Annual Update 2016 Building a Grad NationAnnual Update 2016 Building a Grad Nation 73
Virtu
al Sc
hool
% o
f Non
-Gra
duat
es
Com
ing
from
Sch
ools
At o
r Belo
w 67%
ACGR
- 20
14
% o
f Non
-Gra
duat
es
Com
ing
from
Sch
ools
At o
r Belo
w 67%
ACGR
- 20
14
Num
ber o
f Sch
ools
At o
r Belo
w 67%
ACGR
- 20
14
Char
ter S
choo
l
Voca
tiona
l Sch
ool
Alte
rnat
ive S
choo
l
Appendix L: ESSA High Schools (i.e., 100 or more students) with ACGR 67 Percent or Below, by State and Type, 2014
New Jersey 27 0% 0% 11% 7% 26%
New York 276 4% 0% 4% 8% 54%
North Carolina 11 18% 0% 0% 55% 3%
North Dakota 6 0% 0% 0% 0% 28%
Ohio 135 59% 15% 0% 3% 57%
Oklahoma 25 12% 8% 0% 4% 25%
Oregon 63 33% 13% 0% 16% 40%
Pennsylvania 50 46% 22% 4% 2% 30%
Rhode Island 4 25% 0% 0% 0% 25%
South Carolina 18 33% 28% 0% 0% 17%
South Dakota 6 0% 17% 0% 33% 23%
Tennessee 28 4% 4% 0% 0% 23%
Texas 84 44% 1% 0% 88% 19%
Utah 26 31% 19% 0% 54% 32%
Vermont 2 0% 0% 0% 0% 8%
Virginia 10 0% 0% 0% 60% 5%
Washington 98 0% 3% 0% 72% 37%
West Virginia 1 0% 0% 0% 0% 2%
Wisconsin 37 41% 16% 0% 30% 33%
Wyoming 7 0% 0% 0% 29% 24%
United States 2397 26% 8% 1% 28% 33%
Note: Schools In The Above Table Are Those That Contain 100 Or More Students. There Is Overlap Between Categories Based On Required Reporting By Nces. Alternative Schools Include All District, Charter, And Virtual Schools With An “Alternative” Schools Mission (I.E., Not Regular, Special Education, Or Vocational). Charter And Virtual Schools Are Also Included Within The Vocational School Category Where Applicable.Sources: U.S. Department Of Education, National Center For Education Statistics. (1998-2015). Public Elementary/Secondary School Universe Surveys. U.S. Department Of Education Through Provisional Data File Of Sy2013-14 School Level Four-Year Regulatory Adjusted Cohort Graduation Rates.
STATE
continued

Appendices Progress and Challenge in Raising High School Graduation Rates
Annual Update 2016 Building a Grad Nation74
Appendix M: Number of Non-Graduates by State and School Type, 2014
Alabama 6,959 0% 0% 0% 1% 99%
Alaska 2,338 6% 5% 0% 38% 60%
Arizona 16,885 37% 10% 1% 2% 97%
Arkansas 4,192 4% 0% 0% 5% 95%
California 46,254 24% 2% 0% 7% 92%
Colorado 13,013 18% 12% 1% 30% 69%
Connecticut 4,179 1% 0% 2% 1% 97%
Delaware 1,146 3% 0% 5% 2% 90%
District of Columbia 1,601 29% 0% 0% 9% 91%
Florida 43,243 20% 1% 1% 29% 69%
Georgia 30,071 9% 0% 0% 3% 93%
Hawaii 2,323 5% 0% 0% 0% 100%
Idaho 4,820 25% 25% 0% 35% 65%
Illinois 21,120 10% 0% 0% 0% 100%
Indiana 9,126 19% 7% 0% 0% 100%
Iowa 2,720 0% 1% 0% 15% 85%
Kansas 4,401 5% 11% 0% 0% 100%
Kentucky 4,664 0% 0% 0% 18% 82%
Louisiana 9,992 6% 1% 0% 6% 93%
Maine 1,775 0% 0% 0% 0% 100%
Maryland 8,283 4% 1% 3% 8% 88%
Massachusetts 8,941 4% 0% 7% 2% 90%
Michigan 15,984 10% 4% 0% 29% 67%
Minnesota 8,422 16% 11% 0% 19% 80%
Mississippi 7,018 0% 0% 0% 0% 100%
Missouri 6,650 5% 0% 0% 0% 98%
Montana 1,493 0% 0% 0% 0% 100%
Nebraska 2,265 0% 0% 0% 0% 100%
Num
ber o
f Non
-Gra
duat
es
in A
CGR
Coho
rt - 2
014
Char
ter S
choo
l
Virtu
al Sc
hool
Voca
tiona
l Sch
ool
Alte
rnat
ive S
choo
l
Regu
lar S
choo
l
STATE

Progress and Challenge in Raising High School Graduation Rates Appendices
Annual Update 2016 Building a Grad NationAnnual Update 2016 Building a Grad Nation 75
Appendix M: Number of Non-Graduates by State and School Type, 2014
Nevada 7,438 11% 4% 0% 12% 87%
New Hampshire 1,608 1% 1% 0% 0% 100%
New Jersey 11,563 1% 0% 3% 1% 96%
New York 41,785 1% 0% 5% 5% 90%
North Carolina 13,884 2% 0% 0% 2% 98%
North Dakota 848 0% 0% 0% 0% 100%
Ohio 23,248 43% 26% 0% 1% 98%
Oklahoma 7,248 7% 5% 0% 2% 98%
Oregon 10,107 14% 6% 0% 11% 89%
Pennsylvania 16,060 21% 14% 2% 0% 97%
Rhode Island 1,826 5% 0% 5% 2% 93%
South Carolina 10,028 11% 10% 0% 0% 100%
South Dakota 1,083 0% 2% 0% 11% 89%
Tennessee 8,432 1% 0% 0% 0% 99%
Texas 32,093 10% 1% 0% 20% 79%
Utah 6,662 8% 4% 0% 26% 74%
Vermont 760 0% 0% 0% 0% 100%
Virginia 13,652 0% 0% 0% 3% 97%
Washington 16,609 0% 1% 0% 27% 73%
West Virginia 3,024 0% 0% 0% 0% 100%
Wisconsin 6,951 10% 5% 0% 9% 91%
Wyoming 1,259 0% 0% 0% 13% 87%
United States 526,046 12% 4% 1% 10% 89%
Note: Schools in the above table are those that contain 100 or more students. There is overlap between categories based on required reporting by NCES. Regular schools include all district, charter, and virtual schools with a “regular” schools mission (i.e., not alternative, special education, or vocational). Charter and virtual schools are also included within the alternative and vocational school categories where applicable.Sources: U.S. Department of Education, National Center for Education Statistics. (1998-2015). Public Elementary/Secondary School Universe Surveys. U.S. Department of Education through provisional data file of SY2013-14 School Level Four-Year Regulatory Adjusted Cohort Graduation Rates.
Num
ber o
f Non
-Gra
duat
es
in A
CGR
Coho
rt - 2
014
Char
ter S
choo
l
Virtu
al Sc
hool
Voca
tiona
l Sch
ool
Alte
rnat
ive S
choo
l
Regu
lar S
choo
l
Regu
lar S
choo
l
STATE
continued

Appendices Progress and Challenge in Raising High School Graduation Rates
Annual Update 2016 Building a Grad Nation76
Alabama 7 359 2% 0 0 0 0
Alaska 31 95 33% 4 4 100% 0 0
Arizona 24 207 12% 67 149 45% 11 11 100%
Arkansas 18 265 7% 0 12 0% 0 0
California 31 996 3% 89 318 28% 15 17 88%
Colorado 19 247 8% 11 38 29% 16 17 94%
Connecticut 10 166 6% 1 5 20% 0 0
Delaware 0 25 0% 2 4 50% 0 0
District Of Columbia 8 14 57% 9 17 53% 0 0
Florida 34 447 8% 12 69 17% 10 17 59%
Georgia 101 400 25% 4 15 27% 1 1 100%
Hawaii 0 42 0% 4 14 29% 0 0
Idaho 2 123 2% 1 14 7% 7 8 88%
Illinois 22 621 4% 6 24 25% 1 1 100%
Indiana 12 353 3% 16 30 53% 6 7 86%
Iowa 1 313 0% 0 0 2 2 100%
Kansas 7 279 3% 1 1 100% 7 7 100%
Kentucky 0 223 0% 0 0 0 0
Louisiana 38 274 14% 7 13 54% 1 2 50%
Maine 1 104 1% 0 0 0 0
Maryland 14 189 7% 3 10 30% 0 0
Massachusetts 28 271 10% 5 30 17% 0 0
Michigan 21 575 4% 16 75 21% 6 7 86%
Minnesota 9 352 3% 11 35 31% 9 9 100%
Mississippi 43 247 17% 0 0 0 0
Missouri 12 447 3% 3 9 33% 0 0
Montana 6 81 7% 0 0 0 0
Appendix N: Number and Percentage of Regular High Schools by Type (District, Charter, Virtual), 2014
Regu
lar D
istric
t Hig
h
Scho
ols b
elow 6
7%To
tal R
egul
ar D
istric
t
High
Sch
ools
% R
egul
ar D
istric
t Hig
h
Scho
ols b
elow 6
7%Re
gular
Cha
rter
High
Sch
ools
below
67%
Tota
l Reg
ular
Cha
rter
High
Sch
ools
% R
egul
ar C
harte
r
Scho
ols b
elow 6
7%Re
gular
Virtu
al Hi
gh
Scho
ols b
elow 6
7%To
tal R
egul
ar Vi
rtual
High
Sch
ools
% R
egul
ar Vi
rtual
Scho
ols b
elow 6
7%
Regular District High Schools Regular Charter High Schools Regular Virtual High Schools
STATE

Progress and Challenge in Raising High School Graduation Rates Appendices
Annual Update 2016 Building a Grad NationAnnual Update 2016 Building a Grad Nation 77
Nebraska 3 193 2% 0 0 0 0
Nevada 10 84 12% 6 13 46% 3 4 75%
New Hampshire 2 78 3% 0 2 0% 1 1 100%
New Jersey 22 348 6% 0 15 0% 0 0
New York 229 1077 21% 8 35 23% 0 0
North Carolina 3 468 1% 2 31 6% 0 0
North Dakota 6 82 7% 0 0 0 0
Ohio 47 723 7% 56 73 77% 19 19 100%
Oklahoma 21 320 7% 1 8 13% 2 2 100%
Oregon 31 200 16% 14 35 40% 8 9 89%
Pennsylvania 22 580 4% 13 56 23% 11 14 79%
Rhode Island 3 42 7% 1 5 20% 0 0
South Carolina 11 198 6% 1 10 10% 5 5 100%
South Dakota 4 70 6% 0 0 0 0
Tennessee 22 324 7% 1 8 13% 1 2 50%
Texas 6 1251 0% 2 65 3% 0 0
Utah 2 107 2% 4 26 15% 5 5 100%
Vermont 2 61 3% 0 0 0 0
Virginia 4 315 1% 0 1 0% 0 0
Washington 25 330 8% 0 0 1 1 100%
West Virginia 1 114 1% 0 0 0 0
Wisconsin 11 398 3% 9 26 35% 6 10 60%
Wyoming 5 54 9% 0 0 0 0
Totals And National Averages: 991 15132 7% 390 1295 30% 154 178 87%
Note: These Calculations Include Only Those High Schools With Enrollment Of 100 Or More Students.Sources: U.S. Department Of Education, National Center For Education Statistics. (1998-2015). Public Elementary/Secondary School Universe Surveys. U.S. Department Of Education Through Provisional Data File Of Sy2013-14 School Level Four-Year Regulatory Adjusted Cohort Graduation Rates.
Appendix N: Number and Percentage of Regular High Schools by Type (District, Charter, Virtual), 2014 Appendix N: Number and Percentage of Regular High Schools by Type (District, Charter, Virtual), 2014
Regu
lar D
istric
t Hig
h
Scho
ols b
elow 6
7%To
tal R
egul
ar D
istric
t
High
Sch
ools
% R
egul
ar D
istric
t Hig
h
Scho
ols b
elow 6
7%Re
gular
Cha
rter
High
Sch
ools
below
67%
Tota
l Reg
ular
Cha
rter
High
Sch
ools
% R
egul
ar C
harte
r
Scho
ols b
elow 6
7%Re
gular
Virtu
al Hi
gh
Scho
ols b
elow 6
7%To
tal R
egul
ar Vi
rtual
High
Sch
ools
% R
egul
ar Vi
rtual
Scho
ols b
elow 6
7%
% R
egul
ar Vi
rtual
Scho
ols b
elow 6
7%
Regular District High Schools Regular Charter High Schools Regular Virtual High Schools
STATE
continued
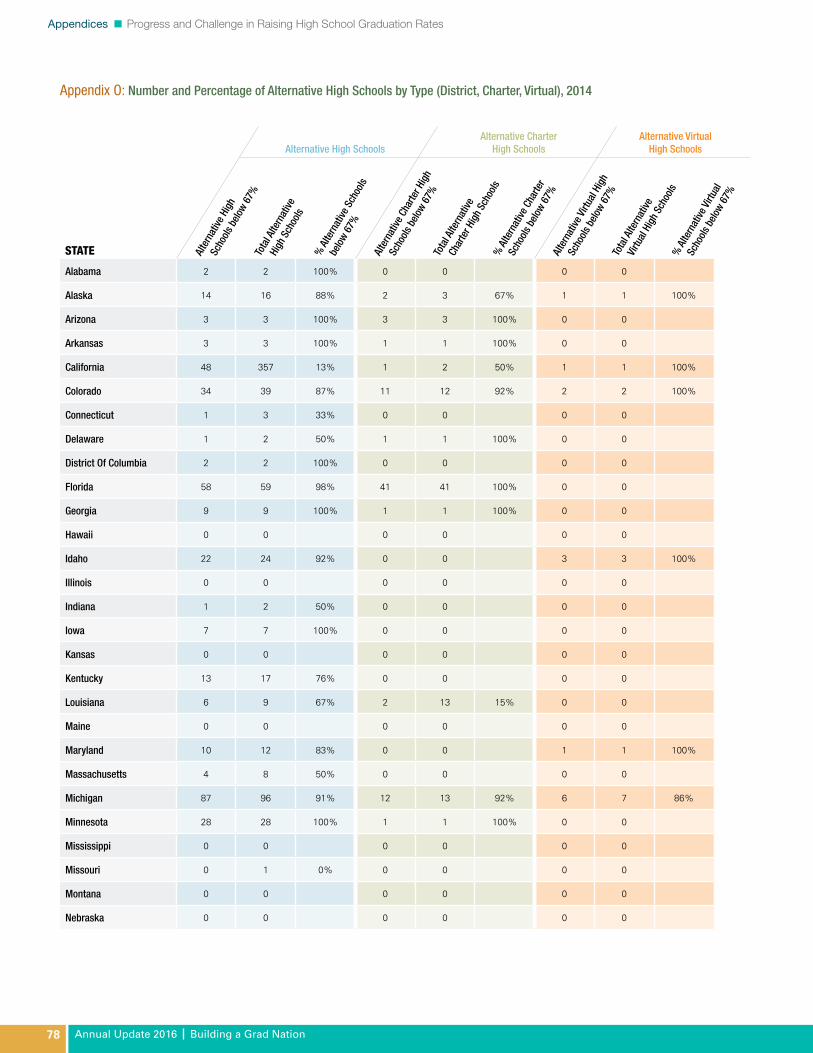
Appendices Progress and Challenge in Raising High School Graduation Rates
Annual Update 2016 Building a Grad Nation78
Appendix O: Number and Percentage of Alternative High Schools by Type (District, Charter, Virtual), 2014
Alabama 2 2 100% 0 0 0 0
Alaska 14 16 88% 2 3 67% 1 1 100%
Arizona 3 3 100% 3 3 100% 0 0
Arkansas 3 3 100% 1 1 100% 0 0
California 48 357 13% 1 2 50% 1 1 100%
Colorado 34 39 87% 11 12 92% 2 2 100%
Connecticut 1 3 33% 0 0 0 0
Delaware 1 2 50% 1 1 100% 0 0
District Of Columbia 2 2 100% 0 0 0 0
Florida 58 59 98% 41 41 100% 0 0
Georgia 9 9 100% 1 1 100% 0 0
Hawaii 0 0 0 0 0 0
Idaho 22 24 92% 0 0 3 3 100%
Illinois 0 0 0 0 0 0
Indiana 1 2 50% 0 0 0 0
Iowa 7 7 100% 0 0 0 0
Kansas 0 0 0 0 0 0
Kentucky 13 17 76% 0 0 0 0
Louisiana 6 9 67% 2 13 15% 0 0
Maine 0 0 0 0 0 0
Maryland 10 12 83% 0 0 1 1 100%
Massachusetts 4 8 50% 0 0 0 0
Michigan 87 96 91% 12 13 92% 6 7 86%
Minnesota 28 28 100% 1 1 100% 0 0
Mississippi 0 0 0 0 0 0
Missouri 0 1 0% 0 0 0 0
Montana 0 0 0 0 0 0
Nebraska 0 0 0 0 0 0
Alte
rnat
ive H
igh
Scho
ols b
elow 6
7%To
tal A
ltern
ative
High
Sch
ools
% A
ltern
ative
Sch
ools
below
67%
Alte
rnat
ive C
harte
r Hig
h
Scho
ols b
elow 6
7%To
tal A
ltern
ative
Char
ter H
igh
Scho
ols%
Alte
rnat
ive C
harte
r
Scho
ols b
elow 6
7%Al
tern
ative
Virtu
al Hi
gh
Scho
ols b
elow 6
7%To
tal A
ltern
ative
Virtu
al Hi
gh S
choo
ls%
Alte
rnat
ive Vi
rtual
Scho
ols b
elow 6
7%
Alternative High Schools Alternative Charter
High Schools Alternative Virtual
High Schools
STATE

Progress and Challenge in Raising High School Graduation Rates Appendices
Annual Update 2016 Building a Grad NationAnnual Update 2016 Building a Grad Nation 79
Appendix O: Number and Percentage of Alternative High Schools by Type (District, Charter, Virtual), 2014
Nevada 8 9 89% 0 0 1 1 100%
New Hampshire 0 0 0 0 0 0
New Jersey 2 2 100% 0 0 0 0
New York 19 20 95% 2 2 100% 0 0
North Carolina 6 13 46% 0 0 0 0
North Dakota 0 0 0 0 0 0
Ohio 4 4 100% 0 0 0 0
Oklahoma 1 1 100% 0 0 0 0
Oregon 10 13 77% 0 0 0 0
Pennsylvania 1 1 100% 0 0 0 0
Rhode Island 0 1 0% 0 2 0% 0 0
South Carolina 0 0 0 0 0 0
South Dakota 1 1 100% 0 0 1 1 100%
Tennessee 0 1 0% 0 0 0 0
Texas 39 56 70% 34 58 59% 1 1 100%
Utah 14 16 88% 0 1 0% 0 0
Vermont 0 0 0 0 0 0
Virginia 6 6 100% 0 0 0 0
Washington 69 95 73% 0 0 2 3 67%
West Virginia 0 0 0 0 0 0
Wisconsin 11 15 73% 0 1 0% 0 0
Wyoming 2 3 67% 0 0 0 0
Totals And National Averages: 546 956 57% 112 155 72% 19 21 90%
Note: These Calculations Include Only Those High Schools With Enrollment Of 100 Or More Students.Sources: U.S. Department Of Education, National Center For Education Statistics. (1998-2015). Public Elementary/Secondary School Universe Surveys. U.S. Department Of Education Through Provisional Data File Of Sy2013-14 School Level Four-Year Regulatory Adjusted Cohort Graduation Rates.
Alte
rnat
ive H
igh
Scho
ols b
elow 6
7%To
tal A
ltern
ative
High
Sch
ools
% A
ltern
ative
Sch
ools
below
67%
Alte
rnat
ive C
harte
r Hig
h
Scho
ols b
elow 6
7%To
tal A
ltern
ative
Char
ter H
igh
Scho
ols%
Alte
rnat
ive C
harte
r
Scho
ols b
elow 6
7%Al
tern
ative
Virtu
al Hi
gh
Scho
ols b
elow 6
7%To
tal A
ltern
ative
Virtu
al Hi
gh S
choo
ls
% A
ltern
ative
Virtu
al
Scho
ols b
elow 6
7%
% A
ltern
ative
Virtu
al
Scho
ols b
elow 6
7%
Alternative High Schools Alternative Charter
High Schools Alternative Virtual
High Schools
STATE
continued

Appendices Progress and Challenge in Raising High School Graduation Rates
Annual Update 2016 Building a Grad Nation80
Appendix P: Number and Percentage of Special Education High Schools by Type (District, Charter, Virtual), 2014
Alabama 1 1 100% 0 0 0 0
Alaska 1 1 100% 0 0 0 0
Arizona 0 0 0 0 0 0
Arkansas 0 0 0 0 0 0
California 18 18 100% 0 0 0 0
Colorado 0 0 0 0 0 0
Connecticut 0 1 0% 0 0 0 0
Delaware 6 6 100% 0 0 0 0
District Of Columbia 0 0 0 0 0 0
Florida 40 41 98% 4 5 80% 0 0
Georgia 3 3 100% 2 3 67% 0 0
Hawaii 0 0 0 0 0 0
Idaho 0 0 0 0 0 0
Illinois 0 0 0 0 0 0
Indiana 0 0 0 0 0 0
Iowa 1 1 100% 0 0 0 0
Kansas 1 1 100% 0 0 0 0
Kentucky 0 1 0% 0 0 0 0
Louisiana 1 1 100% 0 0 0 0
Maine 0 1 0% 0 0 0 0
Maryland 7 7 100% 0 0 0 0
Massachusetts 2 3 67% 0 0 0 0
Michigan 32 37 86% 0 0 0 0
Minnesota 3 5 60% 1 1 100% 0 0
Mississippi 0 0 0 0 0 0
Missouri 3 3 100% 0 0 0 0
Montana 0 0 0 0 0 0
Nebraska 0 0 0 0 0 0
Spec
ial E
duca
tion
High
Sch
ools
below
67%
Tota
l Spe
cial E
duca
tion
High
Sch
ools
% S
pecia
l Edu
catio
n
Scho
ols b
elow 6
7%Sp
ecial
Edu
catio
n Ch
arte
r
High
Sch
ools
below
67%
Tota
l Spe
cial E
duca
tion
Char
ter H
igh
Scho
ols%
Spe
cial E
duca
tion
Char
ter S
choo
ls be
low 6
7%Sp
ecial
Edu
catio
n Virt
ual
High
Sch
ools
below
67%
Tota
l Spe
cial E
duca
tion
Virtu
al Hi
gh S
choo
ls%
Spe
cial E
duca
tion
Virtu
al Sc
hools
belo
w 67
%
Special Education Charter High Schools
Special Education Virtual High Schools
STATE
Special Education High Schools

Progress and Challenge in Raising High School Graduation Rates Appendices
Annual Update 2016 Building a Grad NationAnnual Update 2016 Building a Grad Nation 81
Appendix P: Number and Percentage of Special Education High Schools by Type (District, Charter, Virtual), 2014
Nevada 4 4 100% 0 0 0 0
New Hampshire 0 0 0 0 0 0
New Jersey 0 0 0 0 0 0
New York 7 8 88% 0 0 0 0
North Carolina 0 1 0% 0 0 0 0
North Dakota 0 0 0 0 0 0
Ohio 3 3 100% 5 9 56% 1 1 100%
Oklahoma 0 0 0 0 0 0
Oregon 0 0 0 0 0 0
Pennsylvania 1 2 50% 0 0 0 0
Rhode Island 0 0 0 0 0 0
South Carolina 1 1 100% 0 0 0 0
South Dakota 0 0 0 0 0 0
Tennessee 4 5 80% 0 0 0 0
Texas 2 2 100% 0 0 0 0
Utah 0 0 1 1 100% 0 0
Vermont 0 0 0 0 0 0
Virginia 0 0 0 0 0 0
Washington 1 1 100% 0 0 0 0
West Virginia 0 0 0 0 0 0
Wisconsin 0 0 0 0 0 0
Wyoming 0 0 0 0 0 0
Totals And National Averages:
142 158 90% 13 19 68% 1 1 100%
Note: These Calculations Include Only Those High Schools With Enrollment Of 100 Or More Students.Sources: U.S. Department Of Education, National Center For Education Statistics. (1998-2015). Public Elementary/Secondary School Universe Surveys. U.S. Department Of Education Through Provisional Data File Of Sy2013-14 School Level Four-Year Regulatory Adjusted Cohort Graduation Rates.
Spec
ial E
duca
tion
High
Sch
ools
below
67%
Tota
l Spe
cial E
duca
tion
High
Sch
ools
% S
pecia
l Edu
catio
n
Scho
ols b
elow 6
7%Sp
ecial
Edu
catio
n Ch
arte
r
High
Sch
ools
below
67%
Tota
l Spe
cial E
duca
tion
Char
ter H
igh
Scho
ols%
Spe
cial E
duca
tion
Char
ter S
choo
ls be
low 6
7%Sp
ecial
Edu
catio
n Virt
ual
High
Sch
ools
below
67%
Tota
l Spe
cial E
duca
tion
Virtu
al Hi
gh S
choo
ls
% S
pecia
l Edu
catio
n
Virtu
al Sc
hools
belo
w 67
%
% S
pecia
l Edu
catio
n
Virtu
al Sc
hools
belo
w 67
%
Special Education High Schools
Special Education Charter High Schools
Special Education Virtual High Schools
STATE
continued

Appendices Progress and Challenge in Raising High School Graduation Rates
Annual Update 2016 Building a Grad Nation82
Appendix Q: Number and Percentage of Vocational High Schools by Type (District, Charter, Virtual), 2014
Alabama 0 0 0 0 0 0
Alaska 0 2 0% 0 0 0 0
Arizona 1 2 50% 1 1 100% 0 0
Arkansas 0 0 0 0 0 0
California 0 1 0% 0 1 0% 0 0
Colorado 1 2 50% 0 0 0 0
Connecticut 0 16 0% 0 0 0 0
Delaware 0 6 0% 0 0 0 0
District Of Columbia 0 1 0% 0 0 0 0
Florida 4 8 50% 0 0 0 0
Georgia 0 0 – 0 0 0 0
Hawaii 0 0 0 0 0 0
Idaho 0 0 0 0 0 0
Illinois 0 0 0 0 0 0
Indiana 0 0 0 0 0 0
Iowa 0 0 0 0 0 0
Kansas 0 0 0 0 0 0
Kentucky 0 0 0 0 0 0
Louisiana 1 2 50% 0 0 0 0
Maine 0 0 0 0 0 0
Maryland 1 12 8% 0 0 0 0
Massachusetts 2 39 5% 0 0 0 0
Michigan 0 1 0% 0 0 0 0
Minnesota 1 1 100% 0 0 0 0
Mississippi 0 0 0 0 0 0
Missouri 0 2 0% 1 1 100% 0 0
Montana 0 0 0 0 0 0
Nebraska 0 0 0 0 0 0
Voca
tiona
l Hig
h
Scho
ols b
elow 6
7%To
tal V
ocat
ional
High
Sch
ools
% Vo
catio
nal S
choo
ls
below
67%
Voca
tiona
l Cha
rter H
igh
Scho
ols b
elow 6
7%To
tal V
ocat
ional
Char
ter H
igh
Scho
ols%
Voca
tiona
l Cha
rter
Scho
ols b
elow 6
7%Vo
catio
nal V
irtua
l Hig
h
Scho
ols b
elow 6
7%To
tal V
ocat
ional
Virtu
al
High
Sch
ools
% Vo
catio
nal V
irtua
l
Scho
ols b
elow 6
7%
Vocational High Schools Vocational Charter
High Schools Vocational Virtual
High Schools
STATE

Progress and Challenge in Raising High School Graduation Rates Appendices
Annual Update 2016 Building a Grad NationAnnual Update 2016 Building a Grad Nation 83
Appendix Q: Number and Percentage of Vocational High Schools by Type (District, Charter, Virtual), 2014
Nevada 0 1 0% 0 0 0 0
New Hampshire 0 0 0 0 0 0
New Jersey 3 39 8% 0 0 0 0
New York 11 23 48% 0 0 0 0
North Carolina 0 1 0% 0 0 0 0
North Dakota 0 0 0 0 0 0
Ohio 0 2 0% 0 0 0 0
Oklahoma 0 0 0 0 0 0
Oregon 0 0 0 0 0 0
Pennsylvania 2 18 11% 0 1 0% 0 0
Rhode Island 0 3 0% 0 1 0% 0 0
South Carolina 0 0 0 0 0 0
South Dakota 0 0 0 0 0 0
Tennessee 0 0 0 1 0% 0 0
Texas 0 0 0 0 0 0
Utah 0 0 0 0 0 0
Vermont 0 0 0 0 0 0
Virginia 0 0 0 0 0 0
Washington 0 0 0 0 0 0
West Virginia 0 0 0 0 0 0
Wisconsin 0 1 0% 0 0 0 0
Wyoming 0 0 0 0 0 0
Totals And National Averages: 27 183 15% 2 6 33% 0 0 0%
Voca
tiona
l Hig
h
Scho
ols b
elow 6
7%To
tal V
ocat
ional
High
Sch
ools
% Vo
catio
nal S
choo
ls
below
67%
Voca
tiona
l Cha
rter H
igh
Scho
ols b
elow 6
7%To
tal V
ocat
ional
Char
ter H
igh
Scho
ols%
Voca
tiona
l Cha
rter
Scho
ols b
elow 6
7%Vo
catio
nal V
irtua
l Hig
h
Scho
ols b
elow 6
7%To
tal V
ocat
ional
Virtu
al
High
Sch
ools
% Vo
catio
nal V
irtua
l
Scho
ols b
elow 6
7%
% Vo
catio
nal V
irtua
l
Scho
ols b
elow 6
7%
Vocational High Schools Vocational Charter
High Schools Vocational Virtual
High Schools
STATE
continued
Note: These Calculations Include Only Those High Schools With Enrollment Of 100 Or More Students.Sources: U.S. Department Of Education, National Center For Education Statistics. (1998-2015). Public Elementary/Secondary School Universe Surveys. U.S. Department Of Education Through Provisional Data File Of Sy2013-14 School Level Four-Year Regulatory Adjusted Cohort Graduation Rates.

Appendices Progress and Challenge in Raising High School Graduation Rates
Annual Update 2016 Building a Grad Nation84
Appendix R: Four-Year Adjusted Cohort Graduation Rate (ACGR) Data Links, by State
Department Link to Main Website Link to ACGR Data
Alabama Alabama State Department of Education
http://www.alsde.edu/home/Default.aspxhttp://www.alsde.edu/dept/data/Pages/graduationrate-all.
aspx
AlaskaAlaska Department of Education & Early Development
http://www.eed.state.ak.us/ http://www.eed.state.ak.us/stats/
Arizona Arizona Department of Education
http://www.azed.gov/ http://www.azed.gov/research-evaluation/graduation-rates/
Arkansas Arkansas Department of Education
http://www.arkansased.org/http://www.arkansased.org/divisions/public-school-accountability/school-performance/graduation-rate
California California Department of Education
http://www.cde.ca.gov/ http://www.cde.ca.gov/ds/sd/sd/filesgrads.asp
Colorado Colorado Department of Education
http://www.cde.state.co.us/index_home.htm http://www.cde.state.co.us/cdereval/gradcurrent
Connecticut Connecticut State Department of Education
http://www.sde.ct.gov/sde/site/default.asphttp://www.sde.ct.gov/sde/cwp/view.
asp?a=2758&q=334898
Delaware Delaware Department of Education
http://www.doe.k12.de.us/http://profiles.doe.k12.de.us/SchoolProfiles/State/Account.
aspx
Florida Florida Department of Education
http://www.fldoe.org/default.asp http://www.fldoe.org/eias/eiaspubs/pubstudent.asp
Georgia Georgia Department of Education
http://www.doe.k12.ga.us/Pages/Home.aspxhttp://www.gadoe.org/External-Affairs-and-Policy/
communications/Pages/PressReleaseDetails.aspx?PressView=default&pid=147
Hawaii Hawaii State Department of Education
http://doe.k12.hi.us/ http://arch.k12.hi.us/school/nclb/nclb.html#
Idaho Idaho State Department of Education
http://www.sde.idaho.gov/ https://apps.sde.idaho.gov/Accountability/ReportCard
Illinois Illinois State Board of Education
http://www.isbe.net/ http://www.isbe.net/assessment/report_card.htm
Indiana Indiana State Department of Education
http://www.doe.in.gov/ http://www.doe.in.gov/accountability/graduation-cohort-rate
Iowa Iowa Department of Education
http://educateiowa.gov/ https://www.educateiowa.gov/education-statistics
Kansas Kansas State Department of Education
http://www.ksde.org/ http://online.ksde.org/rcard/
Kentucky Kentucky Department of Education
http://education.ky.gov/Pages/default.aspx http://applications.education.ky.gov/SRC/DataSets.aspx
Louisiana Louisiana Department of Education
http://www.doe.state.la.us/http://www.louisianabelieves.com/docs/data-management/
cohort-graduation-rates-(2006-2012).pdf?sfvrsn=2
Maine Maine Department of Education
http://www.maine.gov/doe/ http://www.maine.gov/education/gradrates/gradrates.html
Maryland Maryland State Department of Education
http://www.marylandpublicschools.org/MSDEhttp://reportcard.msde.maryland.gov/Entity.
aspx?WDATA=State
MassachusettsMassachusetts Department of Elementary & Secondary Education
http://www.doe.mass.edu/(1) http://www.doe.mass.edu/infoservices/reports/gradrates/ (2) http://profiles.doe.mass.edu/state_report/gradrates.aspx
Michigan Michigan Department of Education
http://michigan.gov/mdehttps://www.mischooldata.org/Other/DataFiles/
StudentCounts/HistoricalGradDropout.aspx
Minnesota Minnesota Department of Education
https://education.state.mn.us/MDE/index.html
(1)http://w20.education.state.mn.us/MDEAnalytics/Data.jsp (2)http://education.state.mn.us/mdeprod/idcplg?IdcSer-vice=GET_FILE&dDocName=054257&RevisionSelection-
Method=latest&Rendition=primary
Mississippi Mississippi Department of Education
http://www.mde.k12.ms.us/mde-homehttp://www.mde.k12.ms.us/dropout-prevention-and-
compulsory-school-attendance/dropout-graduation-rate-information
MissouriMissouri Department of Elementary & Secondary Education
http://mcds.dese.mo.gov/Pages/default.aspxhttp://mcds.dese.mo.gov/guidedinquiry/Pages/District-and-
School-Information.aspx
STATE

Progress and Challenge in Raising High School Graduation Rates Appendices
Annual Update 2016 Building a Grad NationAnnual Update 2016 Building a Grad Nation 85
Appendix R: Four-Year Adjusted Cohort Graduation Rate (ACGR) Data Links, by Statecontinued
Department Link to Main Website Link to ACGR Data
Montana Montana Office of Public Instruction
http://opi.mt.gov/(1) http://opi.mt.gov/Reports&Data/Measurement/Index.html
(2) http://opi.mt.gov/pdf/Measurement/
Nebraska Nebraska Department of Education
http://www.education.ne.gov/http://www.education.ne.gov/ndepress/2014/High_School_
Graduation_Rate_Hits_Record_High.pdf
Nevada Nevada Department of Education
http://www.doe.nv.gov/ http://www.nevadareportcard.com/di/main/cohort
New Hampshire New Hampshire Department of Education
http://www.education.nh.gov/ http://www.education.nh.gov/data/dropouts.htm
New Jersey State of New Jersey Department of Education
http://www.state.nj.us/education/ http://www.state.nj.us/education/data/grate/
New Mexico New Mexico Public Education Department
http://ped.state.nm.us/ped/index.html http://ped.state.nm.us/ped/Graduation_data.html
New York New York State Education Department
http://www.nysed.gov/ http://data.nysed.gov/
North CarolinaNorth Carolina State Board of Education, Department of Public Instruction
http://www.ncpublicschools.org/organization/http://www.ncpublicschools.org/accountability/reporting/
cohortgradrate
North Dakota North Dakota Department of Public Instruction
http://www.dpi.state.nd.us/ http://www.dpi.state.nd.us/resource/graduation.shtm
Ohio Ohio Department of Education
http://www.ode.state.oh.us/GD/Templates/Pages/ODE/ODEDefaultPage.aspx?page=1
http://reportcard.education.ohio.gov/Pages/Download-Data.aspx
Oklahoma Oklahoma State Department of Education
http://www.ok.gov/sde/ https://apps.sde.ok.gov/CalendarDueDates/Default.aspx
Oregon Oregon Department of Education
http://www.ode.state.or.us/home/ http://www.ode.state.or.us/search/page/?id=2644
Pennsylvania Pennsylvania Department of Education
http://www.portal.state.pa.us/portal/server.pt?open=512&objID=7237&mode=2
Pennsylvania did not provide publicly downloaded files of the Adjusted Cohort Graduation Rates for its districts and
schools, for the Class of 2012.
Rhode IslandRhode Island Department of Elementary and Secondary Education
http://www.ride.ri.gov/default.aspx http://www.eride.ri.gov/eride40/reportcards/12/default.aspx
South Carolina South Carolina Department of Education
http://ed.sc.gov/ http://ed.sc.gov/data/report-cards/
South Dakota South Dakota Department of Education
http://doe.sd.gov/ http://doe.sd.gov/reportcard/listnew/
Tennessee Tennessee Department of Education
http://tn.gov/education/ http://www.tn.gov/education/data/report_card/index.shtml
Texas Texas Education Agency http://tea.texas.gov/http://www.tea.state.tx.us/acctres/completion/2012/level.
html
Utah Utah State Office of Education
http://schools.utah.gov/main/http://www.schools.utah.gov/data/Reports/Graduation-
Dropout.aspx
Vermont State of Vermont Department of Education
http://education.vermont.gov/http://education.vermont.gov/new/html/data/dropout_
completion.html
Virginia Virginia Department of Education
http://www.doe.virginia.gov/http://www.doe.virginia.gov/statistics_reports/graduation_
completion/cohort_reports/index.shtml
WashingtonState of Washington Office of Superintendent of Public Instruction
http://www.k12.wa.us/ http://www.k12.wa.us/DataAdmin/default.aspx
West Virginia West Virginia Department of Education
http://wvde.state.wv.us/http://wveis.k12.wv.us/nclb/pub/enroll/repstatgr.
cfm?xrep=1&sy=11
Wisconsin Wisconsin Department of Public Instruction
http://dpi.wi.gov/
http://data.dpi.state.wi.us/data/HSCompletionPage.aspx?Or-gLevel=st&GraphFile=HIGHSCHOOLCOMPLETION&SCoun-
ty=47&SAthleticConf=45&SCESA=05&CompareTo=CUR-RENTONLY
Wyoming Wyoming Department of Education
http://edu.wyoming.gov/Default.aspx http://edu.wyoming.gov/data/graduation-rates/
Note. Current as of press time.
STATE

Appendices Progress and Challenge in Raising High School Graduation Rates
Annual Update 2016 Building a Grad Nation86
§ White: Includes white, non-Hispanic persons, defined as a person having origins in any of the original peoples of Europe, North Africa, or the Middle East.
§ Advanced Placement (AP): Programs offered by the College Board that provide college-level curriculum courses to high school students. Students who successfully complete the AP examination can earn college credit.
§ Chronic Absenteeism: A measure of how much school a student misses for any reason. It is usually equated to missing ten percent of the school year, or typically 18 school days.
§ Every Student Succeeds Act: Signed into law by President Obama in December 2015, the Every Student Succeeds Act is the most recent reauthorization of the 1965 Elementary and Secondary Education Act and the first since 2002’s No Child Left Behind. While the federal requirement of annual tests for students in grades three through eight remains, ESSA represents a major shift of power from the federal government to states in terms of holding schools accountable for student achievement. The law requires states to identify and intervene in schools that are in the bottom 5 percent of performers, high schools where the grad-uation rate is 67 percent or less, and schools where subgroups of students are struggling.
§ Free- and Reduced-Price Lunch: Students qualify for free and reduced price lunches if their household’s income is no greater than 130% of the federal poverty guidelines. Additionally, a child can receive free or reduced price meals if the family is already receiving SNAP food stamps.
§ Individuals with Disabilities Education Act (IDEA): U.S. federal law originally enacted in 1975 that mandates how states and public agencies provide services, including early intervention, special education, and other related services, to children with disabilities. Most recent amendments to the law were passed in 2004 (National Dissemination Center for Children with Disabilities, n.d.).
§ No Child Left Behind: The No Child Left Behind act is a 2002 reauthorization of the 1965 Elementary and Secondary Education Act. The law was intended to hold states accountable for improving the academic performance of all students, regardless of race, ethnicity, proficiency in English, disability, or economic status.
§ Social and Emotional Learning (SEL): The process through which children and adults acquire and effectively apply the knowledge, attitudes and skills
Appendix S: Frequently Used Terms and Definitions
Student subgroup-related terms (U.S. Depart-ment of Education)"genre":"Pamphlets","ab-stract":"Workbook for the Performance-Based Data Management Initiative (PBDMI:
§ African American: Includes black, non-Hispanic persons; defined as a person having origins in any of the black racial groups of Africa.
§ American Indian/Alaskan Native: A person having origins in any of the original peoples of North and South America (including Central America), and who maintains tribal affiliation or community attachment.
§ Asian: A person having origins in any of the original peoples of the Far East, Southeast Asia, or the Indian subcontinent, including for example, Cambodia, China, Japan, Korea, Malaysia, Pakistan, the Philippine Islands, Thailand, and Vietnam.
§ Hispanic: A person of Mexican, Puerto Rican, Cuban Central or South American, or other Spanish culture or origin, regardless of race.
§ Limited English Proficiency (LEP): Also known as English Language Learners (ELL), defined as students who fall into one of four categories: 1) who were not born in the United States or whose native languages are languages other than English; 2) who are a Native American or Alaskan Native, or a native resident of the outlying areas and who come from an environment where languages other than English have a significant impact on their level of language proficiency; 3) who are migratory, whose native languages are languages other than English; and who come from an environment where languages other than English are dominant; or 4) whose difficulties in speaking, reading, writing, or understanding the English language may be sufficient to deny the ability to meet the state’s proficient level of achievement on state assessments and the ability to successfully achieve in classrooms where the language of instruction is English, and/or the opportunity to fully participate in society.
§ Students with Disabilities: Defined as students with mental retardation, hearing impairments, (including deafness), speech or language impairments, visual impairments (including blindness), autism, traumatic brain injury, other health impairments, or specific learning disabilities, and who, by reason thereof, need special education and related services.
Progress and Challenge in Raising High School Graduation Rates Appendices
Annual Update 2016 Building a Grad NationAnnual Update 2016 Building a Grad Nation 87
What is the ACGR? The Adjusted Cohort Graduation Rate (ACGR) is a method for tracking a group (or cohort) of students who enter high school together, as first-time ninth-graders (or tenth-graders, in schools that begin in tenth grade) and graduate “on-time” (i.e., within three or four years) with a regular diploma. The ACGR accounts (or adjusts) for students who transfer into the school, transfer out to another school in the state, or die. The ACGR is based on a state’s ability to follow individual students, made feasible by assigning a single student identifier to each student, as also required in the 2008 regulations. Most states calculate the ACGR at the state, school district, and school-levels.
What is the formula for the ACGR? The U.S. Department of Education provided the following formula to calculate the ACGR for the graduating class of 2013.
Number of cohort members who earned a regular high school diploma by the end of the 2012-13 school year
Number of first-time 9th graders in fall 2009 (starting cohort) plus students who transferred in, minus students who trans-ferred out, emigrated, or died during school years 2009-2010, 2010-2011, 2011-2012, and 2012-2013
The same formula is followed for each graduating class.
Time span for the ACGR: The four-year ACGR is the “gold standard” for graduation rate reporting, as it is the number of years in which U.S. students are typically expected to complete high school. The four-year ACGR is the rate that the U.S. Department of Education reported in news releases in 2012, 2013, and 2014. In addition to the four-year ACGR, many states calculate five and six-year ACGR to enable consideration of those students who take additional time to complete the standard course of study. Students who graduate early (i.e., in one, two, or three years) are included as graduates with their original four-year cohort. Three-year ACGRs are often calcu-lated for schools that begin at the tenth grade.
What does using the ACGR accomplish? Using the ACGR means that states are no longer estimating gradua-tion rates from aggregate enrollment numbers (as is done with the Averaged Freshman Graduation Rate [AFGR]). ACGR counts individual students who graduate within a given time period.
What goes into the ACGR? For ACGR to provide an accurate picture, states must carefully define the terms they use to calculate ACGR and enact regulations and legislation that comply with the original federal regulations surrounding ACGR. “Graduation,” for instance, is intended to mean that students have received the regular state diploma, rather than
necessary to understand and manage emotions, set and achieve positive goals, feel and show empathy for others, establish and maintain positive relationships, and make responsible decisions.
Appendix T: Graduation Rate FAQWhy does graduating from high school matter? High school graduates are more likely to be employed, make higher taxable incomes, and generate jobs than those without a high school diploma. For example, had the nation already reached our 90 percent goal, the additional graduates from a single class would have earned an esti-mated $5.3 billion more in income, generated more than 37,000 jobs and increased the GDP by $6.6 billion per year. Graduates are less likely to engage in criminal behavior or receive social services. They have better health outcomes and higher life expectancies. Strong evidence also links increased educational attainment with higher voting and volunteering rates. Finally, this issue even affects national security, as only graduates can be accepted to serve in the armed forces.
How were high school graduation rates determined in the past? Historically, high school graduation rates have been arrived at using multiple formulas that varied by state and researcher, and were based on several different defini-tions of the student baseline, of a diploma, and of a grad-uate. These rates include the leaver method, the completer method, and, most notably, state methods.
How were graduation rates determined on an interim basis? Beginning in the late 1990s, researchers and then the states and federal government began developing alternative graduation rate calculations. In 2005, members of the National Governors Association (NGA), deeply concerned about strategies for improving schools, reached a consensus that high school graduation rates should be calculated in a uniform way across the states, and in a pioneering compact, generated a formula for doing so. The formula was modified and refined in a 29-page rulemaking document released by then-Secretary of Education, Margaret Spellings, in December 2008. States were expected to report graduation rates using the refined formula (the Adjusted Cohort Graduation Rate [ACGR]) beginning with the 2010-11 school year. The Averaged Freshman Graduation Rate (AFGR) was an interim calcula-tion that is still used today, for purposes of continuity.

Appendices Progress and Challenge in Raising High School Graduation Rates
Annual Update 2016 Building a Grad Nation88
2010. As of December 2015, all 50 states and the District of Columbia had reported for the 2012-14 school years.
Do all states report ACGR at the school and district levels?
Yes.
1. See Appendix A for 2013 reported ACGR by state and subgroup.
3. See Appendix R for links to state sources of ACGR.
Is the graduation rate that is reported on state report cards the same as the ACGR? Not necessarily. State accountability systems issue state, district, and school report cards. States are supposed to report ACGR, but can also report other graduation-related statistics, which may in some cases lead to confusion as to what the graduation rate actually is. In some states, report cards use methods other than the ACGR to estimate graduation rates. Many state calculation methods inflate the graduation rate by counting GEDs as regular diplomas, or by counting fourth, fifth, and sixth-year graduates together. Some states count students who received a certificate of completion or attendance rather than a diploma as graduates. Check with your state department of education about what method and definitions are used in your state, district, and school report cards. In addition, you may wish to check out the Alliance for Excellent Education’s website and the indi-vidual state report cards for previous years. Those report cards list results by state method, average freshman graduation rate (a different method that preceded ACGR), and results from independent sources. Together, these rates give the range in previous rates and illustrate why a common method based on common definitions and individual students was so badly needed.
Is the ACGR the ONLY graduation rate that is used in Building a Grad Nation: Progress and Challenges, Annual Report 2016? No. Because states are still in transition from using previous rates to using the ACGR, and because trend lines can only be established for states with several years of ACGR data, two other graduation rate estimations are used in this report: the Averaged Freshman Graduation Rate (AFGR) and Promoting Power (PP).
§ The AFGR was developed by the National Center for Education Statistics (NCES) after convening panels of experts to make recommendations about the most effective strategy to calculate graduation rates in the absence of data systems based on individual student identifiers. The AFGR depends on enrollment by grade reported annually by each school and district to the
a GED, a certificate of attendance, a certificate of comple-tion, an alternative diploma or a waiver diploma. “Transfer out” is intended to mean that when a student leaves school, his or her next destination is known and verified in writing, not assumed or conjectured. “Transfers in” should be added to the cohort.
Do all states use the same formula to calculate ACGR? No, not yet. While each state follows the same general ACGR formula provided by the U.S. Department of Education (see the above section, “What is the formula for the ACGR?”), states vary in the ways they define each component of the formula. For instance, states vary in how they count students who “transfer out” into incarcera-tion, homeschooling, or across state boundaries. Students who “transfer out” into homeschooling during high school are considered valid transfers out in most states, although in most states there is no requirement that homeschooled students gain a diploma of any sort. Students who “transfer out” across state lines are considered valid, though documentation is not required in every state. Even more variation occurs among students with disabilities, who constitute approximately 14 percent of the student population. Some rigorous states expect students with disabilities to gain a regular diploma in four years, while other states say that they are granting a “regular diploma” to these students when, in fact, the “regular diploma” for special education students is whatever their individual education plan (IEP, required for students with disabilities) outlines. As a result, it may take several more years to fully implement the ACGR approach uniformly and with fidelity.
Why do the ambiguities and loopholes matter? They matter because they can impede our ability to truly measure real graduation rates and compare rates across states. The U.S. Department of Education developed a comprehensive formula, arrived at after a great deal of input and consensus from education experts across the states. To be able to make accurate comparisons across states, and to learn what is working and who still needs additional support, it is imperative that states use common definitions. When evaluating your state’s regulation, ask “What happens if we change the definition of a ninth-grade cohort or a graduate?” The answer to this question affects your state’s graduation rate and its ability to identify those schools, districts, and groups in need of additional support.
Are all states now reporting the four-year ACGR at the state level? Five states began using a formula similar to ACGR in 2003, or have calculated ACGR back to this period. By 2006, 11 states had reported ACGR, and by 2009, 24 had reported it. Thirty-five states reported in

Progress and Challenge in Raising High School Graduation Rates Appendices
Annual Update 2016 Building a Grad NationAnnual Update 2016 Building a Grad Nation 89
Are there other lists of low-performing schools based on different measurement systems? The Civic Marshall Plan state indices for each state, available at http://new.every1graduates.org/building-a-grad-nation-state-profiles-and-annual-updates, provide ACGR (2013), AFGR (2011) and Promoting Power (2012) estimates for each state. The Alliance for Excellent Education (www.all4ed.org) maintains a Promoting Power database of all high schools by state, county, zip code, and congressional district for the classes of 2008, 2009, and 2010: http://www.all4ed.org/about_the_crisis/schools/ state and local info/promoting power.
Is the dropout rate the inverse of the graduation rate? No. Graduation rates are not the inverse of dropout rates. Generally, the dropout rate is the total number of students who drop out from all grades in a school or district in a given year, divided by the total enrollment in those grades. Depending on the state, dropout rates may cover grades 7 to 12 or grades 9 to 12. Dropout rates can be among the most misleading of indicators because the data is diluted over the grades. Ten to 15 percent is typically considered a very high dropout rate.
Are graduation rates reported or calculated using school and district enrollment data comparable to those reported by the U.S. Census? Not on face value. Two different situations are being addressed. The Census Bureau conducts two surveys (the Current Population Survey and the American Community Survey) that provide snapshots of educational attainment for the population, snapshots that are taken separately for different age groups. Typically, both surveys produce higher rates of educational attainment than do high school graduation rates. In part, the surveys are covering an older population that has had time to “get back on the graduation path” through alternate methods, including the GED (not included in the ACGR or AFGR). They also are not restricted to students enrolled in public schools, but include a sampling of the 11 percent of the population who attended private school and the 3 percent who are home-schooled, both estimated to have very high graduation rates. One survey excludes those living in group situations, such as the incarcerated and the military; the incarcerated population tends to have low graduation rates.
How do I find out the graduation rate in my school or community? Consult the tables listed earlier in Appendix R for web resources, or contact your state department of education if its website does not provide school-by-school information. The Grad Nation: A Guidebook to Help Communities Tackle the Dropout Crisis also provides information on how to find out the graduation rate and size
NCES’ Common Core of Data or CCD. The AFGR is calculated by dividing the number of diploma recipients by the average of the number of ninth-graders three years earlier, the number of tenth-graders two years earlier, and the number of eighth-graders four years earlier. The average is taken because research has shown that many ninth grades are disproportionately large because of the number of students retained. The AFGR does not account for transfers in or out.
§ Promoting Power is an estimated graduation rate developed by the Everyone Graduates Center at Johns Hopkins University School of Education. It compares the number of twelfth-grade students in a school to the number of ninth-graders three years earlier by using the grade level enrollment numbers reported to the federal Common Core of Data. Promoting Power does not account for students who make it to twelfth grade but ultimately do not graduate, nor does it adjust for transfers in or out. In the absence of uniform, school-level graduation rates, Promoting Power enables up-to-date comparisons to be made across states and schools. Promoting Power has been used in each of the Building a Grad Nation Annual Reports.
What is a “dropout factory” school? A dropout factory is a high school with a Promoting Power of 60 percent or less. In other words, it is a school in which its reported twelfth grade enrollment is 60 percent or less than its ninth-grade enrollment three years earlier.
Why are AFGR and PP used in this report, in addition to ACGR? AFGR is used because it has been retroactively calculated for more than 30 years, enabling comparison of national and state trend lines and changes over time. Because AFGR is easily available only at the state level, (although it can be calculated for districts and schools using CCD data, as is done for select districts and schools by the Broad Prize for Urban Education) other more school-specific measures were needed. Promoting Power is one such proxy and enables zeroing in on the number, distribution, and characteristics of schools with low Promoting Power (“dropout factories”). As ACGR becomes more prevalent, use of PP and AFGR will gradually be phased out.
Is there one list of low-performing high schools based on ACGR? No, there is not one centralized list of low-per-forming high schools across the nation based on ACGR. Each state calculates its own ACGR and most, but not all, states have done so school by school. In states that do not publish ACGR by school, it is recommended that state departments of education be contacted. Appendix R lists links for each state, current as of press time.

Appendices Progress and Challenge in Raising High School Graduation Rates
Annual Update 2016 Building a Grad Nation90
2. Principle: High Expectations: All students deserve a world-class education and all children can succeed, if provided appropriate supports.
Action Items:
§ Reduce chronic absenteeism with policies and prac-tices that support students in coming to school, staying in school, and learning at school.
§ Support, promote, or launch grade-level reading campaigns, ensuring all students read proficiently and with comprehension by fourth grade and beyond.
§ Support students in advancing on grade level through school transitions.
§ Redesign middle grades education, engaging, effective, academically directed schools.
§ Provide engaging and demanding coursework that prepares students for college and careers, as outlined in the Common Core State Standards.
§ Transform or replace “dropout factories.”
§ Expand education options and choices for students, connecting high school and postsecondary opportuni-ties, including quality career technical education, early college high schools, dual enrollment, back on track and recovery programs.
§ Reauthorize the Elementary and Secondary Education Act; strengthen state and school system policies to accelerate student achievement.
3. Principle: Accountability And Support. We must measure our work so that we know what’s working – and what is not. We must build state, school system, and school capacity to improve graduation and college readiness rates.
Action Items:
§ Use evidence-based strategies, promising practices, and data-driven decision making in all education-related sectors.
§ Fully implement, use and improve linked educational data systems throughout the educational continuum.
§ Develop and support highly effective and accountable teachers, counselors, youth-serving personnel, and administrator, working with those who represent teachers.
of the dropout crisis in your community. http://www.amer-icaspromise.org/our-work/Dropout-Prevention/~/media/Files/Our%20Work/Dropout%20Prevention/ Grad%20Nation%20Guidebook%20052809.ashx
The Civic Marshall Plan’s State Challenge also provides a quick snapshot of each state’s status in meeting the graduation challenge. Download your state’s index to see where it stands. http://new.every1graduates.org/build-ing-a- grad-nation-state-profiles-and-annual-updates/
Appendix U: Civic Marshall Plan PrinciplesEvery school in every community has unique opportunities to accelerate achievement for their children. To do so, stakeholders at every level require a set of appropriate solutions for their unique needs. The Civic Marshall Plan is not meant to be a prescription, but rather an iterative, evolving, dynamic, solutions-oriented campaign to end America’s dropout crisis. Therefore, the Civic Marshall Plan’s action items are organized around Four Leading Principles: focus, high expectations, accountability, and collaboration. The principles offer stakeholders key themes that can guide all of their work, while the action items provide targeted issues on which they can focus to reach the goal of 90 percent graduation rate by 2020.
1. Principle: Strategic Focus: We must direct human, financial and technical capacities and resources to low-graduation rate communities, school systems, schools and disadvantaged students.
Action Items:
§ Serve communities housing the “dropout factory high schools” that have 60 percent and lower high school graduation rates and their feeder middle and elemen-tary schools.
§ Serve communities housing the high schools that have 61 to 75 percent graduation rates and their feeder middle and elementary schools to ensure they do not slip into a “dropout factory.”
§ Integrate multi-sector, business and community-based efforts in collaboration with individual school and school system efforts.

Progress and Challenge in Raising High School Graduation Rates Appendices
Annual Update 2016 Building a Grad NationAnnual Update 2016 Building a Grad Nation 91
§ Build Early Warning Indicator and Intervention Systems to identify and appropriately support “on track” and “off track” students.
§ Measure the effectiveness of in-school and out-of-school interventions in order to promote and scale best practices.
§ Maximize “time on task” in school and maximize extended learning time in school, out of school, after school, and during the summer.
4. Thoughtful Collaboration. Ending the dropout crisis requires an all-hands-on-deck approach. To achieve collective impact, collaborations must be deliberately planned, guided by shared metrics and thoughtfully integrated to maximize efficiency and outcomes.
Action items:
§ Showcase examples of success at the state and community levels, serving as a challenge to others.
§ Create multi-sector and community-based efforts that harness the power of youth-serving agencies, non-profits and businesses as education partners
§ Ensure parents and families are continuously engaged in their child’s education and provided appropriate resources to promote their child’s success.
§ Elicit the perspectives of students, educators, and parents.
§ Educate community members about the need for educa-tion, high school and beyond, using all available tools to keep Grad Nation a local, state, and national priority.
1 Every Student Succeeds Act, S. 1177, 114th Congress (2015).
2 Grace Kena, Lauren Musu-Gilette, Jennifer Robinson, Xiaolei Wang, Amy Rathbun, Jijun Zhang, Sidney Wilkin-son-Flicker, Amy Barner, Erin Dunlop Velez, The Condition of Education 2015 (Washington, DC: National Center for Education Statistics, American Institutes for Research, and RTI International, May 2015). http://nces.ed.gov/pubsearch/pubsinfo.asp?pubid=2015144
3 Amy Stuart Wells, Lauren Fox, & Diana Cordova-Cobo. How Racially Diverse Schools and Classrooms Can Benefit All Students (New York: The Century Foundation, February 2016). https://tcf.org/content/report/how-racially-diverse-schools-and-classrooms-can-benefit-all-student/
4 National Alliance for Public Charter Schools, A Closer Look at the Charter School Movement: Charter Schools, Students, and Management Organizations, 2015-16 (Washington, DC: National Alliance for Public Charter Schools, February 2016). www.publiccharters.org/get-the-facts/publications-research/
5 Pattie Barth, Jim Hull, & Rebecca St. Andrie, Searching for the Reality of Virtual Schools (Alexandria, VA: The Center for Public Education, May 2012). www.centerforpubliceducation.org/
6 Anderson, Nick. “ACT’s college admission testing grows, but scores stagnate.” Washington Post 8/26/2015: https://www.washingtonpost.com/news/grade-point/wp/2015/08/26/acts-college-admission-testing-grows-but-scores-stagnate/
7 College Board, Annual AP Report to the Nation years 2005-2014, http://research.collegeboard.org/programs/ap/data/nation
8 National Center of Education Statistics, Total Number of Homeless Students Enrolled in LEAs with or without McKin-ney-Vento Subgrants – Total: 2013-14, EDFacts/Consolidated State Performance Report, 2013-14. Accessed at: http://www2.ed.gov/admins/lead/account/consolidated/index.html.
Endnotes


