leaving boys behind: public high school graduation rates · civic report no. 48 april 2006 leaving...
TRANSCRIPT

No. 48 April 2006Civic Report
Leaving Boys Behind:Public High School Graduation Rates
Jay P. GreeneSenior Fellow,
Manhattan Institute for Policy Research
and
Marcus A. WintersSenior Research Associate,
Manhattan Institute for Policy Research
Funding for this report was provided by theBill & Melinda Gates Foundation

Civic Report 48
April 2006

Leaving Boys Behind: Public High School Graduation Rates
April 2006
EXECUTIVE SUMMARY
This study uses a widely respected method to calculate public high school graduation rates for the nation, foreach state, and for the 100 largest school districts in the United States. We calculate graduation rates overall,by race, and by gender, using the most recent available data (the class of 2003).
Among our key findings:
• The overall national public high school graduation rate for the class of 2003 was 70 percent.
• There is a wide disparity in the public high school graduation rates of white and minority students.Nationally, the graduation rate for white students was 78 percent, compared with 72 percent for Asianstudents, 55 percent for African-American students, and 53 percent for Hispanic students.
• Female students graduate high school at a higher rate than male students. Nationally, 72 percent offemale students graduated, compared with 65 percent of male students.
• The gender gap in graduation rates is particularly large for minority students. Nationally, about 5percentage points fewer white male students and 3 percentage points fewer Asian male students gradu-ate than their respective female students. While 59 percent of African-American females graduated,only 48 percent of African-American males earned a diploma (a difference of 11 percentage points).Further, the graduation rate was 58 percent for Hispanic females, compared with 49 percent for Hispa-nic males (a difference of 9 percentage points).
• The state with the highest overall graduation rate was New Jersey (88 percent), followed by Iowa, Wis-consin, and North Dakota, each with 85 percent. The state with the lowest overall graduation rate wasSouth Carolina (54 percent), followed by Georgia (56 percent) and New York (58 percent).
• Each of the nation’s ten largest public high school districts, which enroll more than 8 percent of thenation's public school student population, failed to graduate more than 60 percent of its students.
• Among the nation’s 100 largest public school districts (by total enrollment size), the highest graduationrate was in Davis, Utah (89 percent), followed by the Ysleta Independent School District in Texas (84percent). Among the 100 largest districts, the lowest graduation rate was in San Bernardino City Unifieddistrict (42 percent), followed by Detroit (42 percent) and New York City (43 percent).
Civic Report 48
April 2006
ABOUT THE AUTHORS
Jay P. Greene, Ph.D., is Endowed Chair and Head of the Department of Education Reform at the Universityof Arkansas and a Senior Fellow at the Manhattan Institute. He has conducted evaluations of school choiceand accountability programs in Florida, Charlotte, Milwaukee, Cleveland, and San Antonio. He has alsorecently published research on high school graduation rates, social promotion, and special education. Hisarticles have appeared in policy journals, such as The Public Interest, City Journal, and Education Next, inacademic journals, such as the Teachers College Record, the Georgetown Public Policy Review, and the BritishJournal of Political Science, as well as in major newspapers, such as the Wall Street Journal, the Washington Post,and USA Today. Dr. Greene is the author of Education Myths (Rowman & Littlefield, 2005). His educationresearch has been cited in U.S. Supreme Court opinions and has appeared in scholarly and popularpublications. Dr. Greene received his doctorate in political science from Harvard University in 1995.
Marcus A. Winters is a Senior Research Associate at the Manhattan Institute and a Doctoral Academy Fellowat the University of Arkansas. He has performed several studies on a variety of education policy issues,including high-stakes testing, charter schools, and the effects of vouchers on the public school system. Hisop-ed articles have appeared in numerous newspapers, including the Washington Post, USA Today, and theChicago Sun-Times. He received his B.A. in political science with departmental honors from Ohio Universityin 2002.
ACKNOWLEDGMENTS
We would like to thank the Bill & Melinda Gates Foundation for the generous support of this project. We’dalso like to thank Mark Schneider and Marilyn Seastrom at the U.S. Department of Education’s NationalCenter for Education Statistics for their assistance in making the necessary data available.
Leaving Boys Behind: Public High School Graduation Rates
April 2006
TABLE OF CONTENTS
Introduction ................................................................................................................................................ 1
What’s New in This Report? ....................................................................................................................... 2
Summary of Results .................................................................................................................................... 3
Data and Method ...................................................................................................................................... 3
An Example of a State-Level Graduation Rate Calculation ........................................................................ 6
An Example of a District-Level Graduation Rate Calculation .................................................................... 6
Results ...................................................................................................................................................... 7
Conclusion .................................................................................................................................................. 8
Endnotes .................................................................................................................................................... 9
Appendix ...................................................................................................................................................10
Table 1: State Graduation Rates in Alphabetical Order ............................................................................10
Table 2: States Ranked by Overall High School Graduation Rate .............................................................12
Table 3: District Graduation Rates by Size of Enrollment .........................................................................14
Table 4: District Graduation Rates in Alphabetical Order ........................................................................16
Table 5: Districts Ranked by Overall High School Graduation Rate .........................................................18

Civic Report 48
April 2006
April 2006 1
LEAVING BOYS BEHIND:PUBLIC HIGH SCHOOL GRADUATION RATES
INTRODUCTION
The unreliability of official public high school graduation rates is well known. It is so well known that lastyear, the National Governors Association (NGA) released a report that stated: “Unfortunately, the quality ofstate high school graduation and dropout data is such that most states cannot accurately account for theirstudents as they progress through high school.”1 In response, forty-five state governors signed an agreementto implement an improved, standard calculation of the four-year high school graduation rate.
One might think that the battle has been won—that there is no longer a need for independent estimates ofgraduation rates, such as those that we have produced in the past and that appear in this report. But there areseveral reasons that we continue to need these independent estimates of public high school graduation rates.It will be many years before most states develop the data systems to accurately track students and computegraduation rates. In the interim, we will continue to need reliable estimates of graduation rates. The governorshave pledged to take reasonable steps to improve graduation rate calculations until systems are in place totrack individual students over time. But to ensure the proper implementation of both the immediate and long-term reforms, we will need independent estimates to verify the official statistics. We would not have recognizedthe need for improvement of official graduation statistics had it not been for independent estimates; and wewill not know that they have, in fact, improved unless we continue to produce those independent estimates.
We also continue to need reasonable independent estimates of public high school graduation rates becausenot everyone has accepted that the independent estimates are more reliable than official statistics. Eventhough most of the nation’s governors concede the point, Lawrence Mishel of the Economic Policy Institutehas taken a firm stand in support of the official results and against the independent estimates.2 Mishel’sargument is that independent estimates rely upon enrollment and diploma counts from the U.S. Departmentof Education’s Common Core of Data (CCD). How can we be sure, he asks, that those counts are reliable? Inaddition, he observes that two high-quality government surveys, the Current Population Survey (CPS) andthe National Educational Longitudinal Survey (NELS), produce graduation rate results that are similar toeach other and significantly higher than the independent estimates based on CCD.
Mishel speculates that the CCD counts may be unreliable but offers no support for his speculation. We havegood reason to believe that the CCD enrollment and diploma counts are reliable. CCD establishes standardsand procedures for states to collect and report enrollment and diploma data. If states do not meet thosestandards or follow those procedures, their data are not reported.
It should not be difficult for states to track enrollment and diplomas. Enrollment counts are based on schoolstaking attendance, which schools are very good at doing. One reason schools are likely to keep accurateattendance is that enrollment counts are the basis for school funding by state and federal governments.Further, because attendance determines how much money state and federal governments allot to schools,these higher levels of government are inclined to check and ensure the accuracy of attendance figures. Similarly,diploma counts are likely to be accurate because it is easy for schools to count diplomas and it is easy to verifythe numbers. At the very least, schools have to know how many diplomas should be printed and distributed.
Mishel specifically questions our estimates of the entering ninth-grade class enrollment, which he claims aredistorted by the tendency for those enrollments to be inflated because of students being held back in thatgrade. It is possible to run a simple check to see if our estimates of ninth-grade enrollment are on target. Usingthe official CCD enrollment counts, we estimate that 3,635,420 students entered the ninth grade in public
Civic Report 48
April 20062
school in 1999. According to the U.S. Census—in a number derived from its CPS—there were 3,892,340fourteen-year-olds in the nation in June 1999. According to the National Center for Education Statistics(NCES), 835,328 students attended private high schools (in 2001), which, divided by four, suggests that therewere 208,832 ninth-graders in private school. If we subtract the private school ninth-graders from the fourteen-year-old population, we are left with a difference between the number of fourteen-year-olds and our estimatedninth-grade entering class of 48,088 students, or 1.3 percent. It would seem that the enrollment counts that weuse are accurate.
Enrollments and diplomas are easy to count accurately, and the actors have incentives to ensure that thecounts are accurate—a simple check helps confirm that; on what basis does Mishel believe otherwise? Hesimply has more faith in graduation rates computed from CPS and NELS surveys than in those derived fromCCD enrollment and diploma counts. Essentially, Mishel is arguing that we ought to believe the results fromsamples more than results from the population. This is exactly the opposite of standard social science practice.Normally, we expect some degree of error whenever we survey a sample drawn from a population. If we haveconcerns about the sample, we check the characteristics of the sample against known characteristics of thepopulation from which the sample was drawn to ensure its validity. In this case, however, Mishel is suggestingthat we ought to check the accuracy of the characteristics of the population against the characteristics insamples.
Samples always involve some degree of random error, but CPS and NELS have additional, known biases forthe purpose of calculating graduation rates. The NELS and CPS surveys both overstate graduation ratesbecause they have difficulty finding and following marginalized and disadvantaged people, such as dropouts.Phillip Kaufman (the primary author of previous government calculations of graduation rates that used CPS)indicated that such a coverage bias probably exists. Specifically, dropouts are less likely to be reached bysample surveys (that is, they are “undercovered”). In a report for the Harvard Civil Rights Project, Kaufmanestimated that if we made the reasonable assumption that 50 percent of those undercovered by the CPS weredropouts, we would end up with a completion rate of 80.4 percent.3 If we then excluded GED recipients fromthat estimate, we would get much closer to the estimate of a 70 percent graduation rate that we and otherssuggest. In other words, the systematic sampling biases of CPS and NELS make their graduation numbershigher and less reliable than those derived from population counts.
We can do a simple check on Mishel’s “true” graduation rates derived from CPS and “confirmed” by NELS.If Mishel is correct in saying that the true graduation rate is in the neighborhood of 90 percent,4 there shouldhave been about 3,678,300 diplomas awarded in 2003 from public and private high schools. According toCCD, there were only 3,062,000 diplomas given out that year. If Mishel is correct, CCD would have to havemissed more than 600,000 diplomas in its count. Is it more likely that CPS and NELS suffer from a samplingbias due to the difficulty of finding dropouts, or that school systems undercounted the number of diplomasthey awarded by more than 600,000, making those schools appear less successful than they actually were bynearly 20 percent?
Until official graduation statistics produce more reliable estimates, it is clear that we will continue to needindependent estimates of graduation rates. Those independent estimates will also help ensure progresstoward improved official statistics.
WHAT’S NEW IN THIS REPORT?
While this report builds upon a foundation of previous reports, there is much that is new. First, this reportcontains graduation rate estimates for the class of 2003, the most recent year for which data are available.Unfortunately, CCD enrollment and diploma counts are being released with greater time lags. However,since graduation rates tend not to change dramatically in short periods of time, this study provides a valuablesnapshot of the performance of public schools today.
Leaving Boys Behind: Public High School Graduation Rates
April 2006 3
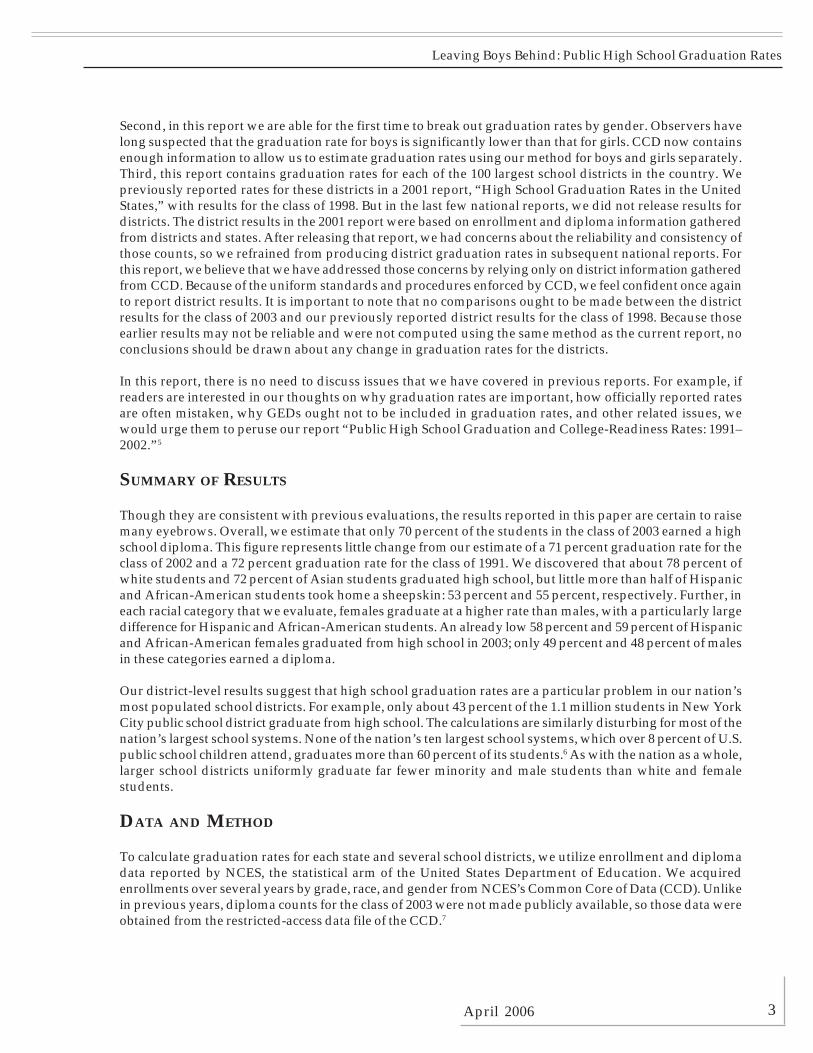
Second, in this report we are able for the first time to break out graduation rates by gender. Observers havelong suspected that the graduation rate for boys is significantly lower than that for girls. CCD now containsenough information to allow us to estimate graduation rates using our method for boys and girls separately.Third, this report contains graduation rates for each of the 100 largest school districts in the country. Wepreviously reported rates for these districts in a 2001 report, “High School Graduation Rates in the UnitedStates,” with results for the class of 1998. But in the last few national reports, we did not release results fordistricts. The district results in the 2001 report were based on enrollment and diploma information gatheredfrom districts and states. After releasing that report, we had concerns about the reliability and consistency ofthose counts, so we refrained from producing district graduation rates in subsequent national reports. Forthis report, we believe that we have addressed those concerns by relying only on district information gatheredfrom CCD. Because of the uniform standards and procedures enforced by CCD, we feel confident once againto report district results. It is important to note that no comparisons ought to be made between the districtresults for the class of 2003 and our previously reported district results for the class of 1998. Because thoseearlier results may not be reliable and were not computed using the same method as the current report, noconclusions should be drawn about any change in graduation rates for the districts.
In this report, there is no need to discuss issues that we have covered in previous reports. For example, ifreaders are interested in our thoughts on why graduation rates are important, how officially reported ratesare often mistaken, why GEDs ought not to be included in graduation rates, and other related issues, wewould urge them to peruse our report “Public High School Graduation and College-Readiness Rates: 1991–2002.”5
SUMMARY OF RESULTS
Though they are consistent with previous evaluations, the results reported in this paper are certain to raisemany eyebrows. Overall, we estimate that only 70 percent of the students in the class of 2003 earned a highschool diploma. This figure represents little change from our estimate of a 71 percent graduation rate for theclass of 2002 and a 72 percent graduation rate for the class of 1991. We discovered that about 78 percent ofwhite students and 72 percent of Asian students graduated high school, but little more than half of Hispanicand African-American students took home a sheepskin: 53 percent and 55 percent, respectively. Further, ineach racial category that we evaluate, females graduate at a higher rate than males, with a particularly largedifference for Hispanic and African-American students. An already low 58 percent and 59 percent of Hispanicand African-American females graduated from high school in 2003; only 49 percent and 48 percent of malesin these categories earned a diploma.
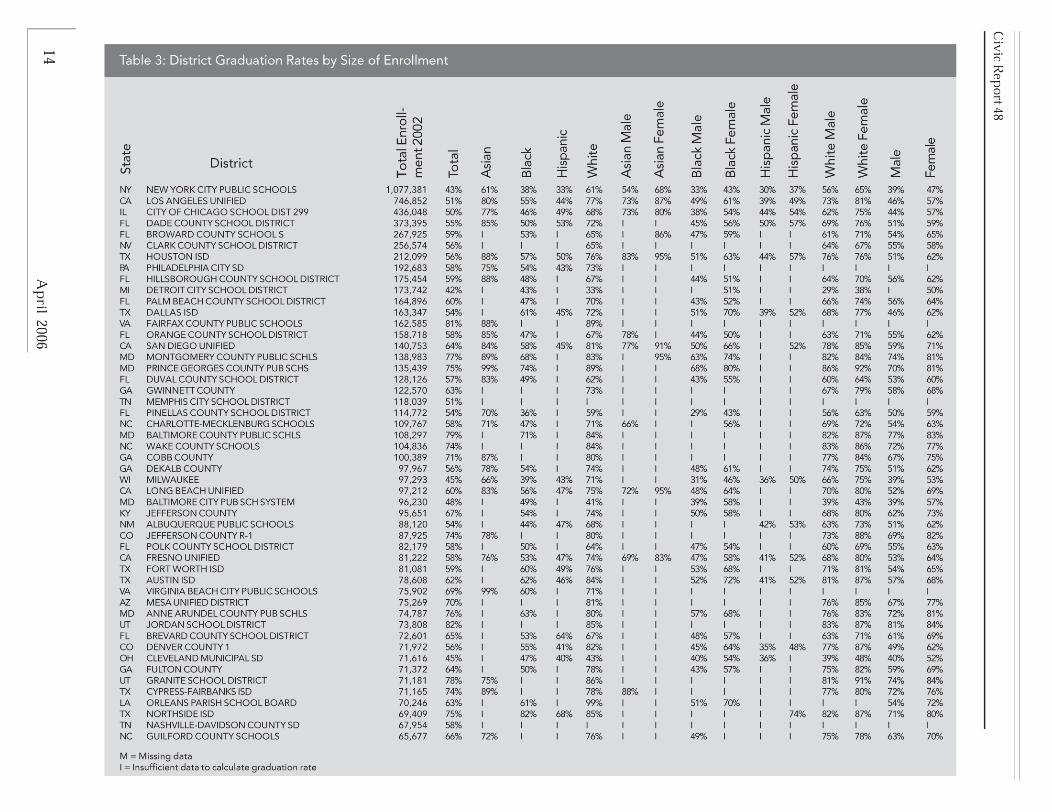
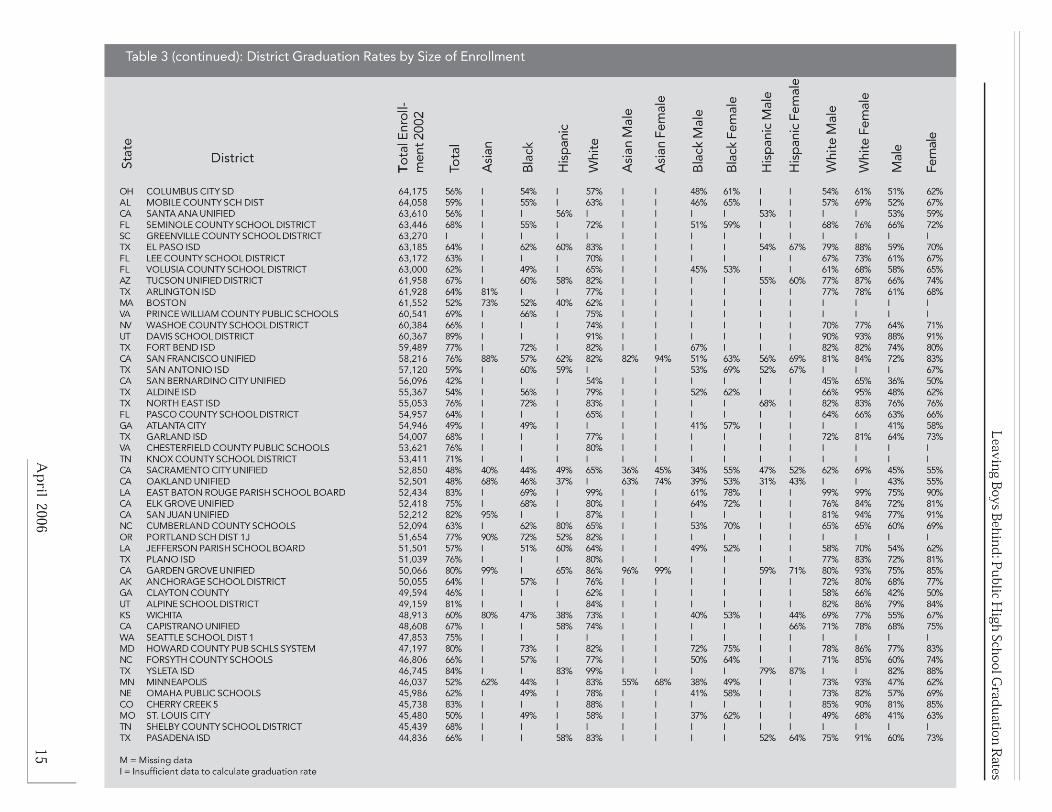
Our district-level results suggest that high school graduation rates are a particular problem in our nation’smost populated school districts. For example, only about 43 percent of the 1.1 million students in New YorkCity public school district graduate from high school. The calculations are similarly disturbing for most of thenation’s largest school systems. None of the nation’s ten largest school systems, which over 8 percent of U.S.public school children attend, graduates more than 60 percent of its students.6 As with the nation as a whole,larger school districts uniformly graduate far fewer minority and male students than white and femalestudents.
DATA AND METHOD
To calculate graduation rates for each state and several school districts, we utilize enrollment and diplomadata reported by NCES, the statistical arm of the United States Department of Education. We acquiredenrollments over several years by grade, race, and gender from NCES’s Common Core of Data (CCD). Unlikein previous years, diploma counts for the class of 2003 were not made publicly available, so those data wereobtained from the restricted-access data file of the CCD.7
Civic Report 48
April 20064
The advantage of using CCD information on enrollments is that these figures are the enrollments that thestates officially report to the federal government under uniform guidelines. Thus, we can have confidencethat the data are accurate and comparable among the states. The disadvantage of using CCD, however, is thatthe data lag to the point where the most recent graduation rate calculation available is for the class of 2003.However, what is gained in the quality of the data reported likely more than outweighs the timing of the data,especially considering that high school graduation rates tend not to change substantially in a short timespan.
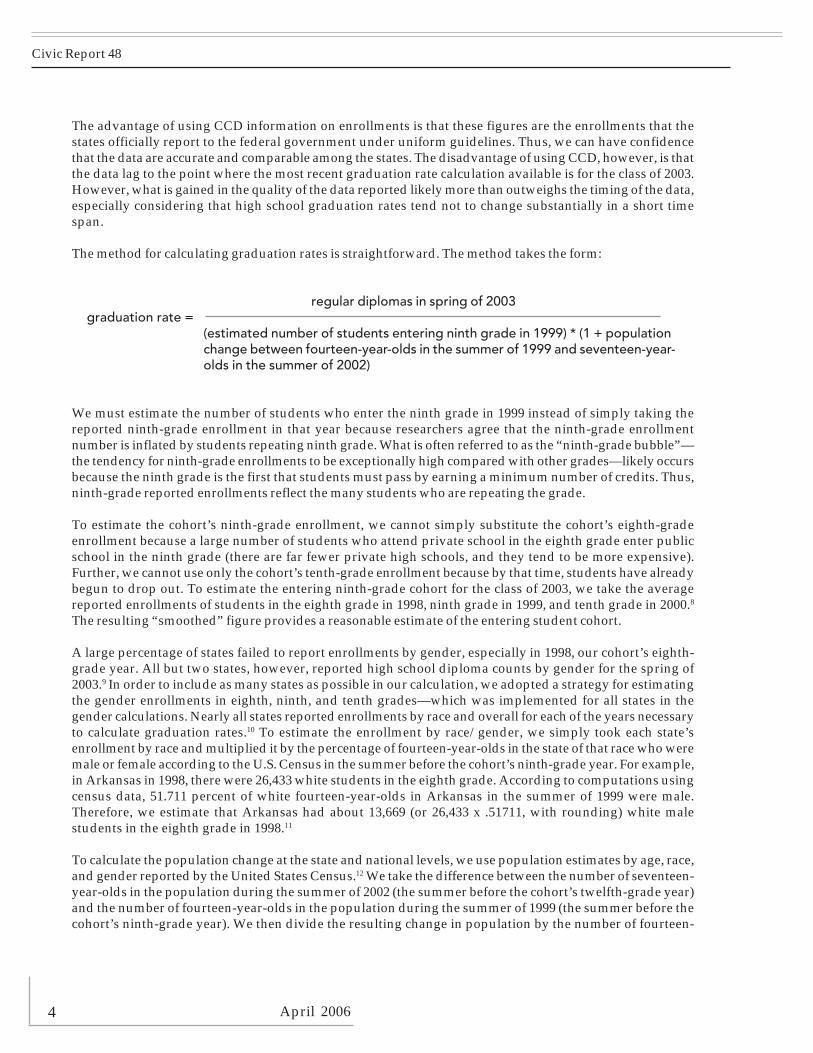
The method for calculating graduation rates is straightforward. The method takes the form:
regular diplomas in spring of 2003graduation rate =
(estimated number of students entering ninth grade in 1999) * (1 + populationchange between fourteen-year-olds in the summer of 1999 and seventeen-year-olds in the summer of 2002)
We must estimate the number of students who enter the ninth grade in 1999 instead of simply taking thereported ninth-grade enrollment in that year because researchers agree that the ninth-grade enrollmentnumber is inflated by students repeating ninth grade. What is often referred to as the “ninth-grade bubble”—the tendency for ninth-grade enrollments to be exceptionally high compared with other grades—likely occursbecause the ninth grade is the first that students must pass by earning a minimum number of credits. Thus,ninth-grade reported enrollments reflect the many students who are repeating the grade.
To estimate the cohort’s ninth-grade enrollment, we cannot simply substitute the cohort’s eighth-gradeenrollment because a large number of students who attend private school in the eighth grade enter publicschool in the ninth grade (there are far fewer private high schools, and they tend to be more expensive).Further, we cannot use only the cohort’s tenth-grade enrollment because by that time, students have alreadybegun to drop out. To estimate the entering ninth-grade cohort for the class of 2003, we take the averagereported enrollments of students in the eighth grade in 1998, ninth grade in 1999, and tenth grade in 2000.8
The resulting “smoothed” figure provides a reasonable estimate of the entering student cohort.
A large percentage of states failed to report enrollments by gender, especially in 1998, our cohort’s eighth-grade year. All but two states, however, reported high school diploma counts by gender for the spring of2003.9 In order to include as many states as possible in our calculation, we adopted a strategy for estimatingthe gender enrollments in eighth, ninth, and tenth grades—which was implemented for all states in thegender calculations. Nearly all states reported enrollments by race and overall for each of the years necessaryto calculate graduation rates.10 To estimate the enrollment by race/gender, we simply took each state’senrollment by race and multiplied it by the percentage of fourteen-year-olds in the state of that race who weremale or female according to the U.S. Census in the summer before the cohort’s ninth-grade year. For example,in Arkansas in 1998, there were 26,433 white students in the eighth grade. According to computations usingcensus data, 51.711 percent of white fourteen-year-olds in Arkansas in the summer of 1999 were male.Therefore, we estimate that Arkansas had about 13,669 (or 26,433 x .51711, with rounding) white malestudents in the eighth grade in 1998.11
To calculate the population change at the state and national levels, we use population estimates by age, race,and gender reported by the United States Census.12 We take the difference between the number of seventeen-year-olds in the population during the summer of 2002 (the summer before the cohort’s twelfth-grade year)and the number of fourteen-year-olds in the population during the summer of 1999 (the summer before thecohort’s ninth-grade year). We then divide the resulting change in population by the number of fourteen-
Leaving Boys Behind: Public High School Graduation Rates
April 2006 5
year-olds in 1999 to get the percent increase (or decrease) in the area’s population of students in the cohort’sage group.
We use a different population change computation for graduation rates by school district because populationestimates by age are not readily available at the school district level. We use district-level enrollments as asubstitute for the age populations and make the reasonable assumption that, on average, transfers in and outof a high school are equal for each grade in the school. We take the difference between the number of studentsin grades nine through twelve in 2002 (the cohort’s twelfth-grade year) and the number of students in gradesnine through twelve in 1999 (the cohort’s ninth-grade year) and divide the resulting figure by the number ofstudents in grades nine through twelve in 1999. This produces an estimate of the percent change in thedistrict’s enrollment while the cohort was in high school.
We then adjust the estimated ninth-grade cohort by the change in the population while the students were inhigh school. This produces the projected graduating cohort—the number of students who could possiblygraduate with the class of 2003. Finally, we take the number of diplomas that were actually given out in thespring of 2003 and divide it by the projected graduating cohort. The result is the estimated high schoolgraduation rate.
Though this method tends to produce reliable estimates of graduation rates, it can be distorted when there areparticularly small cohorts or when population changes are extraordinarily large. For this reason, we adoptand apply consistent rules for excluding cohorts for which we do not have adequate information.13 We do notreport graduation rates for cohorts of students less than or equal to 200 or when the cohort’s populationchange is 30 percent or greater. We also exclude any case where the cohort is less than or equal to 2,000 andthe population change is 20 percent or greater. However, though we do not report graduation rates in areaswith these cohort- or population-change levels, their enrollments and populations are included in the stateand national calculations.
It is important to clarify that the method in this paper is not a four-year on-time graduation rate. Though themethod does follow high school enrollments through four sequential grades, students who take longer thanfour years to graduate are estimated into the calculation as well. Such students would exit our cohort;however, they would likely be replaced by students in the previous cohort class who have also taken longerto graduate. For example, if a student who entered the ninth grade in 1999 took five years to graduate (that is,graduated with the class of 2004), he would not receive a diploma in the spring of 2003 and thus would notbe included in our calculation. However, if another student entered the ninth grade in 1998 (the expectedgraduating class of 2002) and also took five years to graduate, that student would receive a diploma in 2003and would thus be included in the graduation rate calculation. As long as there are not dramatic year-to-yeardifferences in the number of students who take longer than four years to graduate, these students shouldreplace each other in the calculations, and any distortion should be quite limited. Thus, the result of ourestimates can be thought of as the graduation rate for the class of 2003, not the on-time graduation rate for thatclass.
Unlike many other high school graduation rate calculations, the estimates using the above method can bemanipulated to interpret the high school dropout rate as well. The high school dropout rate is found bysubtracting the high school graduation rate from 100. That is, a graduation rate of 70 percent implies adropout rate of 30 percent.
Other graduation rate estimates (including nearly all official government calculations) contend that thedropout rate is different from simply 100 minus the graduation rate. They produce far lower dropout estimateswhere many nongraduates are classified in ways other than as dropouts. However, this practice is contraryto both logic and the public’s understanding of the information that a high school graduation rate conveys.For the purposes of our calculation, a student is either a high school graduate or a high school dropout: the
Civic Report 48
April 20066
student earns a diploma or does not. Thus, our calculation is less confusing than many other methods, andit matches what the public and policymakers expect from a graduation rate.
The above calculations were performed to produce graduation rates in total, by race, gender, and race/genderfor the nation, each state, and each of the 100 largest school districts in the United States for which data wereavailable.
AN EXAMPLE OF A STATE-LEVEL GRADUATION RATE CALCULATION
An example of our calculation will illustrate the method: let us calculate the total graduation rate for NewYork State.
First, we estimate the number of students who entered the cohort in ninth grade. In New York, the enrollmentin eighth grade in 1998 was 200,097, ninth grade in 1999 was 252,864, and tenth grade in 2000 was 217,734.The average of these enrollments is 223,565, which is the estimated number of students who entered thecohort in the ninth grade. Note that the ninth-grade enrollment is much higher than either the eighth-grade ortenth-grade enrollment: this is the “ninth-grade bubble” referred to previously.
Next, we compute the change in New York’s population of the cohort’s age group. In June 2002, there were261,326 seventeen-year-olds in New York; and in June 1999, there were 233,701 fourteen-year-olds in thestate. The difference in these populations is an increase of 27,625 children. We then divide this difference bythe number of fourteen-year-olds in 1999 (27,625 divided by 233,701) to get a population change of about 12percent.
We then combine our estimated ninth-grade class with the population change to produce an estimatednumber of students who could graduate from high school among the entering cohort. We take the estimatednumber of entering ninth-graders in 1999 (223,565) and multiply this number by 112 percent (100 percentplus the 12 percent population increase in the state). This produces a potential graduating class of 249,992students.
Finally, we calculate the state’s graduation rate by dividing the number of diplomas that were distributed inNew York in the spring of 2003 (143,818) by the estimated number of students who could graduate in thecohort (249,992). This produces an estimated graduation rate of 57.5 percent for the state of New York for theclass of 2003.
AN EXAMPLE OF A DISTRICT-LEVEL GRADUATION RATE CALCULATION
Since the method varies slightly, it is useful to illustrate our calculation of the district-level graduation rateswith another example: let us calculate the total graduation rate for Los Angeles.
The enrollment in Los Angeles in the eighth grade in 1998 was 45,053, ninth grade in 1999 was 58,834, andtenth grade in 2000 was 46,664. The average of these enrollments is 50,183, which is the estimated number ofstudents who entered the ninth grade in 1999. Again, note the bubble in the ninth-grade enrollment.
We next calculate the population change using the school district’s high school enrollments during thecohort’s ninth- and twelfth-grade years. In 2002, the cohort’s twelfth-grade year, in Los Angeles there were68,802 students in the ninth grade, 49,109 students in the tenth grade, 38,387 students in the eleventh grade,and 27,253 students in the twelfth grade, which totals 183,551 students in the high school grades. In 1999, thecohort’s ninth-grade year in Los Angeles, there were 58,834 students in the ninth grade, 46,971 students inthe tenth grade, 36,825 students in the eleventh grade, and 28,369 students in the twelfth grade, which totals

Leaving Boys Behind: Public High School Graduation Rates
April 2006 7
170,999 in all high school grades in the school district. We take the number of students in high school in 2002(183,551) and subtract from it the number of high school students in 1999 (170,999) to get an increase in thepopulation of 12,552. We then divide this figure (12,552) by the number of high school students in 1999(170,999) to get a population increase of 6 percent.
Next, we adjust the estimated entering ninth-grade class by the increase in the Los Angeles school district’spopulation. We take the estimated ninth-grade cohort (50,183) and multiply it by 106 percent (100 percentplus the 6 percent population increase) to get an estimated potential graduating cohort of 53,150 students.
Finally, we divide the number of regular diplomas that were granted by the Los Angeles school district in thespring of 2003 (27,563) by the number of students we estimated could potentially graduate in the cohort(53,150). This produces an estimated graduation rate of 51 percent for the Los Angeles school district in 2003.
RESULTS
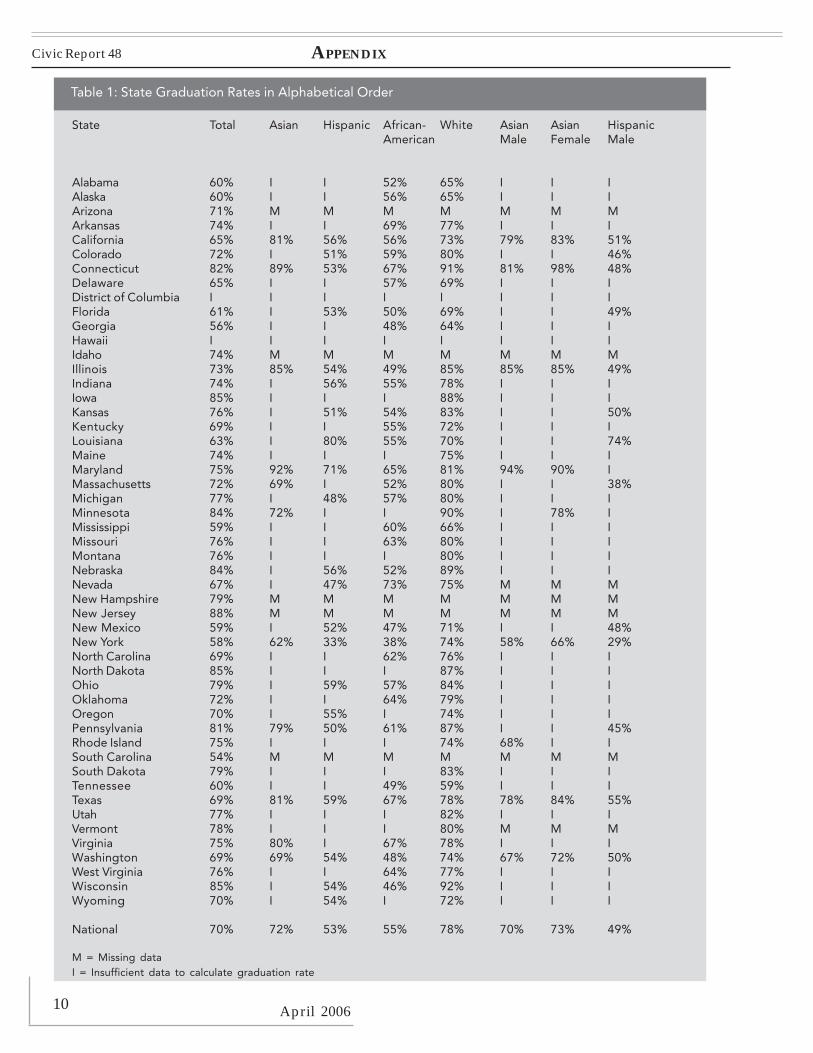
The results of our state-level and national calculations of graduation rates overall, by race, gender, and race/gender are reported alphabetically by state in Table 1.
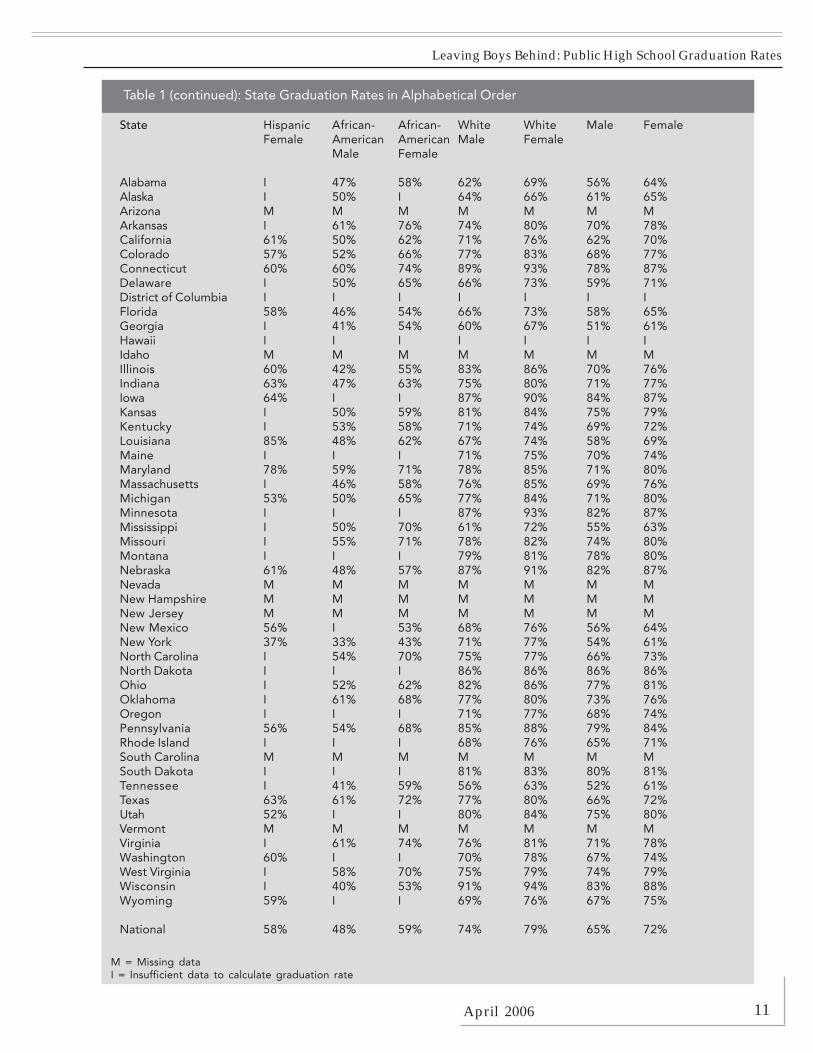
The national overall graduation rate is about 70 percent, which is in line with calculations from previousyears. Nationally, about 78 percent of white students and 72 percent of Asian students graduated with aregular diploma in the class of 2003, compared with the much lower estimates of 53 percent for Hispanicstudents and 55 percent of African-American students. Female students graduated at a rate of about 72percent, compared with males at about 65 percent. The race and gender gaps in high school graduation alsoheld when evaluating by race/gender. At only 48 percent, African-American male students reported thelowest graduation rates of any subgroup nationally, while white female students had the highest graduationrate, at 79 percent. The disparity between male and female graduation rates was much higher for African-American (females, 59 percent; males, 48 percent) and Hispanic (females, 58 percent; males, 49 percent)students than for Asian or white students.
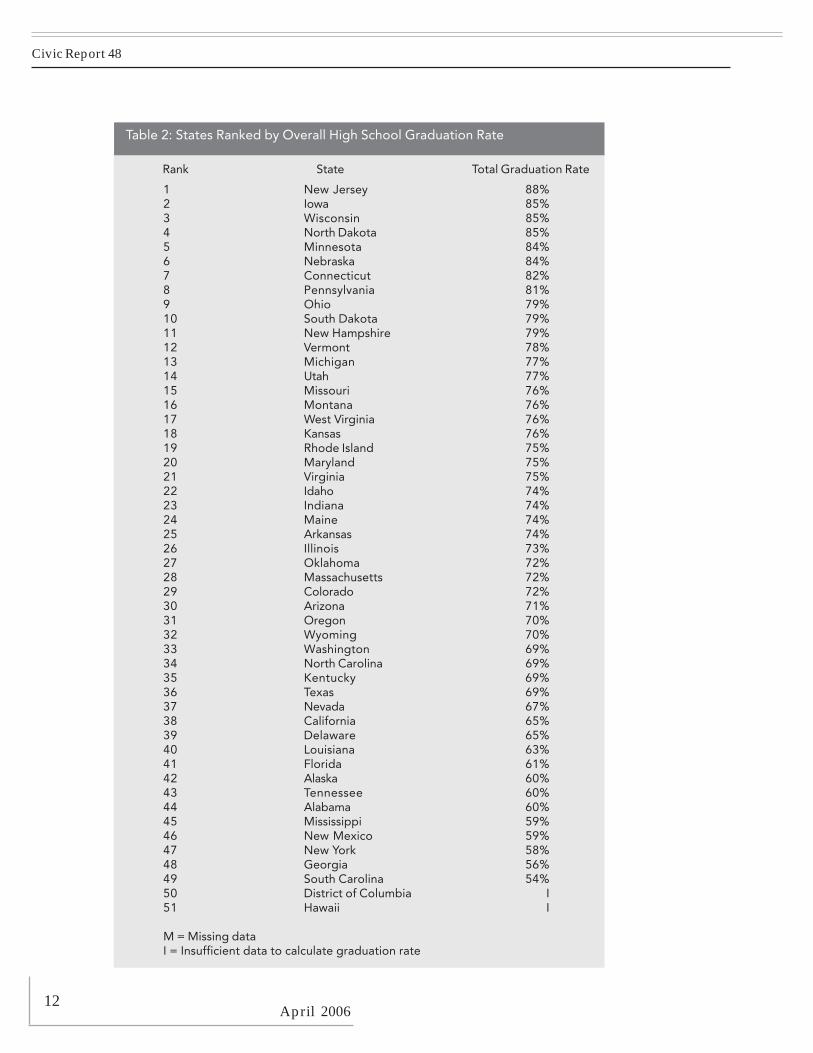
Table 2 ranks the states by overall high school graduation rate. The table shows that graduation rates differedsubstantially among the states. New Jersey had the highest overall graduation rate (88 percent) and wasfollowed by Iowa, Wisconsin, and North Dakota, each at 85 percent. The lowest overall graduation rate wasin South Carolina (54 percent), followed by Georgia (56 percent) and New York (58 percent).
Some states fared well overall but had low graduation rates for certain populations of students. For example,Wisconsin ranked third in the nation for overall graduation rate mostly because it had the highest graduationrate for white students. However, of the thirty-three states for which the necessary information was availableto calculate graduation rates for African-American students, Wisconsin ranked thirty-second. Conversely,Texas ranked thirty-sixth in the nation in overall graduation rate but had the fifth-highest graduation rate forAfrican-American students among the thirty-three states for which adequate information was available.
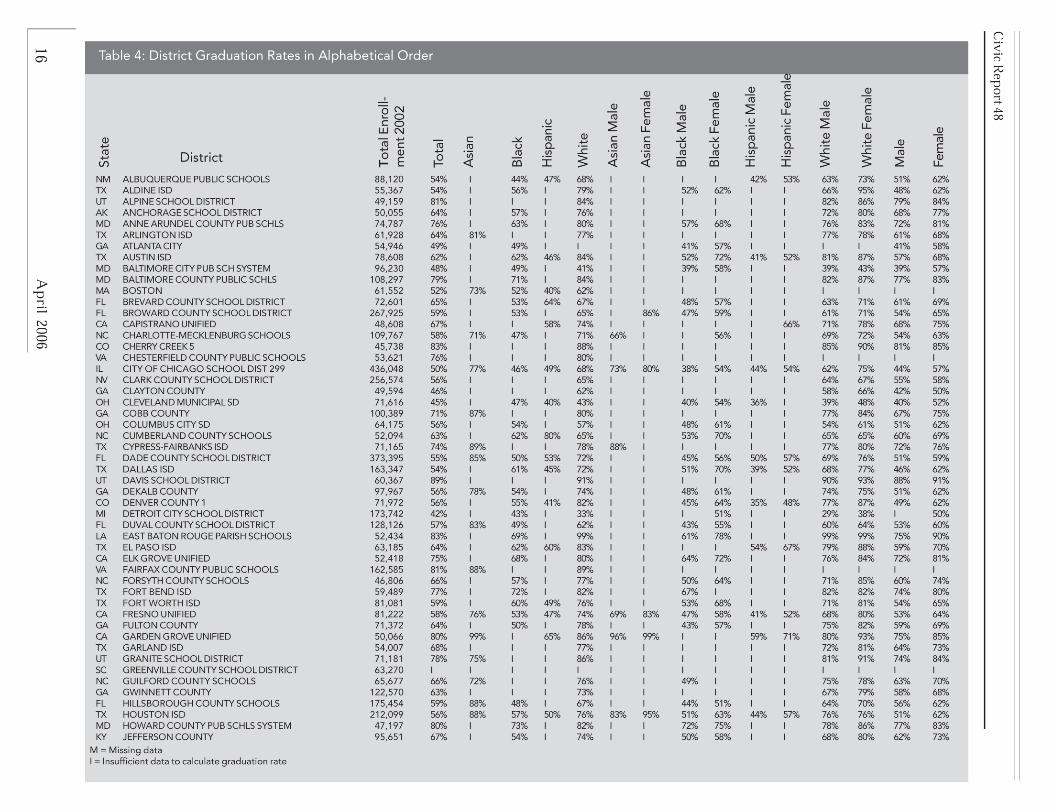
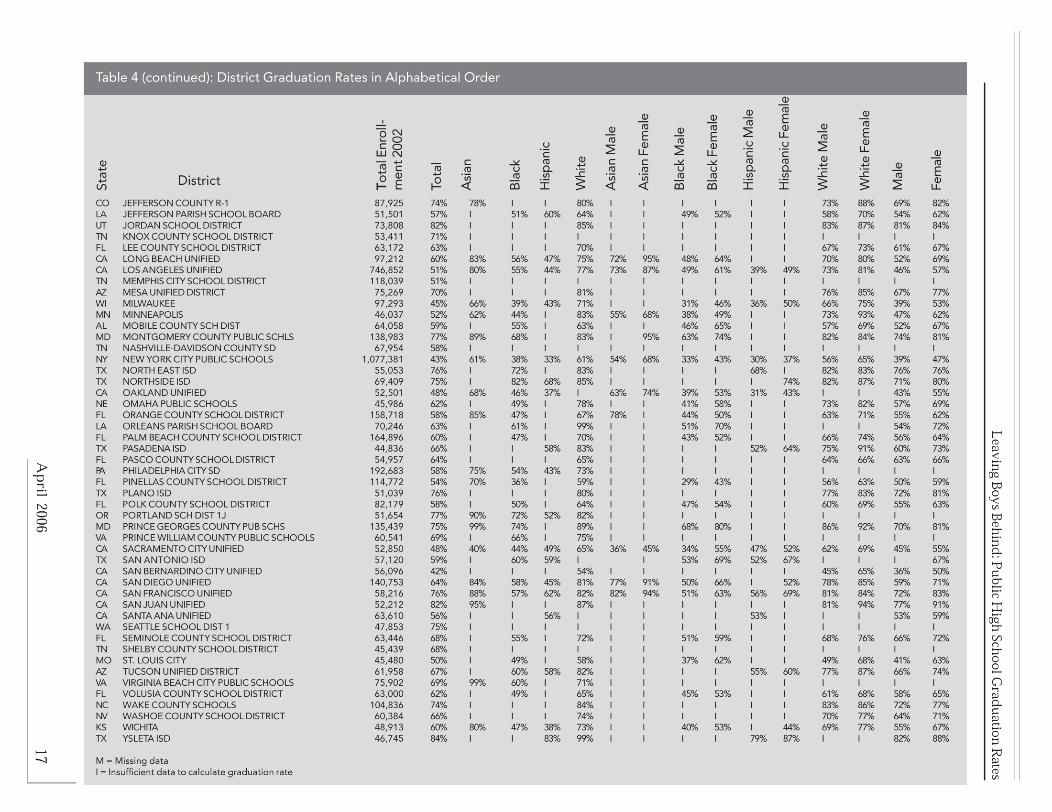
Graduation rates overall and for each subgroup for the 100 largest school districts (and a few other districtsof interest) are reported in order of the district’s total enrollments in 2002 in Table 3, and alphabetically inTable 4.14 The appearance that larger school districts have lower graduation rates is confirmed by a simplePearson’s correlation, which finds a negative correlation between total enrollment and total graduation rateof -0.32. However, one should be very cautious in making a conclusion about the role of district size ongraduation rates from such a calculation, since this does not account for differences in the populations ofstudents educated in these districts. Larger districts, for example, could have a much higher proportion ofminority students, which might lead to lower overall graduation rates.
Civic Report 48
April 20068
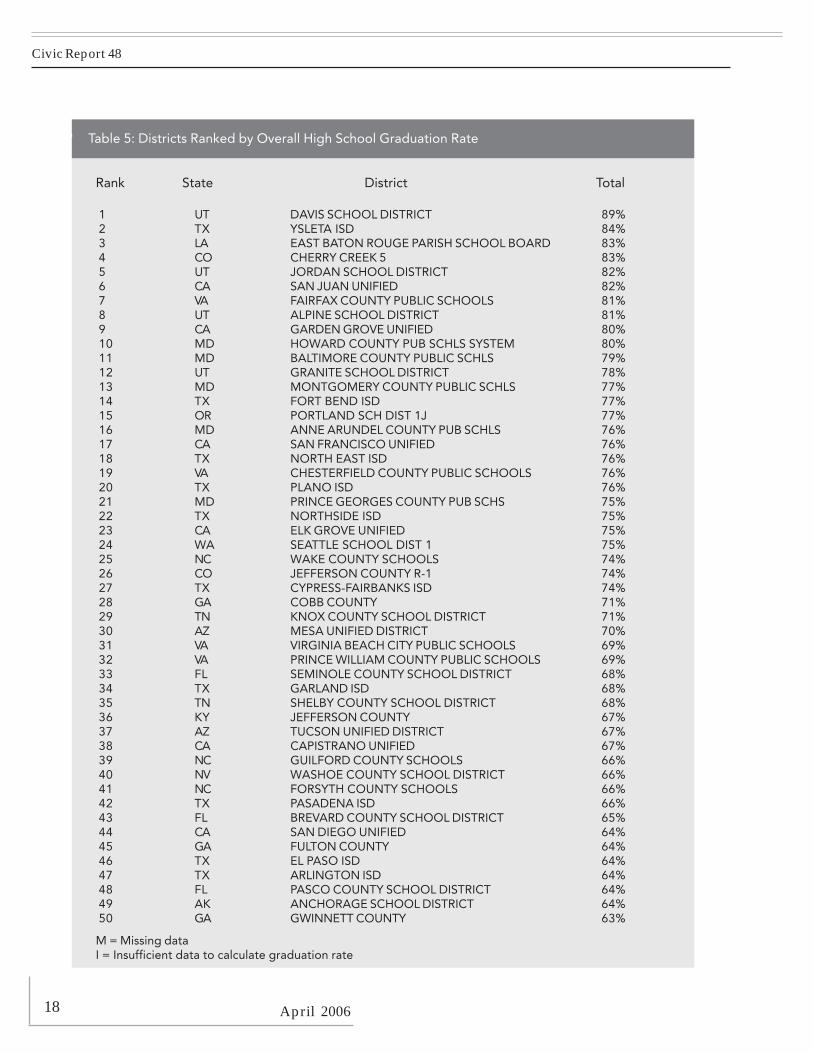
Table 5 ranks the 100 largest school districts by their overall graduation rate. Among the 100 largest schooldistricts, Davis (UT) has the highest graduation rate, at 89 percent, followed by Ysleta (TX) at 84 percent andEast Baton Rouge Parrish (LA) at 83 percent. The lowest graduation rate of the nation’s 100 largest schooldistricts was in San Bernardino (CA), at 42 percent; Detroit (MI) was also at 42 percent, and the nation’slargest school district, New York City, at 43 percent.
CONCLUSION
The graduation rate estimates for the class of 2003 reported in this paper confirm that far fewer studentsgraduate high school than is often realized. It is important for policymakers and the public to understand thatonly about 70 percent of all students and a little more than half of Hispanic and African-American studentsgraduate from high school. While it is not the place of this report to provide guidance on how to improve highschool graduation rates, these results do suggest that there is a graduation problem that needs to be addressed.
Another interesting finding in this report is the difference in high school graduation rates between males andfemales. Females graduate at higher rates for each racial subgroup analyzed in this report, but the gender gapin high school graduation is particularly large for Hispanic and African-American students. The reasons forthis gap should be addressed in future research.
Finally, our calculation of high school graduation rates for the 100 largest school districts suggests that thegraduation problem is centered primarily in the nation’s largest school districts. Only one of the nation’s tenlargest school districts in the nation—where more than 8 percent of all students attend school—graduatesmore than 60 percent of its students. We are not able in this report to define the reasons for such low graduationrates in our nation’s largest school systems; but clearly, if the public is to improve high school graduationrates, it would do well to focus its efforts on the education provided in these urban areas.
Leaving Boys Behind: Public High School Graduation Rates
April 2006 9
ENDNOTES
1. National Governors Association, “Graduation Counts: Redesigning the American High School,” 2005.2. Lawrence Mishel, “The Exaggerated Dropout Crisis,” Education Week, March 8, 2006.3. Phillip Kaufman, “The National Dropout Data Collection System: Assessing Consistency,” paper preparedfor Achieve and the Civil Rights Project, “Dropout Research: Accurate Counts and Positive Interventions,”January 13, 2001.4. We do not know precisely what Mishel claims as the true graduation rate or how he computes it because,as of this writing, he has not yet released the report.5. This report is available online at: http://www.manhattan-institute.org/html/ewp_08.htm.6. Authors’ calculations from CCD and National Center for Education Statistics, Digest of Education Statistics2004, Table 37.7. It appears that state-level diplomas, both overall and by race, will soon be publicly available. However, it isunclear whether these data will be made available by gender or by individual school districts.8. There were several cases in the eighth-grade year in which enrollment data were not reported by gender orrace at the district level. In these cases, we used reasonable proxies for the eighth-grade enrollment. If adistrict was missing eighth-grade enrollment by gender and race (for example, missing African-Americanfemales), our first strategy was to multiply the district’s eighth-grade enrollment by race by the percent of thepopulation of fourteen-year-olds of that race that was male or female in the district’s state as reported by thecensus (i.e., the African-American male number was estimated by multiplying the number of eighth-gradeAfrican-American students by the percent of fourteen-year-old African Americans in that state who weremale). If the eighth-grade enrollment was also missing by race, we inserted the reported eighth-grade enrollmentin the 1999 school year for the enrollment in 1998. Neither calculation is likely to create a strong distortion inthe eighth-grade population, and any such distortion is further contained by the fact that the eighth-gradeenrollment is only one-third of an estimate that is then further adjusted by population changes in the area.9. New Hampshire and South Carolina did not report diplomas by gender.10. Arizona, Idaho, and New Jersey did not report enrollments by race in all necessary years. Populationchanges in Hawaii and the District of Columbia were large enough to require their omission.11. We did not carry out similar computations by district because census data by district are not readilyavailable. Therefore, except for the situation reported in n. 7 above, a district is only included in our estimatesby gender if it reports the necessary enrollments in each year.12. Available at: http://www.census.gov/popest/estimates.php.13. These rules are the same as those in previous evaluations using this method, and were first developed inJay P. Greene and Marcus A. Winters, “Public High School Graduation Rates in the United States,” ManhattanInstitute Civic Report 31, November 2002.14. At the district level, a few graduation rates were estimated to be slightly over 100 percent. This likelyoccurs where there are very high graduation rates, and error inherit in estimation caused a result above 100percent. Since such graduation rates are not possible, in these cases we imputed a graduation rate of 99percent.
Civic Report 48
April 200610
Table 1: State Graduation Rates in Alphabetical Order
State Total Asian Hispanic African- White Asian Asian HispanicAmerican Male Female Male
Alabama 60% I I 52% 65% I I IAlaska 60% I I 56% 65% I I IArizona 71% M M M M M M MArkansas 74% I I 69% 77% I I ICalifornia 65% 81% 56% 56% 73% 79% 83% 51%Colorado 72% I 51% 59% 80% I I 46%Connecticut 82% 89% 53% 67% 91% 81% 98% 48%Delaware 65% I I 57% 69% I I IDistrict of Columbia I I I I I I I IFlorida 61% I 53% 50% 69% I I 49%Georgia 56% I I 48% 64% I I IHawaii I I I I I I I IIdaho 74% M M M M M M MIllinois 73% 85% 54% 49% 85% 85% 85% 49%Indiana 74% I 56% 55% 78% I I IIowa 85% I I I 88% I I IKansas 76% I 51% 54% 83% I I 50%Kentucky 69% I I 55% 72% I I ILouisiana 63% I 80% 55% 70% I I 74%Maine 74% I I I 75% I I IMaryland 75% 92% 71% 65% 81% 94% 90% IMassachusetts 72% 69% I 52% 80% I I 38%Michigan 77% I 48% 57% 80% I I IMinnesota 84% 72% I I 90% I 78% IMississippi 59% I I 60% 66% I I IMissouri 76% I I 63% 80% I I IMontana 76% I I I 80% I I INebraska 84% I 56% 52% 89% I I INevada 67% I 47% 73% 75% M M MNew Hampshire 79% M M M M M M MNew Jersey 88% M M M M M M MNew Mexico 59% I 52% 47% 71% I I 48%New York 58% 62% 33% 38% 74% 58% 66% 29%North Carolina 69% I I 62% 76% I I INorth Dakota 85% I I I 87% I I IOhio 79% I 59% 57% 84% I I IOklahoma 72% I I 64% 79% I I IOregon 70% I 55% I 74% I I IPennsylvania 81% 79% 50% 61% 87% I I 45%Rhode Island 75% I I I 74% 68% I ISouth Carolina 54% M M M M M M MSouth Dakota 79% I I I 83% I I ITennessee 60% I I 49% 59% I I ITexas 69% 81% 59% 67% 78% 78% 84% 55%Utah 77% I I I 82% I I IVermont 78% I I I 80% M M MVirginia 75% 80% I 67% 78% I I IWashington 69% 69% 54% 48% 74% 67% 72% 50%West Virginia 76% I I 64% 77% I I IWisconsin 85% I 54% 46% 92% I I IWyoming 70% I 54% I 72% I I I
National 70% 72% 53% 55% 78% 70% 73% 49%
M = Missing dataI = Insufficient data to calculate graduation rate
APPENDIX
Leaving Boys Behind: Public High School Graduation Rates
April 2006 11
State
AlabamaAlaskaArizonaArkansasCaliforniaColoradoConnecticutDelawareDistrict of ColumbiaFloridaGeorgiaHawaiiIdahoIllinoisIndianaIowaKansasKentuckyLouisianaMaineMarylandMassachusettsMichiganMinnesotaMississippiMissouriMontanaNebraskaNevadaNew HampshireNew JerseyNew MexicoNew YorkNorth CarolinaNorth DakotaOhioOklahomaOregonPennsylvaniaRhode IslandSouth CarolinaSouth DakotaTennesseeTexasUtahVermontVirginiaWashingtonWest VirginiaWisconsinWyoming
National
Table 1 (continued): State Graduation Rates in Alphabetical Order
Hispanic African- African- White White Male FemaleFemale American American Male Female
Male Female
I 47% 58% 62% 69% 56% 64%I 50% I 64% 66% 61% 65%M M M M M M MI 61% 76% 74% 80% 70% 78%61% 50% 62% 71% 76% 62% 70%57% 52% 66% 77% 83% 68% 77%60% 60% 74% 89% 93% 78% 87%I 50% 65% 66% 73% 59% 71%I I I I I I I58% 46% 54% 66% 73% 58% 65%I 41% 54% 60% 67% 51% 61%I I I I I I IM M M M M M M60% 42% 55% 83% 86% 70% 76%63% 47% 63% 75% 80% 71% 77%64% I I 87% 90% 84% 87%I 50% 59% 81% 84% 75% 79%I 53% 58% 71% 74% 69% 72%85% 48% 62% 67% 74% 58% 69%I I I 71% 75% 70% 74%78% 59% 71% 78% 85% 71% 80%I 46% 58% 76% 85% 69% 76%53% 50% 65% 77% 84% 71% 80%I I I 87% 93% 82% 87%I 50% 70% 61% 72% 55% 63%I 55% 71% 78% 82% 74% 80%I I I 79% 81% 78% 80%61% 48% 57% 87% 91% 82% 87%M M M M M M MM M M M M M MM M M M M M M56% I 53% 68% 76% 56% 64%37% 33% 43% 71% 77% 54% 61%I 54% 70% 75% 77% 66% 73%I I I 86% 86% 86% 86%I 52% 62% 82% 86% 77% 81%I 61% 68% 77% 80% 73% 76%I I I 71% 77% 68% 74%56% 54% 68% 85% 88% 79% 84%I I I 68% 76% 65% 71%M M M M M M MI I I 81% 83% 80% 81%I 41% 59% 56% 63% 52% 61%63% 61% 72% 77% 80% 66% 72%52% I I 80% 84% 75% 80%M M M M M M MI 61% 74% 76% 81% 71% 78%60% I I 70% 78% 67% 74%I 58% 70% 75% 79% 74% 79%I 40% 53% 91% 94% 83% 88%59% I I 69% 76% 67% 75%
58% 48% 59% 74% 79% 65% 72%
M = Missing dataI = Insufficient data to calculate graduation rate
Civic Report 48
April 2006
1 New Jersey 88%2 Iowa 85%3 Wisconsin 85%4 North Dakota 85%5 Minnesota 84%6 Nebraska 84%7 Connecticut 82%8 Pennsylvania 81%9 Ohio 79%10 South Dakota 79%11 New Hampshire 79%12 Vermont 78%13 Michigan 77%14 Utah 77%15 Missouri 76%16 Montana 76%17 West Virginia 76%18 Kansas 76%19 Rhode Island 75%20 Maryland 75%21 Virginia 75%22 Idaho 74%23 Indiana 74%24 Maine 74%25 Arkansas 74%26 Illinois 73%27 Oklahoma 72%28 Massachusetts 72%29 Colorado 72%30 Arizona 71%31 Oregon 70%32 Wyoming 70%33 Washington 69%34 North Carolina 69%35 Kentucky 69%36 Texas 69%37 Nevada 67%38 California 65%39 Delaware 65%40 Louisiana 63%41 Florida 61%42 Alaska 60%43 Tennessee 60%44 Alabama 60%45 Mississippi 59%46 New Mexico 59%47 New York 58%48 Georgia 56%49 South Carolina 54%50 District of Columbia I51 Hawaii I
M = Missing dataI = Insufficient data to calculate graduation rate
Rank State Total Graduation Rate
Table 2: States Ranked by Overall High School Graduation Rate
12

Leaving Boys Behind: Public High School Graduation Rates
April 2006 13
Civic Report 48
April 2006
1 UT DAVIS SCHOOL DISTRICT 89%2 TX YSLETA ISD 84%3 LA EAST BATON ROUGE PARISH SCHOOL BOARD 83%4 CO CHERRY CREEK 5 83%5 UT JORDAN SCHOOL DISTRICT 82%6 CA SAN JUAN UNIFIED 82%7 VA FAIRFAX COUNTY PUBLIC SCHOOLS 81%8 UT ALPINE SCHOOL DISTRICT 81%9 CA GARDEN GROVE UNIFIED 80%10 MD HOWARD COUNTY PUB SCHLS SYSTEM 80%11 MD BALTIMORE COUNTY PUBLIC SCHLS 79%12 UT GRANITE SCHOOL DISTRICT 78%13 MD MONTGOMERY COUNTY PUBLIC SCHLS 77%14 TX FORT BEND ISD 77%15 OR PORTLAND SCH DIST 1J 77%16 MD ANNE ARUNDEL COUNTY PUB SCHLS 76%17 CA SAN FRANCISCO UNIFIED 76%18 TX NORTH EAST ISD 76%19 VA CHESTERFIELD COUNTY PUBLIC SCHOOLS 76%20 TX PLANO ISD 76%21 MD PRINCE GEORGES COUNTY PUB SCHS 75%22 TX NORTHSIDE ISD 75%23 CA ELK GROVE UNIFIED 75%24 WA SEATTLE SCHOOL DIST 1 75%25 NC WAKE COUNTY SCHOOLS 74%26 CO JEFFERSON COUNTY R-1 74%27 TX CYPRESS-FAIRBANKS ISD 74%28 GA COBB COUNTY 71%29 TN KNOX COUNTY SCHOOL DISTRICT 71%30 AZ MESA UNIFIED DISTRICT 70%31 VA VIRGINIA BEACH CITY PUBLIC SCHOOLS 69%32 VA PRINCE WILLIAM COUNTY PUBLIC SCHOOLS 69%33 FL SEMINOLE COUNTY SCHOOL DISTRICT 68%34 TX GARLAND ISD 68%35 TN SHELBY COUNTY SCHOOL DISTRICT 68%36 KY JEFFERSON COUNTY 67%37 AZ TUCSON UNIFIED DISTRICT 67%38 CA CAPISTRANO UNIFIED 67%39 NC GUILFORD COUNTY SCHOOLS 66%40 NV WASHOE COUNTY SCHOOL DISTRICT 66%41 NC FORSYTH COUNTY SCHOOLS 66%42 TX PASADENA ISD 66%43 FL BREVARD COUNTY SCHOOL DISTRICT 65%44 CA SAN DIEGO UNIFIED 64%45 GA FULTON COUNTY 64%46 TX EL PASO ISD 64%47 TX ARLINGTON ISD 64%48 FL PASCO COUNTY SCHOOL DISTRICT 64%49 AK ANCHORAGE SCHOOL DISTRICT 64%50 GA GWINNETT COUNTY 63%
Table 5: Districts Ranked by Overall High School Graduation Rate
Rank State District Total
18
M = Missing dataI = Insufficient data to calculate graduation rate

Leaving Boys Behind: Public High School Graduation Rates
April 2006
51 LA ORLEANS PARISH SCHOOL BOARD 63%52 FL LEE COUNTY SCHOOL DISTRICT 63%53 NC CUMBERLAND COUNTY SCHOOLS 63%54 TX AUSTIN ISD 62%55 FL VOLUSIA COUNTY SCHOOL DISTRICT 62%56 NE OMAHA PUBLIC SCHOOLS 62%57 FL PALM BEACH COUNTY SCHOOL DISTRICT 60%58 CA LONG BEACH UNIFIED 60%59 KS WICHITA 60%60 FL BROWARD COUNTY SCHOOL DISTRICT 59%61 FL HILLSBOROUGH COUNTY SCHOOL DISTRICT 59%62 TX FORT WORTH ISD 59%63 AL MOBILE COUNTY SCH DIST 59%64 TX SAN ANTONIO ISD 59%65 PA PHILADELPHIA CITY SD 58%66 FL ORANGE COUNTY SCHOOL DISTRICT 58%67 NC CHARLOTTE-MECKLENBURG SCHOOLS 58%68 FL POLK COUNTY SCHOOL DISTRICT 58%69 CA FRESNO UNIFIED 58%70 TN NASHVILLE-DAVIDSON COUNTY SD 58%71 FL DUVAL COUNTY SCHOOL DISTRICT 57%72 LA JEFFERSON PARISH SCHOOL BOARD 57%73 NV CLARK COUNTY SCHOOL DISTRICT 56%74 TX HOUSTON ISD 56%75 GA DEKALB COUNTY 56%76 CO DENVER COUNTY 1 56%77 OH COLUMBUS CITY SD 56%78 CA SANTA ANA UNIFIED 56%79 FL DADE COUNTY SCHOOL DISTRICT 55%80 TX DALLAS ISD 54%81 FL PINELLAS COUNTY SCHOOL DISTRICT 54%82 NM ALBUQUERQUE PUBLIC SCHOOLS 54%83 TX ALDINE ISD 54%84 MA BOSTON 52%85 MN MINNEAPOLIS 52%86 CA LOS ANGELES UNIFIED 51%87 TN MEMPHIS CITY SCHOOL DISTRICT 51%88 IL CITY OF CHICAGO SCHOOL DIST 299 50%89 MO ST. LOUIS CITY 50%90 GA ATLANTA CITY 49%91 MD BALTIMORE CITY PUB SCH SYSTEM 48%92 CA SACRAMENTO CITY UNIFIED 48%93 CA OAKLAND UNIFIED 48%94 GA CLAYTON COUNTY 46%95 WI MILWAUKEE 45%96 OH CLEVELAND MUNICIPAL SD 45%97 NY NEW YORK CITY PUBLIC SCHOOLS 43%98 MI DETROIT CITY SCHOOL DISTRICT 42%99 CA SAN BERNARDINO CITY UNIFIED 42%100 SC GREENVILLE COUNTY SCHOOL DISTRICT I
Table 5 (continued): Districts Ranked by Overall High School Graduation Rate
Rank State District Total
19
M = Missing dataI = Insufficient data to calculate graduation rate
ADVISORY BOARD
Stephen Goldsmith, Chairman EmeritusMayor Jerry BrownMayor Manuel A.DiazMayor Martin O’MalleyMayor Rick Baker
FELLOWS
Jay P. GreeneHoward Husock
George L. KellingEdmund J. McMahon
Peter D. Salins
The Center for Civic Innovation’s (CCI) purpose is to improve the quality of life in cities by shaping public policyand enriching public discourse on urban issues.
CCI sponsors the publication of books like The Entrepreneurial City: A How-To Handbook for Urban Innovators,which contains brief essays from America’s leading mayors explaining how they improved their cities’ qualityof life; Stephen Goldsmith’s The Twenty-First Century City, which provides a blueprint for getting America’scities back into shape; and George Kelling and Catherine Coles’s Fixing Broken Windows, which explores thetheory widely credited with reducing the rate of crime in New York and other cities. CCI also hosts conferences,publishes studies, and holds luncheon forums where prominent local and national leaders are given opportunitiesto present their views on critical urban issues. Cities on a Hill, CCI’s newsletter, highlights the ongoing work ofinnovative mayors across the country.
The Manhattan Institute is a 501(C)(3) nonprofit organization. Contributions are tax-deductible to the fullestextent of the law. EIN #13-2912529
STAFF
Mark Riebling, Editorial DirectorLindsay Young Craig, Executive Director, CommunicationsErin A. Crotty, Program OfficerClarice Z. Smith, Press Officer
Non-ProfitOrganizationUS Postage
PAIDPermit 04001
New York, NY