health effects of air pollution - 4cleanair.org · health effects of air pollution c. arden pope...
TRANSCRIPT

Health Effects of Air Pollution
C. Arden Pope III
Mary Lou Fulton Professor of Economics
National Association of Clean Air Agencies Spring Membership Meetings
St. Louis, Missouri May 5-8, 2013

The Global Burden of Disease 2010
Bre
athi
ng
Con
tam
inan
ts

The Global Burden of Disease 2010
Breathing contaminates contributes to global burden of disease (GBD)
Number of attributable
deaths
Disability adjusted life-years (DALYs)
Tobacco Smoking 5.7 mil. 5.7% Second Hand Smoke 0.6 mil. 0.6% Household air pollution from solid fuels 3.5 mil. 4.5% Ambient PM air pollution 3.2 mil. 3.1% Ambient Ozone 0.2 mil. 0.1%


Early “Killer smog” episodes demonstrated that air pollution at extreme levels can contribute to respiratory and cardiovascular disease and death
Dec. 5-9, 1952: London--1000’s of excess deaths
Dec. 1-5, 1930: Meuse Valley, Belgium 60 deaths (10x expected)
Oct. 27-31, 1948: Donora, PA 20 deaths, ½ the town’s population fell ill
Respiratory and cardiovascular disease and death

London Fog Episode, Dec. 1952
From: Brimblecombe P. The Big Smoke, Methu

Utah Valley, 1980s • Winter inversions trap local pollution • Natural test chamber
• Local Steel mill contributed ~50% PM2.5 • Shut down July 1986-August 1987 • Natural Experiment

Large difference in air quality when inversions trap air pollution in valley
Utah Valley: Clean day
Utah Valley: Dirty day (PM10 = 220 µg/m3)

Sources: Pope. Am J Pub Health.1989; Pope. Arch Environ Health. 1991
When the steel mill was open, total children’s hospital admissions for respiratory conditions approx. doubled.
µ g/m
3 /Num
bers
of A
dmis
sion
s
0
50
100
150
200
250
300
PM10 concentrations Children's respiratory hospital admissions
Mean PM10
levels forMonthsIncluded
Mean HighPM10
levels forMonthsIncluded
PneumoniaandPleurisy
Bronchitisand Asthma
Total
Mill Open
Mill Closed

Health studies take advantage of highly variable air pollution levels that result from inversions.
98 99 00 01 02 03 04 05 06 07 08 09 100
10
20
30
40
50
60
70
80
90
100
Utah Valley (Lindon Monitor)
Salt Lake Valley (Hawthorn Monitor)
g/
m3

Daily changes in air pollution daily death counts
Time (days)
# of
Dea
ths
Utah Valley

% in
crea
se in
mor
talit
y
0
1
2
3
Estimates frommeta analysis
Estimates from Multicity studies
29 c
ities
(Lev
y et
al.
2000
)
GA
M-b
ased
stu
dies
(Stie
b et
al.
2002
, 200
3)
Una
djus
ted
(And
erso
n et
al.
2005
)
6 U
.S. c
ities
(Kle
mm
and
Mas
on 2
003)
8 C
anad
ian
citie
s(B
urne
tt an
d G
oldb
erg
2003
)
9 C
alifo
rnia
n ci
ties
(Ost
ro e
t al.
2006
)
10 U
.S c
ities
(Sch
war
tz 2
000,
200
3)
14 U
.S c
ities
, cas
e-cr
osso
ver
(Sch
war
tz 2
004)
NM
MA
PS
, 20-
100
U.S
. citi
es(D
omin
ici e
t al.
2003
)A
PH
EA
-2, 1
5-29
Eur
opea
n ci
ties
(Kat
souy
anni
et a
l. 20
03)
9 Fr
ench
citi
es(L
e Te
rtre
et a
l. 20
02)
13 J
apan
ese
citie
s(O
mor
i et a
l. 20
03)
Non
GA
M-b
ased
stu
dies
(Stie
b et
al.
2002
, 200
3)
Pub
licat
ion
bias
adj
uste
d (A
nder
son
et a
l. 20
05)
7 K
orea
n ci
ties
(Lee
et a
l. 20
00)
20
g/m
3 PM
10
20
g/m
3 PM
10
20
g/m
3 PM
10
20
g/m
3 PM
10
20
g/m
3 PM
10
10
g/m
3 PM
2.5
20
g/m
3 PM
10
10
g/m
3 PM
2.5
10
g/m
3 PM
2.5
20
g/m
3 PM
10
20
g/m
3 PM
10
20
g/m
3 PM
10
20
g/m
3 BS
40
g/m
3 TS
P
20
g/m
3 SP
M
Rev
iew
of A
sian
Lit.
--8
stud
ies
(HE
I Rep
ort,
Tabl
e TS
2)20
g/
m3 P
M10
20
g/m
3 PM
10
20
g/m
3 PM
10
Estimates frommeta analysisfrom Asian Lit
PA
PA
Stu
dies
--4
stud
ies
(HE
I Rep
ort,
Tabl
e TS
2)
Asi
an L
it. in
corp
orat
ing
PA
PA
stu
dies
(HE
I Rep
ort,
Tabl
e TS
2)
18 L
atin
Am
. stu
dies
(P
AH
O 2
005)
20
g/m
3 PM
10
10 µg/m3 PM2.5 or 20 µg/m3 PM10 → 0.4% to 1.5% increase in relative risk of mortality—Small but remarkably consistent across meta-analyses and multi-city studies.
Daily time-series studies ***of over 200 cities***

Methods: Case-crossover study of acute
ischemic coronary events (heart attacks and unstable angina) in 12,865 well-defined and followed up cardiac patients who lived on Utah’s Wasatch Front
…and who underwent coronary angiography
Jeffrey Anderson
2006;114:2443-48

y t
0
1
t
Binary Data, classic time-series
y t
0
1
t
Binary Data, case-crossover
Conditional Logistic Reg.
Each subject serves as his/her own control. Control for subject-specific effects, day of week, season, time-trends, etc.—by matching

Prob (Yt = 1) 1 - Prob (Yt = 1)
α1 + α2 + α3 + . . . + α12,865 + β(w0Pt + w1Pt-1 + w2Pt-2 + . . .) Control by matching for: All cross-subject differences (in this case, 12,865 subject-level fixed effects), Season and/or month of year, Time trends, Day of week
( ) = ln
Conditional logistic regression:
Modeling controversies: How to select control or referent periods. Time stratified referent selection approach (avoids bias that can occur due to time trends in exposure) (Holly Janes, Lianne Sheppard, Thomas Lumley Statistics in Medicine and Epidemiology 2005)

%
0.00
5.00
10.00
15.00
Figure 1. Percent increase in risk (and 95% CI) of acute coronary events associated with 10 g/m3 of PM2.5, or PM10 for different lag structures.
Con
curr
ent d
ay
Con
curr
ent d
ay
1-da
y la
g
1-da
y la
g
2-da
y la
g
2-da
y la
g
3-da
y la
g
3-da
y la
g
2-da
y m
ovin
g av
.
2-da
y m
ovin
g av
.
4-da
y m
ovin
g av
.
3-da
y m
ovin
g av
.
3-da
y m
ovin
g av
.
4-da
y m
ovin
g av
.
PM2.5
PM10

%
-10.00
-5.00
0.00
5.00
10.00
15.00
20.00
Figure 2. Percent increase in risk (and 95% CI) of acute coronary events associated with 10 µg/m3 of PM2.5, stratified by various characteristics.
All a
cute
cor
onar
y
Subs
eque
nt M
I
Uns
tabl
e An
gina
Age<
65 Age>
=65
Mal
eFe
mal
e
Smok
ing
Non
Sm
okin
g
BMI<
30BM
I>=3
0 CH
F,ye
sC
HF,
no Hyp
erte
nsio
n,ye
sH
yper
tens
ion,
no
Hyp
erlip
idem
ia,y
esH
yper
lipid
emia
,no
Dia
bete
s,ye
sD
iabe
tes,
no
Fam
ily h
isto
ry,y
esFa
mily
his
tory
,no
# ofDiseasedVessels
# of Risk Factors
0 12
3
0
1
2
3
4+
Inde
x M
I
Short-term PM exposures contributed to acute coronary events, especially among patients with underlying coronary artery disease.

Dale Renlund
Abdallah Kfoury
Benjamin Horne


Short-term changes in air pollution exposure are associated with:
• Daily death counts (respiratory and cardiovascular)
• Hospitalizations
• Lung function
• Symptoms of respiratory illness
• School absences
• Ischemic heart disease
• Etc.

Longer-term air pollution exposure has been linked to even substantially larger health effects.

Median PM2.5 for aprox. 1980
8 10 12 14 16 18 20 22 24 26 28 30 32 34
Adj
uste
d M
orta
lity
for 1
980
(Dea
ths/
Yr/1
00,0
00)
600
650
700
750
800
850
900
950
1000
Age-, sex-, and race- adjusted population-based mortality rates in U.S. cities for 1980 plotted over various indices of particulate air pollution (From Pope 2000).

An Association Between Air Pollution and Mortality in Six U.S. Cities
1993
Dockery DW, Pope CA III, Xu X, Spengler JD, Ware JH, Fay ME, Ferris BG Jr, Speizer FE.
Methods: 14-16 yr prospective follow-up of 8,111adults living in six U.S. cities.
Monitoring of TSP PM10, PM2.5, SO4, H+, SO2, NO2, O3 .
Data analyzed using survival analysis, including Cox Proportional Hazards Models.
Controlled for individual differences in: age, sex, smoking, BMI, education, occupational exposure.

Average Polluted cities
Highly Polluted cities
Clean cities

Adjusted risk ratios (and 95% CIs) for cigarette smoking and PM2.5
Cause of Death
Current Smoker, 25 Pack years
Most vs. Least Polluted City
All 2.00 (1.51-2.65)
1.26 (1.08-1.47)
Lung Cancer
8.00 (2.97-21.6)
1.37 (0.81-2.31)
Cardio-pulmonary
2.30 (1.56-3.41)
1.37 (1.11-1.68)
All other
1.46 (0.89-2.39)
1.01 (0.79-1.30)


25 July 1997

Dan Krewski Rick Burnett Mark Goldberg and 28 others

Legal uncertainty largely resolved with 2001 unanimous ruling by the U.S. Supreme Court.

Perc
ent i
ncre
ase
in m
orta
lily
risk
(95%
CI)
-10
0
10
20
30
40
50
60
70
80
90
100
110
120180
190All Cause CPD CVD IHD
U.S. Medicare Cohort studies: •Eftim et al. Epidemiology 2008 •Zegar et al. EHP 2008 Cohorts of Medicare participants cities of the 6-cities and ACS study, plus all U.S.
U.S. Medicare Cohort Studies

Modern air pollution science has resulted in new and tighter standards in the U.S. for air pollution—especially PM2.5
Contemporary Science
Public Policy Results 1997: New PM2.5 standards (24-hr 65 µg/m3, annual 15 µg/m3) 2006: PM2.5 24-hr standard revised (35 µg/m3) 2012: PM2.5 annual standard revised (12 µg/m3)
1990 - 2013: Continued general improvements in air quality
1989+ Time-series studies 1993+ Prospective cohort mortality studies 1997+ 100’s of other including tox., clinical, etc.

So, an obvious question—
Has reducing air pollution resulted in substantial and measurable improvements in human health?

- Matching PM2.5 data for 1979-1983 and 1999-2000 in 51 Metro Areas - Life Expectancy data for 1978-1982 and 1997-2001 in 211 counties in 51 Metro areas - Evaluate changes in Life Expectancy with changes in PM2.5 for the 2-decade period of approximately 1980-2000.
Fine-Particulate Air Pollution and Life Expectancy in the United States
C. Arden Pope, III, Ph.D., Majid Ezzati, Ph.D., and Douglas W. Dockery, Sc.D.
January 22, 2009
Do cities with bigger improvements in air quality have bigger improvements in health, measured by life expectancy?

Reduction in PM2.5, 1980-2000
0 2 4 6 8 10 12 14
0.0
Reduction in PM2.5, 1980-2000
0 2 4 6 8 10 12 14
Res
idua
l cha
nges
in L
E c
ontro
lling
for c
ovar
iate
s
-2.5
-2.0
-1.5
-1.0
-0.5
0.0
0.5
1.0
1.5
2.0
2.5
22
47 49
45 4
10 17
19
46
48 6 43 50
24
21
36 8
34
20 7
25
1
11
12
14
44 51
27 3 28
30
32 13
18
26
9
29
23
37
38 40
15
33
5
2
35 31
16 39
41 42
B
YES. On average, the greater the reduction in air pollution, the greater the increase in life expectancy.

Francesca Dominici

Cardiovascular disease as part of chronic and acute inflammatory processes.
By the early 2000s, there was increasingly compelling evidence that inflammation is a major accomplice with LDL cholesterol in the initiation and progression of atherosclerosis.
Furthermore, inflammation contributes to acute thrombotic complications of atherosclerosis, increasing the risk of making atherosclerotic plaques more vulnerable to rupture, clotting, and precipitating acute cardiovascular or cerebrovascular events (MI or ischemic stroke).

Interactive effects of hs-CRP (marker of inflammation) and blood lipids. Ridker PM. 2001;103:1813-1818.
Paul Ridker

Fine Particulate exposure
↓ Pulmonary and
systemic inflammation
and oxidative stress
(along with blood lipids) ↓
Progression and destabilization of
atherosclerotic plaques

Experimental evidence of biological effects of PM extracted from filters (Ghio, Costa, Devlin, Kennedy, Frampton, Dye, et al. 1998-2004)
• Acute airway injury and inflammation in rats and humans • In vitro oxidative stress and release of proinflammatory mediators by cultured respiratory epithelial cells • Differential toxicities of PM when the mill was operating versus when it was not (metals content and mixtures?)

PM exposure ↓
Pulmonary inflammation ↓
Systemic inflammatory responses (including release of inflammatory
mediators, bone marrow stimulation and release of leukocytes and platelets)
↓ Progression and destabilization of
atherosclerotic plaques
In rabbits naturally prone to develop atherosclerosis they found that:
PM exposure ↓↓
Accelerated progression of atherosclerotic plaques with greater vulnerability to plaque rupture
A series of studies by van Eeden, Hogg, Suwa et al. (1997-2002) suggest:
Stephan van Eeden
James Hogg

Sun et al. (JAMA 2005)
Representative Photomicrographs of Aortic Arch Sections Normal Chow High-Fat Chow
Clean Filtered Air
Clean Filtered Air
PM Polluted Air PM Polluted Air
apoE-/- mouse Sun QH Lippmann M

Blood • Altered rheology
• Increased coagulability • Translocated particles • Peripheral thrombosis
• Reduced oxygen saturation
Systemic Inflammation Oxidative Stress
• Increased CRP • Proinflammatory mediators
• Leukocyte & platelet activation
PM Inhalation
Brain
• Increased cerebrovascular ischemia
Heart
• Altered cardiac autonomic function
• Increased dysrhythmic susceptibility
• Altered cardiac repolarization
•Increased myocardial Ischemia
•Heart failure exacerbation
Vasculature • Atherosclerosis,
accelerated progression of and destabilization of plaques • Endothelial dysfunction
• Vasoconstriction and Hypertension
Lungs • Inflammation
• Oxidative stress • Accelerated progression
and exacerbation of COPD • Increased respiratory symptoms
• Effected pulmonary reflexes • Reduced lung function
Pope and Dockery, JAWMA 2006.

Brook, Rajagopalan, Pope, et al. 2011 AHA Scientific Statement, PM and CVD

Biggest criticisms regarding the overall results: 1. The effects aren’t big enough to be compelling (need RR > 2.0)
2. The effects are too large to be biologically plausible based on
an extrapolation of smoking literature.

0 60 120 180 240
Adju
sted
Rel
ativ
e R
isk
1.0
1.5
2.0
estimated daily dose of PM2.5, mg
18-22cigs/day
Pack-a-day smoker: RR ~ 2 Daily inhaled dose ~ 240 mg
Live in polluted city or With smoking spouse RR ~ 1.15 – 1.35 Daily inhaled dose ~ 0.2–1.0 mg


0 60 120 180 240 300
Adju
sted
Rel
ativ
e R
isk
1.0
1.5
2.0
2.5
<3cigs/day
estimated daily dose of PM2.5, mg
23+cigs/day
8-12cigs/day
13-17cigs/day
18-22cigs/day
4-7cigs/day
Pope, Burnett, Krewski, et al. 2009.
Figure 1. Adjusted relative risks (and 95% CIs) of IHD (light gray), CVD (dark gray), and CPD (black) mortality plotted over estimated daily dose of PM2.5 from different increments of current cigarette smoking. Diamonds represent comparable mortality risk estimates for PM2.5 from air pollution. Stars represent comparable pooled relative risk estimates associated with SHS exposure from the 2006 Surgeon General’s report and from the INTERHEART study.

0.1 1.0 10.0 100.0
Adju
sted
Rel
ativ
e R
isk
1.0
1.5
2.0
2.5
estimated daily dose of PM2.5, mg
Exposure from
Second hand cigarette smoke: Stars, from 2006 Surgeon General Report and INTERHEART studyAnd air pollution: Hex, from Womens Health Initiative cohort Diamonds, from ACS cohort Triangles, Harvard Six Cities cohort
Exposure from smoking<3, 4-7, 8-12, 13-17, 18-22, and 23+
cigarettes/day
Figure 2. Adjusted relative risks (and 95% CIs) of ischemic heart disease (light gray), cardiovascular (dark gray), and cardiopulmonary (black) mortality plotted over baseline estimated daily dose (using a log scale) of PM2.5 from current cigarette smoking (relative to never smokers), SHS, and air pollution.

0 60 120 180 240 300 360 420 480 540
Adju
sted
Rel
ativ
e R
isk
1.0
1.5
2.0
2.5
3.0
(<3)
Estimated daily dose of PM2.5, mg (cigarettes smoked per day)
(4-7)
Adju
sted
Rel
ativ
e R
isk
5
10
15
20
25
30
35
40
(8-12) (13-17) (18-22) (23-27) (28-32) (33-37) (38-42) (>42)
Lung Cancer
Ischemic heart (light gray)Cardiovascular (dark gray)Cardiopulmonary (black)
0.0 0.5 1.01.00
1.25
1.50
0.0 0.5 1.01.00
1.25
1.50


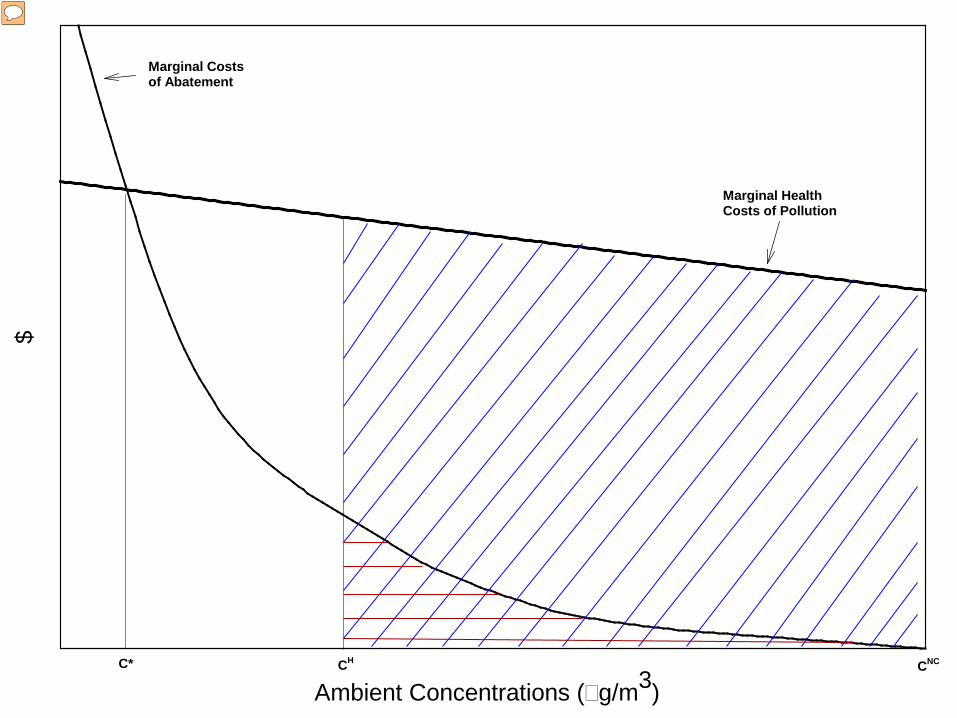
Ambient Concentrations (g/m3)
$
C* CH
Marginal Costsof Abatement
Marginal HealthCosts of Pollution
CNC

Ambient Concentrations (g/m3)
$
C* CH
Marginal Costsof Abatement
Marginal HealthCosts of Pollution
CNC

Ambient Concentrations (g/m3)
$
C* CH
Marginal Costsof Abatement
Marginal HealthCosts of Pollution
CNC
Pollution Abatement

Ambient Concentrations (g/m3)
$
C* CH
Marginal Costsof Abatement
Marginal HealthCosts of Pollution
CNC
Ambient Concentrations (g/m3)
$
C* CH
Marginal Costsof Abatement
Marginal HealthCosts of Pollution
CNC

Ambient Concentrations (g/m3)
$
C* CH
Marginal Costsof Abatement
Marginal HealthCosts of Pollution
CNC