group8=fast food nikita
DESCRIPTION
Group8=fast food nikitaTRANSCRIPT

Running Head: FINAL PROJECT REPORT i
Marketing Analytics Project Report
Quick Service Restaurant Analysis
Submitted By: (Group-8) Abhinandan Narayan (M003/12) Hemlata Meena (M018/12) Pallavi Srivastava (M023/12) Vineet Rai (M051/12) Nakul Bindlish (M093/12) Nikita Johari (M095/12)

M. ANALYTICS REPORT – GROUP 8 ii
TABLE OF CONTENTS
1. INTRODUCTION...................................................................................................................................1
1.1. Quick Service Restaurants...........................................................................................................1
Mc Donald’s.........................................................................................................................................1
KFC.......................................................................................................................................................1
PIZZA HUT............................................................................................................................................2
SUB WAY..............................................................................................................................................2
2. ABOUT THE PROJECT...........................................................................................................................2
3. LITERATURE REVIEW............................................................................................................................4
4. RESEARCH METHODOLOGY.................................................................................................................5
4.1. ABOUT THE SAMPLE:...................................................................................................................5
4.2. CHOICE OF SCALE:........................................................................................................................5
4.3. Measurement Tool......................................................................................................................5
4.4. Reliability Tests............................................................................................................................6
Reliability for Ambience.......................................................................................................................6
Reliability for Food Quality..................................................................................................................7
Reliability for Service Quality...............................................................................................................7
Reliability Analysis for Menu_Offerings...............................................................................................8
Reliability analysis for Prices................................................................................................................9
Reliability Analysis for Value Added Services.....................................................................................10
5. ANALYSIS...........................................................................................................................................11
5.1. GAP Analysis..............................................................................................................................11
Determining the Customer Preference parameters..........................................................................11
KFC.....................................................................................................................................................12
Mc Donald’s.......................................................................................................................................12
SUBWAY............................................................................................................................................13
PIZZA HUT..........................................................................................................................................14
COMPARATIVE ANALYSIS...................................................................................................................14
FINAL RESULT.....................................................................................................................................14

M. ANALYTICS REPORT – GROUP 8 iii
5.2. Perceptual Mapping using Multi-Dimensional Scaling...............................................................16
5.3. Binary Logistic Regression..........................................................................................................17
5.4. Structural Equation Modeling....................................................................................................19
6. CONCLUSION.....................................................................................................................................22
6.1. CONCLUSION – GAP ANALYSIS...................................................................................................22
6.2. CONCLUSION – PERCEPTUAL MAPPING.....................................................................................22
6.3. CONCLUSION – BINARY LOGISTIC REGRESSION.........................................................................22
6.4. CONCLUSION – Structural Equation Modeling...........................................................................23
7. Bibliography.......................................................................................................................................24
Appendix A – Questionnaire Designed for Project...................................................................................A-1
Appendix B – Tabulated Responses from the public................................................................................B-1
Appendix C – Results Sheet......................................................................................................................C-1

M. ANALYTICS REPORT – GROUP 8 iv
LIST OF FIGURES
Figure 1: 5 – Point Likert Scale Employed....................................................................................................5Figure 2: Reliability Analysis for ‘Ambience’................................................................................................6Figure 3: Reliability Analysis for ‘Food Quality’............................................................................................7Figure 4: Reliability Analysis for ‘Service Quality’........................................................................................7Figure 5: Reliability Analysis for ‘Menu Offerings’.......................................................................................8Figure 6: Reliability Analysis for ‘Prices’......................................................................................................9Figure 7: Reliability Analysis for ‘Value Added Services’............................................................................10Figure 8: T-values for individual attributes................................................................................................11Figure 9: Gap analysis for KFC....................................................................................................................12Figure 10: Gap analysis for Mc Donald’s....................................................................................................13Figure 11: Gap analysis for Subway...........................................................................................................13Figure 12: Gap analysis for Pizza Hut.........................................................................................................14Figure 13: Comparative analysis................................................................................................................14Figure 14: Weights of each QSR.................................................................................................................15Figure 15: Customer Mind Map for various QSR.......................................................................................15Figure 16: Perceptual Mapping of various QSR.........................................................................................16Figure 17: Perceptual Mapping (contd.)....................................................................................................17Figure 18: Generating Binary Logistic Regression response......................................................................18Figure 19: Binary Logistic Regression (contd.)...........................................................................................18Figure 20: Initial proposed SEM Model......................................................................................................19Figure 21: Improved SEM Model...............................................................................................................20Figure 22: Final derived SEM Model..........................................................................................................23
M. ANALYTICS REPORT – GROUP 8 1
1. INTRODUCTION
1.1.Quick Service Restaurants
A Quick Service Restaurant is synonymously known as a “fast food restaurant”. It is a specific type of restaurant characterized by the following –
Fast food cuisine Minimal table service Offered from a limited menu Cooked in bulk in advance and kept hot Usually available ready to take away Seating may be provided
Modern commercial Quick Service Restaurants are highly optimized by standardizing their processes. Quick Service Restaurants are known for fast, efficient, take-out-ready foods at affordable prices.
For our project, we have considered the following Quick Service Restaurants –
Mc Donald’s
The McDonald's Corporation is the world's largest chain of fast food restaurants, serving around 68 million customers daily in 119 countries. It is headquartered in the United States. The company began in 1940 as a barbecue restaurant operated by Richard and Maurice McDonald; in 1948 they reorganized their business as a hamburger stand using production line principles.
A McDonald's restaurant is operated by a franchisee, an affiliate, or the corporation itself. The corporation's revenues come from the rent, royalties and fees paid by the franchisees, as well as sales in company-operated restaurants.
KFC
KFC (Kentucky Fried Chicken) is a fast food restaurant chain which specializes in fried chicken and is headquartered in Louisville, Kentucky. It is the world's second largest restaurant chain overall (as measured by sales) after McDonald's, with over 18,000 outlets in 120 countries. The company is a subsidiary of Yum! Brands.

M. ANALYTICS REPORT – GROUP 8 2
KFC was founded by Harland Sanders, a colorful figure who began selling fried chicken from his roadside restaurant in Corbin, Kentucky, during the Great Depression. Sanders identified the potential of the restaurant franchising concept, and the first "Kentucky Fried Chicken" franchise opened in Utah in 1952. KFC popularized chicken in the fast food industry, diversifying the market by challenging the established dominance of the hamburger.
PIZZA HUT
Pizza Hut is an American restaurant chain and international franchise that offers different styles of pizza along with side dishes including salad, pasta, breadsticks, and garlic bread. Pizza Hut was founded on June 15, 1958 by brothers Dan and Frank Carney in their hometown of Wichita, Kansas.
Corporately known as Pizza Hut, Inc., it is a subsidiary of Yum! Brands, Inc., the world's largest restaurant company.
As of 2012, there were more than 6,000 Pizza Hut restaurants in the United States, and more than 5,139 store locations in 94 other countries and territories around the world.
SUB WAY
Subway is an American fast food restaurant franchise that primarily sells submarine sandwiches (subs) and salads. It was founded in August 28, 1965 by Peter Buck and Fred Deluca.
It is owned and operated by Doctor's Associates, Inc. Subway is one of the fastest growing franchises in the world with 40,043 restaurants in 102 countries and territories as of 27 August 2013. It is the largest single-brand restaurant chain and the largest restaurant operator globally.
2. ABOUT THE PROJECT
In this project, we attempted to analyze the Quick Service Restaurants using marketing analytics tools and techniques. Broadly, we intend to do the following analysis –
Gap Analysis Perceptual Mapping Logistic Regression

M. ANALYTICS REPORT – GROUP 8 3
Structural Equation Modeling
For the analysis, we collected a sizeable amount of representable responses.
For the survey, a questionnaire was designed (Please refer to Appendix A for the questionnaire). The questionnaire had the following sections –
1. Personal Information2. Following constructs and related attributes
I. AMBIENCE : The environment inside the restaurant in terms of the following - Interior Furniture Lighting Music Odor Cleanliness Temperature
II. FOOD QUALITY : The quality of food in terms of the following attributes - Taste Freshness Aroma Presentation
III. SERVICE QUALITY : The quality of service gauged in terms of the following attributes- Lead Time Behavior of Staff Service offered by Staff
IV. MENU OFFERINGS: The range of offerings/ menu offered Veg Options Non Veg Options Customization Revision of Menu Addition of new items / year
V. PRICE : The price factor involved Affordability Discounts Combos Payment Options
VI. VALUE ADDED SERVICES : Additional offerings apart from the core product Home Delivery Delivery Time Commitment Special Offers

M. ANALYTICS REPORT – GROUP 8 4
Discount CouponsVII. CUSTOMER SATISFACTION INDEX : How satisfied are the consumers
Satisfaction Level Value for money Consider Revisiting
3. LITERATURE REVIEW
Quick Service Restaurant (QSR) has become one of the major segments in the food service industry. With more and more customers, in particular, the younger generations are being pulled towards this segment and they are becoming more and more demanding in terms of higher quality food preparation and taste, good hygienic conditions, superior customer service, healthier food choices, value for money etc. There is a lot of literature, which studies the impact of organizations image on customer behavior and customer loyalty. According to Kisang Ryu, Heesup Han and Tae-Hee Kim (Kisang Ryu) quick –casual restaurant image and perceived value has a significant role in influencing customer satisfaction. Quick service restaurants image, consumer satisfaction and perceived values are significant predictors of consumer’s behavior intentions i.e. to revisit or not to visit the restaurant again. This also has an impact on customer loyalty. The Image (Baloglu and Brinberg, 1997) is defined as “the sum of beliefs, ideas, and impressions that people have of a place or destination “. Quick service restaurant image is directly dependent on consumer’s perception of attributes like ambience, food quality, service quality, price, menu offerings, value added service and customer satisfaction.
Customer satisfaction is very important factor in the success of restaurants especially QSR. Customer satisfaction is a perception based on the overall eating experience (pleasurable experience) of the customer and this pleasurable experience will depend on the Quality of the restaurant. Food quality that consists of presentation, freshness, taste, temperature and healthy option is an important attribute leading to customer satisfaction. It alone has the potential to lure consumers to revisit the restaurant (Sulek & Hensely, 200 4) and is a contributing factor in QSRs success. The level of service Quality i.e. the quality of service received by the consumer greatly enhances the overall customer experience and satisfaction. Studies have shown that simple gestures like smiling; speaking softly has a positive impact on customer satisfaction and gives a competitive edge over its rivals. This also increases the level of customer retention and frequency of visits.
There is a relationship between consumer value of eating out and importance of fast food restaurant attributes. Consumer values of eating out are divided into hedonic and utilitarian factors (Park) .The hedonic values of eating out relates to quick service, taste of food, cleanliness, employee kindness and various facilities and which are positively correlated, whereas utilitarian value consists of reasonable price, promotional incentives and quick service. Hedonic factors influence customer’s more than utility factors in terms of frequency of visits. Therefore, Quick service restaurants give more importance to

M. ANALYTICS REPORT – GROUP 8 5
hedonic factors than utility factors in marketing their image. Value added service like coupon promotion has a positive impact on consumer retention. A coupon promotion in quick service restaurants increases the sales during the promotion period and also attracts past customers back into the fold. (Tolbert.)
Physical environment like ambience, decorations and spatial layout has a strong impact on customer’s perception of pricing and this perception of pricing has an impact on the satisfaction level of consumer and customer loyalty (Ryu). Decoration and artifacts has more impact on pricing perception than other three physical attributes. Therefore, restaurateurs consistently keep improving their physical environment to improve customer satisfaction and customer loyalty. (Robert J Harrington)
4. RESEARCH METHODOLOGY
4.1.ABOUT THE SAMPLE:
The data was collected from July 2013 to August 2013 for a period of 1 month. A sample of 101 respondents was collected, 6 of the responses were deleted using listwise deletion (Bryne 2010). The sample includes 76 Males and 19 Females. Maximum Number of respondents lies between the age group of 20-30 with no income (students).
4.2.CHOICE OF SCALE:
A five point likert scale has been used with the value 1 assigned to the minimum level for a particular attribute and the value 5 assigned to the maximum level for that attribute.
Figure 1: 5 – Point Likert Scale Employed
4.3.Measurement Tool
An Online Questionnaire was employed to measure consumer response on the following Constructs:
Age Income
M. ANALYTICS REPORT – GROUP 8 6
Gender importance and satisfaction attached to Ambience importance and satisfaction attached to Food Quality importance and satisfaction attached to Service Quality importance and satisfaction attached to Menu Offerings importance and satisfaction attached to Price importance and satisfaction attached to Value Added Services Level of satisfaction Decision to visit again
4.4.Reliability Tests
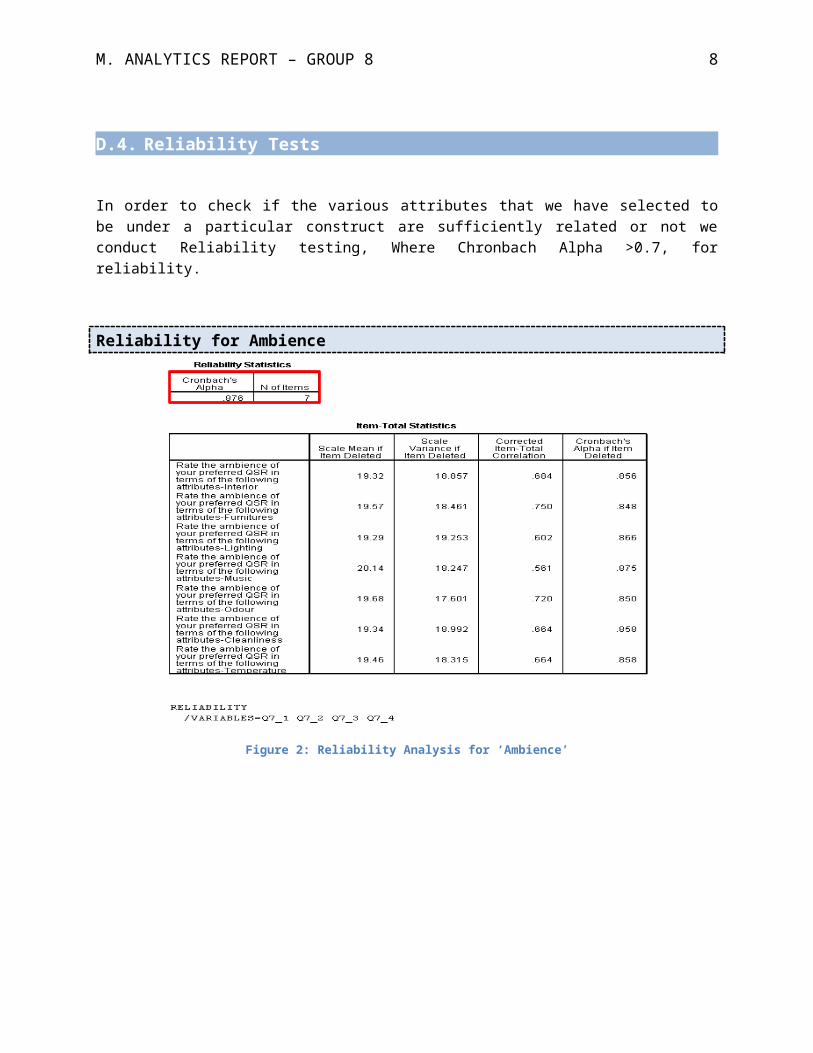
In order to check if the various attributes that we have selected to be under a particular construct are sufficiently related or not we conduct Reliability testing, Where Chronbach Alpha >0.7, for reliability.
Reliability for Ambience
Figure 2: Reliability Analysis for ‘Ambience’

M. ANALYTICS REPORT – GROUP 8 7
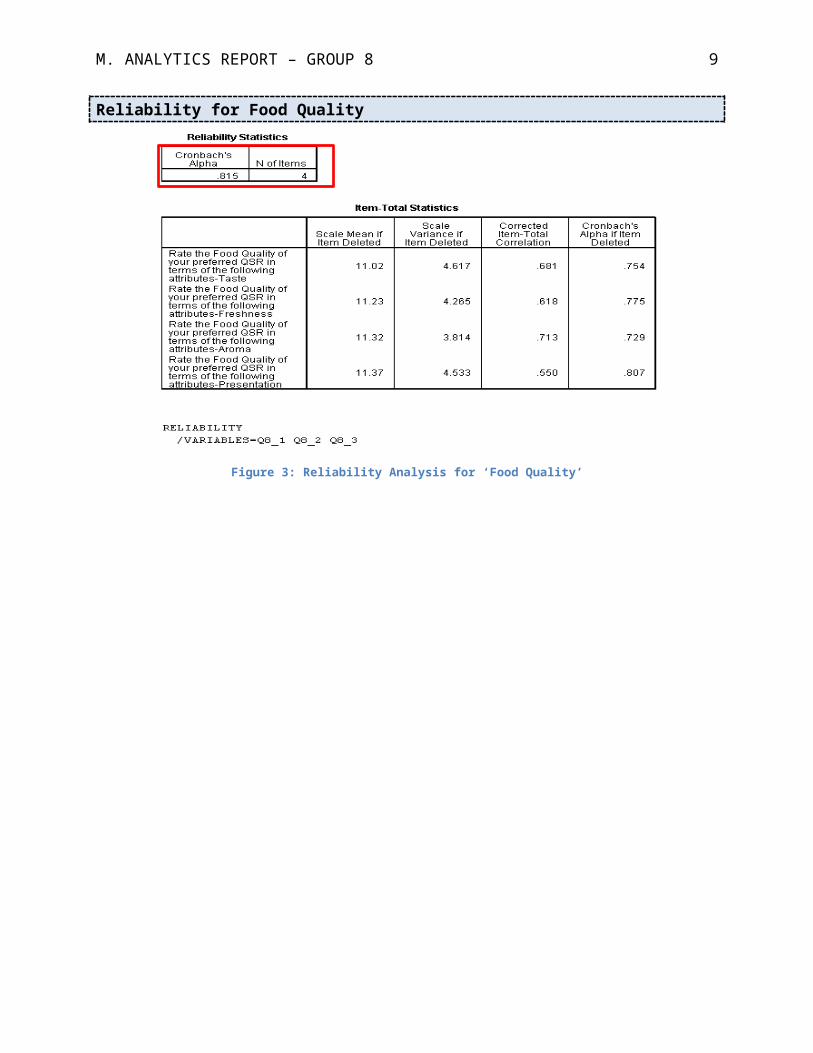
Reliability for Food Quality
Figure 3: Reliability Analysis for ‘Food Quality’
Reliability for Service Quality
Figure 4: Reliability Analysis for ‘Service Quality’
M. ANALYTICS REPORT – GROUP 8 8
Reliability Analysis for Menu_Offerings
Figure 5: Reliability Analysis for ‘Menu Offerings’
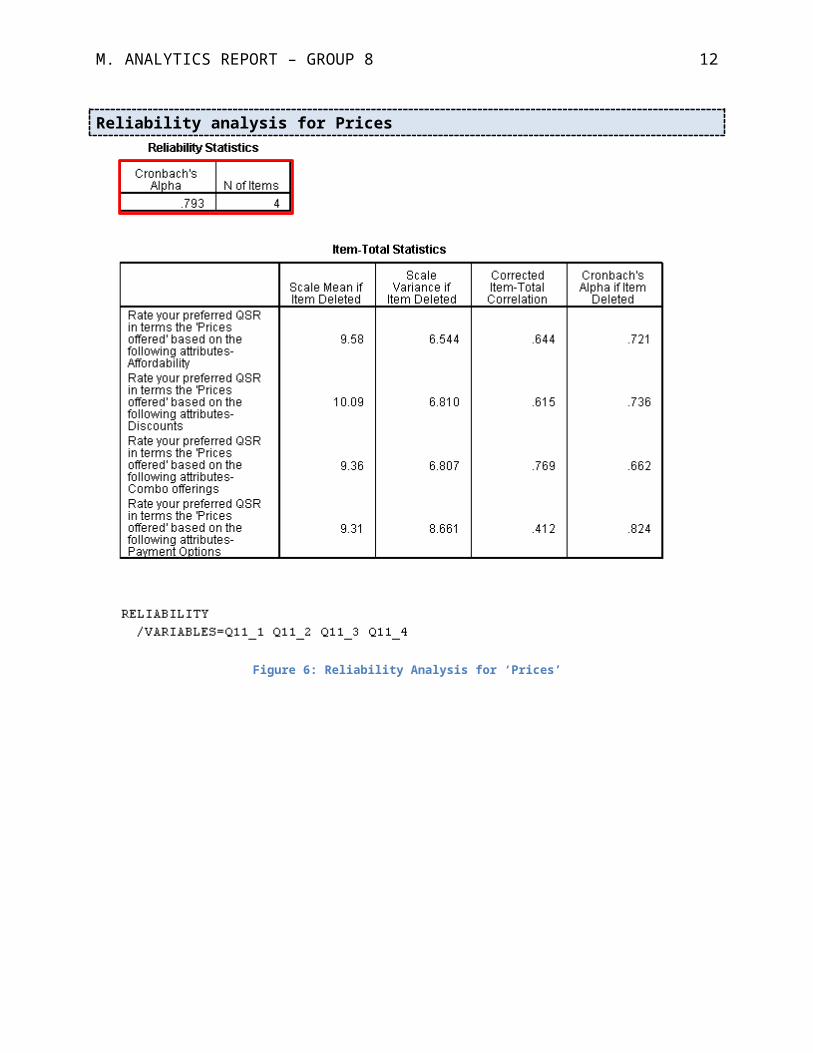
Here Chronbach’s alpha is increasing to 0.718 if we remove the variable non-veg offerings. But we do not remove it because we assume that the data is subjected to some sampling bias that is the number of vegetarians is more than the number of non-vegetarians, which should not be the case ideally.
M. ANALYTICS REPORT – GROUP 8 9
Reliability analysis for Prices
Figure 6: Reliability Analysis for ‘Prices’

M. ANALYTICS REPORT – GROUP 8 10
Reliability Analysis for Value Added Services
Figure 7: Reliability Analysis for ‘Value Added Services’
Calculating Composite Variables:
Odour +Music +Cleanliness +Interior +Furniture +Lighting +Temperature=Ambience Taste+Freshness+Aroma+Presentation=Food Quality Lead Time +Staff Behavior+ Staff Service=Service Quality Veg-options +Non Veg Options+Customization+Menu Revision +New Additions= Menu Offerings Discounts+combo offerings+Affordability+Payment Options =Price Home Delivery+Delivery time commitment+Special offers+Discount Coupons=Value Addition

M. ANALYTICS REPORT – GROUP 8 11
5. ANALYSIS
The responses from willing patrons were fed into SPSS 16® (Please refer to Appendix B for data responses) and results were tabulated based on the questions below:
5.1.GAP Analysis
Data Rearrangement: To conduct Gap Analysis all the respondents who have chosen the same restaurant (i.e. filled the same answer for question 5 , which QSR do you visit the most, KFC, Mc Donald’s, Subway or Pizza Hut) , have been put together making 4 groups of respondents according to whether they chose KFC, Mc Donald’s, Subway or Pizza Hut.
Determining the Customer Preference parameters
The t-values are calculated for each of the attributes ambience, Food Quality, Service Quality, Offerings, Price, Value Added Services, According to importance attached to each by the customers as shown in below Table:
Figure 8: T-values for individual attributes
M. ANALYTICS REPORT – GROUP 8 12
We see that people give importance to Food Quality and Service Quality (taking parameters where t>1.645).
We then find the t-values separately for each of the 4 restaurants and find out which are the attributes that are significantly satisfied by each of the four restaurants. We also see as to whether these restaurants are able to significantly satisfy the attributes to which customers give importance as seen in the following Tables.
(Note that each of the constructs are calculated using simple average of component attributes i.e. COMPOSITE_Attribute_X = (Attribute_X_1 + Attribute_X_2+ Attribute_X_3 +……Attribute_X_n) /n)
KFC
KFC: Significantly satisfies ambience, food quality , service Quality attributes.
Figure 9: Gap analysis for KFC
Mc Donald’s
Mc Donald’s significantly satisfies Ambience, Food Quality, Service Quality, Offerings and Price attributes.

M. ANALYTICS REPORT – GROUP 8 13
Figure 10: Gap analysis for Mc Donald’s
SUBWAY
Subway: Significantly satisfies Food Quality, Service Quality attributes
Figure 11: Gap analysis for Subway

M. ANALYTICS REPORT – GROUP 8 14
PIZZA HUT
Pizza Hut Significantly satisfies Ambience, Food Quality, Service Quality attributes
Figure 12: Gap analysis for Pizza Hut
COMPARATIVE ANALYSIS
Figure 13: Comparative analysis
Comparing the t-values(>1.645) of all the restaurants with the t-values (>1.645) for importance, we see that all the restaurants significantly fulfill the attributes food quality and Service Quality that customers consider important.
FINAL RESULT
Finally we compute the weights of each of the attributes and then take the sum of the weighted values for each restaurant as shown below:
M. ANALYTICS REPORT – GROUP 8 15
Figure 14: Weights of each QSR
We see that Mc Donald’s has the highest weighted value of 3.382; hence it scores above the other restaurants.
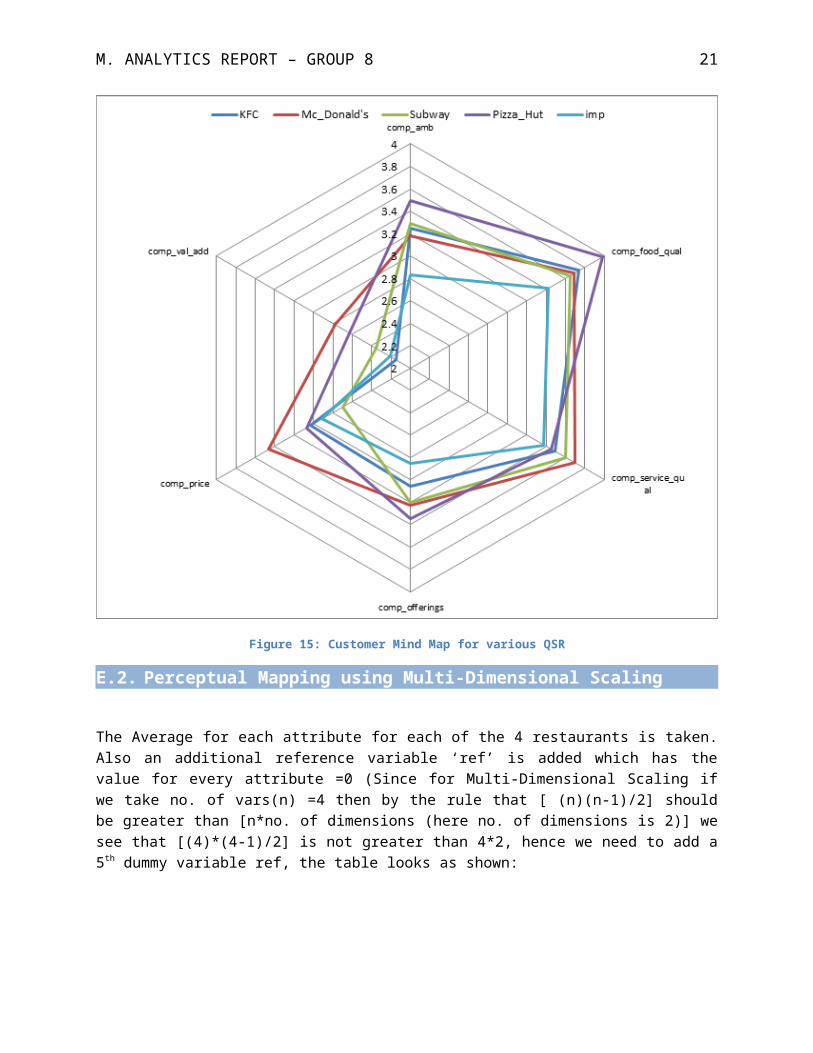
The Radar Chart is as follows:
Figure 15: Customer Mind Map for various QSR

M. ANALYTICS REPORT – GROUP 8 16
5.2.Perceptual Mapping using Multi-Dimensional Scaling
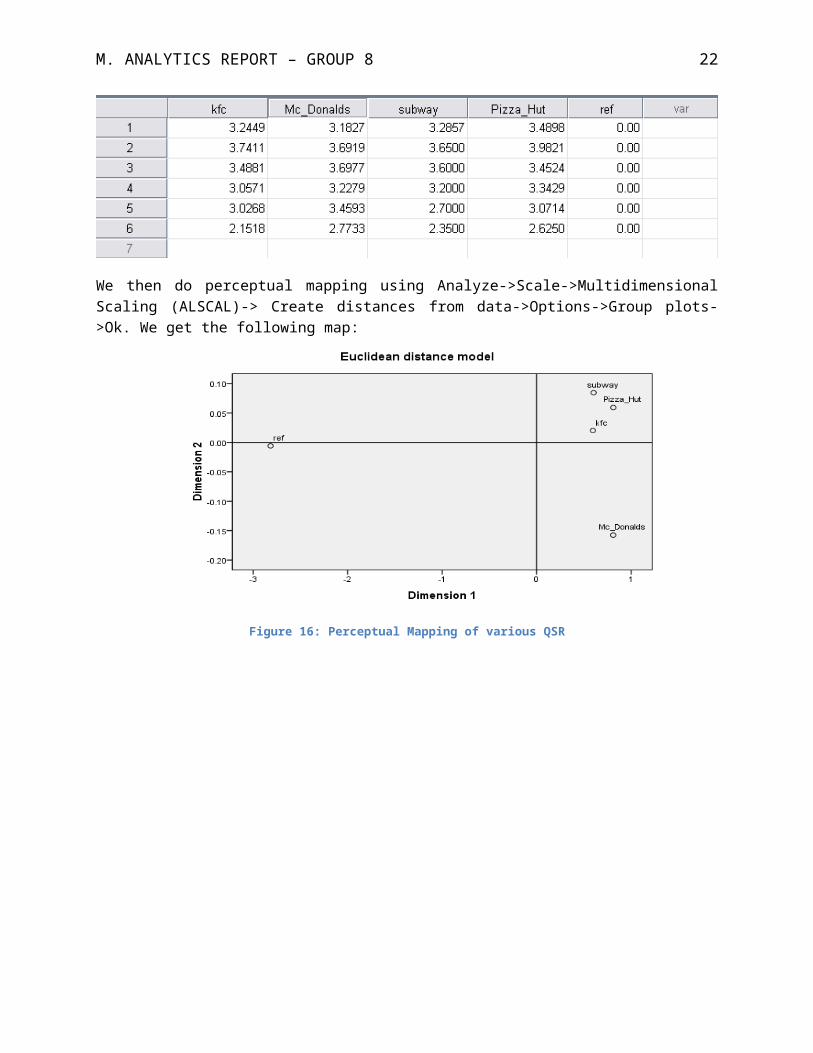
The Average for each attribute for each of the 4 restaurants is taken. Also an additional reference variable ‘ref’ is added which has the value for every attribute =0 (Since for Multi-Dimensional Scaling if we take no. of vars(n) =4 then by the rule that [ (n)(n-1)/2] should be greater than [n*no. of dimensions (here no. of dimensions is 2)] we see that [(4)*(4-1)/2] is not greater than 4*2, hence we need to add a 5th dummy variable ref, the table looks as shown:
We then do perceptual mapping using Analyze->Scale->Multidimensional Scaling (ALSCAL)-> Create distances from data->Options->Group plots->Ok. We get the following map:
Figure 16: Perceptual Mapping of various QSR

M. ANALYTICS REPORT – GROUP 8 17
Figure 17: Perceptual Mapping (contd.)
From the map and the table we deduce that Dimension_1 refers to an attribute where KFC & Subway have similar values and Mc Donald’s & Pizza Hut have similar values. From the SPSS table, dimension_1 is attribute ‘4’ which is Menu offerings. Looking at the map we see that Dimension_2 is an attribute where Mc Donald’s differs significantly from KFC, Subway and Pizza Hut. From the SPSS table we find this to be attribute ‘5’ which is Pricing.
5.3.Binary Logistic Regression
Dependent variable: Are you satisfied with the restaurant and will visit it again (Y/N?)
Covariates: Age, Income, gender, Imp_ambience, Imp_Food_Quality, Imp_Service_Quality, Imp_Offerings, Imp_price, Imp_value_add_serve.
To make analysis easier the dependent variable is recoded, i.e. ‘Yes’ is recoded as 1 and ‘No’ is recoded as 0. Thereafter Logistic regression is done using Analyze->Regression->Binary Logistic ->Method-> Forward LR->Ok.

M. ANALYTICS REPORT – GROUP 8 18
The Following Output is generated:
Figure 18: Generating Binary Logistic Regression response
We see that Step 3 is the Terminating step.
Hit Rate is 81.1% (>70% is acceptable)
Figure 19: Binary Logistic Regression (contd.)

M. ANALYTICS REPORT – GROUP 8 19
LOGIT Function is ‘z’= [ -10.33+1.159*imp_amb+.942*imp_food_qual+1.245*imp_price]
5.4. Structural Equation Modeling
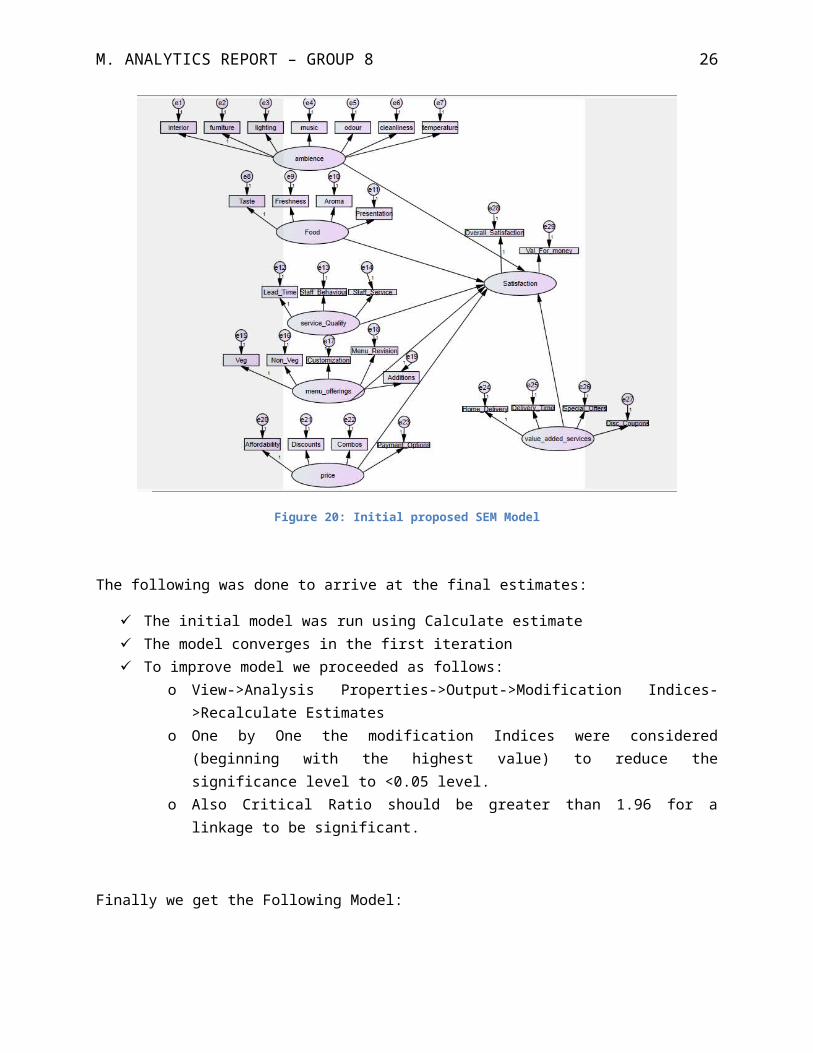
The following Diagram shows the initial proposed model:
Figure 20: Initial proposed SEM Model
The following was done to arrive at the final estimates:
The initial model was run using Calculate estimate The model converges in the first iteration To improve model we proceeded as follows:
o View->Analysis Properties->Output->Modification Indices->Recalculate Estimateso One by One the modification Indices were considered (beginning with the highest value)
to reduce the significance level to <0.05 level.o Also Critical Ratio should be greater than 1.96 for a linkage to be significant.

M. ANALYTICS REPORT – GROUP 8 20
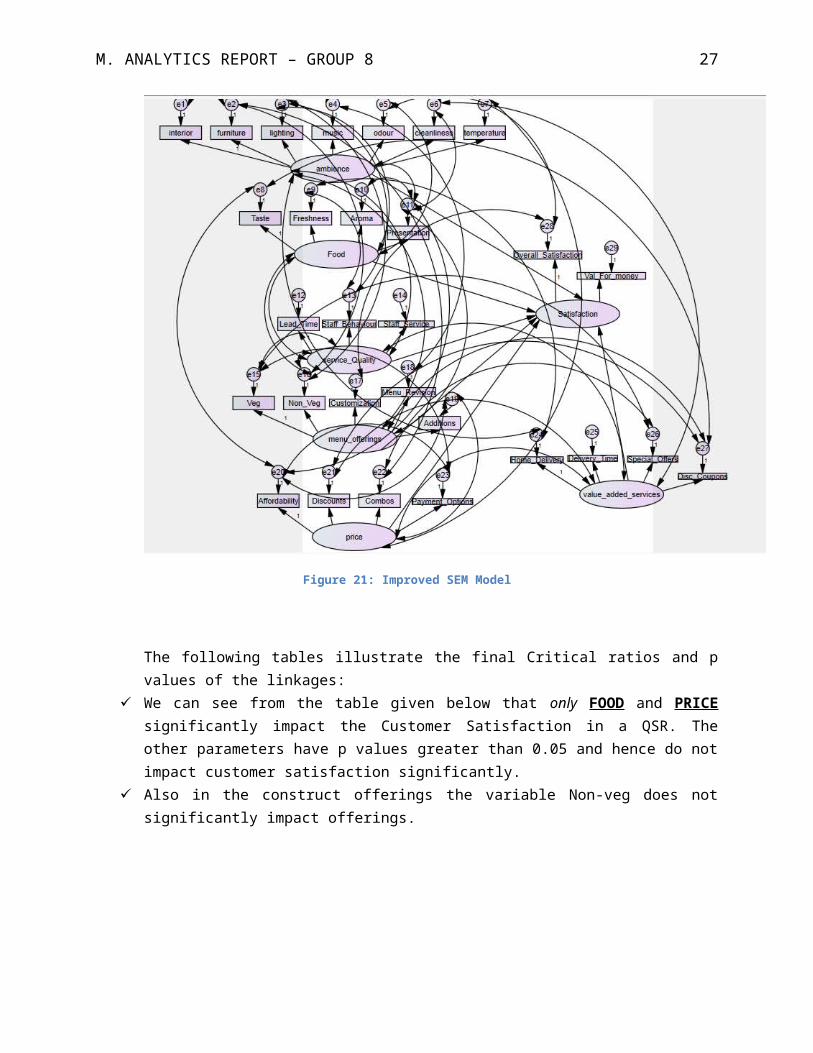
Finally we get the Following Model:
Figure 21: Improved SEM Model
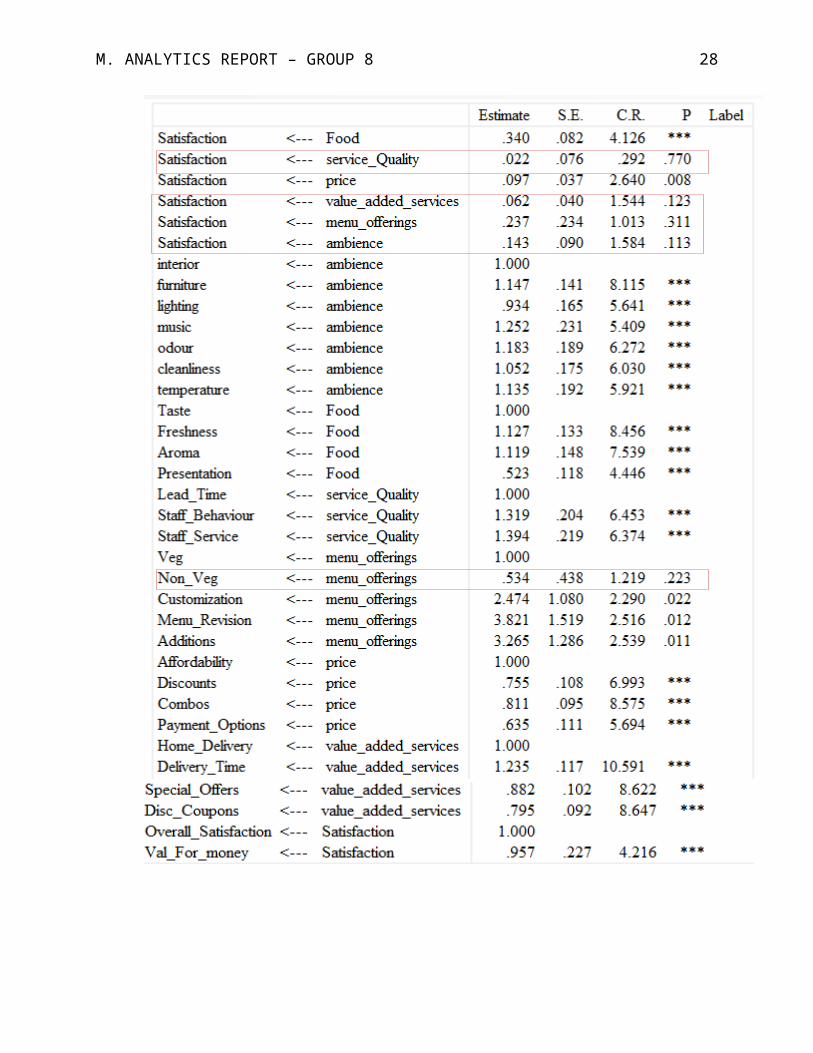
The following tables illustrate the final Critical ratios and p values of the linkages: We can see from the table given below that only FOOD and PRICE significantly impact the
Customer Satisfaction in a QSR. The other parameters have p values greater than 0.05 and hence do not impact customer satisfaction significantly.
Also in the construct offerings the variable Non-veg does not significantly impact offerings.
M. ANALYTICS REPORT – GROUP 8 21
M. ANALYTICS REPORT – GROUP 8 22
6. CONCLUSION
6.1.CONCLUSION – GAP ANALYSIS
There is a Gap in the customer’s expectation of price and the price given by Subway, Hence subway needs to consider an alternative pricing approach.
There is a Gap in the customer’s expectation of Value added Services and the value added services given by KFC, Hence KFC needs to provide some more relevant value added services.
6.2.CONCLUSION – PERCEPTUAL MAPPING
Mc Donald’s is perceived to be different than the other QSRs and occupies a unique position in the customer’s mind.
6.3.CONCLUSION – BINARY LOGISTIC REGRESSION
The probability of customers coming to a QSR increases in accordance with the extent to which Ambience, Food Quality and Price attributes meet the customer demand. This can be concluded since all the coefficients for the individual variables in the LOGIT Function are positive.

M. ANALYTICS REPORT – GROUP 8 23
6.4.CONCLUSION – Structural Equation Modeling
Figure 22: Final derived SEM Model

M. ANALYTICS REPORT – GROUP 8 24
7. BIBLIOGRAPHY
Kisang Ryu, H. H.-H. (n.d.). The relationships among overall quick- casual restaurant image, perceived value, customer satisfaction, and behavioral intentions.
Park, C. (n.d.). Efficient or enjoyable? Consumer values of eating out and fast food restaurant consumption in Korea.
Robert J Harrington, M. C. (n.d.). Generation Y consumers: Key restaurant attributes affecting positive and negative experiences.
Ryu, H. H. (n.d.). The roles of the physical Environment, Price perception and Customer satisfaction in determining Customer Loyalty in the Restaurant Industry.
Tolbert., G. A. (n.d.). Coupon promotions in quick service restaurants: preaching to the converted?

M. ANALYTICS REPORT – GROUP 8 1
A. Appendix A – Questionnaire Designed for Project
Personal Information
1. Agea) 20-25b) 25-30c) 30-40d) 40-50e) Above 50
2. Sexa) Maleb) Female
3. Income Group (Annual in INR)a) Below Rs. 300000b) 300000 – 600000c) 600001 – 100000d) 1000001 – 1500000e) Above 1500000f) Student
4. When do you generally visit a QSR like KFC, Mac Donald’s etc?a) Weekendsb) Occasions (Ceremony / Birthday)c) Hang out with friendsd) Family outinge) Frequent / Almost regular
5. Which QSR do you visit the most?a) KFCb) Mc Donald’sc) Sub Wayd) Pizza Hut
Rate your preferred QSR under the following constructs
AMBIENCE
6. Rate the ambience in terms of the following attributes
Poor Fair Good Very Good Excellent
M. ANALYTICS REPORT – GROUP 8 2
INTERIOR 1-------------------2-----------------3------------------4---------------5
FURNITURES 1-------------------2------------------3-----------------4---------------5
LIGHTING 1-------------------2-----------------3------------------4---------------5
MUSIC 1-------------------2------------------3-----------------4---------------5
ODOUR 1-------------------2------------------3-----------------4---------------5
CLEANLINESS 1-------------------2------------------3-----------------4---------------5
TEMPERATURE 1-------------------2------------------3-----------------4---------------5
FOOD QUALITY
7. Rate the FOOD QUALITY in terms of the following attributes
Poor Fair Good Very Good Excellent
TASTE 1-------------------2------------------3-----------------4---------------5
FRESHNESS 1-------------------2------------------3-----------------4---------------5
AROMA 1-------------------2------------------3-----------------4---------------5
PRESENTATION 1-------------------2------------------3-----------------4---------------5
SERVICE QUALITY
8. Rate the SERVICE QUALITY in terms of the following attributes
Poor Fair Good Very Good Excellent
LEED TIME 1-------------------2------------------3-----------------4---------------5
BEHAVIOUR OF STAFF 1-------------------2------------------3-----------------4---------------5
SERVICE OFFERD BY STAFF 1-------------------2------------------3-----------------4---------------5
MENU OFFERINGS
9. Rate the MENU OFFERINGS in terms of the following attributes
Poor Fair Good Very Good Excellent
VEG. OPTIONS 1-------------------2------------------3-----------------4---------------5
NON – VEG OPTIONS 1-------------------2------------------3-----------------4---------------5
M. ANALYTICS REPORT – GROUP 8 3
CUSTOMIZATION 1-------------------2------------------3-----------------4---------------5
REVISION OF MENU 1-------------------2------------------3-----------------4---------------5
ADDITION OF NEW ITEMS / YEAR 1-------------------2------------------3-----------------4---------------5
PRICE
10. Rate the PRICE in terms of the following attributes
Poor Fair Good Very Good Excellent
AFFORDABILITY 1-------------------2------------------3-----------------4---------------5
DISCOUNTS 1-------------------2------------------3-----------------4---------------5
COMBOS 1-------------------2------------------3-----------------4---------------5
PAYMENT OPTIONS 1-------------------2------------------3-----------------4---------------5
VALUE ADDED SERVICES
11. Rate the VALUE ADDED SERVICES in terms of the following attributes
Poor Fair Good Very Good Excellent
HOME DELIVERY 1-------------------2------------------3-----------------4---------------5
DELIVERY TIME COMMITMENT 1-------------------2------------------3-----------------4---------------5
SPECIAL OFFERS (Occasions / Parties) 1-------------------2------------------3-----------------4---------------5
DISCOUNT COUPONS 1-------------------2------------------3-----------------4---------------5
SATISFACTION INDEX
12. Rate the VALUE ADDED SERVICES in terms of the following attributes
Poor Fair Good Very Good Excellent
SATISFACTION LEVEL 1-------------------2------------------3-----------------4---------------5
VALUE FOR MONEY 1-------------------2------------------3-----------------4---------------5
CONSIDER REVISITING 1-------------------2------------------3-----------------4---------------5
M. ANALYTICS REPORT – GROUP 8 1
B. Appendix B – Tabulated Responses from the public

M. ANALYTICS REPORT – GROUP 8 1
C. Appendix C – Results Sheet
1. Gap Analysis
2. Multi-Dimensional Scaling
3. Structural Equation Modeling