green diesel_final report
TRANSCRIPT

Methods and Economics of Renewable Diesel Production
12 May 2016
Group O: Michael P. Letterio, Robert McNew, Nickolas
Martin

1
Abstract
The hydrodeoxygenation of triglyceride feedstocks has been shown in the literature
to be a viable alternative to the production of diesel fuel. Renewable diesel boasts a high
cetane number along with decreased carbon emissions. However renewable diesel suffers
from poor cold flow properties. Using soybean oil as a feedstock we have developed a two-
reactor process, hydrodeoxygenation (HDO) employing a sulfided NiMo catalyst followed
by isomerization to ensure suitable diesel properties using a Pt/SAPO11 catalst.1,2 Capital
investment of renewable diesel plants can run as high as $1 billion with high feedstock
costs. Current diesel prices make it impossible for a profitable renewable diesel business
to be developed currently. However it has shown promise to be fairly profitable if the
market turns around. To promote the use of renewable fuels, US policy makers have
currently allowed for a $1/gallon tax credit. Renewable diesel has been shown to lower
CO2 emissions by 60% on a per energy basis compared to conventional diesel production.
Government intervention and changing markets could help make this process feasible in
the future.

2
Table of Contents
Introduction ................................................................................................................... 5
Feedstock Choice ........................................................................................................... 6
Current Renewable Diesel facilities ................................................................................... 7
Process Development ...................................................................................................... 9
ASPEN Modeling ......................................................................................................... 10
Heat Integration ............................................................................................................ 12
Haz Ops ...................................................................................................................... 14
Market Analysis ........................................................................................................... 16
Government Policies ..................................................................................................... 19
Economics ................................................................................................................... 20
Life Cycle Analysis....................................................................................................... 23
Appendix A: Economics ................................................................................................ 30
Appendix B: Aspen Data ............................................................................................... 32
Appendix C: Market Analysis ......................................................................................... 43
Appendix D: ASTM Diesel Standards .............................................................................. 48
3
List of Figures
Figure 1: U.S. Vegetable oil prices ................................................................................ 7
Figure 2: Process Flow ................................................................................................. 9
Figure 3: ASPEN flowsheet of renewable diesel operations. ........................................ 12
Figure 4: HEN of the process flow for reactor inlets and outlets ................................... 13
Figure 5: United States excess oil 1990-2015............................................................... 17
Figure 6: Total excess oil stocks between US, Brazil and Argentina. ............................ 18
Figure 7: Soybean oil production................................................................................ 19
Figure 8: Effect of price of Diesel on NROI ................................................................ 21
Figure 9: Diesel prices since 1994 ............................................................................... 22
Figure 10: Effect of the price of soybean oil on NROI. ............................................... 23
Figure 11: Fuel Production Processes for the four soybean derived fuels ...................... 24
Figure 12: GREET well-to-pump and pump-to wheel stages ........................................ 24
Figure 13: Energy input flows for biodiesel production from 1 ha of soybean ............... 25
Figure 14: Well-to-Wheel GHG Net Emissions ........................................................... 28
Figure A.1: VGA ........................................................................................................ 30
Figure A.2: Cost Sheet ................................................................................................ 31
Figure C.1: Soybean oil production in the United States ............................................... 43
Figure C.2: Average drought conditions in the contiguous 48 states 1895-2011 ............ 43
Figure C.3: Soybean oil market trends - United States.................................................. 44
Figure C.4: Argentina Excess Oil 1990-2015 ............................................................... 44
Figure C.5: Soybean Oil Production - Argentina .......................................................... 45
Figure C.6: Soybean Oil market Trends - Argentina..................................................... 45
Figure C.7: Brazil Excess Oil 1990-2015 ..................................................................... 46
Figure C.8: Soybean Oil Production - Brazil ................................................................ 46
Figure C.9: Soybean Oil Market Trends - Brazil .......................................................... 47

4
List of Tables
Table 1: A comparison of carbon structure composition of various candidates for
renewable diesel feedstock. ........................................................................................... 6
Table 2: Current Renewable Diesel Production .............................................................. 8
Table 3: Haz Ops ........................................................................................................ 14
Table 4: Potential carbon tax savings........................................................................... 20
Table 5: Economics of Current Design ........................................................................ 20
Table 6: Land Requirement for fuel production ........................................................... 25
Table 7: Energy Use for Soybean Farming in the United States (USDA 2007b) ............ 26
Table 8: Energy Use and Amount of Fuel Prodcut and Co-Products from One Ton of
Soybeans .................................................................................................................... 27
Table B.1: Cases for Flash 1 ....................................................................................... 32
Table B.2: Cases for Table 2 ....................................................................................... 33
Table B.3: Aspen Block Summary .............................................................................. 34
Table B.4: Aspen Stream Tables ................................................................................. 39

5
Introduction
As anthropogenic CO2 emissions continue to rise there has been an increasing
desire to develop biofuels from a variety of different sources, including biomass and
triglycerides. The use of biofuels creates a closed carbon cycle theoretically preventing
any carbon addition to the atmosphere. Currently much of the biofuels industries employ
first generation (edible) feedstock. The processing of triglycerides to either biodiesel or
renewable diesel production. Biodiesel is produced by the transesterification of
triglycerides to produce fatty acid methyl esters (FAME). Biodiesel has come under
substantial criticism due to its expensive separation structure and oxygenate content that
would require current diesel engines to be modified. An alternative to this is the HDO of
triglycerides to produce hydrocarbons.4-7 The HDO of triglyceride feedstock produces n-
chain hydrocarbons in the diesel range that can be used without blending in the diesel
engines used. The HDO process produces diesel fuel with a much higher cetane number
than conventional diesel fuel due to the higher purity of diesel products. The major concern
of renewable diesel is the cold flow properties of the diesel fuel. By employing an
isomerization process the cold flow properties of renewable diesel can be greatly improved
while maintaining a high cetane number. Current possible feedstock include soybean,
palm, and rapeseed oils as first generation fuels along while jatropha and waste oils can be
used as second-generation fuels (non-edible).
Global diesel demand is expected to increase from 27 MMB/D to 33 MMB/D by
2030, leaving an opportunity for other methods of diesel production to fill the demand gap.8 The
development of renewable diesel facilities has been limited by the high capital cost of
plants and price fluctuations in the feedstock and final product markets. Here we provide
a process design and economic analysis of a potential renewable diesel facility.
6
Feedstock Choice
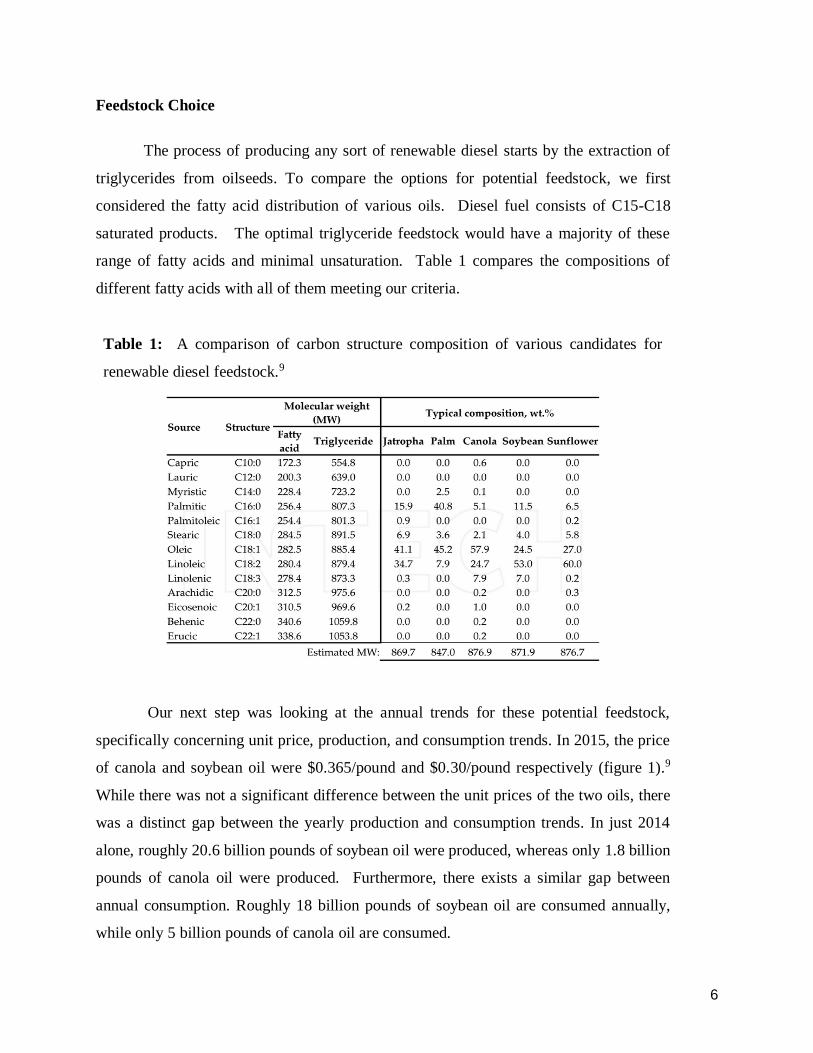
The process of producing any sort of renewable diesel starts by the extraction of
triglycerides from oilseeds. To compare the options for potential feedstock, we first
considered the fatty acid distribution of various oils. Diesel fuel consists of C15-C18
saturated products. The optimal triglyceride feedstock would have a majority of these
range of fatty acids and minimal unsaturation. Table 1 compares the compositions of
different fatty acids with all of them meeting our criteria.
Table 1: A comparison of carbon structure composition of various candidates for
renewable diesel feedstock.9
Our next step was looking at the annual trends for these potential feedstock,
specifically concerning unit price, production, and consumption trends. In 2015, the price
of canola and soybean oil were $0.365/pound and $0.30/pound respectively (figure 1).9
While there was not a significant difference between the unit prices of the two oils, there
was a distinct gap between the yearly production and consumption trends. In just 2014
alone, roughly 20.6 billion pounds of soybean oil were produced, whereas only 1.8 billion
pounds of canola oil were produced. Furthermore, there exists a similar gap between
annual consumption. Roughly 18 billion pounds of soybean oil are consumed annually,
while only 5 billion pounds of canola oil are consumed.

7
Figure 1: U.S. Vegetable oil prices3
With this data, it becomes clear that soybean oil is the most abundant and therefore
our recommended renewable diesel feedstock. Based on the current market growth and
consumption of soybean oil as our feedstock, we expect to produce 131 MMgal/yr of
renewable diesel from a 600 MTonnes/yr feedstock.
Current Renewable Diesel facilities
To develop the scope of our project we first wanted to obtain an idea of the global
renewable diesel production we compared our proposed facility show in Table 2. As can
be seen from the table the current market for renewable diesel is still relatively small,
with most plants starting up some time between 2008 and 2013. The exception to this
data is the Delaware City Refinery which produces conventional diesel oil at a capacity
much larger than any renewable diesel facility. ASTM diesel standards are provided in
the appendix for reference.

8
Table 2: Current Renewable Diesel Production10
Company Size (bpd) Location Feedstock
ConocoPhillips 1,000 Ireland Soybean Oil, Animal Fats
ConocoPhillips 12,000 United States Soybean Oil
Diamond Green Diesel
(Valero) a
17,000 United States Soybean Oil, Animal fats
Delaware City Refinery b 52,000 United States Petroleum
Neste 2 x 3,400 Finland Palm, Rapeseed, animal fats
Neste 13,600 Singapore Palm Oil
Neste 13,600 Netherlands Palm, Rapeseed, animal fats
Petrobras c 4 x 4000 Brazil
British Petroleum c 1,900 Australia
UOP/Eni 6,500 Italy Soybean Oil
Our Proposed Facility 9,800 United States Soybean Oil
a Currently producing 10000 bpd expected expansion of approximately 7000 bpd Q1 2018
b Conventional Diesel Production c Co-processing plants

9
Process Development
Our proposed process flow diagram is shown in Figure 2. The oil will first enter a
reactor and undergo HDO, with a flash tank used to separate the oil from water and syngas.
The liquid stream goes through a second reactor to isomerize the n-alkanes to achieve
desired physical properties. Another flash tank is used to again separate our product oil
from syngas and water. The vapor streams from the flash tanks undergo hydrogen
separation with the use of a ceramic membrane with near 100% hydrogen selectivity.11
Figure 2: Process Flow
For consideration on catalyst, patent US 9,266,802 by Chevron U.S.A. Inc. example
4 of a NiMoW maleate catalyst has the most desirable conversion of soybean oil to diesel
with a 99.5% conversion having 54.2 wt% nC18, 19.2 wt% nC17, 6.6 wt% nC16, and 2.3
wt% nC15. In addition, the sulfur content of the catalyst is 8 ppmw. The low sulfur content
of the catalyst prevents most of the sulfur leaching that can occur in hydrocracking and
limits the need for the addition of a hydrotreater to remove excess sulfur to meet ASTM
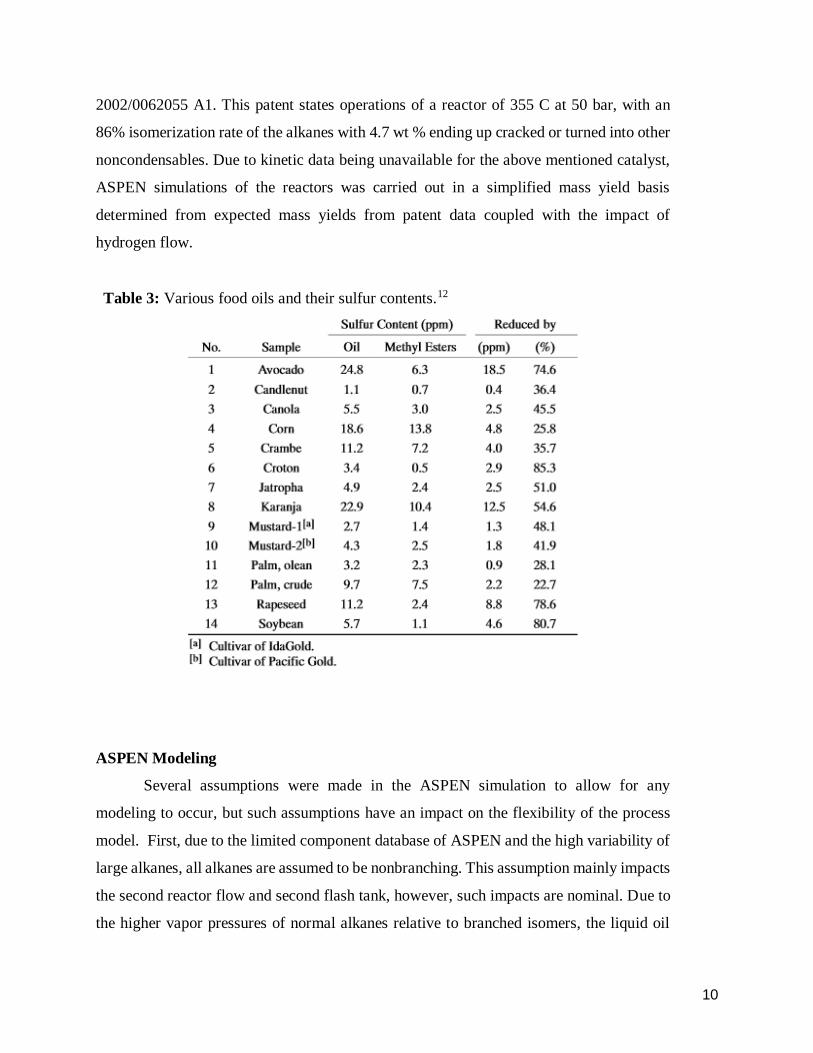
diesel specifications. Table 3 also shows the naturally low sulfur content of soybean oil
emphasizing the impact of sulfur content of the catalyst on the process. Due to sulfur
allowance of 15 ppmw, the process at hand is unlikely to ever reach that limit. The patent
specifies reactor operation at 500 °F, 1000 psig (260 °C at 70 bar) and a LHSV of 1 h-1. It
has also been shown that the reaction does not suffer from any internal or external transport
effects. A second patent was used to specify isomerization of the normal alkanes, US
10
2002/0062055 A1. This patent states operations of a reactor of 355 C at 50 bar, with an
86% isomerization rate of the alkanes with 4.7 wt % ending up cracked or turned into other
noncondensables. Due to kinetic data being unavailable for the above mentioned catalyst,
ASPEN simulations of the reactors was carried out in a simplified mass yield basis
determined from expected mass yields from patent data coupled with the impact of
hydrogen flow.
Table 3: Various food oils and their sulfur contents.12
ASPEN Modeling
Several assumptions were made in the ASPEN simulation to allow for any
modeling to occur, but such assumptions have an impact on the flexibility of the process
model. First, due to the limited component database of ASPEN and the high variability of
large alkanes, all alkanes are assumed to be nonbranching. This assumption mainly impacts
the second reactor flow and second flash tank, however, such impacts are nominal. Due to
the higher vapor pressures of normal alkanes relative to branched isomers, the liquid oil

11
composition of the second flash tank will be underestimates. Another key assumption is in
the reactor design. Due to lack of kinetic data, mass yield based reactor simulation was
used, thereby limiting each simulation to a specific mass flow to ensure accurate outlet
compositions. To simulate varying flow rates of either H2 or oil would require a
readjustment of the mass balance and subsequent changes expected in mass yields. Due to
the high mass flow rate of the process, a change of 0.4 % on yield will have a great impact
on yields of oil or H2 recycle. Membrane separation was also simplified to component splits
in the outlet flows.
Due to the inflexibility of modeling in the reactors and membrane separation of H2,
focus was put towards the separation setup and optimization. Due to high boiling points of
the alkanes, single flashes are sufficient for separation of the otherwise volatile <C5
alkanes, CO, CO2, H2O, and H2 (hereby referred to as noncondensables). Due to high H2
flows required for both reactors, effective recycle of H2 from the noncondensables stream
was important. With the membrane separation being determined to be nearly 100%
selective to H2 and highly resistant to poisoning, a single separation unit would suffice for
both noncondensable streams. Outlet flow of H2 can then be split to flow to either reactor
2 or to the front of the process for feed into reactor 1.
Process simulation is adjustable only in flashing conditions. To study the effects on
inlet temperature and flashing pressure on liquid composition and recovery was carried out
with 20 case studies being carried out, 4 temperature conditions per 5 flashing pressures,
full description of case scenarios can be seen in the appendix. The composition profiles
showed that lower inlet temperatures had higher product recovery, but also had higher H2
composition. Flashing at lower pressures also had lower product recovery, but had less H2
losses. Due to the relatively low H2 loss in comparison to H2 recovery, it was opted for
lower temperatures in flash inlet with higher operating pressure of the first flash tank. The
first flash was determined to have an inlet stream at 70 °C and to operate at 65 bar as to
allow high enough process pressures to naturally flow to reactor 2 that operates at 50 bar.
The second flash was to have an inlet temperature of 30 °C for high product recovery and
manageable downstream handling, and an operating pressure of 25 bar. The lower
temperature of the second flash would minimize product loss that would occur at the
lowering flashing pressure. Product loss changed minimally on 5 bar increments of

12
operating pressures will H2 recovery changed significantly. This led to the second flash
tank to be designed with higher H2 recovery in mind.
Figure 3: ASPEN flowsheet of renewable diesel operations.
Due to the high flow rates of the H2 the oil was considered to be in the vapor phase
after the reactors in the ASPEN simulation, requiring the whole stream to be cooled to at
least temperatures below 110 C to condense the oils. Due to the large mass flow rate of H2
this is not an unreasonable outcome of the simulation, however the required heat
exchangers are large, as noted in the next section, and are the major capital cost of the
project. More intensive research or experimentation would be beneficial to confirm the
simulation and the need for the heat exchangers as large as the ones required for the
designed process.
Heat Integration
With the process requiring high temperature swings on the flows for the flash tanks,
heat integration was imperative to reduce the roughly 14 gigawatt energy flow requirement.
ASPEN was used to find mass flow rates of the streams to be used and the average heat
capacity of the streams. The 4 streams to be considered are inlet to reactor 1, S1, and inlet
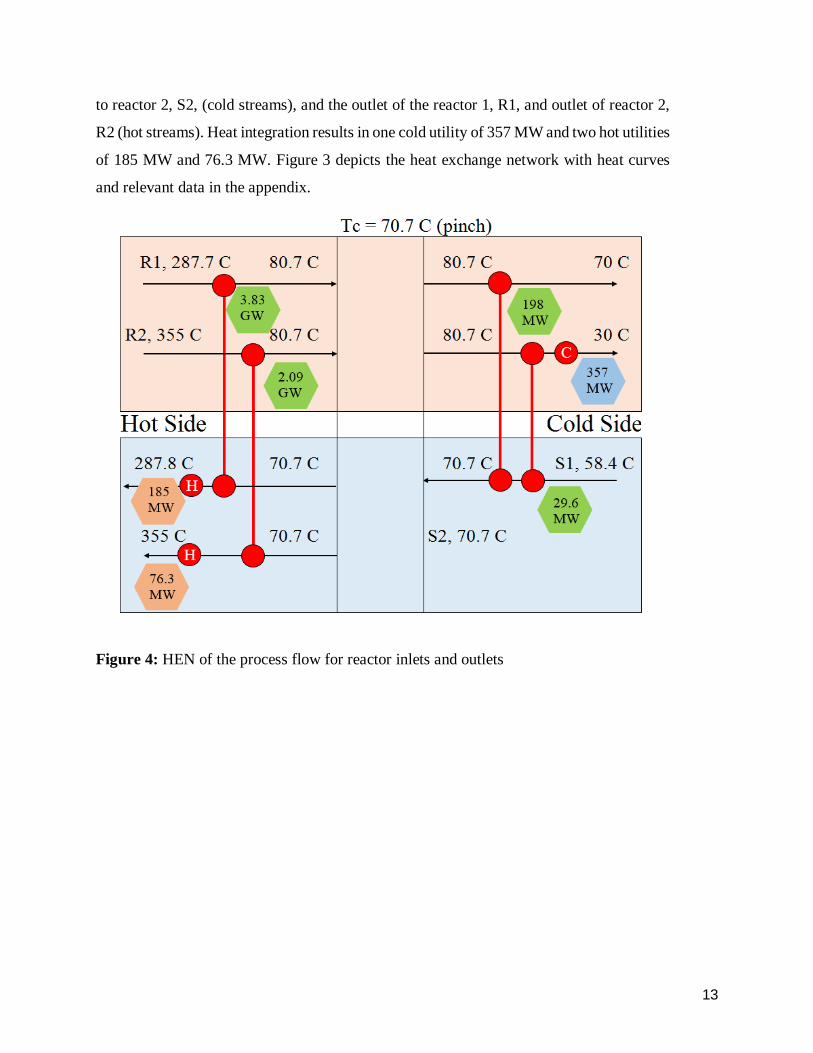
13
to reactor 2, S2, (cold streams), and the outlet of the reactor 1, R1, and outlet of reactor 2,
R2 (hot streams). Heat integration results in one cold utility of 357 MW and two hot utilities
of 185 MW and 76.3 MW. Figure 3 depicts the heat exchange network with heat curves
and relevant data in the appendix.
Figure 4: HEN of the process flow for reactor inlets and outlets
14
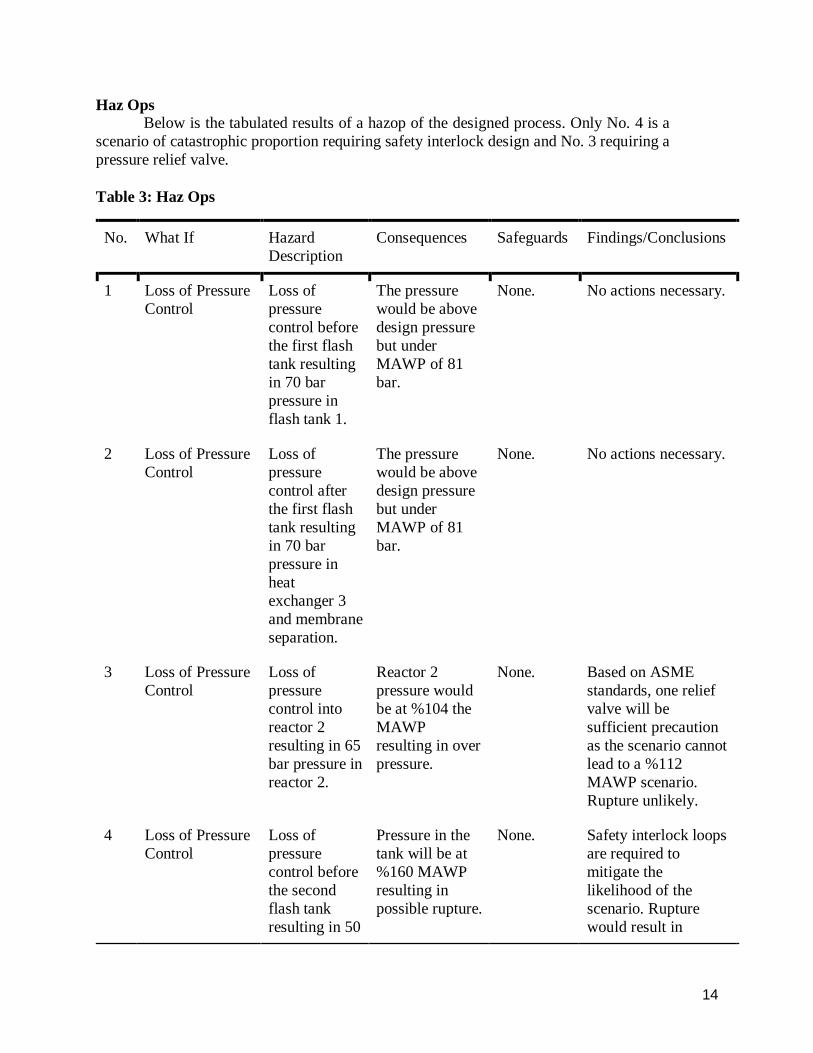
Haz Ops Below is the tabulated results of a hazop of the designed process. Only No. 4 is a
scenario of catastrophic proportion requiring safety interlock design and No. 3 requiring a
pressure relief valve.
Table 3: Haz Ops
No. What If Hazard
Description
Consequences Safeguards Findings/Conclusions
1 Loss of Pressure
Control
Loss of
pressure
control before
the first flash
tank resulting
in 70 bar
pressure in
flash tank 1.
The pressure
would be above
design pressure
but under
MAWP of 81
bar.
None. No actions necessary.
2 Loss of Pressure
Control
Loss of
pressure
control after
the first flash
tank resulting
in 70 bar
pressure in
heat
exchanger 3
and membrane
separation.
The pressure
would be above
design pressure
but under
MAWP of 81
bar.
None. No actions necessary.
3 Loss of Pressure
Control
Loss of
pressure
control into
reactor 2
resulting in 65
bar pressure in
reactor 2.
Reactor 2
pressure would
be at %104 the
MAWP
resulting in over
pressure.
None. Based on ASME
standards, one relief
valve will be
sufficient precaution
as the scenario cannot
lead to a %112
MAWP scenario.
Rupture unlikely.
4 Loss of Pressure
Control
Loss of
pressure
control before
the second
flash tank
resulting in 50
Pressure in the
tank will be at
%160 MAWP
resulting in
possible rupture.
None. Safety interlock loops
are required to
mitigate the
likelihood of the
scenario. Rupture
would result in

15
bar pressure in
the flash tank.
catastrophic spillage
and fire hazard.
5 Loss of Cooling Heat
exchanger 2
fails resulting
in high
temperature
on flash tank 1
inlet.
Higher than
anticipated
vapor flow
would occur,
but impact
minimal due to
already high
hydrogen flows.
None. No actions necessary.
6 Loss of Cooling Heat
exchanger 4
fails resulting
in high
temperature
on flash tank 2
inlet.
See No. 5. See No. 5. See No. 5.
7 Loss of Heating Heat exchange
1 fails
resulting in
low feed
temperature
into reactor 1.
Reaction in
reactor 1 would
most likely be
quenched
thereby having
triglycerides in
product stream.
None. Operability issues, no
actions required.
8 Loss of Heating Heat
exchanger 3
fails resulting
in low feed
temperature
into reactor 2.
Reaction in
reactor 2 would
most likely be
quenched
thereby
reducing
isomerization
rate.
None. Operability issues, no
actions required.
9 Hydrogen Split
Fails
Stream split of
hydrogen in
not having
proper flows
to target units.
Either reactor 1
or reactor 2
could have
reactions
proceed less
than expected.
Reaction cannot
proceed further
due to near
None. Operability issues, no
actions required.

16
completion in
reactors.
10 Loss of Feed Oil feed is
reduced or
stopped.
Reactor feed
temperature
may rise too
high resulting in
high pressure.
None. Unlikely due to high
mass composition of
hydrogen to reactor.
No actions necessary.
11 Loss of Feed Hydrogen
feed is
reduced or
stopped.
Hydrogen is
eventually
consumed in the
process.
None. Due to high process
flows, time to
consume all hydrogen
is long enough for
operators to react to
scenario. No actions
necessary.
12 High Feed Rate Oil feed is
higher than
expected.
Reactions may
not occur to
completion due
to increased
flow rate of oil.
None. Operability issues, no
actions required.
13 High Feed Rate Hydrogen
feed is higher
than expected.
Due to low feed
rate relative to
process flow,
impact likely to
be insignificant.
None. No actions necessary.
Market Analysis
Initially, our choice of feedstock was between soybean oil, cottonseed oil,
sunflower seed oil, and corn oil based on their production volumes in the United States. In
order to not pressure any of the crop markets, while still meeting our annual feedstock
demand of 600 MTonnes, it became clear that we would have to seek additional markets
internationally. What follows is an analysis of the market trends for these four oils in the
United States, Brazil, and Argentina. Brazil and Argentina were selected because of their
1) annual production volumes of the aforementioned oils, and 2) geographical proximity
to the United States.

17
In general the United States appears to have much more soybean oil in excess
annually than the other potential feedstock. The United States soybean oil excess has the
general cyclic trend with large swings in the stocks of soybean oil. While the general trend
of soybean oil production increases overtime (figure C.8) increases over time, there are
years with less than expected production volume (i.e. 2003, 2008, 2010). For example,
2008 and 2010 were years of recession in the U.S. These three years indicated in the chart
above generally correspond with periods of negative excess oil. The trend of domestic
soybean production is also expressed in Table C.1.
Figure 5: United States excess oil 1990-2015
One thought for this deviation was believed to be drought. If not enough soybean
crop for example is produced, than the excess would not be expected to be as high.
According to Figure C.2, there appears to be a correlation between United States drought
patterns and annual volume of soybean oil produced.
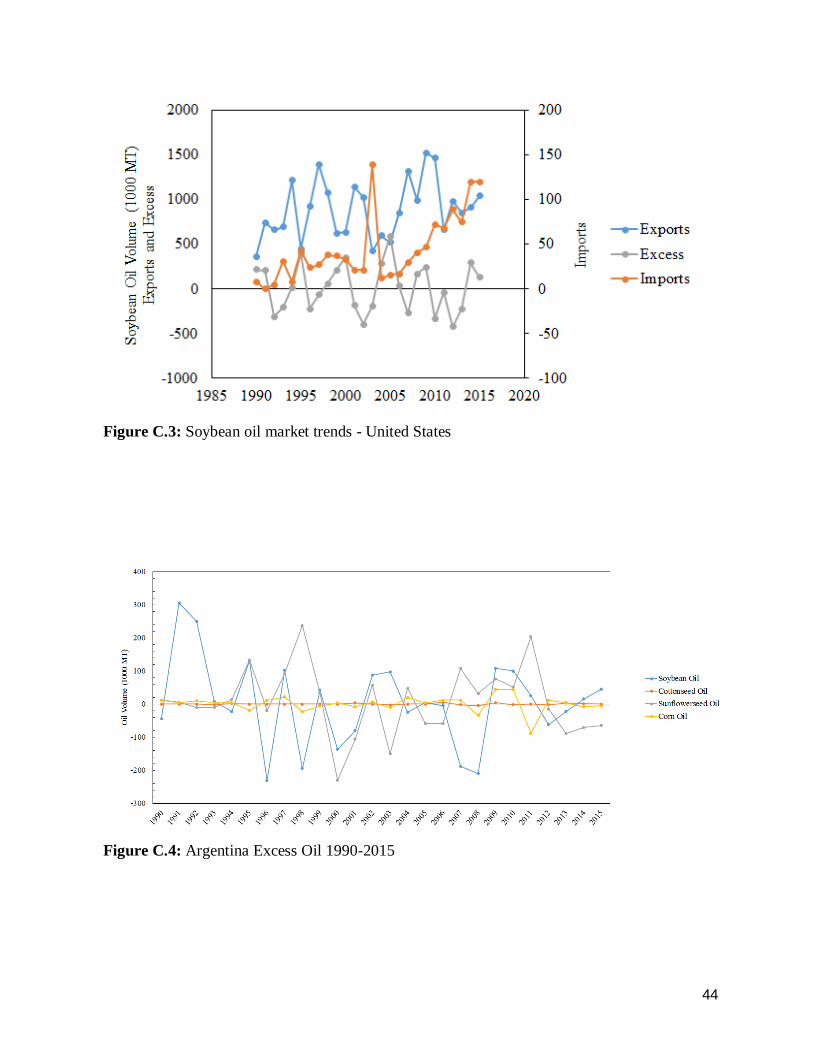
Another correlation is discovered when comparing the annual soybean oil exports
to the annual excess. In general, when the United States exports more oil, there is less in
excess and vice versa (see Figure C.3). Argentina typically has soybean and sunflower seed
oil in excess as shown in Figure C.4. Based on the annual production trends (Figure C.5),
there have been variations in the anticipated trend in the years 2008 and 2012. This
generally corresponds to decreased amounts of soybean oil in excess. For the Argentine

18
markets, the export and import trends of soybean oil appear to be less sensitive to the annual
excess (Figure C.6).
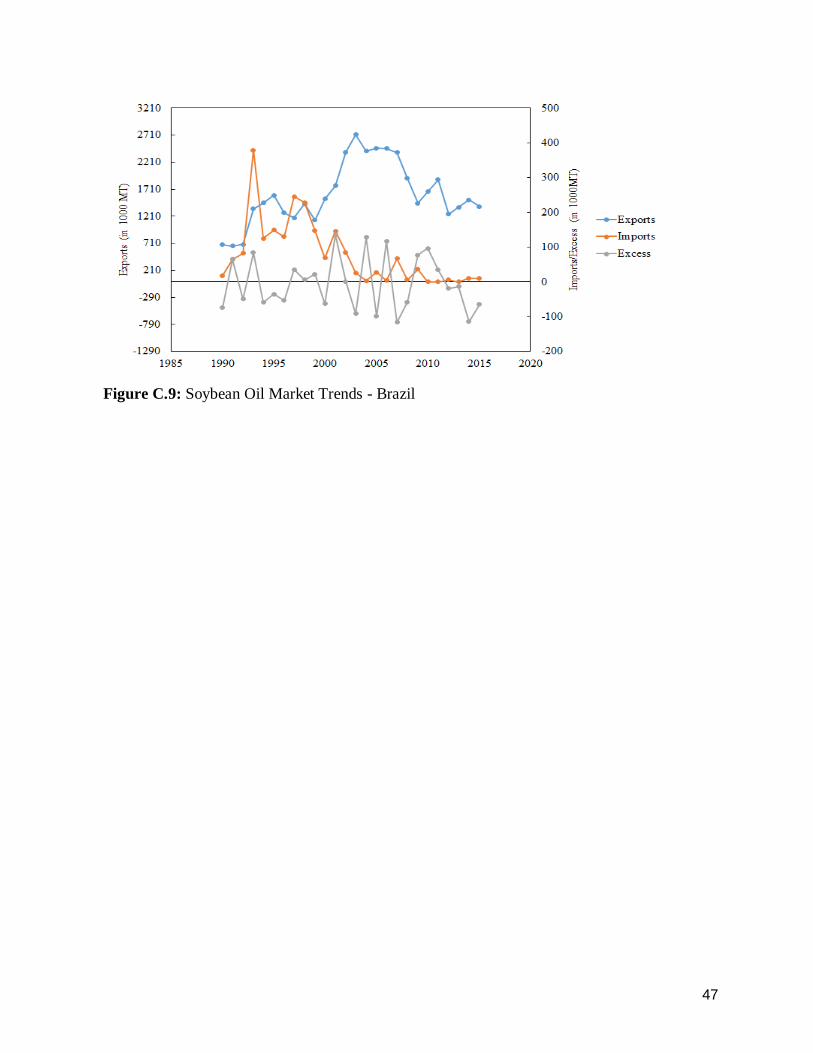
Finally, the excess of soybean and corn oil seem to be the most volatile depending
on the year in the Brazil (Figure C.7). Based on the annual production trends, there has
recently been variations in the anticipated trend in the years 2005 and 2012 (Figure C.8).
This generally corresponds to decreased amounts of soybean oil in excess. For the Brazilian
markets, the export and import trends of soybean oil appear to be less sensitive to the annual
excess (Figure C.9).
Our group made the decision to get our soybean oil from both the United States and
South America. The reason for doing so was to avoid pressuring one market too much. The
excess soybean oil stock for the top 3 producers of soybean oil (the United States,
Argentina, and Brazil) is shown in the figure below, from 1990-2015.
Figure 6: Total excess oil stocks between US, Brazil and Argentina.
It appears as though the global soybean oil excess has periods of increase and decrease, for
3-4 years at a time. At the moment, it appears that all three markets have a net positive
amount of soybean oil at the end of year. Because our plant will not be built immediately,

19
we also wanted to consider what the average excess for these three countries has looked
like for the past 15 years.
Figure 7: Soybean oil production
While all three countries under investigation have a positive trend over time,
Brazil’s exports have been decreasing in the past few years, which is the category our
feedstock would come from. For the purposes of our project moving forward, we will only
consider the United States and Argentinean markets. They hold the most promise for
increased production capacity, excess supply, and export capacity of soybean oil moving
forward. Because of this, we do not believe that we will be pressuring either market in a
significant manner. We will assume that 50% of our soybean oil feedstock will come from
the United States and 50% will come from Argentina.
Government Policies
Two policy issues will have a large part in whether the renewable diesel process
can be profitable. The current tax credit in the US is $1.00/gallon is from bill H.R. 2029
which expires December 31, 2016.3 As will be shown in the next section this bill is critical
for building the renewable diesel industry. If the bill is not renewed it is unlikely that the
renewable diesel industry will be able to continue in the United States
The other policy that can also help develop the renewable diesel industry is the
implementation of a carbon tax. One of the main reasons to look towards renewable diesel
facilities is because substantially less CO2 emissions compared to conventional plants. A
20
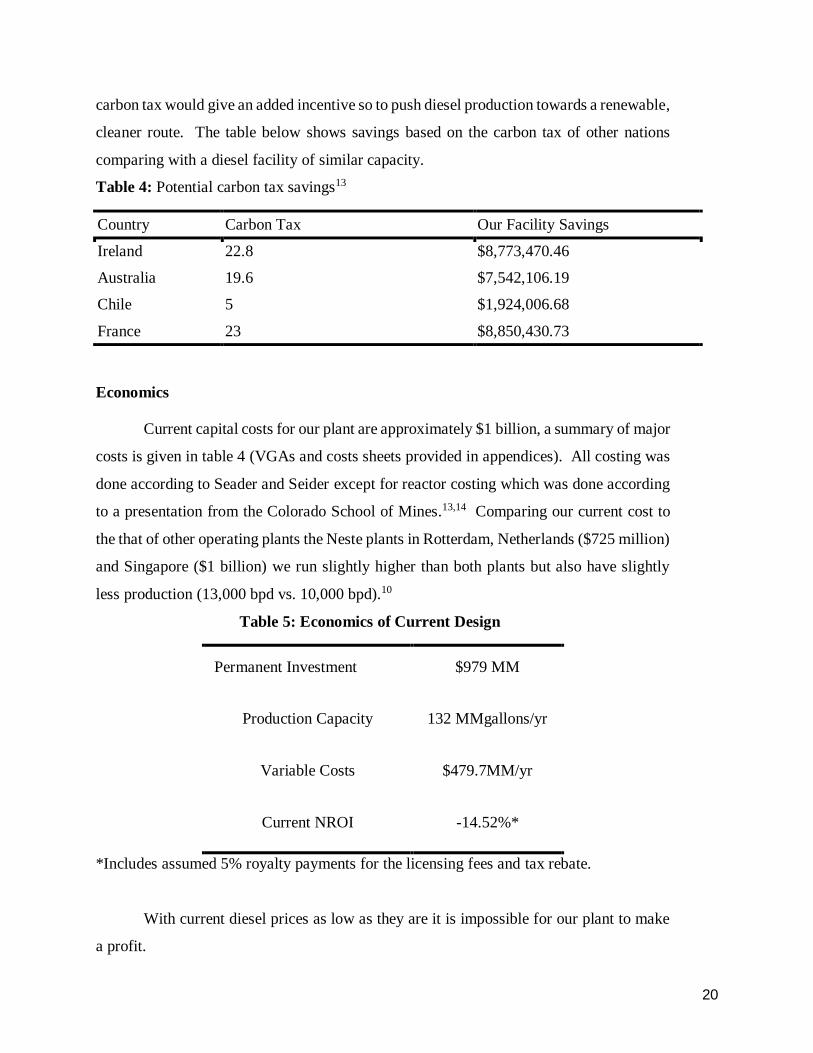
carbon tax would give an added incentive so to push diesel production towards a renewable,
cleaner route. The table below shows savings based on the carbon tax of other nations
comparing with a diesel facility of similar capacity.
Table 4: Potential carbon tax savings13
Country Carbon Tax Our Facility Savings
Ireland 22.8 $8,773,470.46
Australia 19.6 $7,542,106.19
Chile 5 $1,924,006.68
France 23 $8,850,430.73
Economics
Current capital costs for our plant are approximately $1 billion, a summary of major
costs is given in table 4 (VGAs and costs sheets provided in appendices). All costing was
done according to Seader and Seider except for reactor costing which was done according
to a presentation from the Colorado School of Mines.13,14 Comparing our current cost to
the that of other operating plants the Neste plants in Rotterdam, Netherlands ($725 million)
and Singapore ($1 billion) we run slightly higher than both plants but also have slightly
less production (13,000 bpd vs. 10,000 bpd).10
Table 5: Economics of Current Design
Permanent Investment $979 MM
Production Capacity 132 MMgallons/yr
Variable Costs $479.7MM/yr
Current NROI -14.52%*
*Includes assumed 5% royalty payments for the licensing fees and tax rebate.
With current diesel prices as low as they are it is impossible for our plant to make
a profit.

21
The purchase cost of hydrogen and soybean oil outweighs the value of the diesel fuel
making it impossible for any plant working on soybean oil to be profitable at the current
prices. As can be seen from figure 2 it would take an increase in diesel price to
$4.20/gallon before an NROI of 0% is achieved. In the last ten years the max price of
diesel was $4.72/gallon in July 2008 at this price of diesel our project plant would still only
have an NROI of 3.78% making it barely profitable.15 Figure 17 also shows demonstrates
the importance of the government subsidy. Without the subsidy it would be near
impossible to make a profit unless soybean oil and capital costs dropped dramatically.
Figure 8: Effect of price of Diesel on NROI
In order to determine if this business could be profitable at all we calculated the
NROI of the DGD based on their capital cost of $330 million, their output of 134 million
gallons a year, and our utility costs as a close approximation. In the early part of the decade
when many of the renewable diesel facilities were being built diesel averaged around
$4/gallon while soybean prices were also higher at approximately $0.85/kg. However it
appears the DGD facility was able to achieve an NROI of approximately 13%.
-20.00%
-15.00%
-10.00%
-5.00%
0.00%
5.00%
10.00%
2 2.5 3 3.5 4 4.5
NR
OI
Price of Diesel ($/gallon)
NROI
NROI noroyaltiesNROI norebate

22
Figure 9: Diesel prices since 1994
Estimating the profitability of the other plants in the Netherlands and Singapore is
more difficult due to other government policies on the taxing of fossil fuels and rebates
being unclear however diesel prices are significantly higher (2.96 USD/gallon in
Singapore, 5.10 USD/gallon in the Netherlands) which could easily lead to a large profit
margin as palm oil and soybean oil have similar prices to soybean oil in the US.16,17
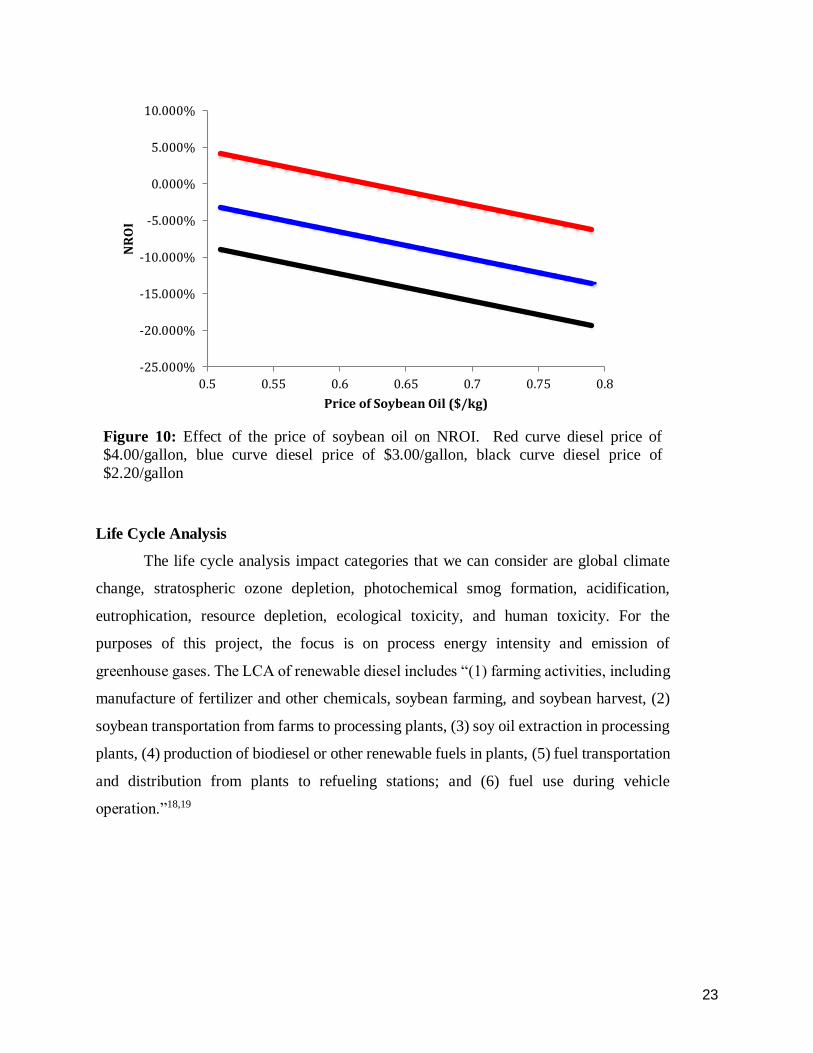
Although the soybean oil price has steadily decreased over the last three years there
has still be a large degree of variability over the last ten years that makes it difficult to tell
the direction of the soybean market. The price of soybean has been shown to shift enough
to dramatically shift the profitability of the plant. Figure 19 shows how the price of
soybean oil can affect the NROI of our projected plant. However although about $0.51/kg
of soybean oil has been the lowest observed for soybean oil the highest price seen over the
past 10 years has been $1.17/kg which would be catastrophic to the industry.9
23
Figure 10: Effect of the price of soybean oil on NROI. Red curve diesel price of $4.00/gallon, blue curve diesel price of $3.00/gallon, black curve diesel price of
$2.20/gallon
Life Cycle Analysis
The life cycle analysis impact categories that we can consider are global climate
change, stratospheric ozone depletion, photochemical smog formation, acidification,
eutrophication, resource depletion, ecological toxicity, and human toxicity. For the
purposes of this project, the focus is on process energy intensity and emission of
greenhouse gases. The LCA of renewable diesel includes “(1) farming activities, including
manufacture of fertilizer and other chemicals, soybean farming, and soybean harvest, (2)
soybean transportation from farms to processing plants, (3) soy oil extraction in processing
plants, (4) production of biodiesel or other renewable fuels in plants, (5) fuel transportation
and distribution from plants to refueling stations; and (6) fuel use during vehicle
operation.”18,19
-25.000%
-20.000%
-15.000%
-10.000%
-5.000%
0.000%
5.000%
10.000%
0.5 0.55 0.6 0.65 0.7 0.75 0.8
NR
OI
Price of Soybean Oil ($/kg)

24
Figure 11: Fuel Production Processes for the four soybean derived fuels18
The GREET (Greenhouse gases, Regulated Emissions, and Energy Use in Transportation)
model is used in our life cycle analysis, as we consider this process from well to wheel (see
Figure below).
Figure 12: GREET well-to-pump and pump-to wheel stages18
A majority (about ~65%) of the energy intensity in the lifecycle of renewable diesel comes
from the agricultural soybean production, soybean transportation, and soybean crushing.
25
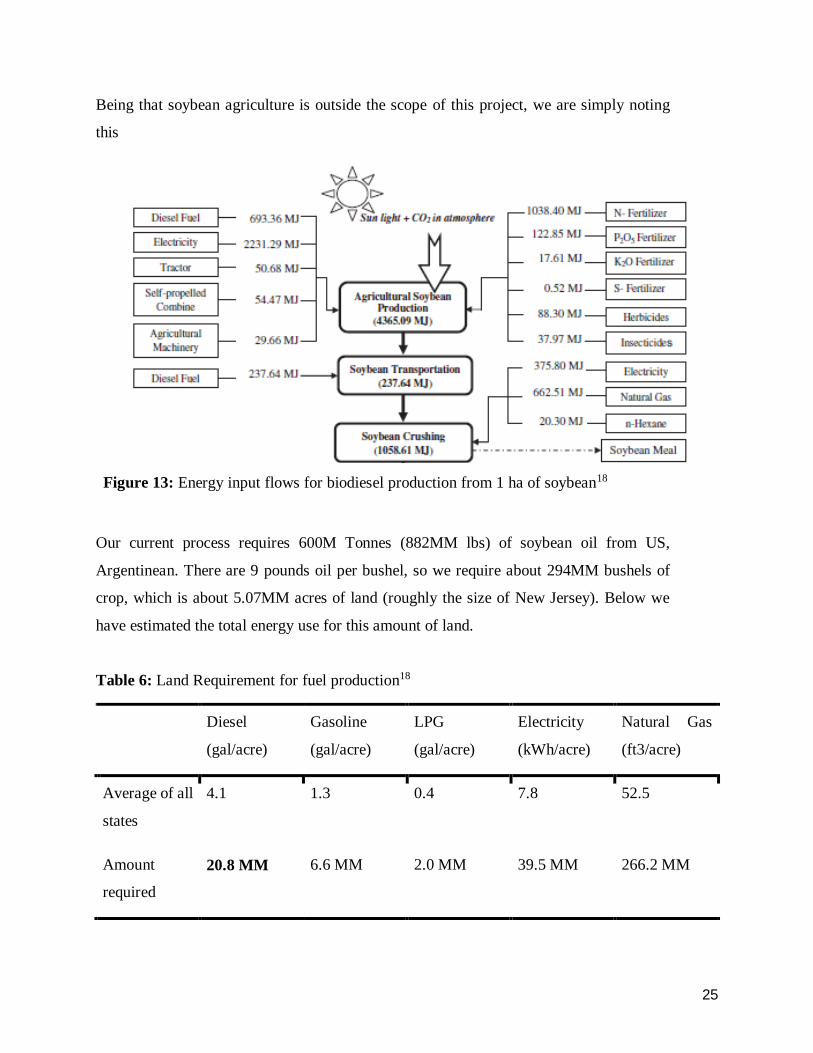
Being that soybean agriculture is outside the scope of this project, we are simply noting
this
Figure 13: Energy input flows for biodiesel production from 1 ha of soybean18
Our current process requires 600M Tonnes (882MM lbs) of soybean oil from US,
Argentinean. There are 9 pounds oil per bushel, so we require about 294MM bushels of
crop, which is about 5.07MM acres of land (roughly the size of New Jersey). Below we
have estimated the total energy use for this amount of land.
Table 6: Land Requirement for fuel production18
Diesel
(gal/acre)
Gasoline
(gal/acre)
LPG
(gal/acre)
Electricity
(kWh/acre)
Natural Gas
(ft3/acre)
Average of all
states
4.1 1.3 0.4 7.8 52.5
Amount
required
20.8 MM 6.6 MM 2.0 MM 39.5 MM 266.2 MM

26
Our preliminary process produces 131 MM gallons of green diesel annually. To be a more
sustainable venture, we propose using our renewable diesel to power the machinery and
equipment used the harvest the soybean crop.
Table 7: Energy Use for Soybean Farming in the United States (USDA 2007b)18
Based on our desired annual production rate of renewable diesel (1.323 MM tons),
the required input of hydrogen to the process is approximately 10.6MM lbs. Using the one-
to-one hydrogen-carbon dioxide ratio in the hydrogen production process via reforming,
this equates to an annual carbon footprint of 234MM lbs CO2. It was assumed from the
table below that 0.49mmBtu hydrogen was required per ton of soybean.18

27
Table 8: Energy Use and Amount of Fuel Prodcut and Co-Products from One Ton of Soybeans18
The group also wanted to check that shipping half of our feedstock from a foreign market
would not have a negative impact on the life cycle analysis, specifically in regards to the
greenhouse gas emissions. The figure below shows the Well-to-Wheel GHG Emissions if
we get 50% of our feedstock from international soybean oil production plants. We will
assume for now that our plant will be built in Virginia. This is for several reasons: (1)
Virginia is on the coast, so rail costs will be low, (2) there is already a significant amount
of soybean grown in the state, and (3) the Port of Norfolk is a major shipping port on the
East Coast. The largest port in Argentina is in Buenos Aires, so we determined the optimal
route to be 6169 nautical miles (~11,000km). Based on this distance, a large container
vessel (carrying 20,000 tonnes on general) would need to make roughly 15 trips during the
year. A vessel this size burns 11.5 g CO2/tonne-km.
28
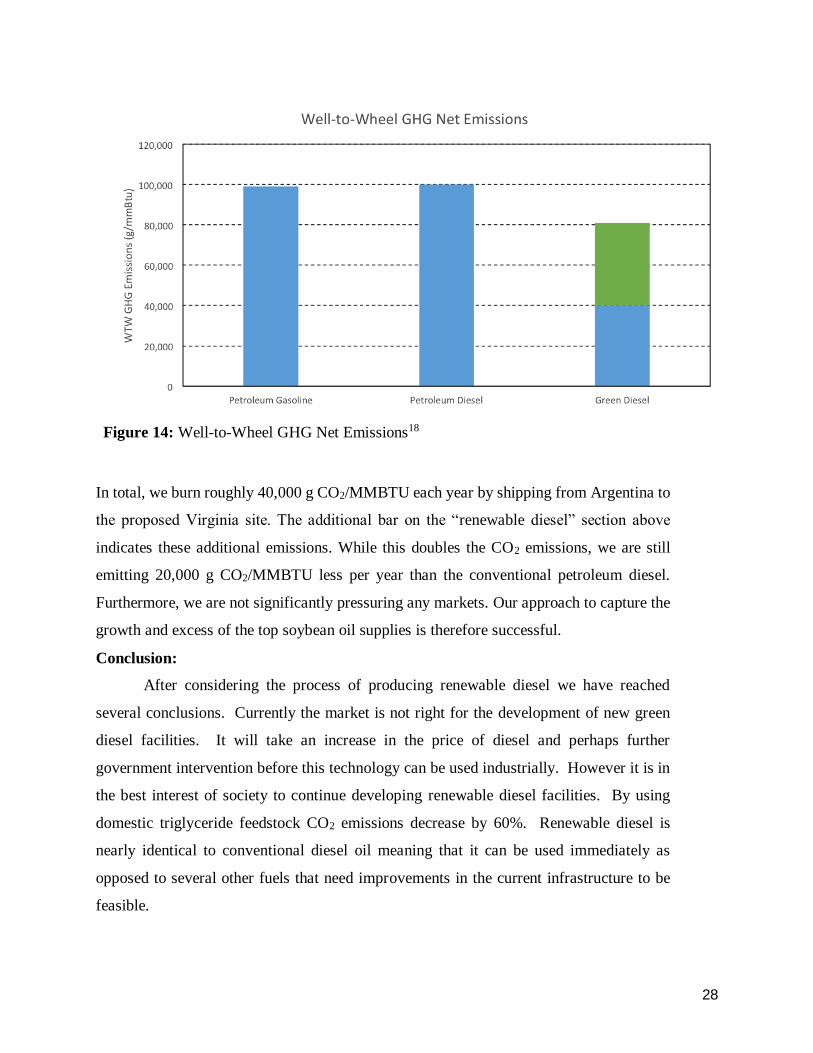
Figure 14: Well-to-Wheel GHG Net Emissions18
In total, we burn roughly 40,000 g CO2/MMBTU each year by shipping from Argentina to
the proposed Virginia site. The additional bar on the “renewable diesel” section above
indicates these additional emissions. While this doubles the CO2 emissions, we are still
emitting 20,000 g CO2/MMBTU less per year than the conventional petroleum diesel.
Furthermore, we are not significantly pressuring any markets. Our approach to capture the
growth and excess of the top soybean oil supplies is therefore successful.
Conclusion:
After considering the process of producing renewable diesel we have reached
several conclusions. Currently the market is not right for the development of new green
diesel facilities. It will take an increase in the price of diesel and perhaps further
government intervention before this technology can be used industrially. However it is in
the best interest of society to continue developing renewable diesel facilities. By using
domestic triglyceride feedstock CO2 emissions decrease by 60%. Renewable diesel is
nearly identical to conventional diesel oil meaning that it can be used immediately as
opposed to several other fuels that need improvements in the current infrastructure to be
feasible.

29
Works Cited: 1. (Patent US 9,266,802)
2. (Patent US 2002/0062055 A1).
3. Tax Credit
4. Alonso, D. M., Bond, J. Q. & Dumesic, J. A. Catalytic conversion of biomass to biofuels. 1493–1513 (2010). doi:10.1039/c004654j
5. Ki, S. et al. Production of renewable diesel via catalytic deoxygenation of natural triglycerides :
Comprehensive understanding of reaction intermediates and hydrocarbons. Appl. Energy 116, 199–205
(2014).
6. Sinha, A. K. et al. Development of Hydroprocessing Route to Transportation Fuels from Non-Edible Plant-
Oils. 1–13 (2013). doi:10.1007/s10563-012-9148-x
7. Srivastava, A. & Prasad, R. Triglycerides-based diesel fuels. 4, (2000).
8. PIRA Energy Group. An Assessment of the Diesel Fuel Market: Demand, Supply, Trade, and Key Drivers.
Fuels Institute. 2014.
9. USDA. Oilseeds: World Markets and Trade. Oil Crops Yearbooks Economic Research Service. March 2014.
10. Eco Resources Consultants Study of Hydrogenation Derived Renewable Diesel as a Renewable Fuel Option
in North America: Final Report March 2012.
11. Oyama et al., Highly hydrogen selective ceramic membranes: application to the transformation of greenhouse
gases. J. Mem. Sci. 176, 233-248 (2000)
12. Zarchin, R. et. al. Hydroprocessing of soybean oil on nickel-phosphide supported catalysts. Fuel. 2014.
13. http://www.carbontax.org/where-carbon-is-taxed/
14. Seider, W. D., Seader, J. D., Lewin, D. R., Widagdo S., Product and Process Design Principles: Synthesis,
Analysis and Design, 3rd Ed. Wiley 2009
15. http://inside.mines.edu/~jjechura/Refining/08_Hydroprocessing.pdf
16. http://www.eia.gov/dnav/pet/hist/LeafHandler.ashx?n=PET&s=EMD_EPD2D_PTE_NUS_DPG&f=W
17. https://www.spc.com.sg/our-business/spc-service-station/latest-pump-price
18. Huo, H., M. Wang, C. Bloyd, and V. Putsche. Life-Cycle Assessment of Energy and Greenhouse Gas Effects
of Soybean-Derived Biodiesel and Renewable Fuels. Rep. Chicago: Argonne National Laboratory, 2008. Print.
19. Giroux, Robert "CHEG625 Class 15." 4 April 2016. Lecture

30
Appendix A: Economics
Figure A. 1: VGA

31
Figure A. 2: Cost Sheet

32
Appendix B: Aspen Data
ASPEN Tables:
Table B.1: Cases for Flash 1
Row/
Case
VARY 1 VARY 2
VARY
3
C18
LOSS
C17
LOSS
C16
LOSS
C15
LOSS H2 in Product
Reactor 1 H2
Feed
Reactor 2
Out
FLAS
H1
TEMP TEMP PRES TONNE/OPER-YEAR
C C BAR
CUM/OPER-
YEAR
1 100 100 65 1085 1284 604 676 8009
2 90 90 65 540 664 327 382 7755
3 80 80 65 256 328 170 206 7499
4 70 70 65 116 154 84 106 7246
5 100 100 60 1163 1377 647 724 7403
6 90 90 60 577 711 350 409 7170
7 80 80 60 273 350 182 221 6934
8 70 70 60 123 164 90 113 6701
9 100 100 55 1254 1486 698 780 6795
10 90 90 55 622 766 378 440 6583
11 80 80 55 294 377 195 237 6367
12 70 70 55 132 176 96 122 6153
13 100 100 50 1364 1616 759 847 6184
14 90 90 50 675 832 410 478 5993
15 80 80 50 318 408 212 257 5798
16 70 70 50 142 191 104 132 5604
17 100 100 45 1499 1776 833 929 5571
18 90 90 45 740 912 450 524 5402
19 80 80 45 348 447 232 282 5227
20 70 70 45 155 208 114 144 5052

33
Table B.2: Cases for Table 2
Row/
Case
VARY
1 VARY 2 VARY 3
VARY
4
C18
LOSS
C17
LOSS
C16
LOSS
C15
LOSS H2 In Product
Reactor
2 H2
Feed
Reactor 1
Contamin
-ants
Reactor 2
Outlet
FLAS
H2
TEMP TEMP TEMP PRES TONNE/OPER-YEAR
C C C BAR
CUM/OPER-
YEAR
1 60 60 60 45 303 415 208 237 4672
2 50 50 50 45 122 175 93 111 4518
3 40 40 40 45 46 69 39 49 4367
4 30 30 30 45 16 25 15 20 4220
5 60 60 60 40 334 459 230 262 4160
6 50 50 50 40 134 193 102 123 4024
7 40 40 40 40 50 76 43 54 3889
8 30 30 30 40 17 28 17 22 3759
9 60 60 60 35 375 514 258 294 3646
10 50 50 50 35 149 215 115 137 3527
11 40 40 40 35 56 84 48 60 3410
12 30 30 30 35 19 31 19 25 3296
13 60 60 60 30 428 589 295 336 3130
14 50 50 50 30 170 246 131 157 3029
15 40 40 40 30 63 96 54 69 2928
16 30 30 30 30 22 35 21 28 2830
17 60 60 60 25 504 693 347 395 2612
18 50 50 50 25 199 288 154 184 2528
19 40 40 40 25 74 112 64 81 2445
20 30 30 30 25 25 41 25 33 2363

34
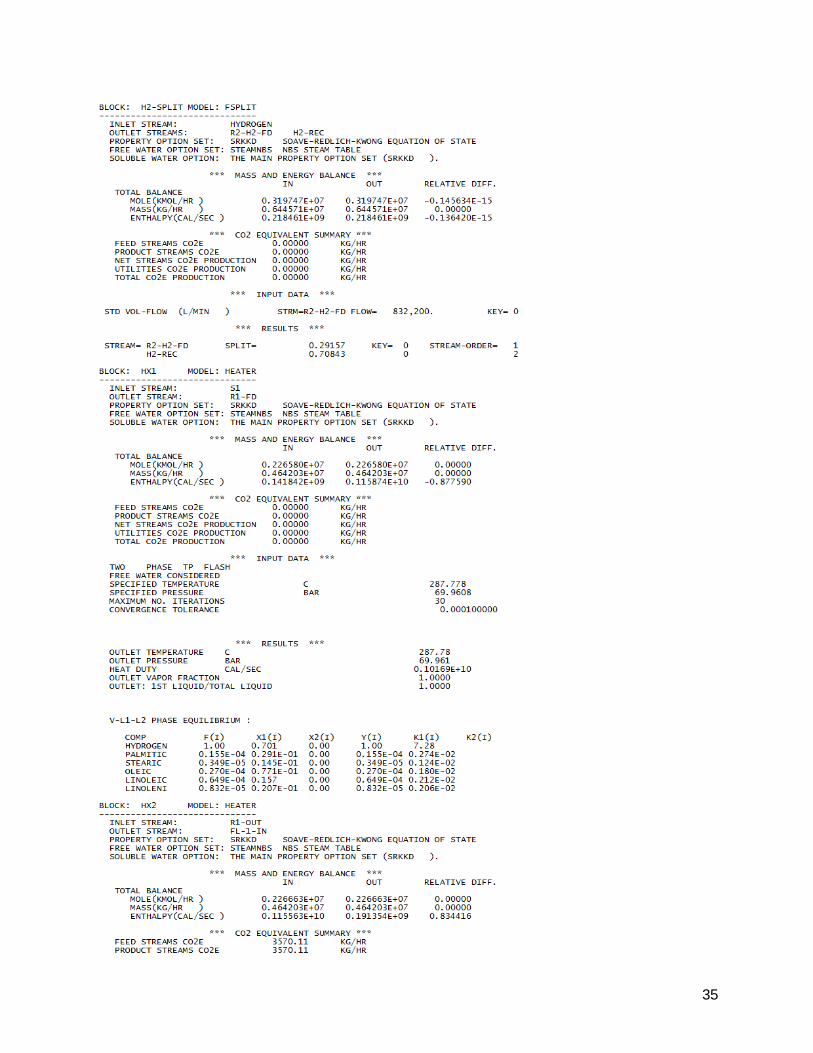
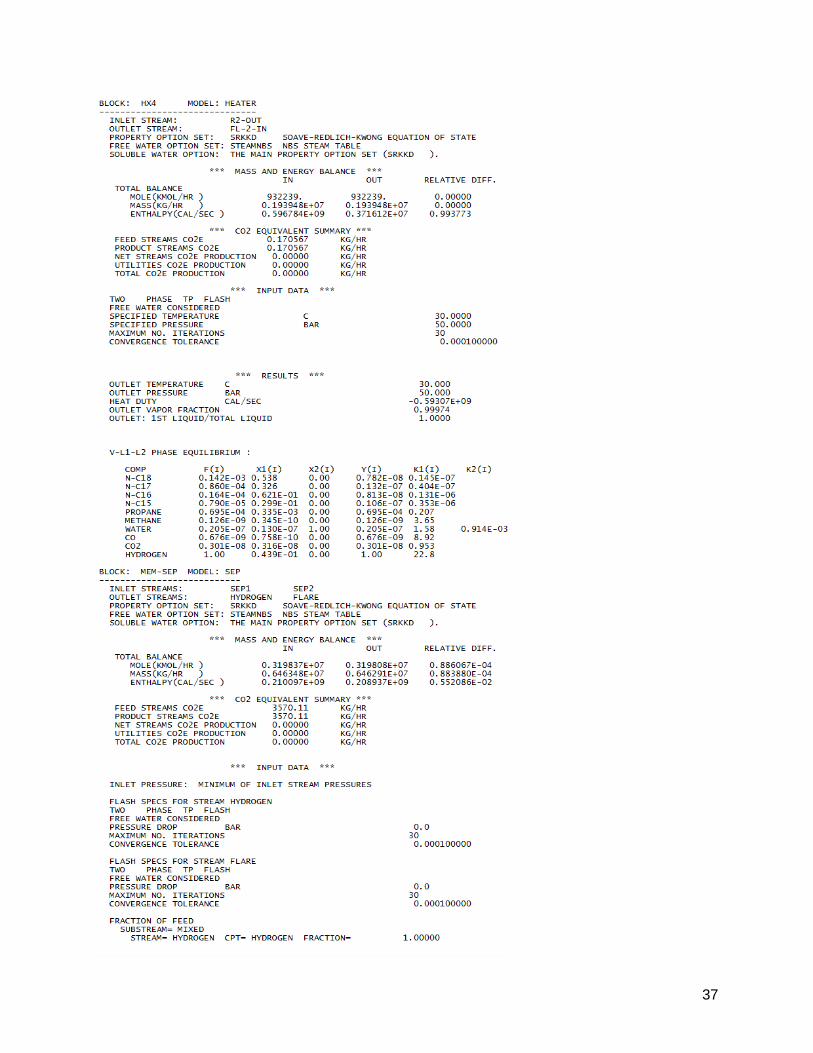
Table B.3: Aspen Block Summary
35

36
37

38

39
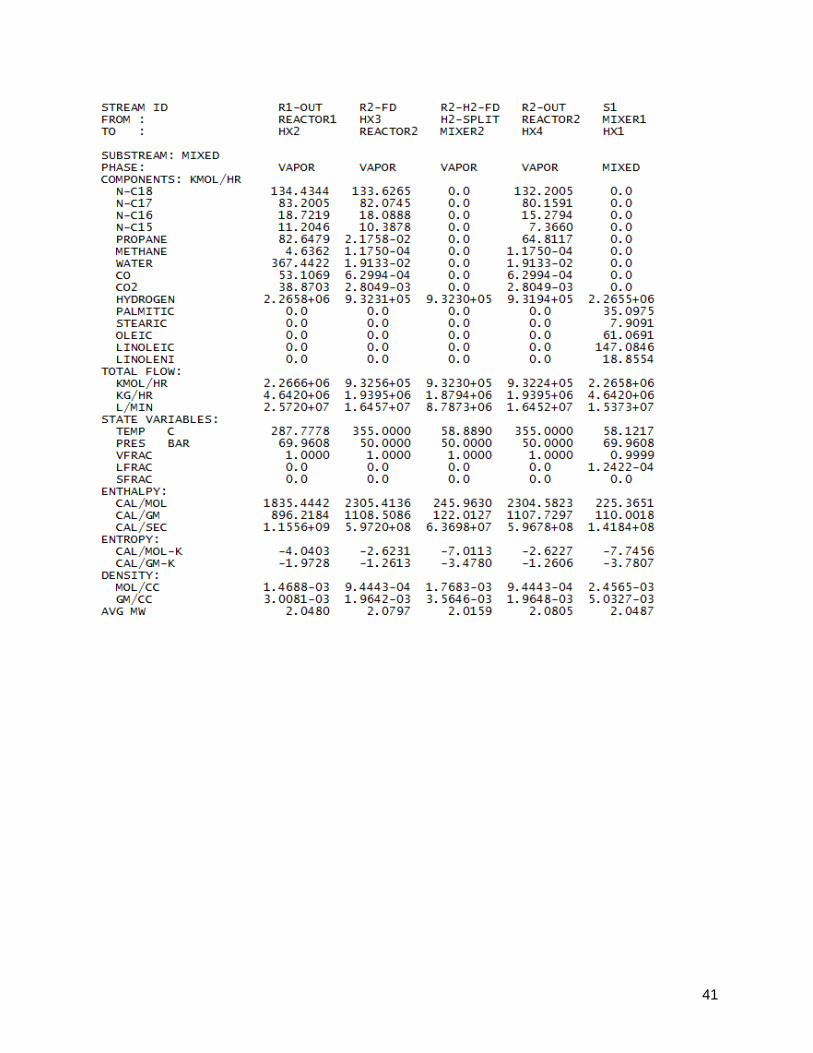
Table B.4: Aspen Stream Tables

40
41

42

43
Appendix C: Market Analysis
Figure C.1: Soybean oil production in the United States
Figure C.2: Average drought conditions in the contiguous 48 states 1895-2011
44
Figure C.3: Soybean oil market trends - United States
Figure C.4: Argentina Excess Oil 1990-2015

45
Figure C.5: Soybean Oil Production - Argentina
Figure C.6: Soybean Oil market Trends - Argentina

46
Figure C.7: Brazil Excess Oil 1990-2015
Figure C.8: Soybean Oil Production - Brazil
47
Figure C.9: Soybean Oil Market Trends - Brazil

48
Appendix D: ASTM Diesel Standards
Table D.1: ASTM Diesel Standards