green report card
TRANSCRIPT

Green Report CardConsumer Perceptions of Corporations’
Efforts to Go Green
September 2008

www.thetaylorgroup.com 2
The Green Report Card Study
• A Baseline Study of Perceptions of Corporate Greenness– Goals:
• Gather “environmental friendliness” ratings for a range of companies.
• Track perceptions against these initial baseline ratings over time.
– Companies Measured:
• 71 business-to-consumer-based companies, across a variety of industries:
– Airlines
– Automotive
– Beverages
– Computer/Software/Web
– Consumer Electronics & Appliances
– Delivery Services
– Financial
– Media & Entertainment
– Oil
– Pharmaceuticals
– Retailers
– Telecom
– TV Service Providers
www.thetaylorgroup.com 3
Study Approach
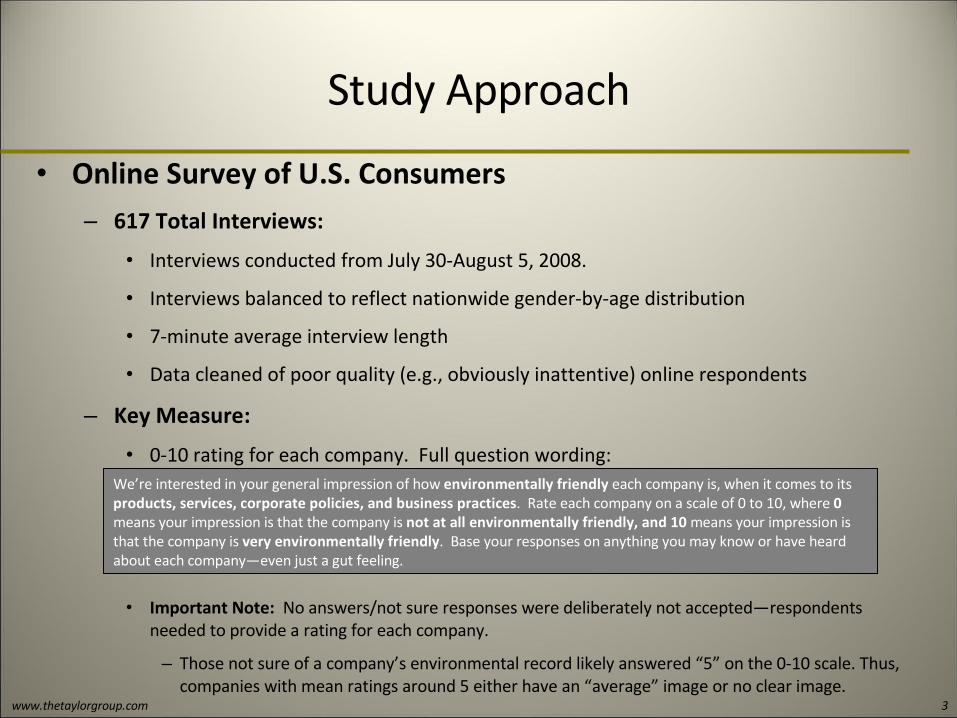
• Online Survey of U.S. Consumers – 617 Total Interviews:
• Interviews conducted from July 30-August 5, 2008.
• Interviews balanced to reflect nationwide gender-by-age distribution
• 7-minute average interview length
• Data cleaned of poor quality (e.g., obviously inattentive) online respondents
– Key Measure:
• 0-10 rating for each company. Full question wording:
• Important Note: No answers/not sure responses were deliberately not accepted—respondents needed to provide a rating for each company.
– Those not sure of a company’s environmental record likely answered “5” on the 0-10 scale. Thus, companies with mean ratings around 5 either have an “average” image or no clear image.
We’re interested in your general impression of how environmentally friendly each company is, when it comes to its products, services, corporate policies, and business practices. Rate each company on a scale of 0 to 10, where 0 means your impression is that the company is not at all environmentally friendly, and 10 means your impression is that the company is very environmentally friendly. Base your responses on anything you may know or have heard about each company—even just a gut feeling.

www.thetaylorgroup.com 4
Interpreting the Ratings
• The Greenness “Meter”– Throughout this report, companies are placed on a greenness “meter” based on
the ratings offered by survey respondents.
● This graphical device was designed primarily for ease of presentation and comparison of ratings.
● For example, note that the distance between scale points 4, 5, and 6 is greater than the distance between other points. Since the majority of the companies rated fall in the 4-6 range, the additional space allows for clearer, less cluttered placement of companies on the scale.
● For more precise results and comparisons, please refer to the table of actual mean ratings included on each chart.
www.thetaylorgroup.com 5
The Top-Rated Companies
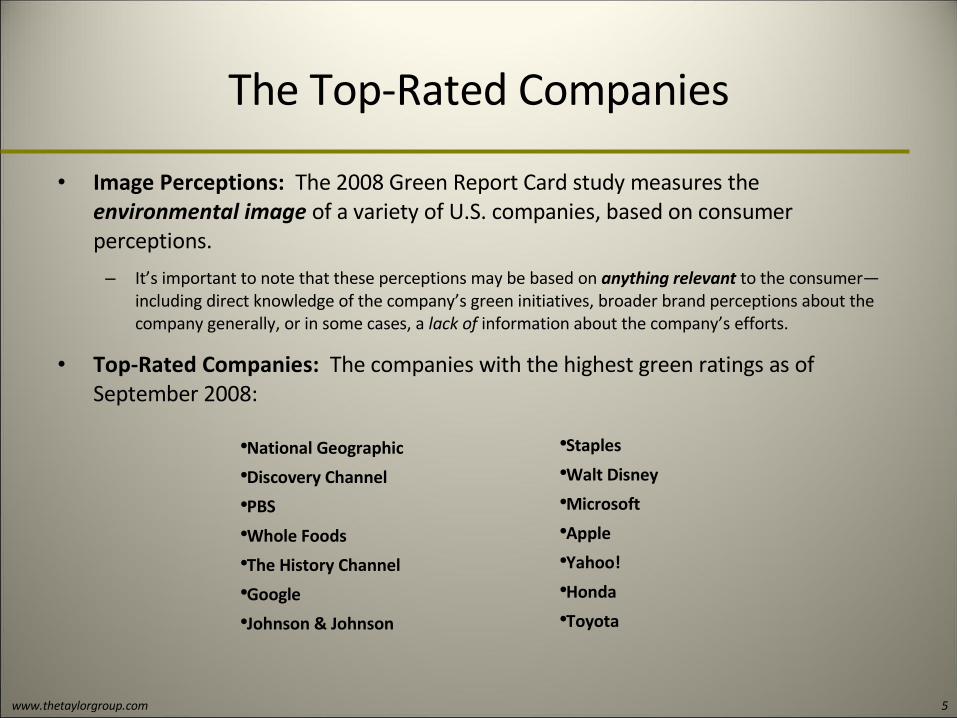
• Image Perceptions: The 2008 Green Report Card study measures the environmental image of a variety of U.S. companies, based on consumer perceptions.
– It’s important to note that these perceptions may be based on anything relevant to the consumer—including direct knowledge of the company’s green initiatives, broader brand perceptions about the company generally, or in some cases, a lack of information about the company’s efforts.
• Top-Rated Companies: The companies with the highest green ratings as of September 2008:
●National Geographic●Discovery Channel●PBS●Whole Foods●The History Channel●Google●Johnson & Johnson
●Staples●Walt Disney●Microsoft●Apple●Yahoo!●Honda●Toyota

www.thetaylorgroup.com 6
Implications
• Three Green Groupings: The ratings results suggest that at present, consumers tend to group U.S. companies into three broad green categories: A handful of companies that are clearly perceived as green, including companies with:
• A specific environmental or “organic” legacy (National Geographic, Whole Foods)
• A scientific or historical focus (Discovery Channel, The History Channel)
• A family-friendly image (Disney, PBS, Johnson & Johnson)
• A youthful, hip, or high-tech image (Google, Yahoo!, Apple, Microsoft, Staples)
• A line of green/hybrid products, aggressively marketed (Toyota, Honda)
A handful of industries that are clearly perceived as not green, especially industries associated with the distribution or large-scale use of fossil fuels (oil companies, airlines). Note that even non-legacy companies in these industries are generally seen as un-green “by association” (JetBlue).
The great amorphous in-between, including companies that either have no green strategy to speak of, have not promoted their green strategy, or have not promoted their strategy effectively enough to make a dent in consumer consciousness.

www.thetaylorgroup.com 7
Implications
• Amorphousness is a Double-Edged Sword: The fact that so many U.S. companies have an average or indistinct environmental image means that:
Most have much work to do if they wish to be perceived as strongly environmentally focused, especially if they wish their green image to be both distinct and compelling.
The green brand image field seems wide open at this point, with much opportunity for companies to set themselves apart from a generally indistinguishable competitive set.
8
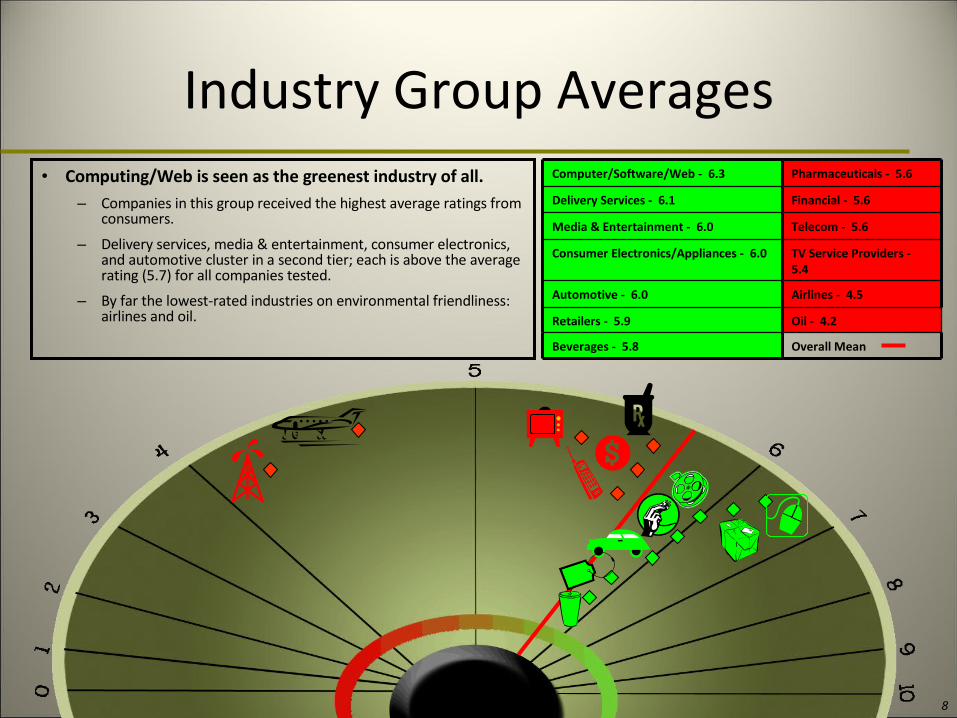
Industry Group Averages
TV Service Providers - 5.4
Consumer Electronics/Appliances - 6.0
Telecom - 5.6Media & Entertainment - 6.0
Financial - 5.6Delivery Services - 6.1
Beverages - 5.8
Retailers - 5.9
Automotive - 6.0
Computer/Software/Web - 6.3
Overall Mean
Oil - 4.2
Airlines - 4.5
Pharmaceuticals - 5.6• Computing/Web is seen as the greenest industry of all. – Companies in this group received the highest average ratings from
consumers.
– Delivery services, media & entertainment, consumer electronics, and automotive cluster in a second tier; each is above the average rating (5.7) for all companies tested.
– By far the lowest-rated industries on environmental friendliness: airlines and oil.

9
Computing, Software, Web
IndustryMean
Microsoft
Yahoo
Apple
HPDell
IBM
Overall Mean
IBM - 5.9
Hewlett-Packard - 6.1
Dell - 6.2
Google - 6.6
Yahoo - 6.4
Apple - 6.4
Microsoft - 6.4
• Google is considered the greenest of the Computing/Web companies.
– Tier two is made up of Microsoft, Apple, and Yahoo, all with identical ratings.
– The oldest computing company in the group (IBM) trails the field—but still receives a higher rating than the average company included in the survey.

10
Delivery Services
Overall Mean
FedEx - 6.0
UPS - 6.2
UPS
FedEx
IndustryMean
• UPS has a slight edge over FedEx in the Delivery category.
– Both companies receive similar, above-average grades, although UPS has a two-tenths of a point rating advantage.

11
Media & Entertainment
FOX - 5.7
TIME - 5.7
Sports Illustrated - 5.3The History Channel - 6.6
NY Times - 5.3PBS - 7.0
USA Today - 5.6Discovery Channel - 7.4
CNN - 5.9
A&E TV Network - 6.0
Disney - 6.4
National Geographic - 7.6
Overall Mean
Movie industry - 5.0
Music industry - 5.1
ESPN - 5.6
National Geographic
Discovery Channel
PBSThe History Channel
Disney
A&ECNN
Time
FOXESPN
USA Today
NY TimesMusic industry
Movie industry Sports Illustrated
Industry Mean
• Perceptions vary widely in the Media & Entertainment industries.
– Leading the group are nonprofits with a strong environmental or philanthropic legacy (National Geographic, PBS), a network with a focus on science (Discovery Channel), and a company with a strong family image (Disney). The History Channel also enjoys high ratings.
– The music and movie industries are considered the least green in this category, with significantly below-average ratings.

12
Consumer Electronics & Appliances
Overall Mean
Samsung - 5.8
LG - 6.0
Sony - 6.1
GE - 6.2
Sony
GELG
Samsung
Industry Mean
• All Consumer Electronics/Appliances companies receive above-average ratings.
– General Electric narrowly edges out Sony and LG as the most environmentally friendly company tested in the category.
– Samsung receives the lowest ratings of the four, but is still seen as slightly more green than the average company.

13
Automotive
Overall Mean
GM - 5.5
Honda - 6.4
Toyota - 6.4
Ford - 5.5
Toyota
Honda
Ford
GMIndustry
Mean
• Stark differences exist among Auto manufacturers based on U.S. versus non-U.S. status.
– The two non-U.S. companies tested (Toyota and Honda) both receive strong ratings on their green efforts.
– The two U.S. manufacturers (GM and Ford) both receive below-average ratings.
14
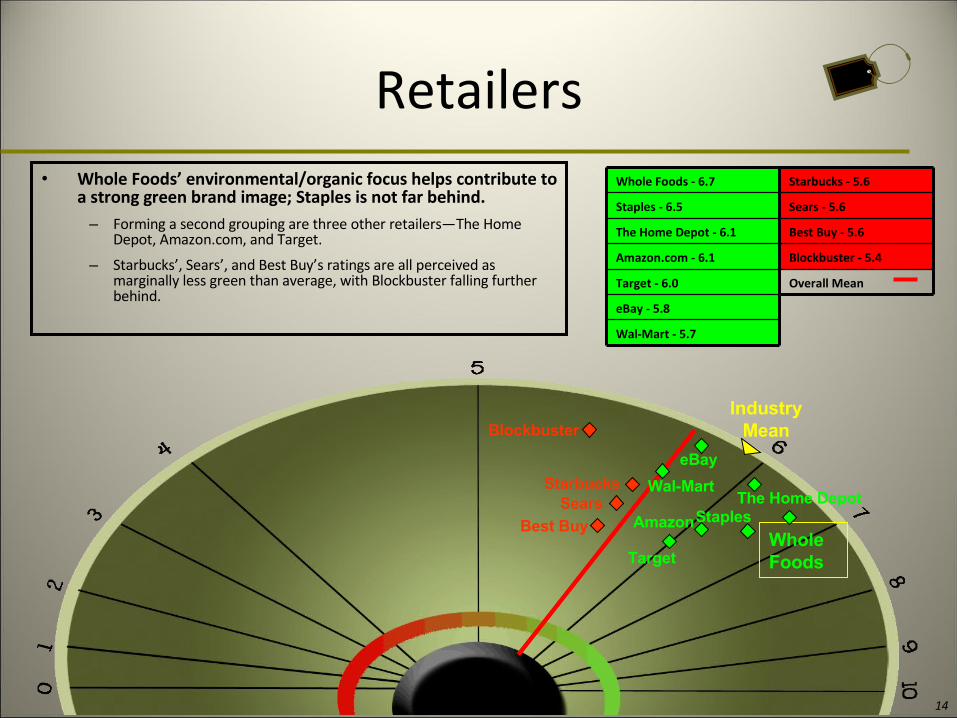
Retailers
Wal-Mart - 5.7
eBay - 5.8
Best Buy - 5.6The Home Depot - 6.1
Sears - 5.6Staples - 6.5
Starbucks - 5.6Whole Foods - 6.7
Target - 6.0
Amazon.com - 6.1
Overall Mean
Blockbuster - 5.4
Whole Foods
The Home DepotStaplesAmazon
Target
Starbucks
Best Buy
Blockbuster
Sears
eBay
Wal-Mart
Industry Mean
• Whole Foods’ environmental/organic focus helps contribute to a strong green brand image; Staples is not far behind.
– Forming a second grouping are three other retailers—The Home Depot, Amazon.com, and Target.
– Starbucks’, Sears’, and Best Buy’s ratings are all perceived as marginally less green than average, with Blockbuster falling further behind.
15
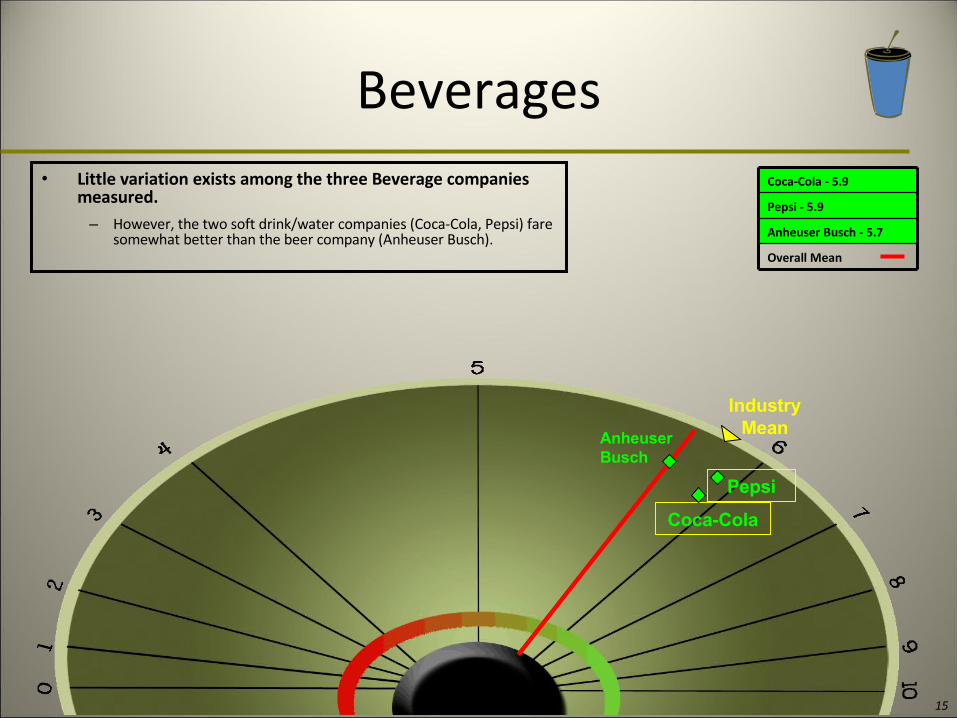
Beverages
Overall Mean
Anheuser Busch - 5.7
Pepsi - 5.9
Coca-Cola - 5.9
Coca-Cola
Pepsi
Anheuser Busch
IndustryMean
• Little variation exists among the three Beverage companies measured.
– However, the two soft drink/water companies (Coca-Cola, Pepsi) fare somewhat better than the beer company (Anheuser Busch).
16
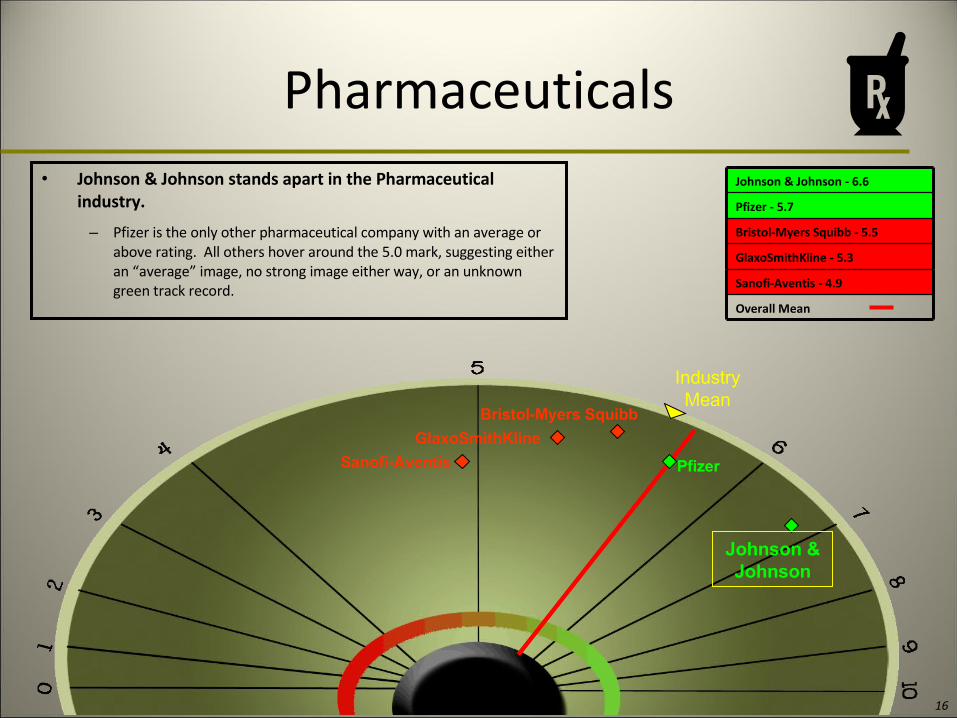
Pharmaceuticals
Overall Mean
Sanofi-Aventis - 4.9
Johnson & Johnson - 6.6
GlaxoSmithKline - 5.3
Bristol-Myers Squibb - 5.5
Pfizer - 5.7
Johnson & Johnson
Bristol-Myers Squibb
Pfizer
GlaxoSmithKline
Sanofi-Aventis
IndustryMean
• Johnson & Johnson stands apart in the Pharmaceutical industry.
– Pfizer is the only other pharmaceutical company with an average or above rating. All others hover around the 5.0 mark, suggesting either an “average” image, no strong image either way, or an unknown green track record.
17
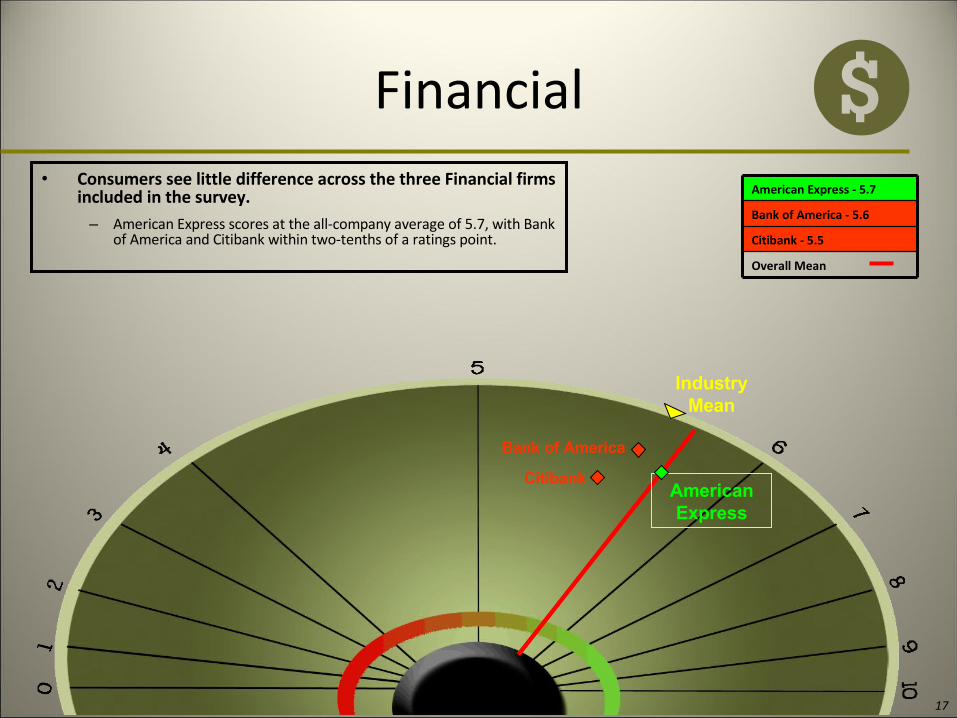
Financial
Overall Mean
Bank of America - 5.6
American Express - 5.7
Citibank - 5.5
American Express
Citibank
Bank of America
IndustryMean
• Consumers see little difference across the three Financial firms included in the survey.
– American Express scores at the all-company average of 5.7, with Bank of America and Citibank within two-tenths of a ratings point.
18
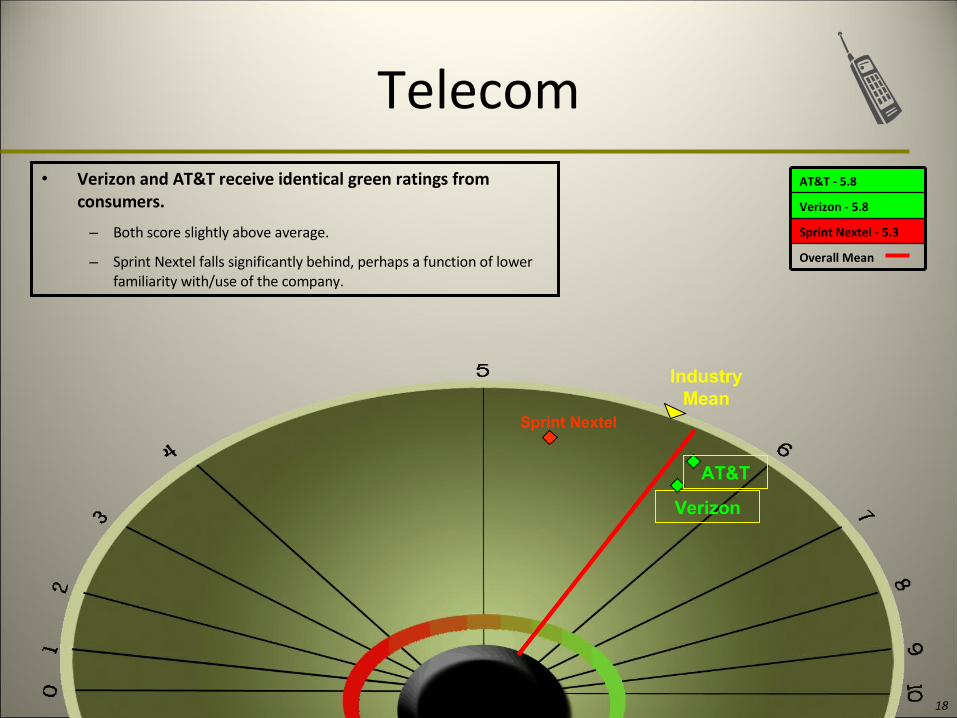
Telecom
Overall Mean
AT&T - 5.8
Sprint Nextel - 5.3
Verizon - 5.8
Verizon
AT&T
Sprint Nextel
IndustryMean
• Verizon and AT&T receive identical green ratings from consumers.
– Both score slightly above average.
– Sprint Nextel falls significantly behind, perhaps a function of lower familiarity with/use of the company.
19
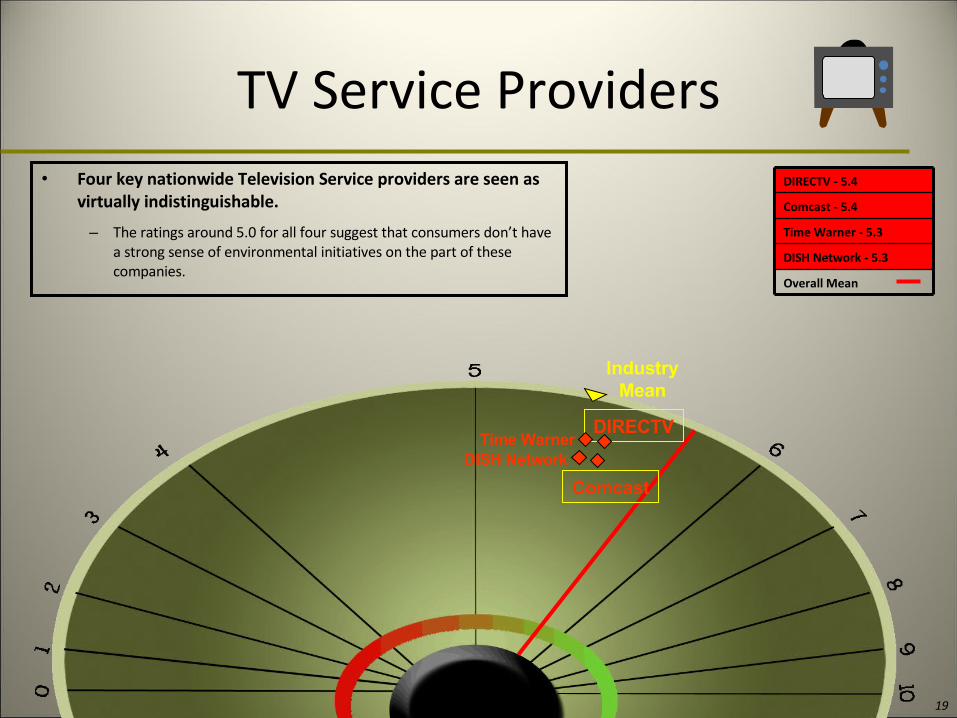
TV Service Providers
Overall Mean
DISH Network - 5.3
Time Warner - 5.3
Comcast - 5.4
DIRECTV - 5.4
DIRECTVTime Warner
DISH Network
Comcast
IndustryMean
• Four key nationwide Television Service providers are seen as virtually indistinguishable.
– The ratings around 5.0 for all four suggest that consumers don’t have a strong sense of environmental initiatives on the part of these companies.
20
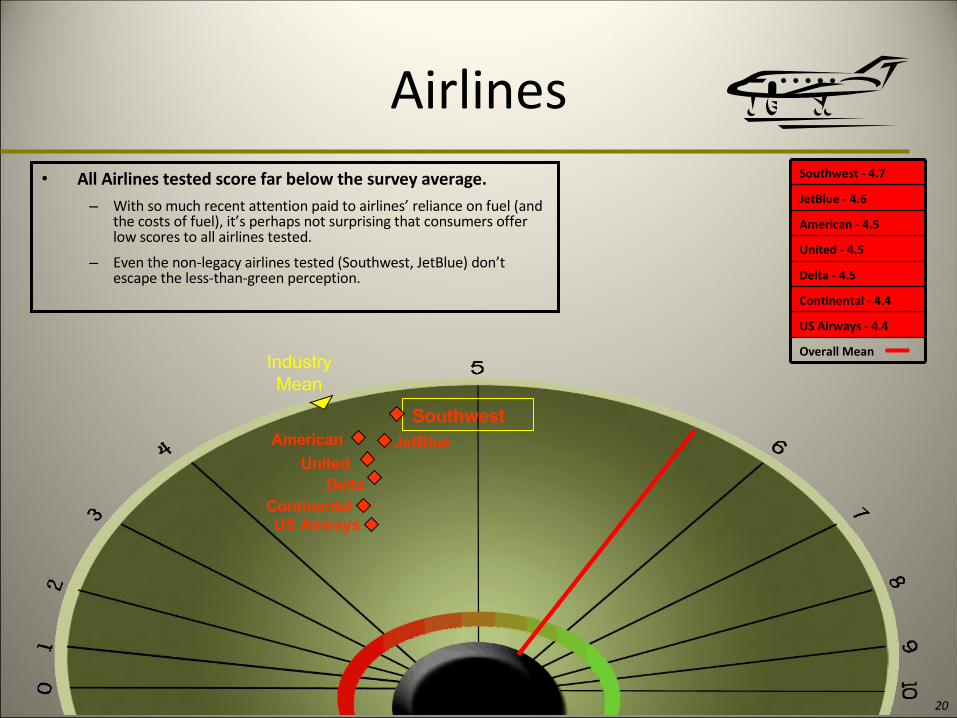
Airlines
Overall Mean
United - 4.5
American - 4.5
JetBlue - 4.6
US Airways - 4.4
Continental - 4.4
Delta - 4.5
Southwest - 4.7
American
Southwest
United
ContinentalUS Airways
JetBlue
Delta
IndustryMean
• All Airlines tested score far below the survey average.– With so much recent attention paid to airlines’ reliance on fuel (and
the costs of fuel), it’s perhaps not surprising that consumers offer low scores to all airlines tested.
– Even the non-legacy airlines tested (Southwest, JetBlue) don’t escape the less-than-green perception.
21
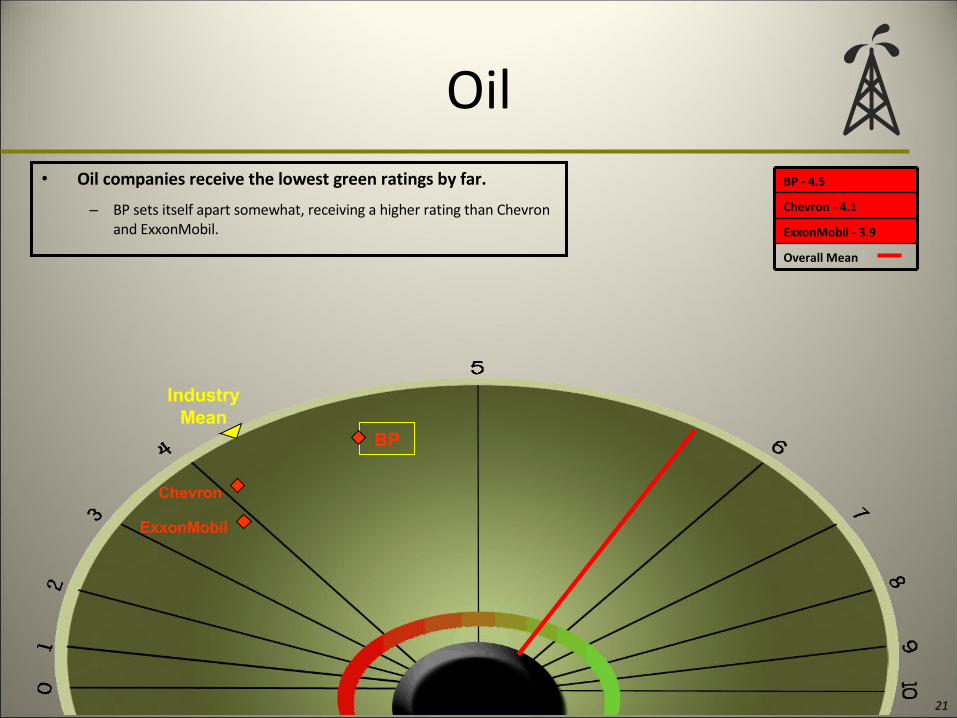
Oil
Overall Mean
ExxonMobil - 3.9
Chevron - 4.1
BP - 4.5
BP
Chevron
ExxonMobil
IndustryMean
• Oil companies receive the lowest green ratings by far.
– BP sets itself apart somewhat, receiving a higher rating than Chevron and ExxonMobil.
www.thetaylorgroup.com 22
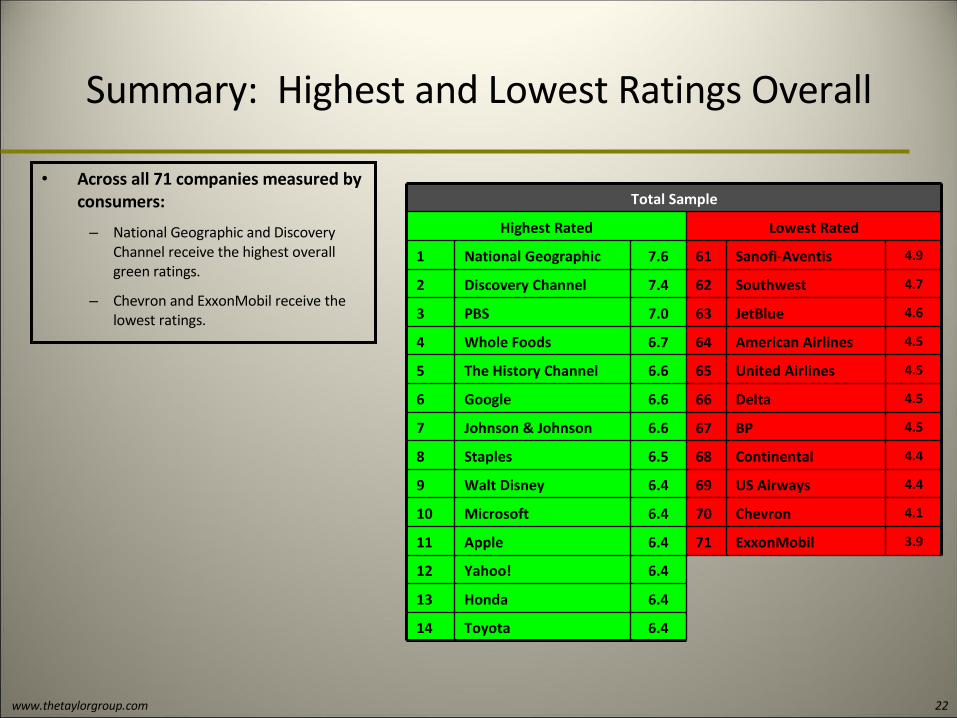
Summary: Highest and Lowest Ratings Overall
Total Sample
Lowest RatedHighest Rated
14
13
12
11
10
9
8
7
6
5
4
3
2
1
Toyota
Honda
Yahoo!
Apple
Microsoft
Walt Disney
Staples
Johnson & Johnson
The History Channel
Whole Foods
PBS
Discovery Channel
National Geographic
6.4
6.4
6.4
6.4
6.4
6.4
6.5
6.6
6.6
6.6
6.7
7.0
7.4
7.6
3.9
4.1
4.4
4.4
4.5
4.5
4.5
4.5
4.6
4.7
4.9
ExxonMobil
Chevron
US Airways
Continental
BP
Delta
United Airlines
American Airlines
JetBlue
Southwest
Sanofi-Aventis
71
70
69
68
67
66
65
64
63
62
61
• Across all 71 companies measured by consumers:
– National Geographic and Discovery Channel receive the highest overall green ratings.
– Chevron and ExxonMobil receive the lowest ratings.
www.thetaylorgroup.com 23
Highest and Lowest Among Green Purchasers
Among those most likely to say:
“I try to make environmentally responsible purchasing decisions”
Lowest RatedHighest Rated
14
13
12
11
10
9
8
7
6
5
4
3
2
1
Dell
Honda
Yahoo!
Apple
Microsoft
Walt Disney
Johnson & Johnson
Staples
Whole Foods
The History Channel
PBS
Discovery Channel
National Geographic
6.5
6.7
6.7
6.7
6.7
6.8
6.9
7.0
7.0
7.1
7.1
7.5
7.8
8.0
3.8
4.1
4.5
4.6
4.6
4.6
4.6
4.7
4.7
4.9
4.9
ExxonMobil
Chevron
US Airways
BP
Continental
Delta
United Airlines
JetBlue
American Airlines
Sanofi-Aventis
Southwest
71
70
69
68
67
66
65
64
63
62
61
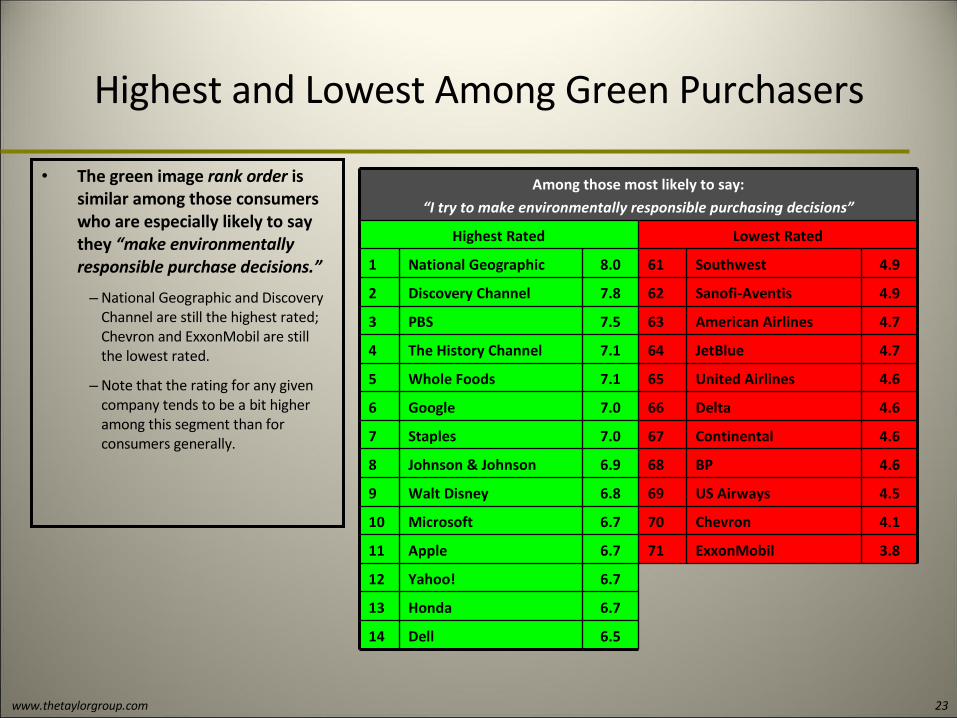
• The green image rank order is similar among those consumers who are especially likely to say they “make environmentally responsible purchase decisions.”
– National Geographic and Discovery Channel are still the highest rated; Chevron and ExxonMobil are still the lowest rated.
– Note that the rating for any given company tends to be a bit higher among this segment than for consumers generally.
www.thetaylorgroup.com 24
Top of Mind: Most and Least Green
% Naming% Naming
Which company comes to mind first as being . . .
The least environmentally friendlyThe most environmentally friendly
Wal-Mart
Johnson & Johnson
Toyota
Discovery Channel
National Geographic
Whole Foods
5%
5%
6%
7%
11%
13%
5%
6%
28%
Wal-Mart
Chevron
ExxonMobil
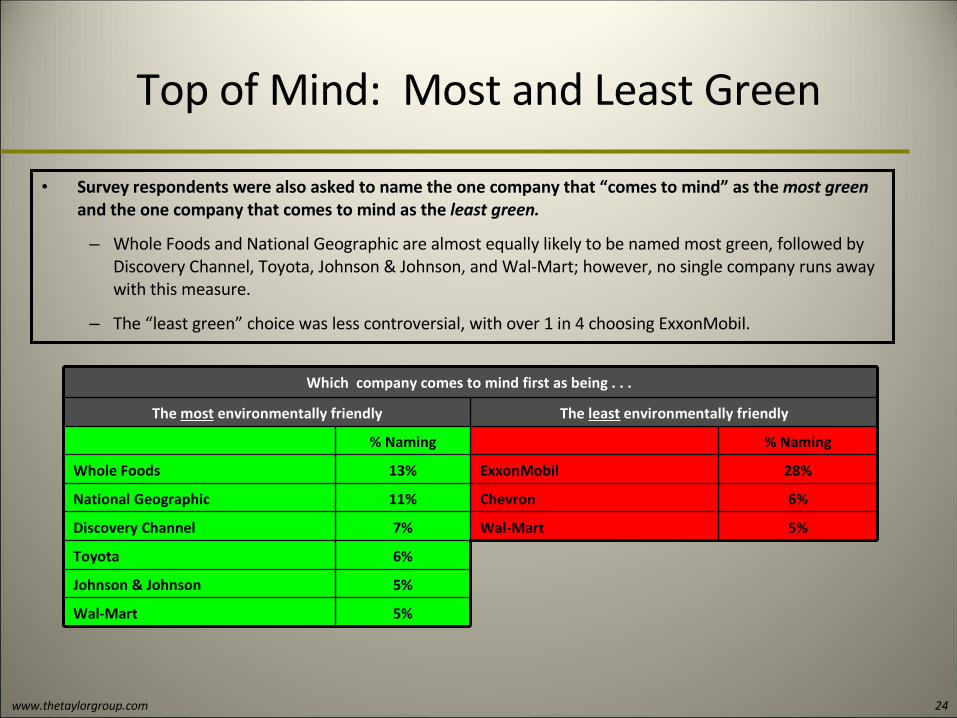
• Survey respondents were also asked to name the one company that “comes to mind” as the most green and the one company that comes to mind as the least green.
– Whole Foods and National Geographic are almost equally likely to be named most green, followed by Discovery Channel, Toyota, Johnson & Johnson, and Wal-Mart; however, no single company runs away with this measure.
– The “least green” choice was less controversial, with over 1 in 4 choosing ExxonMobil.

www.thetaylorgroup.com 25
Additional Data Cuts Available
• This summary report offers a high-level overview of the Green Report Card findings.
• Upon request, the findings from this report can be cut by a variety of attitudinal, behavioral, and demographic consumer characteristics, including:
– Degree of attention and concern about environmental issues
– Degree of concern about global warming in particular
– “Green” habits engaged in currently (recycling, efforts to reduce energy use, etc.)
– Political philosophy and party identification
– Age
– Gender
– Marital status
– Presence of children in household
– Home area characteristics (urban, suburban, rural, small town)
– Race/ethnicity
– Education level
– Income

www.thetaylorgroup.com 26
For More Information
• For further information about this report or additional data, please contact:
Jeff Radcliffe, Director of Client Services
603-422-7612