gravity corrections to measured geometric slopes in puna ... · 5- behavior of egm08 in argentina...
TRANSCRIPT
5- BEHAVIOR OF EGM08 IN ARGENTINA
Data sets composed of 664 leveling and GPS benchmarks arranged along theArgentine territory wasused to calculate s
CONTACT INFORMATION:Sergio Cimbaro: - Diego Piñón:[email protected] [email protected]
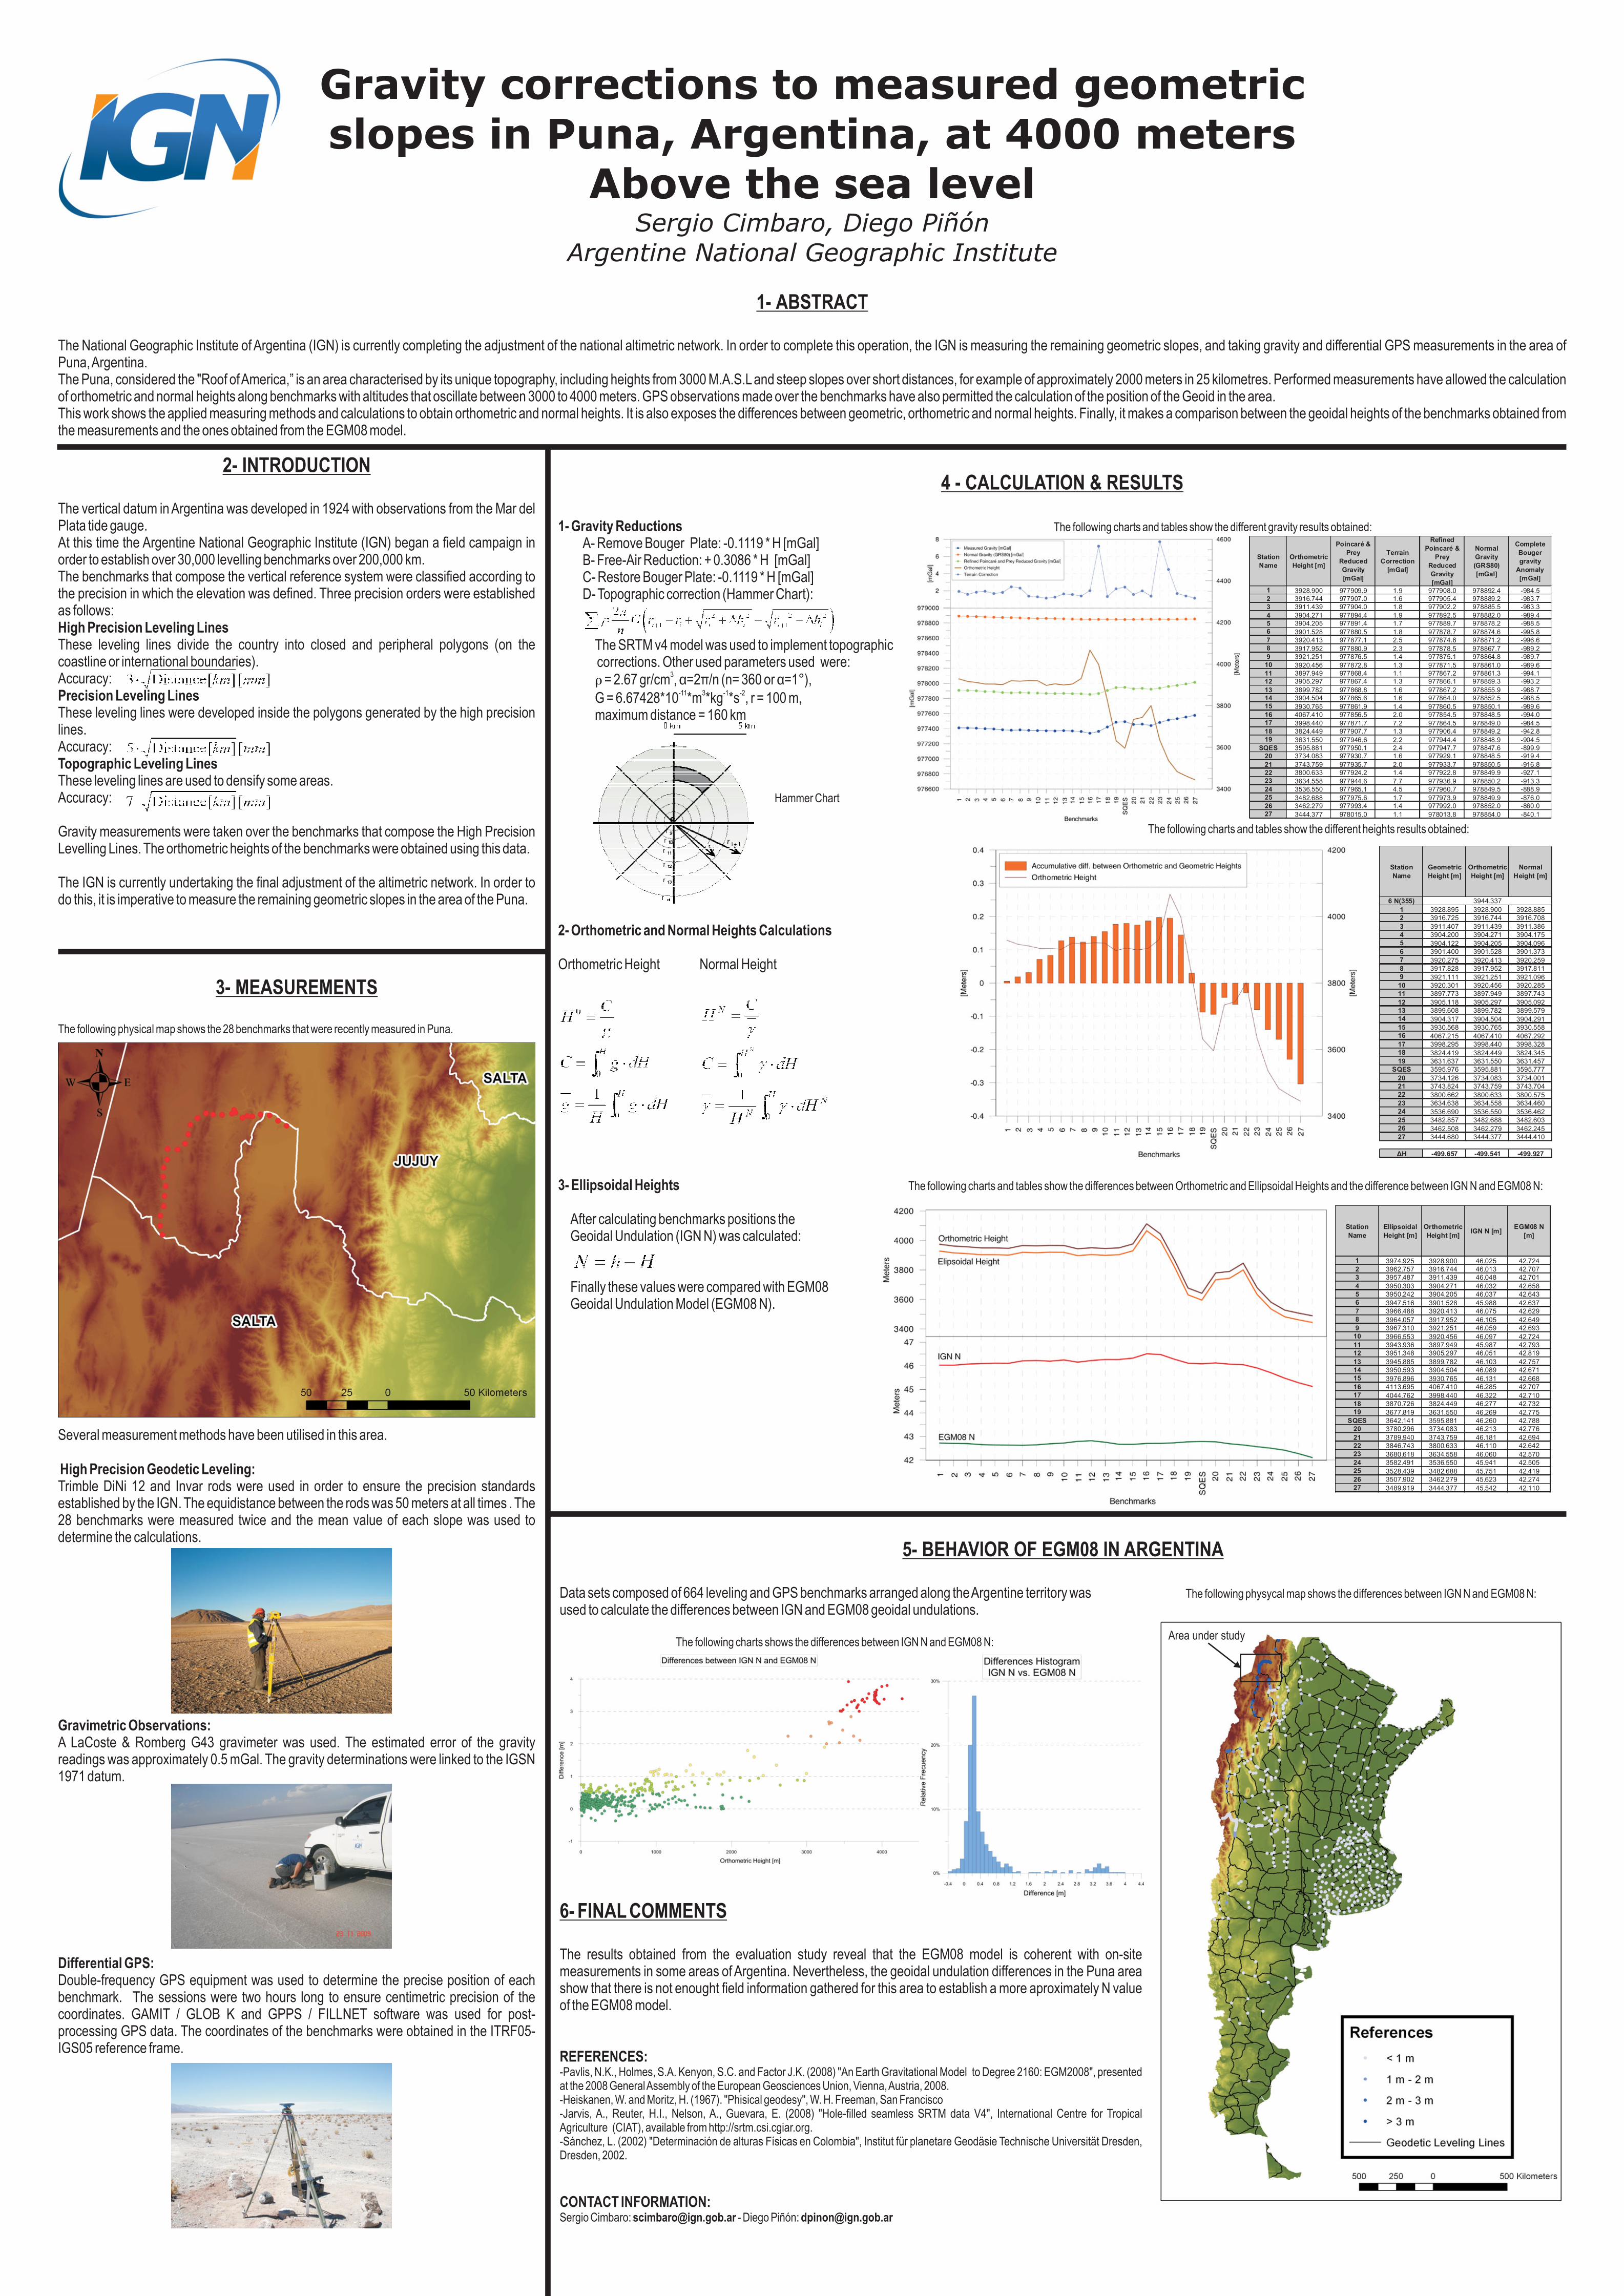
The following physycal map shows the differences between IGN N and EGM08 N:
The following charts shows the differences between IGN N and EGM08 N:
-Pavlis, N.K., Holmes, S.A. Kenyon, S.C. and Factor J.K. (2008) "An Earth Gravitational Model to Degree 2160: EGM2008", presentedat the 2008 GeneralAssembly of the European Geosciences Union, Vienna,Austria, 2008.-Heiskanen, W. and Moritz, H. (1967). "Phisical geodesy", W. H. Freeman, San Francisco-Jarvis, A., Reuter, H.I., Nelson, A., Guevara, E. (2008) "Hole-filled seamless SRTM data V4", International Centre for TropicalAgriculture (CIAT), available from http://srtm.csi.cgiar.org.-Sánchez, L. (2002) "Determinación de alturas Físicas en Colombia", Institut für planetare Geodäsie Technische Universität Dresden,Dresden, 2002.
the difference between IGN and EGM08 geoidal undulations.
The results obtained from the evaluation study reveal that the EGM08 model is coherent with on-sitemeasurements in some areas of Argentina. Nevertheless, the geoidal undulation differences in the Puna areashow that there is not enought field information gathered for this area to establish a more aproximately N valueof the EGM08 model.
6- FINAL COMMENTS
REFERENCES:
Gravity corrections to measured geometric
slopes in Puna, Argentina, at 4000 meters
Above the sea levelSergio Cimbaro,
Argentine National Geographic InstituteDiego Piñón
1- ABSTRACT
The National Geographic Institute of Argentina (IGN) is currently completing the adjustment of the national altimetric network. In order to complete this operation, the IGN is measuring the remaining geometric slopes, and taking gravity and differential GPS measurements in the area ofPuna,Argentina.The Puna, considered the "Roof ofAmerica,” is an area characterised by its unique topography, including heights from 3000 M.A.S.Land steep slopes over short distances, for example of approximately 2000 meters in 25 kilometres. Performed measurements have allowed the calculationof orthometric and normal heights along benchmarks with altitudes that oscillate between 3000 to 4000 meters. GPS observations made over the benchmarks have also permitted the calculation of the position of the Geoid in the area.This work shows the applied measuring methods and calculations to obtain orthometric and normal heights. It is also exposes the differences between geometric, orthometric and normal heights. Finally, it makes a comparison between the geoidal heights of the benchmarks obtained fromthe measurements and the ones obtained from the EGM08 model.
2- INTRODUCTION
The vertical datum in Argentina was developed in 1924 with observations from the Mar delPlata tide gauge.At this time the Argentine National Geographic Institute (IGN) began a field campaign inorder to establish over 30,000 levelling benchmarks over 200,000 km.The benchmarks that compose the vertical reference system were classified according tothe precision in which the elevation was defined. Three precision orders were establishedas follows:
These leveling lines divide the country into closed and peripheral (on thecoastline or international boundaries).Accuracy:
These leveling lines were developed inside the polygons generated by the high precisionlines.
These leveling lines are used to densify some areas.
High Precision Leveling Linespolygons
Accuracy:
Accuracy:
Gravity measurements were taken over the benchmarks that compose the High PrecisionLevelling Lines. The orthometric heights of the benchmarks were obtained using this data.
The IGN is currently undertaking the final adjustment of the altimetric network. In order todo this, it is imperative to measure the remaining geometric slopes in the area of the Puna.
Precision Leveling Lines
Topographic Leveling Lines
4 - CALCULATION & RESULTS
1- Gravity Reductions
2- Orthometric and Normal Heights Calculations
3- Ellipsoidal Heights
A- Remove Bouger Plate: -0.1119 * H [mGal]B- Free-Air Reduction: + 0.3086 * H [mGal]C- Restore Bouger Plate: -0.1119 * H [mGal]D- Topographic correction (Hammer Chart):
The SRTM v4 model was used to implement topographiccorrections. Other used parameters used were:
= 2.67 gr/cm , =2 /n (n= 360 or =1°),
G = 428* * * * , r = 100 m,maximum distance = 160 km
The following charts and tables show the different gravity results obtained:
Hammer Chart
The following charts and tables show the different heights results obtained:
The following charts and tables show the differences between Orthometric and Ellipsoidal Heights and the difference between IGN N and EGM08 N:
�3
-11 3 -1 -2
α π α
6.67 10 m kg s
Orthometric Height Normal Height
After calculating benchmarks positions theGeoidal Undulation (IGN N) was calculated:
Finally these values were compared with EGM08Geoidal Undulation Model (EGM08 N).
3- MEASUREMENTS
The following physical map shows the 28 benchmarks that were recently measured in Puna.
Several measurement methods have been utilised in this area.
50 meters
High Precision Geodetic Leveling:
Gravimetric Observations:
Differential GPS:
Trimble DiNi 12 and Invar rods were used in order to ensure the precision standardsestablished by the IGN. The equidistance between the rods was at all times . The28 benchmarks were measured twice and the mean value of each slope was used todetermine the calculations.
La oste & Romberg G43 gravimeter was used.
Double-frequency GPS equipment was used to determine the precise position of eachbenchmark. The sessions were two hours long to ensure centimetric precision of thecoordinates. GAMIT / GLOB K and GPPS / FILLNET software was used for post-processing GPS data. The coordinates of the benchmarks were obtained in the ITRF05-IGS05 reference frame.
A C The estimated error of the gravityreadings was approximately 0.5 mGal. The gravity determinations were linked to the IGSN1971 datum.
Station
Name
Orthometric
Height [m]
Poincaré &
Prey
Reduced
Gravity
[mGal]
Terrain
Correction
[mGal]
Refined
Poincaré &
Prey
Reduced
Gravity
[mGal]
Normal
Gravity
(GRS80)
[mGal]
Complete
Bouger
gravity
Anomaly
[mGal]
1 3928.900 977909.9 1.9 977908.0 978892.4 -984.5
2 3916.744 977907.0 1.6 977905.4 978889.2 -983.7
3 3911.439 977904.0 1.8 977902.2 978885.5 -983.3
4 3904.271 977894.4 1.9 977892.5 978882.0 -989.4
5 3904.205 977891.4 1.7 977889.7 978878.2 -988.5
6 3901.528 977880.5 1.8 977878.7 978874.6 -995.8
7 3920.413 977877.1 2.5 977874.6 978871.2 -996.6
8 3917.952 977880.9 2.3 977878.5 978867.7 -989.2
9 3921.251 977876.5 1.4 977875.1 978864.8 -989.7
10 3920.456 977872.8 1.3 977871.5 978861.0 -989.6
11 3897.949 977868.4 1.1 977867.2 978861.3 -994.1
12 3905.297 977867.4 1.3 977866.1 978859.3 -993.2
13 3899.782 977868.8 1.6 977867.2 978855.9 -988.7
14 3904.504 977865.6 1.6 977864.0 978852.5 -988.5
15 3930.765 977861.9 1.4 977860.5 978850.1 -989.6
16 4067.410 977856.5 2.0 977854.5 978848.5 -994.0
17 3998.440 977871.7 7.2 977864.5 978849.0 -984.5
18 3824.449 977907.7 1.3 977906.4 978849.2 -942.8
19 3631.550 977946.6 2.2 977944.4 978848.9 -904.5
SQES 3595.881 977950.1 2.4 977947.7 978847.6 -899.9
20 3734.083 977930.7 1.6 977929.1 978848.5 -919.4
21 3743.759 977935.7 2.0 977933.7 978850.5 -916.8
22 3800.633 977924.2 1.4 977922.8 978849.9 -927.1
23 3634.558 977944.6 7.7 977936.9 978850.2 -913.3
24 3536.550 977965.1 4.5 977960.7 978849.5 -888.9
25 3482.688 977975.6 1.7 977973.9 978849.9 -876.0
26 3462.279 977993.4 1.4 977992.0 978852.0 -860.0
27 3444.377 978015.0 1.1 978013.8 978854.0 -840.1
Station
Name
Ellipsoidal
Height [m]
Orthometric
Height [m]IGN N [m]
EGM08 N
[m]
1 3974.925 3928.900 46.025 42.724
2 3962.757 3916.744 46.013 42.707
3 3957.487 3911.439 46.048 42.701
4 3950.303 3904.271 46.032 42.658
5 3950.242 3904.205 46.037 42.643
6 3947.516 3901.528 45.988 42.637
7 3966.488 3920.413 46.075 42.629
8 3964.057 3917.952 46.105 42.649
9 3967.310 3921.251 46.059 42.693
10 3966.553 3920.456 46.097 42.724
11 3943.936 3897.949 45.987 42.793
12 3951.348 3905.297 46.051 42.819
13 3945.885 3899.782 46.103 42.757
14 3950.593 3904.504 46.089 42.671
15 3976.896 3930.765 46.131 42.668
16 4113.695 4067.410 46.285 42.707
17 4044.762 3998.440 46.322 42.710
18 3870.726 3824.449 46.277 42.732
19 3677.819 3631.550 46.269 42.775
SQES 3642.141 3595.881 46.260 42.788
20 3780.296 3734.083 46.213 42.776
21 3789.940 3743.759 46.181 42.694
22 3846.743 3800.633 46.110 42.642
23 3680.618 3634.558 46.060 42.570
24 3582.491 3536.550 45.941 42.505
25 3528.439 3482.688 45.751 42.419
26 3507.902 3462.279 45.623 42.274
27 3489.919 3444.377 45.542 42.110
Station
Name
Geometric
Height [m]
Orthometric
Height [m]
Normal
Height [m]
6 N(355)
1 3928.895 3928.900 3928.885
2 3916.725 3916.744 3916.708
3 3911.407 3911.439 3911.386
4 3904.200 3904.271 3904.175
5 3904.122 3904.205 3904.096
6 3901.400 3901.528 3901.373
7 3920.275 3920.413 3920.259
8 3917.828 3917.952 3917.811
9 3921.111 3921.251 3921.096
10 3920.301 3920.456 3920.285
11 3897.773 3897.949 3897.743
12 3905.118 3905.297 3905.092
13 3899.608 3899.782 3899.579
14 3904.317 3904.504 3904.291
15 3930.568 3930.765 3930.558
16 4067.215 4067.410 4067.292
17 3998.295 3998.440 3998.328
18 3824.419 3824.449 3824.345
19 3631.637 3631.550 3631.457
SQES 3595.976 3595.881 3595.777
20 3734.126 3734.083 3734.001
21 3743.824 3743.759 3743.704
22 3800.662 3800.633 3800.575
23 3634.638 3634.558 3634.460
24 3536.690 3536.550 3536.462
25 3482.857 3482.688 3482.603
26 3462.508 3462.279 3462.245
27 3444.680 3444.377 3444.410
ΔH -499.657 -499.541 -499.927
3944.337
Area under study