graduation rates by major - southeastern louisiana … · graduation rates by major college of...
TRANSCRIPT

Graduation Rates by Major Fall 1998 Cohort
May 2005 Office of Institutional Research and Assessment

Graduation Rates by Major Fall 1998 Cohort
Executive Summary
Typically, Southeastern reports graduation rates for the entire university or for a subgroup of students such as athletes, or by ethnicity or gender. This report is unique in that it will show graduation rates based on the original major of the student when they first enrolled at Southeastern. Each major will show a graduation rate for its major, for the major's department, the major's college and for the university. This report also includes information on student progression. Students were tracked by student classification for each semester. The Fall 1998 cohort of 2,588 first-time, full-time, degree-seeking students were tracked each semester by major for six years. Of the 2,588 students who started in Fall 1998, 654 graduated for an overall graduation rate of 25.3%. But if you look at those students who graduated with the same major they started with when they entered the institution, only 232 students graduated for a 9.0% graduation rate. In Fall 2004, the first semester after the six-year period, there were an additional 258 (10.0%) students who were still enrolled in Southeastern. In Fall 2004, students who transferred to another Louisiana public higher education institution made up another 6.8% (176). Majors in the College of Education and Human Development graduate within their original major at a much higher rate than the rest of the University, 17.2%. A smaller percentage of students are graduating from their original majors in the College of Arts and Sciences, College of Business and Technology, and the College of Nursing and Health Sciences with 7.9%, 12.7%, and 12.2% respectfully. The departments of Foreign Languages, Marketing and Finance, Communication, Management, Teaching and Learning, Accounting, and Human Development all have relatively high graduation rates for those students who began in majors within their respective departments, 33.3%, 22.2%, 19.5%, 18.3%, 17.4%, 16.9%, and 16.3% respectively. Another measure in this report is the average-time-to-degree. For each major the number of semesters on average it took for students to obtain a degree is displayed. This measure includes all intervening semesters between the student's first semester here at Southeastern and their graduating semester, not including summer semesters. This number includes stop-outs. Overall, the average time it took for a student to obtain a degree was 12.3 semesters. The quickest time-to-degree for majors came from Government 8.8 semesters, and Social Studies Education 9.6 semesters. Art Education, Consumer Family Services, Sociology, General Studies, and Social Work had the longest time-to-degree with 25.0, 14.7, 14.5, 14.5, and 14.2 semesters respectively.

Graduation Rates by Major
Introduction This report takes a longitudinal look at a beginning cohort of students. This cohort was tracked for six years in order to analyze the retention and graduation patterns of Southeastern’s students. The analysis took first-time, full-time, degree-seeking freshmen in the fall of 1998 and tracked them for six years through Summer of 2004 using the following six categories: students persisting in the major; students who changed their major and are still enrolled; students who transferred to another Louisiana public higher educational institution; students who graduated within the original major; students who graduated outside of the original major; and students who dropped out. This report has included information on students’ progression through their program. This information will show by semester the number of students who progressed in their program. Graduation Rates The National Center for Educational Statistics Integrated Postsecondary Educational Data Systems’ (IPEDS) definition of graduation rates is the basis of this report. IPEDS considers a student graduated if that student has graduated within one hundred and fifty percent of normal time. For baccalaureate degree-seeking students, one hundred and fifty percent of normal time will be six years. For associate degree-seeking students, one hundred and fifty percent of normal time will be three years. Associate degree-seeking students are included in the “Within the Major” category if they graduated with an associate degree within the three-year limit. If the associate degree-seeking student changed their major to a baccalaureate major and graduated, they will be included if they have graduated within the six year time limit. Cohort The cohort is defined as first-time, full-time, degree-seeking students who entered Southeastern in the fall of 1998. First-time students are those students who have not attended any postsecondary institution prior to attending Southeastern. Full-time students are those who are enrolled in twelve or more credit hours. Students must have been classified in a degree-seeking major; students in Special Programs for Adults are excluded. Students who entered as Developmental or Provisional were tracked until they matriculated into the first non-developmental, degree-seeking majors. These majors were then used as their intended cohort majors. After the cohort was defined, the students were tracked each fall semester to determine if they persisted in their original majors, changed their majors and were still persisting, dropped out of Southeastern or transferred to another public institution. The students were also tracked every semester to determine if they had graduated in their original majors or if they had graduated in different majors. Two graduation rates are presented for each degree program. One is for those students who graduated in the original degree program. The second is an overall graduation rate for those students that started in that particular major including those who changed majors. There are also four comparative graduation rates given per major -- the department rate, the college rate, and two university rates.
Progression An indicator of students’ progression has been added to this year’s report. The students were tracked to see if they had obtained a higher classification for each successive fall semester. Therefore, in Fall 1999 progression indicates the number of students who were enrolled as sophomores. Likewise, this progression indicator for Fall 2000 and Fall 2001 indicates the number of students who were enrolled as juniors and seniors, respectively. For Fall 2002, Fall 2003, and Fall 2004, this indicator shows the number of students who have obtained senior status. Average Time to Degree Those students who graduated with a baccalaureate degree during Summer 2003, Fall 2003 and Spring 2004 semesters were tracked backwards to determine the Average Time-to-Degree. This figure per major indicates the amount of time, fall and spring semesters only, from the first semester the student started at Southeastern until and including the semester of graduation. Included in this figure are those semesters that would be considered stop-outs. This figure does not include transfer students. Graphs The graphs depict each major separately and reflect the cohort’s percent distribution between each of the above mentioned five categories. It is especially important to take into account the size of the cohort. Caution should be used when interpreting graphs for relatively small cohorts. A change in the status of one or two students in a major with a relatively small cohort may have a large effect on the percent change between categories. Note: This report follows the academic departmental reorganization of Summer 2004. The 1998 majors in this report are placed in the appropriate academic department in the new organization, although this may not have been their department during their college career.

Number Number that Number that Number Number Six -Year Graduation Six - YearNumber that are Graduated Graduated Out that That Rate for Those Who Graduation
in Still in of Original Transferred Dropped Persisted in Rate forDeclared Majors Cohort Enrolled Original Major Major Out Out Original Major ALL Students
COLLEGE OF ARTS AND SCIENCES
Department of Biological ScienceBiological Sciences 232 31 15 31 22 133 6.5% 19.8%
Horticulture 5 1 2 1 1 0 40.0% 60.0%Science Education Biology 4 0 0 0 0 4 0.0% 0.0%
Department Total 241 32 17 32 23 137 7.1% 20.3%
Department of Chemistry and PhysicsChemistry 35 5 1 9 5 15 2.9% 28.6%
Physics 75 10 0 14 5 46 0.0% 18.7%Science Education Chemistry 1 1 0 0 0 0 0.0% 0.0%
Science Education Physics 1 0 0 0 0 1 0.0% 0.0%Department Total 112 16 1 23 10 62 0.9% 21.4%
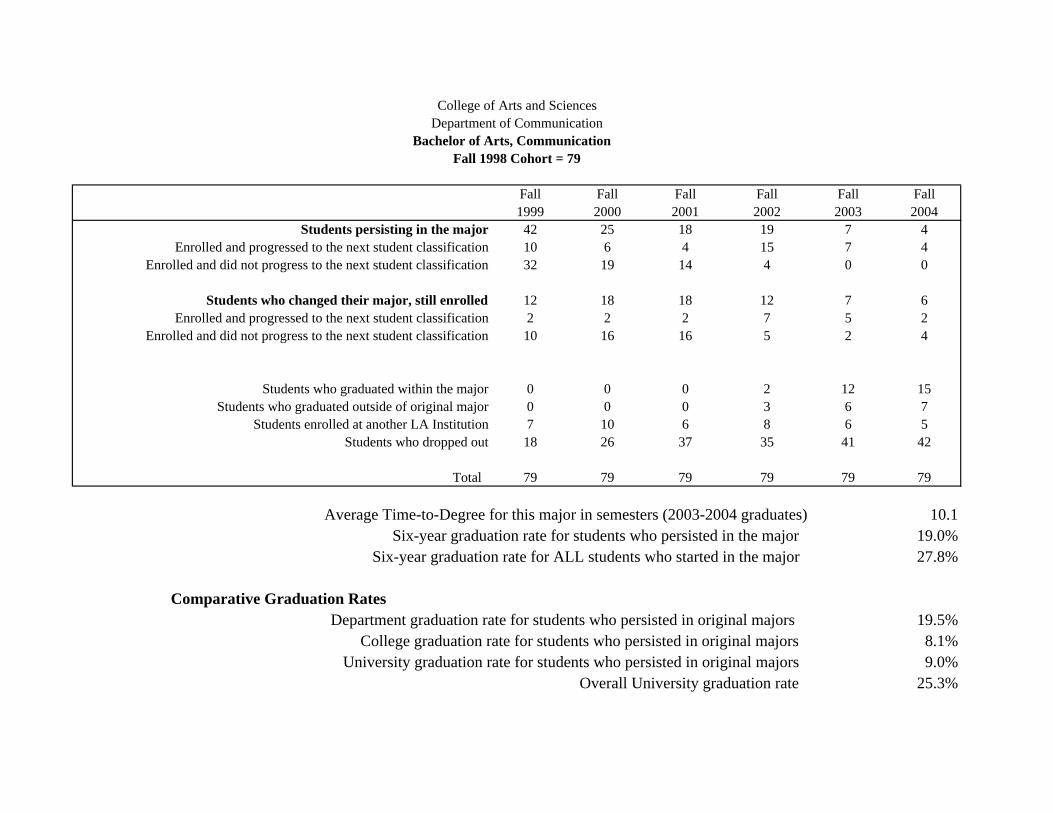
Department of CommunicationCommunication 79 10 15 7 5 42 19.0% 27.8%
Communication Education 3 0 1 0 1 1 33.3% 33.3%Department Total 82 10 16 7 6 43 19.5% 28.0%
Department of EnglishEnglish 15 1 1 4 0 9 6.7% 33.3%
English Education 17 0 1 6 0 10 5.9% 41.2%Liberal Arts Studies 32 2 2 3 3 22 6.3% 15.6%Department Total 64 3 4 13 3 41 6.3% 26.6%
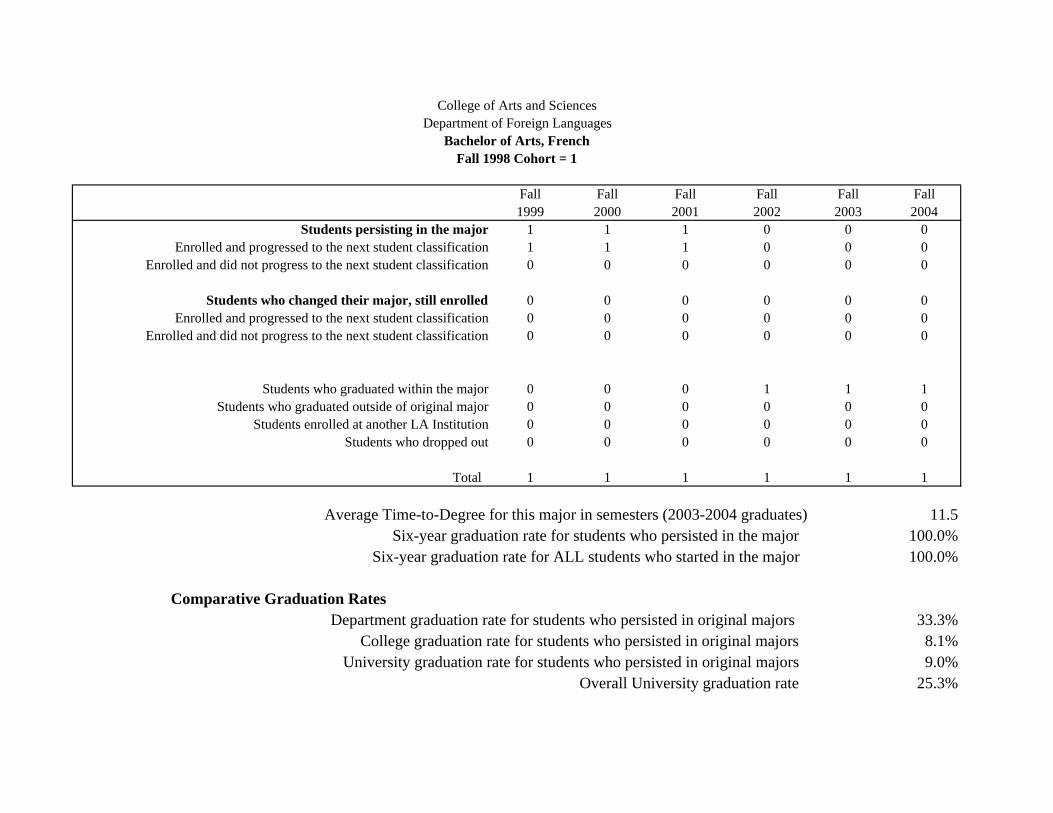
Department of Foreign Languages and LiteraturesFrench 1 0 1 0 0 0 100.0% 100.0%
Spanish 1 0 0 0 0 1 0.0% 0.0%Spanish Education 1 0 0 0 0 1 0.0% 0.0%
Department Total 3 0 1 0 0 2 33.3% 33.3%
Southeastern Louisiana UniversityGraduation Rates by Major
Graduation Rates by Major Institutional Research Assessment
Number Number that Number that Number Number Six -Year Graduation Six - YearNumber that are Graduated Graduated Out that That Rate for Those Who Graduation
in Still in of Original Transferred Dropped Persisted in Rate forDeclared Majors Cohort Enrolled Original Major Major Out Out Original Major ALL Students
Southeastern Louisiana UniversityGraduation Rates by Major
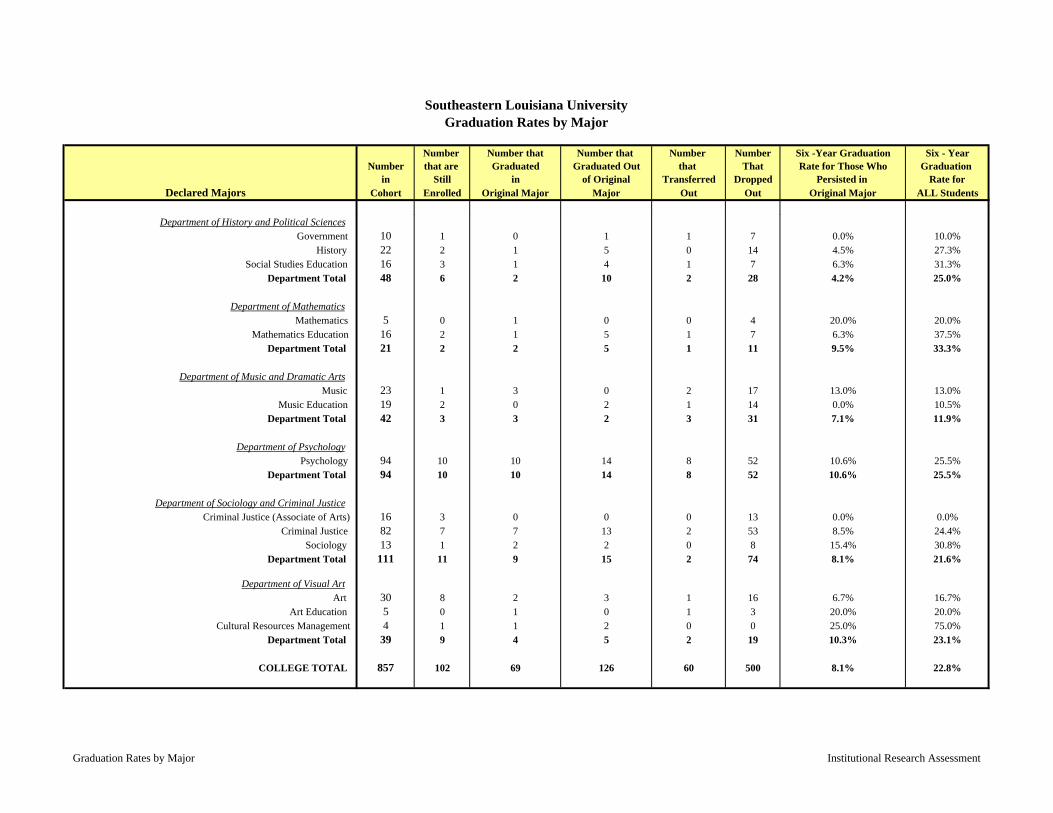
Department of History and Political SciencesGovernment 10 1 0 1 1 7 0.0% 10.0%
History 22 2 1 5 0 14 4.5% 27.3%Social Studies Education 16 3 1 4 1 7 6.3% 31.3%
Department Total 48 6 2 10 2 28 4.2% 25.0%
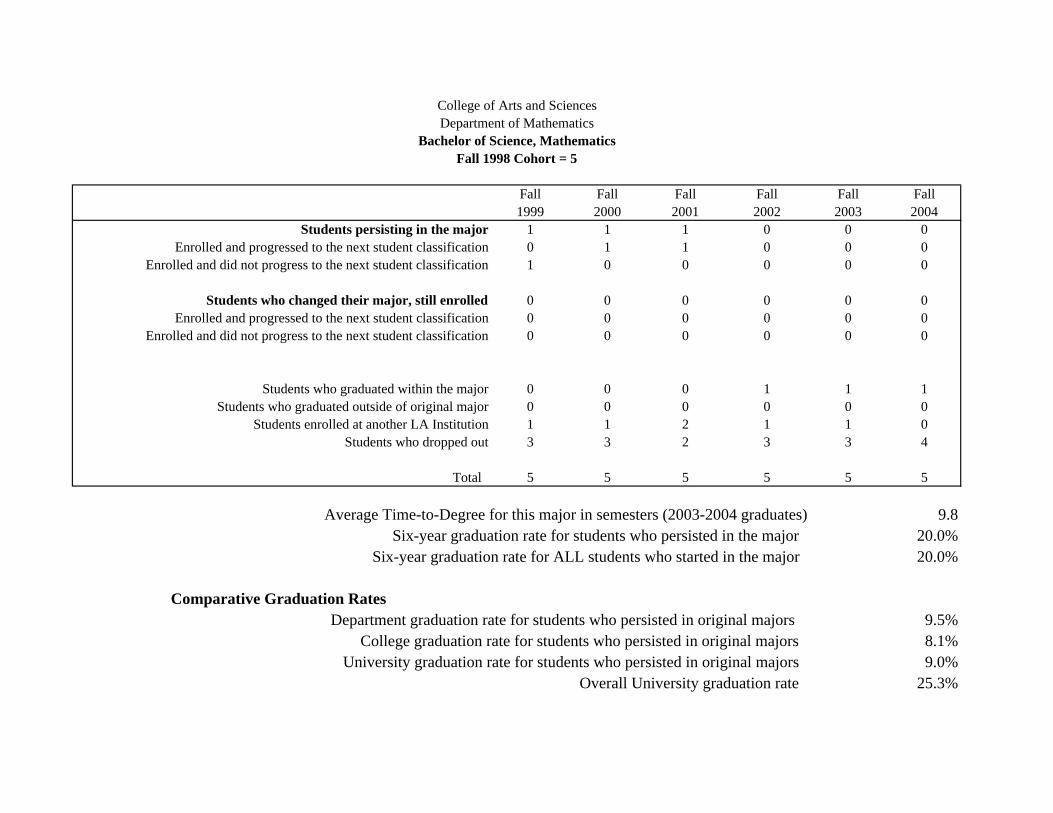
Department of MathematicsMathematics 5 0 1 0 0 4 20.0% 20.0%
Mathematics Education 16 2 1 5 1 7 6.3% 37.5%Department Total 21 2 2 5 1 11 9.5% 33.3%
Department of Music and Dramatic ArtsMusic 23 1 3 0 2 17 13.0% 13.0%
Music Education 19 2 0 2 1 14 0.0% 10.5%Department Total 42 3 3 2 3 31 7.1% 11.9%
Department of PsychologyPsychology 94 10 10 14 8 52 10.6% 25.5%
Department Total 94 10 10 14 8 52 10.6% 25.5%
Department of Sociology and Criminal JusticeCriminal Justice (Associate of Arts) 16 3 0 0 0 13 0.0% 0.0%
Criminal Justice 82 7 7 13 2 53 8.5% 24.4% Sociology 13 1 2 2 0 8 15.4% 30.8%
Department Total 111 11 9 15 2 74 8.1% 21.6%
Department of Visual ArtArt 30 8 2 3 1 16 6.7% 16.7%
Art Education 5 0 1 0 1 3 20.0% 20.0%Cultural Resources Management 4 1 1 2 0 0 25.0% 75.0%
Department Total 39 9 4 5 2 19 10.3% 23.1%
COLLEGE TOTAL 857 102 69 126 60 500 8.1% 22.8%
Graduation Rates by Major Institutional Research Assessment

Number Number that Number that Number Number Six -Year Graduation Six - YearNumber that are Graduated Graduated Out that That Rate for Those Who Graduation
in Still in of Original Transferred Dropped Persisted in Rate forDeclared Majors Cohort Enrolled Original Major Major Out Out Original Major ALL Students
Southeastern Louisiana UniversityGraduation Rates by Major
COLLEGE OF BUSINESS AND TECHNOLOGY
Department of AccountingAccounting 83 10 14 22 3 34 16.9% 43.4%
Department Total 83 10 14 22 3 34 16.9% 43.4%
Department of Computer ScienceComputer Science 119 14 3 23 7 72 2.5% 21.8%
Department Total 119 14 3 23 7 72 2.5% 21.8%
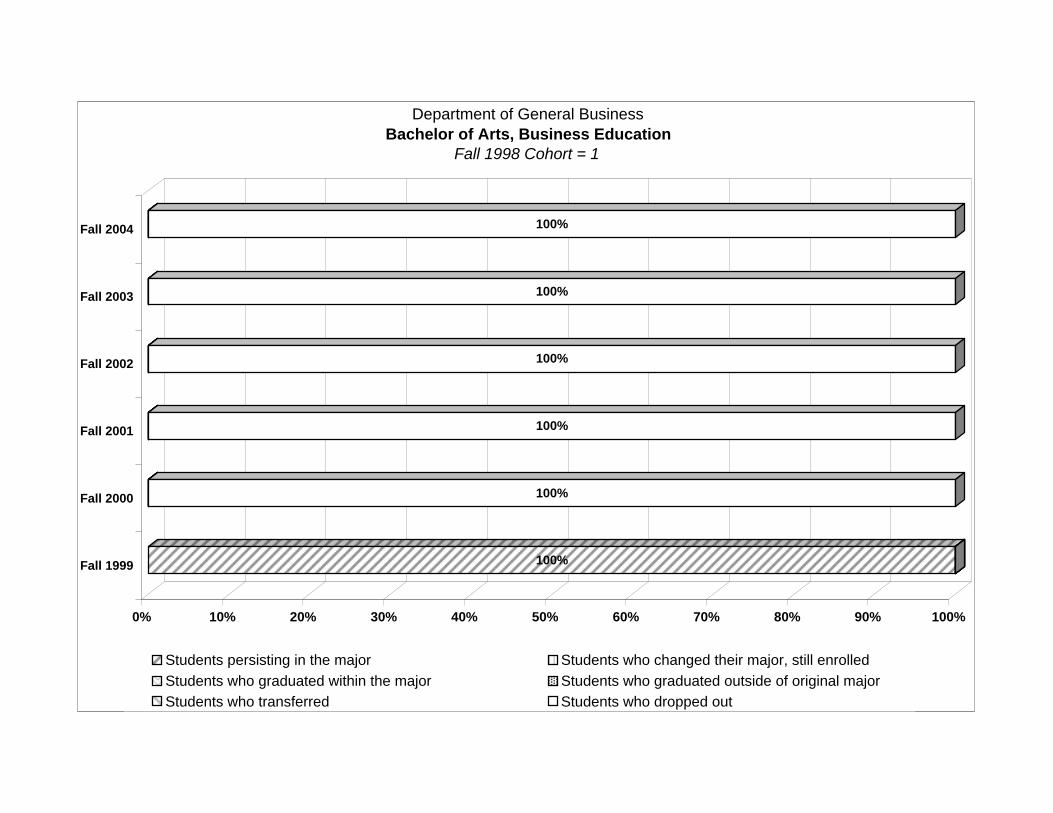
Department of General BusinessBusiness Education 1 0 0 0 0 1 0.0% 0.0%
General Business 98 8 12 18 10 50 12.2% 30.6%Office Administration 3 1 0 0 0 2 0.0% 0.0%
Office Administration (Associate of Arts) 2 0 0 0 0 2 0.0% 0.0%Department Total 104 9 12 18 10 55 11.5% 28.8%
Department of Industrial TechnologyDesign-Drafter Technology (Associates of Applied Science) 10 1 0 2 1 6 0.0% 20.0%
Industrial Technology (Bachelor of Science) 77 4 6 6 12 49 7.8% 15.6%Department Total 87 5 6 8 13 55 6.9% 16.1%
Department of ManagementManagement 126 14 23 13 7 69 18.3% 28.6%
Department Total 126 14 23 13 7 69 18.3% 28.6%
Department of Marketing and FinanceFinance 15 0 4 2 0 9 26.7% 40.0%
Marketing 66 6 14 8 5 33 21.2% 33.3%Department Total 81 6 18 10 5 42 22.2% 34.6%
COLLEGE TOTAL 600 58 76 94 45 327 12.7% 28.3%
Graduation Rates by Major Institutional Research Assessment
Number Number that Number that Number Number Six -Year Graduation Six - YearNumber that are Graduated Graduated Out that That Rate for Those Who Graduation
in Still in of Original Transferred Dropped Persisted in Rate forDeclared Majors Cohort Enrolled Original Major Major Out Out Original Major ALL Students
Southeastern Louisiana UniversityGraduation Rates by Major
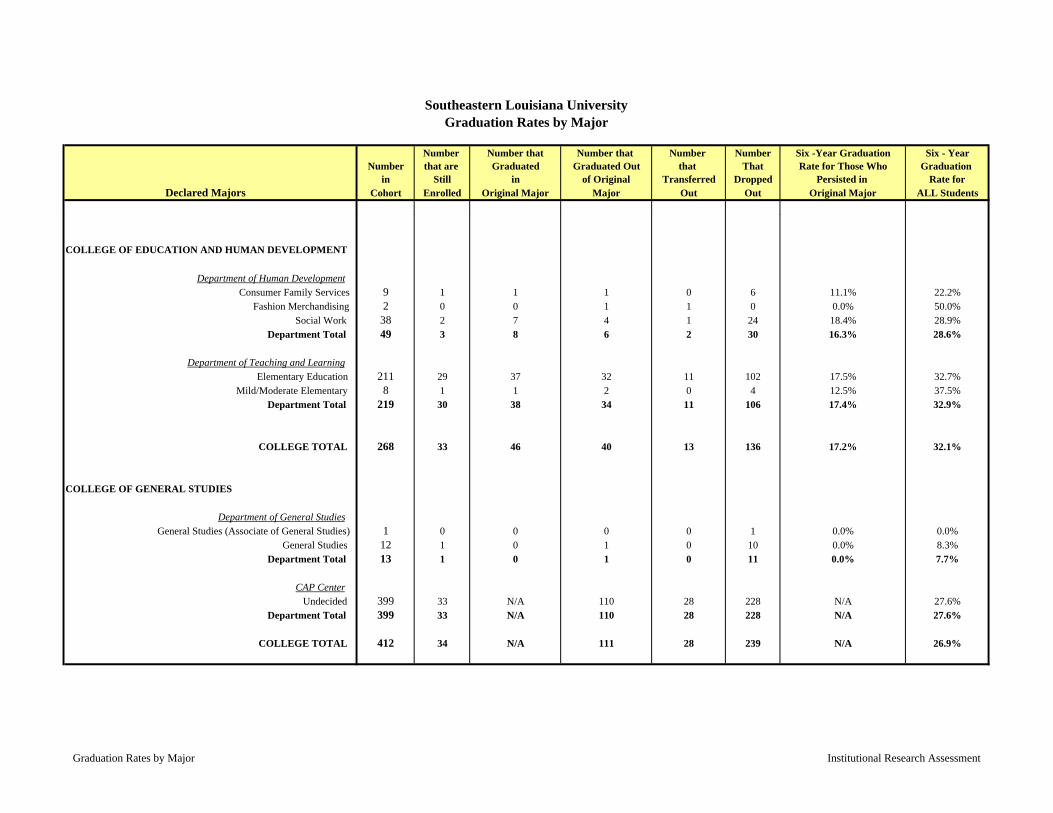
COLLEGE OF EDUCATION AND HUMAN DEVELOPMENT
Department of Human DevelopmentConsumer Family Services 9 1 1 1 0 6 11.1% 22.2%
Fashion Merchandising 2 0 0 1 1 0 0.0% 50.0%Social Work 38 2 7 4 1 24 18.4% 28.9%
Department Total 49 3 8 6 2 30 16.3% 28.6%
Department of Teaching and LearningElementary Education 211 29 37 32 11 102 17.5% 32.7%
Mild/Moderate Elementary 8 1 1 2 0 4 12.5% 37.5%Department Total 219 30 38 34 11 106 17.4% 32.9%
COLLEGE TOTAL 268 33 46 40 13 136 17.2% 32.1%
COLLEGE OF GENERAL STUDIES
Department of General StudiesGeneral Studies (Associate of General Studies) 1 0 0 0 0 1 0.0% 0.0%
General Studies 12 1 0 1 0 10 0.0% 8.3%Department Total 13 1 0 1 0 11 0.0% 7.7%
CAP CenterUndecided 399 33 N/A 110 28 228 N/A 27.6%
Department Total 399 33 N/A 110 28 228 N/A 27.6%
COLLEGE TOTAL 412 34 N/A 111 28 239 N/A 26.9%
Graduation Rates by Major Institutional Research Assessment

Number Number that Number that Number Number Six -Year Graduation Six - YearNumber that are Graduated Graduated Out that That Rate for Those Who Graduation
in Still in of Original Transferred Dropped Persisted in Rate forDeclared Majors Cohort Enrolled Original Major Major Out Out Original Major ALL Students
Southeastern Louisiana UniversityGraduation Rates by Major
COLLEGE OF NURSING AND HEALTH SCIENCES
Department of Communication Sciences and DisordersSpeech, Language, and Hearing 27 2 3 5 3 14 11.1% 29.6%
Department Total 27 2 3 5 3 14 11.1% 29.6%
Department of Kinesiology and Health StudiesKinesiology 86 8 12 13 3 50 14.0% 29.1%
Department Total 86 8 12 13 3 50 14.0% 29.1%
School of NursingNursing 223 21 26 33 13 130 11.7% 26.5%
Department Total 223 21 26 33 13 130 11.7% 26.5%
COLLEGE TOTAL 336 31 41 51 19 194 12.2% 27.4%
Provisional Admit 24 0 0 0 1 23 0.0% 0.0%Developmental Education 91 0 0 0 10 81 0.0% 0.0%
UNIVERSITY TOTAL 2588 258 232 422 176 1500 9.0% 25.3%
Graduation Rates by Major Institutional Research Assessment
Sophomore Fall 1999
Juniors Fall 2000
Seniors Fall 2001 Fall 2002 Fall 2003 Fall 2004
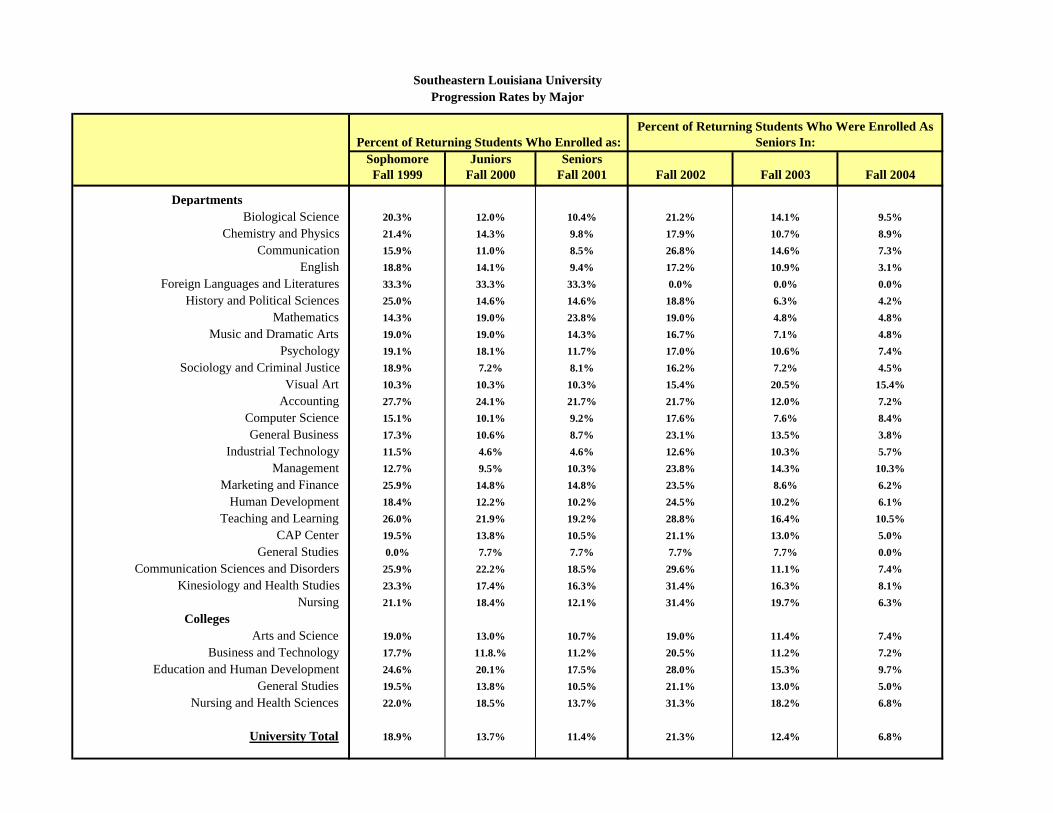
DepartmentsBiological Science 20.3% 12.0% 10.4% 21.2% 14.1% 9.5%
Chemistry and Physics 21.4% 14.3% 9.8% 17.9% 10.7% 8.9%Communication 15.9% 11.0% 8.5% 26.8% 14.6% 7.3%
English 18.8% 14.1% 9.4% 17.2% 10.9% 3.1%Foreign Languages and Literatures 33.3% 33.3% 33.3% 0.0% 0.0% 0.0%
History and Political Sciences 25.0% 14.6% 14.6% 18.8% 6.3% 4.2% Mathematics 14.3% 19.0% 23.8% 19.0% 4.8% 4.8%
Music and Dramatic Arts 19.0% 19.0% 14.3% 16.7% 7.1% 4.8% Psychology 19.1% 18.1% 11.7% 17.0% 10.6% 7.4%
Sociology and Criminal Justice 18.9% 7.2% 8.1% 16.2% 7.2% 4.5% Visual Art 10.3% 10.3% 10.3% 15.4% 20.5% 15.4%
Accounting 27.7% 24.1% 21.7% 21.7% 12.0% 7.2% Computer Science 15.1% 10.1% 9.2% 17.6% 7.6% 8.4% General Business 17.3% 10.6% 8.7% 23.1% 13.5% 3.8%
Industrial Technology 11.5% 4.6% 4.6% 12.6% 10.3% 5.7% Management 12.7% 9.5% 10.3% 23.8% 14.3% 10.3%
Marketing and Finance 25.9% 14.8% 14.8% 23.5% 8.6% 6.2% Human Development 18.4% 12.2% 10.2% 24.5% 10.2% 6.1%
Teaching and Learning 26.0% 21.9% 19.2% 28.8% 16.4% 10.5%CAP Center 19.5% 13.8% 10.5% 21.1% 13.0% 5.0%
General Studies 0.0% 7.7% 7.7% 7.7% 7.7% 0.0% Communication Sciences and Disorders 25.9% 22.2% 18.5% 29.6% 11.1% 7.4%
Kinesiology and Health Studies 23.3% 17.4% 16.3% 31.4% 16.3% 8.1%Nursing 21.1% 18.4% 12.1% 31.4% 19.7% 6.3%
CollegesArts and Science 19.0% 13.0% 10.7% 19.0% 11.4% 7.4%
Business and Technology 17.7% 11.8.% 11.2% 20.5% 11.2% 7.2%Education and Human Development 24.6% 20.1% 17.5% 28.0% 15.3% 9.7%
General Studies 19.5% 13.8% 10.5% 21.1% 13.0% 5.0%Nursing and Health Sciences 22.0% 18.5% 13.7% 31.3% 18.2% 6.8%
University Total 18.9% 13.7% 11.4% 21.3% 12.4% 6.8%
Southeastern Louisiana UniversityProgression Rates by Major
Percent of Returning Students Who Enrolled as:Percent of Returning Students Who Were Enrolled As
Seniors In:

Fall Fall Fall Fall Fall Fall1999 2000 2001 2002 2003 2004
Students persisting in the major 119 62 44 27 14 9Enrolled and progressed to the next student classification 31 14 13 16 12 8
Enrolled and did not progress to the next student classification 88 48 31 11 2 1
Students who changed their major, still enrolled 36 49 52 59 37 22Enrolled and progressed to the next student classification 15 13 11 33 22 15
Enrolled and did not progress to the next student classification 21 36 41 26 15 7
Students who graduated within the major 0 0 0 3 9 15Students who graduated outside of original major 0 0 0 4 17 31
Students enrolled at another LA Institution 19 30 25 21 30 22Students who dropped out 58 91 111 118 125 133
Total 232 232 232 232 232 232
Average Time-to-Degree for this major in semesters (2003-2004 graduates) 11.6Six-year graduation rate for students who persisted in the major 6.5%
Six-year graduation rate for ALL students who started in the major 19.8%
Comparative Graduation Rates Department graduation rate for students who persisted in original majors 7.1%
College graduation rate for students who persisted in original majors 8.1%University graduation rate for students who persisted in original majors 9.0%
Overall University graduation rate 25.3%
College of Arts and SciencesDepartment of Biological Sciences
Bachelor of Science, Biological Sciences Fall 1998 Cohort = 232
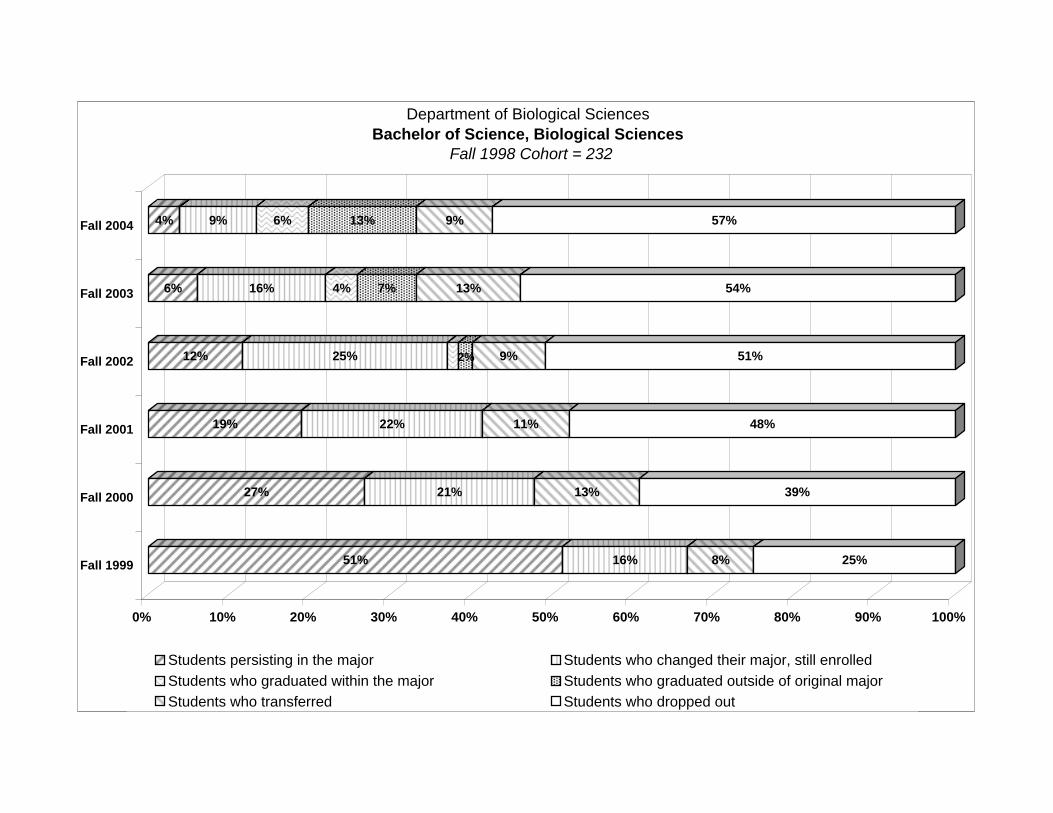
51% 16% 8% 25%
27% 21% 13% 39%
19% 22% 11% 48%
12% 25% 2% 9% 51%
6% 16% 4% 7% 13% 54%
4% 9% 6% 13% 9% 57%
0% 10% 20% 30% 40% 50% 60% 70% 80% 90% 100%
Fall 1999
Fall 2000
Fall 2001
Fall 2002
Fall 2003
Fall 2004
Department of Biological Sciences Bachelor of Science, Biological Sciences
Fall 1998 Cohort = 232
Students persisting in the major Students who changed their major, still enrolled Students who graduated within the major Students who graduated outside of original major Students who transferred Students who dropped out

Fall Fall Fall Fall Fall Fall1999 2000 2001 2002 2003 2004
Students persisting in the major 4 3 3 3 1 1Enrolled and progressed to the next student classification 3 1 0 2 0 0
Enrolled and did not progress to the next student classification 1 2 3 1 1 1
Students who changed their major, still enrolled 1 1 1 0 0 0Enrolled and progressed to the next student classification 0 1 1 0 0 0
Enrolled and did not progress to the next student classification 1 0 0 0 0 0
Students who graduated within the major 0 0 0 0 2 2Students who graduated outside of original major 0 0 0 1 1 1
Students enrolled at another LA Institution 0 1 1 1 1 1Students who dropped out 0 0 0 0 0 0
Total 5 5 5 5 5 5
Average Time-to-Degree for this major in semesters (2003-2004 graduates) 12.0Six-year graduation rate for students who persisted in the major 40.0%
Six-year graduation rate for ALL students who started in the major 60.0%
Comparative Graduation Rates Department graduation rate for students who persisted in original majors 7.1%
College graduation rate for students who persisted in original majors 8.1%University graduation rate for students who persisted in original majors 9.0%
Overall University graduation rate 25.3%
College of Arts and SciencesDepartment of Biological Sciences
Bachelor of Science, Horticulture Fall 1998 Cohort = 5
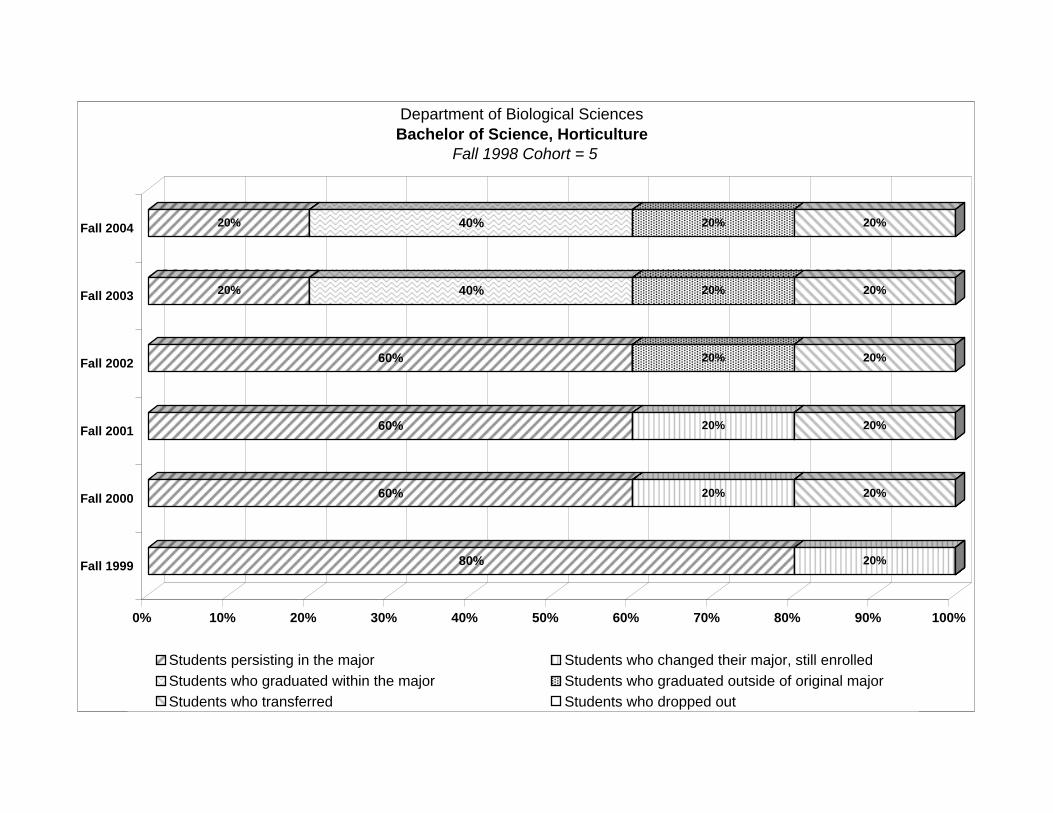
80% 20%
60% 20% 20%
60% 20% 20%
60% 20% 20%
20% 40% 20% 20%
20% 40% 20% 20%
0% 10% 20% 30% 40% 50% 60% 70% 80% 90% 100%
Fall 1999
Fall 2000
Fall 2001
Fall 2002
Fall 2003
Fall 2004
Department of Biological Sciences Bachelor of Science, Horticulture
Fall 1998 Cohort = 5
Students persisting in the major Students who changed their major, still enrolled Students who graduated within the major Students who graduated outside of original major Students who transferred Students who dropped out

Fall Fall Fall Fall Fall Fall1999 2000 2001 2002 2003 2004
Students persisting in the major 2 1 0 0 0 0Enrolled and progressed to the next student classification 0 0 0 0 0 0
Enrolled and did not progress to the next student classification 2 1 0 0 0 0
Students who changed their major, still enrolled 0 0 1 0 0 0Enrolled and progressed to the next student classification 0 0 0 0 0 0
Enrolled and did not progress to the next student classification 0 0 1 0 0 0
Students who graduated within the major 0 0 0 0 0 0Students who graduated outside of original major 0 0 0 0 0 0
Students enrolled at another LA Institution 0 0 0 0 0 0Students who dropped out 2 3 3 4 4 4
Total 4 4 4 4 4 4
Average Time-to-Degree for this major in semesters (2003-2004 graduates) NASix-year graduation rate for students who persisted in the major 0.0%
Six-year graduation rate for ALL students who started in the major 0.0%
Comparative Graduation Rates Department graduation rate for students who persisted in original majors 7.1%
College graduation rate for students who persisted in original majors 8.1%University graduation rate for students who persisted in original majors 9.0%
Overall University graduation rate 25.3%
College of Arts and SciencesDepartment of Biological Sciences
Bachelor of Science, Science Education Biology Fall 1998 Cohort = 4
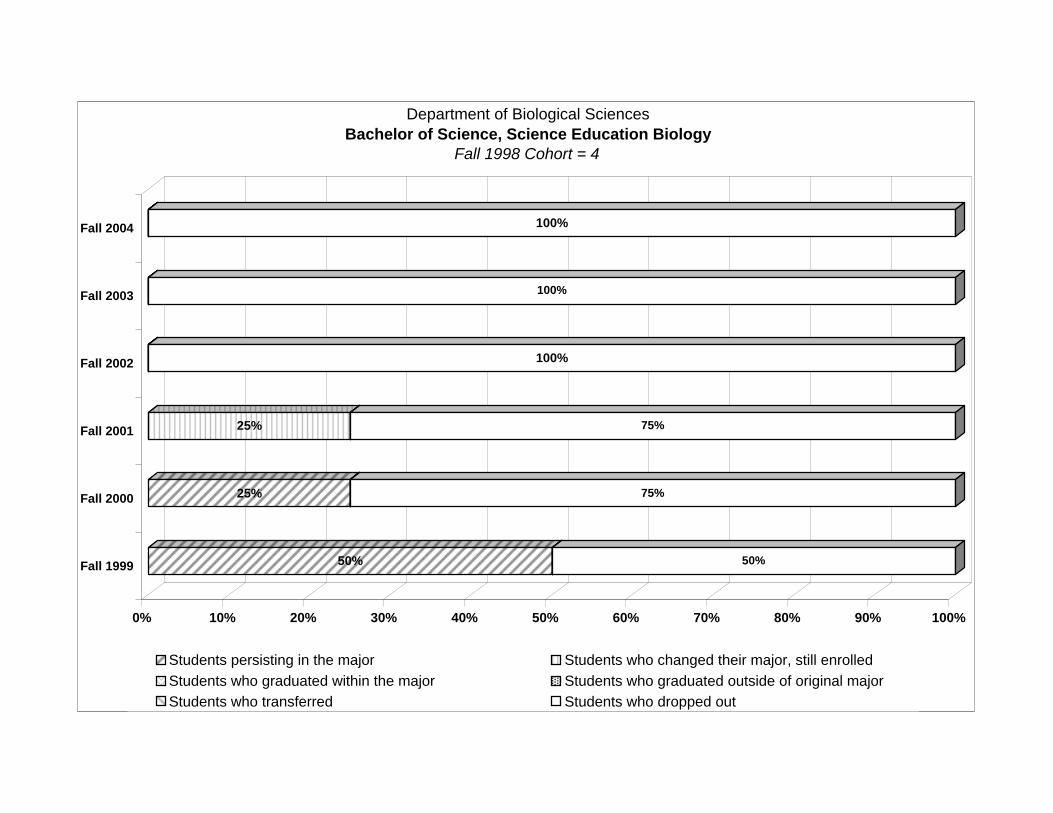
50% 50%
25% 75%
25% 75%
100%
100%
100%
0% 10% 20% 30% 40% 50% 60% 70% 80% 90% 100%
Fall 1999
Fall 2000
Fall 2001
Fall 2002
Fall 2003
Fall 2004
Department of Biological Sciences Bachelor of Science, Science Education Biology
Fall 1998 Cohort = 4
Students persisting in the major Students who changed their major, still enrolled Students who graduated within the major Students who graduated outside of original major Students who transferred Students who dropped out

Fall Fall Fall Fall Fall Fall1999 2000 2001 2002 2003 2004
Students persisting in the major 18 8 8 1 0 0Enrolled and progressed to the next student classification 8 4 2 1 0 0
Enrolled and did not progress to the next student classification 10 4 6 0 0 0
Students who changed their major, still enrolled 7 9 9 8 8 5Enrolled and progressed to the next student classification 5 6 5 7 4 2
Enrolled and did not progress to the next student classification 2 3 4 1 4 3
Students who graduated within the major 0 0 0 1 1 1Students who graduated outside of original major 0 0 0 2 6 9
Students enrolled at another LA Institution 3 5 6 4 4 5Students who dropped out 7 13 12 19 16 15
Total 35 35 35 35 35 35
Average Time-to-Degree for this major in semesters (2003-2004 graduates) 10.5Six-year graduation rate for students who persisted in the major 2.9%
Six-year graduation rate for ALL students who started in the major 28.6%
Comparative Graduation Rates Department graduation rate for students who persisted in original majors 0.9%
College graduation rate for students who persisted in original majors 8.1%University graduation rate for students who persisted in original majors 9.0%
Overall University graduation rate 25.3%
College of Arts and SciencesDepartment of Chemistry and Physics
Bachelor of Science, ChemistryFall 1998 Cohort = 35
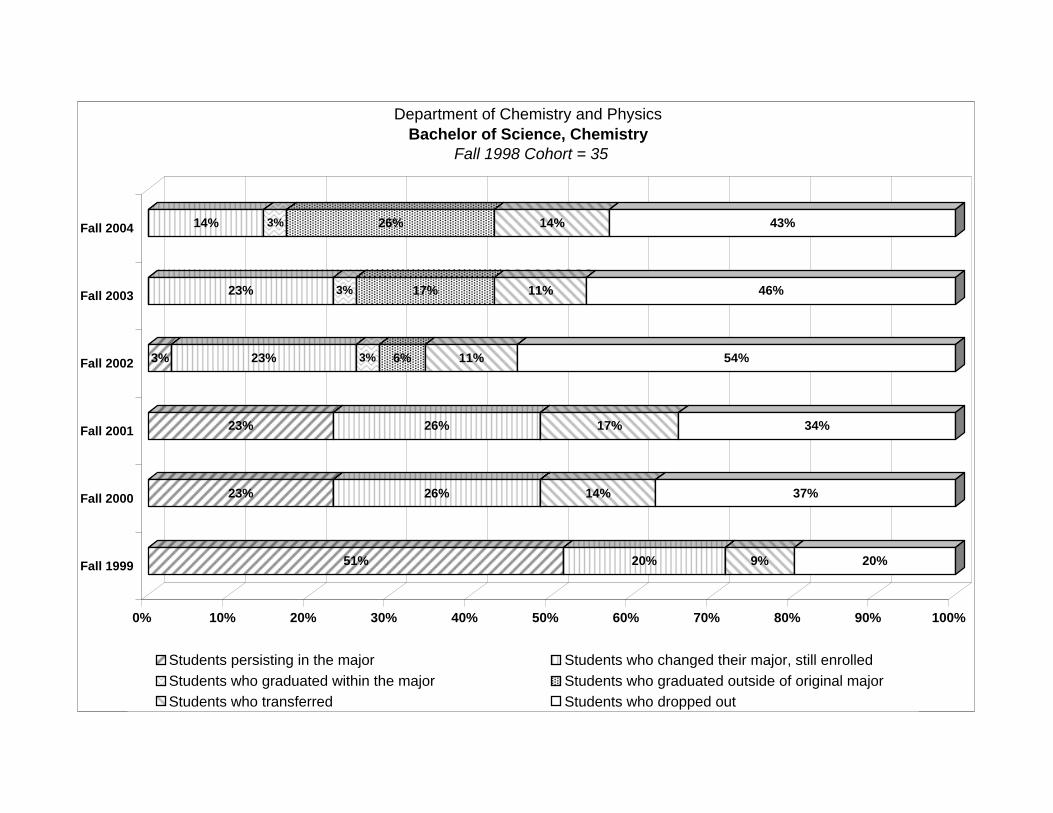
51% 20% 9% 20%
23% 26% 14% 37%
23% 26% 17% 34%
3% 23% 3% 6% 11% 54%
23% 3% 17% 11% 46%
14% 3% 26% 14% 43%
0% 10% 20% 30% 40% 50% 60% 70% 80% 90% 100%
Fall 1999
Fall 2000
Fall 2001
Fall 2002
Fall 2003
Fall 2004
Department of Chemistry and Physics Bachelor of Science, Chemistry
Fall 1998 Cohort = 35
Students persisting in the major Students who changed their major, still enrolled Students who graduated within the major Students who graduated outside of original major Students who transferred Students who dropped out

Fall Fall Fall Fall Fall Fall1999 2000 2001 2002 2003 2004
Students persisting in the major 29 11 5 1 0 0Enrolled and progressed to the next student classification 3 0 0 0 0 0
Enrolled and did not progress to the next student classification 26 11 5 1 0 0
Students who changed their major, still enrolled 19 21 24 21 16 10Enrolled and progressed to the next student classification 7 6 4 12 8 7
Enrolled and did not progress to the next student classification 12 15 20 9 8 3
Students who graduated within the major 0 0 0 0 0 0Students who graduated outside of original major 0 1 1 5 11 14
Students enrolled at another LA Institution 6 14 14 17 13 5Students who dropped out 21 28 31 31 35 46
Total 75 75 75 75 75 75
Average Time-to-Degree for this major in semesters (2003-2004 graduates) 10.0Six-year graduation rate for students who persisted in the major 0.0%
Six-year graduation rate for ALL students who started in the major 18.7%
Comparative Graduation Rates Department graduation rate for students who persisted in original majors 0.9%
College graduation rate for students who persisted in original majors 8.1%University graduation rate for students who persisted in original majors 9.0%
Overall University graduation rate 25.3%
College of Arts and SciencesDepartment of Chemistry and Physics
Bachelor of Science, PhysicsFall 1998 Cohort = 75
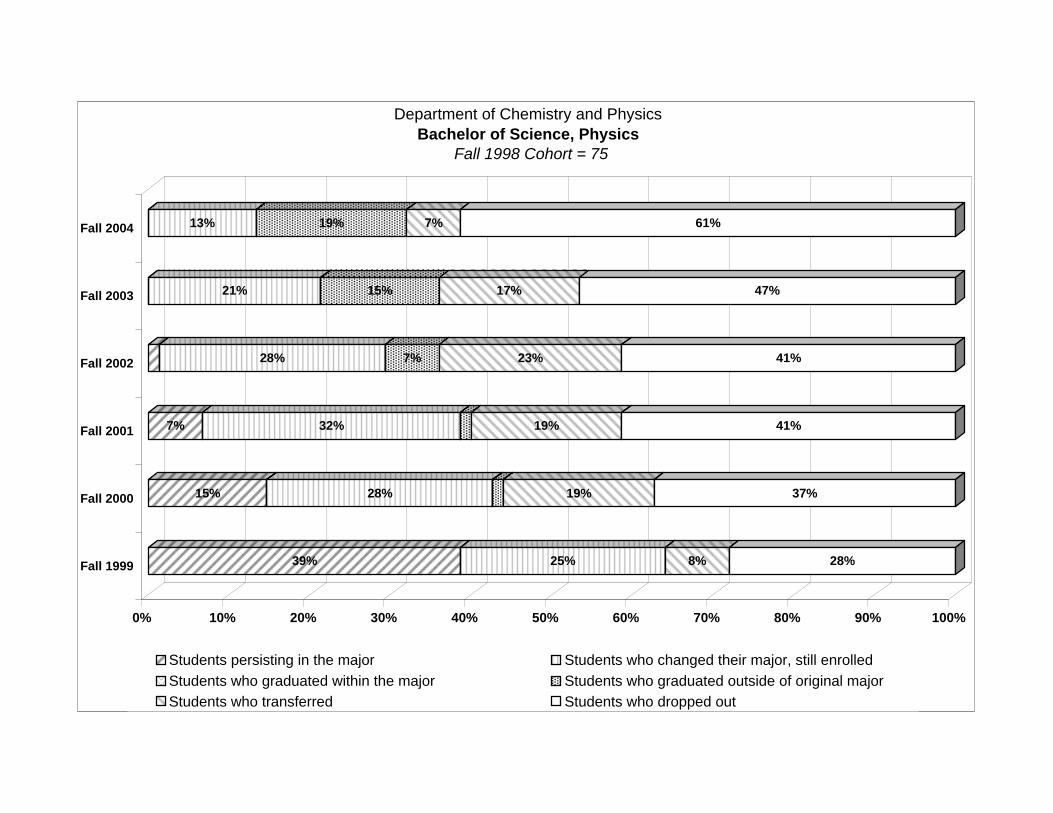
39% 25% 8% 28%
15% 28% 19% 37%
7% 32% 19% 41%
28% 7% 23% 41%
21% 15% 17% 47%
13% 19% 7% 61%
0% 10% 20% 30% 40% 50% 60% 70% 80% 90% 100%
Fall 1999
Fall 2000
Fall 2001
Fall 2002
Fall 2003
Fall 2004
Department of Chemistry and Physics Bachelor of Science, Physics
Fall 1998 Cohort = 75
Students persisting in the major Students who changed their major, still enrolled Students who graduated within the major Students who graduated outside of original major Students who transferred Students who dropped out
Fall Fall Fall Fall Fall Fall1999 2000 2001 2002 2003 2004
Students persisting in the major 42 25 18 19 7 4Enrolled and progressed to the next student classification 10 6 4 15 7 4
Enrolled and did not progress to the next student classification 32 19 14 4 0 0
Students who changed their major, still enrolled 12 18 18 12 7 6Enrolled and progressed to the next student classification 2 2 2 7 5 2
Enrolled and did not progress to the next student classification 10 16 16 5 2 4
Students who graduated within the major 0 0 0 2 12 15Students who graduated outside of original major 0 0 0 3 6 7
Students enrolled at another LA Institution 7 10 6 8 6 5Students who dropped out 18 26 37 35 41 42
Total 79 79 79 79 79 79
Average Time-to-Degree for this major in semesters (2003-2004 graduates) 10.1Six-year graduation rate for students who persisted in the major 19.0%
Six-year graduation rate for ALL students who started in the major 27.8%
Comparative Graduation Rates Department graduation rate for students who persisted in original majors 19.5%
College graduation rate for students who persisted in original majors 8.1%University graduation rate for students who persisted in original majors 9.0%
Overall University graduation rate 25.3%
College of Arts and SciencesDepartment of Communication
Bachelor of Arts, Communication Fall 1998 Cohort = 79
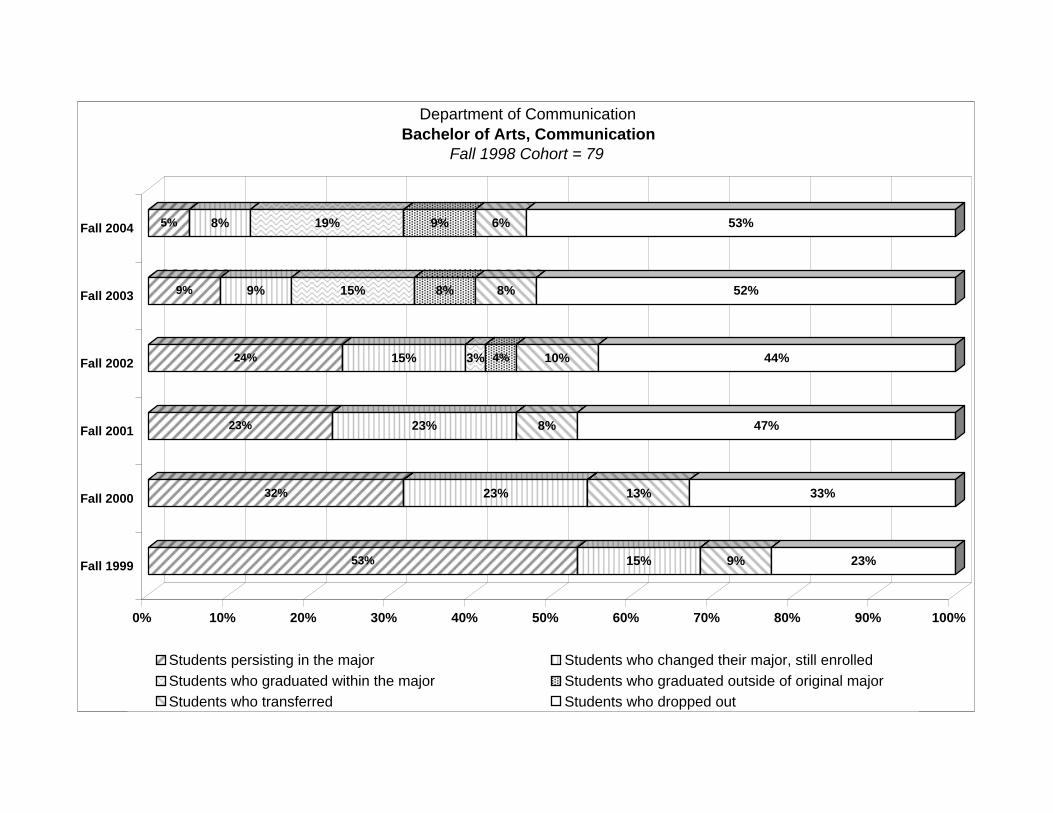
53% 15% 9% 23%
32% 23% 13% 33%
23% 23% 8% 47%
24% 15% 3% 4% 10% 44%
9% 9% 15% 8% 8% 52%
5% 8% 19% 9% 6% 53%
0% 10% 20% 30% 40% 50% 60% 70% 80% 90% 100%
Fall 1999
Fall 2000
Fall 2001
Fall 2002
Fall 2003
Fall 2004
Department of Communication Bachelor of Arts, Communication
Fall 1998 Cohort = 79
Students persisting in the major Students who changed their major, still enrolled Students who graduated within the major Students who graduated outside of original major Students who transferred Students who dropped out

Fall Fall Fall Fall Fall Fall1999 2000 2001 2002 2003 2004
Students persisting in the major 3 1 1 0 0 0Enrolled and progressed to the next student classification 1 1 1 0 0 0
Enrolled and did not progress to the next student classification 2 0 0 0 0 0
Students who changed their major, still enrolled 0 0 0 1 0 0Enrolled and progressed to the next student classification 0 0 0 0 0 0
Enrolled and did not progress to the next student classification 0 0 0 1 0 0
Students who graduated within the major 0 0 0 1 1 1Students who graduated outside of original major 0 0 0 0 0 0
Students enrolled at another LA Institution 0 1 0 0 1 1Students who dropped out 0 1 2 1 1 1
Total 3 3 3 3 3 3
Average Time-to-Degree for this major in semesters (2003-2004 graduates) 13.7Six-year graduation rate for students who persisted in the major 33.3%
Six-year graduation rate for ALL students who started in the major 33.3%
Comparative Graduation Rates Department graduation rate for students who persisted in original majors 19.5%
College graduation rate for students who persisted in original majors 8.1%University graduation rate for students who persisted in original majors 9.0%
Overall University graduation rate 25.3%
College of Arts and SciencesDepartment of Communication
Bachelor of Arts, Communication Education Fall 1998 Cohort = 3
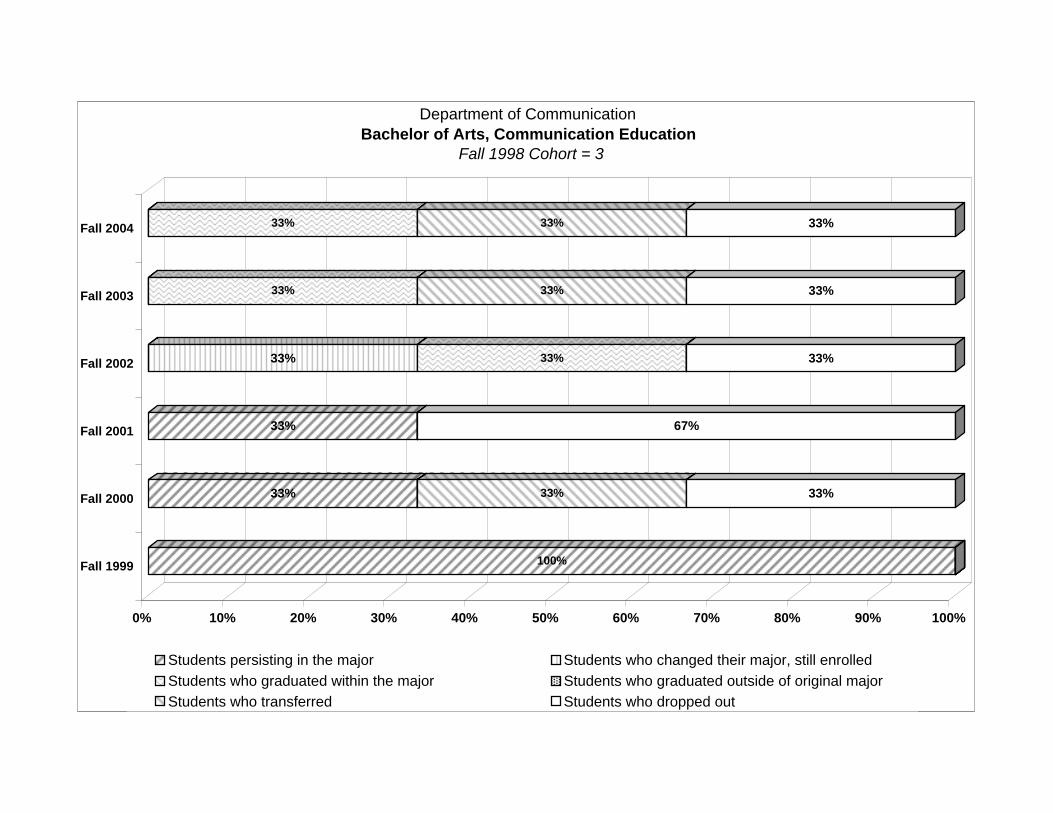
100%
33% 33% 33%
33% 67%
33% 33% 33%
33% 33% 33%
33% 33% 33%
0% 10% 20% 30% 40% 50% 60% 70% 80% 90% 100%
Fall 1999
Fall 2000
Fall 2001
Fall 2002
Fall 2003
Fall 2004
Department of Communication Bachelor of Arts, Communication Education
Fall 1998 Cohort = 3
Students persisting in the major Students who changed their major, still enrolled Students who graduated within the major Students who graduated outside of original major Students who transferred Students who dropped out

Fall Fall Fall Fall Fall Fall1999 2000 2001 2002 2003 2004
Students persisting in the major 6 2 1 0 0 0Enrolled and progressed to the next student classification 1 1 1 0 0 0
Enrolled and did not progress to the next student classification 5 1 0 0 0 0
Students who changed their major, still enrolled 4 8 8 4 3 1Enrolled and progressed to the next student classification 1 1 1 3 2 1
Enrolled and did not progress to the next student classification 3 7 7 1 1 0
Students who graduated within the major 0 0 0 1 1 1Students who graduated outside of original major 0 0 0 0 3 4
Students enrolled at another LA Institution 2 1 2 2 1 0Students who dropped out 3 4 4 8 7 9
Total 15 15 15 15 15 15
Average Time-to-Degree for this major in semesters (2003-2004 graduates) 12.9Six-year graduation rate for students who persisted in the major 6.7%
Six-year graduation rate for ALL students who started in the major 33.3%
Comparative Graduation Rates Department graduation rate for students who persisted in original majors 6.3%
College graduation rate for students who persisted in original majors 8.1%University graduation rate for students who persisted in original majors 9.0%
Overall University graduation rate 25.3%
College of Arts and SciencesDepartment of English
Bachelor of Arts, English Fall 1998 Cohort = 15
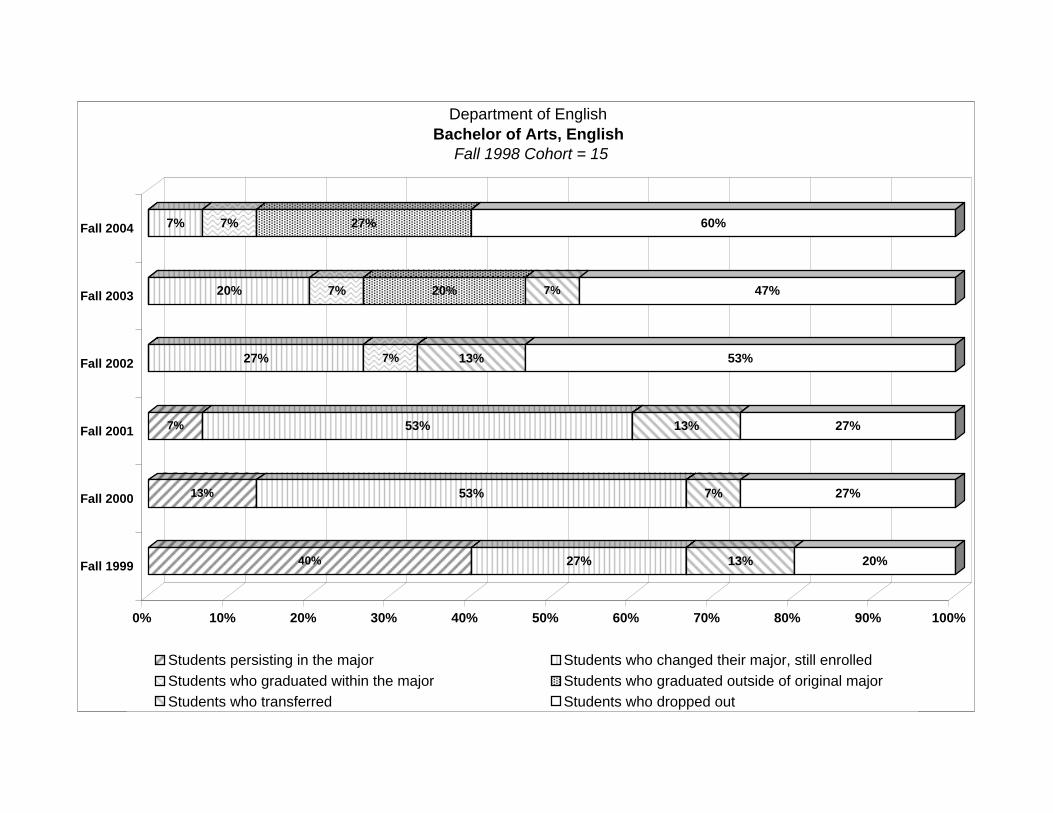
40% 27% 13% 20%
13% 53% 7% 27%
7% 53% 13% 27%
27% 7% 13% 53%
20% 7% 20% 7% 47%
7% 7% 27% 60%
0% 10% 20% 30% 40% 50% 60% 70% 80% 90% 100%
Fall 1999
Fall 2000
Fall 2001
Fall 2002
Fall 2003
Fall 2004
Department of English Bachelor of Arts, English
Fall 1998 Cohort = 15
Students persisting in the major Students who changed their major, still enrolled Students who graduated within the major Students who graduated outside of original major Students who transferred Students who dropped out

Fall Fall Fall Fall Fall Fall1999 2000 2001 2002 2003 2004
Students persisting in the major 10 5 2 1 0 0Enrolled and progressed to the next student classification 5 3 1 1 0 0
Enrolled and did not progress to the next student classification 5 2 1 0 0 0
Students who changed their major, still enrolled 4 4 4 3 2 0Enrolled and progressed to the next student classification 2 1 0 3 2 0
Enrolled and did not progress to the next student classification 2 3 4 0 0 0
Students who graduated within the major 0 0 0 1 1 1Students who graduated outside of original major 0 0 1 2 4 6
Students enrolled at another LA Institution 1 2 1 1 0 0Students who dropped out 2 6 9 9 10 10
Total 17 17 17 17 17 17
Average Time-to-Degree for this major in semesters (2003-2004 graduates) 13.3Six-year graduation rate for students who persisted in the major 5.9%
Six-year graduation rate for ALL students who started in the major 41.2%
Comparative Graduation Rates Department graduation rate for students who persisted in original majors 6.3%
College graduation rate for students who persisted in original majors 8.1%University graduation rate for students who persisted in original majors 9.0%
Overall University graduation rate 25.3%
College of Arts and SciencesDepartment of English
Bachelor of Arts, English Education Fall 1998 Cohort = 17
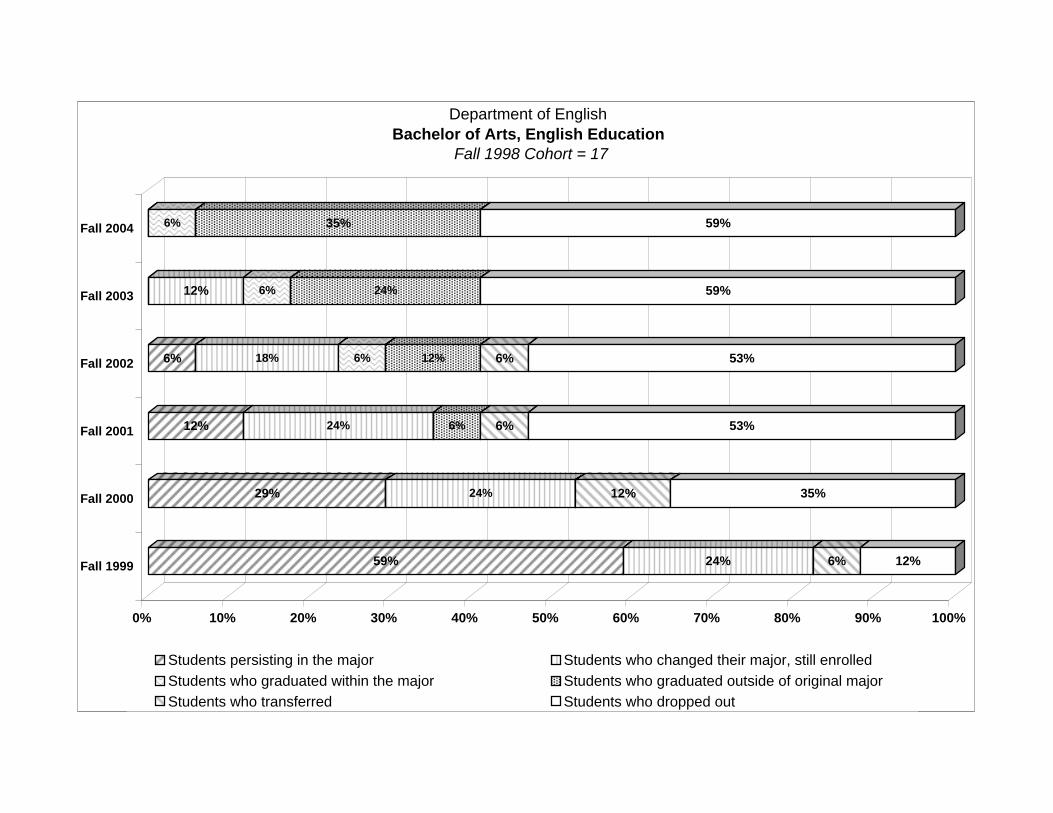
59% 24% 6% 12%
29% 24% 12% 35%
12% 24% 6% 6% 53%
6% 18% 6% 12% 6% 53%
12% 6% 24% 59%
6% 35% 59%
0% 10% 20% 30% 40% 50% 60% 70% 80% 90% 100%
Fall 1999
Fall 2000
Fall 2001
Fall 2002
Fall 2003
Fall 2004
Department of English Bachelor of Arts, English Education
Fall 1998 Cohort = 17
Students persisting in the major Students who changed their major, still enrolled Students who graduated within the major Students who graduated outside of original major Students who transferred Students who dropped out

Fall Fall Fall Fall Fall Fall1999 2000 2001 2002 2003 2004
Students persisting in the major 9 3 3 3 1 0Enrolled and progressed to the next student classification 1 1 1 2 1 0
Enrolled and did not progress to the next student classification 8 2 2 1 0 0
Students who changed their major, still enrolled 11 10 7 5 2 2Enrolled and progressed to the next student classification 2 2 2 2 2 1
Enrolled and did not progress to the next student classification 9 8 5 3 0 1
Students who graduated within the major 0 0 0 0 1 2Students who graduated outside of original major 0 0 0 2 2 3
Students enrolled at another LA Institution 3 5 5 6 3 3Students who dropped out 9 14 17 16 23 22
Total 32 32 32 32 32 32
Average Time-to-Degree for this major in semesters (2003-2004 graduates) 13.6Six-year graduation rate for students who persisted in the major 6.3%
Six-year graduation rate for ALL students who started in the major 15.6%
Comparative Graduation Rates Department graduation rate for students who persisted in original majors 6.3%
College graduation rate for students who persisted in original majors 8.1%University graduation rate for students who persisted in original majors 9.0%
Overall University graduation rate 25.3%
College of Arts and SciencesDepartment of English
Bachelor of Arts, Liberal Arts StudiesFall 1998 Cohort = 32
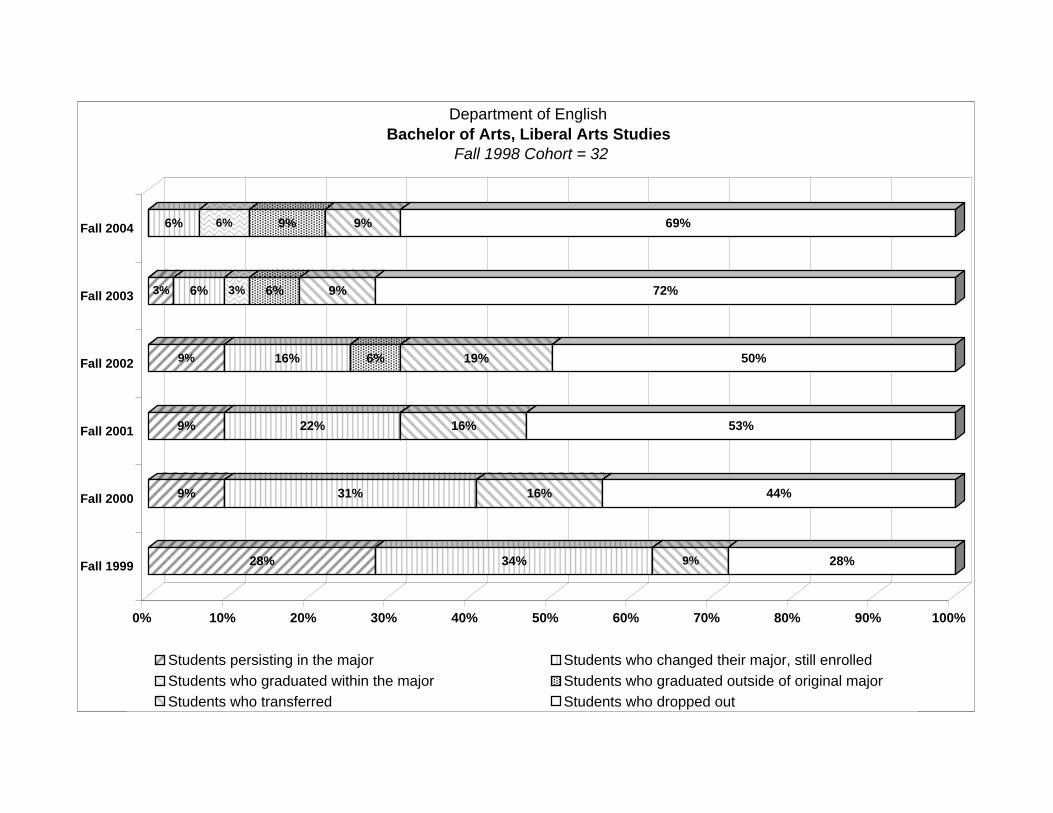
28% 34% 9% 28%
9% 31% 16% 44%
9% 22% 16% 53%
9% 16% 6% 19% 50%
3% 6% 3% 6% 9% 72%
6% 6% 9% 9% 69%
0% 10% 20% 30% 40% 50% 60% 70% 80% 90% 100%
Fall 1999
Fall 2000
Fall 2001
Fall 2002
Fall 2003
Fall 2004
Department of English Bachelor of Arts, Liberal Arts Studies
Fall 1998 Cohort = 32
Students persisting in the major Students who changed their major, still enrolled Students who graduated within the major Students who graduated outside of original major Students who transferred Students who dropped out
Fall Fall Fall Fall Fall Fall1999 2000 2001 2002 2003 2004
Students persisting in the major 1 1 1 0 0 0Enrolled and progressed to the next student classification 1 1 1 0 0 0
Enrolled and did not progress to the next student classification 0 0 0 0 0 0
Students who changed their major, still enrolled 0 0 0 0 0 0Enrolled and progressed to the next student classification 0 0 0 0 0 0
Enrolled and did not progress to the next student classification 0 0 0 0 0 0
Students who graduated within the major 0 0 0 1 1 1Students who graduated outside of original major 0 0 0 0 0 0
Students enrolled at another LA Institution 0 0 0 0 0 0Students who dropped out 0 0 0 0 0 0
Total 1 1 1 1 1 1
Average Time-to-Degree for this major in semesters (2003-2004 graduates) 11.5Six-year graduation rate for students who persisted in the major 100.0%
Six-year graduation rate for ALL students who started in the major 100.0%
Comparative Graduation Rates Department graduation rate for students who persisted in original majors 33.3%
College graduation rate for students who persisted in original majors 8.1%University graduation rate for students who persisted in original majors 9.0%
Overall University graduation rate 25.3%
College of Arts and SciencesDepartment of Foreign Languages
Bachelor of Arts, FrenchFall 1998 Cohort = 1

100%
100%
100%
100%
100%
100%
0% 10% 20% 30% 40% 50% 60% 70% 80% 90% 100%
Fall 1999
Fall 2000
Fall 2001
Fall 2002
Fall 2003
Fall 2004
Department of Foreign Languages Bachelor of Arts, French
Fall 1998 Cohort = 1
Students persisting in the major Students who changed their major, still enrolled Students who graduated within the major Students who graduated outside of original major Students who transferred Students who dropped out

Fall Fall Fall Fall Fall Fall1999 2000 2001 2002 2003 2004
Students persisting in the major 0 0 0 0 0 0Enrolled and progressed to the next student classification 0 0 0 0 0 0
Enrolled and did not progress to the next student classification 0 0 0 0 0 0
Students who changed their major, still enrolled 0 0 0 0 0 0Enrolled and progressed to the next student classification 0 0 0 0 0 0
Enrolled and did not progress to the next student classification 0 0 0 0 0 0
Students who graduated within the major 0 0 0 0 0 0Students who graduated outside of original major 0 0 0 0 0 0
Students enrolled at another LA Institution 0 0 0 0 0 0Students who dropped out 1 1 1 1 1 1
Total 1 1 1 1 1 1
Average Time-to-Degree for this major in semesters (2003-2004 graduates) 13.0Six-year graduation rate for students who persisted in the major 0.0%
Six-year graduation rate for ALL students who started in the major 0.0%
Comparative Graduation Rates Department graduation rate for students who persisted in original majors 33.3%
College graduation rate for students who persisted in original majors 8.1%University graduation rate for students who persisted in original majors 9.0%
Overall University graduation rate 25.3%
College of Arts and SciencesDepartment of Foreign Languages
Bachelor of Arts, SpanishFall 1998 Cohort = 1
100%
100%
100%
100%
100%
100%
0% 10% 20% 30% 40% 50% 60% 70% 80% 90% 100%
Fall 1999
Fall 2000
Fall 2001
Fall 2002
Fall 2003
Fall 2004
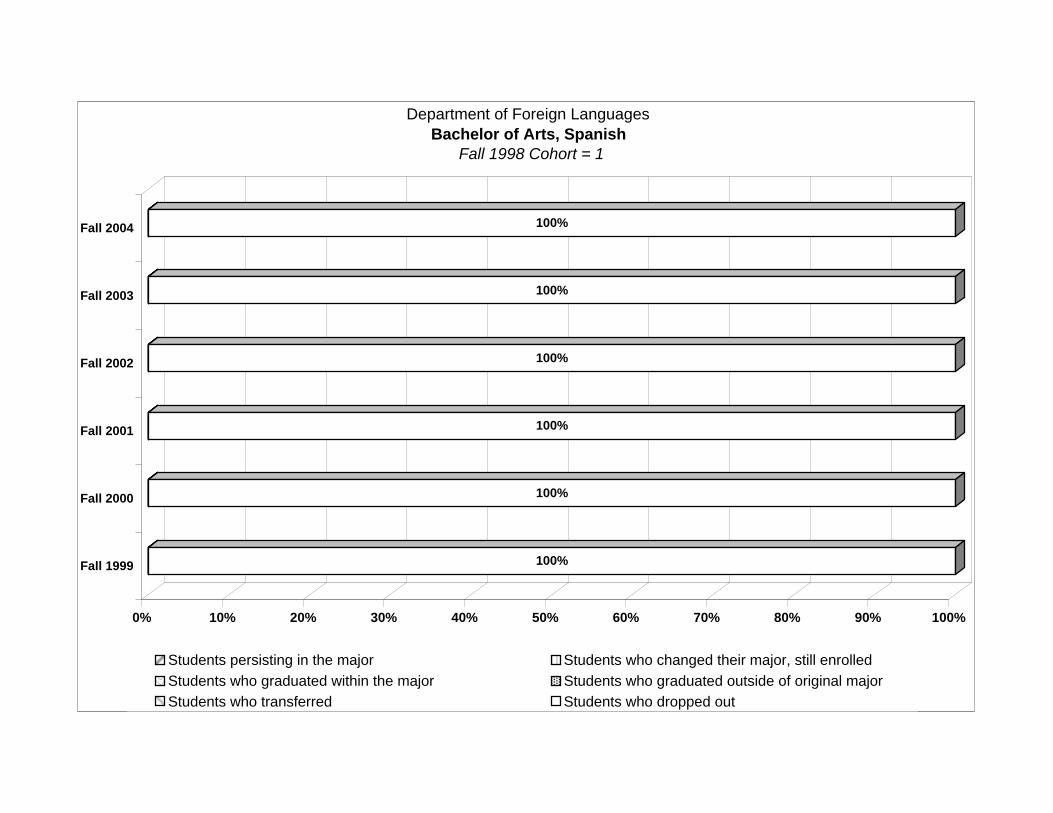
Department of Foreign LanguagesBachelor of Arts, Spanish
Fall 1998 Cohort = 1
Students persisting in the major Students who changed their major, still enrolled Students who graduated within the major Students who graduated outside of original major Students who transferred Students who dropped out

Fall Fall Fall Fall Fall Fall1999 2000 2001 2002 2003 2004
Students persisting in the major 1 0 0 1 0 0Enrolled and progressed to the next student classification 0 0 0 0 0 0
Enrolled and did not progress to the next student classification 1 0 0 1 0 0
Students who changed their major, still enrolled 0 0 0 0 0 0Enrolled and progressed to the next student classification 0 0 0 0 0 0
Enrolled and did not progress to the next student classification 0 0 0 0 0 0
Students who graduated within the major 0 0 0 0 0 0Students who graduated outside of original major 0 0 0 0 0 0
Students enrolled at another LA Institution 0 0 0 0 0 0Students who dropped out 0 1 1 0 1 1
Total 1 1 1 1 1 1
Average Time-to-Degree for this major in semesters (2003-2004 graduates) NA Six-year graduation rate for students who persisted in the major 0.0%
Six-year graduation rate for ALL students who started in the major 0.0%
Comparative Graduation Rates Department graduation rate for students who persisted in original majors 33.3%
College graduation rate for students who persisted in original majors 8.1%University graduation rate for students who persisted in original majors 9.0%
Overall University graduation rate 25.3%
College of Arts and SciencesDepartment of Foreign Languages
Bachelor of Arts, Spanish EducationFall 1998 Cohort = 1

100%
100%
100%
100%
100%
100%
0% 10% 20% 30% 40% 50% 60% 70% 80% 90% 100%
Fall 1999
Fall 2000
Fall 2001
Fall 2002
Fall 2003
Fall 2004
Department of Foreign LanguagesBachelor of Arts, Spanish Education
Fall 1998 Cohort = 1
Students persisting in the major Students who changed their major, still enrolled Students who graduated within the major Students who graduated outside of original major Students who transferred Students who dropped out
Fall Fall Fall Fall Fall Fall1999 2000 2001 2002 2003 2004
Students persisting in the major 6 3 1 1 0 0Enrolled and progressed to the next student classification 3 1 0 1 0 0
Enrolled and did not progress to the next student classification 3 2 1 0 0 0
Students who changed their major, still enrolled 2 2 2 2 1 1Enrolled and progressed to the next student classification 1 0 0 1 1 0
Enrolled and did not progress to the next student classification 1 2 2 1 0 1
Students who graduated within the major 0 0 0 0 0 0Students who graduated outside of original major 0 0 0 0 0 1
Students enrolled at another LA Institution 0 2 2 3 1 1Students who dropped out 2 3 5 4 8 7
Total 10 10 10 10 10 10
Average Time-to-Degree for this major in semesters (2003-2004 graduates) 8.8Six-year graduation rate for students who persisted in the major 0.0%
Six-year graduation rate for ALL students who started in the major 10.0%
Comparative Graduation Rates Department graduation rate for students who persisted in original majors 4.2%
College graduation rate for students who persisted in original majors 8.1%University graduation rate for students who persisted in original majors 9.0%
Overall University graduation rate 25.3%
College of Arts and SciencesDepartment of History and Political Sciences
Bachelor of Arts, Government Fall 1998 Cohort = 10
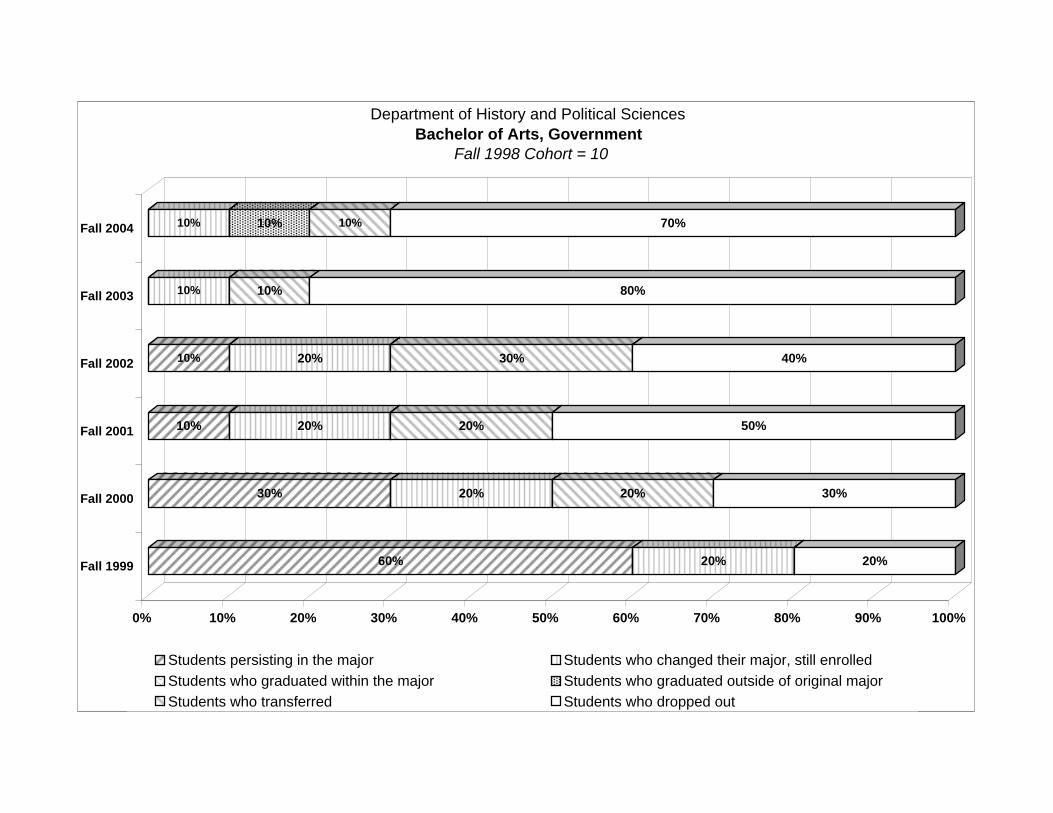
60% 20% 20%
30% 20% 20% 30%
10% 20% 20% 50%
10% 20% 30% 40%
10% 10% 80%
10% 10% 10% 70%
0% 10% 20% 30% 40% 50% 60% 70% 80% 90% 100%
Fall 1999
Fall 2000
Fall 2001
Fall 2002
Fall 2003
Fall 2004
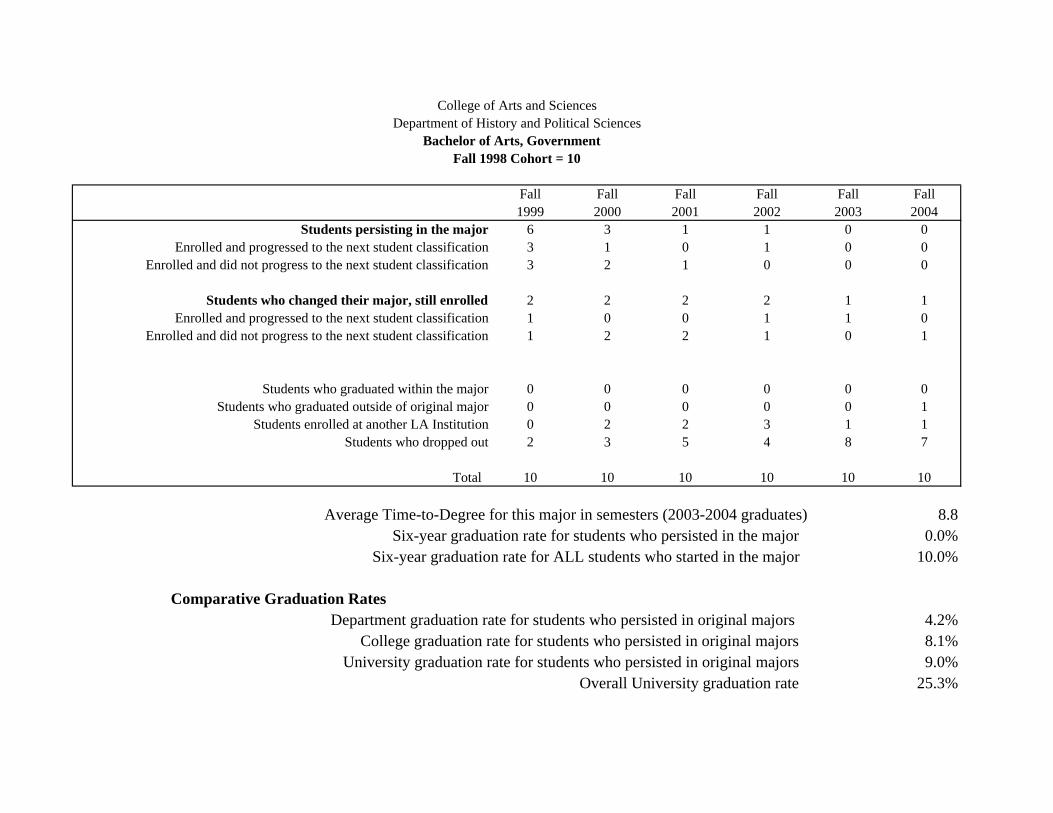
Department of History and Political Sciences Bachelor of Arts, Government
Fall 1998 Cohort = 10
Students persisting in the major Students who changed their major, still enrolled Students who graduated within the major Students who graduated outside of original major Students who transferred Students who dropped out

Fall Fall Fall Fall Fall Fall1999 2000 2001 2002 2003 2004
Students persisting in the major 5 1 1 0 0 0Enrolled and progressed to the next student classification 1 1 1 0 0 0
Enrolled and did not progress to the next student classification 4 0 0 0 0 0
Students who changed their major, still enrolled 9 7 7 6 3 2Enrolled and progressed to the next student classification 3 2 2 4 0 0
Enrolled and did not progress to the next student classification 6 5 5 2 3 2
Students who graduated within the major 0 0 0 1 1 1Students who graduated outside of original major 0 0 0 1 5 5
Students enrolled at another LA Institution 0 2 1 1 0 0Students who dropped out 8 12 13 13 13 14
Total 22 22 22 22 22 22
Average Time-to-Degree for this major in semesters (2003-2004 graduates) 12.3Six-year graduation rate for students who persisted in the major 4.5%
Six-year graduation rate for ALL students who started in the major 27.3%
Comparative Graduation Rates Department graduation rate for students who persisted in original majors 4.2%
College graduation rate for students who persisted in original majors 8.1%University graduation rate for students who persisted in original majors 9.0%
Overall University graduation rate 25.3%
College of Arts and SciencesDepartment of History and Political Sciences
Bachelor of Arts, HistoryFall 1998 Cohort = 22
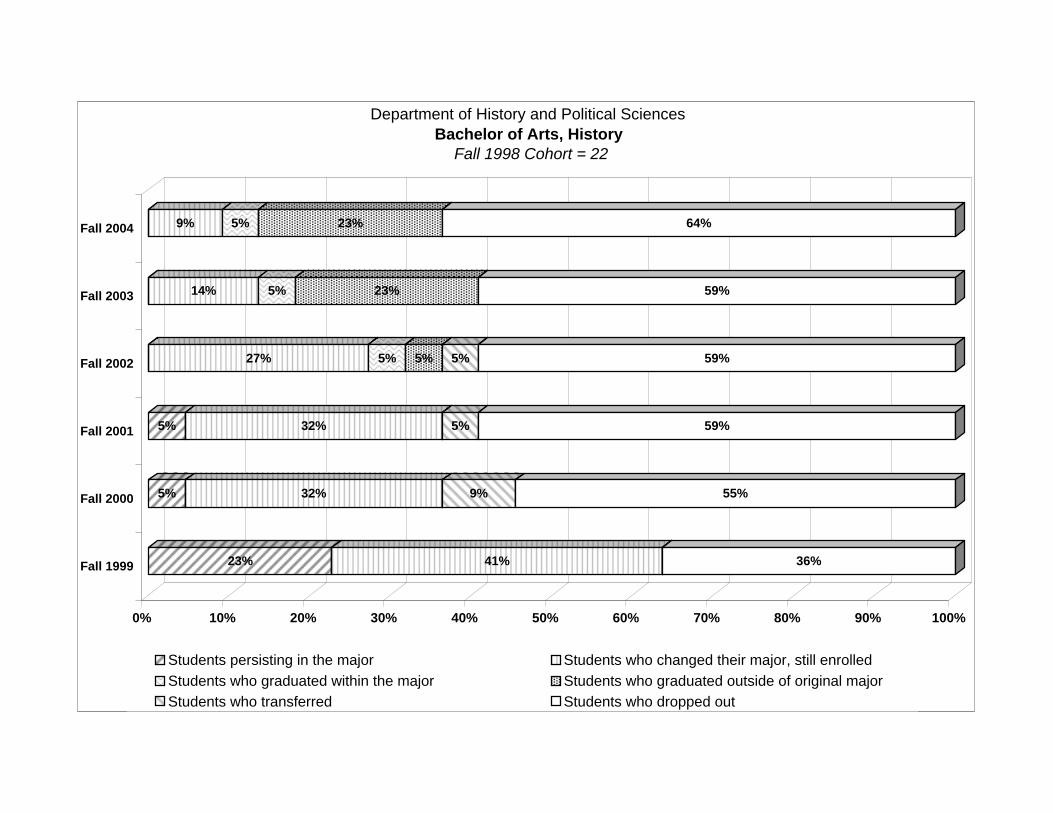
23% 41% 36%
5% 32% 9% 55%
5% 32% 5% 59%
27% 5% 5% 5% 59%
14% 5% 23% 59%
9% 5% 23% 64%
0% 10% 20% 30% 40% 50% 60% 70% 80% 90% 100%
Fall 1999
Fall 2000
Fall 2001
Fall 2002
Fall 2003
Fall 2004
Department of History and Political Sciences Bachelor of Arts, History
Fall 1998 Cohort = 22
Students persisting in the major Students who changed their major, still enrolled Students who graduated within the major Students who graduated outside of original major Students who transferred Students who dropped out

Fall Fall Fall Fall Fall Fall1999 2000 2001 2002 2003 2004
Students persisting in the major 7 5 3 2 2 1Enrolled and progressed to the next student classification 2 2 1 1 2 1
Enrolled and did not progress to the next student classification 5 3 2 1 0 0
Students who changed their major, still enrolled 3 3 5 4 2 2Enrolled and progressed to the next student classification 2 1 3 2 0 1
Enrolled and did not progress to the next student classification 1 2 2 2 2 1
Students who graduated within the major 0 0 0 0 0 1Students who graduated outside of original major 0 0 0 2 4 4
Students enrolled at another LA Institution 1 1 1 1 1 1Students who dropped out 5 7 7 7 7 7
Total 16 16 16 16 16 16
Average Time-to-Degree for this major in semesters (2003-2004 graduates) 9.6Six-year graduation rate for students who persisted in the major 6.3%
Six-year graduation rate for ALL students who started in the major 31.3%
Comparative Graduation Rates Department graduation rate for students who persisted in original majors 4.2%
College graduation rate for students who persisted in original majors 8.1%University graduation rate for students who persisted in original majors 9.0%
Overall University graduation rate 25.3%
College of Arts and SciencesDepartment of History and Political SciencesBachelor of Arts, Social Studies Education
Fall 1998 Cohort = 16
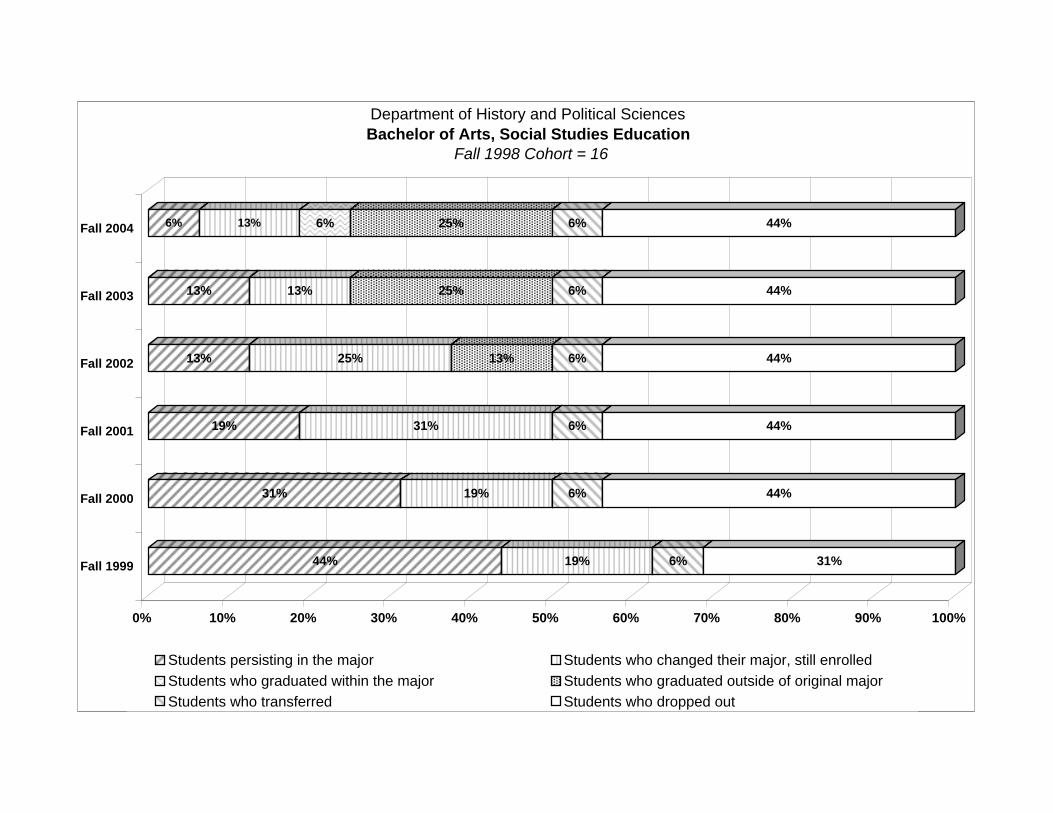
44% 19% 6% 31%
31% 19% 6% 44%
19% 31% 6% 44%
13% 25% 13% 6% 44%
13% 13% 25% 6% 44%
6% 13% 6% 25% 6% 44%
0% 10% 20% 30% 40% 50% 60% 70% 80% 90% 100%
Fall 1999
Fall 2000
Fall 2001
Fall 2002
Fall 2003
Fall 2004
Department of History and Political Sciences Bachelor of Arts, Social Studies Education
Fall 1998 Cohort = 16
Students persisting in the major Students who changed their major, still enrolled Students who graduated within the major Students who graduated outside of original major Students who transferred Students who dropped out
Fall Fall Fall Fall Fall Fall1999 2000 2001 2002 2003 2004
Students persisting in the major 1 1 1 0 0 0Enrolled and progressed to the next student classification 0 1 1 0 0 0
Enrolled and did not progress to the next student classification 1 0 0 0 0 0
Students who changed their major, still enrolled 0 0 0 0 0 0Enrolled and progressed to the next student classification 0 0 0 0 0 0
Enrolled and did not progress to the next student classification 0 0 0 0 0 0
Students who graduated within the major 0 0 0 1 1 1Students who graduated outside of original major 0 0 0 0 0 0
Students enrolled at another LA Institution 1 1 2 1 1 0Students who dropped out 3 3 2 3 3 4
Total 5 5 5 5 5 5
Average Time-to-Degree for this major in semesters (2003-2004 graduates) 9.8Six-year graduation rate for students who persisted in the major 20.0%
Six-year graduation rate for ALL students who started in the major 20.0%
Comparative Graduation Rates Department graduation rate for students who persisted in original majors 9.5%
College graduation rate for students who persisted in original majors 8.1%University graduation rate for students who persisted in original majors 9.0%
Overall University graduation rate 25.3%
College of Arts and SciencesDepartment of Mathematics
Bachelor of Science, MathematicsFall 1998 Cohort = 5
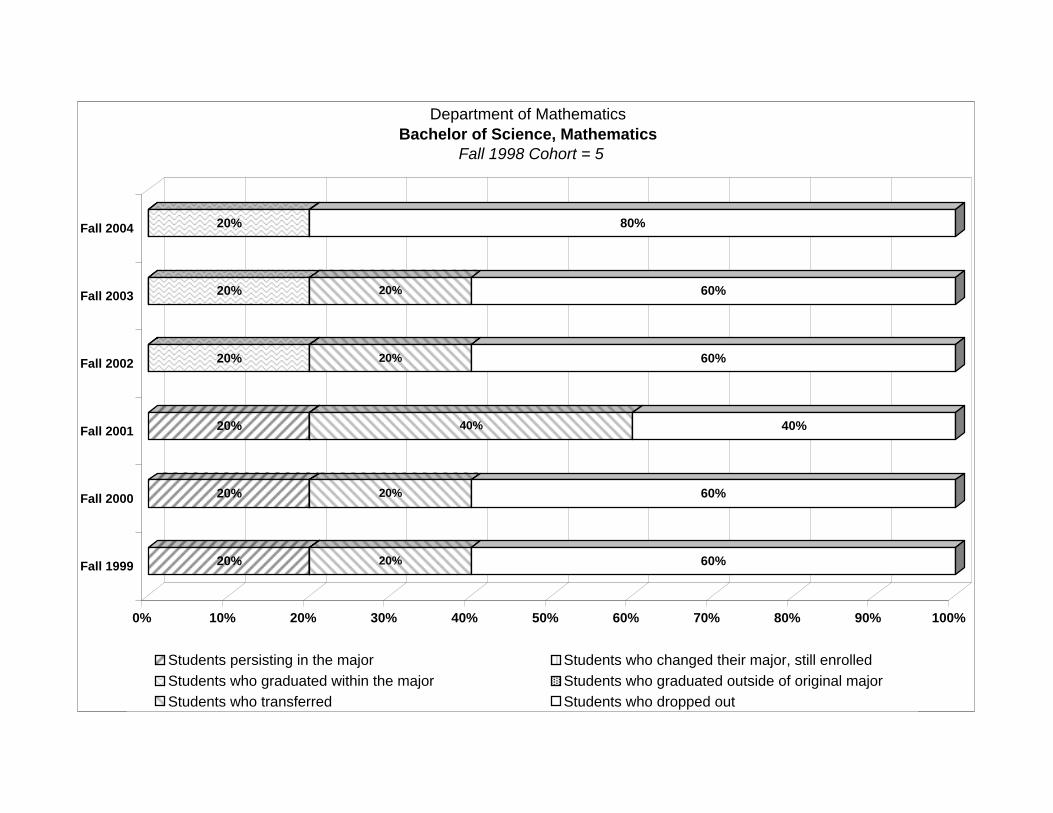
20% 20% 60%
20% 20% 60%
20% 40% 40%
20% 20% 60%
20% 20% 60%
20% 80%
0% 10% 20% 30% 40% 50% 60% 70% 80% 90% 100%
Fall 1999
Fall 2000
Fall 2001
Fall 2002
Fall 2003
Fall 2004
Department of Mathematics Bachelor of Science, Mathematics
Fall 1998 Cohort = 5
Students persisting in the major Students who changed their major, still enrolled Students who graduated within the major Students who graduated outside of original major Students who transferred Students who dropped out

Fall Fall Fall Fall Fall Fall1999 2000 2001 2002 2003 2004
Students persisting in the major 8 3 2 1 0 0Enrolled and progressed to the next student classification 3 2 2 1 0 0
Enrolled and did not progress to the next student classification 5 1 0 0 0 0
Students who changed their major, still enrolled 3 6 7 5 1 2Enrolled and progressed to the next student classification 0 1 2 3 1 1
Enrolled and did not progress to the next student classification 3 5 3 2 0 1
Students who graduated within the major 0 0 0 0 1 1Students who graduated outside of original major 0 0 0 2 5 5
Students enrolled at another LA Institution 0 1 1 1 0 1Students who dropped out 5 6 6 7 9 7
Total 16 16 16 16 16 16
Average Time-to-Degree for this major in semesters (2003-2004 graduates) 11.8Six-year graduation rate for students who persisted in the major 6.3%
Six-year graduation rate for ALL students who started in the major 37.5%
Comparative Graduation Rates Department graduation rate for students who persisted in original majors 9.5%
College graduation rate for students who persisted in original majors 8.1%University graduation rate for students who persisted in original majors 9.0%
Overall University graduation rate 25.3%
College of Arts and SciencesDepartment of Mathematics
Bachelor of Science, Mathematics Education Fall 1998 Cohort = 16

50% 19% 31%
19% 38% 6% 38%
13% 44% 6% 38%
6% 31% 13% 6% 44%
6% 6% 31% 56%
13% 6% 31% 6% 44%
0% 10% 20% 30% 40% 50% 60% 70% 80% 90% 100%
Fall 1999
Fall 2000
Fall 2001
Fall 2002
Fall 2003
Fall 2004
Department of Mathematics Bachelor of Science, Mathematics Education
Fall 1998 Cohort = 16
Students persisting in the major Students who changed their major, still enrolled Students who graduated within the major Students who graduated outside of original major Students who transferred Students who dropped out

Fall Fall Fall Fall Fall Fall1999 2000 2001 2002 2003 2004
Students persisting in the major 7 5 3 3 0 0Enrolled and progressed to the next student classification 2 2 2 2 0 0
Enrolled and did not progress to the next student classification 5 3 1 1 0 0
Students who changed their major, still enrolled 5 1 2 1 1 1Enrolled and progressed to the next student classification 1 1 1 0 0 0
Enrolled and did not progress to the next student classification 4 0 1 1 1 1
Students who graduated within the major 0 0 0 1 3 3Students who graduated outside of original major 0 0 0 0 0 0
Students enrolled at another LA Institution 3 2 2 4 2 2Students who dropped out 8 15 16 14 17 17
Total 23 23 23 23 23 23
Average Time-to-Degree for this major in semesters (2003-2004 graduates) 14.0Six-year graduation rate for students who persisted in the major 13.0%
Six-year graduation rate for ALL students who started in the major 13.0%
Comparative Graduation Rates Department graduation rate for students who persisted in original majors 7.1%
College graduation rate for students who persisted in original majors 8.1%University graduation rate for students who persisted in original majors 9.0%
Overall University graduation rate 25.3%
College of Arts and SciencesDepartment of Music and Dramatic Arts
Bachelor of Music, Music Fall 1998 Cohort = 23
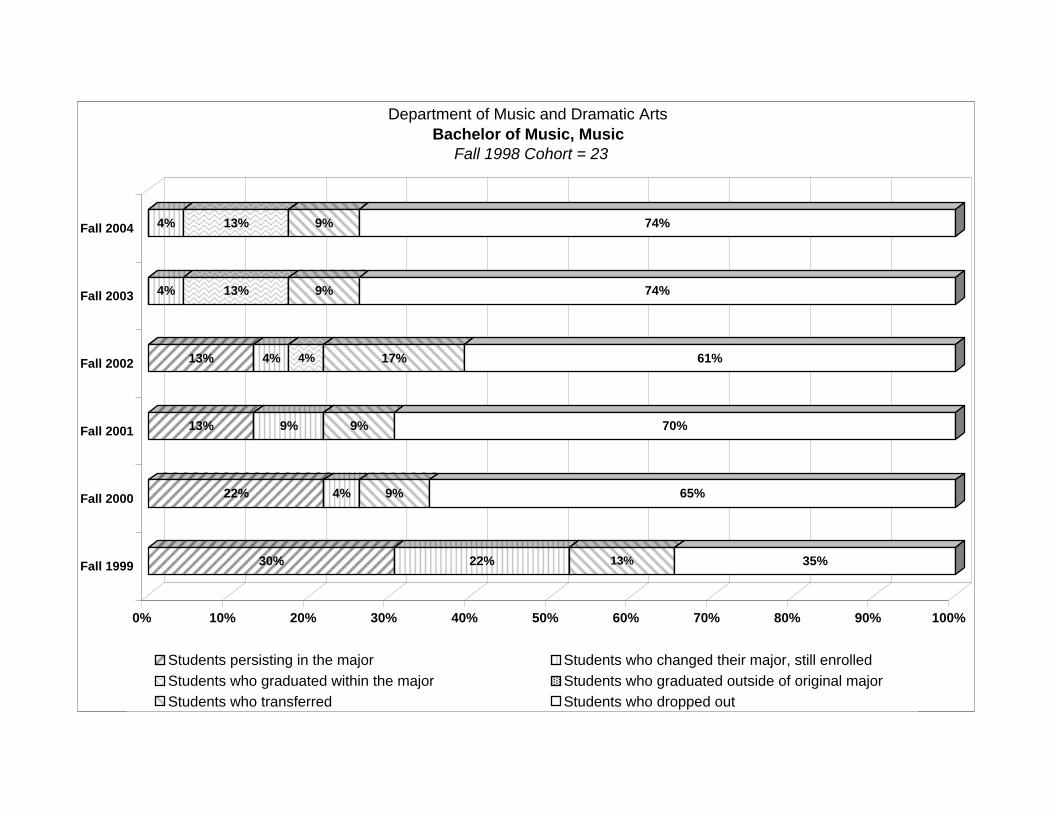
30% 22% 13% 35%
22% 4% 9% 65%
13% 9% 9% 70%
13% 4% 4% 17% 61%
4% 13% 9% 74%
4% 13% 9% 74%
0% 10% 20% 30% 40% 50% 60% 70% 80% 90% 100%
Fall 1999
Fall 2000
Fall 2001
Fall 2002
Fall 2003
Fall 2004
Department of Music and Dramatic Arts Bachelor of Music, Music
Fall 1998 Cohort = 23
Students persisting in the major Students who changed their major, still enrolled Students who graduated within the major Students who graduated outside of original major Students who transferred Students who dropped out

Fall Fall Fall Fall Fall Fall1999 2000 2001 2002 2003 2004
Students persisting in the major 10 6 4 3 2 1Enrolled and progressed to the next student classification 4 3 1 2 1 1
Enrolled and did not progress to the next student classification 6 3 3 1 1 0
Students who changed their major, still enrolled 2 5 5 5 3 1Enrolled and progressed to the next student classification 1 2 2 3 2 1
Enrolled and did not progress to the next student classification 1 3 3 2 1 0
Students who graduated within the major 0 0 0 0 0 0Students who graduated outside of original major 0 0 0 0 1 2
Students enrolled at another LA Institution 1 1 1 1 1 1Students who dropped out 6 7 9 10 12 14
Total 19 19 19 19 19 19
Average Time-to-Degree for this major in semesters (2003-2004 graduates) 11.8Six-year graduation rate for students who persisted in the major 0.0%
Six-year graduation rate for ALL students who started in the major 10.5%
Comparative Graduation Rates Department graduation rate for students who persisted in original majors 7.1%
College graduation rate for students who persisted in original majors 8.1%University graduation rate for students who persisted in original majors 9.0%
Overall University graduation rate 25.3%
College of Arts and SciencesDepartment of Music and Dramatic Arts
Bachelor of Music Education, Music EducationFall 1998 Cohort = 19

53% 11% 5% 32%
32% 26% 5% 37%
21% 26% 5% 47%
16% 26% 5% 53%
11% 16% 5% 5% 63%
5% 5% 11% 5% 74%
0% 10% 20% 30% 40% 50% 60% 70% 80% 90% 100%
Fall 1999
Fall 2000
Fall 2001
Fall 2002
Fall 2003
Fall 2004
Department of Music and Dramatic ArtsBachelor of Music Education, Music Education
Fall 1998 Cohort = 19
Students persisting in the major Students who changed their major, still enrolled Students who graduated within the major Students who graduated outside of original major Students who transferred Students who dropped out

Fall Fall Fall Fall Fall Fall1999 2000 2001 2002 2003 2004
Students persisting in the major 43 27 20 8 3 4Enrolled and progressed to the next student classification 12 10 5 6 2 4
Enrolled and did not progress to the next student classification 31 17 15 2 1 0
Students who changed their major, still enrolled 16 17 22 21 11 6Enrolled and progressed to the next student classification 6 7 6 10 8 3
Enrolled and did not progress to the next student classification 10 10 16 11 3 3
Students who graduated within the major 0 0 0 6 10 10Students who graduated outside of original major 0 0 0 4 11 14
Students enrolled at another LA Institution 8 16 12 11 9 8Students who dropped out 27 34 40 44 50 52
Total 94 94 94 94 94 94
Average Time-to-Degree for this major in semesters (2003-2004 graduates) 11.0Six-year graduation rate for students who persisted in the major 10.6%
Six-year graduation rate for ALL students who started in the major 25.5%
Comparative Graduation Rates Department graduation rate for students who persisted in original majors 10.6%
College graduation rate for students who persisted in original majors 8.1%University graduation rate for students who persisted in original majors 9.0%
Overall University graduation rate 25.3%
College of Arts and SciencesDepartment of Psychology
Bachelor of Arts, Psychology Fall 1998 Cohort = 94
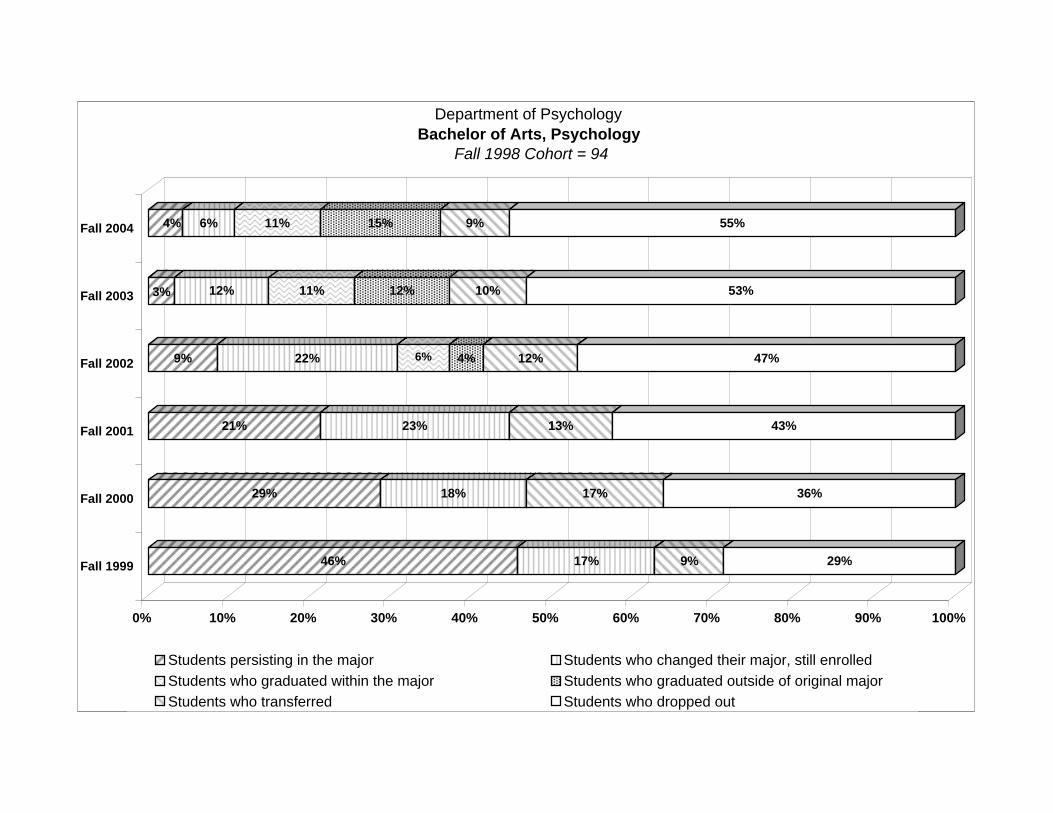
46% 17% 9% 29%
29% 18% 17% 36%
21% 23% 13% 43%
9% 22% 6% 4% 12% 47%
3% 12% 11% 12% 10% 53%
4% 6% 11% 15% 9% 55%
0% 10% 20% 30% 40% 50% 60% 70% 80% 90% 100%
Fall 1999
Fall 2000
Fall 2001
Fall 2002
Fall 2003
Fall 2004
Department of Psychology Bachelor of Arts, Psychology
Fall 1998 Cohort = 94
Students persisting in the major Students who changed their major, still enrolled Students who graduated within the major Students who graduated outside of original major Students who transferred Students who dropped out

Fall Fall Fall Fall Fall Fall1999 2000 2001 2002 2003 2004
Students persisting in the major 6 0 0 0 0 0Enrolled and progressed to the next student classification 6 0 0 0 0 0
Enrolled and did not progress to the next student classification 0 0 0 0 0 0
Students who changed their major, still enrolled 2 5 5 4 3 3Enrolled and progressed to the next student classification 2 0 0 2 3 2
Enrolled and did not progress to the next student classification 0 5 5 2 0 1
Students who graduated within the major 0 0 0 0 0 0Students who graduated outside of original major 0 0 0 0 0 0
Students enrolled at another LA Institution 1 1 0 0 0 0Students who dropped out 7 10 11 12 13 13
Total 16 16 16 16 16 16
Average Time-to-Degree for this major in semesters (2003-2004 graduates) 7.5Six-year graduation rate for students who persisted in the major 0.0%
Six-year graduation rate for ALL students who started in the major 0.0%
Comparative Graduation Rates Department graduation rate for students who persisted in original majors 8.1%
College graduation rate for students who persisted in original majors 8.1%University graduation rate for students who persisted in original majors 9.0%
Overall University graduation rate 25.3%
College of Arts and SciencesDepartment of Sociology and Criminal Justice
Associate of Arts, Criminal Justice Fall 1998 Cohort = 16
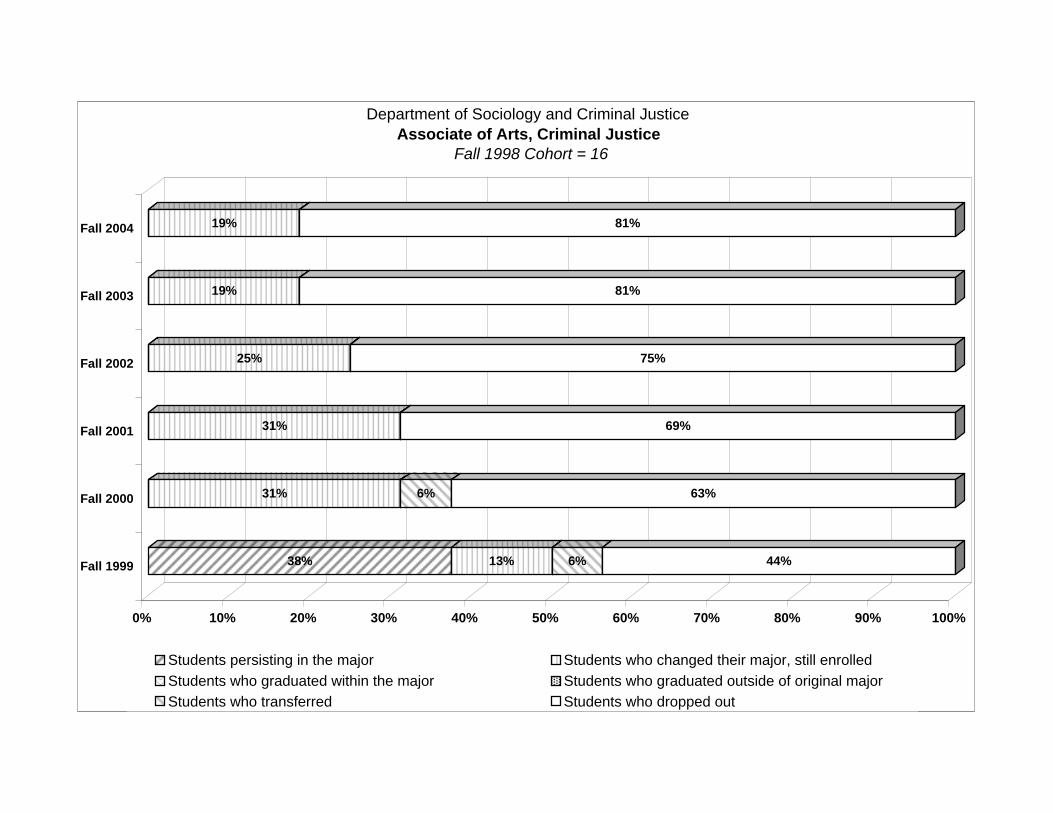
38% 13% 6% 44%
31% 6% 63%
31% 69%
25% 75%
19% 81%
19% 81%
0% 10% 20% 30% 40% 50% 60% 70% 80% 90% 100%
Fall 1999
Fall 2000
Fall 2001
Fall 2002
Fall 2003
Fall 2004
Department of Sociology and Criminal Justice Associate of Arts, Criminal Justice
Fall 1998 Cohort = 16
Students persisting in the major Students who changed their major, still enrolled Students who graduated within the major Students who graduated outside of original major Students who transferred Students who dropped out

Fall Fall Fall Fall Fall Fall1999 2000 2001 2002 2003 2004
Students persisting in the major 41 26 15 6 5 2Enrolled and progressed to the next student classification 7 3 4 2 2 1
Enrolled and did not progress to the next student classification 34 23 11 4 3 1
Students who changed their major, still enrolled 9 13 17 20 8 5Enrolled and progressed to the next student classification 3 3 3 13 3 2
Enrolled and did not progress to the next student classification 6 10 14 7 5 3
Students who graduated within the major 0 0 0 4 6 7Students who graduated outside of original major 0 0 1 2 10 13
Students enrolled at another LA Institution 5 3 2 3 2 2Students who dropped out 27 40 47 47 51 53
Total 82 82 82 82 82 82
Average Time-to-Degree for this major in semesters (2003-2004 graduates) 12.6Six-year graduation rate for students who persisted in the major 8.5%
Six-year graduation rate for ALL students who started in the major 24.4%
Comparative Graduation Rates Department graduation rate for students who persisted in original majors 8.1%
College graduation rate for students who persisted in original majors 8.1%University graduation rate for students who persisted in original majors 9.0%
Overall University graduation rate 25.3%
College of Arts and SciencesDepartment of Sociology and Criminal Justice
Bachelor of Arts, Criminal Justice Fall 1998 Cohort = 82
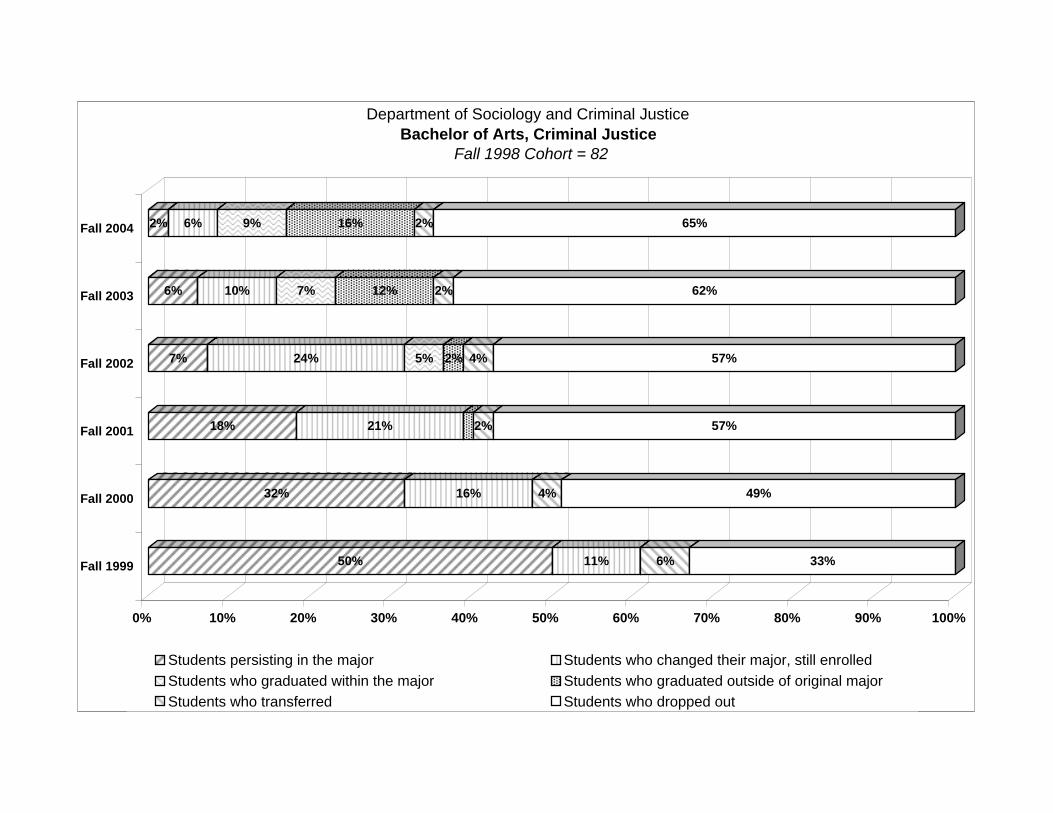
50% 11% 6% 33%
32% 16% 4% 49%
18% 21% 2% 57%
7% 24% 5% 2% 4% 57%
6% 10% 7% 12% 2% 62%
2% 6% 9% 16% 2% 65%
0% 10% 20% 30% 40% 50% 60% 70% 80% 90% 100%
Fall 1999
Fall 2000
Fall 2001
Fall 2002
Fall 2003
Fall 2004
Department of Sociology and Criminal Justice Bachelor of Arts, Criminal Justice
Fall 1998 Cohort = 82
Students persisting in the major Students who changed their major, still enrolled Students who graduated within the major Students who graduated outside of original major Students who transferred Students who dropped out

Fall Fall Fall Fall Fall Fall1999 2000 2001 2002 2003 2004
Students persisting in the major 6 1 3 2 0 0Enrolled and progressed to the next student classification 1 1 0 1 0 0
Enrolled and did not progress to the next student classification 5 0 3 1 0 0
Students who changed their major, still enrolled 4 5 4 1 0 1Enrolled and progressed to the next student classification 2 1 2 0 0 0
Enrolled and did not progress to the next student classification 2 4 2 1 0 1
Students who graduated within the major 0 0 0 0 2 2Students who graduated outside of original major 0 0 0 2 2 2
Students enrolled at another LA Institution 2 2 2 1 1 0Students who dropped out 1 5 4 7 8 8
Total 13 13 13 13 13 13
Average Time-to-Degree for this major in semesters (2003-2004 graduates) 14.5Six-year graduation rate for students who persisted in the major 15.4%
Six-year graduation rate for ALL students who started in the major 30.8%
Comparative Graduation Rates Department graduation rate for students who persisted in original majors 8.1%
College graduation rate for students who persisted in original majors 8.1%University graduation rate for students who persisted in original majors 9.0%
Overall University graduation rate 25.3%
College of Arts and SciencesDepartment of Sociology and Criminal Justice
Bachelor of Arts, Sociology Fall 1998 Cohort = 13
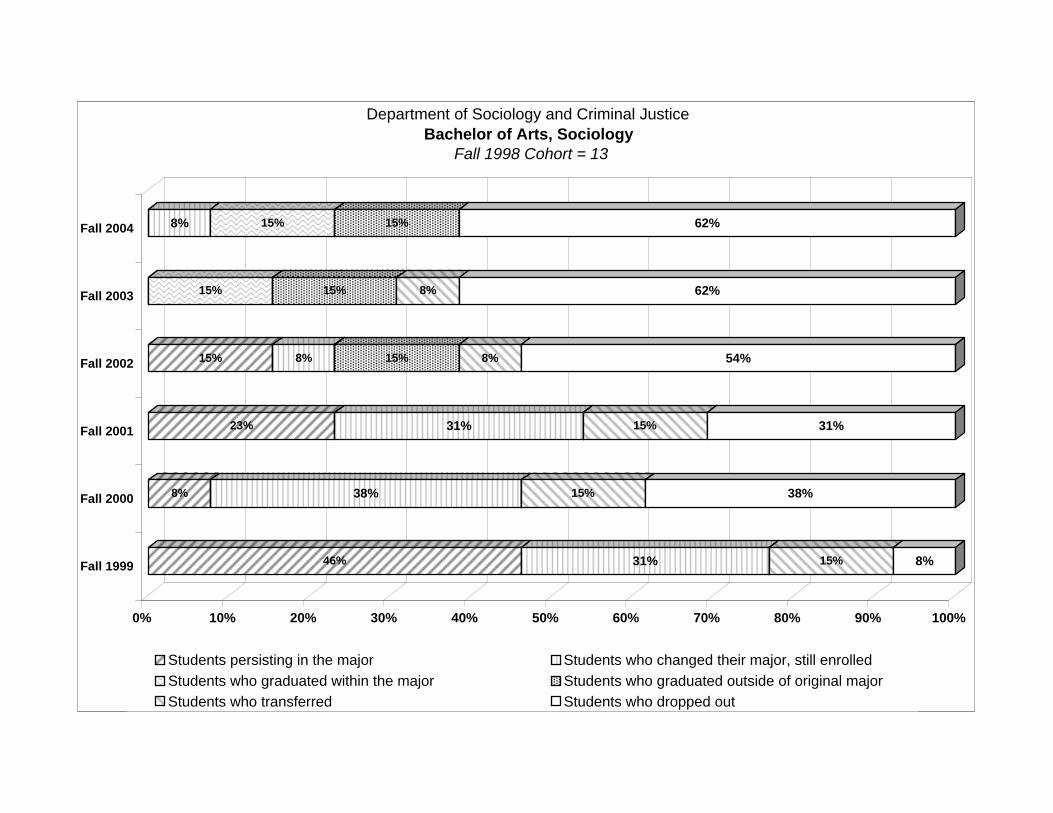
46% 31% 15% 8%
8% 38% 15% 38%
23% 31% 15% 31%
15% 8% 15% 8% 54%
15% 15% 8% 62%
8% 15% 15% 62%
0% 10% 20% 30% 40% 50% 60% 70% 80% 90% 100%
Fall 1999
Fall 2000
Fall 2001
Fall 2002
Fall 2003
Fall 2004
Department of Sociology and Criminal Justice Bachelor of Arts, Sociology
Fall 1998 Cohort = 13
Students persisting in the major Students who changed their major, still enrolled Students who graduated within the major Students who graduated outside of original major Students who transferred Students who dropped out

Fall Fall Fall Fall Fall Fall1999 2000 2001 2002 2003 2004
Students persisting in the major 15 10 5 5 4 3Enrolled and progressed to the next student classification 2 2 1 2 2 2
Enrolled and did not progress to the next student classification 13 8 4 3 2 1
Students who changed their major, still enrolled 4 5 6 5 5 5Enrolled and progressed to the next student classification 0 1 1 3 5 4
Enrolled and did not progress to the next student classification 4 4 5 2 0 1
Students who graduated within the major 0 0 0 0 1 2Students who graduated outside of original major 0 0 0 1 1 3
Students enrolled at another LA Institution 1 1 1 0 1 1Students who dropped out 10 14 18 19 18 16
Total 30 30 30 30 30 30
Average Time-to-Degree for this major in semesters (2003-2004 graduates) 13.6Six-year graduation rate for students who persisted in the major 6.7%
Six-year graduation rate for ALL students who started in the major 16.7%
Comparative Graduation Rates Department graduation rate for students who persisted in original majors 10.3%
College graduation rate for students who persisted in original majors 8.1%University graduation rate for students who persisted in original majors 9.0%
Overall University graduation rate 25.3%
College of Arts and SciencesDepartment of Visual Arts
Bachelor of Arts, Art Fall 1998 Cohort = 30
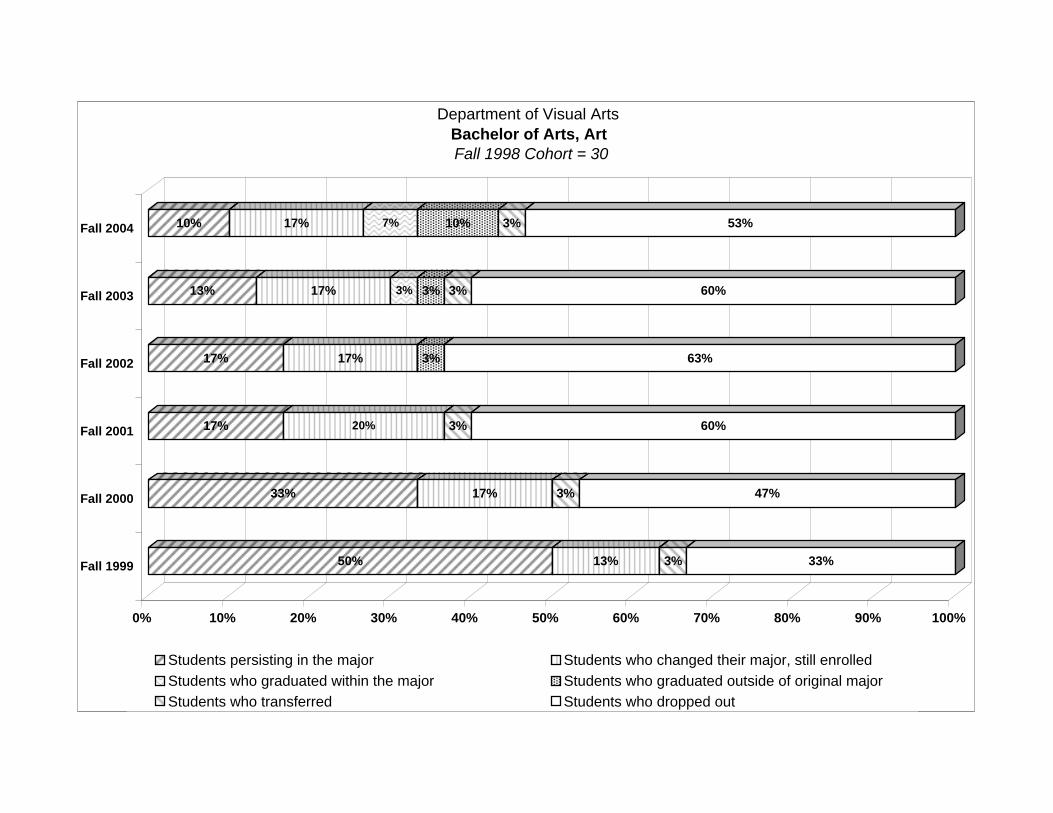
50% 13% 3% 33%
33% 17% 3% 47%
17% 20% 3% 60%
17% 17% 3% 63%
13% 17% 3% 3% 3% 60%
10% 17% 7% 10% 3% 53%
0% 10% 20% 30% 40% 50% 60% 70% 80% 90% 100%
Fall 1999
Fall 2000
Fall 2001
Fall 2002
Fall 2003
Fall 2004
Department of Visual Arts Bachelor of Arts, Art
Fall 1998 Cohort = 30
Students persisting in the major Students who changed their major, still enrolled Students who graduated within the major Students who graduated outside of original major Students who transferred Students who dropped out

Fall Fall Fall Fall Fall Fall1999 2000 2001 2002 2003 2004
Students persisting in the major 3 1 1 0 0 0Enrolled and progressed to the next student classification 0 1 1 0 0 0
Enrolled and did not progress to the next student classification 3 0 0 0 0 0
Students who changed their major, still enrolled 1 0 0 0 0 0Enrolled and progressed to the next student classification 1 0 0 0 0 0
Enrolled and did not progress to the next student classification 0 0 0 0 0 0
Students who graduated within the major 0 0 0 1 1 1Students who graduated outside of original major 0 0 0 0 0 0
Students enrolled at another LA Institution 1 1 1 1 1 1Students who dropped out 0 3 3 3 3 3
Total 5 5 5 5 5 5
Average Time-to-Degree for this major in semesters (2003-2004 graduates) 25.0Six-year graduation rate for students who persisted in the major 20.0%
Six-year graduation rate for ALL students who started in the major 20.0%
Comparative Graduation Rates Department graduation rate for students who persisted in original majors 10.3%
College graduation rate for students who persisted in original majors 8.1%University graduation rate for students who persisted in original majors 9.0%
Overall University graduation rate 25.3%
College of Arts and SciencesDepartment of Visual Arts
Bachelor of Arts, Art EducationFall 1998 Cohort = 20
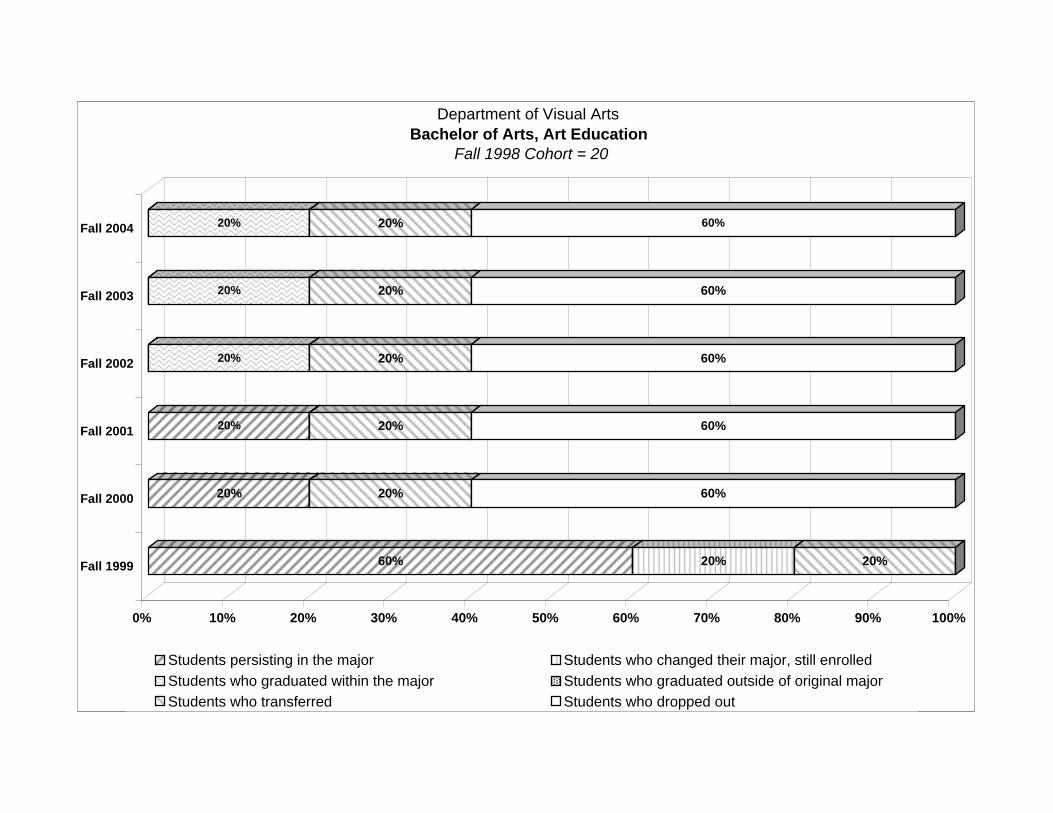
60% 20% 20%
20% 20% 60%
20% 20% 60%
20% 20% 60%
20% 20% 60%
20% 20% 60%
0% 10% 20% 30% 40% 50% 60% 70% 80% 90% 100%
Fall 1999
Fall 2000
Fall 2001
Fall 2002
Fall 2003
Fall 2004
Department of Visual Arts Bachelor of Arts, Art Education
Fall 1998 Cohort = 20
Students persisting in the major Students who changed their major, still enrolled Students who graduated within the major Students who graduated outside of original major Students who transferred Students who dropped out

Fall Fall Fall Fall Fall Fall1999 2000 2001 2002 2003 2004
Students persisting in the major 2 2 1 0 0 0Enrolled and progressed to the next student classification 1 0 1 0 0 0
Enrolled and did not progress to the next student classification 1 2 0 0 0 0
Students who changed their major, still enrolled 2 2 3 1 1 1Enrolled and progressed to the next student classification 0 0 0 1 1 0
Enrolled and did not progress to the next student classification 2 2 3 0 0 1
Students who graduated within the major 0 0 0 1 1 1Students who graduated outside of original major 0 0 0 0 1 2
Students enrolled at another LA Institution 0 0 0 0 0 0Students who dropped out 0 0 0 2 1 0
Total 4 4 4 4 4 4
Average Time-to-Degree for this major in semesters (2003-2004 graduates) 14.0Six-year graduation rate for students who persisted in the major 25.0%
Six-year graduation rate for ALL students who started in the major 75.0%
Comparative Graduation Rates Department graduation rate for students who persisted in original majors 10.3%
College graduation rate for students who persisted in original majors 8.1%University graduation rate for students who persisted in original majors 9.0%
Overall University graduation rate 25.3%
College of Arts and SciencesDepartment of Visual Arts
Bachelor of Arts, Cultural Resources ManagementFall 1998 Cohort = 4

50% 50%
50% 50%
25% 75%
25% 25% 50%
25% 25% 25% 25%
25% 25% 50%
0% 10% 20% 30% 40% 50% 60% 70% 80% 90% 100%
Fall 1999
Fall 2000
Fall 2001
Fall 2002
Fall 2003
Fall 2004
Department of Visual Arts Bachelor of Arts, Cultural Resources Management
Fall 1998 Cohort = 4
Students persisting in the major Students who changed their major, still enrolled Students who graduated within the major Students who graduated outside of original major Students who transferred Students who dropped out

Fall Fall Fall Fall Fall Fall1999 2000 2001 2002 2003 2004
Students persisting in the major 39 30 21 14 7 4Enrolled and progressed to the next student classification 14 13 8 9 4 2
Enrolled and did not progress to the next student classification 25 17 13 5 3 2
Students who changed their major, still enrolled 15 20 18 16 9 6Enrolled and progressed to the next student classification 9 7 10 9 6 4
Enrolled and did not progress to the next student classification 6 13 8 7 3 2
Students who graduated within the major 0 0 0 7 11 14Students who graduated outside of original major 0 0 0 10 17 22
Students enrolled at another LA Institution 1 6 9 4 3 3Students who dropped out 28 27 35 32 36 34
Total 83 83 83 83 83 83
Average Time-to-Degree for this major in semesters (2003-2004 graduates) 12.9Six-year graduation rate for students who persisted in the major 16.9%
Six-year graduation rate for ALL students who started in the major 43.4%
Comparative Graduation Rates Department graduation rate for students who persisted in original majors 16.9%
College graduation rate for students who persisted in original majors 12.7%University graduation rate for students who persisted in original majors 9.0%
Overall University graduation rate 25.3%
College of Business and TechnologyDepartment of Accounting
Bachelor of Science, Accounting Fall 1998 Cohort = 83
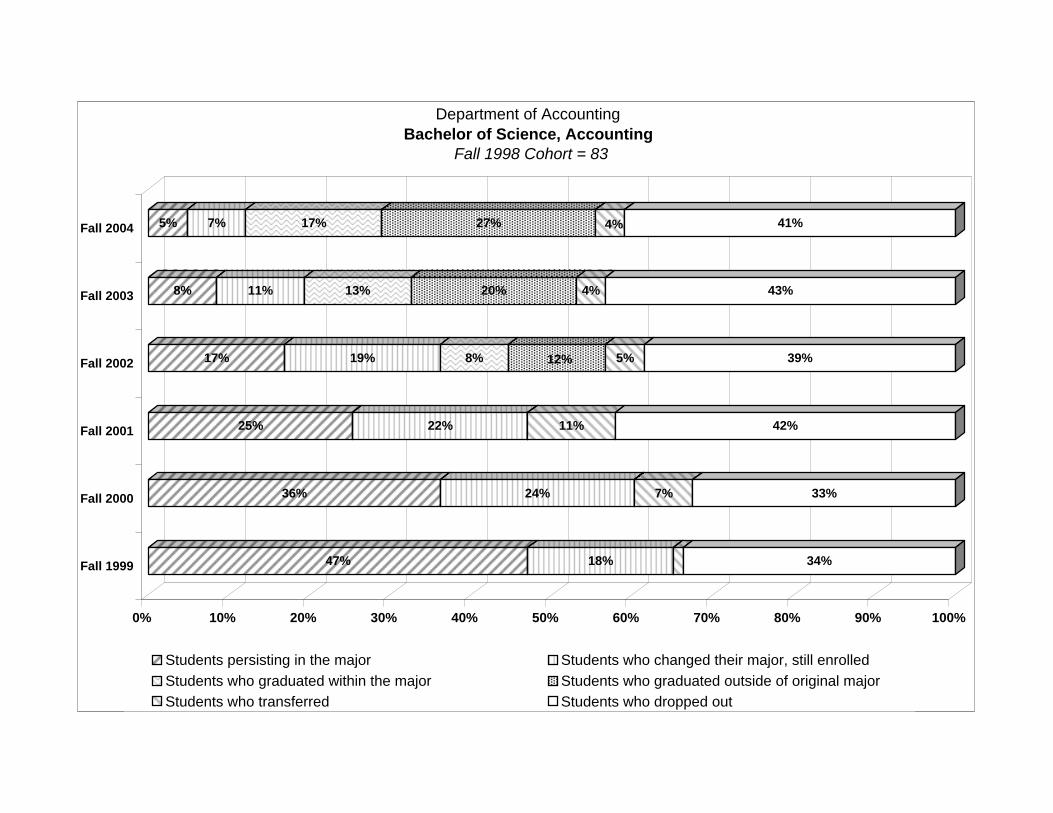
47% 18% 34%
36% 24% 7% 33%
25% 22% 11% 42%
17% 19% 8% 12% 5% 39%
8% 11% 13% 20% 4% 43%
5% 7% 17% 27% 4% 41%
0% 10% 20% 30% 40% 50% 60% 70% 80% 90% 100%
Fall 1999
Fall 2000
Fall 2001
Fall 2002
Fall 2003
Fall 2004
Department of Accounting Bachelor of Science, Accounting
Fall 1998 Cohort = 83
Students persisting in the major Students who changed their major, still enrolled Students who graduated within the major Students who graduated outside of original major Students who transferred Students who dropped out

Fall Fall Fall Fall Fall Fall1999 2000 2001 2002 2003 2004
Students persisting in the major 62 34 18 5 1 2Enrolled and progressed to the next student classification 12 4 2 3 0 1
Enrolled and did not progress to the next student classification 50 30 16 2 1 1
Students who changed their major, still enrolled 18 24 26 28 16 12Enrolled and progressed to the next student classification 6 8 9 18 9 9
Enrolled and did not progress to the next student classification 12 16 17 10 7 3
Students who graduated within the major 0 0 0 2 3 3Students who graduated outside of original major 0 0 1 4 19 23
Students enrolled at another LA Institution 4 3 7 6 6 7Students who dropped out 35 58 67 74 74 72
Total 119 119 119 119 119 119
Average Time-to-Degree for this major in semesters (2003-2004 graduates) 13.0Six-year graduation rate for students who persisted in the major 2.5%
Six-year graduation rate for ALL students who started in the major 21.8%
Comparative Graduation Rates Department graduation rate for students who persisted in original majors 2.5%
College graduation rate for students who persisted in original majors 12.7%University graduation rate for students who persisted in original majors 9.0%
Overall University graduation rate 25.3%
College of Business and TechnologyDepartment of Computer Science
Bachelor of Science, Computer ScienceFall 1998 Cohort = 119
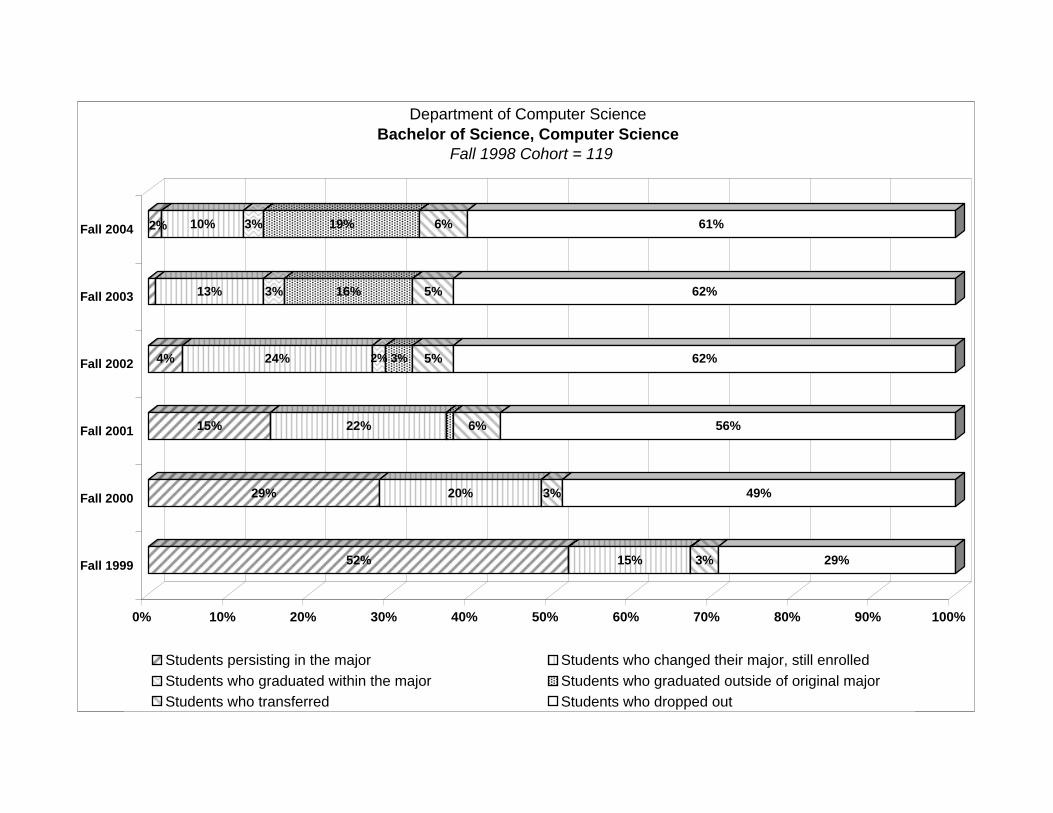
52% 15% 3% 29%
29% 20% 3% 49%
15% 22% 6% 56%
4% 24% 2% 3% 5% 62%
13% 3% 16% 5% 62%
2% 10% 3% 19% 6% 61%
0% 10% 20% 30% 40% 50% 60% 70% 80% 90% 100%
Fall 1999
Fall 2000
Fall 2001
Fall 2002
Fall 2003
Fall 2004
Department of Computer Science Bachelor of Science, Computer Science
Fall 1998 Cohort = 119
Students persisting in the major Students who changed their major, still enrolled Students who graduated within the major Students who graduated outside of original major Students who transferred Students who dropped out

Fall Fall Fall Fall Fall Fall1999 2000 2001 2002 2003 2004
Students persisting in the major 1 0 0 0 0 0Enrolled and progressed to the next student classification 0 0 0 0 0 0
Enrolled and did not progress to the next student classification 1 0 0 0 0 0
Students who changed their major, still enrolled 0 0 0 0 0 0Enrolled and progressed to the next student classification 0 0 0 0 0 0
Enrolled and did not progress to the next student classification 0 0 0 0 0 0
Students who graduated within the major 0 0 0 0 0 0Students who graduated outside of original major 0 0 0 0 0 0
Students enrolled at another LA Institution 0 0 0 0 0 0Students who dropped out 0 1 1 1 1 1
Total 1 1 1 1 1 1
Average Time-to-Degree for this major in semesters (2003-2004 graduates) NASix-year graduation rate for students who persisted in the major 0.0%
Six-year graduation rate for ALL students who started in the major 0.0%
Comparative Graduation Rates Department graduation rate for students who persisted in original majors 11.5%
College graduation rate for students who persisted in original majors 12.7%University graduation rate for students who persisted in original majors 9.0%
Overall University graduation rate 25.3%
College of Business and TechnologyDepartment of General Business
Bachelor of Arts, Business EducationFall 1998 Cohort = 1
100%
100%
100%
100%
100%
100%
0% 10% 20% 30% 40% 50% 60% 70% 80% 90% 100%
Fall 1999
Fall 2000
Fall 2001
Fall 2002
Fall 2003
Fall 2004
Department of General Business Bachelor of Arts, Business Education
Fall 1998 Cohort = 1
Students persisting in the major Students who changed their major, still enrolled Students who graduated within the major Students who graduated outside of original major Students who transferred Students who dropped out

Fall Fall Fall Fall Fall Fall1999 2000 2001 2002 2003 2004
Students persisting in the major 57 32 23 17 5 3Enrolled and progressed to the next student classification 12 5 4 11 3 1
Enrolled and did not progress to the next student classification 45 27 19 6 2 2
Students who changed their major, still enrolled 14 17 21 21 12 5Enrolled and progressed to the next student classification 5 6 5 11 9 2
Enrolled and did not progress to the next student classification 9 11 16 10 3 3
Students who graduated within the major 0 0 0 2 10 12Students who graduated outside of original major 0 0 1 4 13 18
Students enrolled at another LA Institution 7 16 11 8 8 10Students who dropped out 20 33 42 46 50 50
Total 98 98 98 98 98 98
Average Time-to-Degree for this major in semesters (2003-2004 graduates) 10.8Six-year graduation rate for students who persisted in the major 12.2%
Six-year graduation rate for ALL students who started in the major 30.6%
Comparative Graduation Rates Department graduation rate for students who persisted in original majors 11.5%
College graduation rate for students who persisted in original majors 12.7%University graduation rate for students who persisted in original majors 9.0%
Overall University graduation rate 25.3%
College of Business and TechnologyDepartment of General Business
Bachelor of Arts, General BusinessFall 1998 Cohort = 98
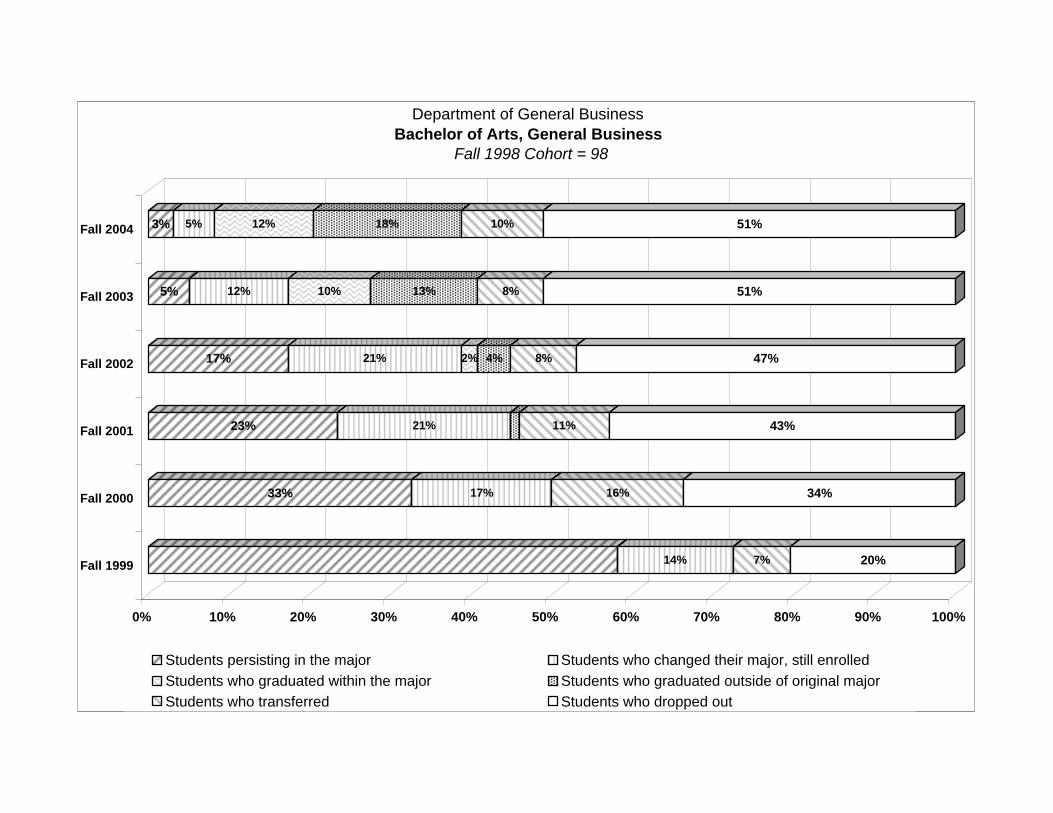
14% 7% 20%
33% 17% 16% 34%
23% 21% 11% 43%
17% 21% 2% 4% 8% 47%
5% 12% 10% 13% 8% 51%
3% 5% 12% 18% 10% 51%
0% 10% 20% 30% 40% 50% 60% 70% 80% 90% 100%
Fall 1999
Fall 2000
Fall 2001
Fall 2002
Fall 2003
Fall 2004
Department of General Business Bachelor of Arts, General Business
Fall 1998 Cohort = 98
Students persisting in the major Students who changed their major, still enrolled Students who graduated within the major Students who graduated outside of original major Students who transferred Students who dropped out

Fall Fall Fall Fall Fall Fall1999 2000 2001 2002 2003 2004
Students persisting in the major 1 0 0 0 1 0Enrolled and progressed to the next student classification 0 0 0 0 1 0
Enrolled and did not progress to the next student classification 1 0 0 0 0 0
Students who changed their major, still enrolled 1 2 2 2 1 1Enrolled and progressed to the next student classification 1 0 0 2 1 1
Enrolled and did not progress to the next student classification 0 2 2 0 0 0
Students who graduated within the major 0 0 0 0 0 0Students who graduated outside of original major 0 0 0 0 0 0
Students enrolled at another LA Institution 0 0 0 0 0 0Students who dropped out 1 1 1 1 1 2
Total 3 3 3 3 3 3
Average Time-to-Degree for this major in semesters (2003-2004 graduates) NASix-year graduation rate for students who persisted in the major 0.0%
Six-year graduation rate for ALL students who started in the major 0.0%
Comparative Graduation Rates Department graduation rate for students who persisted in original majors 11.5%
College graduation rate for students who persisted in original majors 12.7%University graduation rate for students who persisted in original majors 9.0%
Overall University graduation rate 25.3%
College of Business and TechnologyDepartment of General Business
Bachelor of Arts, Office AdministrationFall 1998 Cohort = 3
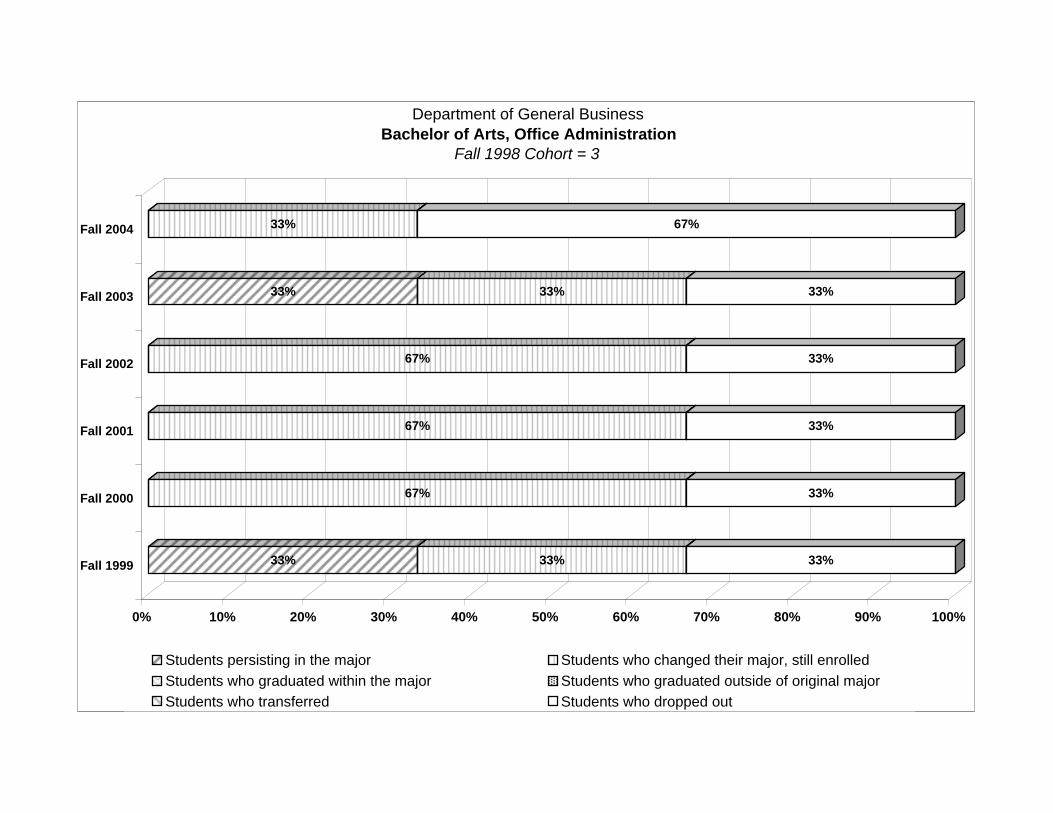
33% 33% 33%
67% 33%
67% 33%
67% 33%
33% 33% 33%
33% 67%
0% 10% 20% 30% 40% 50% 60% 70% 80% 90% 100%
Fall 1999
Fall 2000
Fall 2001
Fall 2002
Fall 2003
Fall 2004
Department of General Business Bachelor of Arts, Office Administration
Fall 1998 Cohort = 3
Students persisting in the major Students who changed their major, still enrolled Students who graduated within the major Students who graduated outside of original major Students who transferred Students who dropped out

Fall Fall Fall Fall Fall Fall1999 2000 2001 2002 2003 2004
Students persisting in the major 1 0 0 0 0 0Enrolled and progressed to the next student classification 0 0 0 0 0 0
Enrolled and did not progress to the next student classification 1 0 0 0 0 0
Students who changed their major, still enrolled 0 1 1 0 0 0Enrolled and progressed to the next student classification 0 0 0 0 0 0
Enrolled and did not progress to the next student classification 0 1 1 0 0 0
Students who graduated within the major 0 0 0 0 0 0Students who graduated outside of original major 0 0 0 0 0 0
Students enrolled at another LA Institution 0 0 0 0 0 0Students who dropped out 1 1 1 2 2 2
Total 2 2 2 2 2 2
Average Time-to-Degree for this major in semesters (2003-2004 graduates) 12.8Six-year graduation rate for students who persisted in the major 0.0%
Six-year graduation rate for ALL students who started in the major 0.0%
Comparative Graduation Rates Department graduation rate for students who persisted in original majors 11.5%
College graduation rate for students who persisted in original majors 12.7%University graduation rate for students who persisted in original majors 9.0%
Overall University graduation rate 25.3%
College of Business and TechnologyDepartment of General Business
Associate of Arts, Office AdministrationFall 1998 Cohort = 2

50% 50%
50% 50%
50% 50%
100%
100%
100%
0% 10% 20% 30% 40% 50% 60% 70% 80% 90% 100%
Fall 1999
Fall 2000
Fall 2001
Fall 2002
Fall 2003
Fall 2004
Department of General Business Associate of Arts, Office Administration
Fall 1998 Cohort = 2
Students persisting in the major Students who changed their major, still enrolled Students who graduated within the major Students who graduated outside of original major Students who transferred Students who dropped out
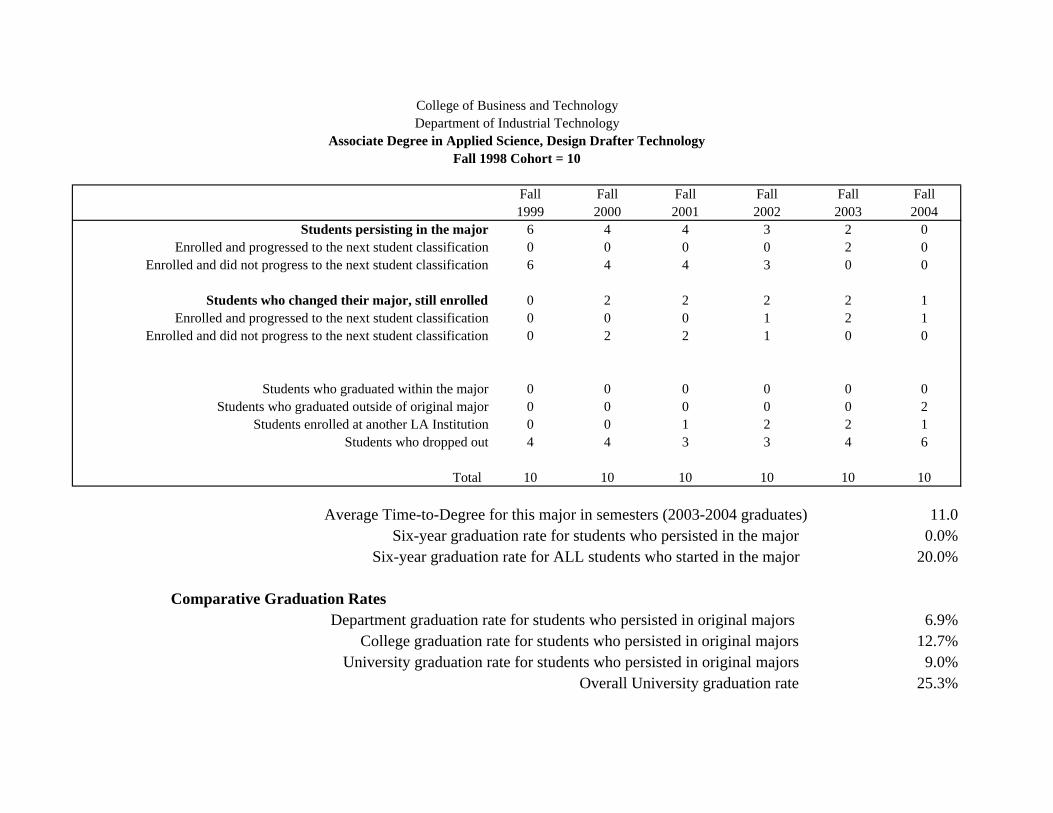
Fall Fall Fall Fall Fall Fall1999 2000 2001 2002 2003 2004
Students persisting in the major 6 4 4 3 2 0Enrolled and progressed to the next student classification 0 0 0 0 2 0
Enrolled and did not progress to the next student classification 6 4 4 3 0 0
Students who changed their major, still enrolled 0 2 2 2 2 1Enrolled and progressed to the next student classification 0 0 0 1 2 1
Enrolled and did not progress to the next student classification 0 2 2 1 0 0
Students who graduated within the major 0 0 0 0 0 0Students who graduated outside of original major 0 0 0 0 0 2
Students enrolled at another LA Institution 0 0 1 2 2 1Students who dropped out 4 4 3 3 4 6
Total 10 10 10 10 10 10
Average Time-to-Degree for this major in semesters (2003-2004 graduates) 11.0Six-year graduation rate for students who persisted in the major 0.0%
Six-year graduation rate for ALL students who started in the major 20.0%
Comparative Graduation Rates Department graduation rate for students who persisted in original majors 6.9%
College graduation rate for students who persisted in original majors 12.7%University graduation rate for students who persisted in original majors 9.0%
Overall University graduation rate 25.3%
College of Business and TechnologyDepartment of Industrial Technology
Associate Degree in Applied Science, Design Drafter TechnologyFall 1998 Cohort = 10
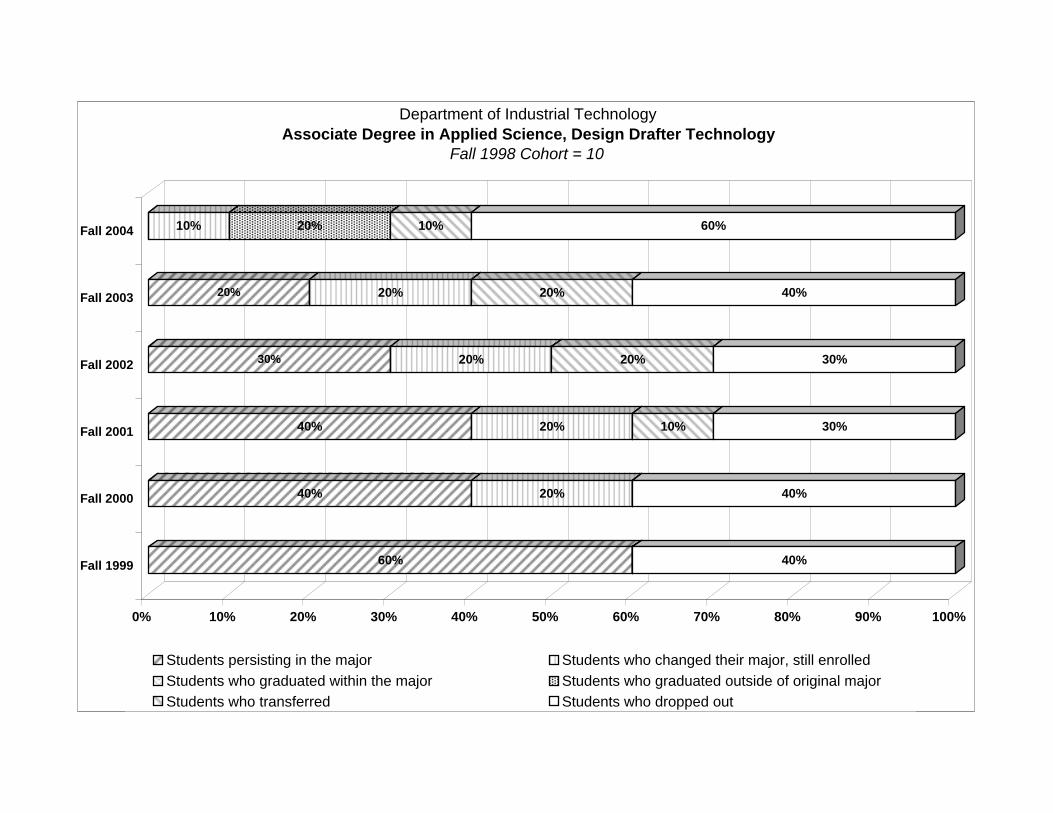
60% 40%
40% 20% 40%
40% 20% 10% 30%
30% 20% 20% 30%
20% 20% 20% 40%
10% 20% 10% 60%
0% 10% 20% 30% 40% 50% 60% 70% 80% 90% 100%
Fall 1999
Fall 2000
Fall 2001
Fall 2002
Fall 2003
Fall 2004
Department of Industrial Technology Associate Degree in Applied Science, Design Drafter Technology
Fall 1998 Cohort = 10
Students persisting in the major Students who changed their major, still enrolled Students who graduated within the major Students who graduated outside of original major Students who transferred Students who dropped out

Fall Fall Fall Fall Fall Fall1999 2000 2001 2002 2003 2004
Students persisting in the major 33 21 11 6 2 1Enrolled and progressed to the next student classification 5 3 2 4 1 1
Enrolled and did not progress to the next student classification 28 18 9 2 1 0
Students who changed their major, still enrolled 11 8 9 9 4 3Enrolled and progressed to the next student classification 5 1 2 6 4 3
Enrolled and did not progress to the next student classification 6 7 7 3 0 0
Students who graduated within the major 0 0 0 2 5 6Students who graduated outside of original major 0 0 1 2 5 6
Students enrolled at another LA Institution 7 13 15 12 11 12Students who dropped out 26 35 41 46 50 49
Total 77 77 77 77 77 77
Average Time-to-Degree for this major in semesters (2003-2004 graduates) 12.1Six-year graduation rate for students who persisted in the major 7.8%
Six-year graduation rate for ALL students who started in the major 15.6%
Comparative Graduation Rates Department graduation rate for students who persisted in original majors 6.9%
College graduation rate for students who persisted in original majors 12.7%University graduation rate for students who persisted in original majors 9.0%
Overall University graduation rate 25.3%
College of Business and TechnologyDepartment of Industrial Technology
Bachelor of Science, Industrial Technology Fall 1998 Cohort = 77

43% 14% 9% 34%
27% 10% 17% 45%
14% 12% 19% 53%
8% 12% 3% 3% 16% 60%
3% 5% 6% 6% 14% 65%
4% 8% 8% 16% 64%
0% 10% 20% 30% 40% 50% 60% 70% 80% 90% 100%
Fall 1999
Fall 2000
Fall 2001
Fall 2002
Fall 2003
Fall 2004
Department of Industrial Technology Bachelor of Science, Industrial Technology
Fall 1998 Cohort = 77
Students persisting in the major Students who changed their major, still enrolled Students who graduated within the major Students who graduated outside of original major Students who transferred Students who dropped out
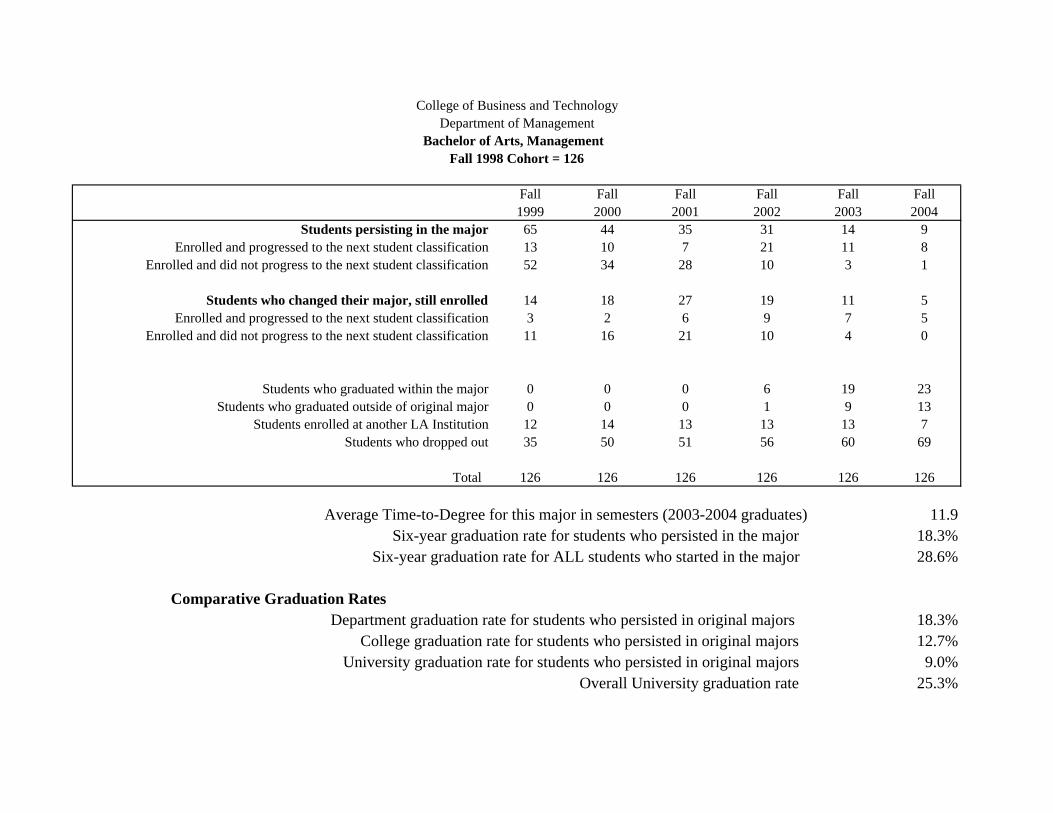
Fall Fall Fall Fall Fall Fall1999 2000 2001 2002 2003 2004
Students persisting in the major 65 44 35 31 14 9Enrolled and progressed to the next student classification 13 10 7 21 11 8
Enrolled and did not progress to the next student classification 52 34 28 10 3 1
Students who changed their major, still enrolled 14 18 27 19 11 5Enrolled and progressed to the next student classification 3 2 6 9 7 5
Enrolled and did not progress to the next student classification 11 16 21 10 4 0
Students who graduated within the major 0 0 0 6 19 23Students who graduated outside of original major 0 0 0 1 9 13
Students enrolled at another LA Institution 12 14 13 13 13 7Students who dropped out 35 50 51 56 60 69
Total 126 126 126 126 126 126
Average Time-to-Degree for this major in semesters (2003-2004 graduates) 11.9Six-year graduation rate for students who persisted in the major 18.3%
Six-year graduation rate for ALL students who started in the major 28.6%
Comparative Graduation Rates Department graduation rate for students who persisted in original majors 18.3%
College graduation rate for students who persisted in original majors 12.7%University graduation rate for students who persisted in original majors 9.0%
Overall University graduation rate 25.3%
College of Business and TechnologyDepartment of Management
Bachelor of Arts, Management Fall 1998 Cohort = 126
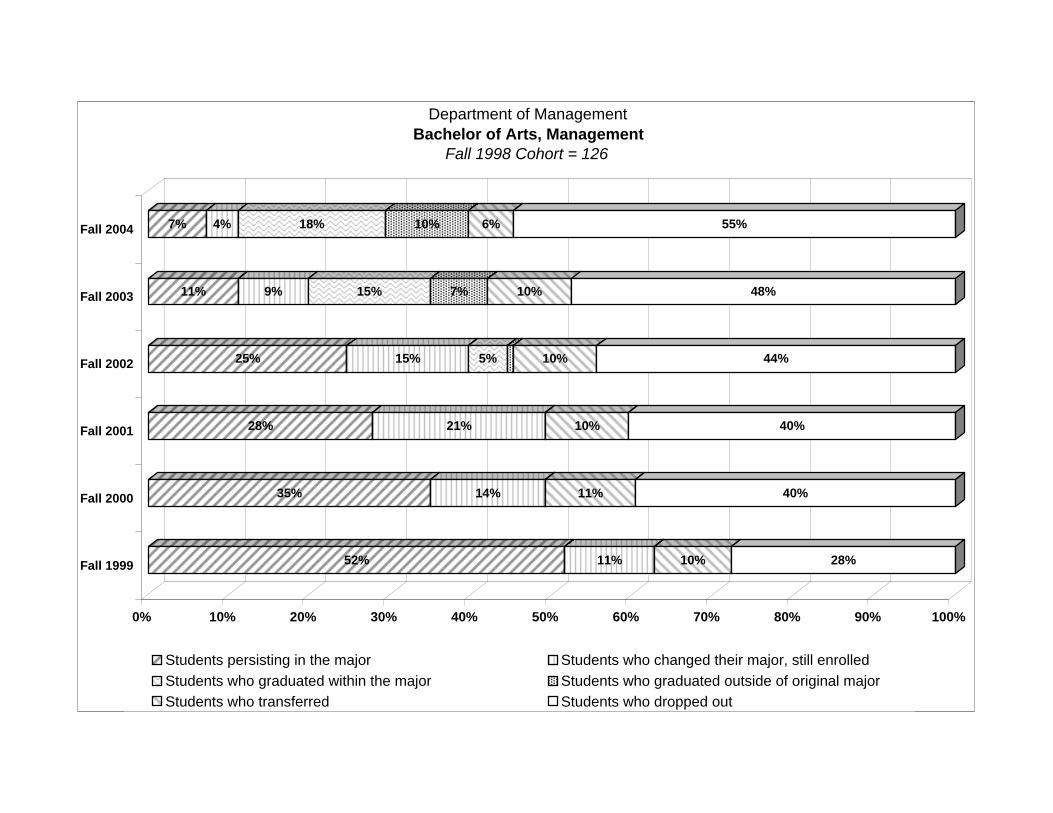
52% 11% 10% 28%
35% 14% 11% 40%
28% 21% 10% 40%
25% 15% 5% 10% 44%
11% 9% 15% 7% 10% 48%
7% 4% 18% 10% 6% 55%
0% 10% 20% 30% 40% 50% 60% 70% 80% 90% 100%
Fall 1999
Fall 2000
Fall 2001
Fall 2002
Fall 2003
Fall 2004
Department of Management Bachelor of Arts, Management
Fall 1998 Cohort = 126
Students persisting in the major Students who changed their major, still enrolled Students who graduated within the major Students who graduated outside of original major Students who transferred Students who dropped out

Fall Fall Fall Fall Fall Fall1999 2000 2001 2002 2003 2004
Students persisting in the major 10 7 5 6 1 0Enrolled and progressed to the next student classification 4 2 1 3 1 0
Enrolled and did not progress to the next student classification 6 5 4 3 0 0
Students who changed their major, still enrolled 1 3 2 3 0 0Enrolled and progressed to the next student classification 0 0 1 2 0 0
Enrolled and did not progress to the next student classification 1 3 1 1 0 0
Students who graduated within the major 0 0 0 0 3 4Students who graduated outside of original major 0 0 0 0 2 2
Students enrolled at another LA Institution 2 2 3 3 3 0Students who dropped out 2 3 5 3 6 9
Total 15 15 15 15 15 15
Average Time-to-Degree for this major in semesters (2003-2004 graduates) 10.7Six-year graduation rate for students who persisted in the major 26.7%
Six-year graduation rate for ALL students who started in the major 40.0%
Comparative Graduation Rates Department graduation rate for students who persisted in original majors 22.2%
College graduation rate for students who persisted in original majors 12.7%University graduation rate for students who persisted in original majors 9.0%
Overall University graduation rate 25.3%
College of Business and TechnologyDepartment of Marketing and Finance
Bachelor of Science, Finance Fall 1998 Cohort = 15
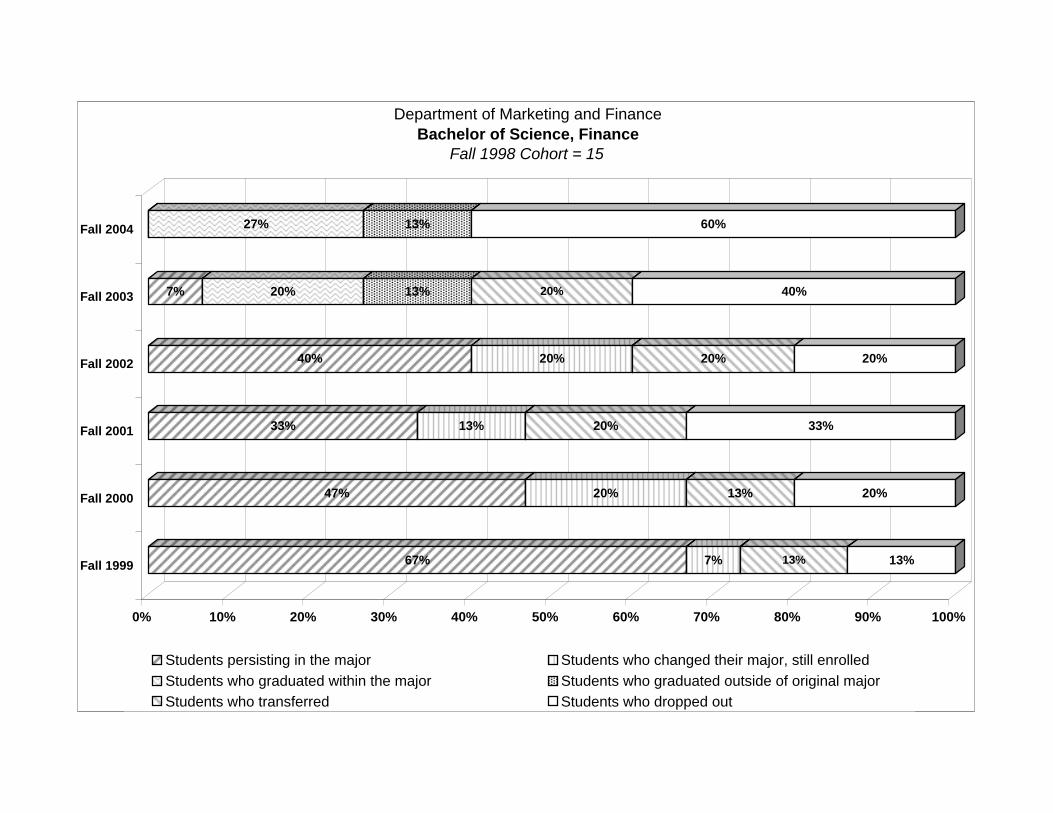
67% 7% 13% 13%
47% 20% 13% 20%
33% 13% 20% 33%
40% 20% 20% 20%
7% 20% 13% 20% 40%
27% 13% 60%
0% 10% 20% 30% 40% 50% 60% 70% 80% 90% 100%
Fall 1999
Fall 2000
Fall 2001
Fall 2002
Fall 2003
Fall 2004
Department of Marketing and Finance Bachelor of Science, Finance
Fall 1998 Cohort = 15
Students persisting in the major Students who changed their major, still enrolled Students who graduated within the major Students who graduated outside of original major Students who transferred Students who dropped out

Fall Fall Fall Fall Fall Fall1999 2000 2001 2002 2003 2004
Students persisting in the major 38 24 19 11 3 1Enrolled and progressed to the next student classification 12 7 5 9 2 1
Enrolled and did not progress to the next student classification 26 17 14 2 1 0
Students who changed their major, still enrolled 12 16 17 11 8 5Enrolled and progressed to the next student classification 5 3 5 5 4 4
Enrolled and did not progress to the next student classification 7 13 12 6 4 1
Students who graduated within the major 0 0 0 6 12 14Students who graduated outside of original major 0 0 0 2 5 8
Students enrolled at another LA Institution 2 5 7 5 7 5Students who dropped out 14 21 23 31 31 33
Total 66 66 66 66 66 66
Average Time-to-Degree for this major in semesters (2003-2004 graduates) 12.1Six-year graduation rate for students who persisted in the major 21.2%
Six-year graduation rate for ALL students who started in the major 33.3%
Comparative Graduation Rates Department graduation rate for students who persisted in original majors 22.2%
College graduation rate for students who persisted in original majors 12.7%University graduation rate for students who persisted in original majors 9.0%
Overall University graduation rate 25.3%
College of Business and TechnologyDepartment of Marketing and Finance
Bachelor of Arts, Marketing Fall 1998 Cohort = 66
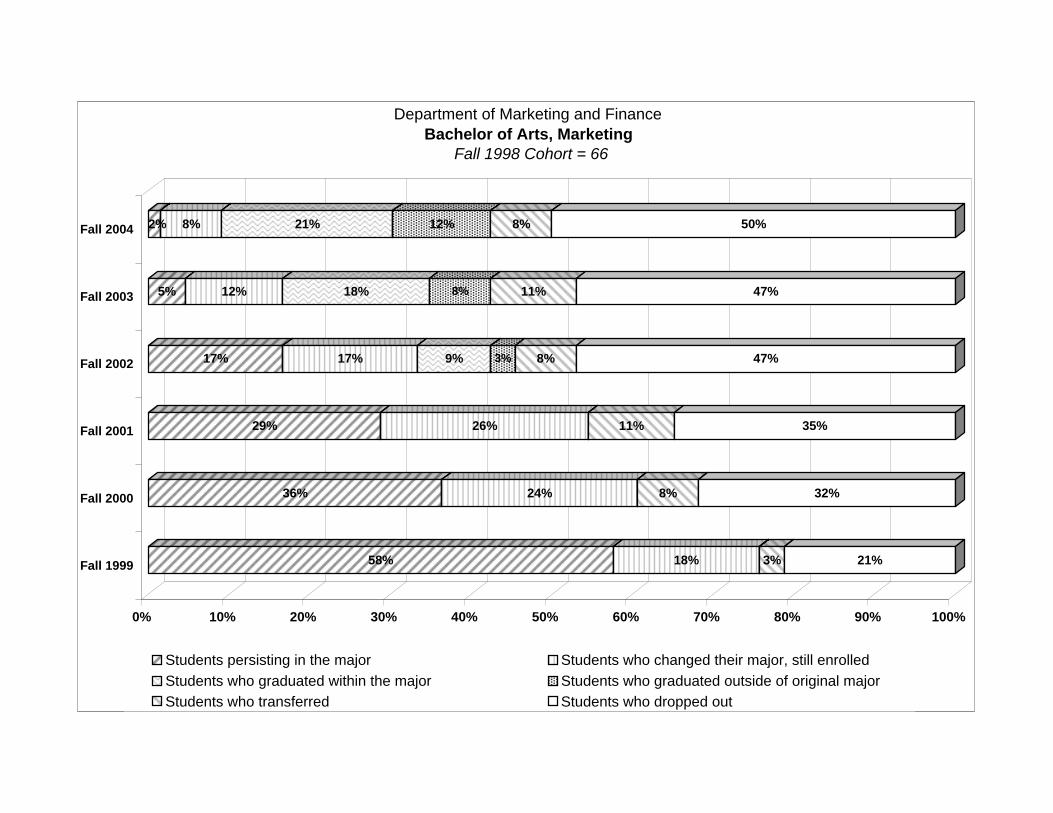
58% 18% 3% 21%
36% 24% 8% 32%
29% 26% 11% 35%
17% 17% 9% 3% 8% 47%
5% 12% 18% 8% 11% 47%
2% 8% 21% 12% 8% 50%
0% 10% 20% 30% 40% 50% 60% 70% 80% 90% 100%
Fall 1999
Fall 2000
Fall 2001
Fall 2002
Fall 2003
Fall 2004
Department of Marketing and Finance Bachelor of Arts, Marketing
Fall 1998 Cohort = 66
Students persisting in the major Students who changed their major, still enrolled Students who graduated within the major Students who graduated outside of original major Students who transferred Students who dropped out

Fall Fall Fall Fall Fall Fall1999 2000 2001 2002 2003 2004
Students persisting in the major 5 4 2 1 1 0Enrolled and progressed to the next student classification 1 0 0 1 0 0
Enrolled and did not progress to the next student classification 4 4 2 0 1 0
Students who changed their major, still enrolled 0 2 2 2 1 1Enrolled and progressed to the next student classification 0 0 0 1 1 1
Enrolled and did not progress to the next student classification 0 2 2 1 0 0
Students who graduated within the major 0 0 0 0 1 1Students who graduated outside of original major 0 0 0 0 1 1
Students enrolled at another LA Institution 1 1 1 0 1 0Students who dropped out 3 2 4 6 4 6
Total 9 9 9 9 9 9
Average Time-to-Degree for this major in semesters (2003-2004 graduates) 14.7Six-year graduation rate for students who persisted in the major 11.1%
Six-year graduation rate for ALL students who started in the major 22.2%
Comparative Graduation Rates Department graduation rate for students who persisted in original majors 16.3%
College graduation rate for students who persisted in original majors 17.2%University graduation rate for students who persisted in original majors 9.0%
Overall University graduation rate 25.3%
College of Education and Human DevelopmentDepartment of Human Development
Bachelor of Science, Consumer Family ServicesFall 1998 Cohort = 9
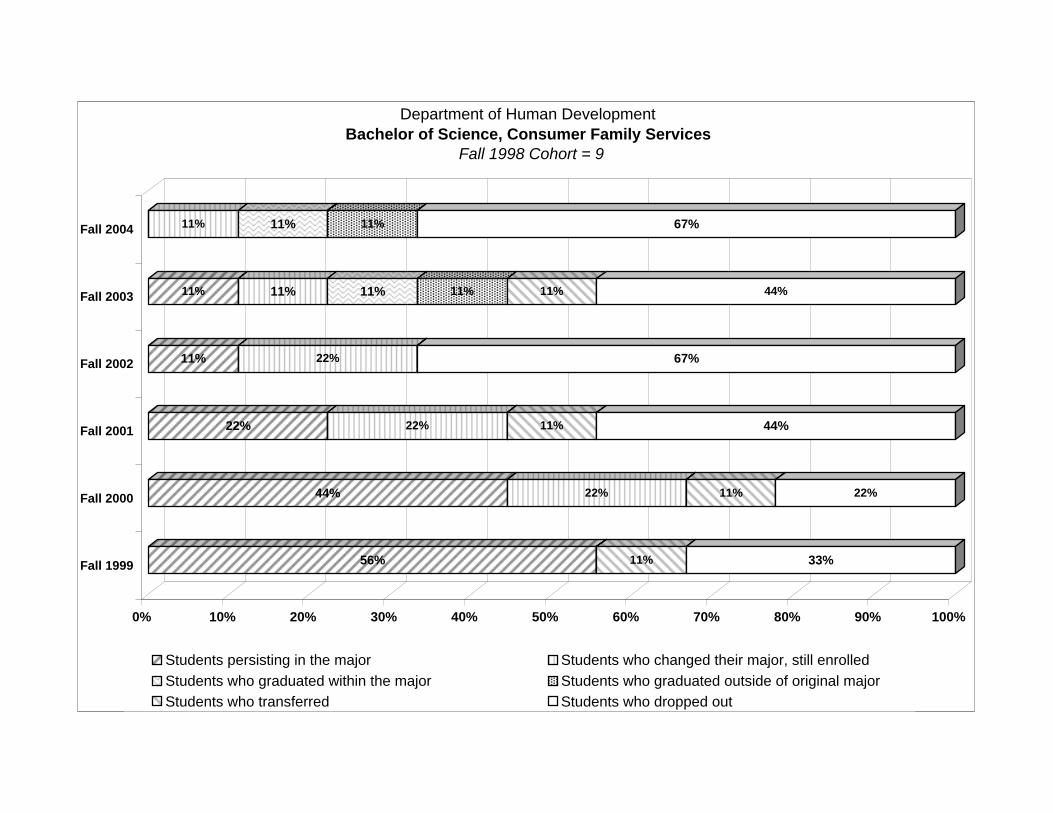
56% 11% 33%
44% 22% 11% 22%
22% 22% 11% 44%
11% 22% 67%
11% 11% 11% 11% 11% 44%
11% 11% 11% 67%
0% 10% 20% 30% 40% 50% 60% 70% 80% 90% 100%
Fall 1999
Fall 2000
Fall 2001
Fall 2002
Fall 2003
Fall 2004
Department of Human Development Bachelor of Science, Consumer Family Services
Fall 1998 Cohort = 9
Students persisting in the major Students who changed their major, still enrolled Students who graduated within the major Students who graduated outside of original major Students who transferred Students who dropped out

Fall Fall Fall Fall Fall Fall1999 2000 2001 2002 2003 2004
Students persisting in the major 0 0 0 0 0 0Enrolled and progressed to the next student classification 0 0 0 0 0 0
Enrolled and did not progress to the next student classification 0 0 0 0 0 0
Students who changed their major, still enrolled 1 1 1 0 0 0Enrolled and progressed to the next student classification 0 1 1 0 0 0
Enrolled and did not progress to the next student classification 1 0 0 0 0 0
Students who graduated within the major 0 0 0 0 0 0Students who graduated outside of original major 0 0 0 1 1 1
Students enrolled at another LA Institution 0 0 1 1 1 1Students who dropped out 1 1 0 0 0 0
Total 2 2 2 2 2 2
Average Time-to-Degree for this major in semesters (2003-2004 graduates) NASix-year graduation rate for students who persisted in the major 0.0%
Six-year graduation rate for ALL students who started in the major 50.0%
Comparative Graduation Rates Department graduation rate for students who persisted in original majors 16.3%
College graduation rate for students who persisted in original majors 17.2%University graduation rate for students who persisted in original majors 9.0%
Overall University graduation rate 25.3%
College of Education and Human DevelopmentDepartment of Human Development
Bachelor of Science, Fashion MerchandisingFall 1998 Cohort = 2
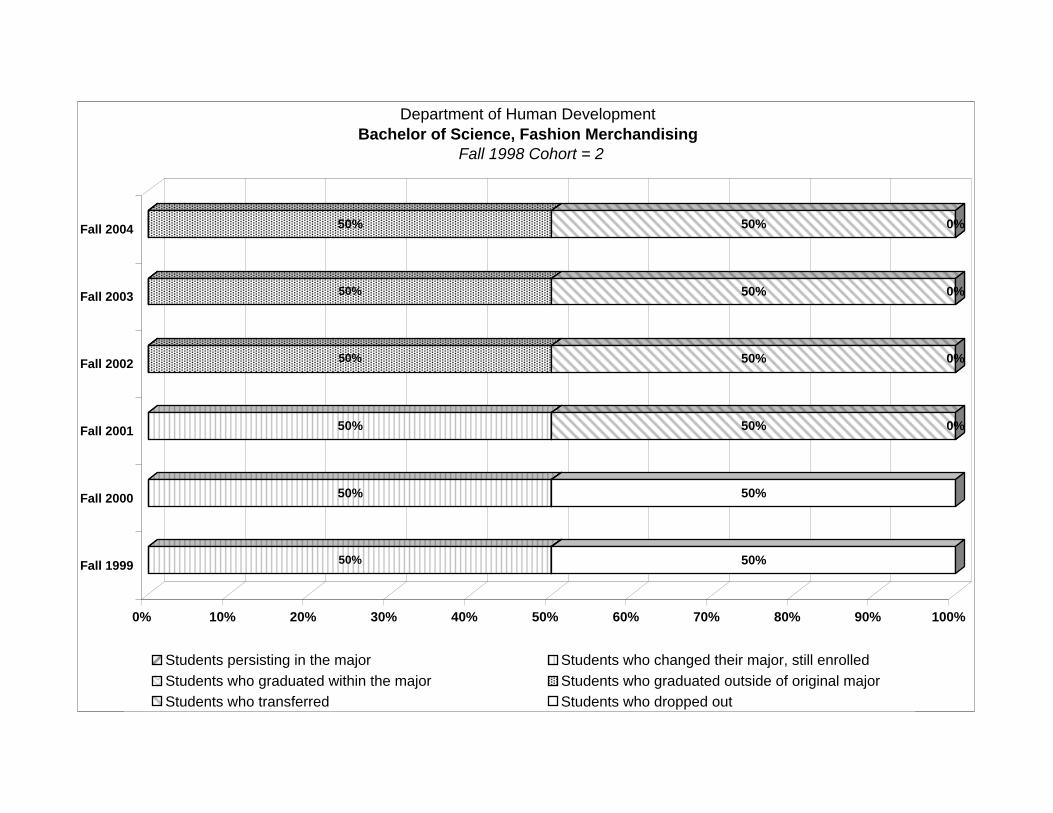
50% 50%
50% 50%
50% 50% 0%
50% 50% 0%
50% 50% 0%
50% 50% 0%
0% 10% 20% 30% 40% 50% 60% 70% 80% 90% 100%
Fall 1999
Fall 2000
Fall 2001
Fall 2002
Fall 2003
Fall 2004
Department of Human Development Bachelor of Science, Fashion Merchandising
Fall 1998 Cohort = 2
Students persisting in the major Students who changed their major, still enrolled Students who graduated within the major Students who graduated outside of original major Students who transferred Students who dropped out

Fall Fall Fall Fall Fall Fall1999 2000 2001 2002 2003 2004
Students persisting in the major 23 14 11 8 1 0Enrolled and progressed to the next student classification 7 5 3 6 1 0
Enrolled and did not progress to the next student classification 16 9 8 2 0 0
Students who changed their major, still enrolled 3 6 7 5 5 2Enrolled and progressed to the next student classification 1 0 1 4 3 2
Enrolled and did not progress to the next student classification 2 6 6 1 2 0
Students who graduated within the major 0 0 0 2 6 7Students who graduated outside of original major 0 0 0 1 2 4
Students enrolled at another LA Institution 2 2 1 1 2 1Students who dropped out 10 16 19 21 22 24
Total 38 38 38 38 38 38
Average Time-to-Degree for this major in semesters (2003-2004 graduates) 14.2Six-year graduation rate for students who persisted in the major 18.4%
Six-year graduation rate for ALL students who started in the major 28.9%
Comparative Graduation Rates Department graduation rate for students who persisted in original majors 16.3%
College graduation rate for students who persisted in original majors 17.2%University graduation rate for students who persisted in original majors 9.0%
Overall University graduation rate 25.3%
College of Education and Human DevelopmentDepartment of Human Development
Bachelor of Arts, Social WorkFall 1998 Cohort = 38
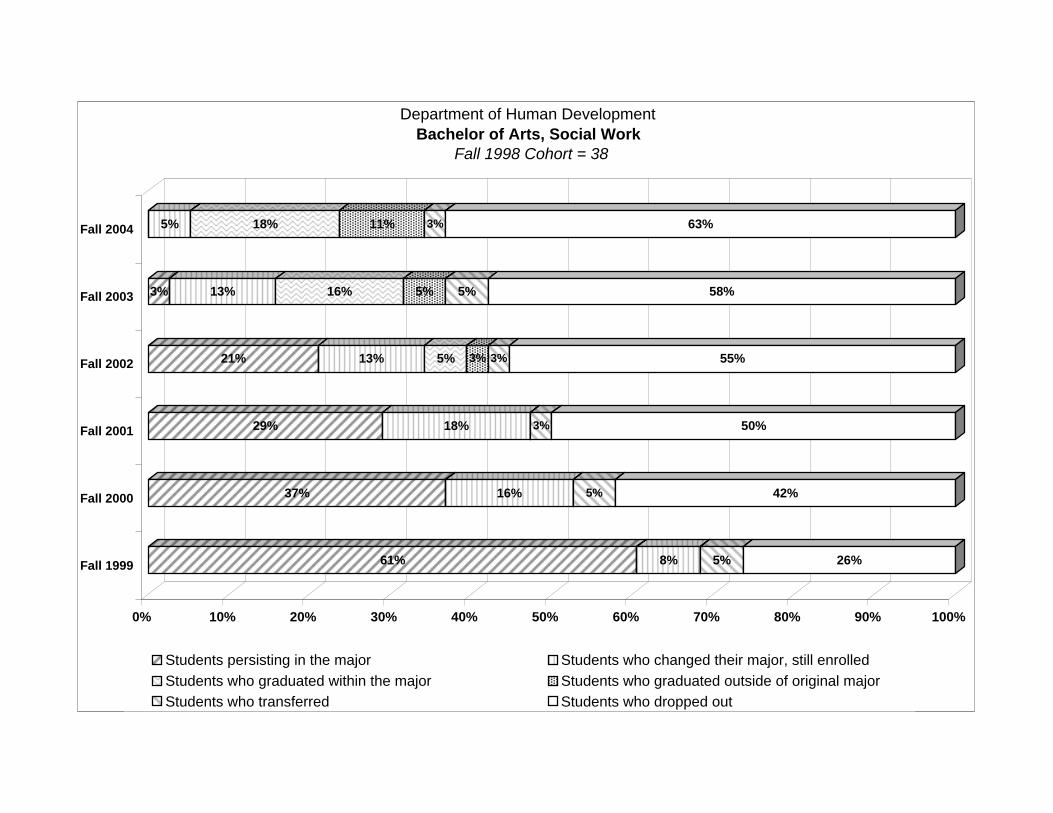
61% 8% 5% 26%
37% 16% 5% 42%
29% 18% 3% 50%
21% 13% 5% 3% 3% 55%
3% 13% 16% 5% 5% 58%
5% 18% 11% 3% 63%
0% 10% 20% 30% 40% 50% 60% 70% 80% 90% 100%
Fall 1999
Fall 2000
Fall 2001
Fall 2002
Fall 2003
Fall 2004
Department of Human Development Bachelor of Arts, Social Work
Fall 1998 Cohort = 38
Students persisting in the major Students who changed their major, still enrolled Students who graduated within the major Students who graduated outside of original major Students who transferred Students who dropped out

Fall Fall Fall Fall Fall Fall1999 2000 2001 2002 2003 2004
Students persisting in the major 126 90 73 49 19 10Enrolled and progressed to the next student classification 46 36 28 34 10 8
Enrolled and did not progress to the next student classification 80 54 45 15 9 2
Students who changed their major, still enrolled 27 34 44 41 26 19Enrolled and progressed to the next student classification 10 11 13 26 22 14
Enrolled and did not progress to the next student classification 17 23 31 15 4 5
Students who graduated within the major 0 0 0 11 32 37Students who graduated outside of original major 0 0 0 6 24 32
Students enrolled at another LA Institution 10 14 15 14 15 11Students who dropped out 48 73 79 90 95 102
Total 211 211 211 211 211 211
Average Time-to-Degree for this major in semesters (2003-2004 graduates) 13.6Six-year graduation rate for students who persisted in the major 17.5%
Six-year graduation rate for ALL students who started in the major 32.7%
Comparative Graduation Rates Department graduation rate for students who persisted in original majors 17.4%
College graduation rate for students who persisted in original majors 17.2%University graduation rate for students who persisted in original majors 9.0%
Overall University graduation rate 25.3%
College of Education and Human DevelopmentDepartment of Teaching and Learning
Bachelor of Arts, Elementary EducationFall 1998 Cohort = 211
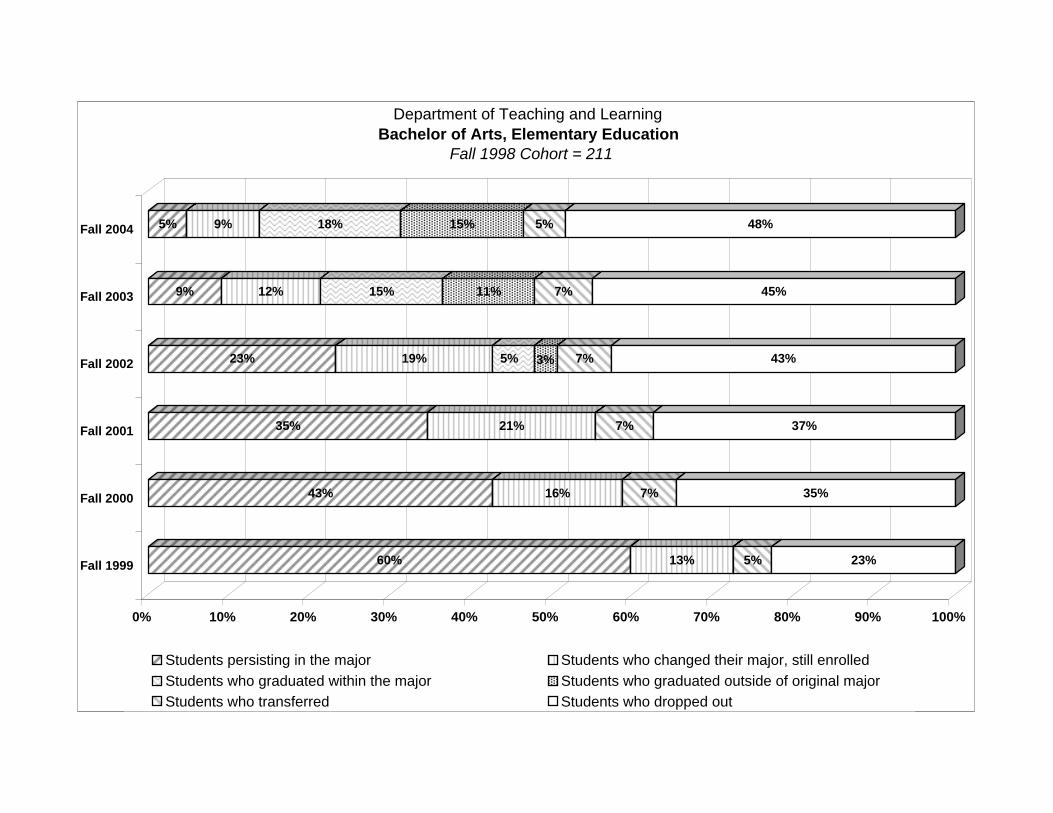
60% 13% 5% 23%
43% 16% 7% 35%
35% 21% 7% 37%
23% 19% 5% 3% 7% 43%
9% 12% 15% 11% 7% 45%
5% 9% 18% 15% 5% 48%
0% 10% 20% 30% 40% 50% 60% 70% 80% 90% 100%
Fall 1999
Fall 2000
Fall 2001
Fall 2002
Fall 2003
Fall 2004
Department of Teaching and Learning Bachelor of Arts, Elementary Education
Fall 1998 Cohort = 211
Students persisting in the major Students who changed their major, still enrolled Students who graduated within the major Students who graduated outside of original major Students who transferred Students who dropped out

Fall Fall Fall Fall Fall Fall1999 2000 2001 2002 2003 2004
Students persisting in the major 5 4 3 1 0 0Enrolled and progressed to the next student classification 1 1 1 1 0 0
Enrolled and did not progress to the next student classification 4 3 2 0 0 0
Students who changed their major, still enrolled 1 2 2 4 4 1Enrolled and progressed to the next student classification 0 0 0 2 4 1
Enrolled and did not progress to the next student classification 1 2 2 2 0 0
Students who graduated within the major 0 0 0 0 1 1Students who graduated outside of original major 0 0 0 0 0 2
Students enrolled at another LA Institution 1 1 1 1 0 0Students who dropped out 1 1 2 2 3 4
Total 8 8 8 8 8 8
Average Time-to-Degree for this major in semesters (2003-2004 graduates) 12.1Six-year graduation rate for students who persisted in the major 12.5%
Six-year graduation rate for ALL students who started in the major 37.5%
Comparative Graduation Rates Department graduation rate for students who persisted in original majors 17.4%
College graduation rate for students who persisted in original majors 17.2%University graduation rate for students who persisted in original majors 9.0%
Overall University graduation rate 25.3%
College of Education and Human DevelopmentDepartment of Teaching and Learning
Bachelor of Arts, Mild/Moderate ElementaryFall 1998 Cohort = 8
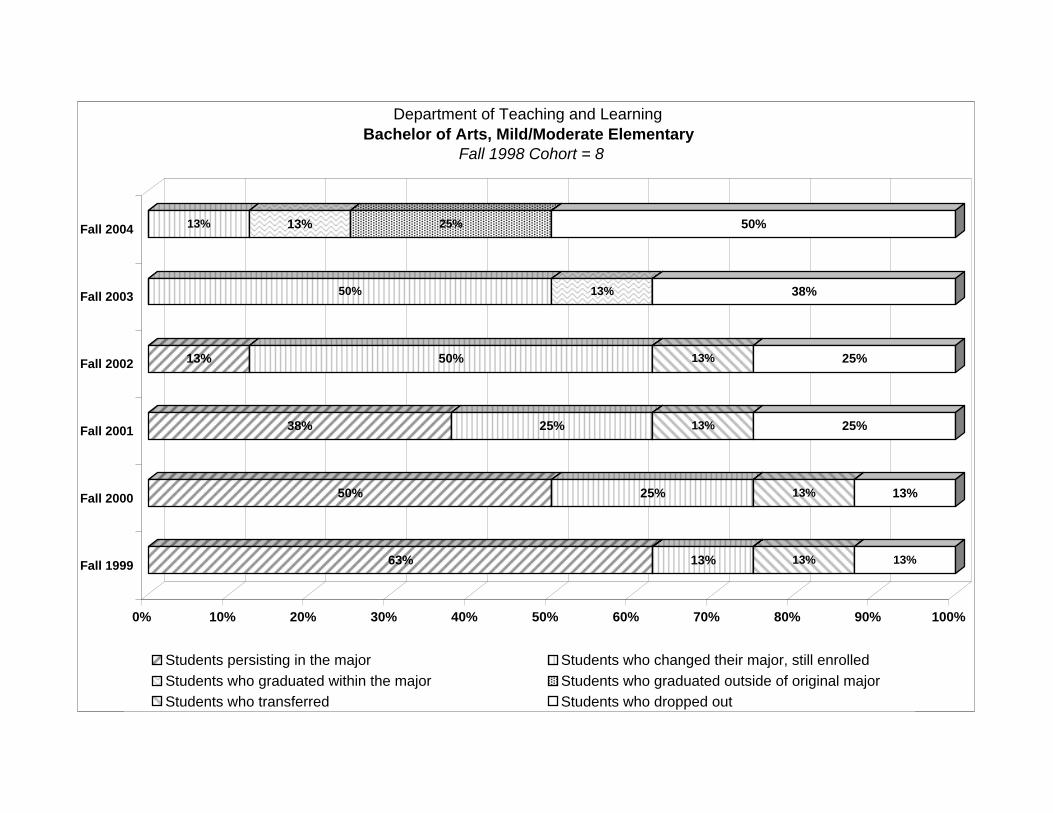
63% 13% 13% 13%
50% 25% 13% 13%
38% 25% 13% 25%
13% 50% 13% 25%
50% 13% 38%
13% 13% 25% 50%
0% 10% 20% 30% 40% 50% 60% 70% 80% 90% 100%
Fall 1999
Fall 2000
Fall 2001
Fall 2002
Fall 2003
Fall 2004
Department of Teaching and Learning Bachelor of Arts, Mild/Moderate Elementary
Fall 1998 Cohort = 8
Students persisting in the major Students who changed their major, still enrolled Students who graduated within the major Students who graduated outside of original major Students who transferred Students who dropped out

Fall Fall Fall Fall Fall Fall1999 2000 2001 2002 2003 2004
Students persisting in the major 0 0 0 0 0 0Enrolled and progressed to the next student classification 0 0 0 0 0 0
Enrolled and did not progress to the next student classification 0 0 0 0 0 0
Students who changed their major, still enrolled 0 0 0 1 0 0Enrolled and progressed to the next student classification 0 0 0 0 0 0
Enrolled and did not progress to the next student classification 0 0 0 1 0 0
Students who graduated within the major 0 0 0 0 0 0Students who graduated outside of original major 0 0 0 0 0 0
Students enrolled at another LA Institution 0 0 0 0 0 0Students who dropped out 1 1 1 0 1 1
Total 1 1 1 1 1 1
Average Time-to-Degree for this major in semesters (2003-2004 graduates) 12.1Six-year graduation rate for students who persisted in the major 0.0%
Six-year graduation rate for ALL students who started in the major 0.0%
Comparative Graduation Rates Department graduation rate for students who persisted in original majors 0.0%
College graduation rate for students who persisted in original majors NAUniversity graduation rate for students who persisted in original majors 9.0%
Overall University graduation rate 25.3%
College of General StudiesDepartment of General Studies
Associate of General Studies, General Studies Fall 1998 Cohort = 1
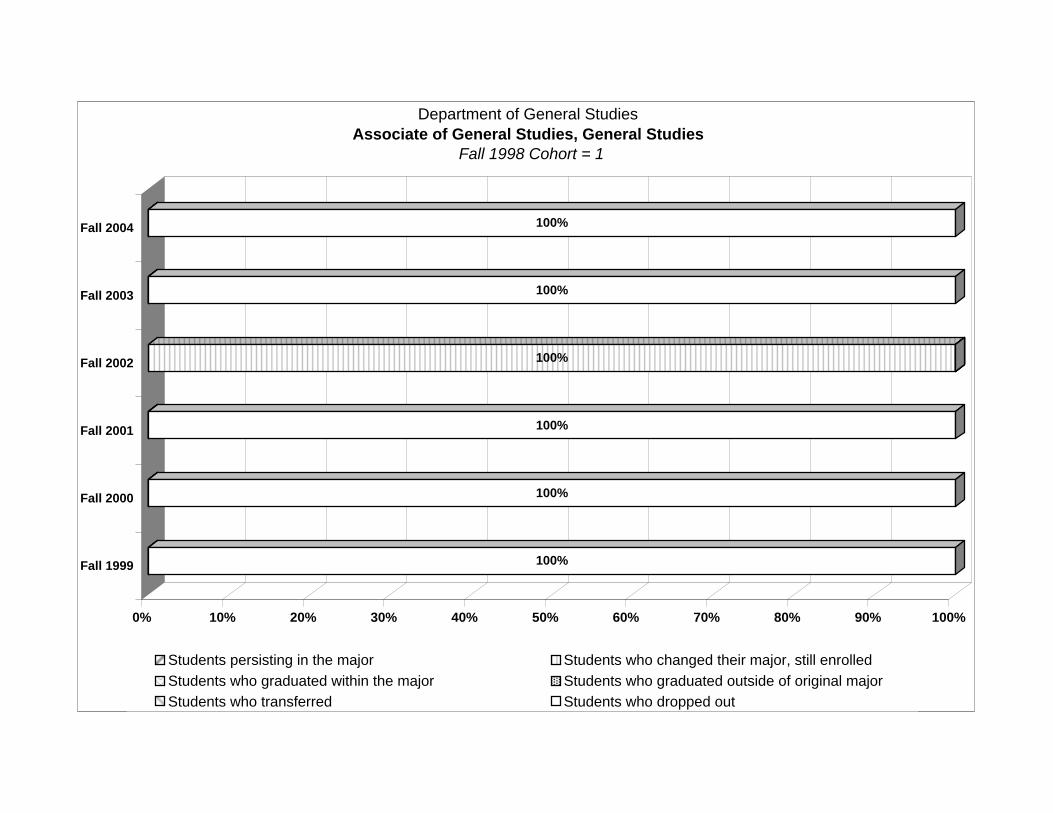
100%
100%
100%
100%
100%
100%
0% 10% 20% 30% 40% 50% 60% 70% 80% 90% 100%
Fall 1999
Fall 2000
Fall 2001
Fall 2002
Fall 2003
Fall 2004
Department of General Studies Associate of General Studies, General Studies
Fall 1998 Cohort = 1
Students persisting in the major Students who changed their major, still enrolled Students who graduated within the major Students who graduated outside of original major Students who transferred Students who dropped out
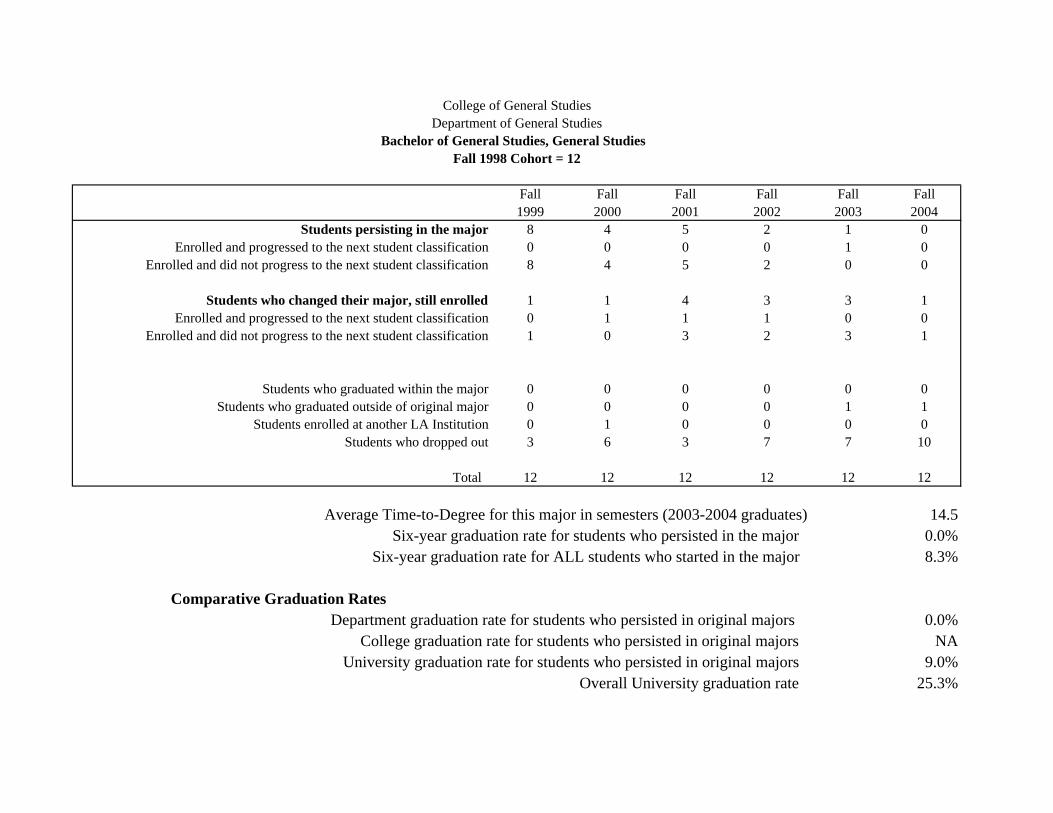
Fall Fall Fall Fall Fall Fall1999 2000 2001 2002 2003 2004
Students persisting in the major 8 4 5 2 1 0Enrolled and progressed to the next student classification 0 0 0 0 1 0
Enrolled and did not progress to the next student classification 8 4 5 2 0 0
Students who changed their major, still enrolled 1 1 4 3 3 1Enrolled and progressed to the next student classification 0 1 1 1 0 0
Enrolled and did not progress to the next student classification 1 0 3 2 3 1
Students who graduated within the major 0 0 0 0 0 0Students who graduated outside of original major 0 0 0 0 1 1
Students enrolled at another LA Institution 0 1 0 0 0 0Students who dropped out 3 6 3 7 7 10
Total 12 12 12 12 12 12
Average Time-to-Degree for this major in semesters (2003-2004 graduates) 14.5Six-year graduation rate for students who persisted in the major 0.0%
Six-year graduation rate for ALL students who started in the major 8.3%
Comparative Graduation Rates Department graduation rate for students who persisted in original majors 0.0%
College graduation rate for students who persisted in original majors NAUniversity graduation rate for students who persisted in original majors 9.0%
Overall University graduation rate 25.3%
College of General StudiesDepartment of General Studies
Bachelor of General Studies, General Studies Fall 1998 Cohort = 12

67% 8% 25%
33% 8% 8% 50%
42% 33% 25%
17% 25% 58%
8% 25% 8% 58%
8% 8% 83%
0% 10% 20% 30% 40% 50% 60% 70% 80% 90% 100%
Fall 1999
Fall 2000
Fall 2001
Fall 2002
Fall 2003
Fall 2004
Department of General Studies Bachelor of General Studies, General Studies
Fall 1998 Cohort = 12
Students persisting in the major Students who changed their major, still enrolled Students who graduated within the major Students who graduated outside of original major Students who transferred Students who dropped out
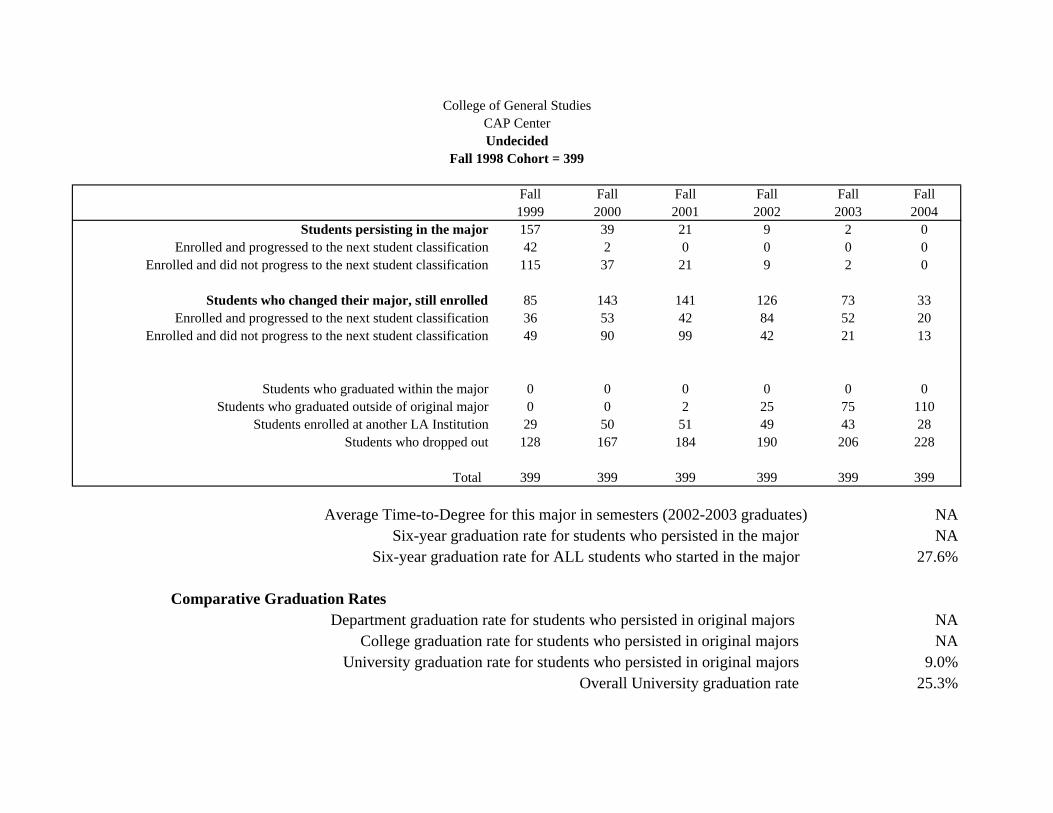
Fall Fall Fall Fall Fall Fall1999 2000 2001 2002 2003 2004
Students persisting in the major 157 39 21 9 2 0Enrolled and progressed to the next student classification 42 2 0 0 0 0
Enrolled and did not progress to the next student classification 115 37 21 9 2 0
Students who changed their major, still enrolled 85 143 141 126 73 33Enrolled and progressed to the next student classification 36 53 42 84 52 20
Enrolled and did not progress to the next student classification 49 90 99 42 21 13
Students who graduated within the major 0 0 0 0 0 0Students who graduated outside of original major 0 0 2 25 75 110
Students enrolled at another LA Institution 29 50 51 49 43 28Students who dropped out 128 167 184 190 206 228
Total 399 399 399 399 399 399
Average Time-to-Degree for this major in semesters (2002-2003 graduates) NASix-year graduation rate for students who persisted in the major NA
Six-year graduation rate for ALL students who started in the major 27.6%
Comparative Graduation Rates Department graduation rate for students who persisted in original majors NA
College graduation rate for students who persisted in original majors NAUniversity graduation rate for students who persisted in original majors 9.0%
Overall University graduation rate 25.3%
College of General StudiesCAP CenterUndecided
Fall 1998 Cohort = 399

39% 21% 7% 32%
10% 36% 13% 42%
5% 35% 13% 46%
2% 32% 6% 12% 48%
18% 19% 11% 52%
8% 28% 7% 57%
0% 10% 20% 30% 40% 50% 60% 70% 80% 90% 100%
Fall 1999
Fall 2000
Fall 2001
Fall 2002
Fall 2003
Fall 2004
CAP Center Undecided
Fall 1998 Cohort = 399
Students persisting in the major Students who changed their major, still enrolled Students who graduated within the major Students who graduated outside of original major Students who transferred Students who dropped out

Fall Fall Fall Fall Fall Fall1999 2000 2001 2002 2003 2004
Students persisting in the major 9 7 5 5 0 0Enrolled and progressed to the next student classification 5 3 2 3 0 0
Enrolled and did not progress to the next student classification 4 4 3 2 0 0
Students who changed their major, still enrolled 5 7 9 6 3 2Enrolled and progressed to the next student classification 2 3 3 5 3 2
Enrolled and did not progress to the next student classification 3 4 6 1 0 0
Students who graduated within the major 0 0 0 1 3 3Students who graduated outside of original major 0 0 0 0 4 5
Students enrolled at another LA Institution 2 5 5 5 4 3Students who dropped out 11 8 8 10 13 14
Total 27 27 27 27 27 27
Average Time-to-Degree for this major in semesters (2003-2004 graduates) 14.1Six-year graduation rate for students who persisted in the major 11.1%
Six-year graduation rate for ALL students who started in the major 29.6%
Comparative Graduation Rates Department graduation rate for students who persisted in original majors 11.1%
College graduation rate for students who persisted in original majors 12.2%University graduation rate for students who persisted in original majors 9.0%
Overall University graduation rate 25.3%
College of Nursing and Health SciencesDepartment of Communication Sciences and Disorders
Bachelor of Arts, Speech, Language, Hearing Fall 1998 Cohort = 27
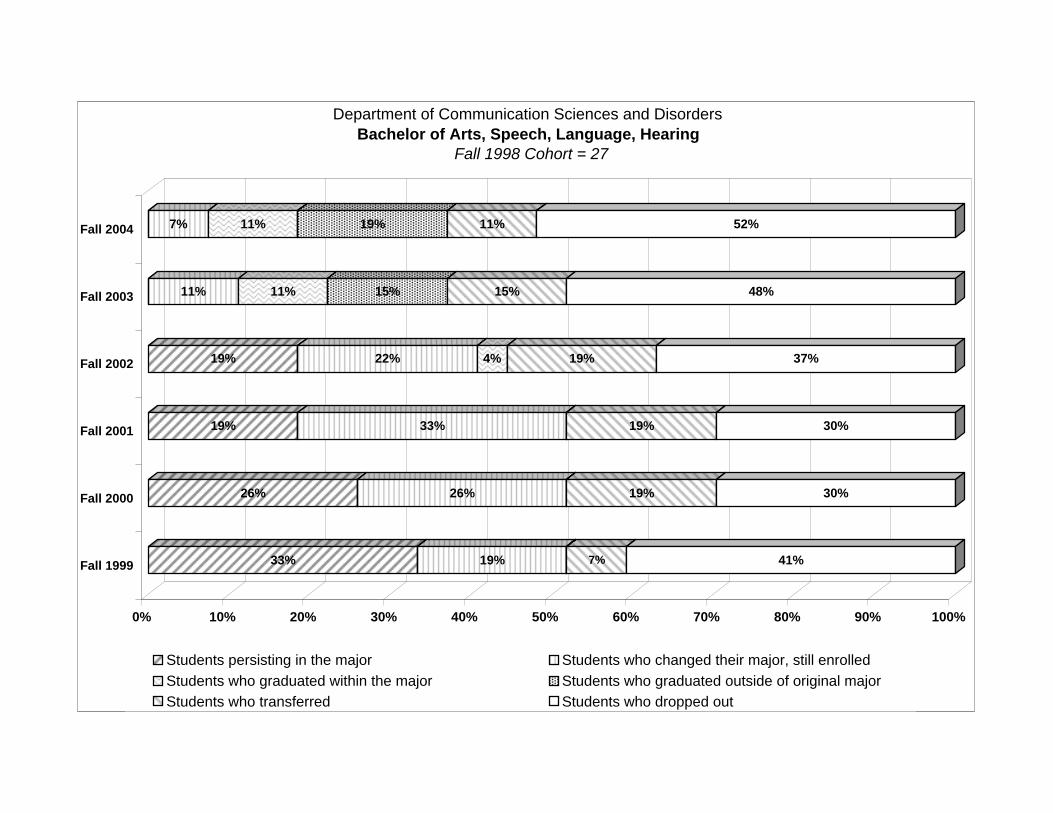
33% 19% 7% 41%
26% 26% 19% 30%
19% 33% 19% 30%
19% 22% 4% 19% 37%
11% 11% 15% 15% 48%
7% 11% 19% 11% 52%
0% 10% 20% 30% 40% 50% 60% 70% 80% 90% 100%
Fall 1999
Fall 2000
Fall 2001
Fall 2002
Fall 2003
Fall 2004
Department of Communication Sciences and Disorders Bachelor of Arts, Speech, Language, Hearing
Fall 1998 Cohort = 27
Students persisting in the major Students who changed their major, still enrolled Students who graduated within the major Students who graduated outside of original major Students who transferred Students who dropped out

Fall Fall Fall Fall Fall Fall1999 2000 2001 2002 2003 2004
Students persisting in the major 46 29 23 20 9 3Enrolled and progressed to the next student classification 12 8 9 17 7 3
Enrolled and did not progress to the next student classification 34 21 14 3 2 0
Students who changed their major, still enrolled 11 15 17 17 8 5Enrolled and progressed to the next student classification 8 7 5 10 7 4
Enrolled and did not progress to the next student classification 3 8 12 7 1 1
Students who graduated within the major 0 0 0 1 9 12Students who graduated outside of original major 0 0 0 3 9 13
Students enrolled at another LA Institution 9 9 7 7 6 3Students who dropped out 20 33 39 38 45 50
Total 86 86 86 86 86 86
Average Time-to-Degree for this major in semesters (2003-2004 graduates) 11.9Six-year graduation rate for students who persisted in the major 14.0%
Six-year graduation rate for ALL students who started in the major 29.1%
Comparative Graduation Rates Department graduation rate for students who persisted in original majors 14.0%
College graduation rate for students who persisted in original majors 12.2%University graduation rate for students who persisted in original majors 9.0%
Overall University graduation rate 25.3%
College of Nursing and Health SciencesDepartment of Kinesiology and Health Studies
Bachelor of Arts, KinesiologyFall 1998 Cohort = 86
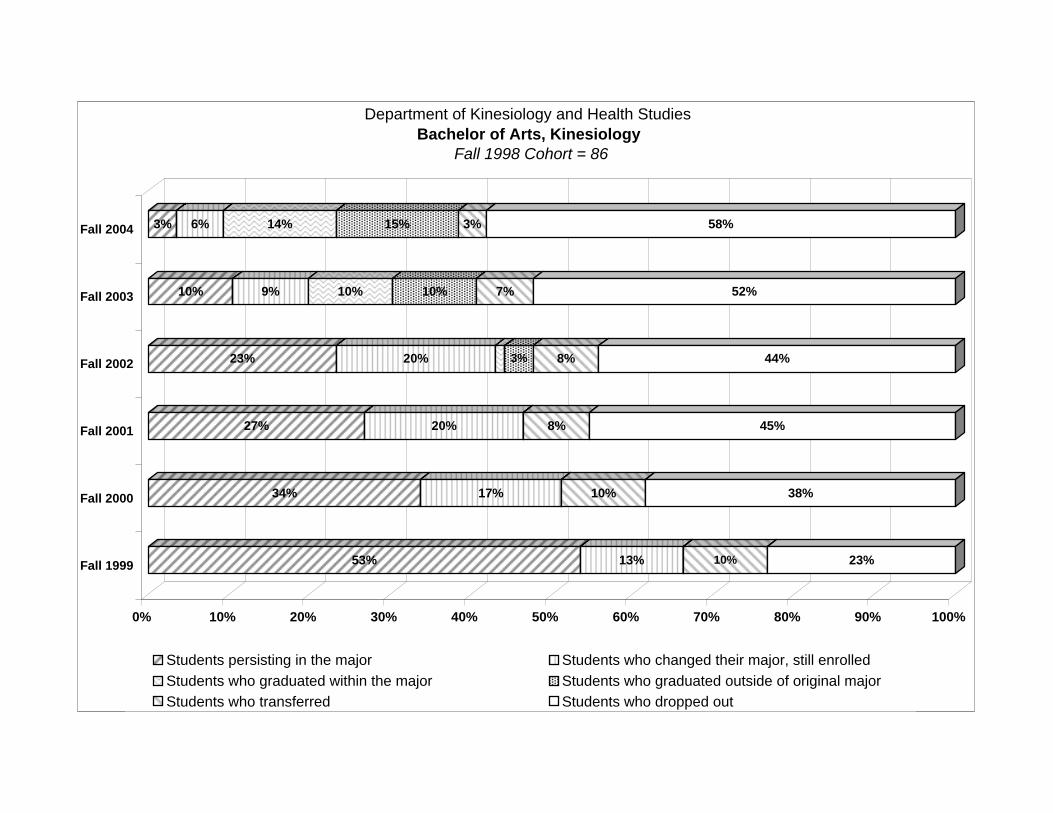
53% 13% 10% 23%
34% 17% 10% 38%
27% 20% 8% 45%
23% 20% 3% 8% 44%
10% 9% 10% 10% 7% 52%
3% 6% 14% 15% 3% 58%
0% 10% 20% 30% 40% 50% 60% 70% 80% 90% 100%
Fall 1999
Fall 2000
Fall 2001
Fall 2002
Fall 2003
Fall 2004
Department of Kinesiology and Health Studies Bachelor of Arts, Kinesiology
Fall 1998 Cohort = 86
Students persisting in the major Students who changed their major, still enrolled Students who graduated within the major Students who graduated outside of original major Students who transferred Students who dropped out
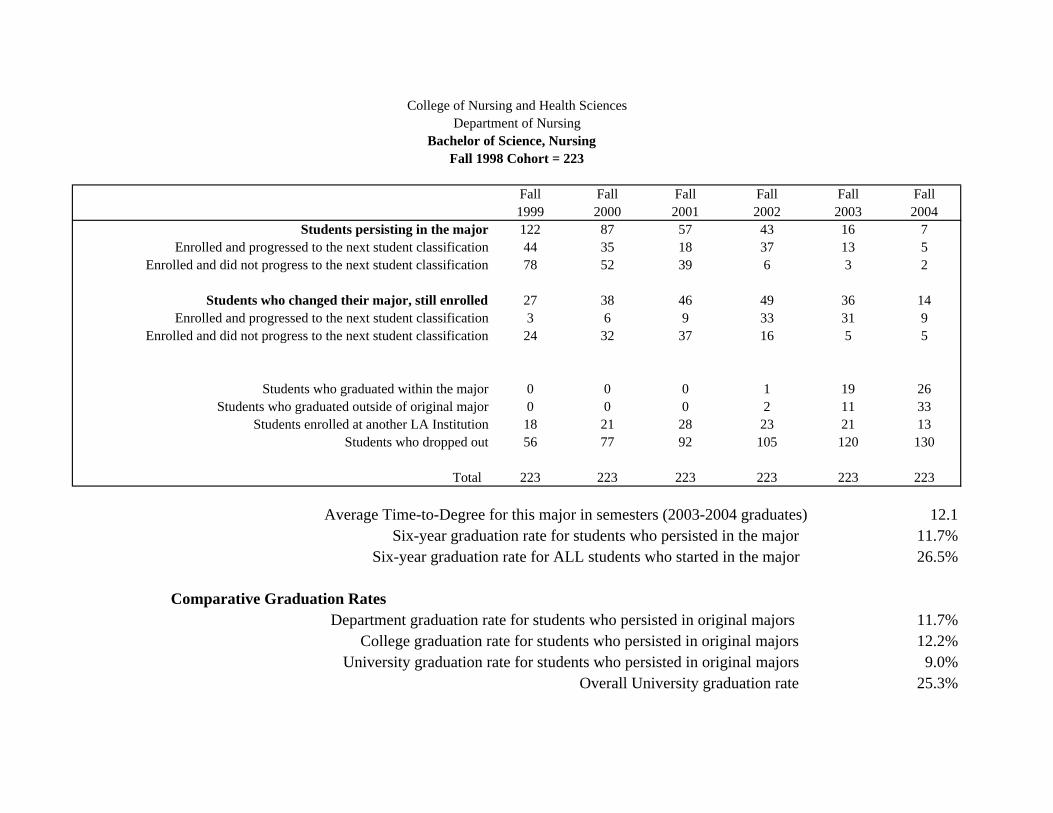
Fall Fall Fall Fall Fall Fall1999 2000 2001 2002 2003 2004
Students persisting in the major 122 87 57 43 16 7Enrolled and progressed to the next student classification 44 35 18 37 13 5
Enrolled and did not progress to the next student classification 78 52 39 6 3 2
Students who changed their major, still enrolled 27 38 46 49 36 14Enrolled and progressed to the next student classification 3 6 9 33 31 9
Enrolled and did not progress to the next student classification 24 32 37 16 5 5
Students who graduated within the major 0 0 0 1 19 26Students who graduated outside of original major 0 0 0 2 11 33
Students enrolled at another LA Institution 18 21 28 23 21 13Students who dropped out 56 77 92 105 120 130
Total 223 223 223 223 223 223
Average Time-to-Degree for this major in semesters (2003-2004 graduates) 12.1Six-year graduation rate for students who persisted in the major 11.7%
Six-year graduation rate for ALL students who started in the major 26.5%
Comparative Graduation Rates Department graduation rate for students who persisted in original majors 11.7%
College graduation rate for students who persisted in original majors 12.2%University graduation rate for students who persisted in original majors 9.0%
Overall University graduation rate 25.3%
College of Nursing and Health SciencesDepartment of Nursing
Bachelor of Science, Nursing Fall 1998 Cohort = 223
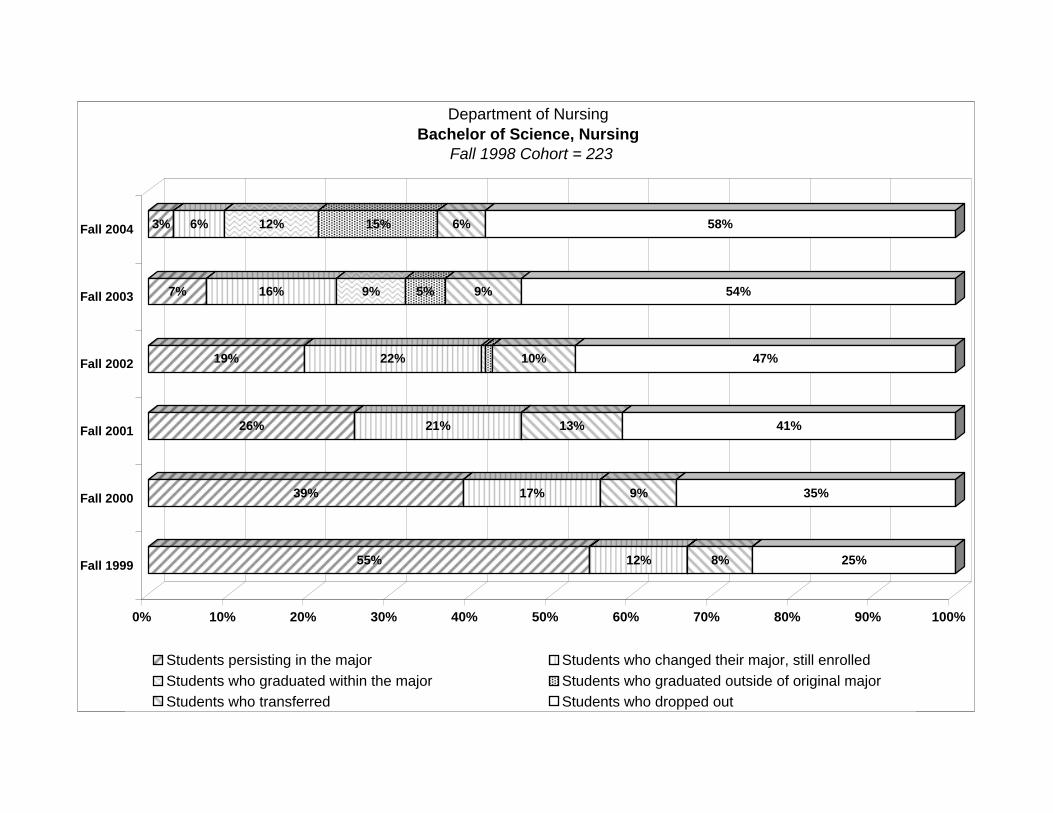
55% 12% 8% 25%
39% 17% 9% 35%
26% 21% 13% 41%
19% 22% 10% 47%
7% 16% 9% 5% 9% 54%
3% 6% 12% 15% 6% 58%
0% 10% 20% 30% 40% 50% 60% 70% 80% 90% 100%
Fall 1999
Fall 2000
Fall 2001
Fall 2002
Fall 2003
Fall 2004
Department of Nursing Bachelor of Science, Nursing
Fall 1998 Cohort = 223
Students persisting in the major Students who changed their major, still enrolled Students who graduated within the major Students who graduated outside of original major Students who transferred Students who dropped out
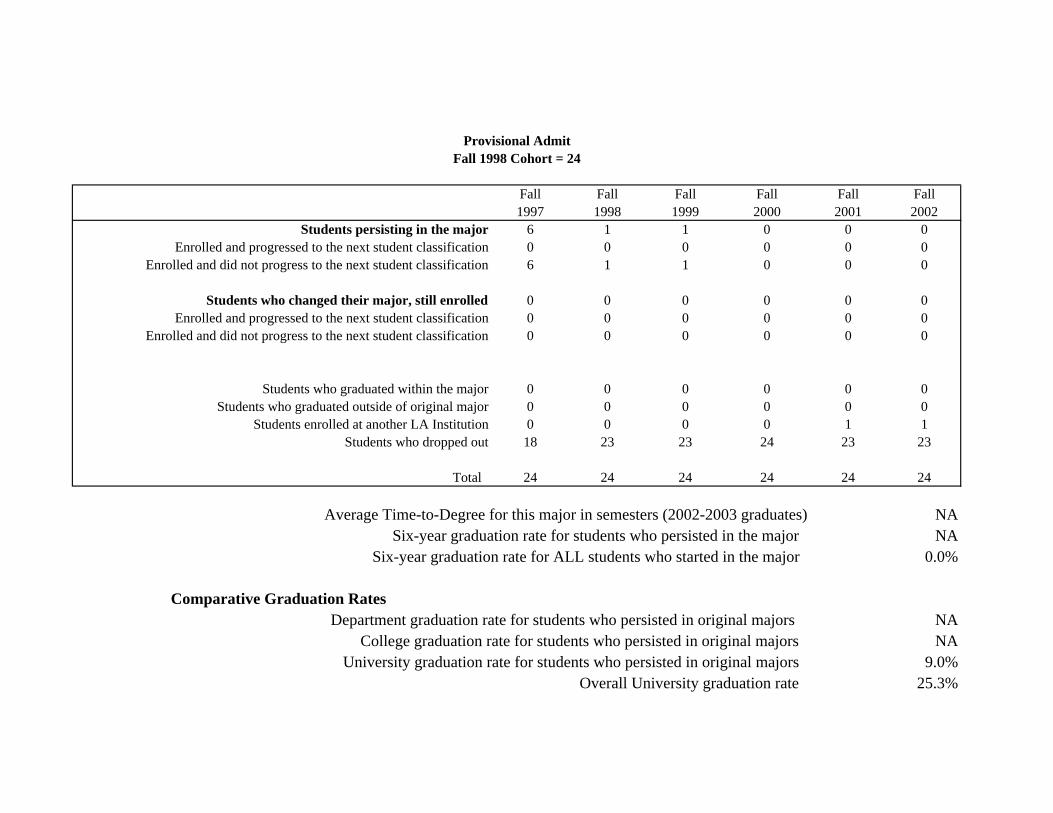
Fall Fall Fall Fall Fall Fall1997 1998 1999 2000 2001 2002
Students persisting in the major 6 1 1 0 0 0Enrolled and progressed to the next student classification 0 0 0 0 0 0
Enrolled and did not progress to the next student classification 6 1 1 0 0 0
Students who changed their major, still enrolled 0 0 0 0 0 0Enrolled and progressed to the next student classification 0 0 0 0 0 0
Enrolled and did not progress to the next student classification 0 0 0 0 0 0
Students who graduated within the major 0 0 0 0 0 0Students who graduated outside of original major 0 0 0 0 0 0
Students enrolled at another LA Institution 0 0 0 0 1 1Students who dropped out 18 23 23 24 23 23
Total 24 24 24 24 24 24
Average Time-to-Degree for this major in semesters (2002-2003 graduates) NASix-year graduation rate for students who persisted in the major NA
Six-year graduation rate for ALL students who started in the major 0.0%
Comparative Graduation Rates Department graduation rate for students who persisted in original majors NA
College graduation rate for students who persisted in original majors NAUniversity graduation rate for students who persisted in original majors 9.0%
Overall University graduation rate 25.3%
Provisional AdmitFall 1998 Cohort = 24
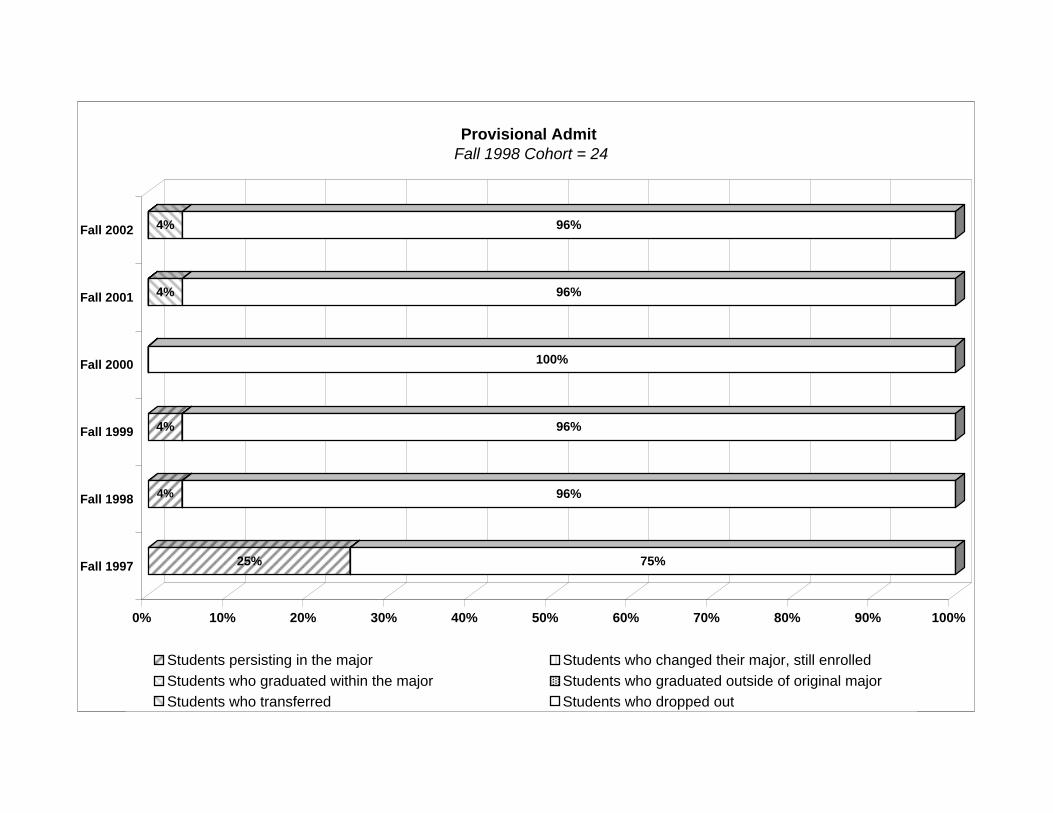
25% 75%
4% 96%
4% 96%
100%
4% 96%
4% 96%
0% 10% 20% 30% 40% 50% 60% 70% 80% 90% 100%
Fall 1997
Fall 1998
Fall 1999
Fall 2000
Fall 2001
Fall 2002
Provisional Admit
Fall 1998 Cohort = 24
Students persisting in the major Students who changed their major, still enrolled Students who graduated within the major Students who graduated outside of original major Students who transferred Students who dropped out

Fall Fall Fall Fall Fall Fall1997 1998 1999 2000 2001 2002
Students persisting in the major 11 1 1 0 0 0Enrolled and progressed to the next student classification 0 0 0 0 0 0
Enrolled and did not progress to the next student classification 11 1 1 0 0 0
Students who changed their major, still enrolled 0 0 0 0 0 0Enrolled and progressed to the next student classification 0 0 0 0 0 0
Enrolled and did not progress to the next student classification 0 0 0 0 0 0
Students who graduated within the major 0 0 0 0 0 0Students who graduated outside of original major 0 0 0 0 0 0
Students enrolled at another LA Institution 16 11 9 8 9 10Students who dropped out 64 79 81 83 82 81
Total 91 91 91 91 91 91
Average Time-to-Degree for this major in semesters (2002-2003 graduates) NASix-year graduation rate for students who persisted in the major NA
Six-year graduation rate for ALL students who started in the major 0.0%
Comparative Graduation Rates Department graduation rate for students who persisted in original majors NA
College graduation rate for students who persisted in original majors NAUniversity graduation rate for students who persisted in original majors 9.0%
Overall University graduation rate 25.3%
Developmental EducationFall 1998 Cohort = 91
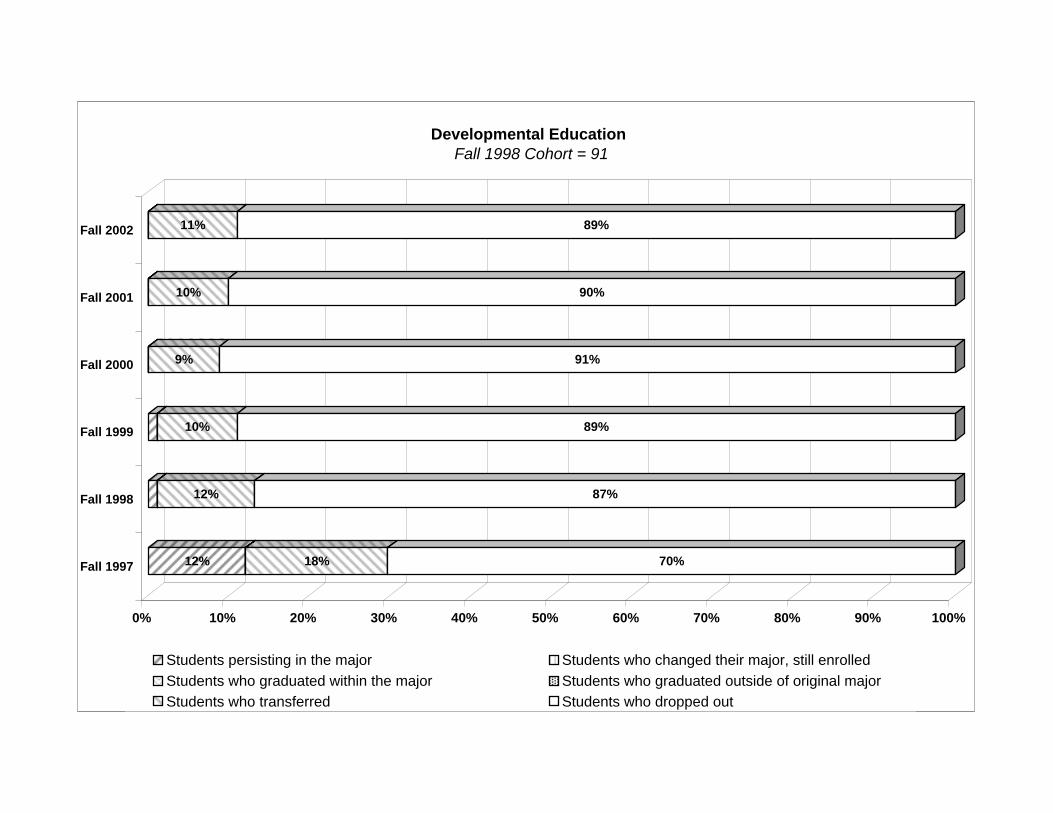
12% 18% 70%
12% 87%
10% 89%
9% 91%
10% 90%
11% 89%
0% 10% 20% 30% 40% 50% 60% 70% 80% 90% 100%
Fall 1997
Fall 1998
Fall 1999
Fall 2000
Fall 2001
Fall 2002
Developmental Education
Fall 1998 Cohort = 91
Students persisting in the major Students who changed their major, still enrolled Students who graduated within the major Students who graduated outside of original major Students who transferred Students who dropped out