retention & graduation - texas woman's university · ftic freshmen four-year graduation...
TRANSCRIPT
Table of Contents
Retention & Graduation ................................................................................................................................ E-1
FTIC Freshmen One-year Retention Rates ChartFall Semesters, 2007/2008 through 2016/2017 ................................................................................................... E-2
FTIC Freshmen Six-year Graduation Rates ChartFall Semesters, 2002/2008 through 2011/2017 ................................................................................................... E-3
FTIC Freshmen Five-year Graduation Rates ChartFall Semesters, 2003/2008 through 2012/2017 ................................................................................................... E-4
FTIC Freshmen Four-year Graduation Rates ChartFall Semesters, 2004/2008 through 2013/2017 ................................................................................................... E-5
FTIC Freshmen Retention and Graduation TablesFall 2009 through Fall 2011 Cohorts .................................................................................................................. E-6Fall 2012 through Fall 2014 Cohorts ................................................................................................................... E-7Fall 2015 through Fall 2017 Cohorts ................................................................................................................... E-8
FTIC Freshmen Six-Year Retention and Graduation ChartFall Semester Total Cohorts, 2009 through 2011 ................................................................................................ E-9Fall Semester Cohorts by Ethnicity, 2011 ......................................................................................................... E-10
Transfer Students Four-year Graduation Rates ChartFall Semesters, 2004/2008 through 2013/2017 ................................................................................................. E-11
Transfer Students Three-year Graduation Rates ChartFall Semesters, 2005/2008 through 2014/2017 ................................................................................................. E-12
Transfer Students Two-year Graduation Rates ChartFall Semesters, 2006/2008 through 2015/2017 ................................................................................................. E-13
Transfer Retention and Graduation TablesFall 2012 through Fall 2014 Cohorts ................................................................................................................. E-14Fall 2015 through Fall 2017 Cohorts ................................................................................................................. E-15
Transfer Four-Year Retention and Graduation ChartFall Semester Total Cohorts, 2011 through 2013 .............................................................................................. E-16Fall Semester Cohorts by Ethnicity, 2013 ......................................................................................................... E-17
Master's Level New Admits Retention and Graduation Tables2011-12 through 2013-14 Cohorts..................................................................................................................... E-182014-15 through 2016-17 Cohorts .................................................................................................................... E-19
Master's Level New Admits Four-Year Retention and Graduation ChartTotal Cohorts, 2010-11 through 2012-13 .......................................................................................................... E-20Total Cohorts by Ethnicity, 2012-13 .................................................................................................................. E-21
Retention & Graduation
Texas Woman's University
Retention & Graduation
E-2
Source: TWU, Office of Institutional Research & Data Manangement, Fact Book 2016.
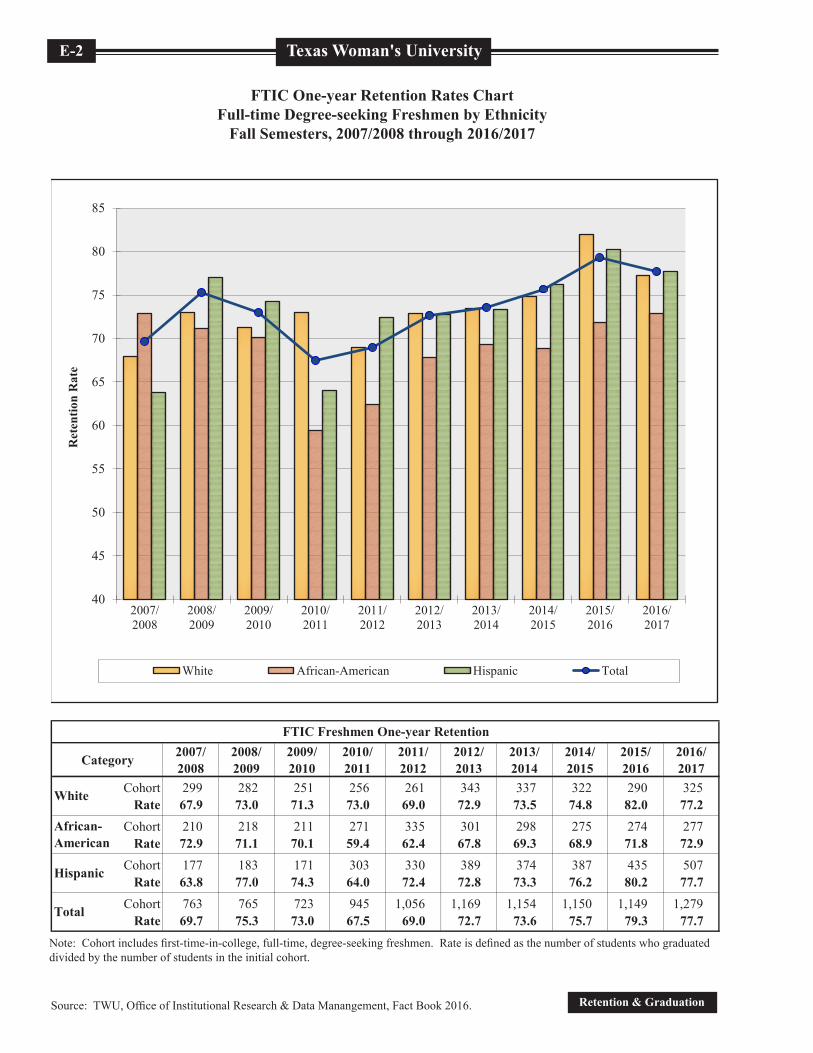
FTIC One-year Retention Rates ChartFull-time Degree-seeking Freshmen by Ethnicity
Fall Semesters, 2007/2008 through 2016/2017FTIC Freshmen One-year Retention Rates Chart
Fall Semesters, 2007/2008 through 2016/2017
Note: Cohort includes first-time-in-college, full-time, degree-seeking freshmen. Rate is defined as the number of students who graduated divided by the number of students in the initial cohort.
Category 2007/ 2008
2008/ 2009
2009/ 2010
2010/ 2011
2011/ 2012
2012/ 2013
2013/ 2014
2014/ 2015
2015/ 2016
2016/ 2017
Cohort 299 282 251 256 261 343 337 322 290 325Rate 67.9 73.0 71.3 73.0 69.0 72.9 73.5 74.8 82.0 77.2
Cohort 210 218 211 271 335 301 298 275 274 277Rate 72.9 71.1 70.1 59.4 62.4 67.8 69.3 68.9 71.8 72.9
Cohort 177 183 171 303 330 389 374 387 435 507Rate 63.8 77.0 74.3 64.0 72.4 72.8 73.3 76.2 80.2 77.7
Cohort 763 765 723 945 1,056 1,169 1,154 1,150 1,149 1,279Rate 69.7 75.3 73.0 67.5 69.0 72.7 73.6 75.7 79.3 77.7
FTIC Freshmen One-year Retention
Total
White
African-American
Hispanic
40
45
50
55
60
65
70
75
80
85
2007/2008
2008/2009
2009/2010
2010/2011
2011/2012
2012/2013
2013/2014
2014/2015
2015/2016
2016/2017
Ret
entio
n R
ate
White African-American Hispanic Total
Source: TWU, Office of Institutional Research.FTIC_1yr_Retention
12/6/2017
Texas Woman's University E-3
Retention & GraduationSource: TWU, Office of Institutional Research & Data Management, Fact Book 2016.
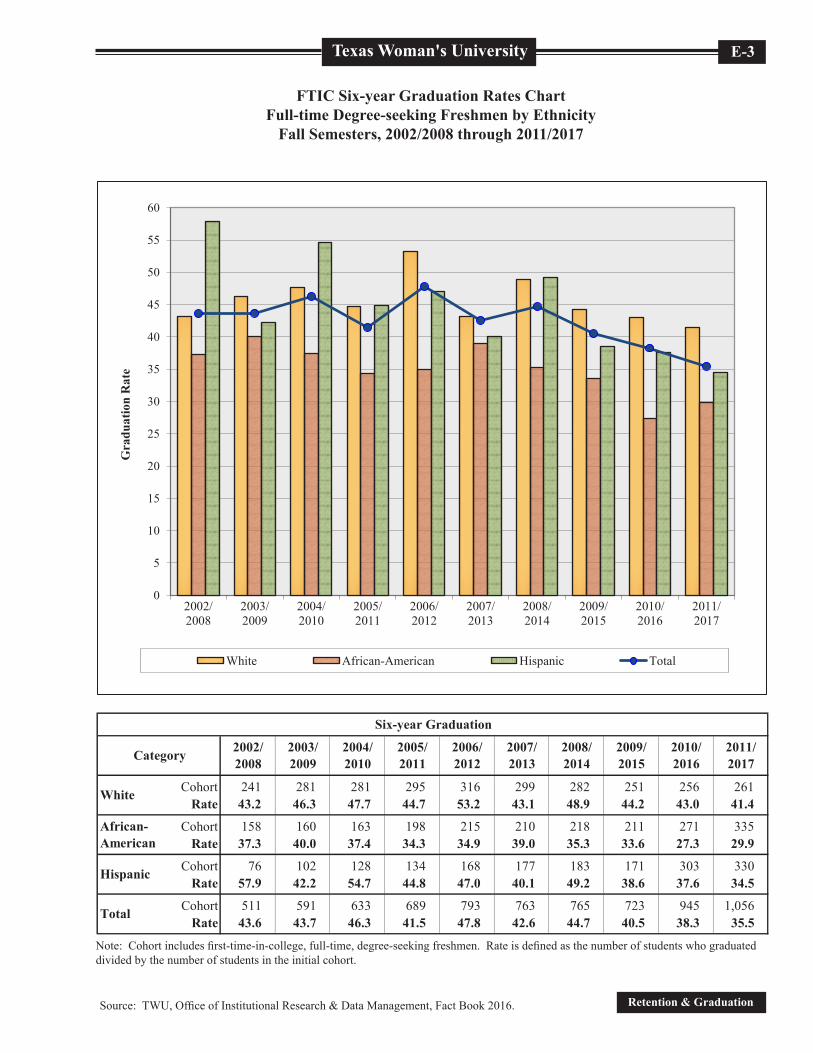
FTIC Six-year Graduation Rates ChartFull-time Degree-seeking Freshmen by Ethnicity
Fall Semesters, 2002/2008 through 2011/2017FTIC Freshmen Six-year Graduation Rates Chart
Fall Semesters, 2002/2008 through 2011/2017
Note: Cohort includes first-time-in-college, full-time, degree-seeking freshmen. Rate is defined as the number of students who graduated divided by the number of students in the initial cohort.
Cohort 241 281 281 295 316 299 282 251 256 261Rate 43.2 46.3 47.7 44.7 53.2 43.1 48.9 44.2 43.0 41.4
Cohort 158 160 163 198 215 210 218 211 271 335Rate 37.3 40.0 37.4 34.3 34.9 39.0 35.3 33.6 27.3 29.9
Cohort 76 102 128 134 168 177 183 171 303 330Rate 57.9 42.2 54.7 44.8 47.0 40.1 49.2 38.6 37.6 34.5
Cohort 511 591 633 689 793 763 765 723 945 1,056Rate 43.6 43.7 46.3 41.5 47.8 42.6 44.7 40.5 38.3 35.5
2004/ 2010
African-American
Hispanic
2002/ 2008
2003/ 2009
2011/ 2017
2005/ 2011
Six-year Graduation
Category 2009/ 2015
Total
White
2010/ 2016
2008/ 2014
2007/ 2013
2006/ 2012
0
5
10
15
20
25
30
35
40
45
50
55
60
2002/2008
2003/2009
2004/2010
2005/2011
2006/2012
2007/2013
2008/2014
2009/2015
2010/2016
2011/2017
White African-American Hispanic Total
Gra
duat
ion
Rat
e
Texas Woman's University
Retention & Graduation
E-4
Source: TWU, Office of Institutional Research & Data Manangement, Fact Book 2016.
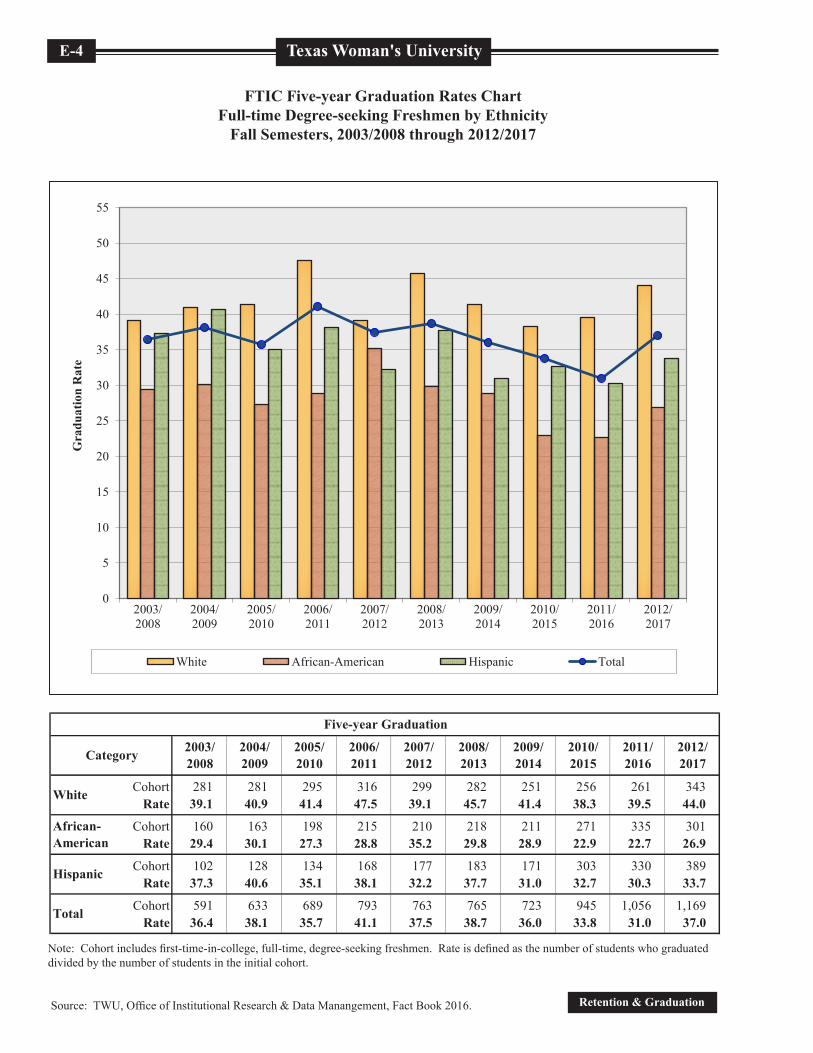
FTIC Five-year Graduation Rates ChartFull-time Degree-seeking Freshmen by Ethnicity
Fall Semesters, 2003/2008 through 2012/2017FTIC Freshmen Five-year Graduation Rates Chart
Fall Semesters, 2003/2008 through 2012/2017
Note: Cohort includes first-time-in-college, full-time, degree-seeking freshmen. Rate is defined as the number of students who graduated divided by the number of students in the initial cohort.
Cohort 281 281 295 316 299 282 251 256 261 343Rate 39.1 40.9 41.4 47.5 39.1 45.7 41.4 38.3 39.5 44.0
Cohort 160 163 198 215 210 218 211 271 335 301Rate 29.4 30.1 27.3 28.8 35.2 29.8 28.9 22.9 22.7 26.9
Cohort 102 128 134 168 177 183 171 303 330 389Rate 37.3 40.6 35.1 38.1 32.2 37.7 31.0 32.7 30.3 33.7
Cohort 591 633 689 793 763 765 723 945 1,056 1,169Rate 36.4 38.1 35.7 41.1 37.5 38.7 36.0 33.8 31.0 37.0
2005/ 2010
2011/ 2016
2009/ 2014
2008/ 2013
Total
Hispanic
2006/ 2011
2003/ 2008
2004/ 2009
White
Category
African-American
Five-year Graduation
2012/ 2017
2010/ 2015
2007/ 2012
0
5
10
15
20
25
30
35
40
45
50
55
2003/2008
2004/2009
2005/2010
2006/2011
2007/2012
2008/2013
2009/2014
2010/2015
2011/2016
2012/2017
White African-American Hispanic Total
Gra
duat
ion
Rat
e
Texas Woman's University E-5
Retention & GraduationSource: TWU, Office of Institutional Research & Data Management, Fact Book 2016.
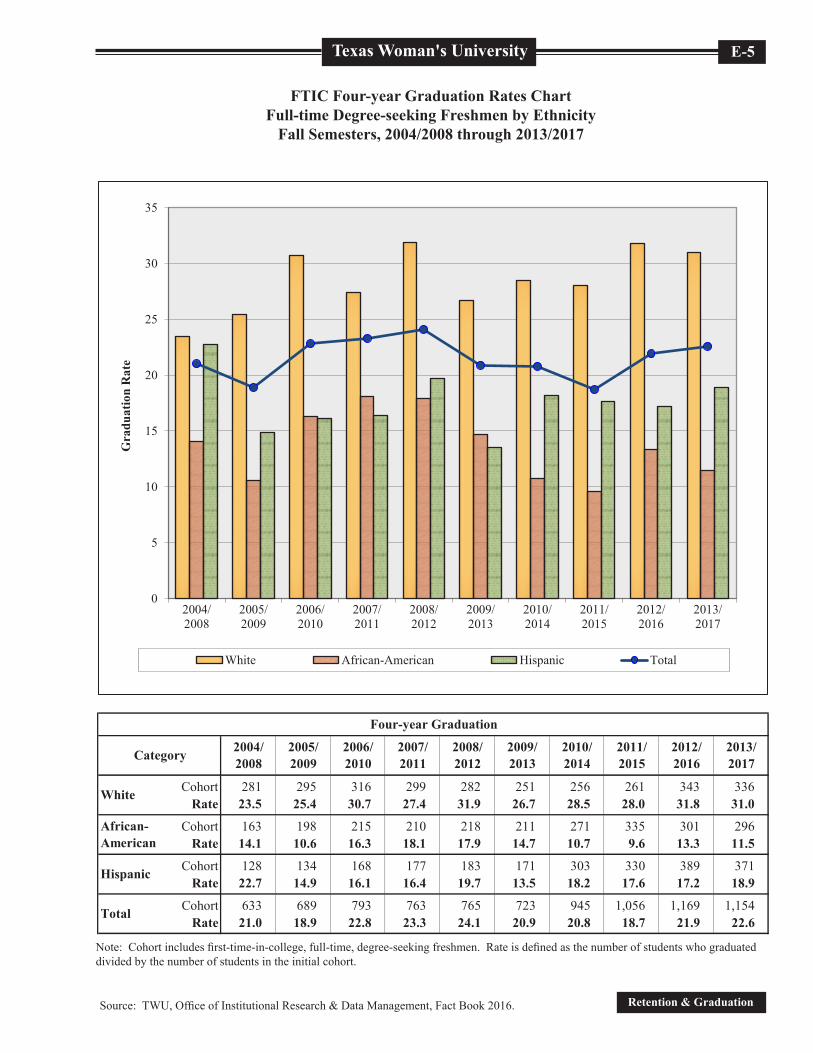
FTIC Four-year Graduation Rates ChartFull-time Degree-seeking Freshmen by Ethnicity
Fall Semesters, 2004/2008 through 2013/2017FTIC Freshmen Four-year Graduation Rates Chart
Fall Semesters, 2004/2008 through 2013/2017
Note: Cohort includes first-time-in-college, full-time, degree-seeking freshmen. Rate is defined as the number of students who graduated divided by the number of students in the initial cohort.
Cohort 281 295 316 299 282 251 256 261 343 336Rate 23.5 25.4 30.7 27.4 31.9 26.7 28.5 28.0 31.8 31.0
Cohort 163 198 215 210 218 211 271 335 301 296Rate 14.1 10.6 16.3 18.1 17.9 14.7 10.7 9.6 13.3 11.5
Cohort 128 134 168 177 183 171 303 330 389 371Rate 22.7 14.9 16.1 16.4 19.7 13.5 18.2 17.6 17.2 18.9
Cohort 633 689 793 763 765 723 945 1,056 1,169 1,154Rate 21.0 18.9 22.8 23.3 24.1 20.9 20.8 18.7 21.9 22.6
2012/ 2016
2010/ 2014
2009/ 2013
2008/ 2012
Total
Hispanic
2005/ 2009
2013/ 2017
African-American
White
Category 2011/ 2015
2007/ 2011
2006/ 2010
2004/ 2008
Four-year Graduation
0
5
10
15
20
25
30
35
2004/2008
2005/2009
2006/2010
2007/2011
2008/2012
2009/2013
2010/2014
2011/2015
2012/2016
2013/2017
White African-American Hispanic Total
Gra
duat
ion
Rat
e
Texas Woman's University
Retention & Graduation
E-6
Source: TWU, Office of Institutional Research & Data Manangement, Fact Book 2016.
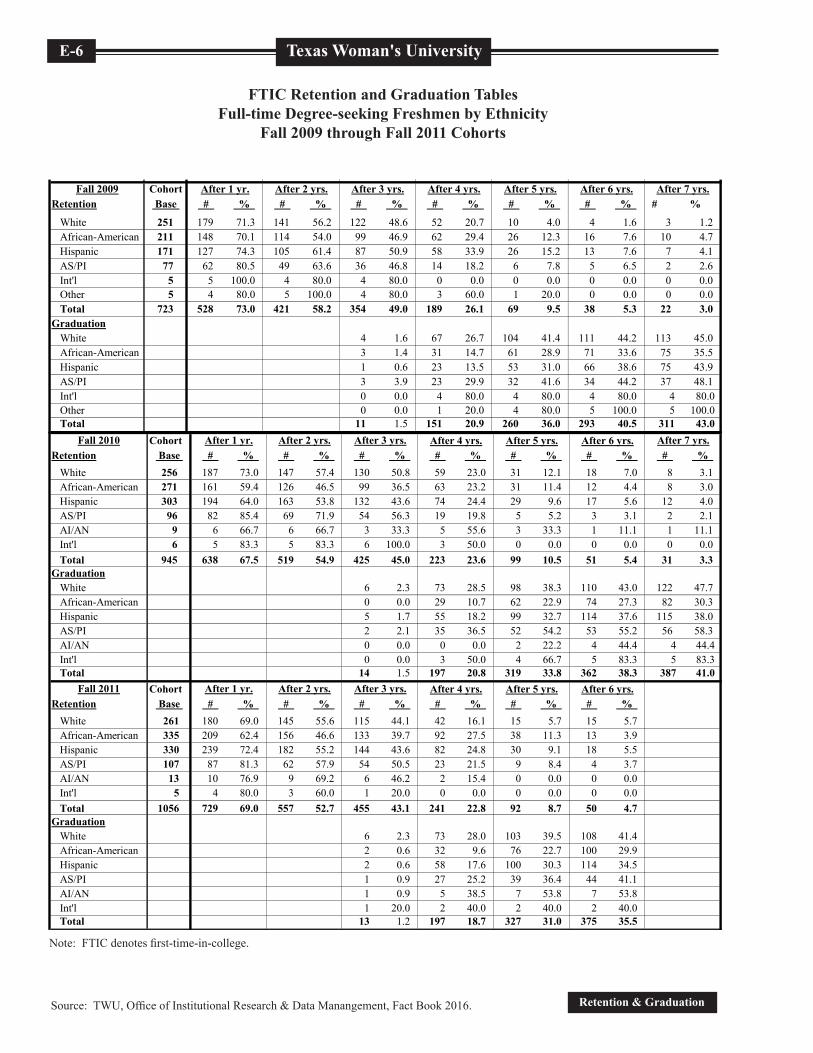
FTIC Retention and Graduation TablesFull-time Degree-seeking Freshmen by Ethnicity
Fall 2009 through Fall 2011 CohortsFTIC Freshmen Retention and Graduation Tables
Fall 2009 through Fall 2011 Cohorts
Note: FTIC denotes first-time-in-college.
Cohort After 4 yrs. After 5 yrs. After 6 yrs.Retention Base # % # % # % # % # % # % # %
White 256 187 73.0 147 57.4 130 50.8 59 23.0 31 12.1 18 7.0 8 3.1African-American 271 161 59.4 126 46.5 99 36.5 63 23.2 31 11.4 12 4.4 8 3.0Hispanic 303 194 64.0 163 53.8 132 43.6 74 24.4 29 9.6 17 5.6 12 4.0AS/PI 96 82 85.4 69 71.9 54 56.3 19 19.8 5 5.2 3 3.1 2 2.1AI/AN 9 6 66.7 6 66.7 3 33.3 5 55.6 3 33.3 1 11.1 1 11.1Int'l 6 5 83.3 5 83.3 6 100.0 3 50.0 0 0.0 0 0.0 0 0.0Total 945 638 67.5 519 54.9 425 45.0 223 23.6 99 10.5 51 5.4 31 3.3
GraduationWhite 6 2.3 73 28.5 98 38.3 110 43.0 122 47.7African-American 0 0.0 29 10.7 62 22.9 74 27.3 82 30.3Hispanic 5 1.7 55 18.2 99 32.7 114 37.6 115 38.0AS/PI 2 2.1 35 36.5 52 54.2 53 55.2 56 58.3AI/AN 0 0.0 0 0.0 2 22.2 4 44.4 4 44.4Int'l 0 0.0 3 50.0 4 66.7 5 83.3 5 83.3Total 14 1.5 197 20.8 319 33.8 362 38.3 387 41.0
Cohort After 4 yrs. After 5 yrs. After 6 yrs. Retention Base # % # % # % # % # % # %
White 261 180 69.0 145 55.6 115 44.1 42 16.1 15 5.7 15 5.7African-American 335 209 62.4 156 46.6 133 39.7 92 27.5 38 11.3 13 3.9Hispanic 330 239 72.4 182 55.2 144 43.6 82 24.8 30 9.1 18 5.5AS/PI 107 87 81.3 62 57.9 54 50.5 23 21.5 9 8.4 4 3.7AI/AN 13 10 76.9 9 69.2 6 46.2 2 15.4 0 0.0 0 0.0Int'l 5 4 80.0 3 60.0 1 20.0 0 0.0 0 0.0 0 0.0Total 1056 729 69.0 557 52.7 455 43.1 241 22.8 92 8.7 50 4.7
GraduationWhite 6 2.3 73 28.0 103 39.5 108 41.4African-American 2 0.6 32 9.6 76 22.7 100 29.9Hispanic 2 0.6 58 17.6 100 30.3 114 34.5AS/PI 1 0.9 27 25.2 39 36.4 44 41.1AI/AN 1 0.9 5 38.5 7 53.8 7 53.8Int'l 1 20.0 2 40.0 2 40.0 2 40.0Total 13 1.2 197 18.7 327 31.0 375 35.5
Cohort After 4 yrs. After 5 yrs. Retention Base # % # % # % # % # %
White 343 250 72.9 197 57.4 159 46.4 67 19.5 23 6.7African-American 301 204 67.8 141 46.8 122 40.5 84 27.9 26 8.6Hispanic 389 283 72.8 224 57.6 188 48.3 116 29.8 45 11.6AS/PI 114 99 86.8 73 64.0 67 58.8 35 30.7 10 8.8AI/AN 13 9 69.2 9 69.2 8 61.5 3 23.1 0 0.0Other 6 3 50.0 2 33.3 2 33.3 1 16.7 0 0.0Total 1169 850 72.7 648 55.4 547 46.8 307 26.3 104 8.9
GraduationWhite 17 5.0 109 31.8 151 44.0African-American 7 2.3 40 13.3 81 26.9Hispanic 9 2.3 67 17.2 131 33.7AS/PI 6 5.3 35 30.7 58 50.9AI/AN 0 0.0 4 30.8 7 53.8Other 0 0.0 1 16.7 3 50.0Total 39 3.3 256 21.9 432 37.0
Fall 2011 After 1 yr.
After 7 yrs.
After 3 yrs.
After 2 yrs.
After 2 yrs.
After 3 yrs.
After 3 yrs.
Fall 2012 After 1 yr.
Fall 2010 After 1 yr. After 2 yrs.
FTIC_Tables
12/8/2017
Cohort After 3 yrs. After 4 yrs. After 5 yrs. After 6 yrs.Retention Base # % # % # % # % # % # % # %
White 299 203 67.9 169 56.5 141 47.2 61 20.4 25 8.4 14 4.7 10 3.3African-American 210 153 72.9 115 54.8 100 47.6 62 29.5 22 10.5 6 2.9 3 1.4Hispanic 177 113 63.8 95 53.7 83 46.9 54 30.5 20 11.3 6 3.4 7 4.0AS/PI 66 55 83.3 49 74.2 41 62.1 17 25.8 7 10.6 2 3.0 3 4.5AI/AN 5 4 80.0 4 80.0 3 60.0 1 20.0 0 0.0 0 0.0 0 0.0Int'l 5 3 60.0 3 60.0 3 60.0 0 0.0 0 0.0 0 0.0 0 0.0Total 763 532 69.7 436 57.1 372 48.8 196 25.7 74 9.7 28 3.7 23 3.0
GraduationWhite 8 2.7 82 27.4 117 39.1 129 43.1 135 45.2African-American 2 1.0 38 18.1 74 35.2 82 39.0 86 41.0Hispanic 2 1.1 29 16.4 57 32.2 71 40.1 72 40.7AS/PI 2 3.0 25 37.9 32 48.5 37 56.1 37 56.1AI/AN 0 0.0 1 20.0 2 40.0 2 40.0 2 40.0Int'l 0 0.0 3 60.0 3 60.0 3 60.0 3 60.0Total 14 1.8 178 23.3 286 37.5 325 42.6 336 44.0
Cohort After 4 yrs. After 5 yrs. After 6 yrs.Retention Base # % # % # % # % # % # % # %
White 282 206 73.0 173 61.3 155 55.0 62 22.0 20 7.1 11 3.9 5 1.8African-American 218 155 71.1 126 57.8 99 45.4 59 27.1 27 12.4 11 5.0 6 2.8Hispanic 183 141 77.0 124 67.8 106 57.9 67 36.6 30 16.4 6 3.3 2 1.1AS/PI 72 65 90.3 52 72.2 42 58.3 25 34.7 12 16.7 6 8.3 2 2.8AI/AN 4 3 75.0 3 75.0 2 50.0 1 25.0 0 0.0 0 0.0 0 0.0Other 4 4 100.0 3 75.0 3 75.0 2 50.0 1 25.0 0 0.0 0 0.0Total 765 576 75.3 483 63.1 409 53.5 218 28.5 90 11.8 34 4.4 15 2.0
GraduationWhite 7 2.5 90 31.9 129 45.7 138 48.9 145 51.4African-American 5 2.3 39 17.9 65 29.8 77 35.3 84 38.5Hispanic 3 1.6 36 19.7 69 37.7 90 49.2 93 50.8AS/PI 1 1.4 17 23.6 28 38.9 32 44.4 37 51.4AI/AN 0 0.0 1 25.0 1 25.0 1 25.0 1 25.0Other 0 0.0 1 25.0 2 50.0 2 50.0 2 50.0Total 16 2.1 184 24.1 296 38.7 342 44.7 364 47.6
Cohort After 4 yrs. After 5 yrs. After 6 yrs.Retention Base # % # % # % # % # % # % # %
White 251 179 71.3 141 56.2 122 48.6 52 20.7 10 4.0 4 1.6 3 1.2African-American 211 148 70.1 114 54.0 99 46.9 62 29.4 26 12.3 16 7.6 10 4.7Hispanic 171 127 74.3 105 61.4 87 50.9 58 33.9 26 15.2 13 7.6 7 4.1AS/PI 77 62 80.5 49 63.6 36 46.8 14 18.2 6 7.8 5 6.5 2 2.6Int'l 5 5 100.0 4 80.0 4 80.0 0 0.0 0 0.0 0 0.0 0 0.0Other 5 4 80.0 5 100.0 4 80.0 3 60.0 1 20.0 0 0.0 0 0.0Total 723 528 73.0 421 58.2 354 49.0 189 26.1 69 9.5 38 5.3 22 3.0
GraduationWhite 4 1.6 67 26.7 104 41.4 111 44.2 113 45.0African-American 3 1.4 31 14.7 61 28.9 71 33.6 75 35.5Hispanic 1 0.6 23 13.5 53 31.0 66 38.6 75 43.9AS/PI 3 3.9 23 29.9 32 41.6 34 44.2 37 48.1Int'l 0 0.0 4 80.0 4 80.0 4 80.0 4 80.0Other 0 0.0 1 20.0 4 80.0 5 100.0 5 100.0Total 11 1.5 151 20.9 260 36.0 293 40.5 311 43.0
After 7 yrs.
After 7 yrs.
Fall 2007 After 1 yr. After 2 yrs.
Fall 2008 After 1 yr.
Fall 2009 After 1 yr.
After 2 yrs.
After 7 yrs.After 3 yrs.
After 3 yrs.
After 2 yrs.
FTIC_Tables
12/8/2017
Texas Woman's University E-7
Retention & GraduationSource: TWU, Office of Institutional Research & Data Management, Fact Book 2016.
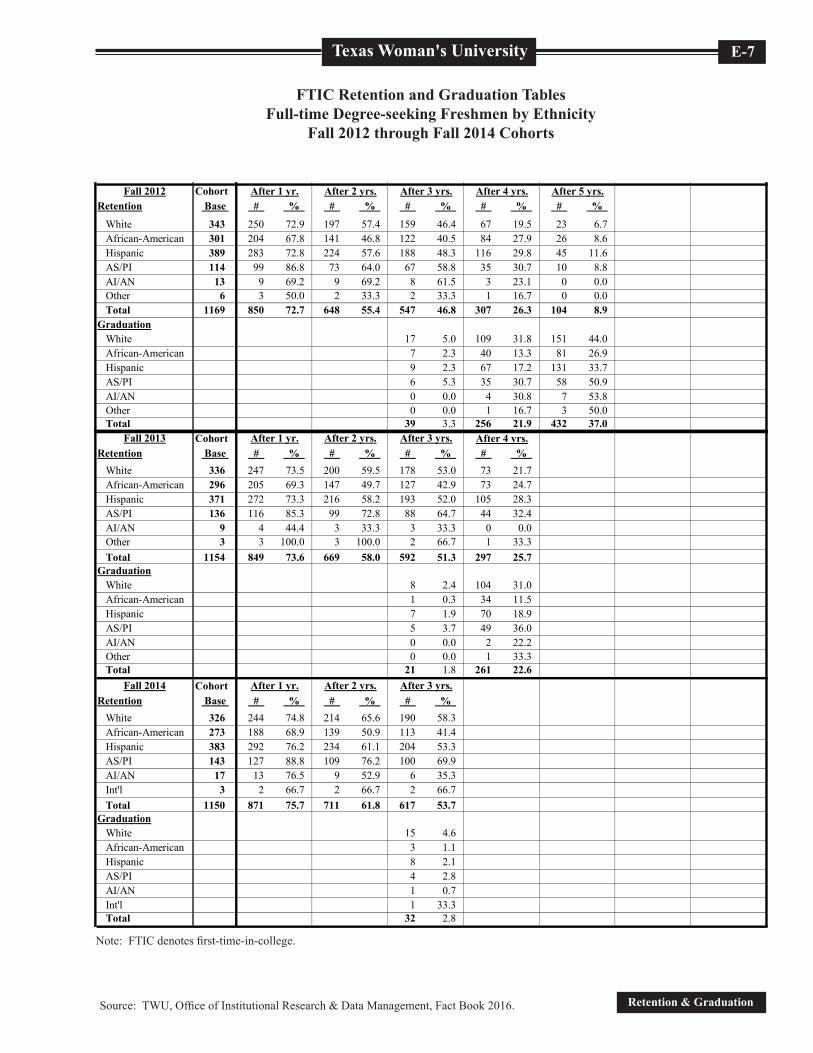
Note: FTIC denotes first-time-in-college.
FTIC Retention and Graduation TablesFull-time Degree-seeking Freshmen by Ethnicity
Fall 2012 through Fall 2014 Cohorts
Cohort After 4 yrs. After 5 yrs. After 6 yrs.Retention Base # % # % # % # % # % # % # %
White 256 187 73.0 147 57.4 130 50.8 59 23.0 31 12.1 18 7.0 8 3.1African-American 271 161 59.4 126 46.5 99 36.5 63 23.2 31 11.4 12 4.4 8 3.0Hispanic 303 194 64.0 163 53.8 132 43.6 74 24.4 29 9.6 17 5.6 12 4.0AS/PI 96 82 85.4 69 71.9 54 56.3 19 19.8 5 5.2 3 3.1 2 2.1AI/AN 9 6 66.7 6 66.7 3 33.3 5 55.6 3 33.3 1 11.1 1 11.1Int'l 6 5 83.3 5 83.3 6 100.0 3 50.0 0 0.0 0 0.0 0 0.0Total 945 638 67.5 519 54.9 425 45.0 223 23.6 99 10.5 51 5.4 31 3.3
GraduationWhite 6 2.3 73 28.5 98 38.3 110 43.0 122 47.7African-American 0 0.0 29 10.7 62 22.9 74 27.3 82 30.3Hispanic 5 1.7 55 18.2 99 32.7 114 37.6 115 38.0AS/PI 2 2.1 35 36.5 52 54.2 53 55.2 56 58.3AI/AN 0 0.0 0 0.0 2 22.2 4 44.4 4 44.4Int'l 0 0.0 3 50.0 4 66.7 5 83.3 5 83.3Total 14 1.5 197 20.8 319 33.8 362 38.3 387 41.0
Cohort After 4 yrs. After 5 yrs. After 6 yrs. Retention Base # % # % # % # % # % # %
White 261 180 69.0 145 55.6 115 44.1 42 16.1 15 5.7 15 5.7African-American 335 209 62.4 156 46.6 133 39.7 92 27.5 38 11.3 13 3.9Hispanic 330 239 72.4 182 55.2 144 43.6 82 24.8 30 9.1 18 5.5AS/PI 107 87 81.3 62 57.9 54 50.5 23 21.5 9 8.4 4 3.7AI/AN 13 10 76.9 9 69.2 6 46.2 2 15.4 0 0.0 0 0.0Int'l 5 4 80.0 3 60.0 1 20.0 0 0.0 0 0.0 0 0.0Total 1056 729 69.0 557 52.7 455 43.1 241 22.8 92 8.7 50 4.7
GraduationWhite 6 2.3 73 28.0 103 39.5 108 41.4African-American 2 0.6 32 9.6 76 22.7 100 29.9Hispanic 2 0.6 58 17.6 100 30.3 114 34.5AS/PI 1 0.9 27 25.2 39 36.4 44 41.1AI/AN 1 0.9 5 38.5 7 53.8 7 53.8Int'l 1 20.0 2 40.0 2 40.0 2 40.0Total 13 1.2 197 18.7 327 31.0 375 35.5
Cohort After 4 yrs. After 5 yrs. Retention Base # % # % # % # % # %
White 343 250 72.9 197 57.4 159 46.4 67 19.5 23 6.7African-American 301 204 67.8 141 46.8 122 40.5 84 27.9 26 8.6Hispanic 389 283 72.8 224 57.6 188 48.3 116 29.8 45 11.6AS/PI 114 99 86.8 73 64.0 67 58.8 35 30.7 10 8.8AI/AN 13 9 69.2 9 69.2 8 61.5 3 23.1 0 0.0Other 6 3 50.0 2 33.3 2 33.3 1 16.7 0 0.0Total 1169 850 72.7 648 55.4 547 46.8 307 26.3 104 8.9
GraduationWhite 17 5.0 109 31.8 151 44.0African-American 7 2.3 40 13.3 81 26.9Hispanic 9 2.3 67 17.2 131 33.7AS/PI 6 5.3 35 30.7 58 50.9AI/AN 0 0.0 4 30.8 7 53.8Other 0 0.0 1 16.7 3 50.0Total 39 3.3 256 21.9 432 37.0
Fall 2011 After 1 yr.
After 7 yrs.
After 3 yrs.
After 2 yrs.
After 2 yrs.
After 3 yrs.
After 3 yrs.
Fall 2012 After 1 yr.
Fall 2010 After 1 yr. After 2 yrs.
FTIC_Tables
12/8/2017
Cohort After 4 yrs.Retention Base # % # % # % # %
White 336 247 73.5 200 59.5 178 53.0 73 21.7African-American 296 205 69.3 147 49.7 127 42.9 73 24.7Hispanic 371 272 73.3 216 58.2 193 52.0 105 28.3AS/PI 136 116 85.3 99 72.8 88 64.7 44 32.4AI/AN 9 4 44.4 3 33.3 3 33.3 0 0.0Other 3 3 100.0 3 100.0 2 66.7 1 33.3Total 1154 849 73.6 669 58.0 592 51.3 297 25.7
GraduationWhite 8 2.4 104 31.0African-American 1 0.3 34 11.5Hispanic 7 1.9 70 18.9AS/PI 5 3.7 49 36.0AI/AN 0 0.0 2 22.2Other 0 0.0 1 33.3Total 21 1.8 261 22.6
Cohort Retention Base # % # % # %
White 326 244 74.8 214 65.6 190 58.3African-American 273 188 68.9 139 50.9 113 41.4Hispanic 383 292 76.2 234 61.1 204 53.3AS/PI 143 127 88.8 109 76.2 100 69.9AI/AN 17 13 76.5 9 52.9 6 35.3Int'l 3 2 66.7 2 66.7 2 66.7Total 1150 871 75.7 711 61.8 617 53.7
GraduationWhite 15 4.6African-American 3 1.1Hispanic 8 2.1AS/PI 4 2.8AI/AN 1 0.7Int'l 1 33.3Total 32 2.8
Cohort Retention Base # % # %
White 294 241 82.0 201 68.4African-American 280 201 71.8 141 50.4Hispanic 440 353 80.2 278 63.2AS/PI 109 93 85.3 79 72.5AI/AN 12 11 91.7 7 58.3Other 8 6 75.0 6 75.0Total 1149 911 79.3 716 62.3
GraduationWhiteAfrican-AmericanHispanicAS/PIAI/ANOtherTotal
After 1 yr. After 2 yrs.
After 2 yrs.
After 3 yrs.
After 3 yrs.
Fall 2015 After 1 yr.
Fall 2013 After 1 yr. After 2 yrs.
Fall 2014
FTIC_Tables
12/8/2017
Texas Woman's University
Retention & Graduation
E-8
Source: TWU, Office of Institutional Research & Data Manangement, Fact Book 2016.
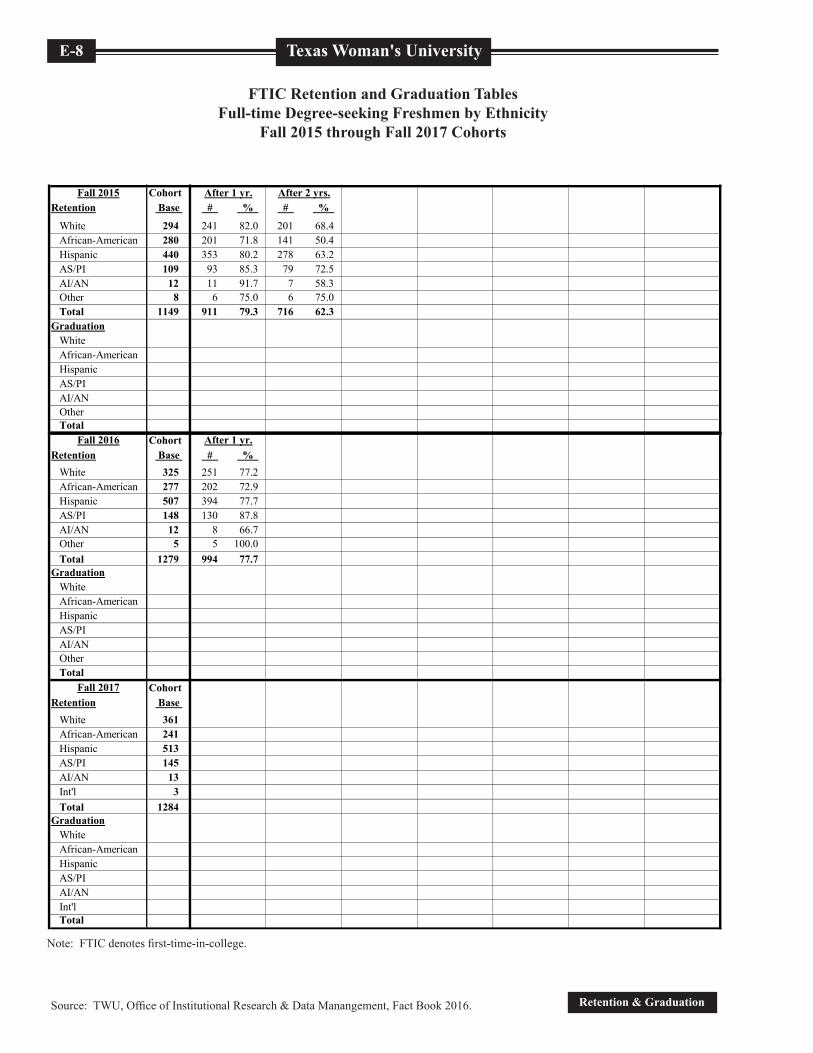
FTIC Retention and Graduation TablesFull-time Degree-seeking Freshmen by Ethnicity
Fall 2015 through Fall 2017 Cohorts
Note: FTIC denotes first-time-in-college.
CohortRetention Base # %
White 325 251 77.2African-American 277 202 72.9Hispanic 507 394 77.7AS/PI 148 130 87.8AI/AN 12 8 66.7Other 5 5 100.0Total 1279 994 77.7
GraduationWhiteAfrican-AmericanHispanicAS/PIAI/ANOtherTotal
Cohort Retention Base
White 361African-American 241Hispanic 513AS/PI 145AI/AN 13Int'l 3Total 1284
GraduationWhiteAfrican-AmericanHispanicAS/PIAI/ANInt'lTotal
Cohort Retention Base
WhiteAfrican-AmericanHispanicAS/PIAI/ANOtherTotal
GraduationWhiteAfrican-AmericanHispanicAS/PIAI/ANOtherTotal
Fall 2018
Fall 2016 After 1 yr.
Fall 2017
FTIC_Tables
12/8/2017
Cohort After 4 yrs.Retention Base # % # % # % # %
White 336 247 73.5 200 59.5 178 53.0 73 21.7African-American 296 205 69.3 147 49.7 127 42.9 73 24.7Hispanic 371 272 73.3 216 58.2 193 52.0 105 28.3AS/PI 136 116 85.3 99 72.8 88 64.7 44 32.4AI/AN 9 4 44.4 3 33.3 3 33.3 0 0.0Other 3 3 100.0 3 100.0 2 66.7 1 33.3Total 1154 849 73.6 669 58.0 592 51.3 297 25.7
GraduationWhite 8 2.4 104 31.0African-American 1 0.3 34 11.5Hispanic 7 1.9 70 18.9AS/PI 5 3.7 49 36.0AI/AN 0 0.0 2 22.2Other 0 0.0 1 33.3Total 21 1.8 261 22.6
Cohort Retention Base # % # % # %
White 326 244 74.8 214 65.6 190 58.3African-American 273 188 68.9 139 50.9 113 41.4Hispanic 383 292 76.2 234 61.1 204 53.3AS/PI 143 127 88.8 109 76.2 100 69.9AI/AN 17 13 76.5 9 52.9 6 35.3Int'l 3 2 66.7 2 66.7 2 66.7Total 1150 871 75.7 711 61.8 617 53.7
GraduationWhite 15 4.6African-American 3 1.1Hispanic 8 2.1AS/PI 4 2.8AI/AN 1 0.7Int'l 1 33.3Total 32 2.8
Cohort Retention Base # % # %
White 294 241 82.0 201 68.4African-American 280 201 71.8 141 50.4Hispanic 440 353 80.2 278 63.2AS/PI 109 93 85.3 79 72.5AI/AN 12 11 91.7 7 58.3Other 8 6 75.0 6 75.0Total 1149 911 79.3 716 62.3
GraduationWhiteAfrican-AmericanHispanicAS/PIAI/ANOtherTotal
After 1 yr. After 2 yrs.
After 2 yrs.
After 3 yrs.
After 3 yrs.
Fall 2015 After 1 yr.
Fall 2013 After 1 yr. After 2 yrs.
Fall 2014
FTIC_Tables
12/8/2017
Texas Woman's University E-9
Retention & GraduationSource: TWU, Office of Institutional Research & Data Management, Fact Book 2016.
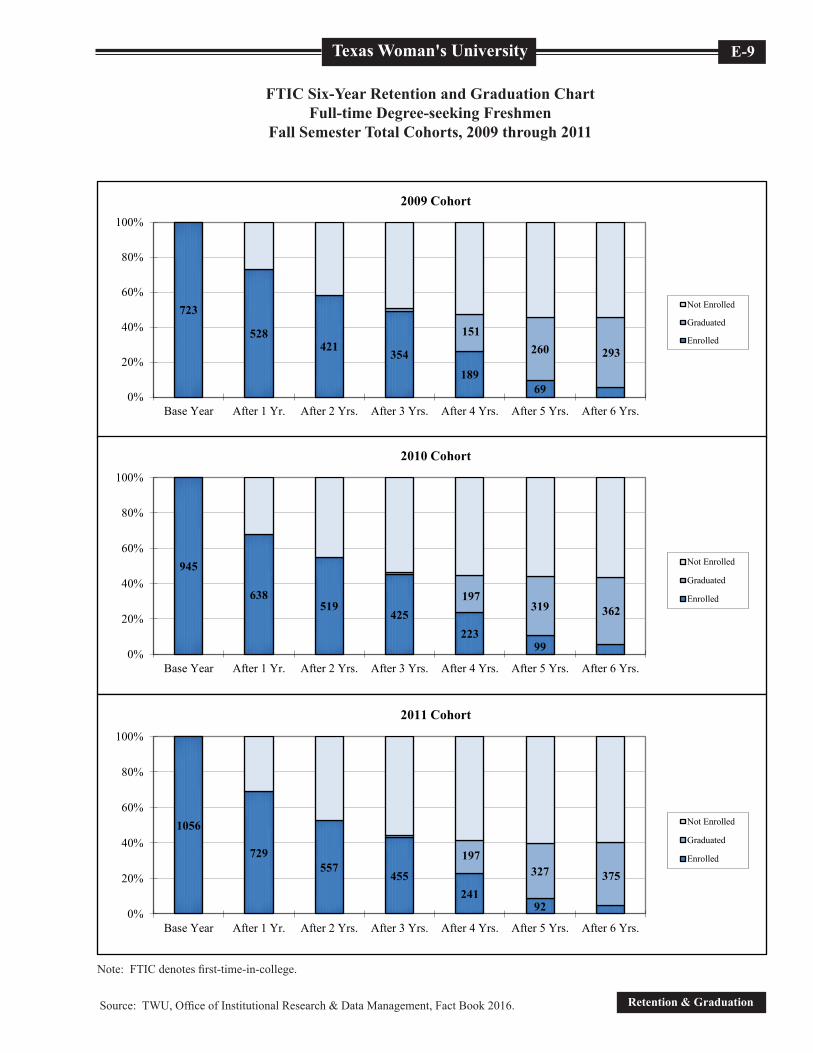
FTIC Six-Year Retention and Graduation ChartFull-time Degree-seeking Freshmen
Fall Semester Total Cohorts, 2009 through 2011FTIC Freshmen Six-Year Retention and Graduation Chart
Fall Semester Total Cohorts, 2009 through 2011
Note: FTIC denotes first-time-in-college.
723
528421
354
18969
151260 293
0%
20%
40%
60%
80%
100%
Base Year After 1 Yr. After 2 Yrs. After 3 Yrs. After 4 Yrs. After 5 Yrs. After 6 Yrs.
2009 Cohort
Not Enrolled
Graduated
Enrolled
945
638519
425223
99
197319 362
0%
20%
40%
60%
80%
100%
Base Year After 1 Yr. After 2 Yrs. After 3 Yrs. After 4 Yrs. After 5 Yrs. After 6 Yrs.
2010 Cohort
Not Enrolled
Graduated
Enrolled
1056
729557
455241
92
197327 375
0%
20%
40%
60%
80%
100%
Base Year After 1 Yr. After 2 Yrs. After 3 Yrs. After 4 Yrs. After 5 Yrs. After 6 Yrs.
2011 Cohort
Not Enrolled
Graduated
Enrolled
Texas Woman's University
Retention & Graduation
E-10
Source: TWU, Office of Institutional Research & Data Manangement, Fact Book 2016.
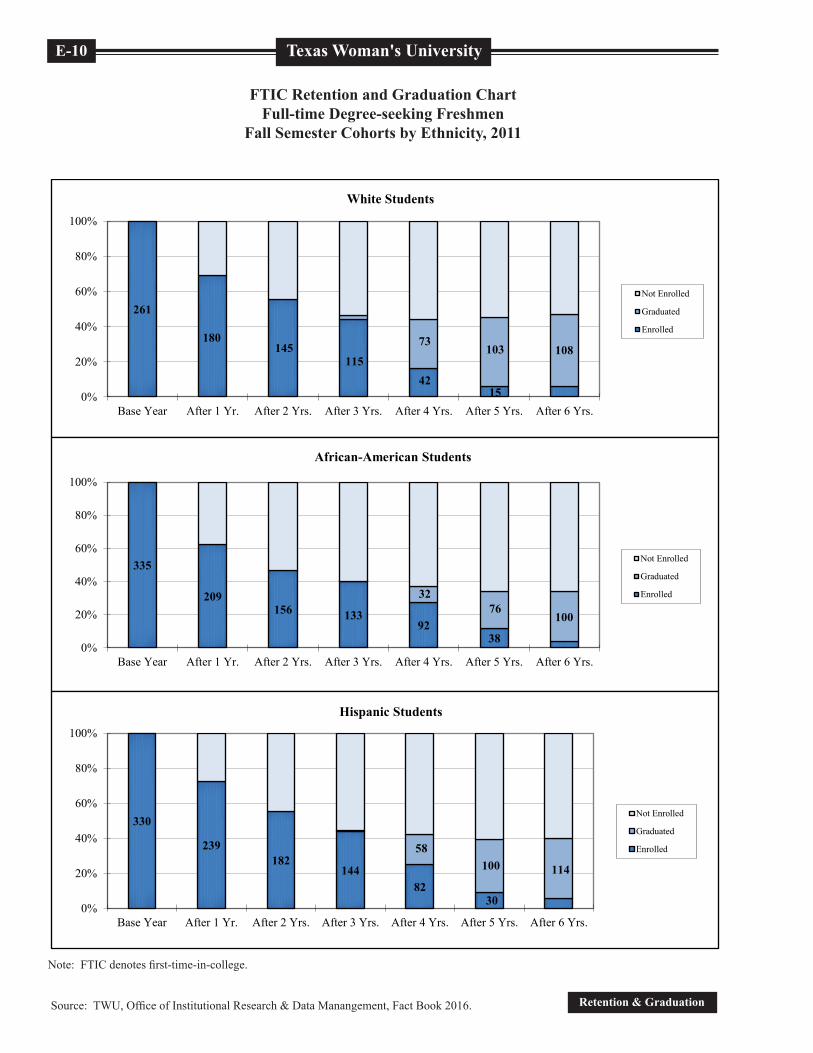
FTIC Retention and Graduation ChartFull-time Degree-seeking Freshmen
Fall Semester Cohorts by Ethnicity, 2011
Note: FTIC denotes first-time-in-college.
261
180145
11542
15
73103 108
0%
20%
40%
60%
80%
100%
Base Year After 1 Yr. After 2 Yrs. After 3 Yrs. After 4 Yrs. After 5 Yrs. After 6 Yrs.
White Students
Not Enrolled
Graduated
Enrolled
335
209156 133
9238
3276
100
0%
20%
40%
60%
80%
100%
Base Year After 1 Yr. After 2 Yrs. After 3 Yrs. After 4 Yrs. After 5 Yrs. After 6 Yrs.
African-American Students
Not Enrolled
Graduated
Enrolled
330
239182
14482
30
58100 114
0%
20%
40%
60%
80%
100%
Base Year After 1 Yr. After 2 Yrs. After 3 Yrs. After 4 Yrs. After 5 Yrs. After 6 Yrs.
Hispanic Students
Not Enrolled
Graduated
Enrolled
Texas Woman's University E-11
Retention & GraduationSource: TWU, Office of Institutional Research & Data Management, Fact Book 2016.
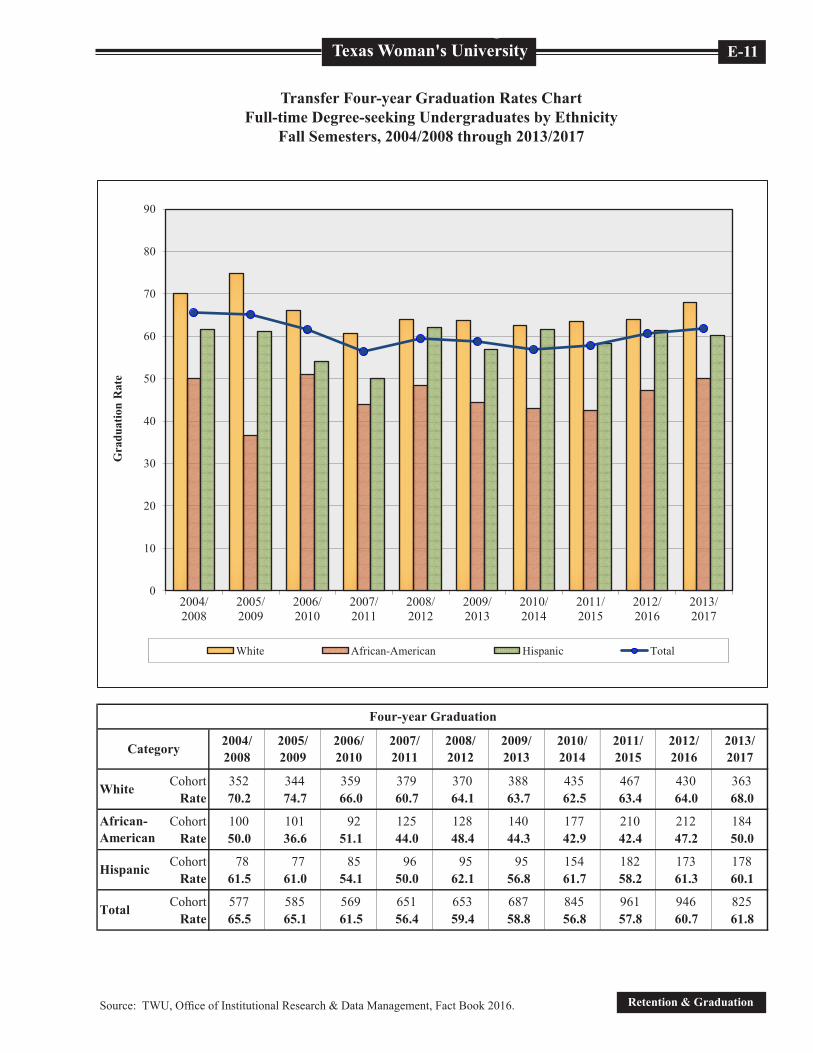
Transfer Four-year Graduation Rates ChartFull-time Degree-seeking Undergraduates by Ethnicity
Fall Semesters, 2004/2008 through 2013/2017
Transfer Students Four-year Graduation Rates ChartFall Semesters, 2004/2008 through 2013/2017
Cohort 352 344 359 379 370 388 435 467 430 363Rate 70.2 74.7 66.0 60.7 64.1 63.7 62.5 63.4 64.0 68.0
Cohort 100 101 92 125 128 140 177 210 212 184Rate 50.0 36.6 51.1 44.0 48.4 44.3 42.9 42.4 47.2 50.0
Cohort 78 77 85 96 95 95 154 182 173 178Rate 61.5 61.0 54.1 50.0 62.1 56.8 61.7 58.2 61.3 60.1
Cohort 577 585 569 651 653 687 845 961 946 825Rate 65.5 65.1 61.5 56.4 59.4 58.8 56.8 57.8 60.7 61.8
2012/ 2016
Total
White
African-American
2008/ 2012
2004/ 2008
2009/ 2013
2006/ 2010Category
Four-year Graduation
2013/ 2017
Hispanic
2007/ 2011
2011/ 2015
2010/ 2014
2005/ 2009
0
10
20
30
40
50
60
70
80
90
2004/2008
2005/2009
2006/2010
2007/2011
2008/2012
2009/2013
2010/2014
2011/2015
2012/2016
2013/2017
White African-American Hispanic Total
Gra
duat
ion
Rat
e
Source: TWU, Office of Institutional Research and Planning.12/7/2017
Trans_Grad
Texas Woman's University
Retention & Graduation
E-12
Source: TWU, Office of Institutional Research & Data Manangement, Fact Book 2016.
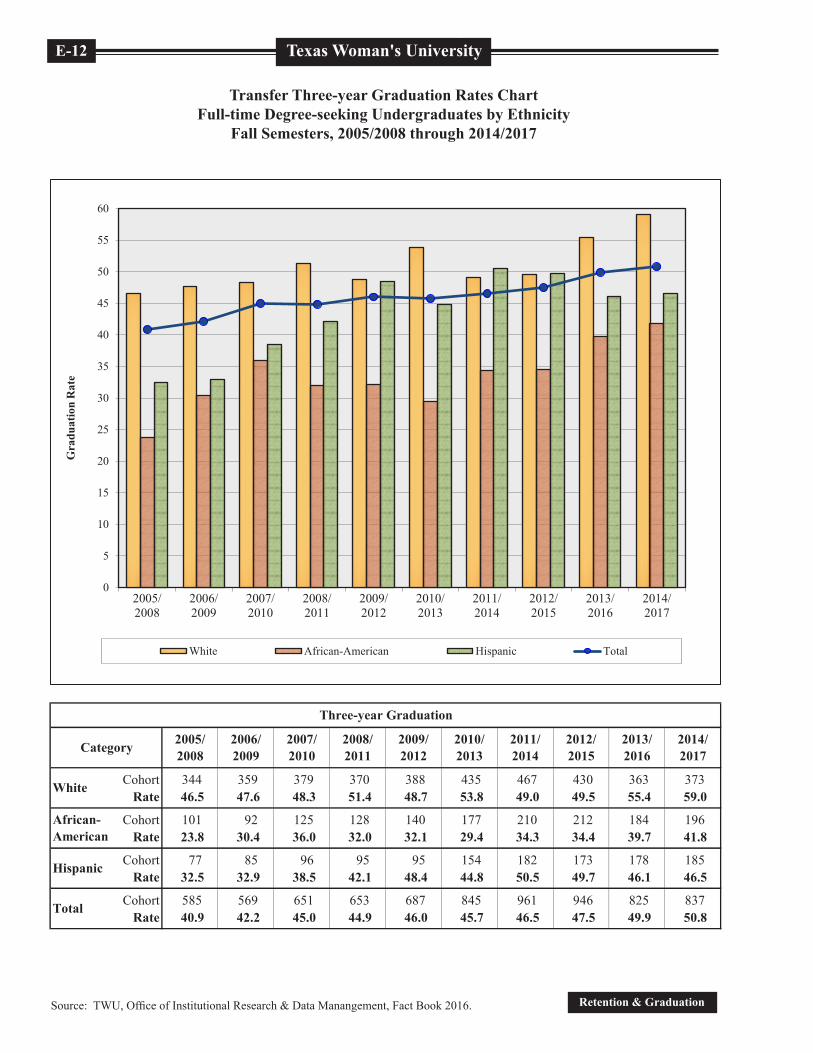
Transfer Three-year Graduation Rates ChartFull-time Degree-seeking Undergraduates by Ethnicity
Fall Semesters, 2005/2008 through 2014/2017
Transfer Students Three-year Graduation Rates ChartFall Semesters, 2005/2008 through 2014/2017
Cohort 344 359 379 370 388 435 467 430 363 373Rate 46.5 47.6 48.3 51.4 48.7 53.8 49.0 49.5 55.4 59.0
Cohort 101 92 125 128 140 177 210 212 184 196Rate 23.8 30.4 36.0 32.0 32.1 29.4 34.3 34.4 39.7 41.8
Cohort 77 85 96 95 95 154 182 173 178 185Rate 32.5 32.9 38.5 42.1 48.4 44.8 50.5 49.7 46.1 46.5
Cohort 585 569 651 653 687 845 961 946 825 837Rate 40.9 42.2 45.0 44.9 46.0 45.7 46.5 47.5 49.9 50.8
Three-year Graduation
2009/ 2012
2011/ 2014
2013/ 2016
Total
White
Category
African-American
Hispanic
2010/ 2013
2014/ 2017
2008/ 2011
2012/ 2015
2007/ 2010
2006/ 2009
2005/ 2008
0
5
10
15
20
25
30
35
40
45
50
55
60
2005/2008
2006/2009
2007/2010
2008/2011
2009/2012
2010/2013
2011/2014
2012/2015
2013/2016
2014/2017
White African-American Hispanic Total
Gra
duat
ion
Rat
e
Source: TWU, Office of Institutional Research and Planning.12/7/2017
Trans_Grad
Texas Woman's University E-13
Retention & GraduationSource: TWU, Office of Institutional Research & Data Management, Fact Book 2016.
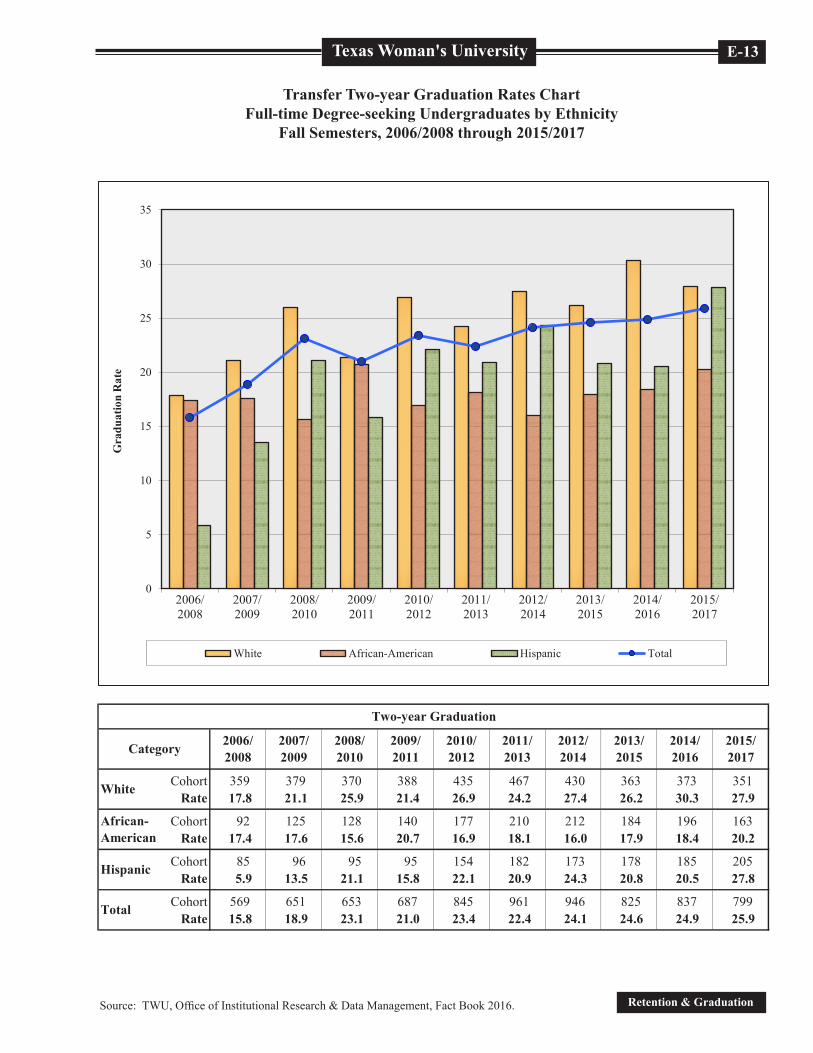
Transfer Two-year Graduation Rates ChartFull-time Degree-seeking Undergraduates by Ethnicity
Fall Semesters, 2006/2008 through 2015/2017
Cohort 359 379 370 388 435 467 430 363 373 351Rate 17.8 21.1 25.9 21.4 26.9 24.2 27.4 26.2 30.3 27.9
Cohort 92 125 128 140 177 210 212 184 196 163Rate 17.4 17.6 15.6 20.7 16.9 18.1 16.0 17.9 18.4 20.2
Cohort 85 96 95 95 154 182 173 178 185 205Rate 5.9 13.5 21.1 15.8 22.1 20.9 24.3 20.8 20.5 27.8
Cohort 569 651 653 687 845 961 946 825 837 799Rate 15.8 18.9 23.1 21.0 23.4 22.4 24.1 24.6 24.9 25.9
2011/ 2013
2012/ 2014
2008/ 2010
2006/ 2008
2010/ 2012
2015/ 2017
2014/ 2016
Two-year Graduation
2009/ 2011
2007/ 2009
2013/ 2015
Total
White
African-American
Hispanic
Category
0
5
10
15
20
25
30
35
2006/2008
2007/2009
2008/2010
2009/2011
2010/2012
2011/2013
2012/2014
2013/2015
2014/2016
2015/2017
White African-American Hispanic Total
Gra
duat
ion
Rat
e
Source: TWU, Office of Institutional Research and Planning.12/7/2017
Trans_Grad
Transfer Students Two-year Graduation Rates ChartFall Semesters, 2006/2008 through 2015/2017
Texas Woman's University
Retention & Graduation
E-14
Source: TWU, Office of Institutional Research & Data Manangement, Fact Book 2016.
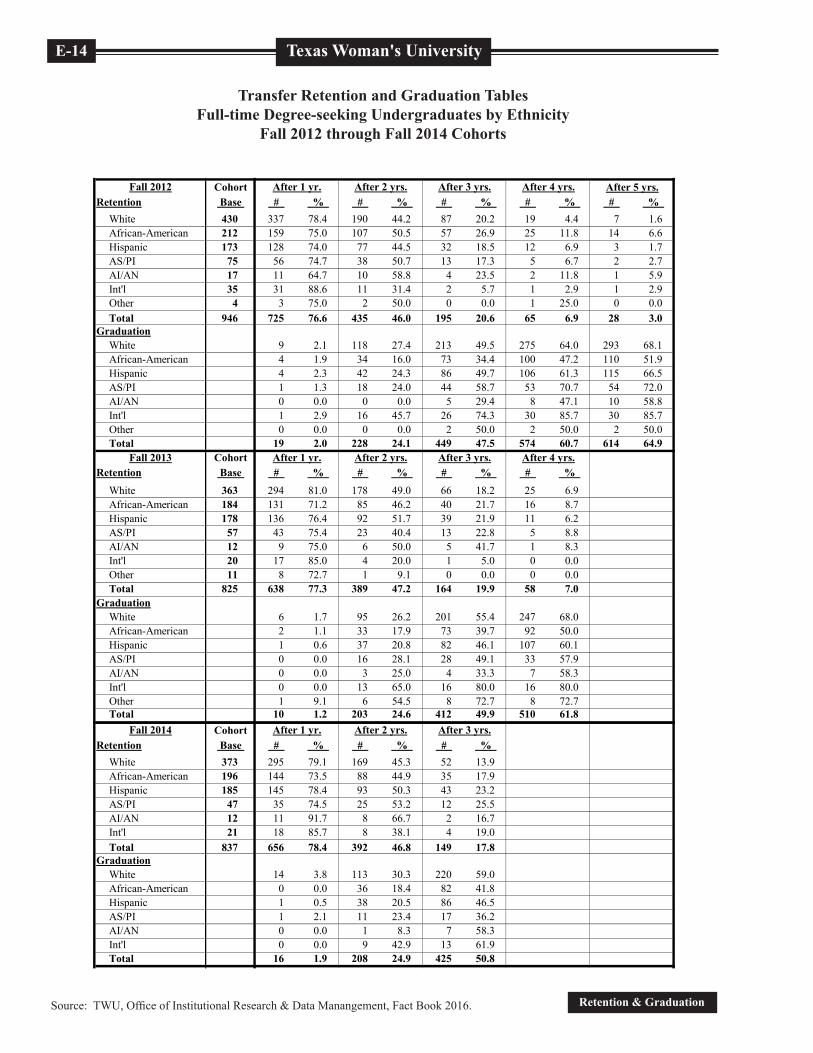
Transfer Retention and Graduation TablesFull-time Degree-seeking Undergraduates by Ethnicity
Fall 2012 through Fall 2014 CohortsTransfer Retention and Graduation Tables
Fall 2012 through Fall 2014 Cohorts
Cohort After 5 yrs.Retention Base # % # % # % # % # %
White 467 355 76.0 220 47.1 94 20.1 25 5.4 12 2.6African-American 210 153 72.9 92 43.8 47 22.4 21 10.0 8 3.8Hispanic 182 129 70.9 82 45.1 29 15.9 11 6.0 2 1.1AS/PI 58 46 79.3 25 43.1 11 19.0 4 6.9 5 8.6Int'l 25 20 80.0 10 40.0 2 8.0 1 4.0 1 4.0Other 8 7 87.5 1 12.5 0 0.0 0 0.0 0 0.0Total 961 719 74.8 433 45.1 185 19.3 63 6.6 29 3.0
GraduationWhite 9 1.9 113 24.2 229 49.0 296 63.4 312 66.8African-American 3 1.4 38 18.1 72 34.3 89 42.4 101 48.1Hispanic 5 2.7 38 20.9 92 50.5 106 58.2 115 63.2AS/PI 2 3.4 12 20.7 29 50.0 36 62.1 37 63.8Int'l 1 4.0 9 36.0 16 64.0 18 72.0 18 72.0Other 0 0.0 3 37.5 5 62.5 5 62.5 5 62.5Total 20 2.1 215 22.4 447 46.5 555 57.8 594 61.8
Cohort After 5 yrs.Retention Base # % # % # % # % # %
White 430 337 78.4 190 44.2 87 20.2 19 4.4 7 1.6African-American 212 159 75.0 107 50.5 57 26.9 25 11.8 14 6.6Hispanic 173 128 74.0 77 44.5 32 18.5 12 6.9 3 1.7AS/PI 75 56 74.7 38 50.7 13 17.3 5 6.7 2 2.7AI/AN 17 11 64.7 10 58.8 4 23.5 2 11.8 1 5.9Int'l 35 31 88.6 11 31.4 2 5.7 1 2.9 1 2.9Other 4 3 75.0 2 50.0 0 0.0 1 25.0 0 0.0Total 946 725 76.6 435 46.0 195 20.6 65 6.9 28 3.0
GraduationWhite 9 2.1 118 27.4 213 49.5 275 64.0 293 68.1African-American 4 1.9 34 16.0 73 34.4 100 47.2 110 51.9Hispanic 4 2.3 42 24.3 86 49.7 106 61.3 115 66.5AS/PI 1 1.3 18 24.0 44 58.7 53 70.7 54 72.0AI/AN 0 0.0 0 0.0 5 29.4 8 47.1 10 58.8Int'l 1 2.9 16 45.7 26 74.3 30 85.7 30 85.7Other 0 0.0 0 0.0 2 50.0 2 50.0 2 50.0Total 19 2.0 228 24.1 449 47.5 574 60.7 614 64.9
CohortRetention Base # % # % # % # %
White 363 294 81.0 178 49.0 66 18.2 25 6.9African-American 184 131 71.2 85 46.2 40 21.7 16 8.7Hispanic 178 136 76.4 92 51.7 39 21.9 11 6.2AS/PI 57 43 75.4 23 40.4 13 22.8 5 8.8AI/AN 12 9 75.0 6 50.0 5 41.7 1 8.3Int'l 20 17 85.0 4 20.0 1 5.0 0 0.0Other 11 8 72.7 1 9.1 0 0.0 0 0.0Total 825 638 77.3 389 47.2 164 19.9 58 7.0
GraduationWhite 6 1.7 95 26.2 201 55.4 247 68.0African-American 2 1.1 33 17.9 73 39.7 92 50.0Hispanic 1 0.6 37 20.8 82 46.1 107 60.1AS/PI 0 0.0 16 28.1 28 49.1 33 57.9AI/AN 0 0.0 3 25.0 4 33.3 7 58.3Int'l 0 0.0 13 65.0 16 80.0 16 80.0Other 1 9.1 6 54.5 8 72.7 8 72.7Total 10 1.2 203 24.6 412 49.9 510 61.8
Fall 2011 After 1 yr. After 2 yrs. After 3 yrs.
Fall 2012
Fall 2013
After 4 yrs.
After 3 yrs.
After 1 yr. After 2 yrs.
After 4 yrs.
After 3 yrs.
After 2 yrs. After 4 yrs.After 1 yr.
Trans_Tables
12/8/2017
CohortRetention Base # % # % # %
White 373 295 79.1 169 45.3 52 13.9African-American 196 144 73.5 88 44.9 35 17.9Hispanic 185 145 78.4 93 50.3 43 23.2AS/PI 47 35 74.5 25 53.2 12 25.5AI/AN 12 11 91.7 8 66.7 2 16.7Int'l 21 18 85.7 8 38.1 4 19.0Total 837 656 78.4 392 46.8 149 17.8
GraduationWhite 14 3.8 113 30.3 220 59.0African-American 0 0.0 36 18.4 82 41.8Hispanic 1 0.5 38 20.5 86 46.5AS/PI 1 2.1 11 23.4 17 36.2AI/AN 0 0.0 1 8.3 7 58.3Int'l 0 0.0 9 42.9 13 61.9Total 16 1.9 208 24.9 425 50.8
CohortRetention Base # % # %
White 351 281 80.1 158 45.0African-American 163 120 73.6 60 36.8Hispanic 205 167 81.5 89 43.4AS/PI 57 45 78.9 22 38.6AI/AN 8 7 87.5 6 75.0Int'l 9 6 66.7 4 44.4Other 6 4 66.7 5 83.3Total 799 630 78.8 344 43.1
GraduationWhite 8 2.3 98 27.9African-American 3 1.8 33 20.2Hispanic 4 2.0 57 27.8AS/PI 1 1.8 16 28.1AI/AN 0 0.0 1 12.5Int'l 0 0.0 2 22.2Other 0 0.0 0 0.0Total 16 2.0 207 25.9
CohortRetention Base # %
White 354 258 72.9African-American 175 123 70.3Hispanic 217 164 75.6AS/PI 68 54 79.4AI/AN 9 6 66.7Int'l 11 10 90.9Other 5 3 60.0Total 839 618 73.7
GraduationWhite 9 2.5African-American 1 0.6Hispanic 3 1.4AS/PI 2 2.9AI/AN 0 0.0Int'l 0 0.0Other 0 0.0Total 15 1.8
Fall 2016 After 1 yr.
Fall 2014 After 1 yr. After 2 yrs. After 3 yrs.
Fall 2015 After 1 yr. After 2 yrs.
Trans_Tables
12/8/2017
Texas Woman's University E-15
Retention & GraduationSource: TWU, Office of Institutional Research & Data Management, Fact Book 2016.
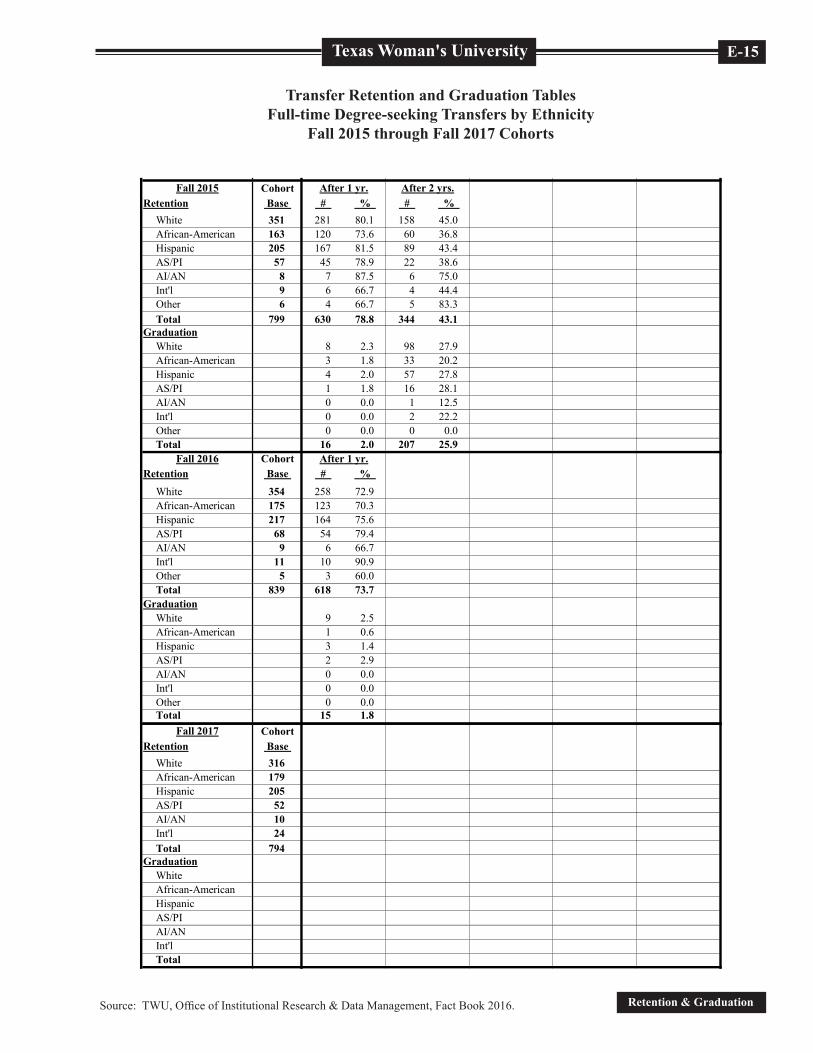
Transfer Retention and Graduation TablesFull-time Degree-seeking Transfers by Ethnicity
Fall 2015 through Fall 2017 Cohorts
CohortRetention Base
White 316African-American 179Hispanic 205AS/PI 52AI/AN 10Int'l 24Total 794
GraduationWhiteAfrican-AmericanHispanicAS/PIAI/ANInt'lTotal
CohortRetention Base
WhiteAfrican-AmericanHispanicAS/PIAI/ANInt'lOtherTotal
GraduationWhiteAfrican-AmericanHispanicAS/PIAI/ANInt'lOtherTotal
CohortRetention Base
WhiteAfrican-AmericanHispanicAS/PIAI/ANInt'lOtherTotal
GraduationWhiteAfrican-AmericanHispanicAS/PIAI/ANInt'lOtherTotal
Fall 2019
Fall 2017
Fall 2018
Trans_Tables
12/8/2017
CohortRetention Base # % # % # %
White 373 295 79.1 169 45.3 52 13.9African-American 196 144 73.5 88 44.9 35 17.9Hispanic 185 145 78.4 93 50.3 43 23.2AS/PI 47 35 74.5 25 53.2 12 25.5AI/AN 12 11 91.7 8 66.7 2 16.7Int'l 21 18 85.7 8 38.1 4 19.0Total 837 656 78.4 392 46.8 149 17.8
GraduationWhite 14 3.8 113 30.3 220 59.0African-American 0 0.0 36 18.4 82 41.8Hispanic 1 0.5 38 20.5 86 46.5AS/PI 1 2.1 11 23.4 17 36.2AI/AN 0 0.0 1 8.3 7 58.3Int'l 0 0.0 9 42.9 13 61.9Total 16 1.9 208 24.9 425 50.8
CohortRetention Base # % # %
White 351 281 80.1 158 45.0African-American 163 120 73.6 60 36.8Hispanic 205 167 81.5 89 43.4AS/PI 57 45 78.9 22 38.6AI/AN 8 7 87.5 6 75.0Int'l 9 6 66.7 4 44.4Other 6 4 66.7 5 83.3Total 799 630 78.8 344 43.1
GraduationWhite 8 2.3 98 27.9African-American 3 1.8 33 20.2Hispanic 4 2.0 57 27.8AS/PI 1 1.8 16 28.1AI/AN 0 0.0 1 12.5Int'l 0 0.0 2 22.2Other 0 0.0 0 0.0Total 16 2.0 207 25.9
CohortRetention Base # %
White 354 258 72.9African-American 175 123 70.3Hispanic 217 164 75.6AS/PI 68 54 79.4AI/AN 9 6 66.7Int'l 11 10 90.9Other 5 3 60.0Total 839 618 73.7
GraduationWhite 9 2.5African-American 1 0.6Hispanic 3 1.4AS/PI 2 2.9AI/AN 0 0.0Int'l 0 0.0Other 0 0.0Total 15 1.8
Fall 2016 After 1 yr.
Fall 2014 After 1 yr. After 2 yrs. After 3 yrs.
Fall 2015 After 1 yr. After 2 yrs.
Trans_Tables
12/8/2017
Texas Woman's University
Retention & Graduation
E-16
Source: TWU, Office of Institutional Research & Data Manangement, Fact Book 2016.
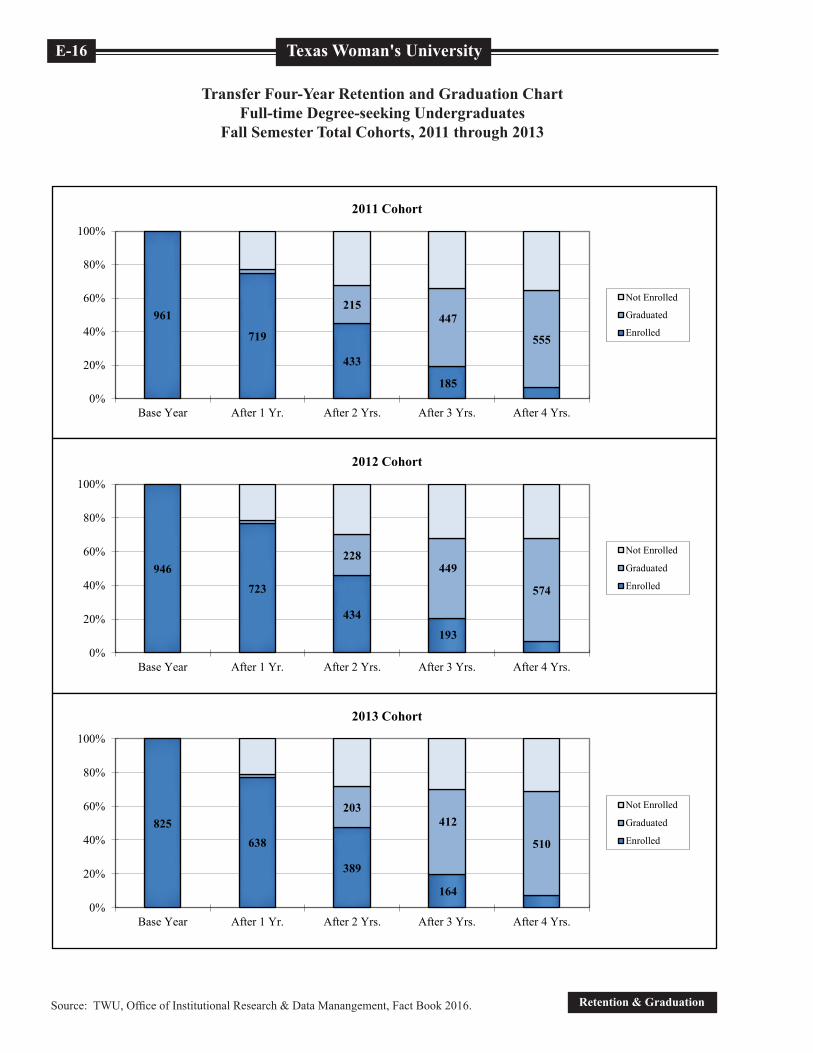
Transfer Four-Year Retention and Graduation ChartFull-time Degree-seeking Undergraduates
Fall Semester Total Cohorts, 2011 through 2013
961
719
433
185
215447
555
0%
20%
40%
60%
80%
100%
Base Year After 1 Yr. After 2 Yrs. After 3 Yrs. After 4 Yrs.
2011 Cohort
Not Enrolled
Graduated
Enrolled
946
723
434
193
228449
574
0%
20%
40%
60%
80%
100%
Base Year After 1 Yr. After 2 Yrs. After 3 Yrs. After 4 Yrs.
2012 Cohort
Not Enrolled
Graduated
Enrolled
825638
389
164
203412
510
0%
20%
40%
60%
80%
100%
Base Year After 1 Yr. After 2 Yrs. After 3 Yrs. After 4 Yrs.
2013 Cohort
Not Enrolled
Graduated
Enrolled
Transfer Four-Year Retention and Graduation ChartFall Semester Total Cohorts, 2011 through 2013
Texas Woman's University E-17
Retention & GraduationSource: TWU, Office of Institutional Research & Data Management, Fact Book 2016.
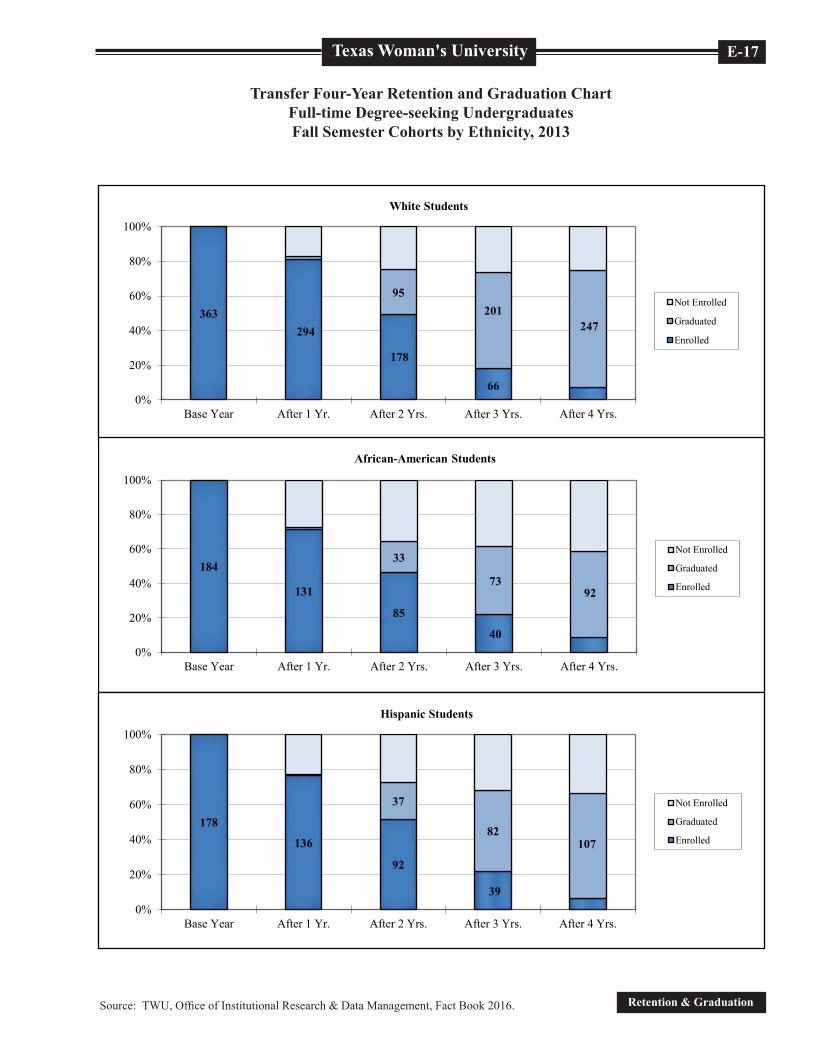
Transfer Four-Year Retention and Graduation ChartFull-time Degree-seeking UndergraduatesFall Semester Cohorts by Ethnicity, 2013
363294
178
66
95201
247
0%
20%
40%
60%
80%
100%
Base Year After 1 Yr. After 2 Yrs. After 3 Yrs. After 4 Yrs.
White Students
Not Enrolled
Graduated
Enrolled
184
131
85
40
33
7392
0%
20%
40%
60%
80%
100%
Base Year After 1 Yr. After 2 Yrs. After 3 Yrs. After 4 Yrs.
African-American Students
Not Enrolled
Graduated
Enrolled
178
136
92
39
37
82107
0%
20%
40%
60%
80%
100%
Base Year After 1 Yr. After 2 Yrs. After 3 Yrs. After 4 Yrs.
Hispanic Students
Not Enrolled
Graduated
Enrolled
Texas Woman's University
Retention & Graduation
E-18
Source: TWU, Office of Institutional Research & Data Manangement, Fact Book 2016.
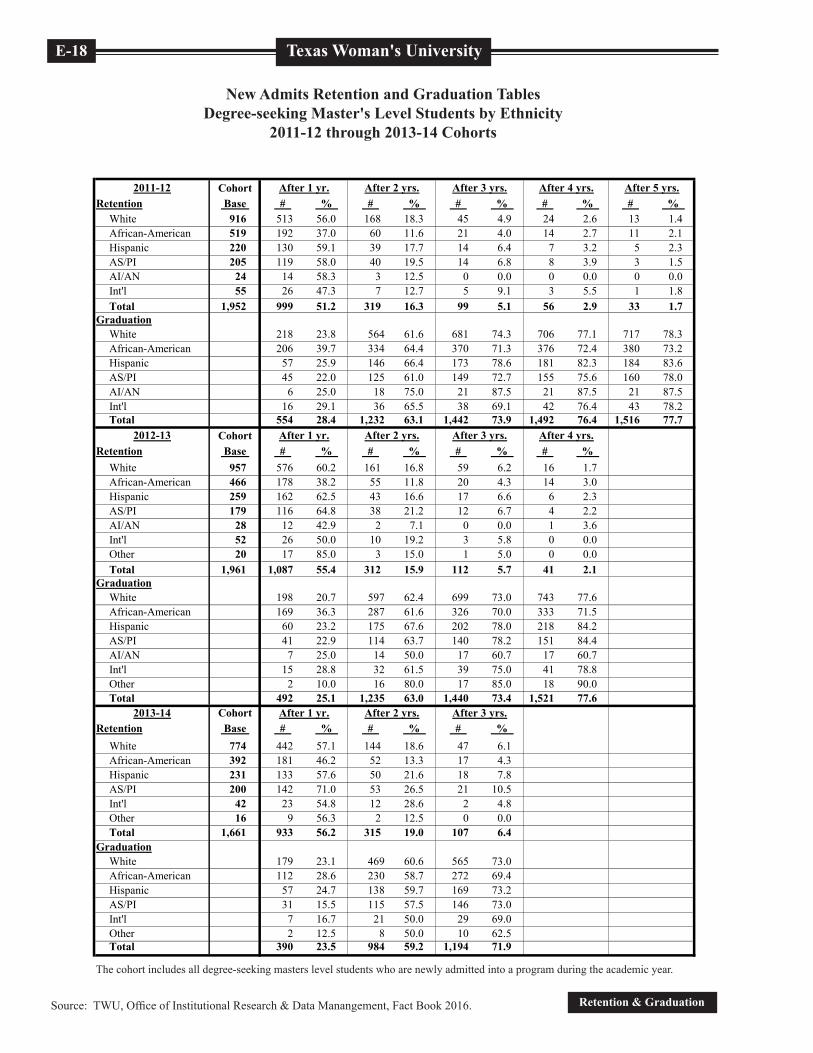
New Admits Retention and Graduation TablesDegree-seeking Master's Level Students by Ethnicity
2011-12 through 2013-14 CohortsMaster's Level New Admits Retention and Graduation Tables
2011-12 through 2013-14 Cohorts
The cohort includes all degree-seeking masters level students who are newly admitted into a program during the academic year.
CohortRetention Base # % # % # % # % # %
White 916 513 56.0 168 18.3 45 4.9 24 2.6 13 1.4African-American 519 192 37.0 60 11.6 21 4.0 14 2.7 11 2.1Hispanic 220 130 59.1 39 17.7 14 6.4 7 3.2 5 2.3AS/PI 205 119 58.0 40 19.5 14 6.8 8 3.9 3 1.5AI/AN 24 14 58.3 3 12.5 0 0.0 0 0.0 0 0.0Int'l 55 26 47.3 7 12.7 5 9.1 3 5.5 1 1.8Total 1,952 999 51.2 319 16.3 99 5.1 56 2.9 33 1.7
GraduationWhite 218 23.8 564 61.6 681 74.3 706 77.1 717 78.3African-American 206 39.7 334 64.4 370 71.3 376 72.4 380 73.2Hispanic 57 25.9 146 66.4 173 78.6 181 82.3 184 83.6AS/PI 45 22.0 125 61.0 149 72.7 155 75.6 160 78.0AI/AN 6 25.0 18 75.0 21 87.5 21 87.5 21 87.5Int'l 16 29.1 36 65.5 38 69.1 42 76.4 43 78.2Total 554 28.4 1,232 63.1 1,442 73.9 1,492 76.4 1,516 77.7
CohortRetention Base # % # % # % # %
White 957 576 60.2 161 16.8 59 6.2 16 1.7African-American 466 178 38.2 55 11.8 20 4.3 14 3.0Hispanic 259 162 62.5 43 16.6 17 6.6 6 2.3AS/PI 179 116 64.8 38 21.2 12 6.7 4 2.2AI/AN 28 12 42.9 2 7.1 0 0.0 1 3.6Int'l 52 26 50.0 10 19.2 3 5.8 0 0.0Other 20 17 85.0 3 15.0 1 5.0 0 0.0Total 1,961 1,087 55.4 312 15.9 112 5.7 41 2.1
GraduationWhite 198 20.7 597 62.4 699 73.0 743 77.6African-American 169 36.3 287 61.6 326 70.0 333 71.5Hispanic 60 23.2 175 67.6 202 78.0 218 84.2AS/PI 41 22.9 114 63.7 140 78.2 151 84.4AI/AN 7 25.0 14 50.0 17 60.7 17 60.7Int'l 15 28.8 32 61.5 39 75.0 41 78.8Other 2 10.0 16 80.0 17 85.0 18 90.0Total 492 25.1 1,235 63.0 1,440 73.4 1,521 77.6
CohortRetention Base # % # % # %
White 774 442 57.1 144 18.6 47 6.1African-American 392 181 46.2 52 13.3 17 4.3Hispanic 231 133 57.6 50 21.6 18 7.8AS/PI 200 142 71.0 53 26.5 21 10.5Int'l 42 23 54.8 12 28.6 2 4.8Other 16 9 56.3 2 12.5 0 0.0Total 1,661 933 56.2 315 19.0 107 6.4
GraduationWhite 179 23.1 469 60.6 565 73.0African-American 112 28.6 230 58.7 272 69.4Hispanic 57 24.7 138 59.7 169 73.2AS/PI 31 15.5 115 57.5 146 73.0Int'l 7 16.7 21 50.0 29 69.0Other 2 12.5 8 50.0 10 62.5Total 390 23.5 984 59.2 1,194 71.9
After 3 yrs.
After 4 yrs.
After 5 yrs.2011-12 After 1 yr. After 2 yrs. After 3 yrs. After 4 yrs.
After 3 yrs.
After 2 yrs.
2012-13 After 1 yr. After 2 yrs.
2013-14 After 1 yr.
MSTNewAdmit_Tables
12/8/2017
Texas Woman's University E-19
Retention & GraduationSource: TWU, Office of Institutional Research & Data Management, Fact Book 2016.
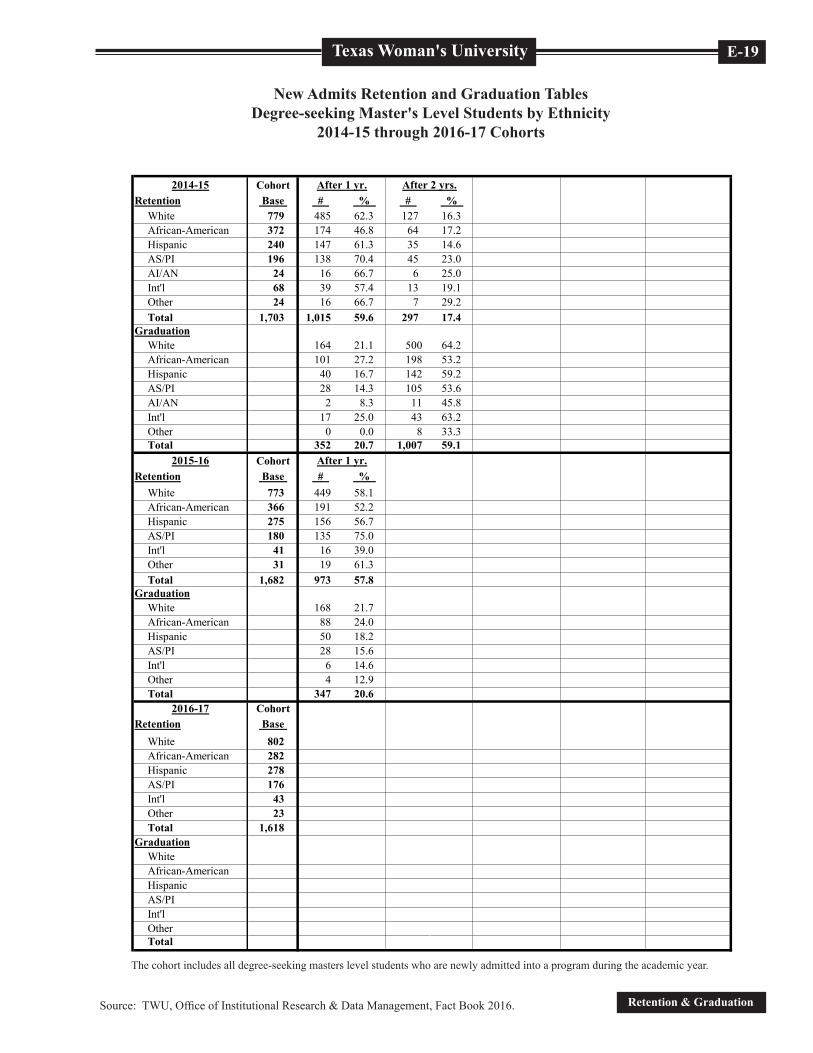
New Admits Retention and Graduation TablesDegree-seeking Master's Level Students by Ethnicity
2014-15 through 2016-17 Cohorts
The cohort includes all degree-seeking masters level students who are newly admitted into a program during the academic year.
CohortRetention Base # % # %
White 779 485 62.3 127 16.3African-American 372 174 46.8 64 17.2Hispanic 240 147 61.3 35 14.6AS/PI 196 138 70.4 45 23.0AI/AN 24 16 66.7 6 25.0Int'l 68 39 57.4 13 19.1Other 24 16 66.7 7 29.2Total 1,703 1,015 59.6 297 17.4
GraduationWhite 164 21.1 500 64.2African-American 101 27.2 198 53.2Hispanic 40 16.7 142 59.2AS/PI 28 14.3 105 53.6AI/AN 2 8.3 11 45.8Int'l 17 25.0 43 63.2Other 0 0.0 8 33.3Total 352 20.7 1,007 59.1
CohortRetention Base # %
White 773 449 58.1African-American 366 191 52.2Hispanic 275 156 56.7AS/PI 180 135 75.0Int'l 41 16 39.0Other 31 19 61.3Total 1,682 973 57.8
GraduationWhite 168 21.7African-American 88 24.0Hispanic 50 18.2AS/PI 28 15.6Int'l 6 14.6Other 4 12.9Total 347 20.6
CohortRetention Base
White 802African-American 282Hispanic 278AS/PI 176Int'l 43Other 23Total 1,618
GraduationWhiteAfrican-AmericanHispanicAS/PIInt'lOtherTotal
2015-16 After 1 yr.
2016-17
2014-15 After 1 yr. After 2 yrs.
MSTNewAdmit_Tables
12/8/2017
Texas Woman's University
Retention & Graduation
E-20
Source: TWU, Office of Institutional Research & Data Manangement, Fact Book 2016.
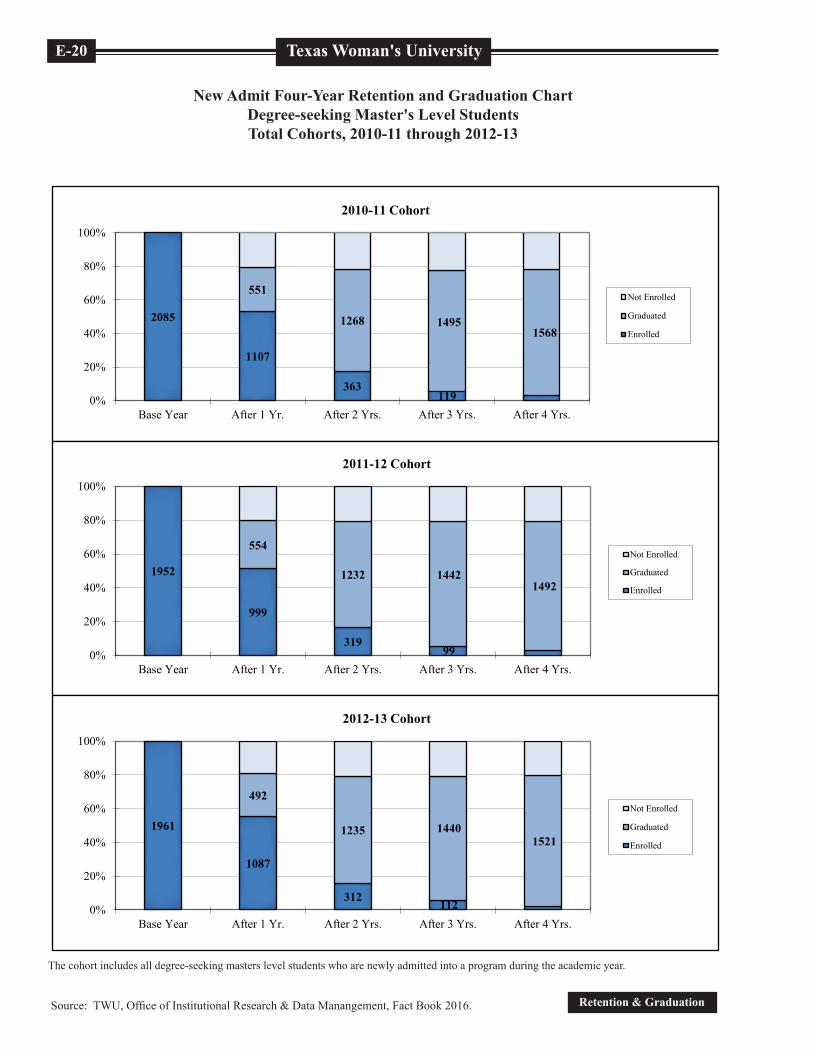
New Admit Four-Year Retention and Graduation ChartDegree-seeking Master's Level StudentsTotal Cohorts, 2010-11 through 2012-13
The cohort includes all degree-seeking masters level students who are newly admitted into a program during the academic year.
2085
1107
363119
551
1268 14951568
0%
20%
40%
60%
80%
100%
Base Year After 1 Yr. After 2 Yrs. After 3 Yrs. After 4 Yrs.
2010-11 Cohort
Not Enrolled
Graduated
Enrolled
1952
999
31999
554
1232 14421492
0%
20%
40%
60%
80%
100%
Base Year After 1 Yr. After 2 Yrs. After 3 Yrs. After 4 Yrs.
2011-12 Cohort
Not Enrolled
Graduated
Enrolled
1961
1087
312 112
492
1235 14401521
0%
20%
40%
60%
80%
100%
Base Year After 1 Yr. After 2 Yrs. After 3 Yrs. After 4 Yrs.
2012-13 Cohort
Not Enrolled
Graduated
Enrolled
Master's Level New Admits Four-Year Retention and Graduation ChartTotal Cohorts, 2010-11 through 2012-13
Texas Woman's University E-21
Retention & GraduationSource: TWU, Office of Institutional Research & Data Management, Fact Book 2016.
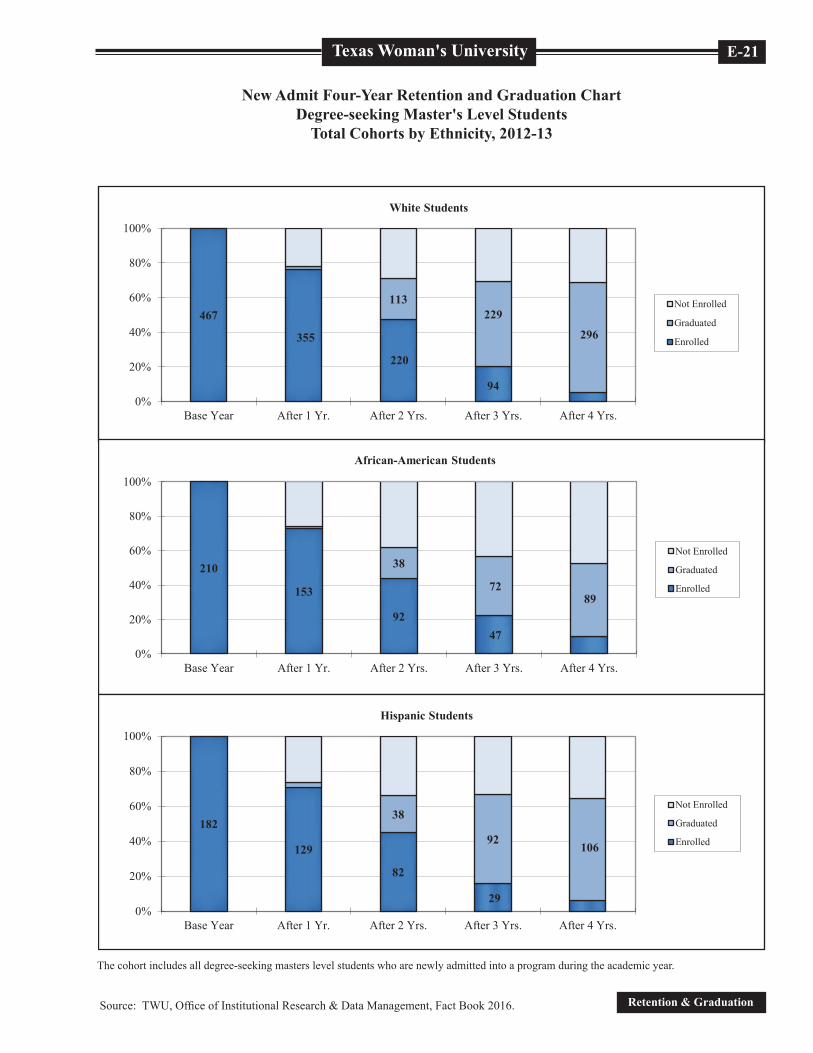
New Admit Four-Year Retention and Graduation ChartDegree-seeking Master's Level Students
Total Cohorts by Ethnicity, 2012-13
The cohort includes all degree-seeking masters level students who are newly admitted into a program during the academic year.
467
355
220
94
113 229
296
0%
20%
40%
60%
80%
100%
Base Year After 1 Yr. After 2 Yrs. After 3 Yrs. After 4 Yrs.
White Students
Not Enrolled
Graduated
Enrolled
210
153
92 47
38
72 89
0%
20%
40%
60%
80%
100%
Base Year After 1 Yr. After 2 Yrs. After 3 Yrs. After 4 Yrs.
African-American Students
Not Enrolled
Graduated
Enrolled
182
129
82
29
38
92 106
0%
20%
40%
60%
80%
100%
Base Year After 1 Yr. After 2 Yrs. After 3 Yrs. After 4 Yrs.
Hispanic Students
Not Enrolled
Graduated
Enrolled