g3d vet manual - veterinary technics...g3d animal monitor operating manual version v1.0 general...
TRANSCRIPT

G3D Animal Monitor
Operating Manual
Version V1.0
GENERAL MEDITECH, INC.
December 24, 2007

Information in this document is subject to change without notice. No part in this document may be reproduced or transmitted in any form or by any means, electronic or mechanical, for any purpose, without the express written permission of GENERAL MEDITECH, INC. Contact: South Office 4/F, Kezhi Rd.W.No. 1, Science Park, Nanshan District, Shenzhen, Guangdong P.R.China Tel: 86-755-26500832 Fax: 86-755-26546285 Zip: 518057 Http://www.szmedtech.comE-mail:[email protected]

CONTENTS
CHAPTER 1 OVERVIEW.............................................................................................................................. 1
1.1 Brief introduction..................................................................................................................................... 1 1.2 Warranty................................................................................................................................................... 1 1.3 The equipment installation....................................................................................................................... 1
1.3.1 Opened package inspection.............................................................................................................. 1 1.3.2 Connect AC power and network ...................................................................................................... 2 1.3.3 Other requirements on the connection of external equipments ........................................................ 2
1.4 Safety information ................................................................................................................................... 2 1.4.1 The electrical safety classifications.................................................................................................. 2 1.4.2 Prohibition........................................................................................................................................ 2 1.4.3 Cautions ........................................................................................................................................... 3
1.5 Function composition .............................................................................................................................. 3 1.6 Product indexes........................................................................................................................................ 3
1.6. 1 Performance index .......................................................................................................................... 3 1.6.2 The available environment conditions for the monitor .................................................................... 5
CHAPTER 2 INTRODUCTION .................................................................................................................... 6
2.1 External appearance................................................................................................................................. 6 2.1.1 Front panel ....................................................................................................................................... 6 2.1.2 Rear panel......................................................................................................................................... 8
2.2 Introduction on display ............................................................................................................................ 9
CHAPTER 3 BASIC OPERATION ............................................................................................................. 11
3.1 How to use rotating mouse .................................................................................................................... 11 3.2 How to use the volume knob ................................................................................................................. 11 3.3 How to use keys..................................................................................................................................... 11 3.4 Menu operation...................................................................................................................................... 11 3.5 Set date and time.................................................................................................................................... 12 3.6 Setting unit............................................................................................................................................. 12 3.7 Change the waveform speed .................................................................................................................. 12 3.8 Setting monitoring format...................................................................................................................... 12 3.9 Setting Alarm......................................................................................................................................... 12 3.10 Preparatory work ................................................................................................................................. 15 3.11 Remote maintenance............................................................................................................................ 15
3.11.1 Setting your monitor..................................................................................................................... 15
CHAPTER 4 ECG MONITORING ............................................................................................................. 25
4.1 ECG electrode monitoring ..................................................................................................................... 25 4.1.1 Installing the ECG electrode .......................................................................................................... 26 4.1.2 ECG monitoring interface .............................................................................................................. 27
4.2 Parameter display................................................................................................................................... 29 4.3 Maintenance........................................................................................................................................... 30 4.4 Trouble shooting .................................................................................................................................... 30
CHAPTER 5 NIBP MONITORING............................................................................................................. 31
i

5.1 Overview ............................................................................................................................................... 31 5.2 Blood pressure cuff installation ............................................................................................................. 31 5.3 The limitations on the measurement ...................................................................................................... 32 5.4 Normal Blood pressure values............................................................................................................... 33 5.5 Monitoring display interface.................................................................................................................. 34 5.6 Introduction on functions....................................................................................................................... 34
5.6.1 Blood pressure measurement ......................................................................................................... 34 5.6.2 Venipuncture .................................................................................................................................. 35
5.7 Maintenance and cleaning ..................................................................................................................... 36 5.8 Trouble shooting .................................................................................................................................... 37
CHAPTER 6 THE IMPEDANCE RESPIRATION MONITORING........................................................ 38
6.1 The electrode connection ....................................................................................................................... 38 6.2 RESP monitoring inspection.................................................................................................................. 38 6.3 Monitoring interface .............................................................................................................................. 39 6.4 Prompting messages .............................................................................................................................. 40
CHAPTER 7 NASAL TUBE RESPIRATION MONITORING................................................................. 41
7.1 Monitoring interface .............................................................................................................................. 41 7.2 The status prompting messages ............................................................................................................. 41
CHAPTER 8 TEMPERATURE MONITORING ....................................................................................... 42
8.1 The installation of the temperature sensor ............................................................................................. 42 8.2 Body temperature parameter menu........................................................................................................ 43 8.3 Maintenance and cleaning ..................................................................................................................... 43
CHAPTER 9 IBP SETTING AND MEASURING (OPTIONAL) ............................................................. 44
9.1 Waveforms displaying ........................................................................................................................... 44 9.2 Module status display ............................................................................................................................ 45 9.3 Pressure value display............................................................................................................................ 45
CHAPTER 10 TREND ANALYSIS.............................................................................................................. 48
10.1 Main interface trend analysis............................................................................................................... 48 10.2 The trend analysis of the trend window............................................................................................... 50
CHAPTER 11 THE WAVEFORM FREEZE AND REPLAY .................................................................... 53
11.1 Waveform freeze operational specification.......................................................................................... 53
CHAPTER 12 ENVENT RECORD.............................................................................................................. 54
CHAPTER 13 HOW TO USE THE DRUG CALCULATOR .................................................................... 55
CHAPTER 14 THE PRINTING FUNCTION OF THE MONITOR (OPTIONAL)................................ 61
14.1 The connection mode of the printer ..................................................................................................... 61 14.2 The configuration of the monitor......................................................................................................... 61 14.3 Waveform and parameter printing ....................................................................................................... 62
CHAPTER 15 CO2 SETTING AND MEASURING (OPTIONAL).......................................................... 63
15.1 Introduction ......................................................................................................................................... 63
ii

15.2 CO2 measuring .................................................................................................................................... 63 15.3 Monitoring interface ............................................................................................................................ 64
CHAPTER 16 PACKAGING AND LABEL ................................................................................................ 65
16.1 Packaging frontispiece......................................................................................................................... 65 16.2 Packaging profile ................................................................................................................................. 65 16.3 Product nameplate ............................................................................................................................... 65
iii

Chapter 1 Overview
Welcome to use G3D Multi-Parameter Animal Monitor!The main purpose of this Manual is to provide operating guide, instrument repair and maintenance information to users. The detailed performance indexes, routine installation, operation and maintenance method as well as safety information are illustrated in this Manual. Before use, the operator shall carefully read this Manual in order to properly and correctly operate this monitor, so that it can reach specified safety standards and performance indexes.
1.1 Brief introduction
The G3D Multi-Parameter Animal Monitor is a multifunctional overall physiologic index monitor, it is applicable to monitor the ECG, NIBP, SpO2, HR, RESP, TEMP in hospitals. This product has the multi-parameter functions which can be selected, combined and configured by the user according to his requirements (but the G3D Multi-Parameter Animal Monitor which you are using probably only had part parameters and corresponding accessories selected by you when you bought it). This product is composed of main machine and corresponding functional accessories such as ECG cable, blood pressure cuff, SpO2 sensor, body temperature sensor and BP hose.
This product has four input/output interfaces for printer, network communication, external CRT and external telephone line.
1.2 Warranty
Our Company offers a 1.5 year warranty of free charge for the G3D Multi-Parameter Animal Monitor since the date of the purchase, while offers 1 year warranty for the SpO2 sensor, blood pressure cuff, ECG cable and body temperature sensor since the date of the purchase, the consumables are excluded from the scope of this warranty.
The following situations are not included in the scope of the warranty:
The serial number of the monitor was ripped off or unreadable.
The monitor was damaged due to improper connection with other equipment.
The monitor was damaged due to accident.
The user modified the monitor without our Company’s written authorization.
1.3 The equipment installation
1.3.1 Opened package inspection
Please open the package according to the positions marked on the package box, and take out the monitor and accessories carefully.
Count the accessories according to the packing list, Check the monitor and accessories if any damages occurred, e.g. mechanical deterioration.
If has any problem, please contact the distributor immediately. Friendly remind: The package box and protective filling material shall be well preserved for your
further transportation and storage.
1

1.3.2 Connect AC power and network
Confirm the AC power source is in conformity with the requirements of this equipment: (90~256)V a.c., 50/60Hz;
Connect the monitor to the AC power source with the flexible cable adhered to the monitor. The connection with the external equipments shall be in conformity with the requirements specified
in the Manual. Electric potential balance terminal (refer to the rear panel introduction) shall be connected to the
protective grounding end of the public power grid or properly connected to the other protective grounding ends.
If you found and proved that the functions of the monitor have been damaged or it shown error prompting message, the monitor can not be used for monitoring on the animal, and you shall contact the relevant department in hospital or manufacturer.
1.3.3 Other requirements on the connection of external equipments
The parallel printer faucet, network faucet are on the rear panel of the monitor, through which the monitor can be connected to the external printer and can be connected to the network to update the monitor to add more new functions.
When the monitor is connected to the external equipment via the faucets of this equipment, please refer to GB 9706.15.
Do not place the monitor against the wall, and do not plug up the heat emission holes on the back and two sides of the monitor.
1.4 Safety information
1.4.1 The electrical safety classifications
The electrical safety classification of this product is I class internal stand-by power equipment; if there is a
symbol (electrocardiogram) beside the sensor insertion slot, its application section is CF defibrillation
prevention type, if there is a symbol beside the sensor insertion slot, its application section (except
the ECG application section) is BF defibrillation prevention type.
The marked symbol on the Manual means: attention, refer to document attached with the machine.
Anywhere marked with , means when you using this equipment, you shall pay more attention on it in
order to guarantee the safety of the animal, operator or equipment.
1.4.2 Prohibition
Do not use the G3D Multi-Parameter Animal Monitor for asphyxiation monitoring.
Do not use the G3D Multi-Parameter Animal Monitor during the magnetic resonance imaging (MRI) or
CT inspection process.
2

Do not use this monitor in the environment filled with inflammable gas and anaesthesia gas.
1.4.3 Cautions
In order to make the monitor safe grounding, the hospital must provide the power socket with complete wire under voltage, zero line and protective grounding in accordance with national standard. Or the hospital bears all consequences.
Do not dismantle the housing of the monitor at will for the sake of electric shock. The maintenance and upgrade of the monitor shall be carried out by the qualified and authorized service personnel.
Only qualified accessories can be used for the monitor.
Keep the monitor dry, prevent it from water and humidity, and avoid strong collision.
In order to make the monitor safe grounding, hospital must provide the power socket with complete wire under voltage, zero line and protective grounding.
Do not use this monitor in the environment filled with inflammable gas and anaesthesia gas.
Do not dismantle the monitor cover board for the sake of electric shock.
When using the electrosurgery unit during the monitoring, the loop of the electrosurgery unit shall be properly connected to prevent from burning, even the life risk.
When using this monitor, the F-type application section cannot be connected to other conductivity or ground.
In order to avoid losing time for diagnosis and treatment, please configure adequate alarm settings according to different conditions of each animal (for detailed setting methods, refer to the 3.9 Setting Alarm and 3.11 Alarm menu in this Manual.
When various equipments are connected to the same animal, pay attention to the danger of leakage current overlap.
Do not put the monitor in environments such as high temperature and high pressure, gas fumigation or liquid immersion. Before clean or sterilize the monitor, cut off the general power please.
The ECG Cable uses five lead cable only, and cannot be connected to other signal terminals. G3D Multi-Parameter Animal Monitor has no defibrillation synchronization, so it cannot be connected to the synchronization defibrillation instrument.
1.5 Function composition
The G3D Multi-Parameter Animal Monitor can be used to monitor the major parameters such as electrocardiogram (ECG), body temperature (TEMP), respiration (RESP), saturation oxygen (SpO2), invasive blood pressure (IBP), noninvasive blood pressure (NIBP). It integrates the parameter measurement module function, display and record export as a whole, which forms a compact and portable monitor.
1.6 Product indexes
1.6. 1 Performance index
◆ Electrocardiogram (ECG)
Heart rate (HR) 3

Measurement range: 30BPM ~ 350BPM;
Accuracy in measurement: 1BPM or ±1%, the larger one is applicable.
Heart rate alarm settings and allowable deviation:
upper limit (60 ~ 300)bpm, allowable deviation ±10%
lower limit (10 ~ 200)bpm, allowable deviation ±10%
ECG noise level: ≤30μV
ECG frequency response: filter mode: (1 ~ 25)Hz
Non-filter mode: (0.05 ~ 100)Hz
ECG input loop current: ≤0.1μA
ECG display sensitivity: continuous adjustment
Scan speed grades and errors:
The scan rate can be divided into four grades for option: 6.25mm/s, 12.5mm/s, 25mm/s, and
50mm/s.
The scan rate error: ≤± 10 %
◆Noninvasive blood pressure (NIBP)
Measurement range
a) Systolic blood pressure (SBP): (5.3 ~ 36.0) kPa, or (40 ~270) mmHg
b) Diastolic blood pressure (DBP): (2.7 ~ 26.7) kPa, or (20 ~200) mmHg
c) Mean pressure (MAP): (4.0 ~ 29.3) kPa, or (30 ~220) mmHg
Accuracy in measurement: ≤±0.4 kPa (3 mmHg) or ±2%, the larger one is applicable.
◆Respiration rate (RR)
Measurement range:
0 BPM ~ 120 BPM;
Accuracy in measurement:
±1 BPMor ±5 %, the larger one is applicable.
◆Body temperature (TEMP)
Body temperature channel
The number of channel: 2.
Body temperature sensor configuration: one intra-cavity probe, one optional body surface sensor.
Measurement range: 25 °C~ 45°C
Accuracy in measurement: ±0.2 °C
4

Response time: ≤3 min
◆Pulse saturation oxygen (SpO2)
Measurement range: (0 ~ 100) %
Accuracy in measurement: within the range of (70 ~ 100) % ±2 %
Within the range of (50 ~ 69) % ±3 %
◆Pulse rate (PR)
Measurement range:
(30 ~ 250) bpm;
Accuracy in measurement:
1BPM or ±2%, the larger one is applicable.
◆Trend retrospection: it can retrospect the data of past 360 hours.
1.6.2 The available environment conditions for the monitor
Temperature range: working (+5 ~ +45)°C Transportation and storage (-20 ~ +55)°C
Relative humidity: working ≤ 80 % Transportation and storage ≤ 93 %
Air pressure: working (700 ~ 1060)hPa Transportation and storage (500 ~ 1060)hPa
Adaptive power: (90~256)V a.c. 50/60Hz
Maximum input power 80VA
Fuse: T 1.6 A
Continuous working time:
Power working time: ≥ 8 hours
Internal power continuous working time: > 1 hour, (when the battery is fully charged and it measures the blood pressure every ten minutes).
Signal Faucet:
CRT (external monitor): Standard VGA faucet (optional) PRINTER (external printer) PC/AT parallel faucet (optional) NET (external central monitor) RJ45 faucet LINE (external telephone line) MODEM faucet
5

Chapter 2 Introduction
2.1 External appearance
2.1.1 Front panel
The front panel of the G3D Multi-Parameter Animal Monitor is shown as Figure 2.1:
(20)
(2) (3) (4) (5) (1) (6) (7)
(8)
(9)
(18) (19)(17) (16) (10) (11) (12) (13) (14) (15)
Figure 2.1
(1) DISPLAY: Waveforms, menu, alarm and measuring parameters are displayed here.
(2) —— Silence key. Press this button to start or stop the monitor tone.
(3) —— Alarm key. Press this button to enter alarm setting.
(4) —— Freeze key. When the waveforms are updated, press this button to freeze the displayed
waveforms.
(5) —— NIBP key. In hold condition, press this button to start NIBP measurement. If the monitor
is performing a NIBP measurement, press this button to stop current NIBP measurement.
(6) —— Print key. When the device is equipped with a recording/printer-device, press this button
to activate printout of the monitoring results. When the printer is operating, stop print by pressing this
button.
(7) —— Main menu key. When no menu is shown in display, press this button to show the
system's main menu. Whatever status the menu appears in, exit the menu by pressing this button.
(8) ROTATING MOUSE: Rotate the mouse clockwise or counterclockwise to select the menu item.
Press the mouse to operate the menu item.
(9) Power switch: Press this key for more than two seconds to turn ON and OFF the monitor.
6

(10) TEMP1 —— Temperature probe connector (channel 1)
(11) TEMP2 —— Temperature probe connector (channel 2)
(12) NIBP —— NIBP cuff hose connector
(13) RESP —— Respiration pipe connector
(14) SpO2 —— SpO2 probe connector
(15) ECG/RESP —— ECG cable connector
(16) IBP1 —— IBP transducer connector (channel 1)
(17) IBP2 —— IBP transducer connector (channel 2)
(18) POWER —— Power indicator
ON: The monitor power is turned on.
OFF: The monitor power is turned off.
(19) CHARGE —— Charge indicator
ON: AC power is applied to the monitor.
OFF: AC power is not applied to the monitor.
(20) Alarm Indicator. When a parameter value exceeds its alarm limit, this indicator flashes once a
second.
Type CF applied part. The unit displaying this symbol contains an F-type isolated (floating) animal part providing a high degree of protection against shock, and is suitable for use during defibrillation.
TYPE BF applied part. Defibrillator-proof protection against electrical shock.
Attention: Consult accompanying documents (this manual).
7

2.1.2 Rear panel
The rear panel of the G3D Multi-Parameter Animal Monitor is shown as Figure 2.2:
(8)
(1)
(2)
(3)
(4) (5) (6) (7)
Figure 2.2
(1) Dispersion holes
(2) Brightness adjustment knob
Turn this knob to adjust the brightness of the monitor screen. Turn clockwise to brighter the screen; turn counterclockwise to darker the screen.
(3) Volume adjustment knob
Turn this knob to adjust the volume of the monitor. Turn clockwise to louder the volume; turn counterclockwise to lower the volume.
(4) AC power input connector
A three-wire power cord can be connected to this receptacle to provide AC power supply to the animal monitor.
(5) Electric potential balance terminal
It is marked with symbol , when the monitor is used with other equipment, it can be connected to equal the voltage.
(6) Network connector: Standard RJ45 connector
Through network connector, this monitor can be connected with the central monitoring system, another monitor, or a PC. It enables the functions of other animal viewing, data output and on-line software upgrading.
(7) Battery cover
(8) Handle
8

2.2 Display
The display of this monitor is divided into four major areas such as channel display area, parameter display area, status bar and menu bar. The status bar is displayed on the top part of the screen; the channel display area is displayed under the status bar, the left part of the screen, while the menu bar is always displayed at the low part of the screen. The parameters are always displayed at the right part of the screen. The menu bar is a popup one, when is popup, it will shut out part of the channel display area and parameter display area. The basic layout of the display is as following:
Because the Monitor has provided the channel display area configuration function, the display content at the channel display area can be set by the operator. The parameter display area can be automatically adjusted according to the channel configuration format, so that each parameter can be equally displayed at the right part or right low part of the screen along with corresponding waveform channels.
9

Channel display area The channel display area is divided into several channels. Total seven channels are provided; the content of the channel can be selected from any of them such as the ECG waveform, RESP waveform, blood volume waveform, trend graph and trend table. The name of each channel is usually displayed on the left corner of the channel, select the channel, you can visit the menu of the channel. What is displayed at the same row of the channel name is the status information concerning this channel.
Parameter display area The heart rate (HR), oxygen saturation (SpO2), respiration rate (RESP), body temperature (T1/T2) and noninvasive blood pressure (NIBP) are displayed in
this area, every parameter has a corresponding label; The important parameters are configured with alarm prohibition signs, the prohibition signs are displayed on the left part of the label, the operational menu of relevant user’s parameters can be gained by selecting parameter label.
Menu bar The menu bar area is dynamic popup and disappearance, when no menu is displayed on the screen, the main menu key, the alarm key and the freeze key on the front penel can activate the menus to display, the relevant menus can also be activated by selecting the labels on the display with the rotating mouse.
Status bar
④ ① ② ⑥ ⑦ ③ ⑤ ⑧
① Information bar. Display the Monitor status information and animal’s information.
② Animal types: large or small.
③ Date. Its display format can be modified in the menu.
④ Time. Its display format can be modified in the menu.
⑤ The alarm status icon: means the alarm is allowed, means the alarm is prohibited.
⑥ The battery electrical voltage icon: denotes the remaining charge in the battery. Three grids means full charge; blank means to be exhausted, charge in time please.
⑦ Central monitor network function status icon. Red icon means the monitor is not connected to the central monitor system, the blue icon means the monitor has been connected to the central monitor system.
⑧ The mute status icon: means the heartbeat sound is unclosed, means the heartbeat sound is closed.
When the symbol shows, the system cannot produce alarm sound prompting, so the operator
shall be especially cautious to use this function.
10

Chapter 3 Basic Operation
3.1 How to use rotating mouse
At the main interface, there is a yellow frame which means your current position, you can select different sign names with the rotating mouse, or you can click at the current sign name to popup the corresponding functional menu.
3.2 How to use the volume knob
By tuning the volume knob you can adjust the volume, tune counterclockwise, the volume becomes low, tune clockwise, the volume becomes loud.
3.3 How to use keys
Silence key: turn the heartbeat sound on or off. Alarm key: popup or close the alarm menu. Freeze key: popup or close the freeze menu. NIBP key: inflate the air when measuring the blood pressure. Print key: print the waveforms. Menu key: popup or close the menu.
3.4 Menu operation
Pop-up the menu:
Press down the corresponding menu keys (menu, freeze, alarm key): the corresponding menu will pop up.
Select the concerned waveform or parameter label on the screen by the rotating mouse, and then click the rotating mouse, the corresponding menu pops out.
Menu browse:
In the menu bar, the knob of black background and white character is the knob selected by the cursor. Using the rotating mouse to select the required knob, then press the rotating mouse, and you can get the function of this knob.
Return to the previous menu:
Select the “Exit” knob at the right end of the menu bar, the menu bar returns to the previous menu.
If press the menu key on the front panel when in the menu displaying status, it will exit all the menus.
If no key operation for more than one minute, the Monitor will automatically exit all the menus.
Main menu:
11

3.5 Set date and time
Note: Changing date or time will influence the storage of the trend and events, after the modification, you must turn off the Monitor and turn it on again immediately! Select menu key -> System Setup -> Set Time
3.6 Setting unit
Select menu key -> System Setup -> Region Settings -> Select Units
3.7 Change the waveform speed
Decrease the waveform speed and the waveform is compressed, you will see longer time quantum, increase the waveform speed, the waveform is expanded, you get more detailed view, so you can change the ECG waveform speed and RESP waveform speed.
3.8 Setting monitoring format
The common monitoring formats include 1 ECG, 2 ECGs, 3 ECGs, 7 ECGs and Huge Digit, and the other five formats defined by the user. The detailed information for the format you required, please refer to the Format Setup.
3.9 Setting Alarm
All the parameters on the screen can be set with the alarm and alarm limit, you can use the rotating mouse to select the parameter you want to set the alarm and then click the mouse to operate the relevant menu.
Open or close the alarm
a. Open or close the alarm of a certain parameter Select the sign name of the parameter > Press the mouse -> Select the alarm on/off menu
12

b. Open or close the alarm of all parameters Select alarm key -> Alarm On/Off
13

Alarm setting a. The alarm setting for a certain parameter
Select the sign name of this parameter -> Press the mouse -> Select the alarm setting menu
b. Alarm setting for all parameters Select alarm key -> Alarm Settings
14

3.10 Preparatory work
Check the Monitor
Before the measurement, please check whether the Monitor has mechanical failure, which including all external cables, plug-ins and accessories connecting to it.
Connecting the power After connecting the power, press the “on/off” Key on the Monitor.
Setting modules Configure the modules which ought to be observed, check whether the animal cables and sensors are properly connected.
Starting monitoring Connect the animal to the Monitor. Verify the “Monitor setting”, “Alarm limit”, alarm volume, animal type and pacing impulse status to be suitable to you animal, if necessary, change them. For the detailed information for measuring your required parameters, please refer to the chapters and sections about the measurement.
Cut off the power Press the “on/off” Key, and then pull off the power cord.
3.11 Remote maintenance
Select menu key -> System Setup -> Maintenance -> Remote maintenance
Enter the Remote Maintenance status, the Central Management System can remotely upgrade the Monitor.
3.11.1 Setting your monitor
Menu settings
■Menu
<Display> mainly set the display interface. <Tools> mainly set the practical tools. <Review> mainly observe the historic data. <Animal> mainly set animal’s information. <System Setup> mainly set the system information. <Recorder Setup> mainly set the printer parameters.
■ Display menu
<Fixed Format> it can set the display channel as the 1 ECG, 2ECGs, 3 ECGs, 7ECGs, Huge Digit.
15

1 ECG
2 ECGs
3 ECGs
16

7 ECGs
Huge Digit
<User Format> it can set the display channel as the channel format defined by the user.
It supports five user-defined channel formats. <Format Setup> the user can define the display channel by himself.
17

Note: a. The same channel cannot be displayed repeatedly. b. Blank means no channel to be displayed at this position. c. Select the ECG channel, the system will automatically configure the lead of the
ECG channel. d. The configured channel can be saved as the user-defined format, and later this
format can be selected at any time from the <User Format>.
<oxyCRG> display the oxyCRG chart.
<Alarm Limit> display or hide the alarm limit parameter area.
<Waveform Speed> it can adjust the waveform speed of the ECG / PLETH/IBP and RESP/CO2.
<Other Settings> it can set other display formats.
NIBP Size Three display formats are switchable.
or or
18

IBP1 Size Three display formats are switchable.
or or
IBP2 Size Three display formats are switchable.
or or
IBP Overlap Display the two IBP waves in a coordinary.
Menu Font Menu font can be switched to large or small font.
Screen Font
The screen font can be switched large or small font.
Pelth Fill
Pelth waveform can be switched to filling or blank.
■Tools menu
<Event> it can set the events.
19

<Drug Calculator> the drug calculator can be called.
<Standby> it makes the Monitor into standby mode.
■ Review menu
<Trend> you can observe the trend data, for more detailed information, refer to Chapter of Trend Anaysis.
<Recall> it can replay the waveform, for more detailed information, refer to Chapter of the Waveform Freeze and Replay.
■ Animal menu
The animal information can be set.
■System Setup menu
<Set Time> you can set the current time for the Monitor.
20

<Region Settings> you can set the parameters relating to the regions. Select Units
Date Format
Power Frequency
Note: please set the right power frequency, or the signal noise of the ECG will be loud.
Language
It can be set in Chinese or English. <Network Settings>
IP Address
You can set the IP address of the Monitor.
21

Server You can set the IP address and domain name of the Server.
Device Name You can set the name of the Monitor.
<Calibration> you can set the calibration function.
<Maintenance> you can set the maintenance function. Caution: This maintenance function only can be set by the Administrator.
The system maintenance function includes: System Status, Remote Maintenance, Reserved1, Reserved 2 and DEMO.
The maintenance menu is as following:
The System Status: to check the relevant system status. The menu is as following:
[Main Settings] list sample is as following:
22

[Alarm Limits] list sample is as following:
[Software Version] list sample is as following:
You shall pay more attention on the following operation functions:
Remote maintenance: it is used to upgrade the Monitor software;
Reserved 1, Reserved 2;
Demo Switch: to turn on the demonstration status.
<Default Settings> the ex-works settings can be called.
■Alarm Setup menu
23

<Alarm On/Off> open or close the alarm of all the parameters, the detailed information shows in 3.9
Setting Alarm.
<Alarm Settings> set the alarm limits of the parameters, the detailed information shows in 3.9 Setting
Alarm.
<Alarm Tone> set the pulse and alarm tone, shows as following:
<Default Limit> can set the value of the alarm parameters as the default value, shows as following:
24

Chapter 4 ECG Monitoring
This Monitor adopts 5-lead ECG cable to collect the ECG signal from the animal, and it can simultaneously display seven leads of ECG signal, ECG channel displayed on the top part of the screen is the major channel of the ECG signal, the lead type selected by this Monitor we called it the major lead, the Monitor calculates the heart rate value according to the data of this lead, it also controls the gain (if set in automatic mode) according to the lead data. All leads adopt the same gain control and same measurement mode, the Monitor can separately check whether the connections of the leads fall off, and display them on the screen.
4.1 ECG electrode monitoring
In order to monitor the animal’s ECG, we use a five-electrode ECG cable by which we can get more than 12 selective ECG lead, while the certain lead of the Monitor is effective, the animal’s ECG waveform corresponding to the lead will be displayed.
The ECG cable includes two parts: the main cable connecting the Monitor and the electrode lead line connecting the animal. Usually the ECG cable has five electrodes. Pay attention to the following items when installing the electrodes:
1) The selection and use of the electrode
Generally the electrode for monitoring is disposable electrode made from Ag-AgCl (silver - silver chloride). But before use, you shall confirm that the electrode is within the valid date. If the unqualified electrode is used, it will lead to inaccurate monitoring result.
2) Skin pretreatment
Dogs and cats have an adequate amount of electrolyte material in their skin and hair, so moistening lead sites with isopropyl alcohol will be enough, although it is suggested that before installing the electrode, you shall carry out skin pretreatment for animal at first.
(1) Wet the hair and skin at the lead attachment site with isopropyl alcohol.
(2) Install the electrode on the animal. If monitoring for more than 30’ to 60’ the use of electrical ointment is advisable.
(3) For animals with dense undercoat, rub ointment with fingers to assure that it has made contact with skin.
(4) Connect the electrode lead with the animal cable.
(5) Crocodile clips are included with the equipment. Be sure to open them wide enough to grasp the skin. Take care not to cause injuries.
(6) Confirm the Monitor is power on.
25

4.1.1 Installing the ECG electrode
For the installation of the five–lead ECG electrode, refer to the ECG electrode installation figure as shown in Figure 4.1.
Note: the sign name and color of the electrode is American standard, while inside the square brackets (-) are European standard.
The electrode installation for five-lead device
Figure 4.1 Five-lead ECG electrode installation positions
■ White (red) electrode (RA) — Right foreleg
■ Black (yellow) electrode (LA) — Left foreleg
■ Green (black) electrode (RL) — Right hind leg
■ Red (green) electrode (LL) — Left hind leg
■Brown electrode (V) — Fourth intercostal space
Notice
● Select the place with stable ECG signal or the little inference of skeleton activities to place the electrodes.
● The non-grounding equipment near the animal and the electrosurgery unit (ESU) interference may lead to waveform problems.
● When using the surgical electrocauterize unit, it prohibited to put the electrode near the grounding of the surgical electrocauterize unit, or a lot of interference on the ECG signal will emerge, the electrode spaces shall be equal in axes to the electrocauterize blade and electrocauterize grounding.
● The electrode shall be fixed properly to ensure the reliable contact of the conductor with skin.
● In order to ensure the animal’s safety, all leads shall be connected to the animal.
26

4.1.2 ECG monitoring interface
4.1.2.1 Introduction on the main lead
On the Monitor interface, the ECG waveform is green, including two kinds of ECG channel, of which, the top ECG channel is the main channel of the ECG, we called it the main lead channel, as shown in following Figure:
① ② ③ ④ ⑤
⑦ ⑧ ⑨
⑥
①main lead type ②gain mode ③gain ④measurement mode ⑤waveform speed ⑥scale ⑦scale range ⑧lead off sign ⑨ECG waveform
Select this ① position with the cursor, press the rotating mouse and the ECG menu shows. The function of the knobs on the ECG menu are introduced here:
【Lead】: Switch the lead type. Press the mouse once, it switches once. There are seven lead types such as I, II, III, aVR, aVL, aVF, V for selection. The main lead is a very important lead, in order to get accurate heart rate and gain control performance, the doctor shall select the lead of large range and little noise as the main lead.
Notice: in order to avoid emerging leads repeatedly, when switching the lead type in the current channel, the lead types in the other channels will be changed automatically.
【Gain Mode】: Switch to automatic gain and manual gain, press the mouse once, it switches once.
Gain means the magnification for the ECG waveform signal, this Monitor have five magnification, they are x1/4, x1/2, 1, 2, 4. the x1 in the center is one time magnification, under this magnification, the range ⑦ of the scale⑥ at the left side of the ECG waveform is 1mV. Under the standard graph display format, the length of the scale⑥ is duly 10mm, then the waveform of the 10mm displayed on the standard interface means the ECG signal of 1mV. Then under the condition of x2 magnification, the waveform of the 10mm displayed on the standard interface means the ECG signal of 0.5 mV, and so on, for detailed data refer to the following table:
Gain factor Automatic gain Manual gain 10mmscale range X1/4 Adopted Applicable 4 mV X1/2 Adopted Applicable 2 mV X1 Adopted Applicable 1 mV X2 Adopted Applicable 0.5 mV X4 Adopted Applicable 0.25 mV
27

Notice: All leads including the main lead and other leads adopt the same gain control.
This Monitor provides two methods to regulate the electrocardiogram waveform range:
Automatic mode: Under the automatic mode, according to the main lead waveform data, the Monitor will automatically regulate the gain to amplify the ECG waveform of the main lead without the distortion as possible. The defect of the automatic mode is slow regulation speed, under this mode, the manual gain regulation knob 【Adjust Gain】is voidable.
Manual mode: Under the manual mode, the Monitor will not automatically regulate the ECG gain value. At this time, the ECG gain is regulated via the 【Adjust Gain】 knob. The feature of the mode is fast response, the waveform will change immediately after the gain is regulated, and can amplify the waveform to a distortion status to display.
These two modes are switched via the knob 【Gain Mode】.
【Adjust Gain】: Manually regulate the ECG gain. After pressing down the rotating mouse, regulate the gain via the rotating mouse. Rotate to left, the gain and wave range become small, when rotate to right, the gain and wave range become large, after accomplishment of the regulation, press down the rotating mouse again.
【Mode】: The measurement mode means the filter bandwidth of the ECG channel. Under the diagnosis mode, the filter bandwidth is set to the widest, which can get the detailed information of the ECG signal. The more detailed information is helpful to more accurately judge the status of the ECG signal. But when the importation of the detailed information, the environmental noise may be imported tot, one example for this kind of noise the HF electrotome, the noise mixes with the real ECG signal, so that the ECG signal can not be distinguished. In order to adapt to the noise interference situation, the Monitor also provides two measurement modes, namely the monitoring mode and the operation mode, under these two modes, it adopts narrower bandwidth to measure and gains more smooth signal, the user can make choices according to the exact situations, the comparing data are as followings:
Measurement mode Bandwidth Details Noise Diagnosis 0.05Hz~100Hz Most Most
Monitoring 0.5Hz~40Hz Medium Medium Operation 1.0Hz~25Hz Least Least
Notice: all leads including the main lead and other lead adopt the same measurement mode.
【Waveform Speed】: regulate the waveform speed for parameters relating to the heart, including all ECG channels and blood volume waveform channels, it has four speeds such as 6.25 mm/s, 12.5 mm/s, 25 mm/s, 50 mm/s.
4.1.2.2 Introduction on the interface of other lead channels
③ ④ ② ①
①lead type ②scale ③lead off sign ④ECG waveform
Select the position ① with the cursor, press the rotating mouse and switch lead types.
28

4.2 Parameter display
ECG parameters include the heart rate and ST segment, except the large character mode, the heart rate and ST segment are displayed on the right corner of the screen, the format is as shown in the Figure below.
② ③ ④ ⑤
①
⑨
⑥
⑦
⑧
①ECG waveform ②heart rate and main lead ST alarm limit ③heart rate alarm off sign ④heart rate label ⑤heart rate source sign ⑥heart rate ⑦main lead ST segment ⑧other lead ST segment ⑨ST segment
label. Tune the rotating mouse, move the cursor, select the heart rate label, and press down the rotating mouse, pop up the heart rate setting menu, as shown in the Figure below:
【Alarm On/Off:】: Switch between the alarm on and alarm off.
【Alarm Setting】: Check and regulate the alarm setting of the heart rate.
【HR Source】: Set up the selection strategy for the heart rate source. Press down and the following menu shows:
【AVRG.】: Set up the calculation average periods of the heart rate and ST segment, Press down and the following menu shows:
【ST On/Off】: Open and close the ST segment display, as shown in the Figure below:
Display the ST segment Hide the ST segment
29

Heart rate source selection function:
During the oxygen saturation testing process, the Monitor can measure the pulse rate. Pulse rate and heart rate, one of them can be displayed on the position of the heart rate, and this selection can be called heart rate source selection. This Monitor supports two kinds of heart rate source selection system such as automatic selection and manual selection, the current selected value is displayed here, the heart rate source mark and heart rate label clearly show the current heart rate source, the list is as following:
Label The color of the heart rate value Heart rate source mark Source Heart rate Green I, II, III, aVR, aVL, aVF, V Form ECG signalPulse rate Red SpO2 From SpO2 signal
Notice: pulse rate and heart rate use one set of alarm limit and alarm on/off. In spite where the heart rate value comes from, the alarm systems adopted are totally the same.
4.3 Maintenance
Caution If the ECG cable is damaged or aging, it shall be replaced by a new one.
4.4 Trouble shooting
Problem Possible reasons Suggestions and way-out
Lead off The ECG electrode fallen off from the animal’s body or the ECG cable fallen off from the Monitor.
Ensure the electrode, lead and cable are properly connected.
ECG signal noise is too loud.
The measurement mode is not correctly set according to the environment. The power frequency is not set in accordance with the local power frequency. The Monitor is bad grounding. The electrode is badly connected to the animal.
Change the electrocardiogram measurement mode. Set the power frequency right, refer to Chapter Three. Check the grounding system of the Monitor.Keep the animal quiet, and guarantee the reliable connection of the electrode.
No heart rate display No heart beat sound
The ECG signal is very weak. (<0.25mV) The electrode is badly connected to the animal. The animal type is not correctly set.The gain is not enough.
Check the connection between the electrode and animal, ensure the reliable touch of the electrode and animal’s skin. Correctly set the animal type. If it is the manual gain regulation, please tune the gain to the right magnification.
30

Chapter 5 NIBP Monitoring
5.1 Overview
■The noninvasive blood pressure (NIBP) measurement adopts the succussion.
■ It is applicable to dogs and cats and other animals.
■The measurement mode: manual measurement, automatic measurement and consecutive measurement, each mode displays the systolic blood pressure, mean pressure and diastolic blood pressure.
5.2 Blood pressure cuff installation
Make sure that the blood pressure cuff has been completely deflated; fix the blood pressure cuff on the upper arm or thigh of the animal as shown in Figure 5.1.
Ensure the pipe exit of the blood pressure cuff is rightly on the proper artery, confirm the degree of tightness of blood pressure cuff , don’t be too tight, or it can result in discoloration or ischemia of the extremity.
Figure 5.1 blood pressure cuff installation position
Cats must be left in its owners lap to keep them calm. Try to have the animal in an area away from noise and bright lights. Front limbs are preferable sites although in some nervous animals the tail could be an alternative location.
Sternal, lateral or dorsal recumbent positions are the choice for NIBP measurements in dogs although this could be a position difficult to achieve in large dogs which don’t cooperate. If so, place the dog in sitting position and take measurements from the metacarpus of any of the front limbs.
Other areas in dogs could be the metacarpus and the anterior tibia or the tail. Clip hair if it is too thick and could affect measurements. Avoid using the tail during anesthesia.
Notice:
① The width of the blood pressure cuff should span 40% of limb circumference or two-thirds of the supper arm length, the section for air charging shall be long enough to round 50~80% of the arm or leg, the inappropriate size of the blood pressure cuff will lead to error reading.
31

② The limb to be measured shall be in the same level with the heart, if it can not be realized, the following correction shall be carried out on the measurement result.
■ If the blood pressure cuff is above the heart level, add 0.9mmHg (0.10kPa) to the displayed value per centimeter, or 2.2 mmHg (0.25kPa) per inch.
■ If the blood pressure cuff is low to the heart level, subtract 0.9mmHg (0.10kPa) from the displayed value per centimeter, or 2.2mmHg (0.25kPa) per inch
■ If you have suspicious on the accuracy of the reading, before checking the function of the Monitor, check the animal’s vital signs with possible means at first.
Caution
Please use the accessories approved by our company, or it will lead to the malfunction of the Monitor.
Do not use it to measure the NIBP on the animal with skin damage.
For those animals with severe blood coagulation mechanism malfunction, the automatic blood pressure measurement shall be adopted or not on the basis of the clinic evaluation, because the limb friction with the blood pressure cuff may lead to the risk of haematoma.
Do not install the blood pressure cuff on the limb with intravenous transfusion or pipe, because when the blood pressure cuff is charged with air, it will lead to the organ damage around the pipe due to slow intravenous transfusion or block.
Under the automatic mode, if the NIBP measurement time is too long, the friction between the blood pressure cuff and limb will lead to the purpura, lack of blood or nerve damage. When monitoring the animal, the veterinarian shall often check if the color of the remote limb end is normal, the warm degree and sensitivity. If some abnormal situations occur, stop the blood measurement.
The air charging pipe between the blood pressure cuff and the Monitor shall be unobstructed and cannot be tangled.
5.3 The limitations on the measurement
The blood pressure measurement of this Monitor is vibration measurement. This measurement looks for a regular artery pressure pulsation. If animal’s condition is not applicable to use this method, the measurement value may become unreliable; the measurement time will be increased too. The user shall realize that the following situation interfere the measurement method, which make the measurement becomes unreliable or the longer measurement time, under this condition, the animal’s status will make the measurement impossible.
Animal’s exercises: for example, if the animal is exercise, shivering or jerking, which will make the measurement result unreliable or even impossible, these conditions will interfere in the artery pressure pulsation measurement, further more, the measurement time will be prolonged.
Arrhythmia: for example, if the animal is in irregular heart beating due to the cardiac arrhythmia, the measurement result will be unreliable or the measurement can not be carried out, the measurement time will be prolonged too.
32

Pressure variations: if the animal’s blood pressure changes rapidly during certain measurement process, the measurement will be unreliable or can not be conducted,
Severe shock: if the animal is in severe shock or very low body temperature, the measurement will be unreliable, because the blood flowed to the periphery, which leads to the decrease of the arterypulsation.
Ultimate heart rate: when the heart rate is low than 30bpm (heart beat /minute) or is more than 300bpm, the measurement cannot be carried out.
5.4 Normal Blood pressure values
Feline normal values
The blood pressure values for cats are the same for all breeds. Normal feline blood pressure: 124/84.
Canine normal values
The average canine blood pressure is: 133/75, although these seem to be breeds specific. The following table shows normal values for a certain number of breeds.
Breed Systolic (mmHg)
Diastolic (mmHg)
Pulse Rate
Labrador Retriever 118 ± 17 66 ± 13 99 ± 19
Golden Retriever 122 ± 14 70 ± 11 95 ± 15
Great Pyrenees 120 ± 16 66 ± 6 95 ± 15
Yorkshire Terrier 121 ± 12 69 ± 13 120 ± 14
West Highland 126 ± 6 83 ± 7 112 ± 13
Border Collie 131 ± 14 75 ± 12 101 ± 21
King Charles Spaniel 131 ± 16 72 ± 14 124 ± 24
German Shepherd 132 ± 13 75 ± 10 108 ± 23
Terrier 136 ± 16 76 ± 12 104 ± 16
Bullterrier 134 ± 12 77 ± 17 122 ± 6
Chihuahua 134 ± 9 84 ± 12 109 ± 12
Miniature Breeds 136 ± 13 74 ± 17 117 ± 13
Pomeranian 136 ± 12 76 ± 13 131 ± 14
Beagle 140 ± 15 79 ± 13 104 ± 16
Dachshound 142 ± 10 85 ± 15 98 ± 17
Saluki 143 ± 16 88 ± 10 98 ± 22
Greyhound 149 ± 20 87 ± 16 114 ± 28
Pointer 145 ± 17 83 ± 15 102 ± 14
33

5.5 Monitoring display interface
①
②
③ ④ ⑤
⑨
⑥
⑦
⑧
① Systolic blood pressure alarm limit. ② Diastolic blood pressure alarm limit. ③ NIBP alarm off sign: when the alarm for systolic blood pressure, diastolic blood pressure and
mean pressure is in prohibition status, this sign will be displayed, if one parameter is allowed to alarm, then this sign will disappear.
④ NIBP, press down and NIBP setting menu shows. ⑤ Pressure unit. ⑥ Systolic blood pressure and diastolic blood pressure. ⑦ Mean pressure. ⑧ ⑨ The information prompting bar for the NIBP. Different information is displayed on it
according to different situations.
The NIBP setting menu is as shown in the Figure below:
【Alarm On/Off】 simultaneously switch the alarm on/off for systolic blood pressure, diastolic blood pressure and mean pressure.
【Alarm Setting】 check and set the alarm for systolic blood pressure, diastolic blood pressure and mean pressure.
【Auto/Manual】 switch the automatic measurement mode and manual measurement mode for the noninvasive blood pressure
【Test Interval】 set the automatic measurement time span under the automatic measurement mode 【Venous Puncture】 enter and exit the venipuncture status. 【Stat Test】 start up the continuous measurement. 【Inflate Pressure】 set the initial air charging pressure for the manual measurement mode.
5.6 Introduction on functions
The noninvasive blood pressure has two functions, one is blood pressure measurement, and the other is the venipuncture function.
5.6.1 Blood pressure measurement
When the blood pressure measurement process starts up, the Monitor charges the air into the blood pressure cuff, the human body blood pressure, including the systolic blood pressure, diastolic blood pressure and mean
34

pressure are measured out via the sensors, a measurement process is about 40 seconds.
There are three start-up methods for blood pressure measurement, one is manual measurement mode, the other is automatic measurement mode, and the third is consecutive measurement mode.
Manual measurement mode: under the manual measurement mode, each blood pressure measurement process shall be started up manually; the start up method is pressing the <START> on the panel of the Monitor, under this mode, the blood pressure cuff air charging pressure is set manually.
The manual measurement mode is entered by using 【Auto/Manual】 knob. When the”MANUAL” displays in the position ⑨, it means that it enters into the manual measurement mode. Position ⑧ does not display any information.
Automatic measurement mode: under the automatic measurement mode, the Monitor will periodically start up the blood pressure measurement according to the assigned time span. If you want to enter the automatic measurement mode, use the 【Auto/Manual】 knob to switch, when position ⑨ displays ”AUTO”, it means it has entered the automatic measurement mode, now position ⑧ shows clock format of the automatic measurement time span.
The automatic measurement mode has two status, one is the pause status, at this time, the clock at position ⑧ stopped, it means that although it has entered the automatic mode, but the automatic measurement cycle has not been started yet; the other status is the operational status, at this time the clock at position ⑧ runs, it means the automatic measurement cycle has been started. The clock at position ⑧ indicates how much time still remains for next measurement. In the pause status, carry out one manual blood pressure measurement, then it enters the automatic measurement operational status, you can see that clock at position ⑧ begins to run, if you want to stop the automatic measurement status, you can switch to the manual mode, then switch back to the automatic mode. If you press down the <START> knob during the blood pressure measurement, it not only can stop the measurement immediately, but also can switch the automatic measurement operational status to the pause status.
Notice: whether you are in the automatic mode or manual mode, press the <START> knob on the panel, you can start up the blood pressure measurement.
Notice: during the blood pressure measurement process, press down <START> knob, the Monitor stops the blood pressure measurement immediately and deflate the blood pressure cuff at the same time.
Continuous blood pressure measurement
The blood pressure continuous fast measurement mode is a mode used for operation or emergent animal, its feature is that if it is started, it will carry out blood pressure measurements time after time for consecutive five minutes, under this mode, the measurement mode adopted by the Monitor is simpler than other modes, after five minutes, the Monitor restores to the status (automatic or manual) before the continuous fast measurement.
5.6.2 Venipuncture
Under the venipuncture mode, the Monitor charge air into the blood pressure cuff to the assigned pressure, it keeps the assigned pressure during the assigned time length, then deflate the air.
The setting interface for the venipuncture is as following:
35

① The venipuncture mode switch. ② Keeping pressure. ③ Keeping time. The keeping time is calculated from the air charging time, until the air is deflated.
Animal type Pressure setting range Default pressure Maximum continuous time Large 20-80 mmHg 40 mmHg 100 s Small 20-50 mmHg 30 mmHg 60 s
④ After setting, press this key. When entering the venipuncture mode, the prompting bar will prompt the information as shown in the Figure below, it means it enters the venipuncture mode:
Under the venipuncture mode, you can use the <START> knob to start and stop the air charging. Notice: the blood pressure measurement has close relationship with the animal type, please set correct
animal type to ensure safety, refer to the relevant content concerning the Monitor setting.
5.7 Maintenance and cleaning
■ The reusable blood pressure cuff
The blood pressure cuff can be put in the ordinary hot air oven with high pressure vapor, it can be sterilized with gas or radiation, or put into the decontamination liquid to kill the bacteria, but remember, when you use this method, take out the rubber bag please. The blood pressure cuff cannot be dry-cleaned. The blood pressure cuff can be washed with hand or machine, its life time can be prolonged by hand washing. When you washed it, after the blood pressure cuff is completely dry, put the rubber bad into it.
If you want to put the rubber bag into the blood pressure cuff again, at first you can put the rubber bag at the front end of the blood pressure cuff, thus, the rubber pipe and the large slot of the long end of the blood pressure cuff are in the same line, now, roll the rubber bag longitudinally and insert into the large slot of the blood pressure cuff, hold the rubber pipe and blood pressure cuff, shake the whole blood pressure cuff until the rubber bag get into its position, then take the rubber pipe into the blood pressure cuff, and get it out via the inner of the hole.
■ Disposable blood pressure cuff
The disposable blood pressure cuff is appointed to be used on one animal, do not use the same blood pressure cuff on other animal, the disposable blood pressure cuff can not be sterilized or kill the bacteria with high
36

pressure vapor, the disposable blood pressure cuff can be washed with soap and clean water to control the infection.
Caution
Do not press or limit the rubber pipe of the blood pressure cuff.
Do not allow the water or detergent liquid get inside the air passage connection on the front of the panel, or the instrument may be damaged.
When the reusable blood pressure cuff is not connected to the instrument or being washed, be cautious to prevent the liquid from entering the rubber pipe and being soaked into the instrument.
When clean the Monitor, only clean the external of the connector socket, and do not clean its internal part.
Note:
In order to protect the environment, the disposable blood pressure cuff shall be recycled or be disposed properly.
5.8 Trouble shooting
Problems Possible reasons Suggestions and way-out
Start failure The Monitor hardware error Stop the NIBP measurement function, inform the supplier to dispatch qualified maintenance personnel to repair.
Blood pressure cuff is not connected
Blood pressure cuff is not properly tied up or no blood pressure cuff
Tie up the blood pressure cuff
Blood pressure cuff air leakage
Blood pressure cuff, rubber pipe or connector is damaged
Check and replace the air leakage part, if necessary, inform the supplier to dispatch qualified maintenance personnel to repair.
Weak signal Blood pressure cuff is too loose or the animal’s pulse is too weak.
Use other method to measure the blood pressure.
Over pressure protection The pressure is above the specified safety upper limit
Remeasure it again, if the failure continues, stop the NIBP measurement function, and inform the supplier to dispatch qualified maintenance personnel to repair.
37

Chapter 6 the Impedance Respiration Monitoring
This Monitor measures out the human body respiration movement waveform by the electrocardiogram lead line with the impedance method, this respiration movement waveform is used to calculate the human body respiration rate and analyses the human body respiration status.
The Monitor can measure three lead respiration waveforms according to the selection such as I, II, III, of which, the II lead is generally used. Because the different signal strength, the Monitor provides two kinds of gain adjustment functions such as automatic adjustment and manual adjustment, it can make the respiration waveform clear and without distortion by adopting appropriate gain.
6.1 The electrode connection
The impedance respiration method of this Monitor is to monitor the animal’s respiration by the impedance variation between the two electrocardiogram electrodes. The respiration monitoring is realized via the electrocardiogram I, IIorIII lead and their corresponding electrodes, so no additional electrodes are required, and the installation of the electrode is very important. For some animal, because of their clinical situation, the horizontal expansion of the thoracic cage leads to the negativity thoracic cage internal pressure, under this situation, it is better to put the two respiration electrodes at the central line of the right side of the thoracic cage or the most active area on the left side of the thoracic cage when breathing, so that the optimum respiration wave is gained.
Here we suggest installing five lead electrodes for the respiration monitoring, as shown in Figure 6.1.
Notice
① The respiration monitoring is not recommended to be used on the animal with large activity, because it will lead to mis-alarm.
② Symmetrically install white and red electrodes to get optimum respiration wave, avoid putting the liver and the ventricle on connecting line, which can avoid the false difference produced by the heart coverage or pulsation blood flow, this is very important for the neonatal.
6.2 RESP monitoring inspection
1) Make skin preparation for the animal before installing the electrode; 2) Open the crocodile clips wide enough to grasp the skin. 3) Connect the power for the monitoring system.
38

Installing the electrode for the respiration monitoring system
RESP
Figure 6.1
Notice
The white and red electrodes shall be installed on the cross to gain the optimum respiration wave. Avoid putting the liver and the ventricle on connecting line, which can avoid the false difference produced by the heart coverage or pulsation blood flow.
6.3 Monitoring interface
Impedance respiration monitoring interface and its menu are as shown in the Figure below:
① ② ③ ④ ⑤ ⑥
⑦
⑨
⑧
39

① Impedance respiration waveform label, select this label and the menu as the above Figure shows, the first knob ”RESP mode” is used to switch the respiration measurement mode, which can be switched between the impedance respiration and nasal tube respiration.
② Lead type, its corresponding menu knob is the [Lead]; ③ Gain mode, automatic or manual, their corresponding menu knob is [Gain Mode]; ④ Gain, it has four grades such as x1/2,x1,x2,x4, their corresponding menu knob is [Adjust Gain]; ⑤ Status prompting bar ⑥ Waveform speed is in four grades such as 6.25mm/s, 12.5mm/s, 25mm/s and 50mm/s, their corresponding
menu knob is [Waveform Speed], at the same time, this knob adjusts the speed of the impedance respiration and nasal tube respiration.
⑦ Respiration waveform ⑧ Scale ⑨ The range corresponding to the scale. The unit is Ohm, the length and range of the scale is different from
time to time along with different gains.
The respiration rate is displayed on the parameter area on the right side of the Monitor, as shown in the Figure below:
Select the respiration rate label, you can get following menu:
[Alarm On/Off:]: allow and prohibit the respiration rate limit alarm. [Alarm Setting]: check and set the respiration rate alarm setting.
6.4 Prompting messages
Lead off: it means that the current lead is not properly connected, when the lead line is not inserted on the Monitor or connected to the animal, this message shows.
Off line: it means the impedance respiration function is cut off internally, please check the settings in the menu key [System Setup] [Maintenance] [Reserved 1][ECG Switch] [I-RESP]. Please refer to the ECG on/off operation in the chapters and section about the ECG monitoring.
Running: except the abovementioned two conditions, the system will prompt “Running”.
40

Chapter 7 Nasal Tube Respiration Monitoring
7.1 Monitoring interface
The nasal tube respiration monitoring interface and its menu are as shown in the Figure below:
① Select this label and the menu as the above Figure shows, the first knob “RESP mode” is used to switch the respiration measurement mode, which can be switched between the impedance respiration and nasal tube respiration.
② Status prompting bar. ③ Waveform speed is in four grades such as 6.25mm/s, 12.5mm/s, 25mm/s and 50mm/s, their corresponding menu knob is [Waveform Speed], at the same time, this knob adjusts the speed of the impedance respiration and nasal tube respiration.
The respiration rate is displayed at the position of nasal tube respiration, they use the same position, please refer to the relevant parts concerning the impedance respiration monitoring.
7.2 The status prompting messages
Running: the system always shows “Running”.
41

Chapter 8 Temperature Monitoring
8.1 The installation of the temperature sensor
The G3D Multi-Parameter Animal Monitor can use two temperature sensors simultaneously, stick the body temperature sensors on the animal’s body where ought to be measured, and two body temperature datum are measured out, and gain the body temperature difference.
Caution
Before the monitoring, check if the sensor cables are properly connected, pull the temperature sensor cable from the channel 1 jack, the error message”T1 sensor is off” is displayed on the screen and the alarm sound is produced, the other channels are similar to this.
Be cautious to deal with temperature sensors and cable. When it is not in use, the sensors and cable ought to be ringed loosely, if the cable cores inside them are too tight, which will lead to mechanical damage.
The temperature instrument calibration shall be carried out once a year (or carried out according to the time specified in the hospital procedure). If the calibration is needed, please contact the manufacture.
Notice
The disposable temperature senor only can be used once.
During the monitoring process, the temperature measurement instrument will self-check every one hour, the self-check lasts for two seconds, it will not influence the normal operation of the temperature the Monitor.
The temperature measurement result is displayed on the parameter area of the Monitor, as shown in the Figure below:
④ ③ ②
①
⑤
⑥
⑦
① Temperature alarm upper/lower limit. ② Temperature alarm off sign. ③ Temperature parameter label. Select this label, the body temperature parameter menu shows, which
will be introduced later. ④ Temperature unit. It means the unit of the value. ⑤ Temperature difference. Temperature difference is the absolute value of the difference between the
temperature1 and temperature2. ⑥ Temperature1, measurement range: 25.0-45.0℃. ⑦ Temperature2, measurement range: 25.0-45.0℃.
42

8.2 Body temperature parameter menu
【Alarm On/Off】 allow or prohibit temperature parameter alarm.
【Alarm Setting】 check and configure temperature alarm setting.
In this Monitor, tow temperature channel use one set of alarm limit and alarm on/off. Temperature difference has no alarm function.
【Mode】 selects display content, it has three combination forms, as shown below:
The doctor can select the display content as required.
8.3 Maintenance and cleaning
Caution
When washing the sensor connecting to the Monitor, turn off the power and cut off the AC, please.
Reusable temperature senor
1) The heat for the temperature senor can not be over 100℃(212℉). It can only endure the temperature of 80℃(176℉)~100℃ (212℉).
2) The probe cannot be sterilized with the vapor. 3) It only can be sterilized with the detergent containing the alcohol. 4) When washing the sensor, hold the front end with one hand, the other hand clean the sensor toward the
connector with a wet downless cloth.
Notice
If what you used is disposable temperature senor, it cannot be repeatedly sterilized and reused.
In order to protect the environment, disposable temperature senor shall be recycled or properly
disposed.
43

Chapter 9 IBP Setting and Measuring (Optional)
9.1 Waveforms displaying
Two channels of waveforms are displayed in a same/different waveform area, differentiated by color. When the two curves overlapped, the color of curve will be the color of channel 2.
The height of the waveforms relates to the pressure. And the ratio between height and pressure is specified. Maximum value and Minimum value are listed in the following table:
Maximum value on screen Minimum value on screen 6 mmHg -1 mmHg
10 mmHg -1 mmHg 18 mmHg -2 mmHg 30 mmHg -3 mmHg 60mmHg -6mmHg 80mmHg -8mmHg
100mmHg -11mmHg 120mmHg -13mmHg 180mmHg -20mmHg 240mmHg -26mmHg 300mmHg -33mmHg
The monitor can automatically select a proper ratio according to the phase of the waveform. It also provides a function to adjust the ratio manually. Here we call it two gain modes: auto mode and manual mode.
At the left side of the waveform, there is a scaled axis. It is the pressure axis of channel 1. And at the right side of the waveform, there is also an axis for channel 2. The axis looks like:
Maximum
SBP
DBP
0 mmHg
The bottom horizontal line indicates the location of zero pressure. If a curve dot is displayed higher than this line, it means the pressure of this dot is positive; accordingly, the pressure of the dot, which is lower than this line, is negative.
The top horizontal line indicates the maximum pressure of current display gain. The curve line where its pressure is higher than the maximum pressure will be clipped and becomes a section of horizontal line.
And the 2nd horizontal line counted from top is the location of SBP. The 3rd horizontal line is the location of 44

DBP. So via this scale ruler, operator can easily tell the pressure of the curve.
9.2 Module status display
The status of two channels is displayed at the line above the waveform. All the possible status messages are listed in the following table:
Message string Meaning Possible causation
No response The monitor can not get data from this channel
When the monitor is restarting, this message indicates that the channel is not started yet, but the message should disappear in 5 seconds. The hardware of IBP module does not work properly. It needs to be fixed.
Zero process… This message indicates zero operation is in progress.
This is a normal message. It will appear when zero is processing, and disappear immediately when the process is finished.
NOT zero This message is to tell the operator that the channel did not perform zero processing
Operator has to perform zero process after the monitor is started. If not, the pressure measured is unusable.
(Auto/manual) This is a normal working message. It tells the current gain mode and gain ratio.
The channel works properly.
9.3 Pressure value display
IBP measures SBP, DBP and MAP values. Pressure values of both channels are displayed at the right of the main screen. These values can vary in the range from –60mmHg to 300mmHg. Values not in this range will be displayed as invalid pressure, in the form of ‘---‘ or ‘--.-‘. But there are more reasons if these pressure value is displayed as invalid value, they are:
1. The actual pressure is not in the proper range from -60 mmHg to 300 mmHg. 2. The channel did not perform zero process. 3. The cable is disconnected or not connected firmly. 4. The channel is not calibrated properly. 5. Zero in processing. 6. Monitor is starting.
The pressure values are displayed in the same unit as the NIBP. So if operator wants the IBP pressure values are displayed in another unit, he has to use the menu of NIBP.
Menu operation guide
Let menu disappear, then use the rotating mouse to select a target IBP channel, press down the rotating mouse, we will get a menu which operates on the specified channel. In this menu, we can change the label of the channel, process zero, and select the display gain policy. Functions of these menu items are describing one by one below.
45

Select LABEL
Once the menu button is pressed, the label of the channel will be changed. We can see the changing of the label displaying near the pressure values and the one displaying in the status area. The label recycles in the order listed below:
Label Customary meaning
ART Artery pressure
CVP Center vena pressure
RVP Right ventricle pressure
LAP Left atria pressure
RAP Right atria pressure
PAP Pulmonary artery pressure
ICP Encephalic pressure
LVP Left ventricle pressure
After the selection, the label will be saved in 5 seconds. The monitor will reload and assign the saved label to the corresponding channel at the next start.
These labels are provided as a sign to the channels only. It does not take any other effect other than displaying.
ZERO
In the first time we press this menu button, the corresponding channel will perform zero process. And press the menu button again will terminate the zero process. The system will treat the detected absolute pressure value as the relative zero point. This zero point affects both the pressure values and the waveforms of the channel.
Before performing a zero process, operator should connect the sensor and the pipes, and then plug the cable to the monitor. Make sure the other end of the pipe is open to the air and keep the pipe stay statically. Then it is ready for a zero process. The operator has to decide when the processing will finish. If the pipes are shaking, operator must wait until the pipes get static. If the pipes are static, the process can be done very fast.
Operator has to perform zero process after the monitor started. And before each measurement and after each time the pressure sensor or pipes is changed, zero process must be performed. It’s recommended to perform zero process at lease one time every day.
GAIN MODE
The menu button is to select the display gain mode for the channel. The gain mode switch between auto and manual when press this menu button. This function is disabled if the channel did not zero.
ADJUST GAIN
If the gain mode of the channel is manual, we can use this menu button to increase/decrease display gain of the channel. The clockwise for decrease, whereas for increase. This operation zooms in the waveform in vertical direction. This function is also disabled if the channel did not zero.
46

CALIBRATION
Calibrating operation is used to calibrate the sensibility of the pressure sensor. IBP module needs to change pressure sensor frequently. And there must be different sensibility between two sensors. So we need to calibrate when the pressure sensor is changed or the temperature changed. The result of calibration affects both waveform and pressure values.
Before calibrating, zero process must be done. The system will disable calibrate function if the channel did not zero.
Calibration can be done by the following steps: Connect the sensor pipe with a sphygmomanometer, then pump the sphygmomanometer until the azoth column rise to about 200mmHg. At the same time, the monitor will display the pressure it detected, we can see the pressure may not equal to the value of sphygmomanometer. If the azoth column is static, operator push the menu button→System Setup→Calibration→IBP Calibrate, enter the calibrate function of the channel, and input the correct value. In the calibrate function, it display the pressure value on the screen, then the operator can use the rotating mouse to change the value. Then press the rotating mouse to confirm the operation, or press the menu key to cancel. Once the new value is inputted, the system will calculate a new ratio and apply it immediately. The new ratio will be saved in 5 seconds, and will be load at the next start.
47

Chapter 10 Trend Analysis
The trend data is the animal’s data collected along with the time accumulation, the trend analysis is animal status chart displayed according to the trend data; the trend graph or trend table can be prepared according to the parameters selected by the user. Except the noninvasive blood pressure, they all are consecutive curves, the trend graph (table) can provide time zoom and range zoom to meet the needs of observing trends map of the animal’s status; at the same time, the corresponding trend data list is provided for detailed analysis.
10.1 Main interface trend analysis
Main interface trend graph (table)
Now begins to introduce the main interface trend graph (table): The main interface trend graph (table) displays the latest trend data distribution in-real time, and the parameters can be selected according to the user’s intention. Turn to the time concerned and adjust the time zoom spans.
Display the trend graph (table):
Press menu key and enters into Display, then click the Format Setup, in the display channel selection window select the trend graph (table), after determined, you can see the corresponding trend graph (table) in the main interface (as below).
Trend graph distribution introduction:
48

①Parameter label: The menu entrance for operation on the trend graph.
②Measure scale: Mark the value scale on the trend graph.
③Trend graph display area: The trend graph is displayed on the upper part, the scale in the lower part is the time scale.
Trend graph display area: in the ordinary status, the trend graph of the latest time span is displayed in this area, the data is more than one screen, the graph automatically rolls left; you can use the “Last Page” to check the early stage trend data chart, use the “Next Page” to check the latest trend data graph, the color of the graph is determined by the parameters, the void values is brown.
Operational specification:
1. Label: click the parameter label and enter into the operational menu.
2. Parameter selection menu: the selection is as shown in the Figure below: any parameter; the corresponding trend graph is displayed in the trend graph display area.
3. Adjust the time quantum of the trend graph: operate the [Last Page], [Next Page] in the menu to adjust the time, or turn the graph up or down.
4. [Step]: Operate the “Step” in the menu and enter the function as shown in the Figure below: select the step menu, the graph will be compressed according to selected step, the new graph in the display area of the trend graph line shall be added according to this step.
5. Range: The menu is shown as below, it is used to control the Y coordinate value range of the trend graph, the adjusted range will be stored in the Monitor, it will be applied at next start up; the range zoom has three adjustment methods such as alarm limit range, maximum range, manual adjustment, when the user set the zoom range, the trend data takes it as the upper limit/lower limit according to this range, the value over the limit is void value.
Trend table distribution introduction
49

① Menu operation: The menu entrance for the trend table operation.
② Data display area: In this area under the ordinary status, the trend data of the latest current time quantum is displayed in this area, when the data is more than one screen, it automatically rolls down or up, or use the [Last Page], [Line Up], [Line Down], [Next Page] to check the trend data of the time quantum concerned by the user.
Operational specification:
1. Enter into operation menu:
2. Adjust the time quantum of the data: adjust the time quantum of the time forward or backward data by using the knobs such as [Line Up], [Line Down], [Last Page], [Next Page];
3. Adjust the step: enter the step selection menu by operating the “Step” in the menu, which is shown in the Figure below: Select the step menu, the data in the trend table is compressed according to the selected step, the new data in the trend table will also be added according to this step.
10.2 The trend analysis of the trend window
Now we introduce the popup trend window, it enters into the historic database from the system menu, and enters the trend window by clicking the trend display; the popup trend window can analyses the trend of one parameter or several parameters via the trend graph or trend table; it can conduct time zoom and manual adjustment value range according to the user’s intention.
Trend graph distribution introduction:
50

①Parameter mark: Mark the required drawing parameter selected by the user.
②Scale: Mark the value range of the trend graph.
③Cursor: Move this cursor by [Cursor].
④Parameter table: The corresponding value of the parameters at the current cursor time is displayed in this area, the inverse black text is the selected parameter, the part below the list is the area to display the event and step.
⑤Trend graph display area: Display the trend graph of the selected time quantum in the trend data, the color of the curve is determined by the parameter, of which, the void value is gray.
⑥Starting time of the trend data: It is used to mark the starting time of the trend data in the Monitor.
⑦Cursor time: It is used to mark the time value where the cursor is.
⑧End time of the trend data: It is used to mark the ending time of the trend data in the Monitor.
⑨The mark of the cursor time value in the trend data: It marks the cursor time value in the trend data with red point.
⑩Event mark: It is used to mark all event recorded in the current page.
⑾Time scale: It is used to mark the time scale within the time range of current page.
Operational specification:
The operation menu is as following:
1. Select the parameter: The user select one to three parameter combination in the menu, the selected parameter is displayed with inverse positive figure in the parameter table, click the selected parameter again, it will be canceled, click the [OK], the corresponding trend graph will display in the trend graph display area.
2. The graph time quantum: through the knobs such as [Last Page], [Next Page], the user can browse the trend graph forward or backward, until the required time quantum is founded.
3. [Cursor]: Click this knob and rotate, the cursor on the trend graph which move in accordance with the rotating direction, the time value and events where the cursor is will be displayed in the parameter table.
4. [Step]: select any time step as shown in the following Figure, the trend graph will compress the trend data according to this step, and display it in the trend graph display area.
5. Range: The menu is as below, the value range used for control of the trend graph Y coordinate, the adjusted range will be saved in the Monitor, it is applicable in the next start up. There are three methods
51

for range zoom, including alarm limit range, maximum range, and manual adjustment, when the user set the time zoom range, the trend data will take this range as the upper limit/lower limit value, the value above this is voidable.
ALARMLIMIT: The alarm limit set by the system user is as the value range.
MAXRANGE: The default range of this type of Monitor serves as the value range.
MANUALADJUST: The user clicks and rotates the [MANUALADJUST] knob to adjust the upper/lower
limit range, its value range is limited by the maximum range.
6. Trend table
In this trend table, the information in the trend graph is displayed in list, the parameter number and category are the same with the trend graph. In the trend table, the central time is the cursor time of the trend graph, in the trend table, the value of each parameter is date and time value (except NIBP), the NIBP is the first value in the current step.
Trend table operational specification:
■ Adjust the data display time range: Adjust the data display time range via the knobs such as [Line Up], [Line Down], [Last Page], [Next Page] to get the time quantum concerned by the user.
■ Adjust the time step: Adjust the time span of each data line in the trend table by step.
52

Chapter 11 the Waveform Freeze and Replay
Waveform freeze and replay, this function can freeze the current waveform of the Monitor, so that it is convenient for the doctor to check; turn several pages up or down, you can browse the current waveforms of several seconds, or save the required waveform for further analysis.
11.1 Waveform freeze operational specification
Press the freeze key in the control keyboard, the waveform in the screen is frozen, the following menu shows:
Browse the waveform: the user can turn the waveform forward or backward via the two knobs such as [Last Page] and [Next Page].
Save waveform: Press the [Save] knob to save the frozen waveform section for replay later, if the waveform is successfully saved, the following menu shows:
The waveform replay operational specification:
Enter the [Recall] menu via the [Review] knob, the first frozen waveform is displayed on the screen, the menu is as following:
Select frozen file: Press the [Select File] knob, the following interface shows:
①The start time of the selected file;
②The selectable defrozen file.
Move the cursor to position ② you can select the corresponding time by rotating the knob, click [OK], the corresponding waveform is being drawn in the screen.
Browse waveform: The user can turn the waveforms forward or backward via the knobs [Next Page] and [Last Page].
53

Chapter 12 Envent Record
Event record function, it is mainly used to record events for further reference, through the [Tools] menu, click
the [Event], the following interface shows:
①It can be used to record the event numbers.
②Display that the event was successfully recorded.
Event record operational specification:
Record events: click the corresponding events recorded in the [Event1], [Event2], [Event3], [Event4], the
position ② will display the event that was successfully recorded;
Browse events: you can see the event records at the corresponding time of the day in the event display area
of the trend analysis.
54

Chapter 13 How to Use the Drug Calculator
The drug mixture used for intravenous transfusion and transfusion involves the information such as the drug dosage, infusion speed, dose, volume, and concentration. The drug calculator can calculate the unknown value via the known items to help you to control the drug infusion.
Caution Before using any drug, you shall check that whether you have selected the correct calculation unit or animal weight, if you have some problems, please consult the dispensary in your hospital.
It is always that the doctor in charge determines to use the drug and dosage. The drug calculator will calculate the dosage based on the input value, it cannot verify the validity of the calculated data.
1. Enter the drug calculator
In order to enter the drug calculator, press the menu key Tools Drug Calculator.
2. Unit
Drug unit
When the drug name is” Any Drug”, you can select: g, mg, mcg, unit, k unit, m unit, mEq.
When you select the drug name, the drug unit is set by the drug calculator automatically, the user cannot modify it.
After the drug unit was set, the unit relating to the weight in the drug calculator changes correspondingly, the unit of the titration process table and titration table are keep pace with it.
Time unit
It has two selections such as min (minute), hr (hour). After setting the time unit, the units in the drug calculator changes correspondingly, the units in the drip table, titration table also keep pace with it.
3. Terms
Amount
The total weight of the drug used by the animal within certain time.
Volume
55

The volume of the mixed liquor formed by drug diluents and drugs.
Dose/min, (dose/hr)
The drug quantity injected into the animal within unit time (per minute, hour)
Dose/(kg*min), dose/(kg*hr)
The drug quantity per 1kg of animal weight injected in the animal within the unit time (per
minute, hour)
dose/(kg*min) * weight = dose/min
dose/(kg*hr) * weight = dose/hr
Rate
The volume of the mixed liquor injected into the animal body within unit time (per minute, hour), the unit is ml/min, ml/hr.
Rate/kg
The volume of the mixed liquor per 1kg of animal weight injected into within unit item (per minute, hour), the unit is ml/min, ml/hr.
Rate/kg * weight = rate
Time
The consumed time for drug transfusion (the unit is min, hr).
Concentration
The concentration of the liquor form by the drug diluents and drug,
concentration = amount / volume
Drip/min, drip/hr
The transfusion mixture within unit time.
Drip/ml
The volume of each guttae dropped form the transfusion device, the unit is GTT.
4. Drug calculation execution
a) The operation of numeric input block
The number is input according to the digit, when enter the numeric input block, the numeric input block selects the first digit at left, tune the rotating mouse the numeric input block selects each digit consecutively from left to right, when it reach the last, it jumps to the first digit repeatedly, press the rotating mouse and enter the digit selection status.
The selection range for each digit is 0~9.
When the digit is more than the display value, it displays ---.--, when it less than the display
value, it displays 0.00.
56

When it cannot display all digits, the round is adopted.
b) Calculation rules
The relational expression of the drug weight
amount=dose/min * time
dose/min=dose/(kg*min) * weight
The relational expression of liquid volume
volume=rate * time
rate=rate/kg * weight
Concentration=amount / volume
c) Known item and calculation results
Amount, dose/min, dose/(kg*min), volume, rate, rate/kg, time and concentration can be input as the known item or be output as the calculation result.
The user input the known items (at least three) according to the calculation requirements, according to the input items; the drug calculator can automatically calculate the item which has computation relationship with it.
The known item input by the user is expressed with digit in blue background, the calculation
result is expressed with digit in gray background.
When enters this window, all items are displayed as 0.00, all items can be input with value, when the user inputs the known item, the drug calculator can calculate and the result displays in-real time, then the calculation result is locked, the user only can modify the digital value in the input known item, modify the input item as 0.00 means cancel this input.
The reset knob restores to the initial status of the input.
d) Conduct calculation for any drug When the drug selection is any drug, the drug calculator only provides the calculation function
for the transfusion liquid, while have no application range prompt for the dose, concentration.
Input three items such as weight, drug unit, and time unit. 57
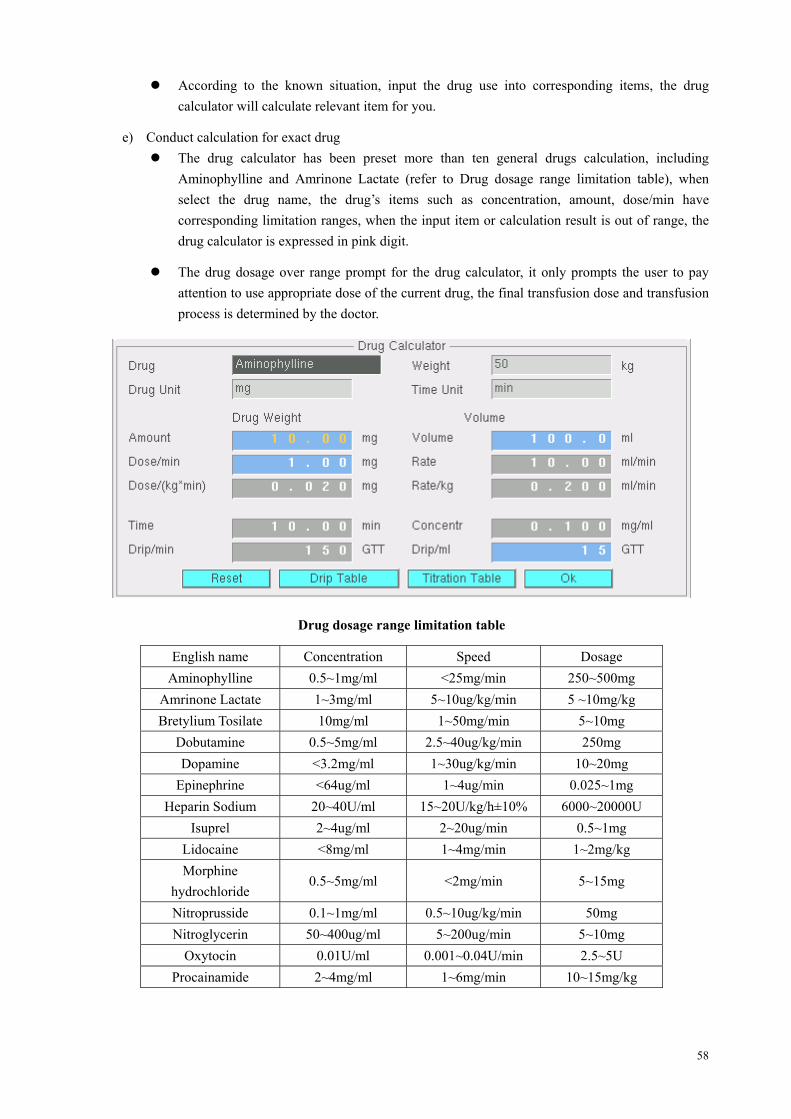
According to the known situation, input the drug use into corresponding items, the drug calculator will calculate relevant item for you.
e) Conduct calculation for exact drug The drug calculator has been preset more than ten general drugs calculation, including
Aminophylline and Amrinone Lactate (refer to Drug dosage range limitation table), when select the drug name, the drug’s items such as concentration, amount, dose/min have corresponding limitation ranges, when the input item or calculation result is out of range, the drug calculator is expressed in pink digit.
The drug dosage over range prompt for the drug calculator, it only prompts the user to pay attention to use appropriate dose of the current drug, the final transfusion dose and transfusion process is determined by the doctor.
Drug dosage range limitation table
English name Concentration Speed Dosage Aminophylline 0.5~1mg/ml <25mg/min 250~500mg
Amrinone Lactate 1~3mg/ml 5~10ug/kg/min 5 ~10mg/kg Bretylium Tosilate 10mg/ml 1~50mg/min 5~10mg
Dobutamine 0.5~5mg/ml 2.5~40ug/kg/min 250mg Dopamine <3.2mg/ml 1~30ug/kg/min 10~20mg
Epinephrine <64ug/ml 1~4ug/min 0.025~1mg Heparin Sodium 20~40U/ml 15~20U/kg/h±10% 6000~20000U
Isuprel 2~4ug/ml 2~20ug/min 0.5~1mg Lidocaine <8mg/ml 1~4mg/min 1~2mg/kg Morphine
hydrochloride 0.5~5mg/ml <2mg/min 5~15mg
Nitroprusside 0.1~1mg/ml 0.5~10ug/kg/min 50mg Nitroglycerin 50~400ug/ml 5~200ug/min 5~10mg
Oxytocin 0.01U/ml 0.001~0.04U/min 2.5~5U Procainamide 2~4mg/ml 1~6mg/min 10~15mg/kg
58

5. Display the drip table
The “Drip Table” shows how much liquid is transfused into the animal’s body at a glance, and how much
time remains.
The drip table displays the residual quantities of the drug and liquor at each time quantum when the user inputs the data into the drug calculator window.
At the main window of the drug calculator, select “Drip Table” knob and enter this function.
The left side of the widow shows the data (and calculation result) inputed by the user at the drug calculator window, the right side is equally divided into 15 parts according to the whole transfusion process, lists the amount and volume at each time quantum.
All items in this window cannot be modified.
In the table, the unit of the amount is the same as the input unit at the drug calculator main window, the volume unit is ml.
Press the “OK” knob and exit the “Drip Table” window, return to the drug calculator main widow.
6. Display the titration table
At a glance, you can see the drug dosage accepted by your animal at different rates, the higher the rate is, the larger the steps are between the items of the table.
The titration table shows that at the same liquid concentration, the dose/min has a coincidence relation with the rate.
Select the “TitrationTable” knob at the drug calculator main window and enter this function.
The left side of the widow shows the data (and calculation result) input by the user at the drug calculator window, the right side is equally divided into 30 parts according to the range in the benchmark item, it shows the coincidence relation between the dose/min and rate.
In the list the user has two items such as ”Dose/min”(if the time unit selected in the drug calculator main window is hr, then this item and titration table list head both are displayed as” Dose/hr”) and “Rate”.
59

Dose/min (Dose/hr), its range is the one to two items as the dosage input by the user in the drug calculator, calculate the titration table.
Press the “OK” knob and exit the” Titration Table” window, return to the drug calculator window.
7. Reset
Exit the drug calculator window or turn off the Monitor, the drug calculator data input by the user is still saved, when the user enters the drug calculator window again, the latest input shows. If the user wants to start a new calculation, please press the” Reset” knob in the drug calculator and clear the input data, the new calculation starts.
60

Chapter 14 The Printing Function of the Monitor (Optional)
For the Monitor, the printing function is optional, you determine whether to have the printing function according to the different configuration of the Monitor, which can print one real time waveform of the main lead ECG (main lead definition please refer to other Chapters and sections) or two real time waveforms of the main lead ECG blood volume, with two printing speed of 25mm/s, 12.5 mm/s; and provides timing printing and alarm printing.
14.1 The connection mode of the printer
The printer used for this Monitor is a special thermal printer, which adopts embedded installation mode, generally it is installed on the side of the Monitor. Do not install any other types of printer to this Monitor, or it will damage the printer. If you have any doubt, please contact the manufacturer immediately.
■ When the printer is properly installed, turn on the Monitor, the indicator of the printer power is
green, if the red error alarm indicator lights, it means that the printer is in paper lack status, do not print at this time, or it will lead to the damage of the printer.
■ The printing paper is single side thermal printing paper, lightly press the printer knob, the cover opens, the side of the printing paper with temperature sensitive coating is smooth, this side shall be installed upside, close the printer door, the red error alarm indicator is off.
■ Check the printer whether it’s properly connected, if not, the printer setting popup block will show the information “Printer is not probed correctly! ”.
14.2 The configuration of the monitor
When setting the printer, please select the ”Recorder Setup” menu in the main menu, popup the dialog box “Set Printer Parameters”.
The printer setting interface is as follows:
Curve mode is used to select the curve channel numbers and content which need to print, in “Mode 1” it prints one electrocardiogram, namely: the main lead ECG; in “Mode 2” it prints two waveforms: the main lead ECG+blood volume waveform.
The printer paper speed can be regulated via the “Curve Speed”, it has two grades to be selected: 25mm/s, 61

12.5mm/s.
“Total” is the total printing length when printing waveform by pressing print key. The unit is second, the minimum length is 5 seconds, the maximum is thirty seconds.
“Alarm Print” is to print all the parameters when a parameter alarms, including heart rate, SpO2, blood pressure, respiration rate and body temperature.
“Timer Print” is only to print the parameter. The default settings for the “Alarm Print” and “Timer Print” are off.
■ Notice: when the printer is in working status, it cannot be configured.
■ Notice: When the timing time arrives, if the printer is in working status, the Monitor will give up this parameter printing.
14.3 Waveform and parameter printing
Press the print key and start up the waveform printing, when reaching at the setting print time, it stops waveform printing and start to print the parameter, if the printer does not stop printing, press the print key and stop the current printing in advance.
■ Notice: when the thermal recorder start up to printing the waveform, you can not forcefully open the printer’s cover when the recorder is still in work, you can take the printing paper out unless you stop the recorder.
If the printing paper in the recorder is used up, you must install the printing paper again, then restart the recorder, you could not start the printing function without the printing paper.
62

Chapter 15 CO2 Setting and Measuring (Optional)
15.1 Introduction
CO2 monitor is to monitor the respiration of animal by detecting the concentration of CO2 generated during respiration. The maximum concentration of CO2 at the end of exhalation is called End-Tide CO2 (ETCO2). The minimum concentration of CO2 at the end of inspiration is called Inspiration CO2 (inCO2). CO2 is generated by cells in the body during metabolizing, and is breathed out via breath system. The concentration of CO2 breathed out from lung reflects directly the situation of metabolizing and breathe system. If the concentration of CO2 is high, it means that metabolizing is excited, such as blood poisoning or acute fever. If the concentration of CO2 is low, it is commonly because the output ability of heart is weak, or the heart stop beating, or the lung soak for the flux of blood is low or oxygen it carried is not enough. Monitoring CO2 is used to warn the doctor of the abnormal of breathe and metabolizing for hocused animal. The concentration of CO2 is represented as a pressure level, with ‘torr’ or % as its unit. Generally, the acceptable value is 38mmHg (5%) when air pressure is 760mmHg. The concentration of CO2 varies very fast from 0% to 5% normally. To detect the concentration of CO2 accurately, the monitor has to be very sensitive.
15.2 CO2 measuring
Firstly plug the air-water separator to the socket. Then push the bottom of the separator carefully to its position. Then connect one end of the breath pipe to the separator and the other end to the animal.
Secondly, we use the menu of monitor to enable the CO2 measure function as the follows:
Select menu key -> Display -> Format Setup
When the CO2 channel displays on the screen, the Monitor works in the CO2 respiration monitoring status. At this time, the value of ETCO2 and inCO2 are displayed on the parameter displaying area. (Notice: if CO2 channel isn’t displaying, the CO2 respiration monitoring is closed.)
Important Note: please close CO2 channel (means do not display CO2 waveform on screen) when disconnect
63

CO2 accessories with animal and do not use CO2 function. If not, the motor in the CO2 module keeps running. Doing this can prolong the life of CO2 module.
15.3 Monitoring interface
CO2 monitoring interface and its menu are as shown in the Figure below:
① Concent. unit, it has three grades such as 76.0mmHg, 10.13Kpa, 10.00%, their corresponding menu knob is [Concent. Unit].
② Gain mode, automatic or manual, their corresponding menu knob is [Gain Mode]. ③ Gain, it has five grades such as x1/2,x1,x2,x4,x8, their corresponding menu knob is [Adjust Gain]. ④ Status prompting bar. ⑤ Flow rate,it has three grades such as 65cc/min, 100cc/min, 150cc/min. When monitoring CO2, doctor can
adjust the detect flux basing on the situation of the animal. Their corresponding menu knob is [Flow Rate].
⑥ Respiration waveform. ⑦ Scale.
The EtCO2 and inCO2 are displayed on the parameter area on the right side of the Monitor, as shown in the Figure below:
Select the EtCO2 label, you can get following menu:
[Alarm On/Off:]: allow and prohibit the EtCO2 and inCO2 limit alarm. [Alarm Settings]: check and set the EtCO2 and inCO2 alarm setting. [Concent. Unit]: concent unit setting.
64

Chapter 16 Packaging and Label
16.1 Packaging frontispiece
Model: G3 Quantity: 1pcs Date: Power Range: ~90V-265v, 50/60Hz, 80VA Manufacturer: General Meditech, Inc. Tel.: 86-755-26546289 Post Code: 518057 Website: http://www.szmedtech.com Address: South Office 4/F, Kezhi 1st Rd. West, Science Park
Nanshan, shenzhen, Guangdong P.R. China
ANIMAL MONITOR
16.2 Packaging profile
HANDLE WITH CARE
Net Weight: kgs Gross Weight: kgs Dimension: 425X300X350mm C/No.: of
16.3 Product nameplate
ANIMAL MONITOR
Model: G3 S/N:
Standard: YZB/粤 0320-2003 Q/SZGR1-2004
Registered No.: 粤食药管械(准)字 2004 第 2210391 号
Power Range: ~90V-265V, 50/60Hz,80VA
General Meditech, Inc.
65