funding disparities for low-income title i charter
TRANSCRIPT

The Federal Title I program provides financial assistance to school districts with high percentages of low-income students to ensure educational attainment. A Freedom of Information Act request reveals in the 2015–16 fiscal year that Florida’s largest school districts allocated 54 cents of Title I funding to eligible charter students for every one dollar designated for eligible district students. This inequity in funding contradicts Florida Statute 1002.33 17(c), which requires the “same level” of funding for charter and district students when using Federal funds. The disparity in funding compromises at-risk students exercising their right to school choice.
Arash KamiarFlorida Education Advocacy Fellow50CAN
The information and data contained in this report is independent research and was not created, approved, or endorsed by 50CAN, any of its affiliates or representatives.
Funding Disparities for Low-Income Title I Charter Students in Eight Florida School Districts

2 FUNDING DISPARITIES FOR LOW-INCOME TITLE I CHARTER STUDENTS IN EIGHT FLORIDA SCHOOL DISTRICTS
Table of contents
Introduction 3
Title I Students in Florida 5
Gaps in Funding to Title I Eligible Charter Students 8
Administration Costs & Roll Forward Amounts 10
Unspent and Unearmarked Funds are Available 11
Conclusion 12
Appendices 14

3 FUNDING DISPARITIES FOR LOW-INCOME TITLE I CHARTER STUDENTS IN EIGHT FLORIDA SCHOOL DISTRICTS
Introduction
This report presents analysis on how eight of Florida’s largest school districts distribute federal Title I funds to eligible charter schools with-in their jurisdiction. These districts encompass nearly 90 percent of all Title I eligible charter students in the state of Florida and include Bro-ward, Duval, Hillsborough, Miami-Dade, Orange, Osceola, Palm Beach and Polk County Public School Districts (see map, Figure 3).
The Federal Title I program is designed to provide financial assis-tance to school districts with high percentages of low-income students to ensure all children meet state academic standards. The federal De-partment of Education (DOE) annually provides these funds to the Florida Department of Education to deliver to local education agencies (LEAs), which in turn distribute these funds to eligible schools within their districts.
Freedom of Information requests were made to eight LEAs regard-ing the 2015–16 fiscal year. The request required a detailed breakdown of Title I spending and total Title I student populations (see, Appendix B).
The funding that should have been available to Title I charter stu-dents was determined by calculating the ratio of Title I charter stu-dents to the total Title I student population. Meaning, if 10 percent of Title I students were enrolled in charter schools then 10 percent of the available Title I budget should have funded eligible charter students. When this threshold was not met, the total gap in funding between Ti-tle I district and charter students was determined.1
This analysis found that for every one dollar an LEA spent on a me-dian Title I district student, only 54 cents was spent on the education of a median Title I charter student in Florida in the 2015–16 fiscal year.
Nearly 50 percent, or approximately $16 million, of Title I funds designated for “at-risk” Title I charter students were not delivered by school districts throughout Florida as required by state law.
Furthermore, because of the broad liberty the DOE provides to school districts, the report found that four of the eight LEAs in this analysis had administration costs exceeding more than 25 percent of their total Title I budget (see, Appendix G).
Although the study found a significant lack of funding parity in the 2015–16 fiscal year, it also concluded that unspent Title I funds (re-ferred to as “roll forward”) were available to rectify the funding dispar-ity. Seven of the eight LEAs would have had more than sixty percent of their roll forward or unspent funds available even after fully funding Title I eligible charter students.
1 Mandatory expenses were subtracted from a school district’s total Title I budget and extraordinary administrative costs were adjusted to capture the most reasonable amounts available to Title I-eligible charter and district students alike (see, Appendix D).

4 FUNDING DISPARITIES FOR LOW-INCOME TITLE I CHARTER STUDENTS IN EIGHT FLORIDA SCHOOL DISTRICTS
It is the final determination of this report that current school district funding formulas violate Florida law. Statute 1002.33 17(c) requires that charter students receive the “same level” of federal funding as dis-trict students:
(c) If the district school board is providing programs or services to students funded by federal funds, any eligible students enrolled in charter schools in the school district shall be provided federal funds for the same level of service provided students in the schools operated by the district school board.
Why This Matters?
The Florida legislature has supported equitable funding for children exercising their right to school choice for decades. The results of this study demonstrate that the right to school choice is compromised for low-income students and their families across the state.
Children who choose to attend Title I public charter schools are often the ones who are most “at-risk.” A disparity in funding for these students means fewer teachers, fewer textbooks, fewer enrichment ac-tivities and ultimately, fewer opportunities to succeed as compared to their counterparts attending traditional and fully funded schools. Not only is the education of Title I students at risk, so is their prospects to become invested and productive citizens of the state of Florida.
Nearly 56,000 Title I charter students had to forgo approximately $16 million in federal funds just for attending a public charter school of their choice (see, Appendix D). The implications of this issue are far-reaching; it extends beyond the lives of these students. If families are unable to trust Florida’s promise of equitable funding for those stu-dents who need it the most, how can they trust the state’s overarching commitment “to increase the proficiency of all students”?
5 FUNDING DISPARITIES FOR LOW-INCOME TITLE I CHARTER STUDENTS IN EIGHT FLORIDA SCHOOL DISTRICTS
Title I Students in Florida
The Federal Title I program provides financial assistance to school dis-tricts with high percentages of low-income students to ensure all chil-dren meet state academic standards. These funds are distributed to the state, which then distributes funds to local education agencies. The LEAs then determine which schools receive funding based on whether or not the school has reached a threshold in which a significant amount of their students are considered low-income. The LEA determines the threshold.
In Florida, both Title I district and public charter schools are enti-tled to the same level of funding according to state statute 1002.33 17(c). LEAs are directly responsible for distributing Title I funds to both dis-trict and public charter schools.
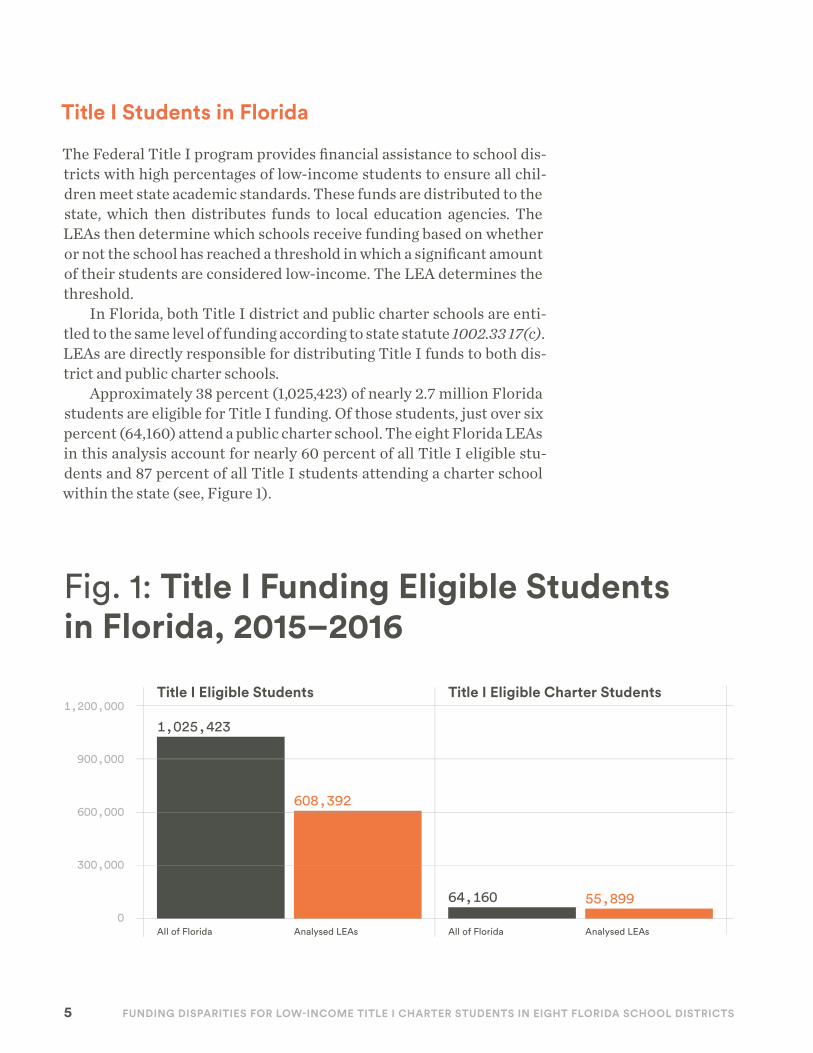
Approximately 38 percent (1,025,423) of nearly 2.7 million Florida students are eligible for Title I funding. Of those students, just over six percent (64,160) attend a public charter school. The eight Florida LEAs in this analysis account for nearly 60 percent of all Title I eligible stu-dents and 87 percent of all Title I students attending a charter school within the state (see, Figure 1).
Fig. 1: Title I Funding Eligible Students in Florida, 2015–2016
0
600,000
900,000
300,000
1,200,000
1,025,423
64,160
608,392
55,899
All of Florida Analysed LEAs All of Florida Analysed LEAs
Title I Eligible Students Title I Eligible Charter Students
6 FUNDING DISPARITIES FOR LOW-INCOME TITLE I CHARTER STUDENTS IN EIGHT FLORIDA SCHOOL DISTRICTS
LEATotal
Title I StudentsCharter
Title I StudentsDistrict
Title I Students
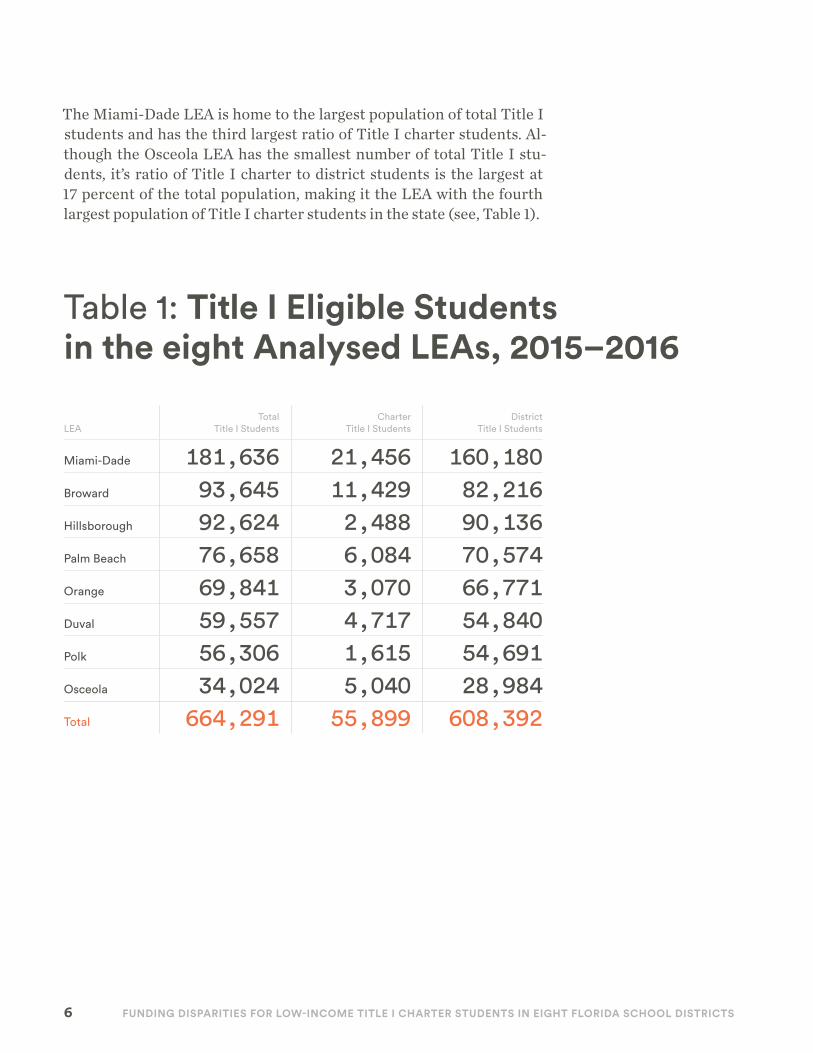
Miami-Dade 181,636 21,456 160,180Broward 93,645 11,429 82,216Hillsborough 92,624 2,488 90,136Palm Beach 76,658 6,084 70,574Orange 69,841 3,070 66,771Duval 59,557 4,717 54,840Polk 56,306 1,615 54,691Osceola 34,024 5,040 28,984Total 664,291 55,899 608,392
Table 1: Title I Eligible Students in the eight Analysed LEAs, 2015–2016
The Miami-Dade LEA is home to the largest population of total Title I students and has the third largest ratio of Title I charter students. Al-though the Osceola LEA has the smallest number of total Title I stu-dents, it’s ratio of Title I charter to district students is the largest at 17 percent of the total population, making it the LEA with the fourth largest population of Title I charter students in the state (see, Table 1).
7 FUNDING DISPARITIES FOR LOW-INCOME TITLE I CHARTER STUDENTS IN EIGHT FLORIDA SCHOOL DISTRICTS
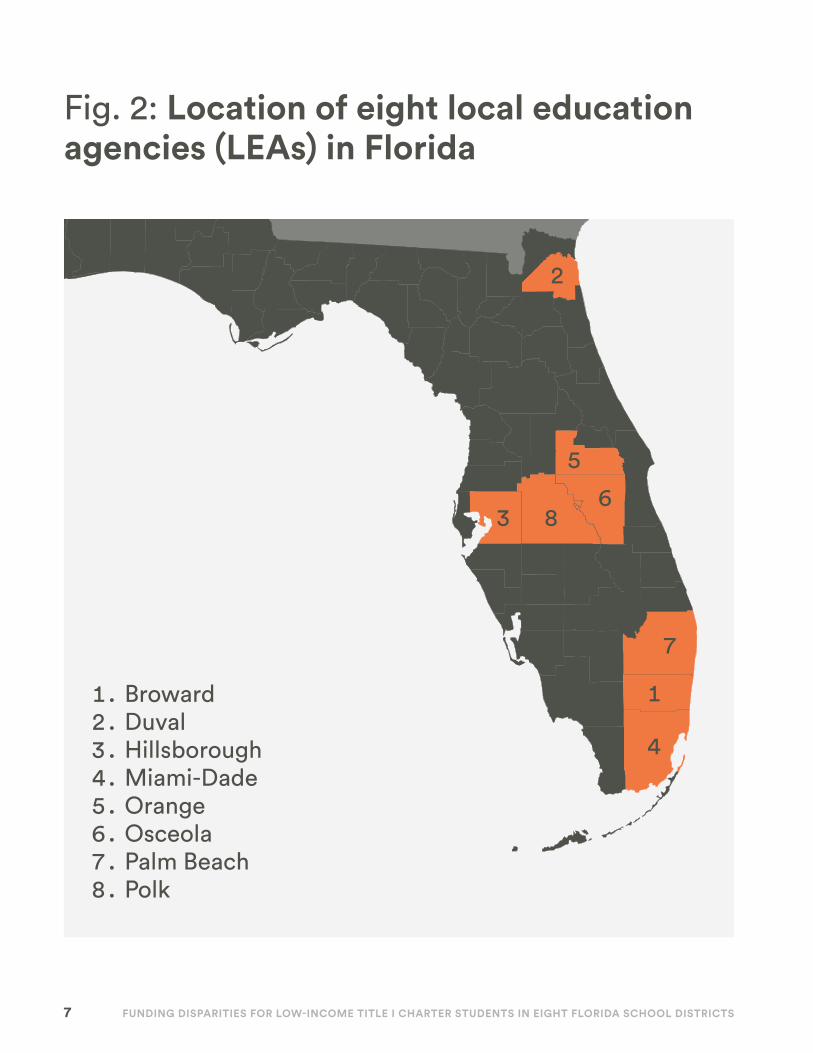
Fig. 2: Location of eight local education agencies (LEAs) in Florida
1. Broward2. Duval3. Hillsborough4. Miami-Dade5. Orange6. Osceola7. Palm Beach8. Polk
1
2
3
4
5
6
7
8
8 FUNDING DISPARITIES FOR LOW-INCOME TITLE I CHARTER STUDENTS IN EIGHT FLORIDA SCHOOL DISTRICTS
Gaps in Funding to Title I Eligible Charter Students
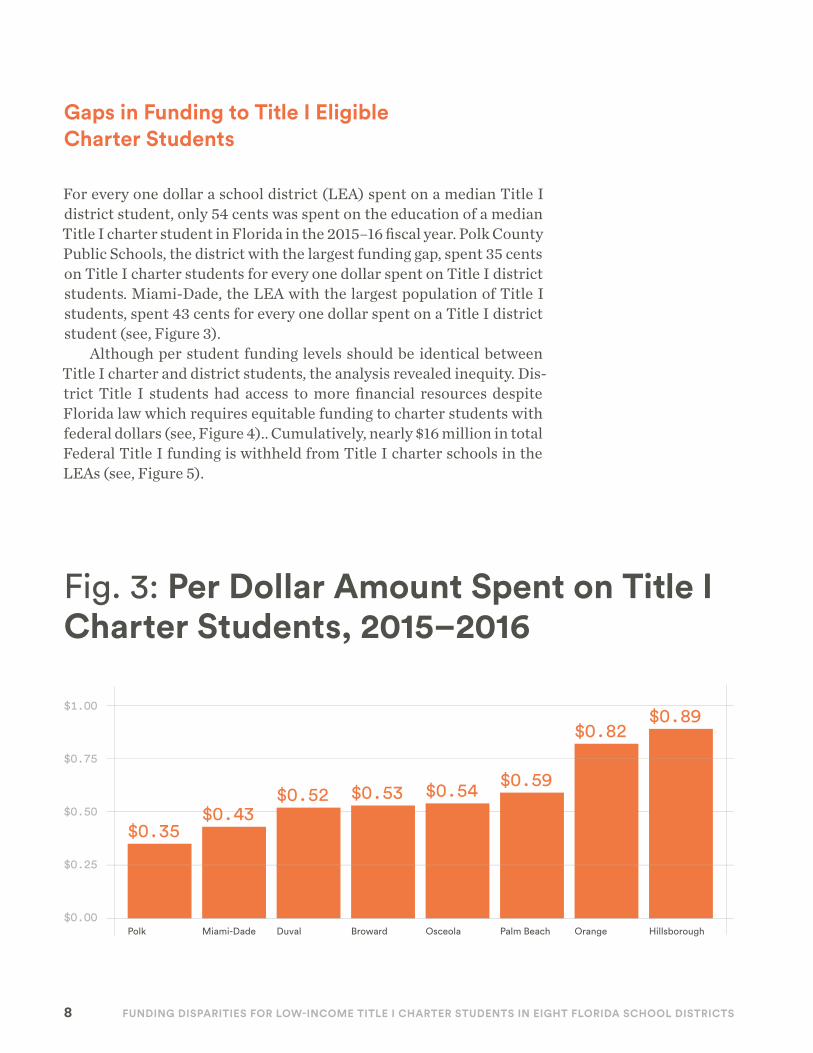
For every one dollar a school district (LEA) spent on a median Title I district student, only 54 cents was spent on the education of a median Title I charter student in Florida in the 2015–16 fiscal year. Polk County Public Schools, the district with the largest funding gap, spent 35 cents on Title I charter students for every one dollar spent on Title I district students. Miami-Dade, the LEA with the largest population of Title I students, spent 43 cents for every one dollar spent on a Title I district student (see, Figure 3).
Although per student funding levels should be identical between Title I charter and district students, the analysis revealed inequity. Dis-trict Title I students had access to more financial resources despite Florida law which requires equitable funding to charter students with federal dollars (see, Figure 4).. Cumulatively, nearly $16 million in total Federal Title I funding is withheld from Title I charter schools in the LEAs (see, Figure 5).
Fig. 3: Per Dollar Amount Spent on Title I Charter Students, 2015–2016
$0.00
$0.50
$0.75
$0.25
$1.00
Polk Miami-Dade Duval Broward Osceola Palm Beach Orange Hillsborough
$0.35$0.43
$0.52 $0.53 $0.54 $0.59
$0.82$0.89

9 FUNDING DISPARITIES FOR LOW-INCOME TITLE I CHARTER STUDENTS IN EIGHT FLORIDA SCHOOL DISTRICTS
Fig. 4: Title I Per Student Spending in 2015–2016
Fig. 5: Approximate Annual Total Loss to Title I Students in Florida, 2015–2016
$0
$500
$750
$250
$1,000
Polk Miami-Dade Duval Broward Osceola Palm Beach Orange Hillsborough
$587
$696$696$614
$815
$520$557 $590
$459$459
$204$204
$298 $320
$432$432
$282$330
$485$411
Hillsborough
Palm Beach
Broward
Polk
Orange
Duval
Miami-Dade
Osceola
$0 $2,000,000 $4,000,000 $6,000,000 $8,000,000
$3,810,000$1,270,000$1,270,000$1,010,000$600,000$310,000$120,000
$7,480,000
DistrictCharter

10 FUNDING DISPARITIES FOR LOW-INCOME TITLE I CHARTER STUDENTS IN EIGHT FLORIDA SCHOOL DISTRICTS
Administration Costs and Roll Forward Amounts
After reviewing the eight LEAs in this analysis, it became evident that a considerable amount of the Title I budget was considered an “admin-istration” expense for half of the LEAs. LEAs, according to the DOE, have a lot of leeway on what is or is not considered an administration expense. There are two line items in every Title I budget designated to encapsulate administration expenditures:
1. LEA Direct and 2. LEA General and Administration.
After reviewing the Duval County Public Schools’ breakdown of their administration expenses, it seemed likely that other districts were ap-plying similar methods by including programs used by district Title I students as an “administration” cost (see, Appendix C). These district related programs seemed to impact the funding formulas for Title I charter students negatively, assuming Title I charter students were using the same programs as district Title I students (see, Appendix D).
A school district is permitted to “roll forward” no more than fifteen percent of their annual budget to the next fiscal year. These funds re-main unspent but available for use by the school district.
When combining the roll forward amount with a school district’s administrative expenses, nearly all LEAs are dedicating more than 30 percent of their Title I budget in a way that may not be directly benefi-cial to Title I eligible students, charter or otherwise.

11 FUNDING DISPARITIES FOR LOW-INCOME TITLE I CHARTER STUDENTS IN EIGHT FLORIDA SCHOOL DISTRICTS
Unspent and Un-earmarked Funds are Available
In every school district but one, Palm Beach, unearmarked Title I funds were available to accommodate the funding disparity Title I charter students faced in 2015–16 fiscal year.
The roll-forward, or unspent, portion of the budget was more than sufficient to cover the gap in funding for Title I charter students. Even after equitably funding Title I charter students, seven LEAs would have had more than sixty percent of their remaining roll forward bud-get available. This includes, Miami-Dade, Broward, Polk, Hillsborough, Duval, Osceola and Orange County Public Schools.
Fig. 6: Administrative Expenses & Roll Forward, Percentage of Title I Budget in Florida, 2015–2016
Hillsborough
Palm Beach
Broward
Polk
Orange
Duval
Miami-Dade
Osceola
0% 20% 30% 40% 50%
47%38%09%40%17%15%26%09%
08%13%34%02%19%15%04%13%
Adm
inis
trat
ive
Expe
nses
Roll
Forw
ard
12 FUNDING DISPARITIES FOR LOW-INCOME TITLE I CHARTER STUDENTS IN EIGHT FLORIDA SCHOOL DISTRICTS
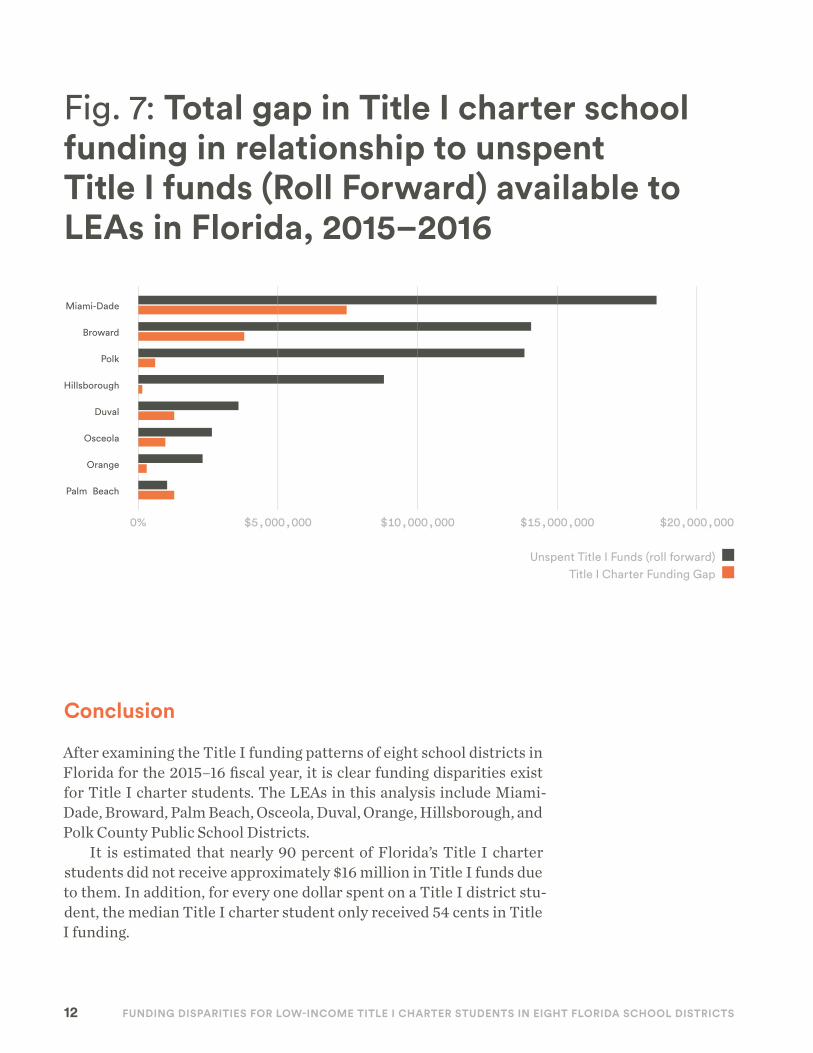
Conclusion
After examining the Title I funding patterns of eight school districts in Florida for the 2015–16 fiscal year, it is clear funding disparities exist for Title I charter students. The LEAs in this analysis include Miami-Dade, Broward, Palm Beach, Osceola, Duval, Orange, Hillsborough, and Polk County Public School Districts.
It is estimated that nearly 90 percent of Florida’s Title I charter students did not receive approximately $16 million in Title I funds due to them. In addition, for every one dollar spent on a Title I district stu-dent, the median Title I charter student only received 54 cents in Title I funding.
Fig. 7: Total gap in Title I charter school funding in relationship to unspent Title I funds (Roll Forward) available to LEAs in Florida, 2015–2016
Palm Beach
Hillsborough
Broward
Osceola
Orange
Polk
Miami-Dade
Duval
0% $5,000,000 $10,000,000 $15,000,000 $20,000,000
Unspent Title I Funds (roll forward)Title I Charter Funding Gap
13 FUNDING DISPARITIES FOR LOW-INCOME TITLE I CHARTER STUDENTS IN EIGHT FLORIDA SCHOOL DISTRICTS
Florida law, under Statute 1002.33 17(c), requires funding charter school students at the “same level” as district students:
(c) If the district school board is providing programs or services to students funded by federal funds, any eligible students enrolled in charter schools in the school district shall be provided federal funds for the same level of service provided students in the schools operated by the district school board.
The funding disparity was preventable, without additional cost to the state or most of the LEAs in this analysis. In seven of the eight school districts, adequate levels of unspent Title I funds were available in the 2015–2016 fiscal year to increase funding for Title I charter students to equitable levels.
This lack of equal funding is proving to be a mechanism in which students and their families are compromised for exercising their right to school choice. Title I charter students are attending schools where there is less funding for high-quality teachers, educational resources, enrichment activities and most importantly, opportunity to succeed as a student.
The Florida legislature has supported the right to school choice; ensuring funding parity and enforcement of current state law is the historical precedent of the legislative body.

Appendices
14 FUNDING DISPARITIES FOR LOW-INCOME TITLE I CHARTER STUDENTS IN EIGHT FLORIDA SCHOOL DISTRICTS

15 FUNDING DISPARITIES FOR LOW-INCOME TITLE I CHARTER STUDENTS IN EIGHT FLORIDA SCHOOL DISTRICTS
APPENDIX A
The data used in this paper were gathered and calculations were made by the author.
16 FUNDING DISPARITIES FOR LOW-INCOME TITLE I CHARTER STUDENTS IN EIGHT FLORIDA SCHOOL DISTRICTS
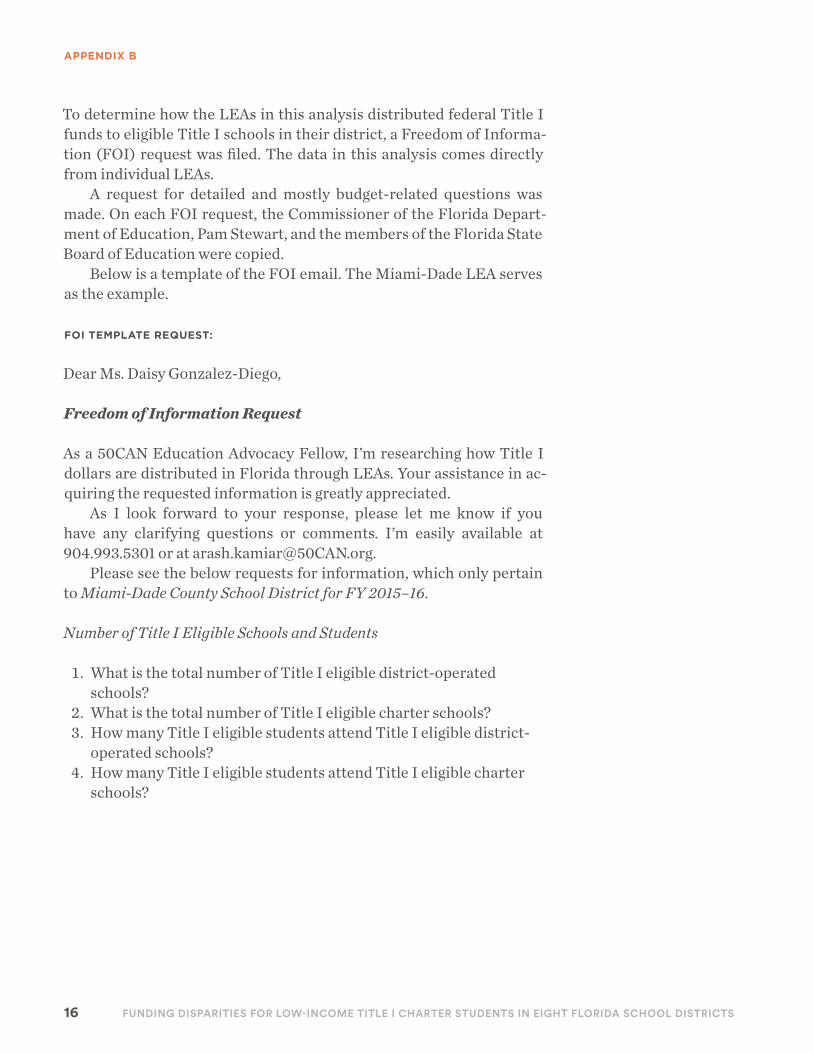
To determine how the LEAs in this analysis distributed federal Title I funds to eligible Title I schools in their district, a Freedom of Informa-tion (FOI) request was filed. The data in this analysis comes directly from individual LEAs.
A request for detailed and mostly budget-related questions was made. On each FOI request, the Commissioner of the Florida Depart-ment of Education, Pam Stewart, and the members of the Florida State Board of Education were copied.
Below is a template of the FOI email. The Miami-Dade LEA serves as the example.
FOI TEMPLATE REQUEST:
Dear Ms. Daisy Gonzalez-Diego,
Freedom of Information Request
As a 50CAN Education Advocacy Fellow, I’m researching how Title I dollars are distributed in Florida through LEAs. Your assistance in ac-quiring the requested information is greatly appreciated.
As I look forward to your response, please let me know if you have any clarifying questions or comments. I’m easily available at 904.993.5301 or at [email protected].
Please see the below requests for information, which only pertain to Miami-Dade County School District for FY 2015–16.
Number of Title I Eligible Schools and Students
1. What is the total number of Title I eligible district-operated schools?
2. What is the total number of Title I eligible charter schools?3. How many Title I eligible students attend Title I eligible district-
operated schools?4. How many Title I eligible students attend Title I eligible charter
schools?
APPENDIX B

17 FUNDING DISPARITIES FOR LOW-INCOME TITLE I CHARTER STUDENTS IN EIGHT FLORIDA SCHOOL DISTRICTS
Title I Budget Allocations
1. What is the total Title I budget? 2. What is the total amount allocated for each of the following
categories:
a. Parental Involvementb. Neglect and Delinquentc. Homelessd. LEA Direct Administratione. LEA General and Administration
After deducting the items in #2 under “Title I Budget Allocations”, what was the amount distributed in following areas:
1. What is the total amount distributed to district-operated Title I schools?
2. What is the total amount distributed to Title I charter schools?3. What is the total amount distributed to private schools? 4. What is the total amount of unspent Title I funds?
Under “Title I Budget Allocations,” the sum of items 2, 3, 4, 5 and 6 should equal the amount listed for question 1, “what is the total Title I budget?”
Sincerely,
Arash KamiarEducation Advocacy FellowC 904-993-53011625 K Street NW, Suite 400Washington, DC 20006
www.50can.org | Twitter LinkedIn Facebook
CC: Pam Stewart, Florida Commissioner of Education Marva Johnson, Chair, Florida Board of Education Board Members of Florida Board of Education Adam Miller, Executive Director, Office of Independent Education & Parental Choice Alberto M. Carvalho, Superintendent, Miami-Dade County Public Schools
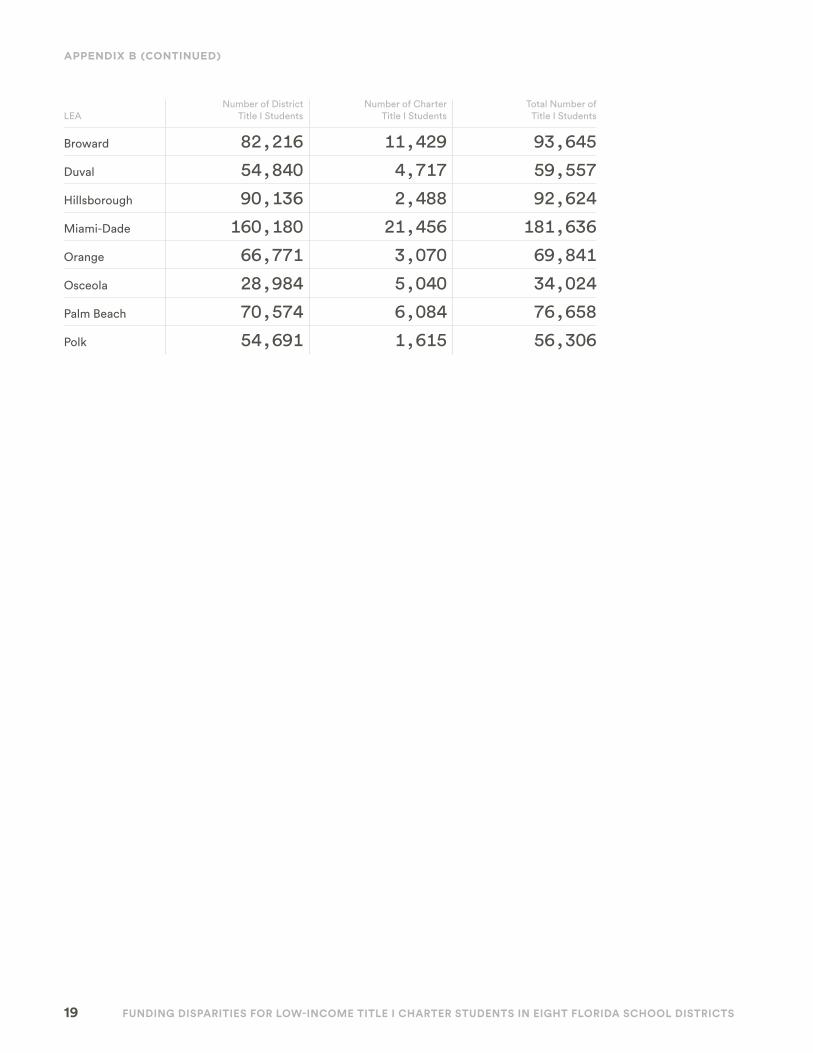
APPENDIX B (CONTINUED)
18 FUNDING DISPARITIES FOR LOW-INCOME TITLE I CHARTER STUDENTS IN EIGHT FLORIDA SCHOOL DISTRICTS
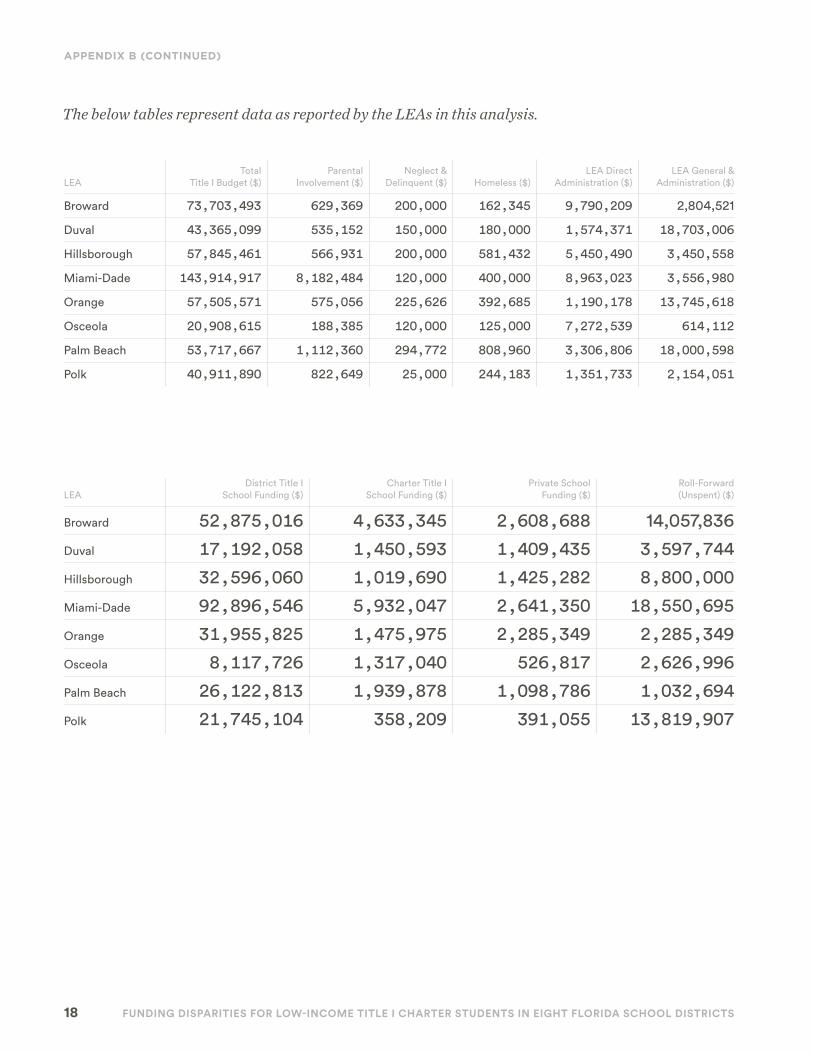
The below tables represent data as reported by the LEAs in this analysis.
APPENDIX B (CONTINUED)
LEATotal
Title I Budget ($)Parental
Involvement ($)Neglect &
Delinquent ($) Homeless ($)LEA Direct
Administration ($)LEA General &
Administration ($)
Broward 73,703,493 629,369 200,000 162,345 9,790,209 2,804,521
Duval 43,365,099 535,152 150,000 180,000 1,574,371 18,703,006
Hillsborough 57,845,461 566,931 200,000 581,432 5,450,490 3,450,558
Miami-Dade 143,914,917 8,182,484 120,000 400,000 8,963,023 3,556,980
Orange 57,505,571 575,056 225,626 392,685 1,190,178 13,745,618
Osceola 20,908,615 188,385 120,000 125,000 7,272,539 614,112
Palm Beach 53,717,667 1,112,360 294,772 808,960 3,306,806 18,000,598
Polk 40,911,890 822,649 25,000 244,183 1,351,733 2,154,051
LEADistrict Title I
School Funding ($)Charter Title I
School Funding ($)Private School
Funding ($)Roll-Forward (Unspent) ($)
Broward 52,875,016 4,633,345 2,608,688 14,057,836Duval 17,192,058 1,450,593 1,409,435 3,597,744Hillsborough 32,596,060 1,019,690 1,425,282 8,800,000Miami-Dade 92,896,546 5,932,047 2,641,350 18,550,695Orange 31,955,825 1,475,975 2,285,349 2,285,349Osceola 8,117,726 1,317,040 526,817 2,626,996Palm Beach 26,122,813 1,939,878 1,098,786 1,032,694Polk 21,745,104 358,209 391,055 13,819,907
19 FUNDING DISPARITIES FOR LOW-INCOME TITLE I CHARTER STUDENTS IN EIGHT FLORIDA SCHOOL DISTRICTS
APPENDIX B (CONTINUED)
LEANumber of District
Title I StudentsNumber of Charter
Title I StudentsTotal Number of
Title I Students
Broward 82,216 11,429 93,645Duval 54,840 4,717 59,557Hillsborough 90,136 2,488 92,624Miami-Dade 160,180 21,456 181,636Orange 66,771 3,070 69,841Osceola 28,984 5,040 34,024Palm Beach 70,574 6,084 76,658Polk 54,691 1,615 56,306
20 FUNDING DISPARITIES FOR LOW-INCOME TITLE I CHARTER STUDENTS IN EIGHT FLORIDA SCHOOL DISTRICTS
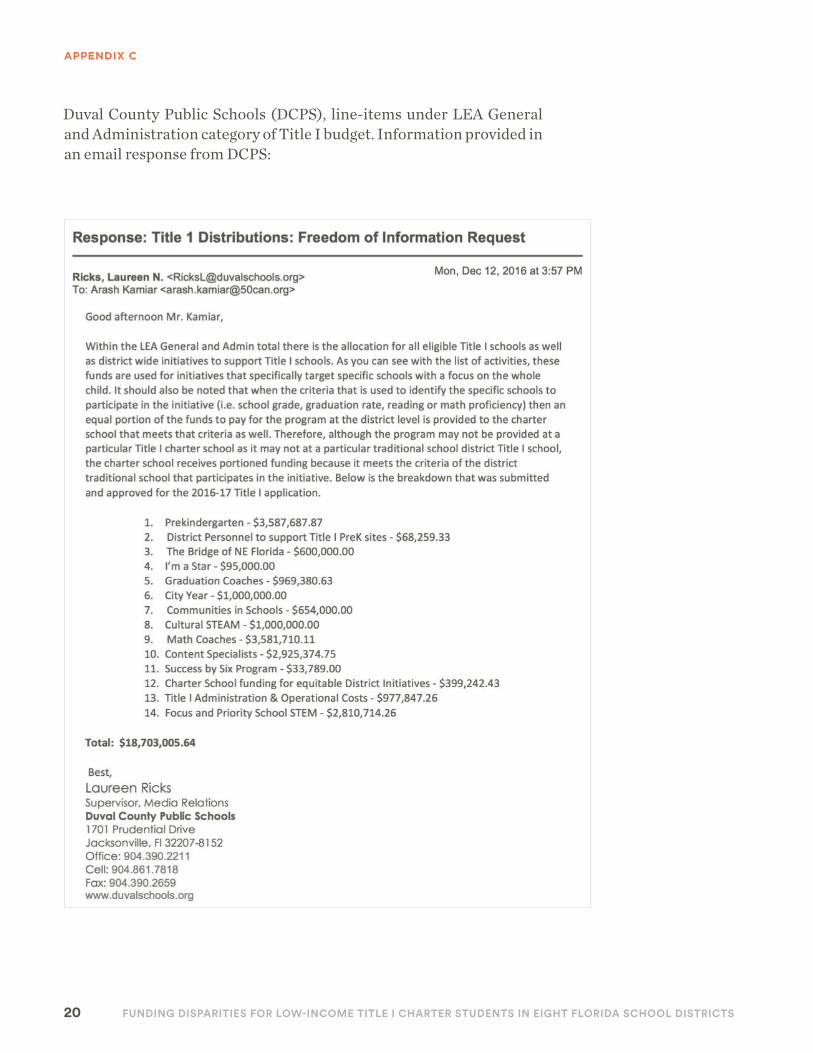
APPENDIX C
Duval County Public Schools (DCPS), line-items under LEA General and Administration category of Title I budget. Information provided in an email response from DCPS:

21 FUNDING DISPARITIES FOR LOW-INCOME TITLE I CHARTER STUDENTS IN EIGHT FLORIDA SCHOOL DISTRICTS
APPENDIX D
To mitigate a potentially skewed representation of the amount of money funneled into Title I charter schools as opposed to Title I dis-trict programs, 17 percent of the Title I budget was assumed to be a reasonable amount for administration. At 17 percent, Broward Public Schools served as the baseline because its administration expenses were the median of LEAs in this analysis.
All administration expenses over 17 percent of the Title I budget of a school district were added to the “district spending” line-item of the school district receiving the adjustment. District spending is the amount of money dedicated to district Title I students. Orange, Osceo-la, Palm Beach and Duval County Public Schools were the only LEAs in this analysis requiring an administrative adjustment.
The below table shows administration expenses and district spending as provided by the school districts. Ordered by “Administration Expenses, Percent of Title I Budget” from smallest to largest:
LEATotal Budget
($)Reported District
Spending ($)Total Administration
Expenses* ($)Administration Expenses,
Percent of Title I Budget
Polk 40,911,890 21,745,104 3,505,784 09%Miami-Dade 143,914,917 92,896,546 12,520,003 09%Hillsborough 57,845,461 32,596,060 8,901,048 15%Broward 73,703,493 52,875,016 12,594,730 17%Orange** 57,505,571 31,955,825 14,935,796 26%Osceola** 20,908,615 8,117,726 7,886,652 38%Palm Beach** 53,717,667 26,122,813 21,307,404 40%Duval County** 43,365,099 17,192,058 20,277,377 47%
*Includes LEA Direct and LEA General and Administration.** LEAs with adjusted administration expenditures.

22 FUNDING DISPARITIES FOR LOW-INCOME TITLE I CHARTER STUDENTS IN EIGHT FLORIDA SCHOOL DISTRICTS
APPENDIX D (CONTINUED)
The below table shows how administration expenses were adjusted to not exceed 17 percent of the Title I budget. Any administration expense over 17 percent was applied to district spending:
LEATotal Budget
($)Reported District
Spending ($)
Administration Overages, Amount over 17%
of Title I Budget ($)
District Spending, Post-administration
Adjustment ($)
Polk $40,911,890 $21,745,104 $0 $21,745,104Miami-Dade $143,914,917 $92,896,546 $0 $92,896,546Hillsborough $57,845,461 $32,596,060 $0 $32,596,060Broward $73,703,493 $52,875,016 $65,136 $52,940,152Orange* $57,505,571 $31,955,825 $5,159,849 $37,115,674Osceola* $20,908,615 $8,117,726 $4,332,187 $12,449,913Palm Beach* $53,717,667 $26,122,813 $12,175,401 $38,298,214Duval County* $43,365,099 $17,192,058 $12,905,310 $30,097,368
*LEAs with adjusted administration expenditures.

23 FUNDING DISPARITIES FOR LOW-INCOME TITLE I CHARTER STUDENTS IN EIGHT FLORIDA SCHOOL DISTRICTS
APPENDIX E
Total loss to Title I charter students in a LEA was ascertained by first de-termining the combined average per pupil spending on Title I district and charter students. The difference between the actual per student charter expenditure and the average of both student types was con-sidered the gap in spending. The gap was then multiplied by the total number of Title I charter students to determine the total loss.
For example, if an LEA spends $100 on a district student and $50 on charter student, the average spending for both students is $75. The dif-ference between the actual per student expenditure on a Title I charter student and the average of both students is $25. If the number of Title I students in the LEA was 500, then the total loss to Title I students in the LEA is $12,500 ($25 x 500 Title I Charter Students).
LEA
Ratio of Funding of Title I Charter
Student to Title I District
Student, 2015–16
Title I District Student:
Per Student Spending, 2015–16
Title I Charter Student:
Per Student Funding, 2015–16
Total Average Per Student
Spending, District and Charter
Combined, 2015–16Total Loss to
Title I Charter Students
Broward 53.0% $815 $432 $765 $3,806,246Duval County 52.1% $614 $320 $590 $1,273,247Hillsborough 89.5% $459 $411 $458 $116,696Miami-Dade 42.8% $696 $298 $646 $7,478,895Orange 82.1% $590 $485 $585 $308,737Osceola 54.2% $520 $282 $482 $1,006,594Palm Beach 59.2% $557 $330 $538 $1,267,408Polk 34.8% $587 $204 $577 $601,738Total $15,859,561
24 FUNDING DISPARITIES FOR LOW-INCOME TITLE I CHARTER STUDENTS IN EIGHT FLORIDA SCHOOL DISTRICTS
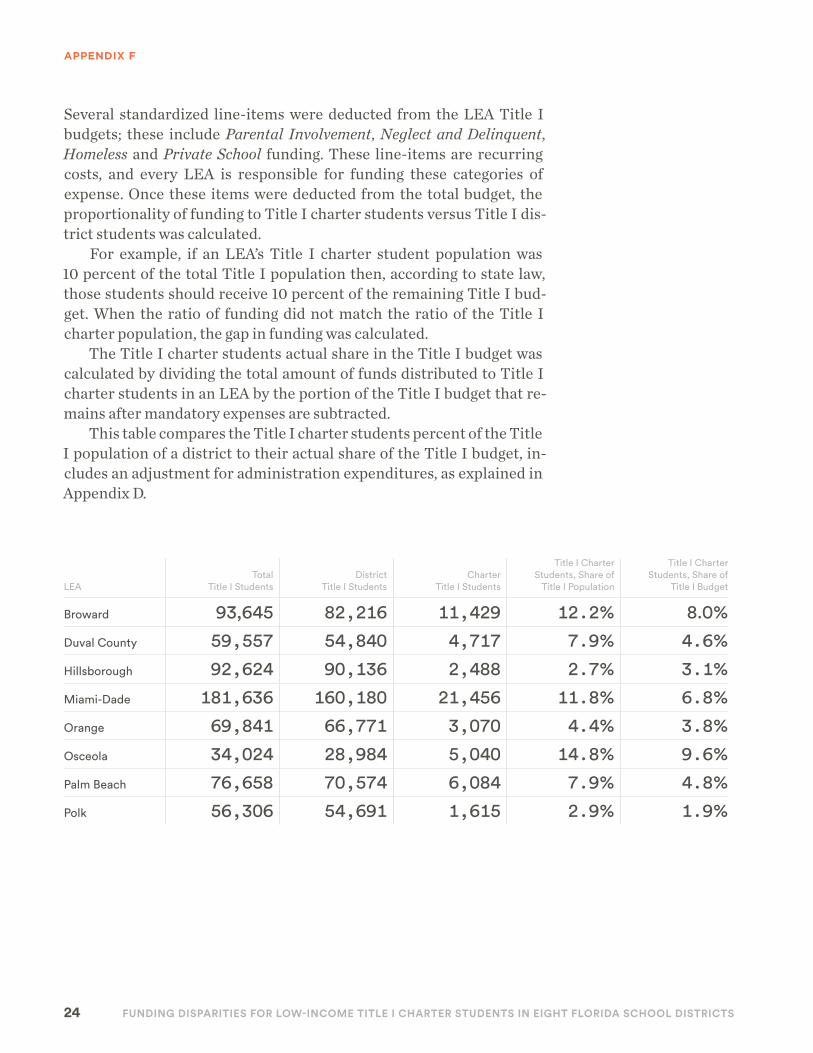
APPENDIX F
Several standardized line-items were deducted from the LEA Title I budgets; these include Parental Involvement, Neglect and Delinquent, Homeless and Private School funding. These line-items are recurring costs, and every LEA is responsible for funding these categories of expense. Once these items were deducted from the total budget, the proportionality of funding to Title I charter students versus Title I dis-trict students was calculated.
For example, if an LEA’s Title I charter student population was 10 percent of the total Title I population then, according to state law, those students should receive 10 percent of the remaining Title I bud-get. When the ratio of funding did not match the ratio of the Title I charter population, the gap in funding was calculated.
The Title I charter students actual share in the Title I budget was calculated by dividing the total amount of funds distributed to Title I charter students in an LEA by the portion of the Title I budget that re-mains after mandatory expenses are subtracted.
This table compares the Title I charter students percent of the Title I population of a district to their actual share of the Title I budget, in-cludes an adjustment for administration expenditures, as explained in Appendix D.
LEATotal
Title I StudentsDistrict
Title I StudentsCharter
Title I Students
Title I Charter Students, Share of
Title I Population
Title I Charter Students, Share of
Title I Budget
Broward 93,645 82,216 11,429 12.2% 8.0%Duval County 59,557 54,840 4,717 7.9% 4.6%Hillsborough 92,624 90,136 2,488 2.7% 3.1%Miami-Dade 181,636 160,180 21,456 11.8% 6.8%Orange 69,841 66,771 3,070 4.4% 3.8%Osceola 34,024 28,984 5,040 14.8% 9.6%Palm Beach 76,658 70,574 6,084 7.9% 4.8%Polk 56,306 54,691 1,615 2.9% 1.9%

25 FUNDING DISPARITIES FOR LOW-INCOME TITLE I CHARTER STUDENTS IN EIGHT FLORIDA SCHOOL DISTRICTS
APPENDIX G
U.S. Department of Education’s email response to an inquiry about LEA administration expenses: