florida education finance program (fefp) funding charter school funding november 2011 1
TRANSCRIPT

FLORIDA EDUCATION FINANCE PROGRAM (FEFP) FUNDING
Charter School Funding
November 2011
11
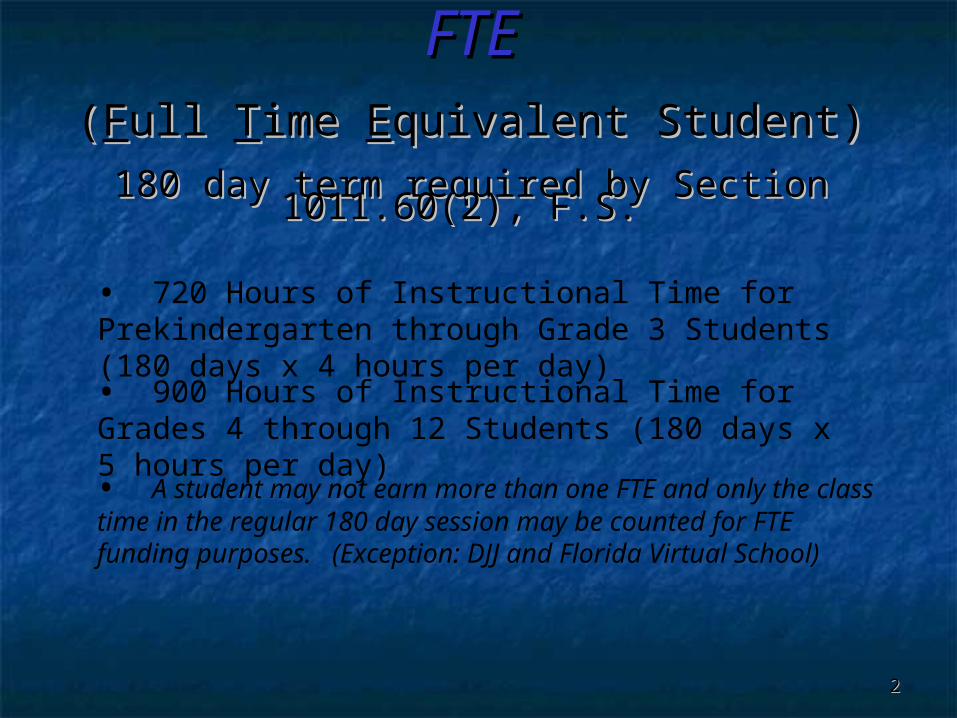
FTEFTE((FFull ull TTime ime EEquivalent Student)quivalent Student)
180 day term required by Section 1011.60(2), F.S.180 day term required by Section 1011.60(2), F.S.
• 720 Hours of Instructional Time for Prekindergarten through Grade 3 Students (180 days x 4 hours per day)
• 900 Hours of Instructional Time for Grades 4 through 12 Students (180 days x 5 hours per day)
• A student may not earn more than one FTE and only the class time in the regular 180 day session may be counted for FTE funding purposes. (Exception: DJJ and Florida Virtual School)
22

Four FTE Survey Periods per year:
- Survey Period 1 (July) covers from the beginning of the fiscal year (July 1) to the beginning of the defined 180 day school year;
- Survey Period 2 (October) covers the first 90 days of the 180 day school year;
- Survey Period 3 (February) covers the second 90 days of the 180 day school year;
- Survey Period 4 (June) covers the period from the end of the 180 day school program to the end of the fiscal year (June 30).
In surveys 1 & 4, only DJJ Schools and Florida Virtual School are counted for FTE funding.
FTE SURVEYS
33

FTE SURVEYS
• Department of Education sets the survey week for each of the four surveys.
• Date Certain is always the Friday of survey week.
• FTE eligibility determined by: - Verifying membership during survey week. - Verifying one day of attendance during survey week or one day during previous six
scheduled school days.
• FTE calculation based on student course schedule.44
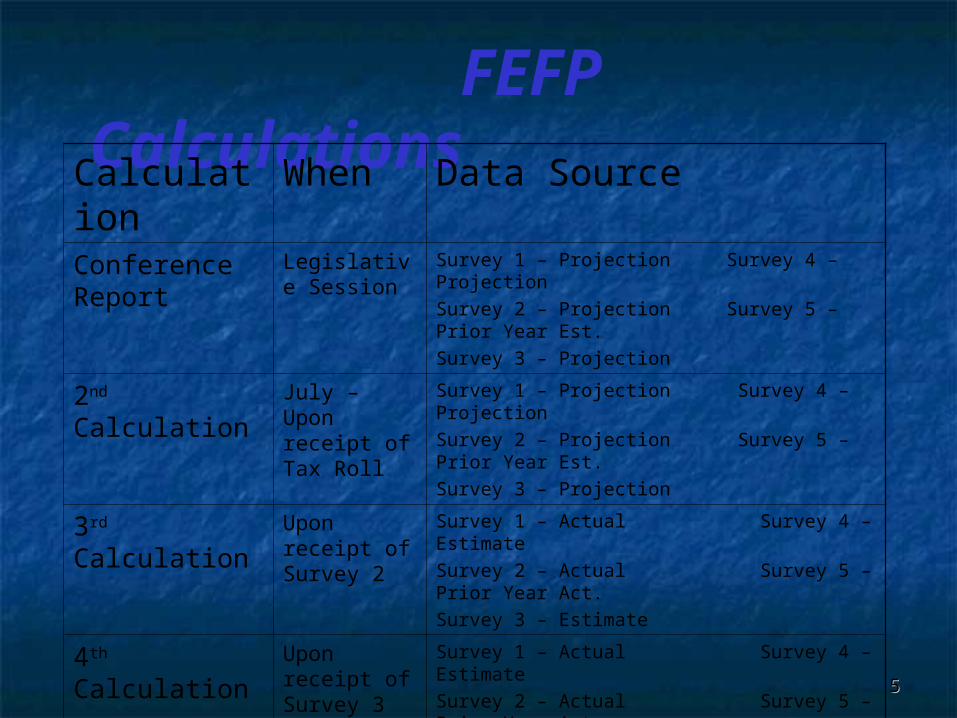
FEFP Calculations
Calculation When Data SourceConference Report
Legislative Session
Survey 1 – Projection Survey 4 – Projection
Survey 2 – Projection Survey 5 – Prior Year Est.
Survey 3 – Projection
2nd Calculation July – Upon receipt of Tax Roll
Survey 1 – Projection Survey 4 – Projection
Survey 2 – Projection Survey 5 – Prior Year Est.
Survey 3 – Projection
3rd Calculation Upon receipt of Survey 2
Survey 1 – Actual Survey 4 – Estimate
Survey 2 – Actual Survey 5 – Prior Year Act.
Survey 3 – Estimate
4th Calculation Upon receipt of Survey 3
Survey 1 – Actual Survey 4 – Estimate
Survey 2 – Actual Survey 5 – Prior Year Act.
Survey 3 – Actual
Final Calculation
After Final Update of Survey 4
Survey 1 – Actual Survey 4 – Actual
Survey 2 – Actual Survey 5 – Prior Year Act.
Survey 3 – Actual
55
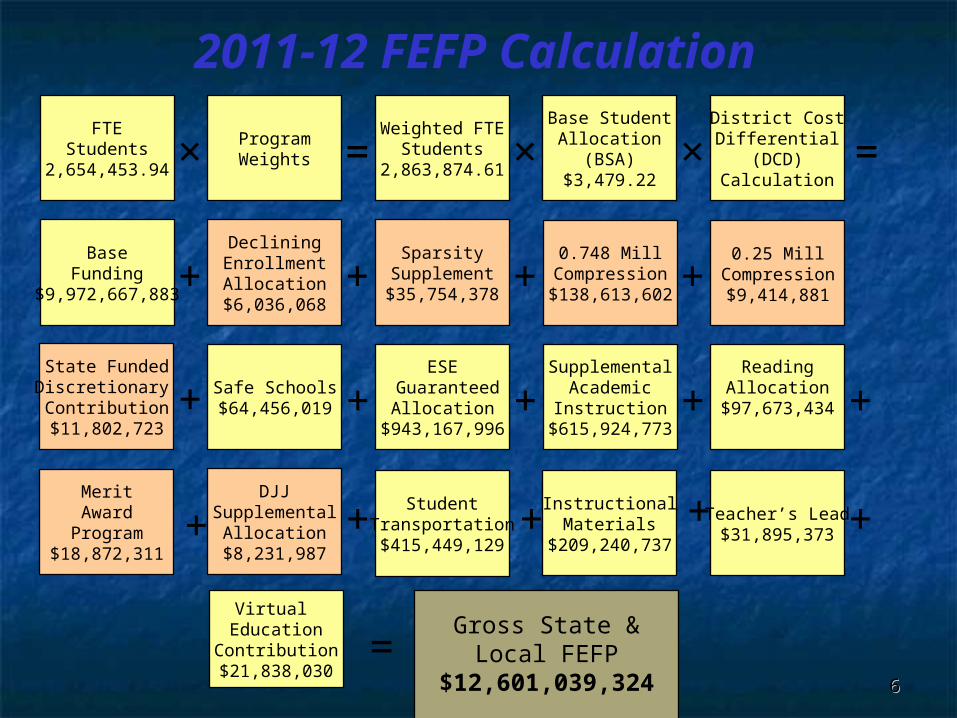
FTEStudents
2,654,453.94
0.748 MillCompression$138,613,602
Safe Schools$64,456,019
×
DJJSupplemental
Allocation$8,231,987
MeritAward
Program$18,872,311
SupplementalAcademicInstruction
$615,924,773
InstructionalMaterials
$209,240,737
Teacher’s Lead$31,895,373
Virtual Education
Contribution$21,838,030
ReadingAllocation
$97,673,434
ESE Guaranteed
Allocation$943,167,996
State FundedDiscretionary Contribution$11,802,723
2011-12 FEFP Calculation
Weighted FTEStudents
2,863,874.61
ProgramWeights
Base StudentAllocation
(BSA)$3,479.22
District CostDifferential
(DCD)Calculation
BaseFunding
$9,972,667,883
DecliningEnrollmentAllocation
$6,036,068
SparsitySupplement$35,754,378
= × × =
+ + + +
+ + + +
+ +
+
+ +
Gross State & Local FEFP
$12,601,039,324
+StudentTransportation$415,449,129
=
0.25 MillCompression$9,414,881
66
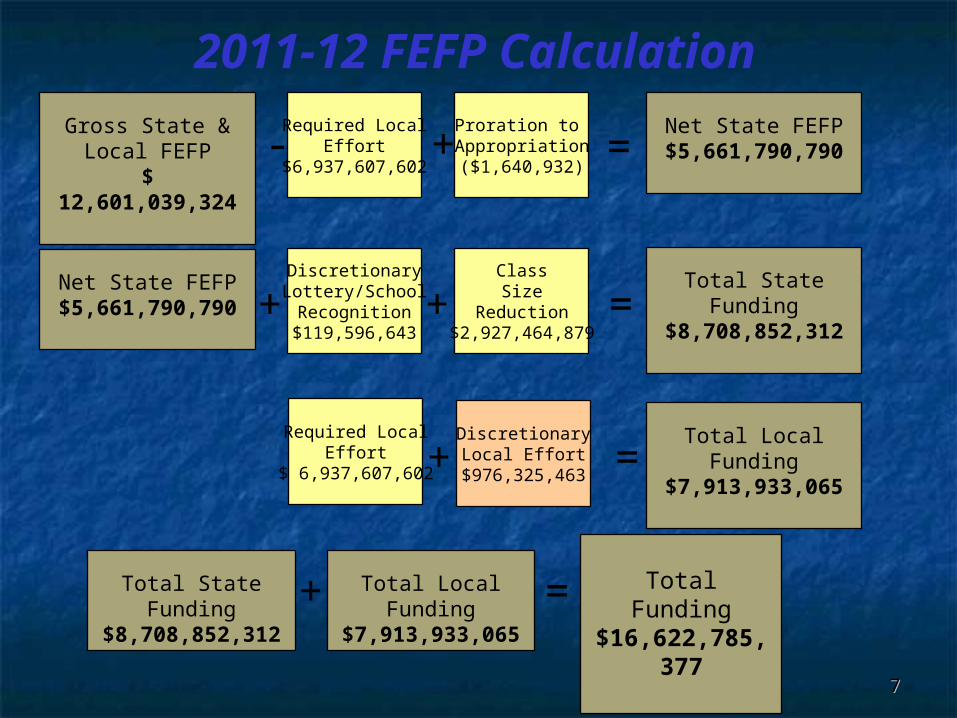
Required LocalEffort
$ 6,937,607,602
2011-12 FEFP Calculation
Required LocalEffort
$6,937,607,602
Proration to Appropriation($1,640,932)
DiscretionaryLottery/SchoolRecognition
$119,596,643
ClassSize
Reduction$2,927,464,879
- + =
+
=+DiscretionaryLocal Effort
$976,325,463
Gross State & Local FEFP
$ 12,601,039,324
Net State FEFP$5,661,790,790
Net State FEFP$5,661,790,790 + =
Total State Funding$8,708,852,312
Total Local Funding$7,913,933,065
Total State Funding$8,708,852,312
Total Local Funding$7,913,933,065+ = Total Funding
$16,622,785,377
77
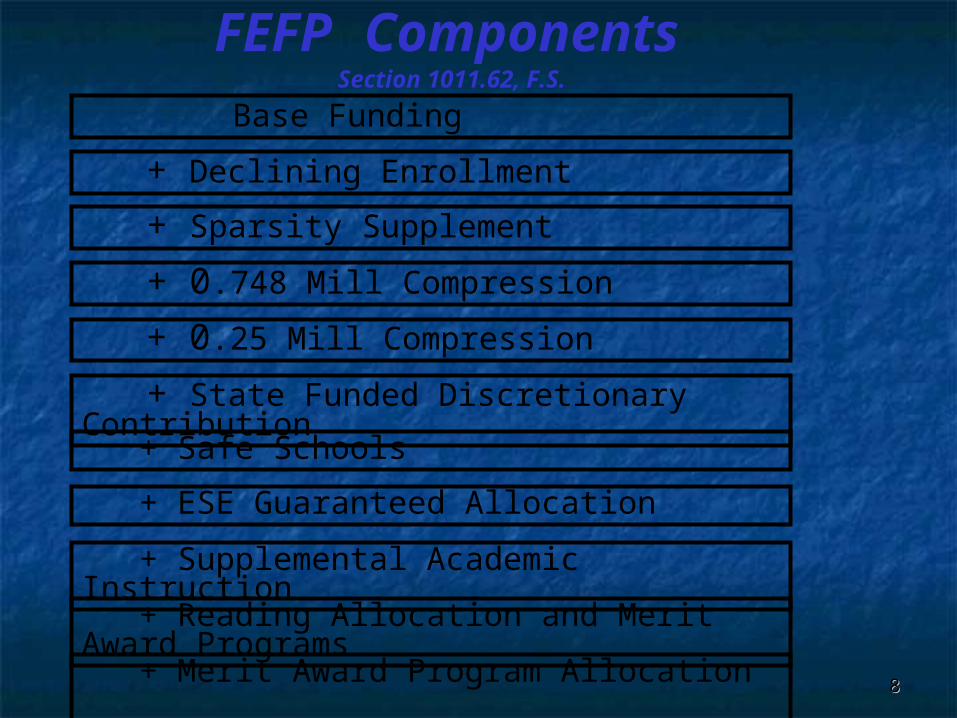
FEFP Components Section 1011.62, F.S.
Base Funding
+ Declining Enrollment
+ Sparsity Supplement
+ 0.748 Mill Compression
+ 0.25 Mill Compression
+ Safe Schools
+ ESE Guaranteed Allocation
+ State Funded Discretionary Contribution
+ Supplemental Academic Instruction
+ Reading Allocation and Merit Award Programs
+ Merit Award Program Allocation 88
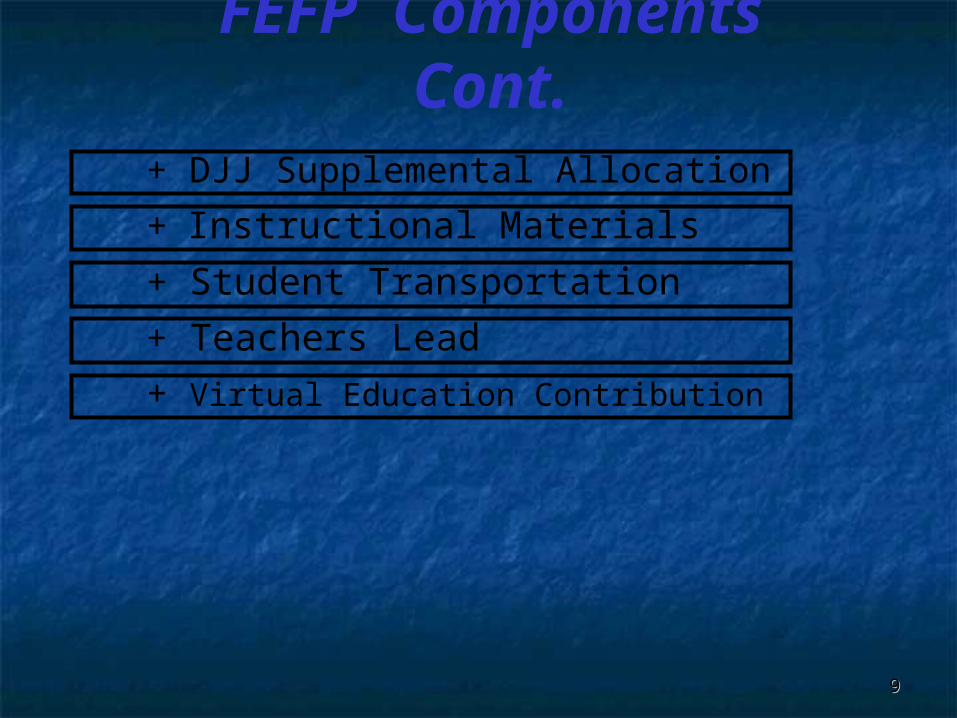
FEFP Components Cont.
+ DJJ Supplemental Allocation
+ Instructional Materials
+ Student Transportation
+ Teachers Lead
+ Virtual Education Contribution
99
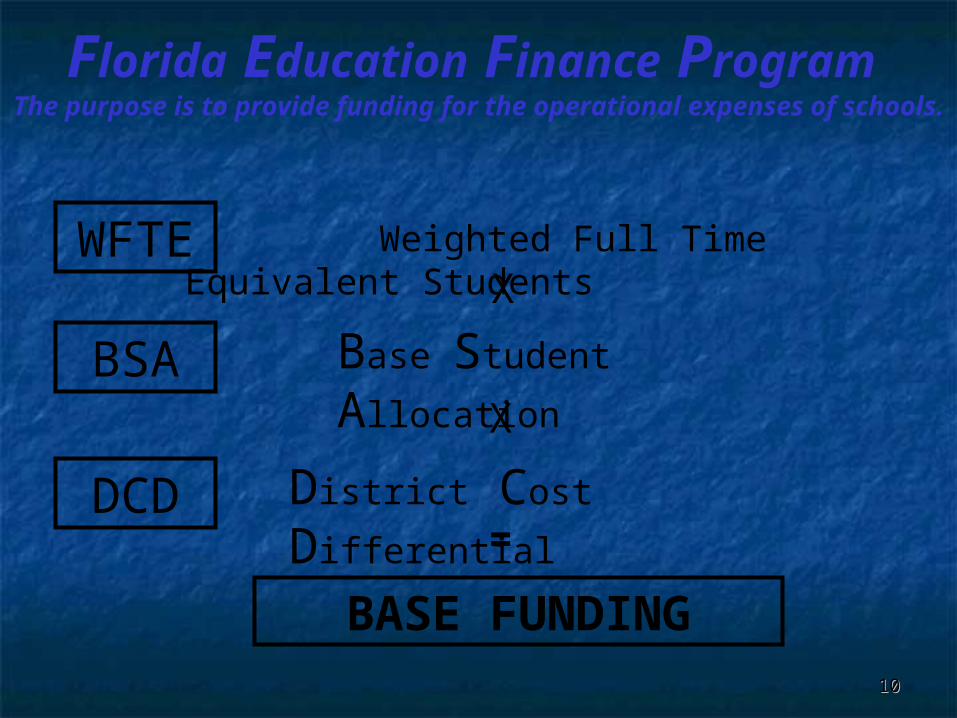
WFTE
BSA
District Cost DifferentialDCD
BASE FUNDING
Weighted Full Time Equivalent Students
Base Student Allocation
X
X
=
Florida Education Finance Program The purpose is to provide funding for the operational expenses of schools.
1010
1111
Appropriations Act
ProgramWeights
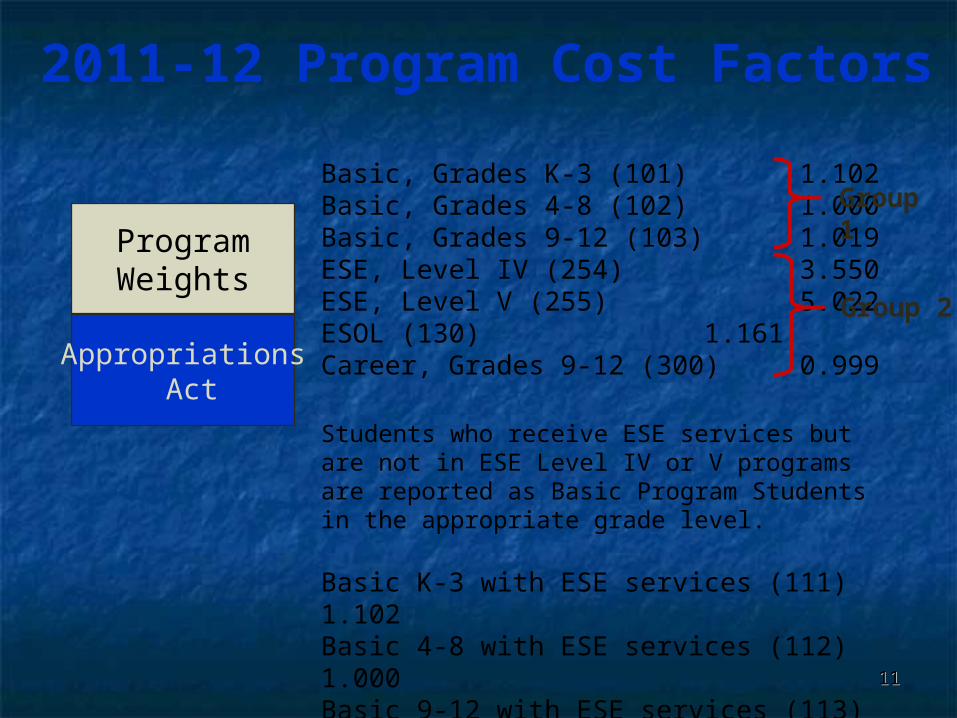
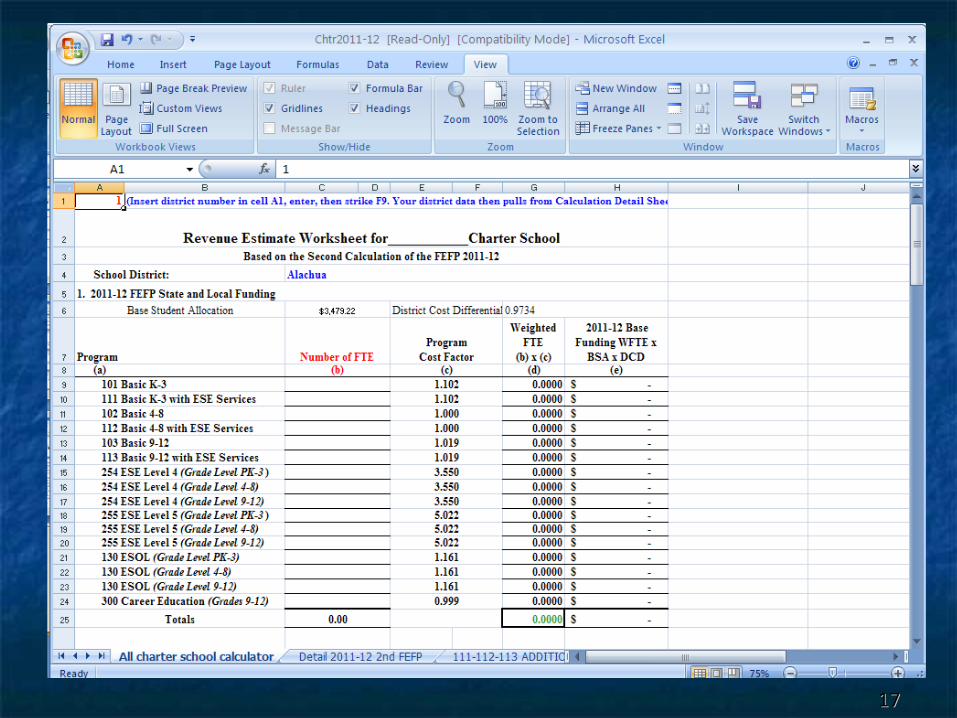
2011-12 Program Cost Factors
Basic, Grades K-3 (101) 1.102Basic, Grades 4-8 (102) 1.000 Basic, Grades 9-12 (103) 1.019 ESE, Level IV (254) 3.550ESE, Level V (255) 5.022ESOL (130) 1.161Career, Grades 9-12 (300) 0.999
Students who receive ESE services but are not in ESE Level IV or V programs are reported as Basic Program Students in the appropriate grade level.
Basic K-3 with ESE services (111) 1.102 Basic 4-8 with ESE services (112) 1.000 Basic 9-12 with ESE services (113) 1.019
Group 1
Group 2
ESE Guaranteed Allocation
Exceptional Student Education Exceptional Student Education (ESE) services for students whose (ESE) services for students whose level of service is less than level of service is less than Programs 254 and 255 (support Programs 254 and 255 (support Levels 4 and 5) are funded through Levels 4 and 5) are funded through the ESE Guaranteed Allocation.the ESE Guaranteed Allocation.
1212

1313
1414
1515
1616
1717
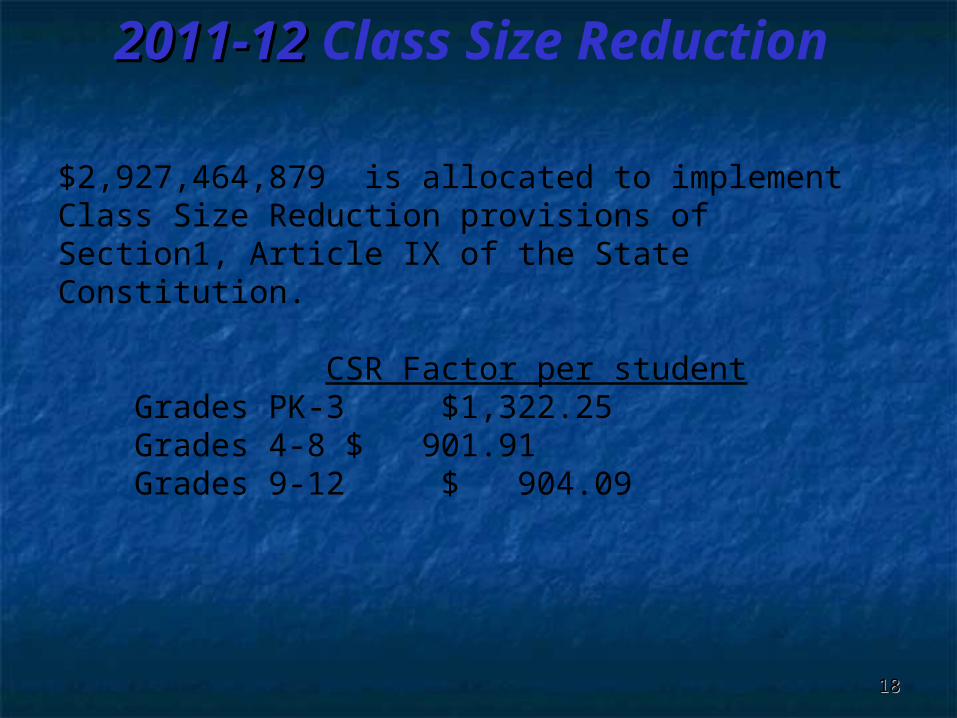
2011-12 2011-12 Class Size Reduction
$2,927,464,879 is allocated to implement Class Size Reduction provisions of Section1, Article IX of the State Constitution.
CSR Factor per student Grades PK-3 $1,322.25 Grades 4-8 $ 901.91 Grades 9-12 $ 904.09
1818
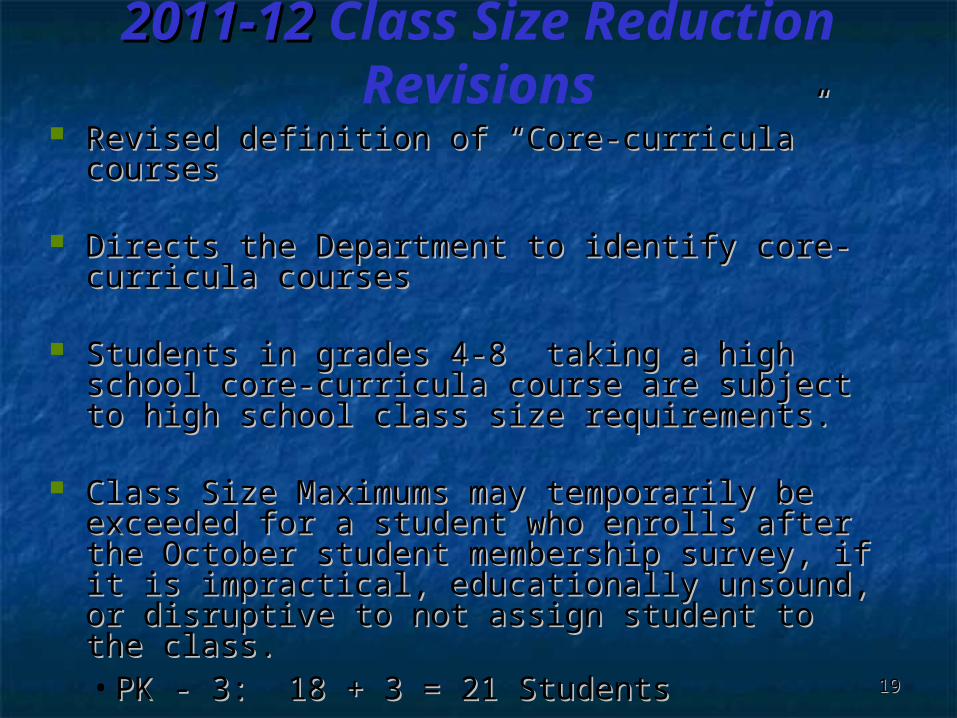
2011-122011-12 Class Size Reduction Revisions Revised definition of “Core-curricula” coursesRevised definition of “Core-curricula” courses
Directs the Department to identify core-curricula Directs the Department to identify core-curricula coursescourses
Students in grades 4-8 taking a high school core-Students in grades 4-8 taking a high school core-curricula course are subject to high school class curricula course are subject to high school class size requirements.size requirements.
Class Size Maximums may temporarily be Class Size Maximums may temporarily be exceeded for a student who enrolls after the exceeded for a student who enrolls after the October student membership survey, if it is October student membership survey, if it is impractical, educationally unsound, or disruptive impractical, educationally unsound, or disruptive to not assign student to the class.to not assign student to the class.• PK - 3: 18 + 3 = 21 StudentsPK - 3: 18 + 3 = 21 Students• 4 - 8: 22 + 5 = 27 Students4 - 8: 22 + 5 = 27 Students• 9 - 12: 25 + 5 = 30 Students9 - 12: 25 + 5 = 30 Students
1919
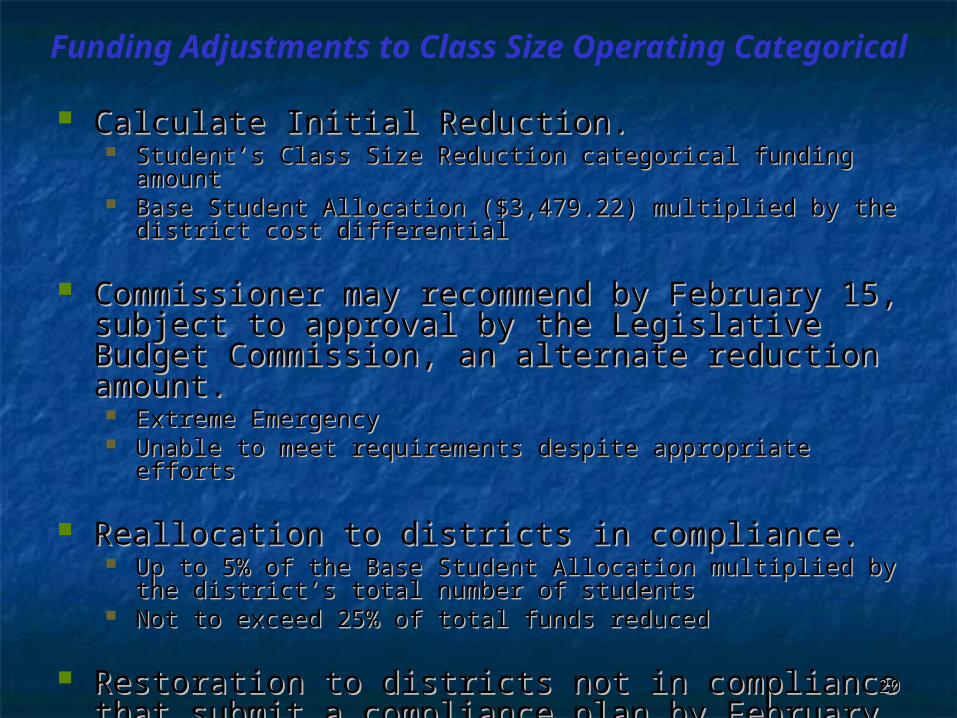
Funding Adjustments to Class Size Operating Categorical
Calculate Initial Reduction.Calculate Initial Reduction. Student’s Class Size Reduction categorical funding amountStudent’s Class Size Reduction categorical funding amount Base Student Allocation ($3,479.22) multiplied by the district Base Student Allocation ($3,479.22) multiplied by the district
cost differentialcost differential
Commissioner may recommend by February 15, Commissioner may recommend by February 15, subject to approval by the Legislative Budget subject to approval by the Legislative Budget Commission, an alternate reduction amount.Commission, an alternate reduction amount. Extreme EmergencyExtreme Emergency Unable to meet requirements despite appropriate effortsUnable to meet requirements despite appropriate efforts
Reallocation to districts in compliance.Reallocation to districts in compliance. Up to 5% of the Base Student Allocation multiplied by the Up to 5% of the Base Student Allocation multiplied by the
district’s total number of studentsdistrict’s total number of students Not to exceed 25% of total funds reducedNot to exceed 25% of total funds reduced
Restoration to districts not in compliance that Restoration to districts not in compliance that submit a compliance plan by February 15.submit a compliance plan by February 15. Balance of funds remainingBalance of funds remaining
2020
Class Size Accountability Requirements
The amount of the initial Class size reduction The amount of the initial Class size reduction shall be the lesser of the previous slide’s shall be the lesser of the previous slide’s calculated amount or the undistributed balance of calculated amount or the undistributed balance of the district's class size categorical allocation. the district's class size categorical allocation.
The Commissioner is authorized to withhold the The Commissioner is authorized to withhold the distribution of the class size categorical allocation distribution of the class size categorical allocation to ensure the availability of sufficient to ensure the availability of sufficient undistributed funds to support the undistributed funds to support the implementation of the calculated reduction.implementation of the calculated reduction.
2121
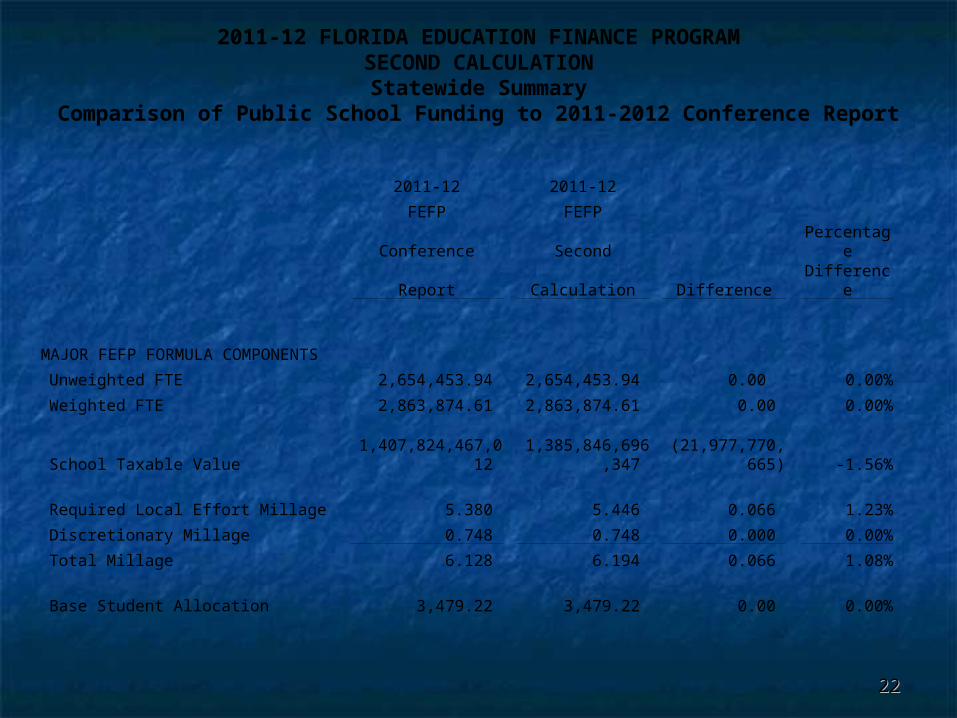
2011-12 FLORIDA EDUCATION FINANCE PROGRAMSECOND CALCULATION
Statewide SummaryComparison of Public School Funding to 2011-2012 Conference
Report
2011-12 2011-12
FEFP FEFP
Conference Second Percentage
Report Calculation Difference Difference
MAJOR FEFP FORMULA COMPONENTS
Unweighted FTE 2,654,453.94 2,654,453.94 0.00 0.00%
Weighted FTE 2,863,874.61 2,863,874.61 0.00 0.00%
School Taxable Value 1,407,824,467,012 1,385,846,696,34
7 (21,977,770,665
) -1.56%
Required Local Effort Millage 5.380 5.446 0.066 1.23%
Discretionary Millage 0.748 0.748 0.000 0.00%
Total Millage 6.128 6.194 0.066 1.08%
Base Student Allocation 3,479.22 3,479.22 0.00 0.00%
2222
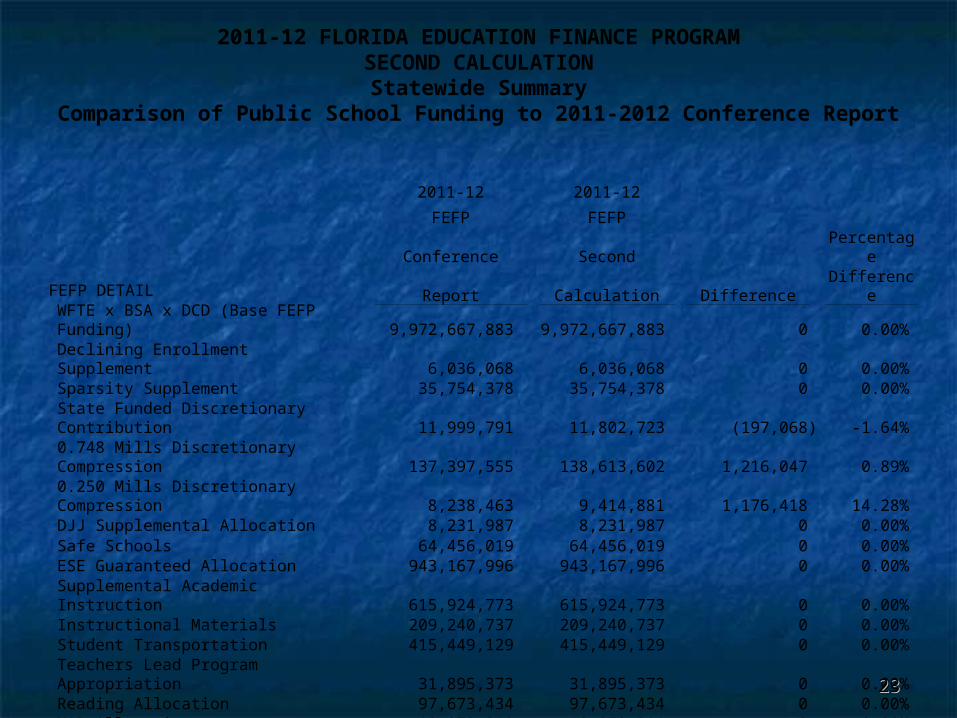
2011-12 FLORIDA EDUCATION FINANCE PROGRAMSECOND CALCULATION
Statewide SummaryComparison of Public School Funding to 2011-2012 Conference
Report
2011-12 2011-12
FEFP FEFP
Conference Second Percentage
Report Calculation Difference Difference
FEFP DETAILWFTE x BSA x DCD (Base FEFP Funding) 9,972,667,883 9,972,667,883 0 0.00%Declining Enrollment Supplement 6,036,068 6,036,068 0 0.00%Sparsity Supplement 35,754,378 35,754,378 0 0.00%State Funded Discretionary Contribution 11,999,791 11,802,723 (197,068) -1.64%0.748 Mills Discretionary Compression 137,397,555 138,613,602 1,216,047 0.89%0.250 Mills Discretionary Compression 8,238,463 9,414,881 1,176,418 14.28%DJJ Supplemental Allocation 8,231,987 8,231,987 0 0.00%Safe Schools 64,456,019 64,456,019 0 0.00%ESE Guaranteed Allocation 943,167,996 943,167,996 0 0.00%Supplemental Academic Instruction 615,924,773 615,924,773 0 0.00%Instructional Materials 209,240,737 209,240,737 0 0.00%Student Transportation 415,449,129 415,449,129 0 0.00%Teachers Lead Program Appropriation 31,895,373 31,895,373 0 0.00%Reading Allocation 97,673,434 97,673,434 0 0.00%MAP Allocation 18,872,311 18,872,311 0 0.00%Virtual Education Contribution 21,643,042 21,838,030 194,988 0.90%
TOTAL FEFP 12,598,648,939 12,601,039,324 2,390,385 0.02%
2323
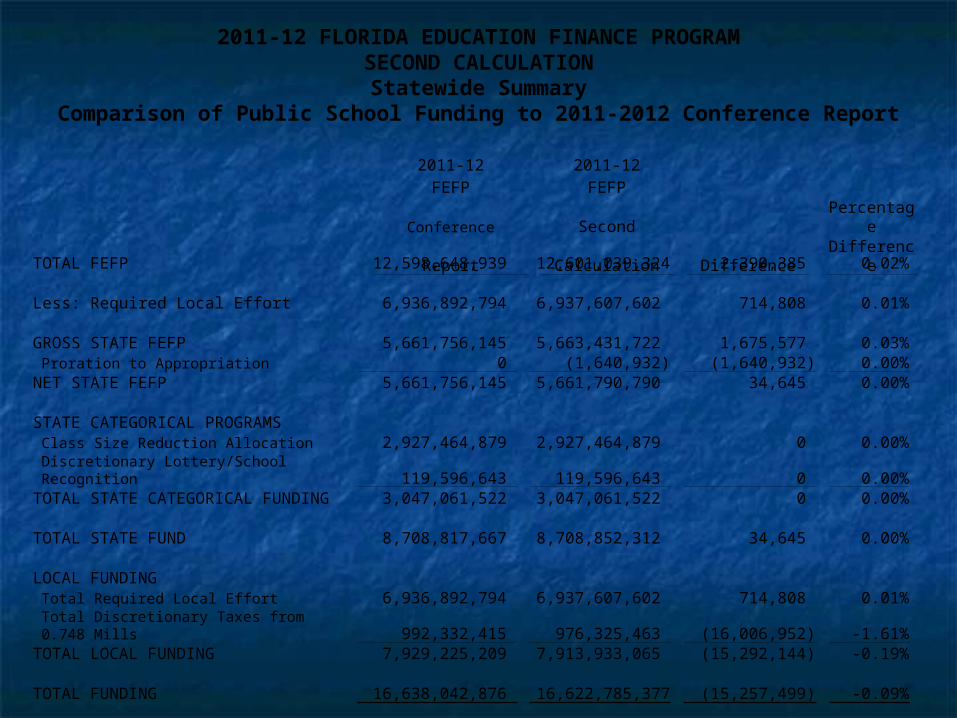
2011-12 FLORIDA EDUCATION FINANCE PROGRAMSECOND CALCULATION
Statewide SummaryComparison of Public School Funding to 2011-2012 Conference
Report
2011-12 2011-12
FEFP FEFP
Conference Second Percentage
Report Calculation Difference Difference
TOTAL FEFP 12,598,648,939 12,601,039,324 2,390,385 0.02%
Less: Required Local Effort 6,936,892,794 6,937,607,602 714,808 0.01%
GROSS STATE FEFP 5,661,756,145 5,663,431,722 1,675,577 0.03%Proration to Appropriation 0 (1,640,932) (1,640,932) 0.00%
NET STATE FEFP 5,661,756,145 5,661,790,790 34,645 0.00%
STATE CATEGORICAL PROGRAMSClass Size Reduction Allocation 2,927,464,879 2,927,464,879 0 0.00%Discretionary Lottery/School Recognition 119,596,643 119,596,643 0 0.00%
TOTAL STATE CATEGORICAL FUNDING 3,047,061,522 3,047,061,522 0 0.00%
TOTAL STATE FUND 8,708,817,667 8,708,852,312 34,645 0.00%
LOCAL FUNDINGTotal Required Local Effort 6,936,892,794 6,937,607,602 714,808 0.01%Total Discretionary Taxes from 0.748 Mills 992,332,415 976,325,463 (16,006,952) -1.61%
TOTAL LOCAL FUNDING 7,929,225,209 7,913,933,065 (15,292,144) -0.19%
TOTAL FUNDING 16,638,042,876 16,622,785,377 (15,257,499) -0.09%
Total Funds per UFTE 6,267.97 6,262.22 (5.75) -0.09%

Contact InformationContact Information
Office of Funding and Financial Office of Funding and Financial ReportingReporting
(850) 245-0405(850) 245-0405
Mark Eggers, Bureau ChiefMark Eggers, Bureau [email protected]
2525