fomc 19851105 g bpt 119851030
TRANSCRIPT

Prefatory Note
The attached document represents the most complete and accurate version available based on original copies culled from the files of the FOMC Secretariat at the Board of Governors of the Federal Reserve System. This electronic document was created through a comprehensive digitization process which included identifying the best-preserved paper copies, scanning those copies,1 and then making the scanned versions text-searchable.2 Though a stringent quality assurance process was employed, some imperfections may remain.
Please note that this document may contain occasional gaps in the text. These gaps are the result of a redaction process that removed information obtained on a confidential basis. All redacted passages are exempt from disclosure under applicable provisions of the Freedom of Information Act.
1 In some cases, original copies needed to be photocopied before being scanned into electronic format. All scanned images were deskewed (to remove the effects of printer- and scanner-introduced tilting) and lightly cleaned (to remove dark spots caused by staple holes, hole punches, and other blemishes caused after initial printing). 2 A two-step process was used. An advanced optimal character recognition computer program (OCR) first created electronic text from the document image. Where the OCR results were inconclusive, staff checked and corrected the text as necessary. Please note that the numbers and text in charts and tables were not reliably recognized by the OCR process and were not checked or corrected by staff.

Strictly Confidential (FR) Class I FOMC
October 30, 1985
SUMMARY AND OUTLOOK
Prepared for the Federal Open Market Committee
By the staff of the Board of Governors of the Federal Reserve System

DOMESTIC NONFINANCIAL DEVELOPMENTS
Recent developments. The economy still appears to be on a path of
moderate growth, albeit with continuing sluggishness in the industrial
sector. Inflation has remained relatively subdued.
The index of industrial production edged off 0.1 percent in
September. Production of business equipment turned down after two months
of increase, and output of consumer goods fell, owing to reduced assemblies
of autos and light trucks and a decline in the production of home goods.
However, output of defense and space equipment maintained its rapid ascent.
On the whole, industrial production has followed an up-and-down pattern in
recent months, with average growth this year running at about 1-1/2 percent
at an annual rate.
Growth in payroll employment slowed appreciably in September.
Nevertheless, for the third quarter as whole, job gains were almost as
rapid as in the first half of the year. Employment in the private service
sector continued to expand in September, and hiring in construction
remained fairly vigorous. However, manufacturing employment fell further,
to a level about 340,000 below its January peak. The civilian unemployment
rate, after dropping 0.3 of a percentage point in August, edged up to 7.1
percent in September.
Consumer spending grew at a rapid pace again in the third quarter--
in real terms, almost 5 percent at an annual rate--but it seems unlikely
that this pace can be maintained. A large part of the third-quarter
advance reflected consumers' response to the sales incentive programs

offered by automakers in August and September, and with the ending of these
programs in early October, sales fell back substantially. Growth in real
disposable income remained weak through late summer, and the saving rate
fell to the lowest level in more than three decades.
Business fixed investment was quite weak in the third quarter, with
preliminary GNP data showing declines in real outlays for both structures
and equipment. So far this year, increases in real BFI have averaged
about 2-1/2 percent at an annual rate. With respect to forward-looking
indicators, equipment orders spurted in late summer, but because much
of the increase was for aircraft, the recent advance may provide only a
small impetus for near-term investment outlays. The outlook for capital
spending in 1986 does not look strong either, as respondents to the
McGraw-Hill fall survey (to be released November 8) plan to reduce nominal
outlays to a bit less than the 1985 total.
Businesses seem fairly content with their current inventory posi-
tions. Except for a sharp drawdown of auto stocks in the third quarter,
inventories generally have been rising about in line with sales. The
constant-dollar inventory-sales ratio for manufacturing and trade edged
down in August and was at the lower end of the narrow range in which it has
been fluctuating so far this year.
Indicators of housing activity continue to be mixed. Total private
housing starts sagged in September and were down 6 percent for the third
third quarter as a whole. In contrast, other indicators have been more
buoyant and seemingly more consistent with the reductions in interest
rates since last spring. For example, sales of existing homes surged in
the third quarter, and new home sales also advanced.

The rate of increase in labor compensation is holding fairly
steady. As measured by the employment cost index, total hourly compensa-
tion in the private sector has risen about 4-3/4 percent over the past
twelve months, roughly the same as in the previous year. Increases in the
benefit component of compensation have slowed this year, but there has been
an offsetting pickup in the ECI measure of wage inflation, centered mainly
in the service-producing industries. The hourly earnings index, which is
limited to production and nonsupervisory workers, slowed further in the
third quarter, to an annual rate of 1 percent.
Incoming data suggest that price inflation has remained quite
moderate in recent months. The consumer price index has been increasing
0.2 percent per month since the spring, and the producer price index,
which was down sharply in September, has been essentially flat since the
start of the year. Measures of industrial commodity prices have fluctuated
in a narrow range recently. Farm crop prices have remained at low levels,
but livestock prices have rebounded sharply from the depressed levels
reached toward the end of summer.
Outlook. The staff expects that real GNP will grow at an annual
rate of around 2-1/2 percent in the current quarter. Final sales are
expected to register a small downturn, associated with depressed auto
sales during the post-incentive "payback" period and a leveling off of
federal spending after a surge in the third quarter. Excluding autos,
private final sales are projected to register a moderate advance. In
addition, business inventory accumulation is expected to pick up as auto
dealers rebuild their stocks.

Inflation, as measured by the fixed-weighted price index for gross
business product, is expected to increase at an annual rate of about 3-1/4
percent in the current quarter, more than in the third quarter but still
less rapidly than in the first half of the year. Energy prices are not
expected to fall as rapidly as in the third quarter, and, reflecting the
rebound in livestock prices, consumer food prices appear likely to rise
faster than in recent months.
The policy assumptions underlying the staff's economic forecast are
similar to those in the last Greenbook. M1 is expected to grow moderately
in the fourth quarter and then increase in 1986 at about the midpoint of
the tentative target range. Interest rates are expected to ease somewhat
over the period. For fiscal policy, the federal budget deficit, on a
unified basis, is expected to be about $193 billion, down only moderately
from the $203 billion of fiscal 1985. The structural deficit is expected
to be little changed in 1986.
The staff's assumptions with respect to dollar exchange rates are
virtually the same as those that were adopted last month in the wake of
the G-5 announcement. Under the assumption of a continuing moderate decline,
the dollar by the end of 1986 will have reversed about one-half of its
cumulative increase from late 1980 to the quarterly peak in early 1985.
Growth of real GNP in 1986 is expected to average 2-1/2 percent.
The forecast has been revised down slightly since the last Greenbook,
primarily because of a more pessimistic assessment of the outlook for
business fixed investment, which now is projected to rise less rapidly
than total GNP. Overall, domestic demand is expected to increase just

under 2 percent next year, reflecting not only the weak investment picture,
but also the constraining effect on the consumer sector of a sustained
period of slow income growth. Homebuilding, however, is likely to
provide some impetus to expansion in 1986, with the demand for owner-
occupied dwellings boosted by favorable demographics and lower mortgage
rates. And, with the dollar down considerably, the external sector is
expected to exert an increasingly positive influence on the U.S. economy as
the year progresses.
The depreciating dollar also is likely to lead to a faster rate of
increase in import prices, but in the context of sluggish demand growth,
the related inflation impulse should be damped. Consumer energy prices are
expected to be little changed again in 1986, and food prices are projected
to rise as much as general inflation, after only a small increase in 1985.
Reflecting these influences, as well as a continuing margin of slack in the
economy, the fixed-weighted price index for gross business product is
expected to accelerate only moderately next year, to a rate of about 3-3/4
percent.

October 30, 1985
STAFF GNP PROJECTIONS
Percent changes, annual rate
Gross domesticbusiness productfixed-weightedprice index Unemployment
Nominal GNP Real GNP - rate
Total Excluding food (percent)and energy
9/25/85 10/30/85 9/25/85 10/30/85 9/25/85 10/30/85 9/25/85 10/30/85 9/25/85 10/30/85
Annual changes:
1983 <1>1984 <1>19851986
Quarterly changes:
1984 Q1 <1> 14.9Q2 <1> 10.7Q3 <1> 5.6Q4 <1> 7.1
1985 Q1Q2Q3Q4
1986 Q1 5.6Q2 7.1Q3 7.3Q4 7.6
Two-quarter changes: <2>
1984 Q2 <1> 12.8Q4 <1> 6.4
1985 Q2 <1> 5.1Q4 6.0
1986 Q2 6.3Q4 7.4
7.710.8
6.26.0
14.910.75.67.1
5.64.56.76.0
5.76.06.26.9
12.86.4
3.76.82.42.7
10.17.11.64.3
.31.93.03.0
2.52.72.82.9
8.62.9
3.76.82.42.4
10.17.11.64.3
.31.93.32.6
2.12.22.42.8
8.62.9
5.1 1.16.3 3.0
5.8 2.66.5 2.9
7.2 7.17.1 7.27.0 7.27.0 7.2
-1.0 -1.0-. 3 -. 3
.1 .1-.1 -. 2
3.7 3.72.8 2.9
3.9 3.74.4 4.0
Four-quarter changes: <3>
1983 Q4 <1> 10.4 10.41984 Q4 <1> 9.5 9.51985 Q4 5.5 5.71986 Q4 6.9 6.2
-2.1 -2.1-1.3 -1.3.0 -.1
-. 2 .1
<1> Actual.<2> Percent change from two quarters earlier.<3> Percent change from four quarters earlier.

CONFIDENTIAL - FRCLASS II FOMC
I-7 October 30, 1985GROSS NATIONAL PRODUCT AND RELATED ITEMS
(Quarterly figures are seasonally adjusted. Expenditures and incomefigures are billions of current dollars at annual rates.)
1983 1984
Q1 Q2 Q3 Q4 Q1 Q2 Q3 Q4
Gross National ProductGross domestic purchases
Final salesPrivateDomestic final purchases
Personal consumption expendituresGoods
-Services
Gross private domestic investmentResidential structuresBusiness fixed investmentChange in business inventories
Nonfarm
Net exports of goods and services <1>ExportsImports
Gov't. purchases of goods and servicesFederal <2>State and local
Gross national product inconstant (1972) dollars
Personal incomeWage and salary disbursements
Disposable personal incomeSaving rate (percent)
Corporate profits with I.V.A. and C.C. Adj.Corporate profits before tax
Federal government surplus or deficit (-)(N.I.A. basis)High employment surplus or deficit (-) <3>
State and local government surplus ordeficit(-) (N.I.A. basis)
Excluding social insurance funds
Civilian labor force (millions)Unemployment rate (percent)
Nonfarm payroll employmentManufacturing
Industrial production (1977-100)Capacity utilization: all manufacturing (percent)Materials (percent)
Housing starts, private (million units, A.R.)New auto sales (millions, A.R.)
Domestic modelsForeign models
3173.83154.23216.82538.02518.4
2070.41034.61035.8
405.0113.3334.6-42.9-32.6
19.6328.5308.9
3267.03273.43286.42604.22610.7
2141.61073.01068.6
449.6129.8339.3-19.4
-5.4
-6.5328.1334.5
3346.63363.03350.92661.12677.5
2181.41095.81085.7
491.9142.3353.9
-4.311.6
-16.4342.0358.4
3431.73461.53419.02727.62757.4
2230.21122.81107.5
540.0143.4383.9
12.714.1
-29.8346.1375.9
3553.33604.83479.52775.12826.6
2276.51152.21124.4
623.8151.2398.8
73.860.6
-51.5358.9410.4
3644.73703.43594.12850.42909.1
2332.71179.01153.7
627.0155.6420.8
50.647.0
-58.7362.4421.1
3694.63785.23622.82861.82952.4
2361.41178.61182.8
662.8155.3435.7
71.863.7
-90.6368.6459.3
3758.73814.83722.12941.62997.6
2396.51192.81203.8
637.8153.5447.7
36.627.2
-56.0367.2423.2
678.8 682.2 689.8 691.4 704.4 743.7 761.0 780.5273.0 270.5 269.2 266.3 267.6 296.4 302.0 315.7405.8 411.6 420.6 425.1 436.8 447.4 458.9 464.8
1491.0 1524.8 1550.2 1572.7 1610.9 1638.8 1645.2 1662.4
2662.81608.12261.4
5.7
2714.41642.12302.9
4.2
2763.31671.32367.4
5.0
179.1 216.7 245.0161.7 198.2 227.4
2836.51715.42428.6
5.3
2920.51755.72502.2
6.1
260.0 277.4225.5 243.3
2984.61793.12554.3
5.7
3047.31819.52606.4
6.3
291.1 282.8246.0 224.8
3096.21847.62644.5
6.2
291.6228.7
-185.7 -167.3 -180.9 -180.5 -161.3 -163.7 -180.6 -197.8-80.9 -74.2 -102.5 -113.1 -113.3 -129.6 -146.1 -169.3
34.1 43.9 47.4 51.2 53.9 54.5 47.6 55.6-1.9 7.0 9.5 12.0 13.4 12.6 4.3 11.1
110.7 111.2 112.1 112.1 112.7 113.5 113.8 114.210.4 10.1 9.3 8.5 7.9 7.5 7.4 7.2
88.8 89.6 90.5 91.8 93.0 94.0 94.9 95.818.1 18.3 18.5 18.9 19.2 19.4 19.5 19.6
103.3 106.8 111.7 114.970.2 72.5 75.8 77.471.4 73.6 77.0 79.3
119.379.882.0
1.64 1.67 1.79 1.72 1.958.46 9.10 9.22 9.94 10.526.06 6.81 6.92 7.29 8.222.40 2.28 2.31 2.65 2.30
121.5 123.480.8 81.682.6 83.0
1.8610.608.232.38
1.6610.307.942.36
123.181.081.4
1.6010.297.502.79
<1> Balance of payments data and details underlying these estimates are shown in the International Developmentssection of this part of the Greenbook.
<2> Components of purchases and total receipts and total expenditures are shown in the Federal Sector Account table
which follows.<3> Estimates in table are evaluated at a 6 percent high employment unemployment rate.

October 30, 1985
CONFIDENTIAL - FRCLASS II FOMC
PERCENT CHANGES IN GROSS NATIONAL PRODUCTAND RELATED ITEMS
(Annual rates compounded quarterly)
1983 1984
Q1 Q2 Q3 Q4 Q1 Q2 Q3 Q4
Constant (1972) Dollars
Gross national productGross domestic purchases
Final salesPrivateDomestic final purchases
Personal consumption expendituresGoodsServices
Gross private domestic investmentResidential structuresBusiness fixed investment
Gov't. purchases of goods and servicesFederalNational defenseState and local
Disposable personal income
Current Dollars
Gross national productGross domestic purchases
Final sales
Personal consumption expendituresGoodsServices
Gross private domestic investmentResidential structuresBusiness fixed investment
Gov't. purchases of goods and servicesFederalNational defenseState and local
Disposable personal incomePersonal incomeWage and salary disbursements
Corporate profits with I.V.A. and C.C.Adj.Corporate profits before tax
Nonfarm payroll employmentManufacturing
Nonfarm business sectorOutput per hourCompensation per hourUnit labor costs
GNP implicit deflator <1>Gross domestic business product
fixed-weighted price index <2>Excluding food and energy
Consumer price index (all urban)
Industrial production
3.3 9.4 6.83.7 12.3 7.41.1 6.4 4.93.5 8.6 6.24.0 12.1 6.9
2.6 10.0 3.83.5 12.6 5.41.5 7.3 2.1
34.1 52.5 38.464.5 78.1 31.6.0 9.6 18.7
-8.2 -2.6 -.5-17.4 -5.9 -5.3
6.8 7.6 -1.9-1.2 -. 2 2.7
2.1 3.3 7.7
8.5 12.3 10.16.7 16.0 11.45.9 8.9 8.1
4.8 14.5 7.63.6 15.7 8.86.1 13.3 6.6
34.3 52.0 43.279.3 71.9 44.4-5.5 5.7 18.5
-1.3 2.0 4.5-8.9 -3.6 -2.07.9 9.8 3.34.2 5.8 9.0
4.3 7.5 11.73.6 8.0 7.35.6 8.7 7.3
94.8 114.3 63.416.0 125.7 73.3
.5 3.4 4.2-1.2 4.4 6.2
4.4 8.1 2.15.7 3.5 2.21.3 -4.2 .1
5.0 2.6 3.1
2.7 3.9 4.54.9 3.5 5.4.4 4.3 4.2
11.5 14.0 19.8
5.9 10.1 7.18.7 12.9 7.94.2 3.6 10.36.3 4.2 8.59.7 7.6 9.5
6.8 4.6 7.99.5 7.8 10.73.8 1.2 4.6
37.0 71.6 -2.24.0 21.3 1.2
30.6 20.6 21.3
-4.3 1.0 18.6-8.7 -2.8 45.2
9.2 3.4 12.2-1.4 3.5 3.7
8.2 8.6 6.3
1.6 4.35.4 .9
-1.0 7.9-2.4 8.42.3 4.0
.7 3.6-1.9 3.8
3.8 3.3
24.9 -13.1-4.6 -5.513.7 8.5
5.4 5.96.2 15.2
-2.3 17.54.8 -. 2
3.9 3.5
10.6 14.9 10.7 5.6 7.112.2 17.6 11.4 9.1 3.28.4 7.3 13.8 3.2 11.4
9.2 8.6 10.2 5.0 6.110.2 10.9 9.6 -. 1 4.98.3 6.2 10.9 10.5 7.3
45.3 78.0 2.0 24.9 -14.33.3 23.6 12.1 -.6 -4.738.4 16.5 23.9 14.9 11.5
.9 7.8 24.3 9.6 10.7-4.3 2.0 50.5 7.8 19.413.2 12.5 14.7 -.8 22.14.4 11.5 10.0 10.7 5.2
10.7 12.7 8.6 8.4 6.011.0 12.4 9.1 8.6 6.711.0 9.7 8.8 5.9 6.5
26.8 29.6 21.3 -10.9 13.0-3.3 35.5 4.5 -30.3 7.1
5.8 5.5 4.3 3.9 4.07.8 6.4 4.5 2.4 1.1
1.0 2.9 5.5 -1.14.1 6.1 3.7 3.63.0 3.1 -1.7 4.7
4.4 4.4 3.3 3.9
3.5 4.2 4.1 4.03.8 3.4 5.4 4.94.2 5.2 3.7 3.7
12.0 16.0 7.6 6.4
<1> Excluding the federal pay increase, the rate of change in 1983-Q4 was 4.4 percent.<2> Uses expenditures in 1972 as weights.
1-8

CONFIDENTIAL - FRCLASS II FOMC
I-9October 30, 1985
GROSS NATIONAL PRODUCT AND RELATED ITEMS(Quarterly figures are seasonally adjusted. Expenditures and income
figures are billions of current dollars at annual rates.)
Projected1985 1986
Q1 Q2 Q3 Q4 Q1 Q2 Q3 Q4
Gross National ProductGross domestic purchases
Final salesPrivateDomestic final purchases
Personal consumption expendituresGoodsServices
Gross private domestic investmentResidential structuresBusiness fixed investmentChange in business inventoriesNonfarm
Net exports of goods and services <1>ExportsImports
Gov't. purchases of goods and servicesFederal <2>State and local
Gross national product inconstant (1972) dollars
3810.63885.23770.02978.13052.6
2446.51212.11234.4
646.8155.2450.940.734.1
-74.5360.7435.2
3853.13947.13835.23024.33118.3
3916.14005.33924.23078.33167.5
3973.44070.03948.73091.83188.4
4028.44127.04004.93142.93241.5
4087.64182.64065.63193.13288.1
4149.44244.44125.73240.63335.6
4219.34307.24195.33296.03383.8
2493.0 2536.5 2552.0 2597.0 2634.5 2672.7 2711.71231.1 1251.2 1244.4 1265.8 1277.5 1289.6 1302.61261.9 1285.3 1307.6 1331.1 1357.0 1383.1 1409.1
643.2158.0467.317.911.4
-94.0347.7441.6
622.8163.4467.5
-8.1-8.4
-89.2347.6436.7
661.0166.9469.524.723.7
-96.6355.1451.8
668.0170.4474.123.521.9
-98.6361.4460.0
675.6174.4479.222.022.1
-95.0372.3467.3
686.6178.4484.5
23.723.8
696.3182.4489.8
24.124.2
-95.1 -87.9382.8 398.4477.8 486.3
791.9 810.9 845.9 857.0 862.0 872.5 885.1 899.3319.9 324.2 347.0 350.7 348.4 351.3 356.1 362.2472.0 486.7 498.9 506.3 513.6 521.2 529.0 537.1
1663.5 1671.3 1684.8 1695.5 1704.4 1713.6 1723.8 1735.8
Personal incomeWage and salary disbursements
Disposable personal incomeSaving rate (percent)
Corporate profits with I.V.A. and C.C. Adj.Corporate profits before tax
Federal government surplus or deficit (-)(N.I.A. basis)High employment surplus or deficit (-) <3>
State and local government surplus ordeficit(-) (N.I.A. basis)
Excluding social insurance funds
Civilian labor force (millions)Unemployment rate (percent)
Nonfarm payroll employmentManufacturing
Industrial production (1977=100)Capacity utilization: all manufacturing (percent)Materials (percent)
Housing starts, private (million units, A.R.)New auto sales (millions, A.R.)
Domestic modelsForeign models
3143.81882.72654.8
4.5
3174.71910.62726.5
5.1
3199.11935.22712.6
2.9
292.3 298.5 324.1222.3 221.0 235.8
3263.01965.42766.1
4.1
3313.11994.22818.5
4.2
3361.32023.02855.7
4.1
3414.32052.12897.7
4.1
3471.52083.32942.8
4.1
313.9 304.9 306.4 306.6 307.9225.6 217.8 221.1 220.3 220.6
-165.1 -214.1 -196.3 -198.6 -196.9 -189.7 -186.6 -185.3-129.4 -178.3 -161.5 -163.5 -159.9 -150.5 -146.2 -144.8
53.7 50.3 48.7 47.8 48.8 50.2 50.2 50.88.3 4.2 2.2 .5 .7 1.3 .5 .1
115.2 115.2 115.5 116.0 116.6 117.1 117.6 118.17.3 7.3 7.2 7.1 7.1 7.2 7.2 7.2
96.6 97.3 97.9 98.4 99.0 99.4 99.9 100.419.6 19.4 19.3 19.3 19.4 19.4 19.5 19.5
123.880.581.5
1.8010.878.462.42
124.280.380.4
1.7710.92
8.272.65
124.580.179.6
1.6612.319.402.90
125.279.979.4
125.879.879.3
1.70 1.759.90 10.706.90 7.703.00 3.00
126.679.879.3
1.7510.707.703.00
127.579.879.2
1.8010.707.603.10
128.479.879.3
1.8010.707.603.10
<1> Balance of payments data and details underlying these estimates are shown in the International Developmentssection of this part of the Greenbook.
<2> Components of purchases and total receipts and total expenditures are shown in the Federal Sector Account tablewhich follows.
<3> Estimates in table are evaluated at a 6 percent high employment unemployment rate.

CONFIDENTIAL - FRCLASS II FOMC
I-10PERCENT CHANGES IN GROSS NATIONAL PRODUCT
AND RELATED ITEMS(Annual rates compounded quarterly)
October 30, 1985
Projected1985 1986
Q1 Q2 Q3 Q4 Q1 Q2 Q3 Q4
Constant (1972) Dollars
Gross national productGross domestic purchases
Final salesPrivate
Domestic final purchases
Personal consumption expendituresGoods
Services
Gross private domestic investmentResidential structuresBusiness fixed investment
Gov't. purchases of goods and servicesFederalNational defenseState and local
Disposable personal income
Current Dollars
Gross national productGross domestic purchases
Final sales
Personal consumption expendituresGoodsServices
Gross private domestic investmentResidential structuresBusiness fixed investment
Gov't. purchases of goods and servicesFederalNational defense
State and local
Disposable personal incomePersonal incomeWage and salary disbursements
Corporate profits with I.V.A. and C.C.Adj.Corporate profits before tax
Nonfarm payroll employmentManufacturing
Nonfarm business sectorOutput per hourCompensation per hourUnit labor costs
GNP implicit deflator <1>Gross domestic business product
fixed-weighted price index <2>Excluding food and energy
Consumer price index (all urban)
.3 1.9 3.3 2.6 2.1 2.2 2.4 2.83.9 3.2 3.2 2.5 1.9 1.7 1.9 1.9-.3 4.6 5.9 -1.0 2.4 2.3 2.2 2.8-.4 4.8 3.6 -1.5 3.3 2.6 2.2 2.84.1 6.4 3.5 -1.5 3.1 2.0 1.6 1.6
5.2 4.8 4.8 -2.2 3.3 1.8 1.5 1.55.4 5.4 6.8 -5.8 4.5 1.2 .8 1.05.0 4.2 2.7 2.2 2.1 2.6 2.2 2.0
3.1 -3.5 -14.9 25.2 .7 2.0 3.2 2.15.3 6.4 10.9 6.1 5.1 6.1 5.6 5.2
-1.6 14.5 -4.7 .1 1.3 1.4 1.4 1.3
.3 3.7 16.1 1.0 -1.7 .8 2.4 3.1
.7 -. 4 33.4 .1 -6.4 -. 9 2.3 4.1-.2 7.2 20.1 .8 1.6 2.8 1.2 1.6
.0 6.7 5.0 1.7 1.9 2.1 2.4 2.3
-1.6 8.2 -4.2 3.2 3.9 1.3 1.6 1.9
5.6 4.5 6.7 6.0 5.7 6.0 6.2 6.97.6 6.5 6.0 6.6 5.7 5.5 6.0 6.05.2 7.1 9.6 2.5 5.8 6.2 6.0 6.9
8.6 7.8 7.2 2.5 7.2 5.9 5.9 6.06.6 6.4 6.7 -2.1 7.1 3.7 3.8 4.1
10.6 9.2 7.6 7.1 7.4 8.0 7.9 7.7
5.8 -2.2 -12.1 26.9 4.3 4.6 6.7 5.74.6 7.4 14.4 8.8 8.7 9.7 9.5 9.33.0 15.3 .1 1.7 4.0 4.3 4.6 4.4
5.9 10.0 18.4 5.3 2.4 4.9 5.9 6.65.4 5.6 31.2 4.3 -2.6 3.4 5.6 7.04.0 12.8 21.5 5.8 4.9 6.6 5.4 5.36.3 13.0 10.5 6.0 6.0 6.0 6.1 6.3
1.6 11.2 -2.0 8.1 7.8 5.4 6.0 6.46.3 4.0 3.1 8.2 6.3 5.9 6.5 6.97.8 6.1 5.3 6.4 6.0 5.9 5.9 6.2
1.0 8.8 39.0 -12.0 -11.0 2.0 .3 1.7-10.7 -2.3 29.6 -16.2 -13.1 6.2 -1.4 .5
3.3 2.9 2.5 2.1 2.1 1.9 1.9 2.1.0 -2.7 -2.0 .3 .8 .8 1.0 1.0
-3.1 1.2 1.2 .7 .8 .8 1.1 1.15.0 3.4 3.9 4.0 4.6 4.1 4.3 4.58.4 2.1 2.7 3.3 3.8 3.3 3.2 3.4
5.4 2.6 3.3 3.3 3.5 3.7 3.7 4.0
3.6 3.7 2.6 3.3 3.7 3.7 3.9 4.04.6 3.8 3.5 3.5 3.8 4.2 4.3 4.53.2 4.2 2.4 3.6 4.2 3.9 4.1 4.2
Industrial production 2.1 1.3 1.1 2.1 2.2 2.4 2.7 2.9
<1> Excluding Federal pay increase, the rate of change in 1985-Q1 was 5.0 percent.<2> Uses expenditures in 1972 as weights.

CONFIDENTIAL - FRCLASS II FOMC
I-11 October 30, 1985GROSS NATIONAL PRODUCT AND RELATED ITEMS
(Expenditures and income figures are billions of current dollars.)
-Projected--1979 1980 1981 1982 1983 1984 1985 1986
Gross national productGross domestic purchases
Final salesPrivateDomestic final purchases
Personal consumption expendituresGoodsServices
Gross private domestic investmentResidential constructionBusiness fixed investmentChange in business inventoriesNonfarm
Net exports of goods and services <1>ExportsImports
Gov't. purchases of goods and servicesFederal <2>State and local
Gross national product inconstant (1972) dollars
Personal incomeWage and salary disbursements
Disposable personal incomeSaving rate (percent)
Corporate profits with I.V.A. and C.C.Adj.Corporate profits before tax
Federal government surplus or deficit (-)(N.I.A. basis)High employment surplus or deficit (-)
State and local government surplus ordeficit (-) (N.I.A. basis)
Excluding social insurance funds
Civilian labor force (millions)Unemployment rate (percent)
Nonfarm payroll employment (millions)Manufacturing
Industrial production (1977-100)Capacity utilization: all manufacturing (percent)Materials (percent)
Housing starts, private (million units, A.R.)New auto sales (millions, A.R.)
Domestic modelsForeign models
2417.82404.52403.51929.21915.9
1507.1813.4693.7
423.0118.5290.2
14.38.6
13.2281.3268.1
474.4168.3306.0
2631.72607.72641.42103.72079.7
1668.0883.5784.5
401.9102.9308.8-9.8-4.5
23.9338.8314.8
537.8197.0340.8
2957.72929.82931.72335.22307.2
1849.1966.1883.0
484.2104.3353.926.018.2
28.0369.9341.9
596.5228.9367.6
3069.23050.23095.42444.92425.9
1984.91002.6982.2
414.991.3349.6-26.1-23.9
19.0348.4329.4
650.5258.9391.5
3304.83313.13318.32632.72641.0
2155.91081.51074.4
471.6132.2352.9-13.5
-3.1
-8.3336.2344.4
685.5269.7415.8
3662.83727.03604.62857.22921.4
2341.81175.71166.1
637.8153.9425.758.249.6
-64.2364.3428.5
747.4295.4452.0
3888.33976.83869.53043.13131.7
2507.01234.71272.3
643.5160.9463.818.815.2
-88.6352.8441.3
826.4335.4491.0
4121.24215.34097.93218.13312.3
2654.01283.91370.1
681.6176.4481.923.323.0
-94.1378.7472.9
879.7354.5525.2
1479.4 1475.0 1512.1 1480.0 1534.7 1639.3 1678.8 1719.4
1951.11237.61650.2
5.9
194.8252.7
2165.31356.71828.9
6.0
175.4234.6
2429.41493.12041.7
6.7
189.9221.2
2584.61568.72180.5
6.2
159.1165.5
2744.21659.22340.1
5.0
225.2203.2
3012.11804.02576.8
6.1
285.7235.7
3195.11923.52715.0
4.1
307.2226.1
3390.12038.12878.7
4.1
306.4219.9
-16.1 -61.2 -64.3 -148.2 -178.6 -175.8 -193.5 -189.6-20.8 -36.4 -31.3 -61.6 -92.7 -139.6 -158.2 -150.4
30.4 30.6 37.6 32.9 44.1 52.96.6 3.5 7.8 -.8 6.6 10.4
105.0 106.9 108.7 110.2 111.6 113.55.8 7.1 7.6 9.7 9.6 7.5
89.8 90.4 91.2 89.6 90.2 94.521.0 20.3 20.2 18.8 18.4 19.4
110.7 108.6 111.0 103.1 109.2 121.884.6 79.3 78.3 70.3 74.0 80.887.1 81.1 81.1 71.7 75.3 82.3
1.72 1.30 1.10 1.06 1.70 1.7710.68 9.04 8.56 8.00 9.18 10.438.36 6.62 6.24 5.77 6.77 7.972.32 2.42 2.32 2.23 2.41 2.46
50.13.8
115.57.2
97.619.4
124.480.280.2
1.7311.008.262.74
50.0.7
117.37.2
99.719.5
127.179.879.3
1.7710.707.653.05
<1> Balance of payments data underlying these estimates are shown in the International Developments section of thispart of the Greenbook.
<2> Components of purchases and total receipts and total expenditures are shown in the Federal Sector Accounts tablewhich follows.
CONFIDENTIAL - FRCLASS II FOMC
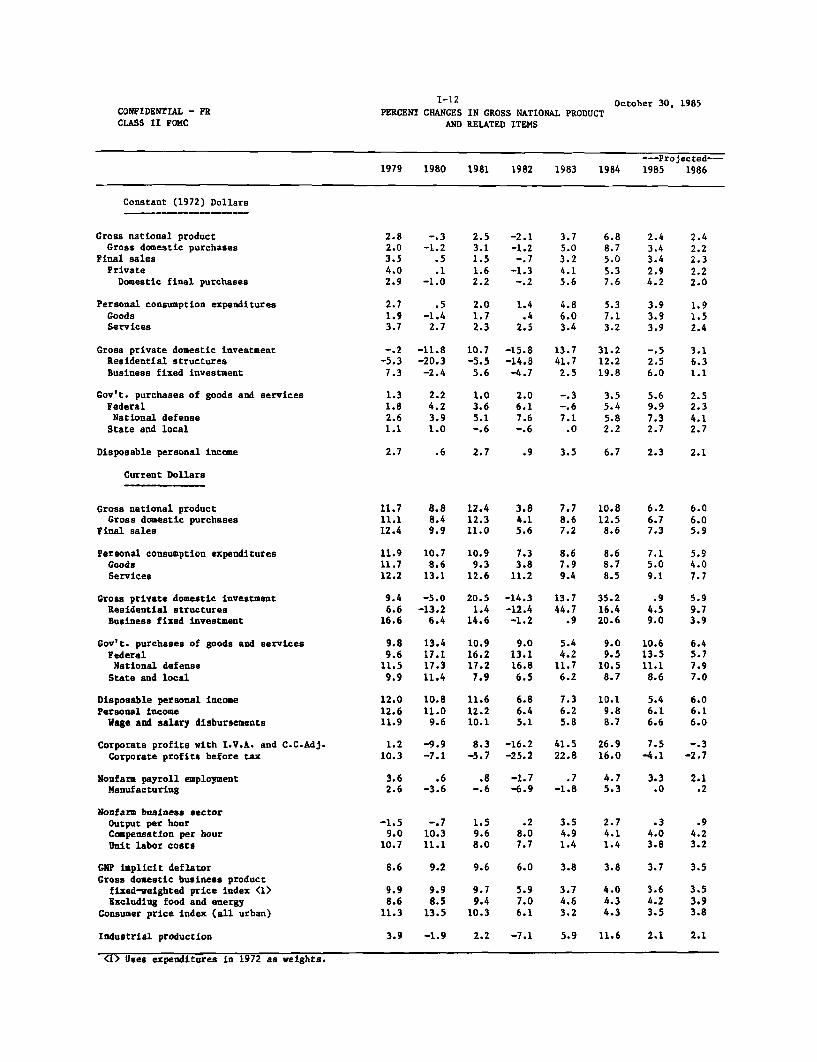
I-12PERCENT CHANGES IN GROSS NATIONAL PRODUCT
AND RELATED ITEMS
October 30, 1985
---Projected--1979 1980 1981 1982 1983 1984 1985 1986
Constant (1972) Dollars
Gross national productGross domestic purchases
Final salesPrivateDomestic final purchases
Personal consumption expendituresGoodsServices
Gross private domestic investmentResidential structuresBusiness fixed investment
Gov't. purchases of goods and servicesFederalNational defense
State and local
Disposable personal income
Current Dollars
Gross national productGross domestic purchases
Final sales
Personal consumption expendituresGoodsServices
Gross private domestic investmentResidential structuresBusiness fixed investment
Gov't. purchases of goods and servicesFederalNational defense
State and local
Disposable personal incomePersonal incomeWage and salary disbursements
Corporate profits with I.V.A. and C.C.Adj.Corporate profits before tax
Nonfarm payroll employmentManufacturing
Nonfarm business sectorOutput per hourCompensation per hourUnit labor costs
GNP implicit deflatorGross domestic business product
fixed-weighted price index <1>Excluding food and energy
Consumer price index (all urban)
Industrial production
<1> Uses expenditures in 1972 as weights.
2.8 -. 3 2.5 -2.1 3.7 6.8 2.4 2.42.0 -1.2 3.1 -1.2 5.0 8.7 3.4 2.23.5 .5 1.5 -.7 3.2 5.0 3.4 2.34.0 .1 1.6 -1.3 4.1 5.3 2.9 2.22.9 -1.0 2.2 -.2 5.6 7.6 4.2 2.0
2.7 .5 2.0 1.4 4.8 5.3 3.9 1.91.9 -1.4 1.7 .4 6.0 7.1 3.9 1.53.7 2.7 2.3 2.5 3.4 3.2 3.9 2.4
-. 2 -11.8 10.7 -15.8 13.7 31.2 -. 5 3.1-5.3 -20.3 -5.5 -14.8 41.7 12.2 2.5 6.37.3 -2.4 5.6 -4.7 2.5 19.8 6.0 1.1
1.3 2.2 1.0 2.0 -.3 3.5 5.6 2.51.8 4.2 3.6 6.1 -.6 5.4 9.9 2.32.6 3.9 5.1 7.6 7.1 5.8 7.3 4.11.1 1.0 -.6 -.6 .0 2.2 2.7 2.7
2.7 .6 2.7 .9 3.5 6.7 2.3 2.1
11.7 8.8 12.4 3.8 7.7 10.8 6.2 6.011.1 8.4 12.3 4.1 8.6 12.5 6.7 6.012.4 9.9 11.0 5.6 7.2 8.6 7.3 5.9
11.9 10.7 10.9 7.3 8.6 8.6 7.1 5.911.7 8.6 9.3 3.8 7.9 8.7 5.0 4.012.2 13.1 12.6 11.2 9.4 8.5 9.1 7.7
9.4 -5.0 20.5 -14.3 13.7 35.2 .9 5.96.6 -13.2 1.4 -12.4 44.7 16.4 4.5 9.7
16.6 6.4 14.6 -1.2 .9 20.6 9.0 3.9
9.8 13.4 10.9 9.0 5.4 9.0 10.6 6.49.6 17.1 16.2 13.1 4.2 9.5 13.5 5.711.5 17.3 17.2 16.8 11.7 10.5 11.1 7.99.9 11.4 7.9 6.5 6.2 8.7 8.6 7.0
12.0 10.8 11.6 6.8 7.3 10.1 5.4 6.012.6 11.0 12.2 6.4 6.2 9.8 6.1 6.111.9 9.6 10.1 5.1 5.8 8.7 6.6 6.0
1.2 -9.9 8.3 -16.2 41.5 26.9 7.5 -. 310.3 -7.1 -5.7 -25.2 22.8 16.0 -4.1 -2.7
3.6 .6 .8 -1.7 .7 4.7 3.3 2.12.6 -3.6 -.6 -6.9 -1.8 5.3 .0 .2
-1.5 -.7 1.5 .2 3.5 2.7 .3 .99.0 10.3 9.6 8.0 4.9 4.1 4.0 4.2
10.7 11.1 8.0 7.7 1.4 1.4 3.8 3.2
8.6 9.2 9.6 6.0 3.8 3.8 3.7 3.5
9.9 9.9 9.7 5.9 3.7 4.0 3.6 3.58.6 8.5 9.4 7.0 4.6 4.3 4.2 3.9
11.3 13.5 10.3 6.1 3.2 4.3 3.5 3.8
3.9 -1.9 2.2 -7.1 5.9 11.6 2.1 2.1

October 30, 1985FEDERAL SECTOR ACCOUNTS(Billions of dollars)
T FRB staff estimatesFiscal Fiscal FY1986
e 2/3/ CY1985 Calendar quarters; not seasonally adjusted
Year Year Admin. FRB CY FRB 1984 | 1985 19861984* 1985* 1/ Staff 1984* Staff IV* I* II* III* IV I II III
Unified budget receipts 666 734 780 773 683 742 166 174 206 188 174 180 225 194
Unified budget outlays 842 937 955 966 868 944 239 230 234 234 246 239 241 240
Surplus/deficit(-), unified budget -175 -203 -175 -193 -184 -202 -72 -56 -28 -47 -72 -60 -16 -46
Surplus/deficit(-), off-budgetagencies4 -10 -9 -2 -5 -10 -11 1 -3 -5 -3 -1 -1 -2 -1
Combined deficit to be financed -185 -212 -178 -198 -195 -213 -71 -59 -32 -50 -72 -61 -18 -47
Means of financing combined deficit:
Net borrowing from public 171 197 180 201 199 206 64 42 45 46 73 52 31 45
Decrease in cash operating balance 7 13 0 -8 -6 3 13 4 -10 7 2 0 -10 0
Other5
8 1 -2 5 2 4 -6 13 -3 -3 -3 9 -3 2
Cash operating balance, end of period 30 17 20 25 18 15 18 14 24 17 15 15 25 25
Memo: Sponsored agency borrowing6
30 21 n.a. 20 30 22 4 4 8 5 5 5 5 5
MU Budget WNIA Budget Seasonally adjusted annual rates
Receipts 688 750 809 799 705 766 722 771 734 774 784 789 804 818Expenditures 860 944 978 992 881 959 920 937 948 970 983 986 993 1004
Purchases 283 327 343 352 295 335 316 320 324 347 351 348 351 356Defense 215 240 255 262 222 246 232 234 241 253 257 260 264 268
Nondefense 68 87 88 90 74 89 84 86 83 94 94 89 87 89All other expenditures 577 617 635 640 586 624 604 617 624 623 632 638 642 648
Surplus/deficit(-) -172 -193 -169 -193 -176 -194 -198 -165 -214 -196 -199 -197 -190 -187
High employment surplus/deficit(-)evaluated at 6 percent unemployment -126 -160 n.a. -155 -140 -158 -169 -129 -178 -162 -164 -160 -151 -146
*--actual e--estimated n.a.--not available
1. Mid-session Review, August 30, 1985.
2. The Congressional Budget Resolution, passed August 1, 1985, shows revenues of
$796 billion, combined unified and off-budget outlays of $968 billion, and a
total deficit of $172 billion in fiscal year 1986.
3. The latest CBO budget estimates that incorporate the Budget Resolution policy
assumptions and the August 1985 CBO economic forecast show revenues of
$790 billion, combined unified and off-budget outlays of $965 billion, and
a total deficit of $175 billion in fiscal year 1986.
Note: Details may not add to totals due to rounding.
4. Includes Federal Financing Bank, Postal Service Fund, RuralElectrification and Telephone Revolving Fund, Rural Telephone Bank,and Strategic Petroleum Reserve.
5. Checks issued less checks paid, accrued items and other transactions.6. Sponsored agency borrowing includes net debt issuance by Federal
Home Loan Banks, FHLMC (excluding participation certificates), FNNA(excluding mortgage-backed securities), Federal Land Banks, FederalIntermediate Credit Banks, Banks for Cooperatives, and Student LoanMarketing Association marketable debt on a payment basis. TheAdministration's definition of borrowing by these agencies issomewhat broader.

DOMESTIC FINANCIAL DEVELOPMENTS
Recent developments. Market rates of interest generally are
unchanged or somewhat lower on net since the October FOMC meeting.
Reserve market conditions have been fairly stable, with federal funds
trading most recently a little below 8 percent. Some market partici-
pants had been anticipating a bit more accommodative stance on the part
of the System, in light of the G-5 agreement, but sentiment has been
buoyed by evidence of moderate economic expansion, subdued inflation,
and slowing monetary growth.
Growth in the monetary aggregates slowed in September, with M1
rising at an 11-1/2 percent rate despite a surge late in the month
associated with disruptions of financial flows caused by Hurricane
Gloria. These effects seem to have been reversed in October, when M1
on average appears to have leveled off; this aggregate, however, still
remains well above its target range. M2 decelerated to a 7 percent
annual rate in September. There was an actual decline in M2 money
market fund balances and a marked slowing in growth of savings deposits
and MMDAs at both commercial banks and thrift institutions. Growth in
small time deposits during September remained negative, but less so
than in August. Current estimates suggest that M2 rose by about 2
percent in October, moving it into its 1985 target range. M3 accele-
rated slightly in September, to 9 3/4 percent, as managed liabilities
at banks rose in response to the runoff of U.S. Government deposits.
Issuance of large time deposits remained firm in October, but M3
remains well within its annual target range.
I-14

I-15
Growth of debt, in the aggregate, has remained rapid, but somewhat
under the pace earlier in the year. Credit demands of nonfinancial
business have weakened since midyear, especially in short-term compo-
nents such as bank loans and commercial paper. A combination of rising
cash flow and declining inventories has more than offset the effect of
continued large net equity liquidations associated with mergers, buy-
outs, and share repurchases. Business loans at banks and commercial
paper declined a little on average for September, and gross issuance of
corporate bonds slowed in both September and October.
Enthusiasm for debt lengthening may have been damped a bit by the
backup in bond rates after early summer, but financial corporations
nonetheless have not cut back their bond issuance as much as industrial
firms. Financial subsidiaries of automobile firms have raised funds to
support their low interest rate loan programs, while thrifts and subsi-
diaries of home builders have been strong issuers of collateralized
mortgage obligations.
Gross issuance of tax-exempt securities has been quite high in the
past few months. Activity has been spurred by heavy advance refunding
and several kinds of private-purpose issues, all of which face threats
from restrictive legislative proposals currently before Congress. Both
commercial banks and mutual funds have been heavy purchasers of munici-
pal debt lately. Overall demand for tax-exempts has been sufficient to
result in some decline in rates on these securities despite the massive
volume.
Consumer installment credit grew at a 15 percent annual rate in
August, continuing the recent pattern of somewhat slower growth than

I-16
observed earlier in the year. Commercial bank data for September and
October suggest further deceleration in consumer credit, but the over-
all recent total likely was boosted by heavy auto finance company
lending under special rate programs.
Mortgage markets continue to show robust activity, with large
increases in thrift holdings of mortgage assets recorded in August, as
better income and capital positions permitted faster growth under the
net worth requirements. Issuance of new mortgage pass-through securi-
ties was at a record $11.6 billion in September, about half of which
were swap issues under FNMA and FHLMC programs. A shift toward
FHA-insured and VA-guaranteed mortgage financing also has occurred
in recent months, as lending standards on conventional loans have
tightened, especially with respect to high loan-to-value mortgages.
In the absence of legislative action to raise the debt ceiling,
the pace of borrowing by the Treasury has been reduced. However, with
the continued large federal deficit being reflected in a rundown in
Treasury cash balances, and a surge of borrowing expected as soon as
a new ceiling is established, the overall market impact of reduced
Treasury issuance has been minimal. Sponsored agency borrowing during
the third quarter was about in line with recent experience, and the
Farm Credit Banks -- which reported a large loss for the quarter --
again paid down some debt. Yield spreads on Farm Credit securities
relative to Treasuries have widened a bit.
Outlook. The staff is projecting that interest rates will come
under some moderate downward pressure between now and next spring, as

I-17
households cut their spending on durables and increase their savings,
and as business capital spending remains sluggish.
In the very near term the federal government is likely to be the
major force in the credit markets. While the combined federal deficit
is projected at around $73 billion in the fourth quarter, the markets
fully anticipate this development and any attendant rate pressures
should be limited and transitory. Thereafter the pace of Treasury
borrowing should subside to a degree, and the growth rate of federal
debt will tend to moderate.
At the same time, there should be some deceleration of credit
demands by other sectors, which likely will become even more evident in
the first quarter of 1986. This is especially true in the tax-exempt
markets, where current staff projections show a sharp drop in the pace
of such borrowing--even in the absence of prompt legislative action on
new rules for the issuance of municipal securities, owing to concerns
about retroactivity.
While current staff projections for corporate profits and capital
expenditures suggest the need for external financing will be minimal
over the next six months, the amount of borrowing associated with gross
equity retirements because of mergers and buyouts will still be high.
Merger and stock buy-back announcements continue unabated, and the
evidence points to heavy net share retirements at least into the
opening months of 1986. The interest rate outlook suggests that corpo-
rate borrowing will be concentrated in long-term markets, although some
pickup in short-term borrowing may occur as inventory accumulation
resumes, and balance sheet structures will be only moderately affected.

I-18
Household debt growth likely will slow a little in coming months.
In particular, consumer credit should stay on the decelerating path
indicated by recent data, perhaps with some caution creeping into both
borrower and lender behavior in light of the strains suggested by high
debt-to-income ratios and rising installment loan delinquency rates.
Net mortgage borrowing by households is projected to remain brisk, how-
ever, in line with the forecasted expansion of single-family housing
starts. Thrift institutions probably will maintain a stronger lending
pace than they did earlier this year, but purchases of mortgage pool
securities by mutual funds, unit trusts, and diversified institutional
investors will remain important.
INTERNATIONAL DEVELOPMENTS
Recent developments. The trade-weighted average foreign exchange
value of the dollar has declined 2-3/4 percent further on balance since
the last FOMC, bringing its net depreciation to 7-1/2 percent since the
G-5 announcement of September 22. The dollar fell nearly 2-1/2 percent
during the first week of October, as market participants remained
concerned about the prospect for central bank sales of dollars and
looked to the IMF/World Bank meetings in Seoul for further announcements
by G-5 officials. The dollar firmed somewhat when reports from Seoul
suggested that some G-5 authorities were satisfied with the dollar's
level and then subsequently traded in a narrow range despite heavy
intervention sales of dollars. Toward the end of the intermeeting
period, the dollar began again to weaken, declining initially against
the yen when the Bank of Japan indicated that in the context of efforts
to support the yen, it would not accommodate seasonal demands for
liquidity as it usually does. Interest rates on yen money-market
instruments and bonds rose steeply in response. The decline of the
dollar broadened to include the other major currencies in association
with some increases in German and U.K. interest rates and declines in
U.S. interest rates.
I-19

I-20
Since the G-5 announcement, the New York Desk has sold a total
of more than $3 billion against yen and marks, divided evenly between
the System and the Treasury; almost all of this activity occurred since
the last FOMC meeting.
Available banking data for the first two months of the third
quarter indicate substantial capital inflows into U.S. banking offices.
In addition, private foreign purchases of U.S. corporate stocks and
bonds continued very strong in July and August. However, net private
foreign holdings of U.S. Treasury securities did not increase during
these two months, in contrast to the substantial net acquisitions
recorded in each of the previous five quarters. Net foreign official
holdings of Treasury securities did increase in July and August, but at
a rate sharply reduced from that in the second quarter.
In August, the merchandise trade deficit (s.a.a.r.) was somewhat
smaller than that recorded in July as exports increased slightly and
imports declined. For the two-month period on average the deficit was
substantially smaller than in the second quarter, with most of the
change coming in imports. These developments need to be assessed with
caution, however, as monthly data are very volatile and preliminary
calculations suggest that revisions will be substantial. Nonoil import
prices for July and August averaged nearly 3 percent below their level a
year ago, and the price of imported oil in August was unusually, and

I-21
probably temporarily, low. Trade data for September are to be released
on October 31 and will be reported in the Greenbook supplement.
Economic growth continues moderate but uneven in the major foreign
industrial countries. Inflation abroad on average remains low, with
some major countries experiencing further gains against inflation in the
most recent data. Through September the German current account had
strengthened substantially when compared with 1984 as had the Japanese
current account through August.
At the IMF/World Bank meetings in Seoul Treasury Secretary Baker
presented an initiative calling for mutual action, by borrowers, by
international institutions, and by the banking community, where
additional financing from official institutions and the banks would
support, and be dependent upon, the restructuring of the economies of
debtor countries. For the individual countries, although it is out of
compliance with its IMF program, Mexico is expected to receive up to
$800 million in emergency assistance from the IMF, the World Bank, and
the Inter-American Development Bank. Argentina was found in compliance
with the end-July IMF performance tests, but some difficulties may arise
with the end-September tests. Real activity has continued to expand in
Brazil, but negotiations between Brazil and the IMF remain stalled. The
Peruvian government has refused a routine IMF mission and has suggested
the possibility that Peru will withdraw from the IMF.
Outlook:
The staff forecast for the foreign exchange value of the dollar
remains unchanged from the last Greenbook. It continues to project that

I-22
the dollar in the fourth quarter will be substantially below the average
in the third quarter and that during 1986 there will be a further
moderate decline. The outlook for economic activity in foreign
industrial countries and in the developing countries is also essentially
the same as in the last Greenbook. Real growth in the foreign
industrial countries is expected to be about equal, on average, to that
in the United States. The developing countries, while slowing somewhat
from most recent rates of expansion, are expected to experience a growth
rate slightly above that of the United States. Based on recent data for
merchandise trade values and, in particular, prices, the staff has
reduced somewhat its projection for the current account deficit for 1985
to $125 billion, and for 1986 to about $130 billion.

STRICTLY CONFIDENTIAL (FR)CLASS II FOMC
OCTOBER 29, 1985
OUTLOOK FOR U.S. NET EXPORTS AND RELATED ITEMS(BILLIONS OF DOLLARS, SEASONALLY ADJUSTED ANNUAL RATES)
1. GNP EXPORTS AND IMPORTS 1/
CURRENT $, NETEXPORTS OF G+SIMPORTS OF G+S
CONSTANT 72 $, NETEXPORTS OF G+SIMPORTS OF G+S
2. U.S. MERCHANDISE TRADE BALANCE 2/
EXPORTSAGRICULTURALNONAGRICULTURAL
IMPORTSPETROLEUM AND PRODUCTSNONPETROLEUM
3. U.S. CURRENT ACCOUNT BALANCE
OF WHICH: NET INVESTMENT INCOME
4. FOREIGN OUTLOOK 3/
REAL GNP--TEN INDUSTRIAL 4/REAL GNP--NONOPEC LDC 5/
CONSUMER PRICES--TEN IND. 4/
ANNUAL1984- 1985-P 1986-P
-64.2364.3428.5
-15.0146.0161.1
-88.6352.8441.3
-32.6140.1172.6
-94.2378.7472.9
-30.2145.5175.7
1984Q3- Q4-
-90.6368.6459.3
-27.0147.4174.4
-56.0367.2423.2
-13.4147.1160.5
1985Q1- Q2- Q3-
-74.5360.7435.2
-28.4143.7172.1
-94.0347.7441.6
-33.8137.9171.8
-89.2347.6436.7
-34.0138.1172.1
198644-P 01-P Q2-P 03-P Q4-P
-96.7355.1451.8
-34.1140.5174.6
-98.7361.4460.0
-33.5141.7175.3
-95.1372.3467.3
-31.6143.9175.5
-95.2382.8477.8
-29.8146.1175.9
-88.0398.4486.3
-25.9150.3176.2
-108.3 -128.8 -134.8 -130.0 -98.2 -118.1 -132.0 -128.5 -136.6 -137.9 -135.7 -135.1 -130.6
220.3 215.4 232.2 222.1 225.4 222.8 213.0 211.2 214.5 219.6 227.3 235.9 246.238.4 28.6 29.4 36.9 38.3 33.5 28.3 2 5 .5? 27.2 29.0 29.3 29.5 29.8181.9 186.7 202.8 185.3 187.2 189.4 184.6 185.7e 187.3 190.6 198.0 206.4 216.4
328.6 344.2 367.1 352.1 323.6 341.0 345.0 339.7 351.1 357.5 362.9 371.0 376.857.5 47.7 43.7 57.8 56.8 45.2 52.8 46.1? 46.7 44.4 42.8 44.2 43.5271.1 296.5 323.3 294.4 266.9 295.7 292.2 293.6f 304.4 313.1 320.2 326.8 333.3
-101.5 -125.2 -129.4 -130.0 -101.9 -121.3 -127.2 -121.3 -130.9 -132.8 -129.4 -129.6 -125.7
19.1 19.8 17.6 13.0 16.0 10.2 22.4 23.3 23.4 19.9 18.5 16.5 15.7
3.2 2.7 2.8 4.8 3.3 0.4 4.3 3.3 2.84.1 3.7 3.8 4.3 3.7 3.3 3.4 3.6f 3.8
4.9 4.4 3.8 2.6 4.8 5.4 5.7 1.5 3.9
2.7 2.6 2.5 2.64.0 3.9 3.8 3.6
4.3 4.3 3.4 3.6
ECONOMIC ACTIVITY AND PRODUCT ACCOUNT DATA.INTERNATIONAL ACCOUNTS BASIS.PERCENT CHANGE, ANNUAL RATES.WEIGHTED BY MULTILATERAL TRADE-WEIGHTS OF 0-10 COUNTRIES PLUS SWITZERLAND; PRICES ARE NOT SEASONALLY ADJUSTED.WEIGHTED BY SHARE IN NONOPEC LDC GNP.PROJECTED