fomc 19840522 g bpt 219840516
TRANSCRIPT

Prefatory Note
The attached document represents the most complete and accurate version available based on original copies culled from the files of the FOMC Secretariat at the Board of Governors of the Federal Reserve System. This electronic document was created through a comprehensive digitization process which included identifying the best-preserved paper copies, scanning those copies,1 and then making the scanned versions text-searchable.2 Though a stringent quality assurance process was employed, some imperfections may remain.
Please note that this document may contain occasional gaps in the text. These gaps are the result of a redaction process that removed information obtained on a confidential basis. All redacted passages are exempt from disclosure under applicable provisions of the Freedom of Information Act.
1 In some cases, original copies needed to be photocopied before being scanned into electronic format. All scanned images were deskewed (to remove the effects of printer- and scanner-introduced tilting) and lightly cleaned (to remove dark spots caused by staple holes, hole punches, and other blemishes caused after initial printing). 2 A two-step process was used. An advanced optimal character recognition computer program (OCR) first created electronic text from the document image. Where the OCR results were inconclusive, staff checked and corrected the text as necessary. Please note that the numbers and text in charts and tables were not reliably recognized by the OCR process and were not checked or corrected by staff.

Confidential (FR) Class II FOMC
May 16, 1984
RECENT DEVELOPMENTS
Prepared for the Federal Open Market Committee
By the staff of the Board of Governors of the Federal Reserve System

TABLE OF CONTENTS
Section Page
DOMESTIC NONFINANCIAL DEVELOPMENTS II
Industrial production .......................................... 1Employment and unemployment..................................... 3Personal income and consumption....................................... 5Business fixed investment...................................... 9Business inventories .............. ............................. 11Housing markets .................................................. 13Government spending: federal, state and local................... 16Exports and imports ................................................... 17Prices. ............................ ........................ ... 19Wages and labor costs................. ...................... 21
Tables
Industrial production........................................... 2Capacity utilization in industry ............................... 2Changes in employment........................................... 4Selected unemployment rates..................................... 4Personal income and expenditures................................ 6Retail sales .................... ..... .................. . 8Auto sales and production........................................ 8Business capital spending indicators............................ 10Changes in manufacturing and trade inventories................. 12Inventories relative to sales................................... 12Private housing activity ....................................... 14Recent deficit reduction plans.................................. 18Recent changes in consumer prices.............................. 20Recent changes in producer prices............................... 20
Selected measures of labor costsin the nonfarm business sector............................... 22
Charts
Prices for new houses, quality-adjusted......................... 14
DOMESTIC FINANCIAL DEVELOPMENTS III
Monetary aggregates and bank credit............................ 2Business finance..... ........................................... 5
Government financeFederal sector................................. 9State and local sector....................................... 11
Mortage markets......................................... ....... 11Consumer credit......................................... ...... 17

Tables
Monetary aggregates.................................. ......... 3Commercial bank credit and short- and intermediate-term
business credit............................................. 6
Gross offerings of securities by U.S. corporations.............. 8Treasury and agency financing................................... 10Gross offerings of securities by state and local governments.... 12Adjustable-rate home mortgages held by major institutions....... 14Mortgage activity at federally insured savings and
loan associations . ......................... ................ 16
New issues of federally guaranteed mortgagepass-through securities............................... .. 16
Consumer installment credit.................................... 18
Charts
Ratio of tax-exempt to taxable bond yields...................... 12Yield spread: GNMA less Treasury yields......................... 14
INTERNATIONAL DEVELOPMENTS IV
Foreign exchange markets......................................... 1U.S. international financial transactions.................. ...... 5U.S. merchandise trade........................................ 10
Foreign economic developments.... ........................... ...... 13Debt situation in selected developing countries.................. 23
Tables
International banking data..................................... 6Summary of U.S. international transactions....................... 9U.S. merchandise trade........................................... 10U.S. oil imports............ ................................. .... 11Major industrial countries
Real GNP and IP............................................... 14Consumer and wholesale prices................................. 15Trade and current account balances........................... 16
Charts
Weighted-average exchange value of the U.S. dollar............... 2Three-month interest rates.................................... 2

May 16, 1984
II - T - 1
SELECTED DOMESTIC NONFINANCIAL DATA(Seasonally adjusted)
Latest data Percent change fromThree
Period Release Data Preceding periods Yeardate period earlier earlier
(At annual rates)
Civilian labor forceUnemployment rate (%) 1/Insured unemployment rate (2) 1/
Nonfarm employment, payroll (mil.)ManufacturingNonmanufacturing
Private nonfarm:Average weekly hours (hr.) 1/Hourly earnings ($) 1/
Manufacturing:Average weekly hours (hr.) 1/Unit labor cost (1967=100)
Industrial production (1967=100)Consumer goodsBusiness equipmentDefense & space equipmentMaterials
Apr.Apr.Feb.Apr.Apr.Apr.
05-04-8405-04-8404-23-8405-04-8405-04-8405-04-84
Apr. 05-04-84Apr. 05-04-84
Apr. 05-04-84Mar. 04-30-84
Apr.Apr.Apr.Apr.Apr.
Consumer prices all items (1967=100) Mar.All items, excluding food & energy Mar.Food Mar.
Producer prices: (1967=100)Finished goodsIntermediate materials, nonfoodCrude foodstuffs & feedstuffs
Personal income ($ bil.) 2/
05-15-8405-15-8405-15-8405-15-8405-15-84
04-24-8404-24-8404-24-84
Apr. 05-11-84Apr. 05-11-84Apr. 05-11-84
113.27.82.9
92.919.773.3
35.68.30
41.288.9
163.1161.6175.4132.7162.9
307.6297.0301.8
291.6323.8269.0
Mar. 04-18-84 2,940.5
3.57.83.15.36.25.0
35.28.25
40.6-8.0
16.412.815.920.217.2
2.74.9
-1.6
.0
.7-14.1
2.010.2
4.54.37.03.6
35.5 34.98.22 7.95
41.0 40.1-6.6 -7.7
3.52.9
- .9
11.3 10.1
(Not at annual rates)
Mfgrs. new orders dur. goods ($Capital goods industries
NondefenseDefense
Inventories to sales ratio: 1/Manufacturing and trade, total
ManufacturingTrade
Ratio: Mfgrs.' durable goods inven-tories to unfilled orders 1/ Mar.
bil. )Mar.Mar.Mar.Mar.
05-01-8405-01-8405-01-8405-01-84
Mar. 05-14-84Mar. 05-14-84Mar. 05-14-84
05-01-84
104.538.111.526.6
2.110.955.5-1.6
1.33 1.321.42 1.431.24 1.23
.522 .526
6.1 30.9.17.1 41.651.1 70.06.8 32.0
1.30 1.431.40 1.591.21 1.30
.537 .585
Retail sales, total ($ bil.)GAF 3/
Apr. 05-11-84 106.4 2.9Apr. 05-11-84 22.6 3.6
-. 2 11.81.0 12.8
05-03-84 10.3 4.2 -6.2 22.1Auto sales, total (mil. units.) 2/ Apr.

DOMESTIC NONFINANCIAL DEVELOPMENTS
Economic growth regained upward momentum in April after tapering
off late in the first quarter, owing in part to adverse weather. Both
employment and industrial production advanced rapidly last month, and
retail sales rebounded. However, housing activity appears to have leveled
off in response to rising mortgage interest rates. Wage and price inflation
in the first four months of this year remained at about last year's
pace.
Industrial Production
Industrial output rose 1/2 percent in March and then surged almost
1-1/2 percent in April. Since the turn of the year, monthly production
increases have averaged only slightly less than during the preceding 13
months of cyclical recovery. Gains in April were widespread among most
product and material categories. Apart from autos, where output declined,
production gains for most consumer goods were considerably larger than
in February and March. The strong upward trend in output of business
equipment resumed in April after two months of smaller increases. In
addition, output of defense equipment has expanded more rapidly lately
than during 1983. Among materials categories, a particularly strong
increase was reported for equipment parts; and raw steel output, although
still at a depressed level, climbed 2 percent.
Auto assemblies, which were running at a high rate of 9-1/4 million
units (not seasonally adjusted) in March, dropped back in April largely
because several GM plants were shut down for model changeovers and plant
II-1

II-2
INDUSTRIAL PRODUCTION(Percentage change from preceding period:
based on seasonally adjusted data)
1983 1984 1984Q__3 Q4 Q1 Feb. Mar. Apr.
-----Annual rate----- -- Monthly rate--
Total 21.8 10.2 11.7 1.0 .5 1.4
Final products 17.7 8.4 12.1 .4 .4 1.2Consumer goods 16.9 1.9 7.2 .1 .2 1.1Durable 29.7 5.8 16.4 -.4 .4 .4Nondurable 12.3 0.5 3.7 .3 .2 1.3
Business equipment 23.2 22.2 20.3 .9 .5 1.3
Defense and space equipment 10.2 11.6 17.9 .9 .8 1.7
Construction supplies 31.3 8.4 15.0 1.0 1.1 1.5
Materials 25.2 12.3 12.6 1.9 .6 1.4Durable goods 31.4 18.0 20.9 2.5 .8 1.9
Nondurable goods 18.3 10.2 1.4 1.9 1.0 1.4Energy materials 21.0 1.3 10.5 -.1 -.5 .3
CAPACITY UTILIZATION IN INDUSTRY(Percent of capacity, seasonally adjusted)
1978-80 1982 1967-82 1984
High Low Avg. Feb. Mar. Apr.
Total industry 87.3 69.6 82.4 80.8 81.0 81.9
Manufacturing 87.5 68.8 81.8 81.0 81.2 82.3Durable 89.4 64.8 80.5 80.2 80.6 81.9Nondurable 87.2 73.8 83.9 82.0 82.0 82.7
Mining 90.4 69.6 86.5 75.1 74.5 74.3Utilities I 86.8 79.0 88.6 82.6 83.2 83.2
Industrial materials 88.9 66.6 83.3 82.0 82.3 83.3
Metal materials 95.4 46.2 82.2 70.9 71.7 73.3Paper materials 97.9 86.3 93.4 99.0 98.3 99.5Chemical materials 91.3 64.0 85.1 79.0 79.8 80.4
1. The 1978-80 high is below the 1967-82 average because of the unusuallyslow growth in demand for electricity.

II-3
conversions. 1 These changeovers, which usually occur during the third
quarter, will be completed in June. In preparing estimates of GNP, the
Commerce Department does not plan to adjust their seasonal factors to
reflect the early model changeover. As a result, their estimate of
auto production should have a substantial downward effect on the real GNP
growth rate in the second quarter--perhaps as much as 2 percentage
points at an annual rate.
Manufacturing capacity utilization rose about 1 percentage point
in April to 82.3 percent, about the same as the average rate during
the 1967-1982 period. Utilization rates vary widely among industries,
and shortages appear to be confined to a few specific products and
materials, such as some electronic components, popular models of cars
and trucks, radial tires, gypsum board, paper, and a few plastics
materials. For the bulk of the industrial sector, existing capacity
still appears ample.
Employment and Unemployment
Labor demand strengthened further in April as payroll employment
climbed 400,000. Part of the surge last month reflected a bounceback in
in jobs at construction sites after a weather-related decline the month
before. Moreover, service industries added 175,000 employees, the
largest monthly gain for this sector since the recovery began. In
manufacturing, employment growth returned to the pace recorded early
this year, rising another 100,000, and the factory workweek rose to
1. In line with past practice, the Board staff has adjusted its seasonalfactors for auto production to reflect the earlier-than-usual modelchangeovers. Using these factors, auto assemblies were at an 8.2
million unit rate in March and 7.7 million in April. The decline that
occurred in addition to model changeovers was at small car plants andfor some less-popular large models.

II-4
CHANGES IN EMPLOYMENT 1(Thousands of employees; based on seasonally adjusted data)
1983 1984 19841981 1982 1983 Q3 Q4 Q1 Feb. Mar. Apr.
---Average monthly changes---
Nonfarm payroll employment2 -6 -172 245 336 249 302 427 149 407
Manufacturing -40 -127 91 96 136 93 110 61 101Durable -33 -99 71 79 108 72 95 49 62Nondurable -8 -28 20 17 28 22 15 12 40
Construction -21 -20 23 35 17 27 56 -63 74Trade 8 -18 44 39 56 65 58 57 15Finance and services 59 31 86 98 69 100 165 100 196Total government -25 -13 1 47 -30 -5 31 -17 1
Private nonfarm productionworkers -7 -146 213 245 239 238 317 109 239
Manufacturing productionworkers -47 -108 82 81 124 74 80 49 95
Total employment3 0 -51 330 378 355 400 702 248 262Nonagricultural 21 -67 336 435 339 425 578 363 150
Average change from final month of preceding period to final month of perioddicated.
2. Survey of establishments.3. Survey of households.
SELECTED UNEMPLOYMENT RATES(Percent; based on seasonally adjusted data)
1983 1984 19841981 1982 1983 Q3 Q4 Q Feb. Mar. Apr.
Civilian, 16 years and older 7.6 9.7 9.6 9.4 8.5 7.9 7.8 7.8 7.8
Teenagers 19.6 23.2 22.4 22.4 20.6 19.6 19.3 19.9 19.420-24 years old 12.2 14.8 14.4 14.0 12.9 11.9 11.6 11.6 12.2Men, 25 years and older 5.1 7.5 7.8 7.5 6.8 6.1 6.1 5.9 5.9Women, 25 years and older 5.9 7.3 7.2 7.0 6.3 6.1 6.1 6.0 6.0
White 6.7 8.6 8.4 8.1 7.4 6.8 6.7 6.7 6.7Black 15.6 18.9 19.5 19.4 17.9 16.5 16.2 16.6 16.8
Fulltime workers 7.3 9.6 9.5 9.3 8.3 7.6 7.5 7.5 7.6
Memo:Total national1 7.5 9.5 9.5 9.3 8.4 7.8 7.7 7.7 7.7
1. Includes resident Armed Forces as employed.

II-5
its highest level in almost two decades. Since its cyclical trough in
December 1982, the number of nonfarm payroll jobs has increased more
than 4 million. Although this rate of employment growth has been on a
par with the average of previous post-war recoveries, total hours of
work have expanded more rapidly as the average workweek, particularly
in manufacturing, has lengthened much more than during previous recoveries.
Despite continued gains in employment, the civilian unemployment
rate remained at 7.8 percent for the third consecutive month in April as
expanding job opportunities have drawn more individuals into the labor
force. The civilian labor force participation rate, which hovered
around 64 percent during the first year of the recovery, rose to 64.4
percent by April. The recent increase has occurred among adult females,
who have contributed importantly to the secular rise in participation
over the past two decades, and among youth, whose participation tends
to be highly sensitive to the availability of jobs.
Personal Income and Consumption
Income growth was exceptionally strong in the first quarter, and
the saving rate rose nearly 1 percentage point to 6.1 percent. Real
disposable personal income grew at more than a 10 percent annual rate--
the largest quarterly advance since the recovery began. Rising employment
contributed to the gains in wages and salaries, while payments under
the PIK program again added substantially to farm income; indeed, the
surge in PIK payments may have accounted for some of the increase in
the measured saving rate last quarter. Recent data on employment and
wages suggest that wage and salary income posted a large gain last

II-6
PERSONAL INCOME AND EXPENDITURES(Based on seasonally adjusted data)
1983 1984 19841982 1983 Q3 Q4 Q1 Jan. Feb. Mar.
- - Percentage changes at annual rates1 - -
Total personal incomeNominalReal 2
Disposable personal incomeNominalReal
4.6 7.7 7.3 11.1 13.2 19.8 8.3-.3 4.2 3.0 8.1 9.7 14.2 8.3
5.1 8.8 10.9 11.0 13.8 20.9 8.4.2 5.2 6.5 8.0 10.2 15.0 8.4
5.7.7e
5.9.2e
ExpendituresNominalReal
7.5 9.0 6.52.5 5.4 2.2
9.4 9.2 21.8 12.4 5.26.5 5.8 15.9 -12.2 -.6e
- - Changes in billions of dollars 3 --
Total personal income
Wages and salaries
PrivateManufacturing
Other income
Farm income
Disposable personal income
10.65.13.4-.66.0-8.9
17.911.29.73.77.5-.6
16.310.38.84.06.6-1.4
26.011.49.92.8
15.25.1
27.012.29.94.6
16.85.2
47.122.718.78.1
29.817.2
10.0 17.2 21.9 22.2 24.2 42.6
20.08.56.93.8
11.9.7
13.85.44.01.88.7-2.3
ExpendituresDurablesNondurablesServices
Personal saving rate (percent) 5.8 4.9 4.9 5.2 6.1 5.1 6.6 6.7
1. Changes over periods longer than one quarter are measured from final quarterof preceding period to final quarter of period indicated. Changes for quarterlyperiods are compounded rates of change; monthly changes are not compounded.2. Total personal income is deflated by the personal consumption expendituredeflator.3. Average monthly changes are from the final month of the preceding period tothe final month of period indicated; monthly figures are changes from thepreceding month.e--estimate
12.02.51.97.6
16.04.34.07.8
10.0-.33.27.1
17.5 12.4
19.19.71.48.1
9.0-2.75.56.2
40.96.8
31.03.0
-23.7-11.1-10.1-2.4
9.8-3.9-4.518.1

II-7
month. However, the drop in PIK payments is likely to depress income
growth in the second quarter.
Rising income and a willingness to use installment credit continue
to provide support for consumer spending. Total retail sales climbed
2.9 percent in April, more than reversing the March decline; the later-
than-usual Easter holiday and bad weather in March may account for the
volatile monthly swing in sales. All major types of stores reported
higher sales in April, but gains were particularly strong for durable
goods, the most credit-sensitive component of consumer expenditures.
Retail sales in the GAF grouping of largely discretionary items rose to
a level 2.1 percent above the first-quarter average.
Despite low inventories of popular domestic models and Japanese
cars, unit auto sales in April were at a 10.3 million unit annual
rate, just slightly less than during the first quarter. Sales of
domestic models, which had dipped in March, returned to 8.2 million
unit rate in April; foreign car sales have hovered around a 2.1 million
unit rate since February. Now that a new quota year has begun, deliveries
of Japanese models undoubtedly have stepped up, and sales are expected
to increase in the next few months.
Consumer surveys found households still quite optimistic in April.
The Conference Board index of confidence advanced nearly 3-1/2 percentage
points, almost returning to its January 1984 peak. The Michigan Survey
Research Center's index of consumer sentiment moved lower, but, except
for the preceding three months, was the highest in the last ten years.
Intentions to buy cars and houses were near record levels; however, many

II-8
RETAIL SALES(Percent change from previous period;based on seasonally adjusted data)
1983 1984
Q3 Q4 Q1 Feb. Mar. Apr.
Total sales 1.9 2.9 3.3 -1.1 -2.0 2.9
(Real)l 1.1 2.5 2.8 -.8 -2.1 -
Total, less automotive,gasoline andnonconsumer stores 2.2 1.6 2.9 -1.6 -.6 2.2
GAF2 1.9 3.3 3.1 -.7 -1.8 3.6
Durable 2.4 6.8 4.7 -.6 -5.3 5.2Automotive group 1.0 9.4 5.5 -.2 -7.3 6.4Furniture & appliances 4.7 3.4 3.0 -3.1 -1.1 3.6
Nondurable 1.7 1.0 2.6 -1.3 -.2 1.8Apparel -1.5 4.2 2.4 .9 1.0 3.9Food 1.7 .1 2.1 -.9 .5 1.2General merchandise3 2.1 2.9 3.4 -.4 -3.2 3.6Gasoline stations 2.3 -.7 .1 -1.0 1.2 1.2
1. BCD series 59. Data are available approximately 3 weeks following theretail sales release.2. General merchandise, apparel, furniture and appliance stores.3. General merchandise excludes mail-order nonstores; mail-order salesare also excluded in the GAF grouping.
AUTO SALES & PRODUCTION(Millions of units; seasonally adjusted annual rates)
1983 1984Q2 Q3 Q4 Q1 Feb. Mar. Apr.
Total sales 9.1 9.2 9.9 10.5 10.6 9.9 10.3
Imports 2.3 2.3 2.7 2.3 2.2 2.1 2.1
Domestic 6.8 6.9 7.3 8.2 8.5 7.8 8.2Small 3.0 2.8 3.2 3.7 3.8 3.5 3.7Intermediate & standard 3.9 4.1 4.1 4.4 4.6 4.3 4.6
Domestic production 6.3 7.6 7.6 8.2 8.1 8.2 7.7Small 2.7 3.2 3.8 3.9 3.8 3.9 3.8Intermediate & standard 3.6 4.4 3.8 4.2 4.3 4.3 3.9
Note--Components may not add to totals due to rounding.

II-9
consumers who thought it was a good time to buy a house also expressed
concerns that interest rates would rise during the year ahead. The
inflation rate anticipated for the next 12 months, 5.9 percent, was
notably higher than the price expectations reported since last fall.
Business Fixed Investment
Business fixed investment still is expanding strongly, but the
pace has subsided from the extremely rapid rate late last year. Indicators
of future outlays point to continued strong growth.
Shipments of nondefense capital goods rose 3.9 percent in March,
bringing the increase for the first quarter to only about 1 percent.
That gain was substantially less than the extraordinary 6 percent surge
in the fourth quarter, but it understates the strength in domestic equipment
demand. Real imports of capital goods jumped about 14 percent (not at
an annual rate) in the first quarter. Foreign producers of capital
equipment have made steady inroads into U.S. markets over the past
several years, and imports in real terms now account for about a fourth
of all equipment expenditures other than motor vehicles compared with
about one-seventh in 1980. In addition, spending on cars and trucks
rose rapidly last quarter.
Nonresidential construction activity also has been robust, increasing
almost 6 percent in the first quarter, with substantial gains reported
for most major categories. Building of stores, restaurants, and warehouses,
which typically follows residential construction activity, has risen
steadily since mid-1983. Office construction picked up sharply despite
high vacancy rates across most of the country; apparently, developers

II-10
BUSINESS CAPITAL SPENDING INDICATORS(Percentage change from preceding comparable period;
based on seasonally adjusted data)
1983 1984Q3 Q4 Q1 Jan. Feb. Mar.
Producers' durable equipment
Nondefense capital goodsShipments
Excluding aircraft &parts
OrdersExcluding aircraft &
parts
Unfilled ordersExcluding aircraft &
parts
Addendum:Sales of heavy-weight
trucks (thousands ofunits, annual rate)
Nonresidential structures
Nonresidential constructionput in place
Nonresidential buildingpermits
3.1 6.0 .9 -5.3 .3 3.9
4.9 6.1 2.0 -4.2 -.6 5.5
3.9 6.9 4.8 .8 7.7 -1.6
6.4 5.4 3.7 1.3 .8 4.1
1.4 2.0 4.3 .8 2.3 1.2
2.4 1.9 3.3 1.0 1.3 1.0
181 199 232 190 275 232
2.7 2.4 5.8 .5 2.6 0.6
11.6 -2.1 16.0 10.4 2.9 19.8

II-11
expect that demand for office space will remain strong over the long
term. Industrial building also rose sharply from its depressed level,
but spending by public utilities declined.
Looking ahead, new orders for nondefense capital goods indicate a
further expansion of capital spending. Excluding the volatile aircraft
component, new orders rose sharply in March, and were up 3.7 percent
for the first quarter. Private surveys of business plans for capital
spending also indicate a substantial rise in outlays in 1984. The
April McGraw-Hill survey of plant and equipment spending found that
businesses plan to boost nominal expenditures 18-1/2 percent this
year, with manufacturers expecting larger increases than nonmanufacturing
firms. The Merrill-Lynch survey, also conducted in April, found a
slightly lower rate of growth at 16 percent. Both findings represent
significant upward revisions from the results of the fall samplings.
Business Inventories
Investment in business inventories expanded rapidly in recent
months. Indeed, the swing toward greater accumulation of nonfarm stocks
accounted for nearly one-third of real GNP growth in the first quarter.
Overall manufacturing and trade inventories surged ahead at an annual
rate of $55-1/2 billion in book value terms in March, after rising at a
record pace of $110 billion in February. Nonetheless, the inventory-sales
ratio for all manufacturing and trade remained fairly low. Thus, there
appears to be room for further accumulation in the months ahead, particu-
larly in the manufacturing sector.
Manufacturers continue to maintain lean inventories relative to
sales. Throughout the latter half of 1983, manufacturers failed to

II-12
CHANGES IN MANUFACTURING AND TRADE INVENTORIES(Billions of dollars at annual rates)
19831982 1983 Q3 Q4
4 Jan. Feb. Mr.Q1 Jan. Feb.. Mar.E
Book value basis
TotalManufacturingWholesale tradeRetail trade
AutomotiveEx. Auto
Constant dollar basis
TotalManufacturingWholesale tradeRetail trade
AutomotiveEx. Auto
-18.1-17.5
-. 3-.3
-1.1.8
-8.2-8.4
.6-.5-. 4
.0
8.8-4.2
2.510.5
4.26.3
.0-3.1-. 5
3.61.12.5
25.56.0
10.09.44.35.2
29.45.09.6
14.88.76.1
9.4-. 53.66.34.12.3
44.727.2 5.5
13.625.6
4.121.5
7.6-5.5
3.99.2
.68.5
INVENTORIES RELATIVE TO SALES 1
CyclicalReference Points2. 1983
1981 Low 1982 HighE. Q3 Q41984
Q1 Jan. Feb.. Mar.E
Book value basis
TotalManufacturingWholesale tradeRetail trade
AutomotiveEx. Auto
Constant dollar basis
TotalManufacturingWholesale tradeRetail trade
AutomotiveEx. Auto
1.391.601.061.361.591.36
1.621.921.351.331.441.27
1.531.781.281.431.881.35
1.772.141.561.451.791.38
1.351.481.151.341.461.31
1.571.801.401.361.371.36
1.321.441.121.371.441.31
1.291.44 1.41
1.081.291.351.28
1.551.751.391.361.401.35
1.511.721.331.331.281.34
37.9110.038.315.257.428.628.9
42.113.8
5.023.2
9.513.7
1.421.32
1.111.351.461.32
1.541.731.371.381.361.38
1. Ratio of end-of-period inventories to average sales for the period.2. Highs and lows are specific to each series and are not necessarily coincident.r--revised estimates.p--preliminary estimates.
__

I-13
accumulate inventories even though shipments were rising. But continued
strong demand early in 1984 apparently persuaded them to step up sharply
their stockbuilding. In February and March, the book value of manufacturing
stocks rose at an annual rate of $38 billion compared with the average
$5 billion pace in the preceding several months. The recent expansion
in stocks was widespread both by industry and by stage of processing.
Together with strong new orders and a rising backlog of unfilled orders,
recent inventory buildups apparently signal sustained strength in production
and employment in manufacturing industries.
Inventories at trade establishments also expanded briskly in recent
months, especially at retail stores. In general, trade inventories are
not as lean as manufacturing stocks, and there is a wide disparity in the
inventory situation within the trade sector. Auto dealers, for example,
have complained about short supplies of some popular models for several
months, even though deliveries were stepped up in the first quarter. At
other retailers, some of the accumulation in February and March probably
was unintended, but may be transitory given the resurgence of sales in
April. Anecdotal reports suggest that the current level of stocks is not
a major concern for most retailers.
Housing Markets
Unusual weather has made recent data difficult to interpret. Early
in the year, favorable weather conditions boosted housing starts, whereas
in March bad weather hindered construction activity. In April, total
private housing starts rebounded to a 1.96 million unit annual rate--
close to the advanced first-quarter pace. However, newly-issued

II-14
PRIVATE HOUSING ACTIVITY(Seasonally adjusted annual rates, millions of units)
1983 1983 1984 1984Annual Q4 Q1 Feb. Mar. Apr. 1
All unitsPermits 1.59 1.63 1.81 1.90 1.73 1.73Starts 1.70 1.70 1.96 2.26 1.65 .1.96
Single-family unitsPermits .89 .91 1.02 1.08 .97 .94Starts 1.07 1.04 1.28 1.46 1.07 1.15
SalesNew homes .62 .67 .68 .70 .66 n.a.Existing homes 2.72 2.76 2.94 2.91 3.03 n.a.
Multifamily unitsPermits .70 .72 .79 .82 .75 .79Starts .63 .66 .69 .80 .58 .82
Mobile home shipments .30 .31 .30 .29 .29 n.a.
1. Preliminary estimates.n.a.--not available.
PRICES FOR NEW HOUSES, QUALITY-ADJUSTED
Percent changefrom year earlier
18
15
- 12
I II I I I9 1 9809 I I 1 9
Z.,- /"*'^\
I
1982 19831979 1980 1981 1984

II-15
residential building permits--an indicator less affected by weather--were
unchanged in April at a 1.7 million unit annual rate, which is somewhat
below the level earlier in the year.
Multifamily starts jumped sharply in April to their highest monthly
pace in more than a decade. Over the preceding eight months, multifamily
construction had been sustained on a high plateau, as building of
rental units was particularly robust. A combination of factors has made
rental units more attractive to investors, including tax advantages of
accelerated depreciation, a dramatic slowdown in the rise in construction
costs, and lower operating costs due to declining energy prices. This
high level of rental construction increased the potential supply of new
units that were vacant and available for occupancy, or were under construction,
to an estimated 780,000 in the first quarter of 1984, up 35 percent from
just two years earlier.
Single-family starts were at a 1.1 million unit annual rate in
April, or 10 percent below the advanced first-quarter average. New
house sales edged lower in March but for the quarter as a whole showed
a moderate gain. Despite some slowing in the last few months, the
recovery of housing activity since early 1982 has been impressive. Yet
price increases of new houses sold have remained quite small. On a
quality-adjusted basis, new house prices rose only 2 percent over the
year ended in the first quarter. However, the average price of new
houses (unadjusted) has gone up substantially, as rising incomes and,
until recently, lower mortgage rates have enabled households to upgrade
the quality of the homes that they purchase.

II-16
Government: Federal, State, and Local
Over the first half of fiscal year 1984 the federal budget deficit
totaled $118 billion (unified basis, not at an annual rate), $11 billion
less than for the same period a year earlier. Receipts were about $27
billion higher than last year, reflecting both the strength of economic
activity and the social security tax increase this January. Meanwhile,
total outlays increased about $16 billion. Smaller payments under
unemployment insurance and Commodity Credit Corporation programs relative
to a year ago held down growth in total outlays. Excluding these two
programs, outlays rose roughly $31 billion.
In April the administration issued the spring update of its fiscal
1985 budget. The revisions were small and reflected changes in economic
assumptions--mainly higher GNP and higher interest rates in the near
term--as well as some technical reestimates. There were no significant
changes in policy assumptions. In particular, the new estimates do not
take account of the compromise between Senate Republicans and the admini-
stration on a deficit reduction package. For FY1984 the deficit now is
estimated at $178 billion, or $6 billion less than shown in the February
budget. The deficit figure for FY1985 is essentially unchanged at $179
billion, and estimates for the outyears, FY1986 through FY1989, are
roughly $3 to $5 billion higher in each year.
Congress has made some progress on the FY1985 budget and deficit
reduction measures. In the House, a budget resolution with deficit
reduction measures totaling about $187 billion over the 1985-87 period
has passed. In addition, the House approved a tax reform bill and a

II-17
spending reconciliation bill that include the revenue raising measures
and entitlement cuts assumed in the budget resolution. The tax bill
increases receipts roughly $10 billion in 1985 and twice that amount in
subsequent years. The bulk of the spending reductions, however, will
need to be enacted in the appropriations process later this summer.
Meanwhile, the Senate passed a revenue measure similar to that in the
House and is expected to vote soon for spending reductions consistent
with the Senate leadership/administration bill shown on the following
table. The Senate then will take up the fiscal 1985 resolution that has
been reported by its budget committee.
After several years of little growth, real spending at state and
local governments advanced at a 3.2 percent annual rate in the first
quarter. Now that operating and capital budgets are in surplus overall,
many state and local governments are in a better position to turn their
attention to restoring and modernizing the infrastructure. Indeed,
almost all of the increased spending in the first quarter was made on
structures, particularly schools and sewer systems. In addition, although
austerity measures still are limiting employment growth in this sector,
a number of jurisdictions that imposed wage freezes in recent years seem
likely to resume pay increases this year.
Exports and Imports
An increasing portion of domestic demand was met by foreign suppliers
during the first quarter, and the U.S. merchandise trade deficit reached
a record level of $103 billion (annual rate). Spending on imported goods
jumped 12 percent (not at an annual rate). Most of the increase was in

II-18
RECENT DEFICIT REDUCTION PLANS(Unified basis, billions of dollars)
-----Fiscal year------1985 1986 1987
1. Receipts: CBO baseline 733 795 863Proposed increases:
Senate/administration 10 15 20House resolution 10 18 22
2. Defense outlays: Admin. budget 1 272 311 349Proposed cuts:
Senate/administration 6 16 19House resolution 16 35 45
3. Nondefense outlays: CBO baseline2 668 719 784Proposed cuts: 3
Senate/administration 10 20 33House resolution 6 11 21
4. Total reductionsSenate/administration 26 51 72House resolution 31 63 88
5. Baseline deficit4 207 235 270
6. Resulting deficits4
Senate/administration 181 184 198House resolution 175 172 182
Note: Details may not add to totals due to rounding.
1. As shown in the April update of the FY1985 budget.
2. February 1984 nondefense baseline revised up for interestoutlays to allow for faster growth of debt associated withinserting administration defense proposals.
3. Includes savings on debt service from lower deficit.
4. The baseline and resulting deficits are calculated from theCBO baseline receipts and nondefense outlay projections with theadministration's defense requests. The deficits published by theSenate Republicans differ from those shown above because they use abaseline with different technical and economic assumptions. Thedeficits published by the Senate are $169 billion, $150 billion, and$143 billion in FY1985, FY1986, and FY1987, respectively.

II-19
the volume of capital and consumer goods as well as industrial supplies,
and reflects the strength of demand in the United States as well as the
price competitiveness of imported goods. On average, prices of nonoil
imports rose 3-1/2 percent at an annual rate in the first quarter, the
same as in the fourth quarter, after two years of declining or being
flat. Merchandise exports picked up moderately as economic activity in
major trading-partner countries has strengthened somewhat since late
last year. Higher shipments to Canada and Western Europe accounted for
much of the increase. (A more complete discussion of international
economic developments is included in Part IV.)
Prices
There is currently no indication of a broad-based acceleration of
inflation at either the consumer or producer level. Although the rate of
inflation picked up somewhat in the first quarter, this was primarily the
result of a large temporary increase in food prices. Declining energy
prices offset part of the higher food costs, while the prices of other
goods and services rose at the same 5 percent pace as in the fourth
quarter of 1983. Moreover, price increases for producers' finished goods
and intermediate materials were negligible in April.
The consumer price index rose at a 5.0 percent annual rate in the
first quarter, up from a 4.0 percent increase in the fourth quarter of
1983. Approximately one-third of the overall increase in the CPI could
be attributed to higher food prices, which advanced at a 9.0 percent
annual rate. Much of the increase occurred early in the quarter, and by
March, a number of food prices had retreated. This reflected the reversal

II-20
RECENT CHANGES(Percentage change; based
IN CONSUMER PRICESon seasonally adjusted data) 1
RelativeImportance 1983 1984 1984Dec. 1983 1982 1983 Q3 Q4 Q1 Feb. Mar.
-Annual rate-- -Monthly rate--
All items2 100.0 3.9 3.8 4.5 4.0 5.0 .4 .2Food 18.7 3.1 2.6 1.1 4.3 9.0 .7 -.1
Energy 11.9 1.3 -.5 3.4 -1.7 -1.4 .2 -.2All items less food and
energy3 69.4 6.0 4.9 5.9 4.9 5.1 .3 .4Commodities 26.5 5.1 5.0 6.8 4.6 3.4 .2 .4Services 42.9 6.9 4.8 5.2 5.3 5.9 .4 .4
Memorandum:CPI-W4 100.0 3.9 3.3 4.7 2.6 2.3 .1 .0
1. Changes are from final month of preceding period to final month of period indicated.2. Official index for all urban consumers, based on a rental equivalence measure forowner-occupied housing after December 1982.3. Data not strictly comparable. Before 1983, they are based on unofficial seriesthat exclude the major components of homeownership; beginning in 1983, data include arental equivalence measure of homeowners costs.4. Index for urban wage earners and clerical workers.
RECENT CHANGES IN(Percentage change; based on
PRODUCER PRICESseasonally adjusted data) 1
RelativeImportance 1983 1984 1984Dec. 1983 1982 1983 Q3 Q4 Q1 Mar. Apr.
--Annual rate-- --Monthly rate--
Finished goods 100.0 3.7 .6 2.0 1.1 6.0 .5 .0Consumer foods 24.0 2.1 2.3 2.5 5.8 17.4 .8 -.6Consumer energy 12.0 -.1 -9.2 -1.3 -10.4 -7.2 -1.2 .7Other consumer goods 41.8 5.3 1.9 2.7 1.5 4.7 .9 -. 1Capital equipment 22.2 3.9 1.9 2.1 1.8 4.3 .3 .3
Intermediate materials2 94.8 .3 1.4 4.0 2.5 2.6 .5 .1Exc. energy 79.3 .6 3.0 3.6 4.1 3.5 .6 .1
Crude food materials 52.8 1.5 8.0 15.6 12.1 13.7 4.2 -1.2Crude energy 31.3 2.6 -4.6 -1.7 -2.3 -1.3 -.8 .4Other crude materials 15.9 -7.6 15.5 16.6 2.4 -9.2 .2 2.9
1. Changes are from final month of preceding period to final month of periodindicated.
Excludes materials for food manufacturing and animal feeds.

II-21
of earlier weather- and disease-related price increases. However, tight
meat supplies and low inventories of some key crops could put renewed
upward pressure on food prices in coming months.
Falling gasoline and natural gas prices contributed to another
decline in consumer energy costs in the first quarter. In contrast with
gasoline prices, fuel oil prices advanced rapidly in January and February
as the result of unusually cold weather; they subsequently fell back in
March. Gasoline prices have stabilized recently, and further declines
seem unlikely now that the summer driving season has begun.
At the producer level, prices for finished goods accelerated to a
6.0 percent annual rate in the first quarter, but then were unchanged in
April. A reversal of the sharp runup in food prices, especially fresh
vegetables, contributed to the favorable April report. Moreover, prices
for finished consumer items, apart from food and energy, were essentially
unchanged on balance, while increases for capital equipment continued to
be moderate. At an earlier stage of processing, prices of intermediate
materials (excluding food and energy) also were little changed on average
in April after a 0.6 percent rise in March. For some intermediate materials,
notably those produced by the pulp and paper industries, strong demand
and high capacity utilization rates boosted prices further. But prices
for a number of building supplies, such as softwood lumber and plywood,
have declined recently, possibly in an overreaction to an expected weakening
in residential construction activity.
Wages and Labor Costs
Wage inflation remained moderate during the first quarter of 1984,
as the general pattern of wage increases across occupations and bargaining

II-22
SELECTED MEASURES OF LABOR COSTS IN THE NONFARM BUSINESS SECTOR(Percentage change at annual rates; based on seasonally adjusted data)
19841983 to
1981 1982 1983 Q3 Q4 date
Hourly earnings index, wages of production workers1 First 4months
Total private nonfarm
ManufacturingContract constructionTransportation and
public utilitiesTradeServices
Employment cost index, wages
8.3 6.0 3.9
8.8 6.1 2.88.4 5.2 1.4
8.5 6.1 4.37.0 4.8 4.69.1 6.6 5.0
and salaries of all
2.3 4.5
1.8 3.5-1.2 1.2
.9 4.83.7 4.83.7 6.2
persons2
Total
By occupation:
White collar
Blue collarService workers
8.8 6.3 5.0
9.1 6.5 6.08.6 5.6 3.88.3 8.5 4.6
Major collective bargaining settlements 3
First-year wage adjustments 9.8
Total effective wage change 9.5
3.8 2.6
6.8 4.0
Labor costs and productivity, all persons
Compensation per hourOutput per hourUnit labor costs
9.0 7.2 4.81.2 .8 3.97.7 6.3 1.8
Employment cost index, compensation4
Compensation per hour 9.8 6.4 5.7
1. Changes are from final quarter of preceding period toperiod indicated. Quarterly changes at compound rates.2. Seasonally adjusted by the Board staff.3. Data are for contracts covering 1,000 or more workers.4. Not seasonally adjusted.
final quarter of
3.9
3.63.0
3.43.54.7
First 3months
5.5 5.0
7.7 4.92.6 4.32.3 11.4
4.2
3.14.95.2
3.0
3.8 4.32.3 2.71.5 1.6
6.12.63.4
6.1 4.9

II-23
status essentially mirrored that seen in 1983. A comprehensive measure
of wage change in private industry--the employment cost index (ECI)--rose
at a 4-1/4 percent annual rate in the first quarter; on a year-over-year
basis, this series has leveled off at a 5 percent rate for several
quarters. Among white-collar workers, year-over-year wage increases
have averaged 5-1/2 to 6 percent lately, while blue-collar wage increases
have been notably smaller at 4 percent reflecting the unprecedented
number of union workers accepting wage concessions over the life of
agreements negotiated in 1982 and 1983. Like the ECI, data from the
hourly earnings index for production and nonsupervisory workers have not
shown signs of accelerating wage increases over the first four months
of 1984.
Concession bargaining continued to occur in early 1984 but was far
less pervasive than in the past two years. Under major agreements,
roughly one-fifth of union workers negotiating new contracts during the
first quarter accepted initial wage cuts or freezes, compared with an
extraordinary figure of two-fifths of workers settling in 1982 and 1983.
Wage cuts so far this year were confined primarily to three industries--
construction, food stores, and airlines. Although concessions were less
widespread, so was the incidence of settlements in excess of 8 percent.
As a result of this reduced dispersion of new wage settlements, first-year
adjustments (excluding COLAs) averaged 3 percent in early
1984, only a bit more than last year.
Hourly compensation, which includes employers' contributions for
social insurance and fringe benefits as well as wages, rose at a 6.1

II-24
percent annual rate in the first quarter. About 1-1/2 percentage points
of the increase reflects legislated changes in both the taxable wage
base and tax rate for social security along with an extension of mandatory
coverage to nonprofit institutions, which became effective January 1.
Meanwhile, productivity in the nonfarm business sector advanced at a 2.6
percent annual rate, the same as the upward-revised increase for the
fourth quarter. These gains do not appear particularly impressive for a
period when output was expanding briskly, but they are consistent with
some improvement in the underlying trend rate of productivity growth
from the dismal performance of the late 1970s.

III-T-1
SELECTED FINANCIAL MARKET QUOTATIONS 1
(Percent)
1982 1983 1984 Change from:FOMC Spring FOMC FOMC FOMC FOMC
Highs Dec. 21 lows Jan. 30 Mar. 27 May 15 Jan. 30 Mar. 27Short-term rates
Federal funds 2
Treasury bills3-month6-month1-year
Commercial paper1-month3-month
15.61 8.69
14.5714.3613.55
7.908.018.11
15.73 8.4815.61 8.43
8.48 9.41 9.97 10.55p 1.14 .58
7.967.977.95
8.898.979.00
9.789.899.89
10.1110.4210.60
1.221.451.60
8.17 9.14 10.01 10.68 1.54 .678.13 9.13 10.05 10.94 1.81 .89
Large negotiable CDs 3
1-month3-month6-month
Eurodollar deposits2
1-month3-month
Bank prime rateTreasury bill futures
June 1984 contractDec. 1984 contract
15.9416.1416.18
8.598.628.78
16.36 9.4416.53 9.56
8.268.268.29
9.239.319.43
10.1810.3210.56
10.9511.4411.92
1.722.132.49
.771.121.36
8.68 9.53 10.45 11.28p 1.75 .838.71 9.70 10.68 11.88p 2.18 1.20
17.00 11.50 10.50 11.00 11.50 12.50 1.50 1.00
13.50 8.259.78 8.98
8.49 9.27 10.06 10.42 1.15 .368.89 9.85 10.64 11.60 1.75 .96
Intermediate- and long-term rates
U.S. Treasury (constant maturity)3-year 15.1610-year 14.9530-year 14.80
Municipal revenue(Bond Buyer index)
Corporate-A utilityRecently offered
Home ortgage ratesS&L fixed-rateFNMA ARM. 1-yr.
14.32 10.814 9.21 9.954 10.394 10.614 .66 .22
17.47 12.90e 11.64 12.90e 13.80e 14 .89e 1.99 1.09
17.6617.41
13.63511.135
12.55 13.29510.54 11.405
13.485 13.87512.105 12.705
.58 .391.30 .60
1982 1983 1984 Percent change from:FOMC FOMC 1983 FOMC
Lows Highs Jan. 30 Mar. 27 May 15 highs Jan. 30Stock prices
Dow-Jones Industrial 776.92 1287.20 1221.52 1154.31 1150.86 -10.6 -5.8NYSE Composite 58.80 99.63 94.12 90.55 90.90 -8.8 -3.4AMEX Composite 118.65 249.06 217.53 209.19 207.51 -16.7 -4.6NASDAQ (OTC) 159.14 328.91 269.23 249.10 249.00 -24.3 -7.5One-day quotes except as noted. 4. One-day quotes for preceding Thursday.
Averages for statement week closest to date shown. 5. One-day quotes for preceding Friday.3. Secondary market. e--estimated. p--preliminary.
9.8710.5410.53
9.3610.1210.27
10.8811.6611.74
11.8312.4612.50
12.7713.4813.50
1.891.821.76
.941.021.00

DOMESTIC FINANCIAL DEVELOPMENTS
The rapid expansion of domestic spending and the financing of mergers
have been reflected in continued strong growth of credit demands in recent
months. Debt of domestic nonfinancial sectors rose at a 12-1/4 percent
annual rate in the first quarter, above its monitoring range, and available
data suggest still faster growth in April. Business borrowing has been
heavy--in the commercial paper market, persistently, and at banks and in
bond markets, more irregularly. In the household sector, growth of consumer
installment credit has maintained the robust pace established last fall,
and home mortgage borrowing has yet to slow. Treasury financing operations
have been influenced of late by debt ceiling considerations, but federal
debt nevertheless has continued to soar. Only in the state and local
government sector has growth of debt been comparatively moderate.
These increasing credit demands have put pressure on interest rates,
contributing to rises of 70 to 135 basis points in market rates for private
short-term instruments and increases of about 100 basis points in long-term
rates on taxable securities. Banks have twice raised their prime rate since
the last FOMC meeting, moving it up 100 basis points to 12-1/2 percent. The
federal funds rate has fluctuated considerably but recently has averaged
about 50 basis points above the 10 percent average level in late March--
consistent with the increase in the discount rate from 8-1/2 to 9 percent and
adjustment plus seasonal borrowing averaging in the vicinity of $1 billion.
Yields on Treasury bills have increased considerably less than other
rates but some of the divergence in the behavior of public and private rates
is probably only temporary. Relative supplies have been affected by a reduc-
tion in the size of the Treasury's weekly bill auctions and the recent flood
III-1

III-2
of new commercial paper. In addition, financial uncertainty was heightened
for a time by the failure of Lion Capital, a securities firm, and by rumors
of a major bank failure.
The expansion of credit is reflected in the relatively rapid growth of
M3 at an average 10 percent rate in March and April, which has pushed this
aggregate about 1/2 percentage point above its 1984 range. On the other
hand, the narrower aggregates, M1 and M2, are in the lower halves of their
ranges as the growth of core deposits has been slower than that of loans.
Monetary Aggregates and Bank Credit
Ml was flat in April after growing at about a 7 percent annual rate
in the first quarter. The sluggishness last month probably overstates any
underlying weakness in narrow money. Because of deposit churning around the
mid-April tax date, seasonal factors affecting April and May growth rates
have proved especially difficult to identify and have been revised substan-
tially in recent years. 1 Moreover, growth of M1 may have been depressed by
the increasing use by households of drafts drawn on MMDAs and MMMFs for tax
payments. The weakness in M1 in April was concentrated in its other check-
able deposits component, while balances in MMDAs and broker/dealer MMMFs
rose rapidly in the weeks preceding the tax date and declined afterward. 2
Perhaps confirming these suspicions about seasonal influences--which are
1. The current seasonal factors are estimated by the X-11 ARIMA techniqueusing data through the end of 1983. An M1 growth estimate based on seasonalfactors derived by the same method, but using data through April 1984, wouldbe nearly 4 percent, and the estimated growth for April of experimental M1,which uses a model-based seasonal adjustment procedure with data through1983, is 2 percent.2. The processing of tax returns by the Treasury does not appear to havecontributed significantly to the weakness in M1 in April. Tax refunds,which tend to boost M1, were down only slightly from previous years, whilenonwithheld tax payments, which also tend to boost M1 as balances are builtup to cover checks to the IRS, were essentially unchanged from previous years.

III-3
MONETARY AGGREGATES(Based on seasonally adjusted data unless otherwise noted)1
Growth from1983 1984 Q4 1983 to
Q2 Q3 Q4 Q1 Mar. Apr. Apr. 1984
----- Percentage change at annual rates ---
1. M1 11.6 9.5 4.8 7.2 5.0 0.0 5.42. (M1)
2 (12.7) (7.9) (4.6) (8.0) (8.1) (2.0) (7.0)
3. M2 10.6 6.9 8.5 6.8 3.6 7.3 6.64. M3 9.3 7.4 9.9 8.9 9.0 10.7 9.5
Levels in billionsof dollars
Mar. 1984Selected components
5. Currency 10.2 9.1 9.7 8.7 5.6 7.2 151.8
6. Demand deposits 4.2 4.0 -0.5 1.2 1.0 5.9 245.2
7. Other checkable deposits 28.5 21.2 9.6 16.2 13.5 -19.5 133.1
8. M2 minus M13
10.2 6.1 9.6 6.7 3.2 9.6 1707.1
9. Overnight RPs and Eurodollars, NSA4
48.0 -8.1 23.4 13.5 -38.8 -14.8 56.210. General purpose and broker/dealer money
market mutual fund shares, NSA -44.4 -13.1 -1.2 9.8 22.8 10.8 146.111. Commercial banks 18.4 12.2 12.4 5.4 6.2 7.8 729.612. Savings deposits, SA, plus
MMDAs, NSA5
62.8 11.0 5.9 6.5 10.1 7.4 373.813. Small time deposits -21.2 13.7 19.3 4.4 2.4 7.8 355.814. Thrift institutions 11.9 7.3 7.3 6.5 6.5 7.1 781.215. Savings deposits, SA, plus
MMDAs, NSA5
53.8 1.0 -7.0 -0.6 9.3 4.8 328.016. Small time deposits -17.0 12.3 18.8 11.8 4.8 9.1 453.3
17. M3 minus M26 3.8 9.8 16.3 18.1 31.7 25.0 548.2
18. Large time deposits -0.3 11.9 15.5 24.4 27.9 25.9 355.319. At comercial banks, net
7 -14.6 -4.6 -0.4 9.8 23.7 18.6 236.3
20. At thrift institutions 51.2 63.5 57.6 58.2 36.5 40.7 119.021. Institution-only money market
mutual fund shares, NSA -41.7 -17.8 16.6 10.9 5.8 0.0 41.822. Term RPs, NSA 40.4 15.2 50.0 16.9 30.9 58.2 58.423. Term Eurodollars, NSA 28.9 -1.7 -1.3 10.5 51.8 5.0 97.1
- Average monthly change in billions of dollars --
MEMORANDA:24. Managed liabilities at commercial
banks (25+26) 0.0 -2.8 5.2 4.7 9.8 6.4 403.825. Large time deposits, gross -4.0 -2.0 0.1 2.0 5.3 3.2 292.226. Nondeposit funds 4.0 -0.8 5.1 2.7 4.5 3.2 111.627. Net due to related foreign
institutions, NSA 2.4 1.2 2.9 2.1 4.8 3.1 -33.428. Other8 1.6 -2.0 2.1 0.7 -0.3 0.1 145.0
29. U.S. government deposits at commercialbanks 9 0.3 1.0 -1.2 1.2 -3.9 -0.8 15.9
1. Quarterly growth rates are computed on a quarterly average basis. Dollar amounts shown under memoranda for quar-terly changes are calculated on an end-month-of-quarter basis.2. M1 seasonally adjusted using an experimental model-based procedure applied to weekly data.3. Nontransactions M2 is seasonally adjusted as a whole.4. Overnight and continuing contract RPs issued to the nonbank public by commercial banks plus overnight Eurodollardeposits issued by branches of U.S. banks to U.S. nonbank customers, both net of amounts held by money market mutualfunds. Excludes retail RPs, which are in the mall time deposit component.5. Growth rates are for savings deposits, seasonally adjusted, plus money market deposit accounts (MMDAs), not seasonallyadjusted. Commercial bank savings deposits excluding MMDAs declined during February, March, and April at rates of 18.2,11.1, and 2.8 percent respectively. At thrift institutions, savings deposits excluding MMDAs declined during February ata rate of 8.8 percent, and increased in March and April at rates of 0.7 and 0.7 percent respectively.6. The non-M2 component of M3 is seasonally adjusted as a whole.7. Net of large-denomination time deposits held by money market mutual funds and thrift institutions.8. Consists of borrowings from other than commercial banks in the form of federal funds purchased, securities soldunder agreements to repurchase and other liabilities for borrowed money (including borrowings from the FederalReserve and unaffiliated foreign banks), loans sold to affiliates, loan RPs and other minor items. Data are partiallyestimated.9. Consists of Treasury demand deposits at commercial banks and Treasury note balances.

III-4
widely shared by private analysts-M1 turned upward in late April and early
May.
The broader monetary aggregates strengthened somewhat in April, but
their growth, especially that of M2, may also be understated. M2 advanced
at a 7-1/4 percent clip last month, up 1/2 percentage point from its first-
quarter growth rate. Two seasonal adjustment problems may have appreciably
reduced M2 growth in April. First, the reporting of RPs over two April
holiday weekends as term, rather than as overnight, obligations probably is
responsible for a significant part of the April increase in term RPs, and
for the decline in overnight RPs. Second, growth of IRA and Keogh accounts
at depository institutions and MMMFs, which are excluded from the monetary
aggregates, totaled more than $6 billion last month. April is by far the
most important month for these flows, and total flows have increased rapidly
over the past three years, making it unlikely that standard adjustments
capture the full seasonal effects.
Inflows of small time deposits at both banks and thrifts strengthened
somewhat in April despite an apparent stickiness in rates on such accounts.
Over the past several months, the rise in yields on Treasury securities and
other market instruments has outstripped those posted by depository institu-
tions on MMDAs and other deposit accounts. By late April, differentials
between Treasury yields and offering rates at commercial banks reached 50
basis points for 3- to 6-month maturities and about 100 basis points for
2- to 4-year maturities. Data for thrift institutions suggest that they
have responded even less aggressively than commercial banks to the increases
in market rates, though their rates remain higher than those at banks.

III-5
M3 expanded at a 10-3/4 percent pace in April, somewhat faster than
in earlier months. The seasonal pattern of IRA contributions may also have
cut into M3 growth but to a smaller degree than for M2. Both thrift institu-
tions and commercial banks continued to rely heavily on managed liabilities,
using large CDs to fund rapid loan growth. In addition to liabilities
counted in M3, banks again tapped their foreign offices as a source of funds
in April; over the first four months of the year such borrowings totaled
more than $9 billion, accounting for about 40 percent of the increase in
managed liabilities.
Growth in commercial bank credit eased in April after five months of
swift expansion. Banks ran off securities holdings at a faster pace than
in the two previous months, while business loan growth at domestic banking
offices abated as banks booked a sizable volume of loans offshore, and
firms shifted more of their borrowing to the commercial paper market.
Consumer and real estate lending, however, continued to expand vigorously.
Business Finance
The pattern of corporate financing so far in the second quarter
generally extends the trends evident in the first quarter. The financing
gap of nonfinancial corporations is continuing to widen as gross capital
expenditures increase more rapidly than the flow of internal funds. The
resultant external financing needs of these firms are being met through
debt issuance; the sale of new equity shares has been sluggish since early
in the year when stock prices slumped, and a large volume of stock has been
retired in mergers that have been financed by borrowing.
With hopes for declining interest rates beginning to fade this winter
and credit needs rising, corporations became more willing to sell bonds, and

III-6
COMMERCIAL BANK CREDIT AND SHORT- AND INTERMEDIATE-TERM BUSINESS CREDIT(Percentage changes at annual rates, based on seasonally adjusted data)
1
Levels in1983 1984 bil. of dollars
Q3 Q1 Feb. Mar. AprilP April 1984p
--- - Commercial Bank Credit-----------
1. Total loans and securitiesat banks
3
2. Securities
3. Treasury securities
4. Other securities
5. Total loans3
6. Business loans3
7. Security loans
8. Real estate loans
9. Consumer loans
10. Business loans net of bankersacceptances
8.6 12.8 14.1 15.9 13.3 5.6
6.3 10.8 4.6 -0.5 -0.3 -8.2
13.6 25.1 -1.9 -2.5 -7.6 -6.4
1.5 0.6 9.5 1.4 4.7 -9.4
9.5 13.5 17.6 22.1 18.4 10.4
7.6 9.4 18.9 15.2 29.2 7.5
25.1 60.8 -1.5 144.0 -140.3 -17.6
11.6 11.4 13.4 12.4 12.9 15.6
15.8 23.1 21.5 17.1 19.5 19.7
Short- and Intermediate-Term Business
7.4 9.7 18.1 14.7 27.3 7.1
1634.6
437.3
186.1
251.2
1197.3
438.4
26.8
351.2
235.3
Credit --- --
428.8
11. Commercial paper issued by non-financial firms
4 -2.7 25.9 20.1 30.7 49.9 91.0 53.9
12. Sum of lines 10 & 11 6.4 11.3 18.3 16.5 29.3 15.6 482.7
13. Line 12 plus loans at foreignbranches
5 6.1 11.5 18.1 15.6 28.4 16.5 502.0
14. Finance company loans to business6
17.8 29.0 n.a. 27.5 n.a. n.a. o.a.
15. Total bankers acceptances outstanding6
20.5 18.9 -22.2 -24.1 0.0 n.a. n.a.
16. Total short- and intermediate-term business credit (sum oflines 13, 14 and 15) 9.3 14.8 n.a. 12.9 n.a. n.a. n.a.
p--preliminaryn.a.--not available.1. Average of Wednesdays for domestically chartered banks and average of current and preceding ends of months forforeign-related institutions.2. Growth rates beginning 1984 have been estimated after adjusting for major changes in reporting panels anddefinitions that caused breaks in series at the beginning of January. Data should be regarded as highlypreliminary.3. Loans include outstanding amounts of loans reported as sold outright to a bank's own foreign branches, uncon-solidated nonbank affiliates of the bank, the bank's holding company (if not a bank), and unconsolidated nonbanksubsidiaries of the holding company.4. Average of Wednesdays.5. Loans at foreign branches are loans made to U.S. firms by foreign branches of domestically chartered banks.6. Based on average of current and preceding ends of month.

III-7
total volume in the domestic and Euromarkets strengthened from the weak
pace in late 1983. New public bond issues by nonfinancial corporations
totaled $2.5 and $3.0 billion in March and April, respectively, the largest
monthly totals since last May. About a fourth of this volume was merger-
related. New issue bond volume dried up in the first half of May, however,
as interest rates climbed further.
On the whole, firms have not been enthusiastic about taking on large
quantities of long-term, fixed-rate debt at recent yield levels. Average
maturities of bonds have shortened and nonfinancial corporations have
turned increasingly to loans and short-term market paper for the bulk of
their financing needs. Commercial paper issuance has accelerated sharply
in recent months, with the net $3.8 billion raised in April the largest
monthly increase on record. In the last three months, the sum of business
loans at commercial banks and commercial paper outstanding grew at an aver-
age annual rate of 20 percent. About a third of that growth was related
to merger financing, but borrowing was large even after adjustment for
this influence.
As interest rates have increased, the spreads between rates on
corporate and Treasury bonds have widened somewhat: the Board's A-rated
utility index is now more than 130 basis points above the yield on 30-year
Treasury bonds, compared with a low of about 100 basis points three months
ago. This partly reflects the impact of differences in call protection,
rather than concerns about quality. Indeed, quality spreads among private
issues have not widened appreciably except for a few borrowers with serious
problems, such as utilities experiencing trouble with nuclear power plant
construction. Risk premiums on securities of utilities with nuclear plants

III-8
GROSS OFFERINGS OF SECURITIES BY U.S. CORPORATIONS(Monthly totals or monthly averages, billions of dollars)
1983Year Q3 Q4
1984Q1P Mar.P Apr.P Mayr
------------- Seasonally adjusted ---------------
Corporate securities--total
Securities sold in U.S.Publicly offered bonds1
Privately placed bondsStocks2
Securities sold abroad3
10.54 9.14 9.12
9.843.941.5 5e4.35
8.512.651.76 e
4.10
.63
8.543.501.50e
3.54
.58
9.74 8.35 9.05 7.10
8.304.801.50e
6.603.301.50e
7.304.301.50e
6.303.101.50e
2.00 1.80 1.50 1.70
1.44 1.75 1.75
--- Domestic offerings, not seasonally adjusted ---
Publicly offered bonds--total1By industry
UtilityIndustrialFinancial
By quality 4
Aaa and AaA and BaaLess than BaaNo rating (or unknown)
Memo items:Equity based bonds5
Mortgage-backed bonds
Stocks-total2
By industryUtilityIndustrialFinancial
3.94 2.65 3.43
.961.131.85
1.131.57.48.34
.87
.531.25
.701.11.19.30
.60
.382.45
1.95.96.39.26
.75 .60 .32
.38 .31 .87
4.30 3.67 3.84
.802.271.23
.482.141.05
.811.731.30
p--preliminary. f--staff forecast. e--estimate.1. Total reflects gross proceeds rather than par value
4.75 3.40 4.20 3.00
.65
.853.25
.931.57.61.34
.90
.352.15
.761.53.57.27
.551.801.85
1.291.251.23.05
.28 .17 .761.24 .10 .27
2.10 1.80 1.30 2.00
.25 .30 .30
.95 1.00 .70
.90 .50 .30
of original discount bonds.2. Includes equity issues associated with debt/equity swaps.3. Notes and bonds, not seasonally adjusted.4. Bonds categorized according to Moody's bond ratings. Excludes mortgage-backedbonds.5. Includes bonds convertible into equity and bonds with warrants attached wherethe warrants entitle the holder to purchase equity in the future.
____ ___

III-9
about to begin operations or with what investors perceive to be well-managed
construction programs have not grown noticeably.
Government Finance
Federal sector. The staff is projecting a combined deficit of
$27-1/2 billion in what used to be the Treasury's surplus quarter. To fi-
nance this shortage and to increase its cash balance, the Treasury plans
to raise $37 billion, net. That would, however, push the debt over its
current statutory limit. Starting in late April, with its debt approaching
the ceiling and with its cash balance skyrocketting to record levels, the
Treasury slashed the size of its regular bill auctions. The cash reserves
have since declined sharply and would run out entirely by late May or early
June without legislation to raise the debt limit.
Because of the bill paydowns, the Treasury has been able to maintain
its normal pattern of coupon offerings, including a $16-1/2 billion mid-
quarter refunding in the second week of May. Although such auction statis-
tics in the aggregate, as the volume of bids, the proportion of dealer
awards, and subsequent dealer positions appear unexceptional, the refunding
cannot be said to have gone well. Dealer awards of the long-term bond were
unusually high, and market prices--especially for long issues--plunged in
initial when-issued trading as retail demand reportedly was not forthcoming.
Rumors of large positions being dumped prevaded an unsettled market last
Friday; data indicate that although a third of the dealers' awards remained
unsold at the end of the day, their positions were well-hedged.
Net cash borrowing of federally sponsored credit agencies edged up
to $5-1/2 billion in the first quarter. FNMA issued about $3-1/2 billion
of new debt to finance mortgage purchases for its portfolio, including a

III-10
TREASURY AND AGENCY FINANCING1
(Total for period; billions of dollars)
1984Q1 02e Mar. Apr.P Maye
Treasury financing
Combined surplus/deficit(-)
Means of financing deficit:
Net cash borrowing
from the public
Marketable borrowings/
repayments(-)Bills
CouponsNonmarketable
Decrease in the cash
balance
Memo: Cash balanceat end of period
Other 2
-56.6 -27.5 -30.2
49.3 37.1 7.5
47.66.5
41.11.7
35.7-1.236.7
1.8
6.6.8
5.8.9
8.7 -32.6
17.2
16.4-3.419.8.8
-2.3 -2.6 9.7 -24.1
14.1 16.7 14.1
9.6 -7.0 13.0
38.2
-1.8
10.4
9.9-. 4
10.6.5
28.2
10.0
-6.0
Federally sponsored creditagencies, net cash borrowing3
-1.1FHLB
FNMA
4.9 3.3
1.2 -.4
1.7 2.1
.5 2.2
Farm Credit Banks
FHLMC
SLMA
1.8
.8 .3 -. 1
.7 1.1 .0
.5 .5 .2
p--preliminary. e--estimate.1. Data reported on a not seasonally adjusted, payment basis.2. Includes checks issued less checks paid, accrued items and othertransactions.3. Excludes mortgage pass-through securities issued by FNMA and FHLMC.

III-11
substantial amount of adjustable-rate loans. Financing activity by the
agencies is estimated to have tailed off in April, but is projected to run
at about $5 billion over the second quarter as a whole.
State and local sector. Activity in the tax-exempt bond market has
remained relatively light so far this year. In April, gross offerings of
these bonds totaled $3.9 billion on a seasonally adjusted basis, somewhat
below the first-quarter average. April is typically a busy month because
many states have winter legislative sessions which often result in new
issues coming to market in early spring. While many large G.O. bonds have
been offered recently, tax-exempt issuance for private purposes continues
to be minimal while Congress ponders legislative restraints. At present,
both the House and the Senate have passed bills that would tighten restric-
tions on the issuance of industrial revenue bonds and would extend authority
to issue single-family mortgage revenue bonds. A compromise package is
expected later this month or next.
In recent weeks, interest rates on municipal securities have risen
much less than rates on taxable securities. Market sources attribute the
comparatively favorable performance of municipals to their relatively short
supply, and suggest that rates could experience upward pressures if and
when an increased supply of private-purpose issues comes to market--although
the market presumably is discounting this to a degree.
Mortgage Markets
Interest rates have risen in both primary and secondary mortgage
markets during the intermeeting period, but by less than in other long-term
securities markets. On fixed-rate conventional home mortgages at S&Ls,
average interest rates on new commitments moved up only 39 basis points to

III-12
GROSS OFFERINGS OF SECURITIES BY STATE AND LOCAL GOVERNMENTS(Monthly totals or monthly averages; billions of dollars)
1982 1983 1984Year Year Q3 Q4 Q1e Aprile Mayr
---------------- Seasonally adjusted ---------------
Total 10.29 10.28 9.33 10.52 8.78 7.10 8.20Long-term 6.58 7.09 6.01 6.77 5.62 3.90 5.40Short-term1 3.71 3.19 3.32 3.75 3.16 3.20 2.80
---------------- Not seasonally adjusted -------------
Total 10.29 10.28 8.89 10.11 7.27 11.26 7.70Long-term 6.58 7.09 5.57 7.11 4.77 4.76 5.50
Refundings .36 1.16 .91 .79 .68 .77Total housing2 1.24 1.45 1.62 1.79 .38 .15
Short-term1 3.71 3.19 3.32 3.00 2.50 6.50 2.20
e--estimate. f--staff forecast.1. These figures do not include tax-exempt commercial paper.2. Primarily mortgage revenue bonds for home ownership and multifamily rentalstructures.
RATIO OF TAX-EXEMPT TO TAXABLE BOND YIELDS*
1.1
1.0
.9
.8
.7
*Bond Buyer 30-year Revenue Bond Index to 30-year Treasury bond yields.

III-13
13.87 percent as of May 11. At large mortgage companies, the most common
contract rate on level-payment FHA-insured loans has risen by 50 basis
points since the last FOMC meeting to 13-1/2 percent, while the effective
yield has increased 75 basis points. As price discounts on GNMA guaran-
teed pass-through securities issued against pools of FHA/VA loans climbed
to nearly 6 points, the Veterans Administration raised its ceiling rate
1/2 percentage point to 13.5 percent, effective May 8. With the subsequent
movements in market yields, discounts most recently have reached 5 points,
even at the 13.5 percent rate.
The yield differential between current-coupon GNMAs and ten-year
Treasury securities is now less than half what it was last August, dropping
to 74 basis points in April-the narrowest spread since late 1978 (see chart
on page III-14). The recent decline can be largely attributed to the use
of GNMAs as backing for collateralized mortgage obligations (CMOs). The
demand for GNMAs increased as securities firms issued a flood of CMOs from
September through February. Moreover, supplies of new GNMAs have been
restrained by the growing popularity of mortgages with adjustable-rate fea-
tures. Because the spreads have shrunk, securities firms can now earn only
a small return from issuing CMOs, and new offerings dropped off markedly
in March and April.
In the secondary market for adjustable-rate mortgages (ARMs), required
yields posted by FNMA under its standard purchase programs have advanced in
line with the rise in yields on Treasury securities. However, FNMA does
allow initial-rate discounting by lenders and recoups this interest short-

III-14
YIELD SPREAD: GNMA LESS TREASURY YIELDS*
Basis points- 300
240
180
120
60
0
*Yields on GNMAs adjusted to a semi-annual coupon basis.
ADJUSTABLE-RATE HOME MORTGAGES HELD BY MAJOR INSTITUTIONS(Billions of dollars)
National FSLIC-insuredEnd of Month banks thrifts FNMA FBLMC
December, 1982 $ 7.0 $43.0 $3.3 $0.1
December, 1983 11.0 68.3 7.1 0.4
March, 1984 n.a. n.a. 8.9 0.7
n.a.--not available.

III-15
fall by paying less than par for the loans. 1 In the primary market, the
FHLBB reported that the proportion of conventional loans closed in early
April with adjustable-rate features was 60 percent at major lenders,
essentially unchanged from the record share reported in March. The average
contract rate on ARM loans closed dropped 19 basis points to 11.11 percent,
reflecting the importance of loans with "teaser" rates and the use of buy-
downs.2
The interest rate sensitivity of the home mortgage portfolio at
financial institutions, while still low, has increased substantially at
some firms. By the end of 1983, adjustable-rate loans already accounted
for 16 percent of all home mortgages held by FSLIC-insured thrifts, and
11 percent of the home mortgage portfolio at national banks--both up con-
siderably from a year earlier.3 FNMA has also added ARMs to its portfolio
so as to reduce its interest-rate risk; at the end of March, 12 percent of
the home mortgages held by Fannie Mae were ARMs. FHLMC, under direction
from the FHLBB to encourage thrifts to originate more ARMs, also has
actively acquired this mortgage instrument, which accounted for 7 percent
of its portfolio by the end of the first quarter.
New mortgage commitments at federally insured S&Ls dipped in March
from their record volume of a month earlier, but remained high. The back-
1. FNMA announced that it will soon revise its ARM purchase programs to
provide a wider range of consumer protections. One expected feature is the
requirement that initial-period rate discounts not exceed 250 basis pointsbelow the program rate on any type of ARM.2. In comparison, the average contract rate on fixed-rate conventional
loans rose 9 basis points.3. These figures are for all ARMs including some older variable-ratemortgages with, typically, less interest rate flexibility. When mortgage-
backed securities are added to the home mortgage portfolio, the portionwith adjustable rates declines to 13 percent at thrifts.

III-16
MORTGAGE ACTIVITY AT FEDERALLY INSURED SAVINGS AND LOAN ASSOCIATIONS 1
(Billions of dollars, seasonally adjusted)
Net change in mortgage assetsMortgage commitments Mortgage Mortgage-backed
New Outstanding2 Total loans securities(1) (2) (3) (4) (5)
1983-Jan. 10.5 31.9 2.2 0.2 2.0Feb. 11.8 34.7 5.5 2.4 3.2Mar. 12.3 37.4 5.2 1.4 3.9Apr. 11.9 39.9 4.0 2.7 1.2May 12.9 42.3 4.0 2.1 1.9June 14.6 44.4 6.7 3.8 3.0July 16.2 46.6 8.2 5.5 2.7Aug. 15.3 48.5 8.8 5.6 3.2Sept. 15.8 49.8 8.0 5.5 2.5Oct. 14.0 51.0 6.4 3.7 2.7Nov. 15.2 53.8 6.5 5.6 1.0Dec. 15.0 56.5 6.0 5.7 0.3
1984-Jan. 17.2 58.0 5.8 4.9 0.9Feb. 18.1 60.4 6.1 6.0 0.1Mar. 16.8 62.7 10.0 5.9 4.1
1. Insured S&Ls account for approximately 98 percent of the assets of alloperating S&Ls. Net changes in mortgage assets reflectaccount for conversions of S&Ls to savings banks.2. End of month. Includes loans in process.
adjustments to
NEW ISSUES OF FEDERALLY GUARANTEED MORTGAGE PASS-THROUGH SECURITIES(Monthly averages, millions of dollars, n.s.a.)
All Memo: FNMA andPeriod issues GNMAs FHLMCs FNMAs FHLMC swap issues
1982-Q3 4772 1305 2249 1218 3149Q4 6653 1779 2727 2147 3795
1983-Q1 7122 3841 1955 1326 2204Q2 7368 4753 1392 1223 1880Q3 7619 4835 1544 1240 2115Q4 5733 3403 1673 657 1954
1984-Q1 4893 2745 887 1261 1744
1984 Mar. 5764 2488 871 2405 2937Apr. 3243 1981 760 502 921

III-17
log of mortgage commitments outstanding continued to advance, reaching a
new high of nearly $63 billion by month-end. Mortgage assets increased a
record $10 billion. S&Ls acquired both loans and mortgage-backed securi-
ties at a rapid pace, including a large volume of FNMA securities obtained
in swaps.
In the first quarter, stiff competition from conventional adjustable-
rate mortgages reduced the number of fixed-rate conventional, FHA, and VA
loans being originated, so the flow of new issues of GNMA and FHLMC pass-
throughs slowed.1 FNMA's new issue volume was high in March, reaching
$2.4 billion, owing to large amounts of swaps with S&Ls, including some
seasoned adjustable-rate mortgages. 2 In April, new offerings for all
three agencies were down.
Consumer Credit
Consumer installment credit expanded at a 17-1/2 percent annual
rate in March following an unusually strong 20 percent rate of increase in
February. In view of the March decline in retail sales, the magnitude of
the credit expansion is impressive. Some arithmetic considerations suggest
a partial explanation. Sales in March, though lower than in February, were
high relative to sales in 1982 and 1983 (when consumers also were less will-
ing to borrow for purchases); with credit extensions more closely tied to
current sales, and repayments more closely linked to past sales, outstandings
have risen rapidly.
1. GNMA securities represent shares in pools of FHA/VA loans, all of whichare fixed rate. HUD regulations for FHA-insured ARMs are currently underreview by the Administration and may not become effective until the latterhalf of the summer.2. FNMA is the only federally related agency to have issued adjustable-ratemortgage pass-through securities, having done so through swaps with fourseparate S&Ls.

III-18
CONSUMER INSTALLMENT CREDIT
1983 1984 19841982 1983 Q4 Q1 Feb. Mar.
---- Percent rate of growth, SAAR ----
Change in outstandings--totalBy type:Automobile creditRevolving creditAll other1
4.3 11.4 16.8 17.4
3.5 9.38.4 15.53.3 11.4
12.924.516.8
14.825.116.3
20.2 17.6
23.320.117.5
2.746.017.6
---- Billions of
Change in outstandings--totalBy type:Automobile creditRevolving creditAll other1
By major holder:Commercial banksFinance companiesAll other
dollars, SAAR ----
14.2 39.8 62.8 67.8 79.3
4.4 12.15.1 10.14.8 17.6
3.8 19.54.7 4.15.7 16.2
----- Annual percentage rate-----
Interest ratesAt commercial banks 2
New cars, 48 mos. 3
Personal, 24 mos.Credit cards
At auto finance companies4
New carsUsed cars
16.8318.6518.51
13.9216.6818.78
13.4616.3918.75
13.3216.1618.73
16.15 12.58 13.65 14.1120.75 18.74 18.12 17.55
13.3216.1618.73
n.a.n.a.n.a.
1. Includes primarily personal cash loans, home improvement loans, and salesfinance contracts for non-automotive consumer durable goods.2. Average of "most common" rates charged, on loans of specified type andmaturity, during the first week in the middle month of each quarter.3. Data for 1982 are for new-car loans at a 36-month maturity.4. Average rate for all loans of each type made during the period, regard-less of maturity.n.a.--not available.
17.817.427.6
38.11.1
23.6
20.919.027.9
41.5-0.026.3
70.4
3.935.531.0
41.1-2.331.7
33.615.330.4
59.03.1
17.2
14.11 14.0517.59 17.52

III-19
The strength in consumer credit during the first quarter was
distributed across all credit categories, with commercial banks again the
dominant supplier. 1 In March, credit card debt at banks jumped while--in
what likely is an erratic movement--auto loan growth slowed to a crawl.
Margins between rates charged for automobile credit and the cost of funds
to lenders have narrowed recently, but until March, heavy demand for car
loans and the opportunity to recover market share from the auto finance
companies drew a large volume of bank funds into this market. The growing
use of adjustable-rate loans in the auto market also may have enhanced the
willingness of banks to accept narrower initial gross margins on auto loans.
Two thirds of the banks in a recent informal polling had adjustable-rate
consumer loan programs in place. Typically 20 to 30 percent of new loans
at these institutions carry variable rates, which are adjusted monthly and
most often are tied to the prime or a CD rate.
On balance, despite strong business credit demands, commercial banks
apparently have continued to be quite willing to make consumer loans. In
April, consumer loans at banks were again up sharply, and one fourth of
the respondents to the April 24 Senior Loan Officer Opinion Survey, the
same proportion as in February, reported increased willingness to make
installment loans to individuals. None of the respondents said they were
less willing to make consumer loans, and large proportions of them had
already reported increased willingness in the August and November surveys.
Nearly 60 percent of the survey respondents also reported raising interest
1. Savings and loans and mutual savings banks have achieved higher ratesof growth than commercial banks in recent months, but are much smallerfactors in consumer credit markets. Together, their holdings add up to
one sixth the amount that commercial banks hold.

III-20
rate quotations on fixed-rate consumer loans since February; the weighted
average increase was 40 basis points.

INTERNATIONAL DEVELOPMENTS
Foreign Exchange Markets
Since the last FOMC meeting, the dollar has risen by about 4-1/4
percent on a trade-weighted basis, as shown in the upper panel of the
chart. It now stands only 2 percent below its mid-January peak. This
gain in part reflects troubles that have afflicted the mark, but signs of
continuing strength in U.S. economic activity and associated further
increases in dollar interest rates also have provided support for the
dollar along a broader front. On a bilateral basis, the dollar has
appreciated 5-1/4 percent against the mark and almost as much against the
other EMS currencies. But the dollar also has advanced about 3 percent
on average against the non-EMS currencies. In addition, the dollar price
of gold has dropped 3 percent.
Early in the intermeeting period, the dollar's value fluctuated
amid continuing market uncertainty about U.S. monetary policy. After the
Federal Reserve discount rate was raised, the dollar firmed.
Over the next several weeks, the dollar appreciated sharply against
the continental European currencies while its value against the yen and
the Canadian dollar remained little changed on balance. On April 17,
negotiations between management and the German metalworkers union broke
down in disagreement over the union's demand to shorten the work-week
from 40 hours to 35 hours without a cut in pay. The mark steadily
weakened as the union moved toward strike action which has so far proved
limited but has been viewed in the market as a potential threat to German
recovery. Disappointing reports on economic activity in Germany and on
Germany's balance of payments also were negative factors for the mark.
IV-1

IV-2
AVERAGE EXCHANGE VALUE OF THE U.S. DOLLARseries
FOMCMarch 27
February March Ap
Strictly Confidential (FR)Class II - FOMC
U.S. DOLLAR March 1973 = 100S138
136
S134
S132
-130
S128
126
IlltIIIIIIll IIIIll lI llllllllllllllI 124>ril May
Percent per annum12
11
U.S. CD's
10
Weighted Average -Foreign Rate
IIIIIIIlliiill l liiiiiin iIll i 8March AprilFebruary
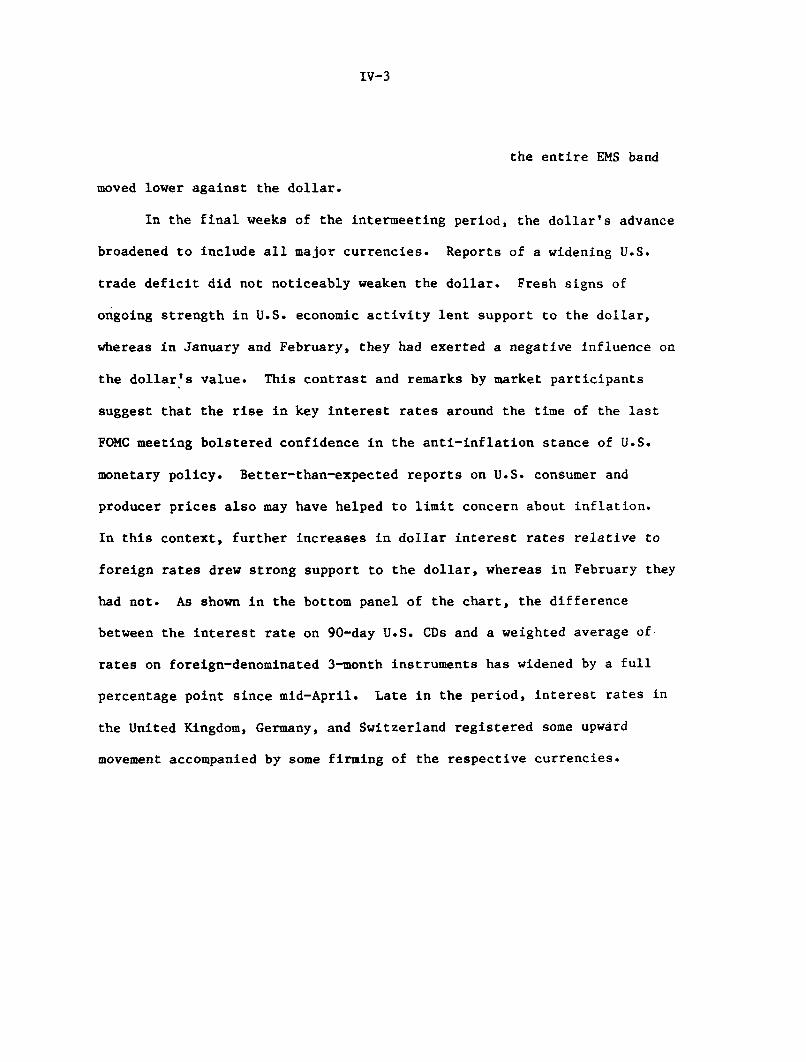
IV-3
the entire EMS band
moved lower against the dollar.
In the final weeks of the intermeeting period, the dollar's advance
broadened to include all major currencies. Reports of a widening U.S.
trade deficit did not noticeably weaken the dollar. Fresh signs of
ongoing strength in U.S. economic activity lent support to the dollar,
whereas in January and February, they had exerted a negative influence on
the dollar's value. This contrast and remarks by market participants
suggest that the rise in key interest rates around the time of the last
FOMC meeting bolstered confidence in the anti-inflation stance of U.S.
monetary policy. Better-than-expected reports on U.S. consumer and
producer prices also may have helped to limit concern about inflation.
In this context, further increases in dollar interest rates relative to
foreign rates drew strong support to the dollar, whereas in February they
had not. As shown in the bottom panel of the chart, the difference
between the interest rate on 90-day U.S. CDs and a weighted average of
rates on foreign-denominated 3-month instruments has widened by a full
percentage point since mid-April. Late in the period, interest rates in
the United Kingdom, Germany, and Switzerland registered some upward
movement accompanied by some firming of the respective currencies.

IV-4

IV-5
U.S. International Financial Transactions
The capital inflows necessary to finance the growing U.S.
current account deficits occurred through a variety of channels in
the early months of 1984, as the foreign exchange value of the
dollar first declined and then recovered. Net Eurodollar borrowing
by U.S. banks from their own foreign offices and IBFs, stimulated
by strong domestic loan demand, increased by more than $9 billion
on a daily average basis between December and April. (See
International Banking Data table, line 3.) By April the Eurodollar
reserve requirement was binding on average on 13 of the 24 largest
banks, up from 7 in the third quarter of 1983.
In contrast, the balance of payments data for the first
quarter of 1984 showed a $12.2 billion net inflow through banks,
but not through transactions with own foreign offices. (See
Summary of U.S. International Transactions table). The explanation
of this apparent inconsistency is that in the balance of payments
data IBFs are treated as domestic rather than foreign offices and
transactions of bank holding companies with their foreign
affiliates are also included. Bank holding companies raised about
$3.5 billion through the issue of commercial paper in the United
States during the first quarter, most of which was advanced to
affiliated banking offices abroad. IBFs experienced substantial
net inflows of funds from unaffiliated foreigners and reduced their
liabilities to affiliated banks in the United States in the first
quarter. In the balance of payments data the roundtripping of
funds raised by bank holding companies cancels out, while the net

INTERNATIONAL BANKING DATA(Billions of dollars)
1981 1982 1983 1984Dec. Dec. Mar. June Sept. Dec. Jan. Feb. Mar. Apr.
1. Net Claims of U.S. BankingOffices (excluding IBFs) on OwnForeign Offices 8.2 33.2 49.2 43.7 42.3 38.8 37.0 35.7 33.8 30.5
2. Net Claims of U.S. BankingOffices on Own IBFs 1/ 11.8 16.2 14.6 12.8 10.5 5.2 7.8 7.0 4.1 4.2
3. Sum of lines 1 and 2of which: 20.0 49.4 63.8 56.5 52.8 44.0 44.7 42.7 37.9 34.7
(a) U.S.-chartered banks 22.5 40.3 53.7 50.0 47.1 40.4 39.4 38.3 35.5 33.8(b) Foreign-chartered banks 2.4 9.1 10.0 6.5 5.7 3.6 5.3 4.4 2.4 0.9
4. Credit Extended to U.S.Nonbank Residents by ForeignBranches of U.S. Banks 13.2 15.7 16.4 16.8 16.8 18.6 18.7 19.0 18.6 19.5
5. Eurodollar Holdings ofU.S. Nonbank Residents 2/ 95.5 112.6 116.4 120.4 121.3 126.4 123.6 124.8 128.7 128.4
1. Corresponds to net claims of international banking facilities (IBFs) on all foreign residents, includingall banks whether related or not, and all nonbanks.2. Includes term and overnight Eurodollars held by money market mutual funds.
Note: These data differ in coverage and timing from the overall banking data incorporated in the international
transactions accounts. Line 1 is an estimate constructed as the residual of line 3 minus line 2. Line 2 isdata for the last Wednesday of the month for the sample of monthly IBF reporters. Line 3 is an average of dailydata reported to the Federal Reserve by U.S. banking offices. Line 4 is an average of daily data. Line 5 is the
month-end value for data through September 1983. For dates after September 1983, the overnight portion is an
average of daily data and the term portion is an average of Wednesday data.

IV-7
inflow into IBFs shows up as an inflow from unrelated foreigners
rather than as an inflow from own foreign offices.
The large inflow of funds into U.S. banking offices
(including IBFs) from unrelated foreigners in the balance of
payments data occurred through a variety of channels; U.S. banks'
liabilities to unrelated foreign banks increased and claims on
both unrelated banks and nonbanks in foreign countries fell. In
addition, capital flight into the United States from the LDCs
appeared to continue in the first quarter of 1984; Latin American
nonbanks increased their deposits in U.S. banks by almost $2
billion, exceeding the average quarterly rate of 1983.
During the first quarter of 1984 there were also substantial
net capital inflows resulting from private securities transactions.
Foreign purchases of U.S. equities totaled more than $1 billion.
In addition, U.S. corporations issued more than $6 billion in
Eurobonds during the first four months of 1984. Some of these
funds will be used abroad, but the larger part will show up as
inflows in the direct investment accounts. The month-to-month
volatility of private foreigners' holdings of U.S. Treasury
securities in the first quarter is almost entirely accounted for by
transactions of the World Bank.
Official reserve transactions did not contribute to
financing the U.S. current account deficit in the first quarter of
1984. U.S. reserve assets increased by $0.7 billion; foreign
official reserve holdings in the United States fell by $3.2
billion. The G-10 countries added to their holdings largely as a

IV-8
result of French borrowings and German accumulation of interest
payments on reserves and dollars exchanged for marks by U.S. troops
stationed in Germany. The decline in OPEC assets accelerated to
almost $3 billion in the first quarter of 1984. The reserves of
other countries also declined, largely as a result of transactions
by the BIS and Singapore.
Preliminary data indicate that official reserves held at the
Federal Reserve Bank of New York increased by $.7 billion in April.
The OPEC countries continued to draw down their assets here (-$.5
billion) but other countries, particularly Germany and Singapore,
increased their holdings. These increases were, in general, not
associated with intervention. In the German case the increase was
the result of central bank swaps with commercial banks, designed to
influence German liquidity conditions, and in the case of
Singapore, the country is an active portfolio manager, reversing
positions frequently.

IV-9
SUMMARY OF U.S. INTERNATIONAL TRANSACTIONS(Billions of dollars)
1982 1983Year Year
198303 04
1984Q1 Jan. Feb.
Private CapitalBanks1. Change in net foreign
positions of banking officesin the U.S. (+ = inflow)
a) with own foreign officesb) all other
Securities2. Private securities
transactions, net
a) foreign net purchases(+) of U.S. corporate bonds
b) foreign net purchases(+) of U.S. corporate stocks
c) U.S. net purchases (-) offoreign securities
3. Foreign net purchases (+) of U.S.Treasury obligations 1/
Official Capital4. Changes in foreign official
reserve assets in U.S.(+ = increase)
a) By areaG-10 countries and SwitzerlandOPECAll other countries
b) By typeU.S. Treasury securitiesOther 2/
5. Changes in U.S. official reserveassets (+ - decrease) 3/
Other transactions (Quarterly data)6. U.S. direct investment (-) abroad7. Foreign direct investment (+) in U.S.8. Other capital flows (+ = inflow) 4/ 5/9. U.S. current account balance 5/
10. Statistical discrepancy 5/
-39.5-8.9
-30.6
16.78.97.8
-1.6 1.1
2.8 2.2
3.6 6.4
-8.0 -7.5
6.5 8.3
2.9 5.1
-12.76.98.8
5.7 7.0-2.7 -1.8
-5.0 -1.2
3.010.4-6.9
-11.241.4
-7.69.52.3
-41.37.1
12.3 12.210.7 9.11.6 3.2
0.3 0.2
12.2 5.1 2.2-0.4 -1.8 0.112.6 6.9 2.1
1.6 0.2 0.8 0.6
0.5 0.7 0.1 0.2 0.1 -0.2
1.3 0.4
-1.5 -0.9
0.8 1.7
-2.8 6.4
0.9 1.7-2.0 -1.5-1.7 6.1
-0.6 2.6 -0.3-2.2 3.8 -2.9
0.5 -1.0
-4.53.2
-0.1-11.4
1.7
* 0.5
0.0 0.2
1.5 1.6 3.0 -3.1
-3.2 -1.6 0.6 -2.2
2.4 0.5 2.6 -0.6-2.9 -0.2 -1.5 -1.1-2.8 -1.9 -0.5 -0.5
1.5 0.1 -2.0-3.1 0,4 -0.2
-0.7 -0.5 -0.2
-2.42.1-0.4
-15.9-2.9
MEMO:U.S. aerchandise trade balance - partof line 9 (Balance of payments basis,seasonally adjusted) -36.4 -61.1 -17.5 -19.4 -25.8 -8.6 -8.0 -9.2
1. Includes U.S. Treasury notes publicly issued to private foreign residents.2. Includes deposits in banks, commercial paper, acceptances, & borrowing under repurchases agreements.3. Includes newly allocated SDR's of $1.1 billion in January 1981.4. Includes U.S. government assets other than official reserves, transactions by nonbanking concerns, allocations of
SDts, and other banking and official transactions not shown elsewhere.5. Includes seasonal adjustment for quarterly data.* Less than $50 million.
NOTE: Details may not add to total because of rounding.
Mar.Mar.

IV-10
U.S. Merchandise Trade
The U.S. merchandise trade deficit increased again in March to a
new record level. For the first quarter as a whole, the deficit was $25
billion, at an annual rate, larger than that recorded in the fourth
quarter of last year (revised). Exports increased moderately for the
third successive quarter, but imports jumped substantially.
The rise in imports in the first quarter, 12 percent not at an
annual rate, was primarily in capital goods, nonoil industrial supplies,
and in consumer goods. These are categories that accounted for half of
all imports last year. Items showing the strongest rises included
nonferrous metals, steel, business and office machines, electric
U.S. MERCHANDISE TRADE 1/
1983 1983 1984Year Ql Q2 Q3 Q4 Ql Feb. Mar.
Value (Bil. $, SAAR)Exports 200.2 197.0 194.9 201.8 207.2 216.5 214.4 218.7Agricultural 36.6 35.3 34.8 37.2 39.2 41.0 39.1 42.4Nonagricultural 163.6 161.7 160.0 164.5 168.0 175.4 175.3 176.3
Imports 261.3 234.1 254.3 271.7 284.9 319.6 310.8 328.6Oil 53.8 43.1 51.3 63.7 57.1 55.2 54.8 57.9Non-oil 207.5 191.0 203.0 208.1 227.8 264.3 256.0 270.7
Trade Balance -61.1 -37.1 -59.4 -70.0 -77.7 -103.1 -96.4 -109.9
Volume (Bil 72$, SAAR)Exports
Agricultural 16.3 16.5 15.8 16.3 16.2 17.0 16.2 17.5Nonagricultural 57.3 56.0 56.0 57.6 58.8 60.9 60.5 61.4
ImportsOil 4.9 3.7 4.8 5.8 5.2 5.1 5.0 5.3Non-oil 81.9 75.4 80.2 82.1 89.1 102.5 100.1 104.3
1. International transactions and GNP basis.

IV-11
machinery, and clothing. As in the past several quarters, the increase
reflected both the strength of the U.S. economy and the high exchange
value of the dollar. Automotive imports were marginally above the
fourth-quarter level with most of the rise in imports coming from
Canada; foreign car imports from Japan and Europe were about the same as
in the fourth quarter.
Prices of nonoil imports rose by 3 1/2 percent at an annual rate
in the first quarter, the same rate as in the fourth quarter; this
follows nearly two years of nonoil import prices declining or being
flat.
Oil imports in the first quarter were slightly less than in the
fourth quarter. (See the table below.) U.S. oil consumption has
averaged close to 15.5 mbd during the past three quarters; inventories,
which were drawn down in the fourth quarter, were little changed in the
first quarter. Preliminary data for April show a pick-up in both
consumption and stock accumulation. While the average price of imported
oil was slightly less in the first quarter than in the fourth quarter,
prices increased during the quarter reflecting rising spot market prices
in late December and early January. Since the beginning of the year,
spot prices have remained close to official prices.
OIL IMPORTS
1983 1983 1984Year Q1 Q2 Q3 Q4 Q1 Feb. Mar.
Volume (mbd, SA) 5.20 4.01 5.07 6.17 5.54 5.38 5.19 5.59Price ($/BBL) 28.42 29.41 27.69 28.29 28.29 28.05 28.19 28.19Value (Bil. $, SAAR) 53.80 43.08 51.31 63.69 57.14 55.24 54.77 57.88

IV-12
Exports in the first quarter increased by 4.5 percent from fourth
quarter levels. Much of the rise was in machinery and automotive
products (to Canada) with a smaller rise in chemical exports. Since the
low first half of last year, nonagricultural exports expanded by 9
percent (mostly in volume); about two thirds of the increase in exports
was to Canada and 15 percent in exports to Mexico. Exports to Western
Europe began to pick up in the fourth quarter as economic activity in
those countries strengthened.
Agricultural exports were only marginally higher in value in the
first quarter as the effect of an increase in the volume of soybean
exports (from low fourth quarter levels) was offset by the effect of
lower prices in the value of wheat exports (a record wheat harvest in
Argentina added to the market glut).

IV-13
Foreign Economic Developments. The progress of the recovery in
major foreign industrial countries remains uneven. It is notable that
seasonally adjusted industrial production in five major countries
declined in the latest month for which data are available. However,
despite declines in March, industrial production rose in the first
quarter in Japan and Germany. Industrial production also rose in Italy
(n.s.a.) in the first two months of the year following a rebound of
activity in the second half of last year, and orders data and consumer
surveys in March suggest continued moderate growth. The slow expansion
in the United Kingdom appears to have been interrupted in February and
March, although business surveys there indicate an improved outlook for
the spring. The record drop of Canadian industrial production and
declines in new and unfilled orders reflect a weakening of the expansion.
Activity remains weak in France, and the unemployment rate, which has
been increasing since October, reached 9.6 percent in March.
Unemployment rates have also risen somewhat in Canada and Germany and
remain at or near record levels in other European countries.
Consumer price inflation, measured on a year-over-year basis,
declined in the early months of this year in Italy and France, the two
relatively high inflation countries. Inflation in other countries
remains stable at rates above those of a year earlier. The reduction in
Italian inflation was cited as a factor in the May 4 reduction of the
discount rate.
The trade account strengthened in Japan in the first quarter to a
surplus of $40 billion (s.a.a.r.). The French and Italian trade
positions deteriorated in the first quarter, though deficits for both

May 16, 1984
REAL GNP AND INDUSTRIAL PRODUCTION IN MAJOR INDUSTRIAL COUNTRIES(PERCENTAGE CHANGE FROM PREVIOUS PERIOD, SEASONALLY ADJUSTED)
Q4 /Q4 Q4/Q41982 1983
1983Q2 Q3 Q4
1984
Q1
1983DEC.
1984
JAN. FEB. MAR. APR.LATEST 3 MONTHSFROM YEAR AGO+
CANADAGNPIP
FRANCEGDPIP
GERMANYGNPIP
ITALYGDPIP
JAPANGNPIP
UNITED KINGDOMGDPIP
UNITED STATESGNPIP
-5.0 6.6 1.9 2.0 .9-11.8 16.7 3.1 4.3 3.1
1.2-1.8
.5 -. 3 .61.0 .8 .0
-1.6 2.9 1.2 -.1 1.3-5.4 5.9 2.2 .5 2.2
-2.3 1.2-6.1 -1.0
-1.6 1.1 1.0-4.7 1.8 1.4
3.8 3.6 1.1 1.5 .8-2.7 8.5 1.6 3.3 2.5
1.6 3.3.1 4.8
-.5 .5 1.6.0 2.0 1.4
N.A.N.A.
N.A.N.A.
N.A.1.1
N.A.N.A.
N.A.3.3
N.A.N.A.
-6.8-6.8
-1.7 6.2 2.3 1.9 1.2-7.5 15.0 4.3 5.1 2.5
* * * *
2.3 -3.5 N.A. N.A.
* * * *
.8 -1.5 N.A. N.A.
* * * *
.9 1.0 -3.9 N.A.
* * * *
N.A. N.A. N.A. N.A.
* * * *
.7 2.7 -.9 N.A.
* * * *
.5 -1.6 N.A. N.A.
1.5 1.0 .5 1.41.5 1.0 .5 1.4
* DATA NOT AVAILABLE ON A MONTHLY OR QUARTERLY BASIS.
+ IF QUARTERLY DATA. T.ATET OITARTFR FjnU varnA Arn
6.614.5
.52.6
2.96.0
1.2-1.0
3.611.2
3.34.3
7.715.1

May 16, 1984
CONSUMER AND WHOLESALE PRICES IN MAJOR INDUSTRIAL COUNTRIES(PERCENTAGE CHANGE FROM PREVIOUS PERIOD)
Q4/Q4 Q4/Q4 1982
1982 1983 Q4
1983Q1 Q2 Q3 Q4
1984Q1
1984JAN. FEB. MAR. APR.
LATEST 3 MONTHSFROM YEAR AGO
CANADACPIWPI
FRANCECPIWPI
GERMANYCPIWPI
ITALYCPIWPI
JAPANCPIWPI
UNITED KINGDOMCPIWPI
UNITED STATESCPI (SA)WPI (SA)
9.7 4.64.5 3.4
9.5 9.88.5 14.5
4.7 2.63.1 .9
16.6 12.812.4 9.1
-.2 1.9.2 -3.3
6.2 5.16.5 5.5
1.6.3
1.81.0
1.41.5
1.6.9
.9
.3
2.7 2.8 2.1 1.92.5 4.0 3.7 3.5
.5 .6-2.0 .8
4.53.3
1.0-.1
1.0.9
1.21.6
1.7N.A.
N.A.N.A.
.7 .61.8 .2
.7 N.A.N.A. N.A.
.51.2
3.6 2.9 2.3 3.51.6 1.6 2.3 3.3
-.1 2.8-1.9 -1.0
2.83.2
1.2 1.1 .71.4 1.0 .7
-.2 1.3.2 -. 6
.5 2.0 1.3 1.11.4 2.0 .8 1.3
-.0 1.1 1.0 1.1-.4 .2 .6 .4
1.3.2
-. 1 .4.7 .6
1.21.1
.7N.A.
.0 .4-. 4 -. 1
.3 N.A.1.0 1.1
N.A..0
8.815.8
3.25.2
11.710.8
3.2-1.1
5.26.3
4.52.7
I

May 16, 1984
TRADE AND CURRENT ACCOUNT BALANCES OF MAJOR INDUSTRIAL COUNTRIES(BILLIONS OF U.S. DOLLARS; SEASONALLY ADJUSTED)
1982 19831982Q4
1983Q1 Q2 Q3 Q4
1984Q1
1983DEC.
1984JAN. FEB. MAR.
CANADATRADECURRENT ACCOUNT
FRANCETRADE 2/CURRENT ACCOUNT 2/
GERMANYTRADECURRENT ACCOUNT (NSA)
ITALYTRADECURRENT ACCOUNT (NSA)
JAPANTRADE 2/CURRENT ACCOUNT
UNITED KINGDOMTRADECURRENT ACCOUNT 2/
UNITED STATESTRADECURRENT ACCOUNT
14.8 14.62.4 1.3
4.1.9
3.3 4.3 3.3 3.7.2 1.0 -. 2 .3
-14.0 -5.9 -2.9 -3.5 -1.7
-12.1 -4.2 -2.4 -3.9 -.9
20.9 16.43.6 3.3
-12.8-5.8
-7.8.5
18.8 31.56.9 21.0
3.6 -. 89.1 3.3
-. 6.3
-. 2.3
5.1 4.1 3.7 3.41.7 .8 -2.6 3.4
3.4N.A.
-1.5N.A.
4.3.7
-2.6 -3.0 -1.4 -2.1 -1.3 -2.5-. 7 -2.0 .6 1.0 .9 N.A.
4.01.6
2.03.7
-36.4 -60.5 -11.4 -9.3-11.2 -40.8 -6.6 -3.7
6.5 8.1 8.8 8.13.5 6.0 6.1 5.5
.3 -. 7 -. 4 -.01.8 .1 1.0 .5
-14.9 -17.5-9.7 -12.1
10.07.2
.01.1
-19.4 -25.8-15.3 N.A.
1.3*
.1*
1.02.0
-. 8*
2.82.2
.5
.7
-4.8*
1.7 .8* *
-. 6 -. 6 -. 3* * *
1.3 1.7 1.3-. 2 .2 .7
-. 4 -. 5 -1.6* * *
3.7 3.1 3.32.9 1.9 2.4
-. 5 .8 -. 3-.1 1.2 .1
-8.6 -8.0 -9.2* * *
1/ THE CURRENT ACCOUNT INCLUDES GOODS, SERVICES AND PRIVATE AND OFFICIAL TRANSFERS.2/ QUARTERLY DATA ARE SUBJECT TO REVISION AND ARE NOT CONSISTENT WITH ANNUAL DATA.
* COMPARABLE MONTHLY OR QUARTERLY CURRENT ACCOUNT DATA ARE NOT PUBLISHED.

IV-17
countries remain below year-earlier levels.
Individual Country Notes. The Japanese economy is continuing its
steady growth. Although industrial production fell almost one percent in
March, the average in the first quarter was a robust 14 percent
(s.a.a.r.) above its level in the previous quarter. Exports have
remained bouyant, in large part because of the strong U.S. recovery, and
the components of private domestic demand have also revived in recent
months. According to the most recent assessment by the Japanese Economic
Planning Agency, the outlook for investment in private plant and
equipment, which has been a source of relative strength in recent months,
has brightened further with an improvement of corporate profits.
Consumption demand, which has lagged somewhat in this recovery, appears
to be increasing at a moderate pace. Labor-market conditions have
improved slightly, as the unemployment rate declined 0.05 percentage
points in March from February's record level of 2.73 percent.
Wholesale prices continue to be stable. Consumer prices, however,
have shown some signs of upward pressure in recent months. The CPI
advanced by 0.4 percent in April, the third month this year in which
consumer prices have increased.
The Japanese trade balance registered another large surplus in
March of $3.3 billion (s.a.), the third consecutive month of surpluses
exceeding $3 billion. The current-account surplus in the first quarter
was over $7.2 billion (s.a.), more than double last year's first quarter
total. Extremely strong exports, which grew by almost 6 percent (s.a.)
in March, accounted for much of the gain.
The German industrial production index declined by a provisional

IV-18
3.9 percent in March, leaving the first quarter level 1 percent above
that of the fourth quarter and 6 percent above the year-earlier level.
Producers and investment goods were among the stronger sectors.
According to an unofficial, preliminary estimate, real GNP in the first
quarter rose by about 2 percent (s.a.a.r.). The number of unemployed has
hovered around the 2.2 million level (9 percent, s.a.) since October of
last year, only 0.1 million below the peak recession level. Order
volumes have risen modestly so far this year, with foreign orders
maintaining the strong lead over domestic orders that developed in the
course of last year. The rate of consumer price inflation over the three
months to April was below 2.5 percent (a.r.).
While the rise in foreign demand is being reflected in a strong
recovery of German exports, the trade surplus (n.s.a.) for the first
quarter this year was less than last year's because German imports rose
even faster. The current account surplus through March, at $0.7 billion,
was almost $1 billion below the year-earlier figure.
This year's wage round has produced no major settlement so far.
The focus is on the metalworkers' union, which broke off negotiations
over a 35 hour workweek with no loss of pay. The union recently won two
important local strike votes; on May 14 selective strikes began and are
expected to expand.
In the United Kingdom the expansion may have paused as industrial
production declined 1.6 percent (s.a.) in February and retail sales fell
1.1 percent in March. However, survey data indicate that orders had
increased in the four months to April, and business confidence remains
strong. The unemployment rate for April remained unchanged at 12.6

IV-19
percent, the level that had been observed in both February and March.
The rate of inflation continued to be steady; in March the retail price
index was 5.25 percent above its year-earlier level, approximately the
rate of increase in each of the previous three months.
The U.K. trade balance returned to deficit in March. The $300
million deficit counteracted a substantial surplus in February to produce
a small trade surplus for the first quarter. The current account
registered a first-quarter surplus of $1.1 billion.
U.K. mineworkers have been on strike for almost two months. The
dispute concerns planned pit closures announced earlier by the National
Coal Board and does not involve wage issues. Recently some possible
compromises have been suggested which may provide the basis for
negotiation. Continued operation of some mines and existing stockpiles
have greatly limited so far the impact of the strike on coal-using
industries.
In France, industrial production fell 1-1/2 percent (s.a.) in
February but remained above its year-earlier level. The unemployment
rate rose for the fifth consecutive month in March and now stands at 9.6
percent (s.a.). Consumer price inflation in the first quarter was below
that of a year earlier.
The French trade deficit narrowed somewhat in March. For the first
quarter as a whole the trade deficit was about $1.5 billion (s.a.),
greater than the $0.2 billion (s.a.) deficit recorded in the fourth
quarter of last year. However, this widening of the trade deficit
appears to have been due in large part to an unusual seasonal pattern of
oil imports; the trade surplus for manufactured goods increased in the

IV-20
first quarter.
Revised data for Italy reveal that real GDP in 1983 rose by 1.2
percent (Q4/Q4); evidence is mounting that the slow recovery, which began
last summer, is continuing this year. Industrial production (n.s.a.) in
February was 3 percent above its year-earlier level; delays in the
revision of seasonal adjustment factors account for the absence of those
data. Data on orders and surveys of production expectations point to
continued growth this year; surveys also suggest increasing confidence
among consumers.
Part of this optimism may reflect the slowdown of inflation: the
consumer price index in the twelve months ending in April rose by 11-1/2
percent, the lowest such increase in eight years and 5 percentage points
below the increase in the year ending in April 1983. However, wholesale
price inflation picked up in the year ending in March, in part as a
result of the appreciation of the dollar against the lira.
The lagging recovery in Italy helped to produce a small surplus in
the current account last year. In the first quarter of this year, the
trade deficit was $2-1/2 billion, compared with a $3 billion deficit in
the first quarter of 1983.
The decree law on incomes policy, which was proposed on February 16
and which would have reduced the cost of living increases granted under
the scala mobile, lapsed on April 16 as a result of the delaying tactics
of the Communist party. On the next day the Craxi government re-
submitted a somewhat watered-down version of the previous decree law,
according to which scala mobile increases will be reduced only through
July of this year. The government hopes that labor-management talks can

IV-21
achieve a more lasting reform of the system. On May 5 the government
reduced the discount rate from 16 to 15.5 percent, with the deceleration
of inflation and the exchange rate stability of the lira cited as factors
behind this decision.
Canadian economic activity continued to expand early this year at a
more hesitant pace than that experienced over the first three quarters of
1983. After posting a strong rise in January, industrial production
declined sharply in February by 3-1/2 percent (s.a.). Part of the
severity in the decline in February's industrial production can be
accounted for by a lockout in British Columbia and unusually bad weather.
Nevertheless, the decline was broadly based as large drops occurred in
the output of transportation equipment, electrical products, primary
metals and machinery. Further, the value of new orders also declined
sharply in February, particularly in new orders for durable goods. The
unemployment rate in March and April of 11.4 percent, though more than 1
percentage point below the peak of early 1983, is up 0.3 percentage
points from the level of the fourth quarter.
The inflation rate was up slightly and averaged approximately 5
percent in the first quarter. This compares with a 4-1/2 percent
increase in the CPI over the twelve months ending in December 1983.
The trade surplus in the first quarter declined slightly from the
average quarterly figure for last year. The strong performance of
transportation equipment exports to the United States accounts for a
substantial fraction of this year's trade surplus.
The federal government introduced legislation that would increase
the ceiling on assets of foreign banks in Canada to 16 percent of total

IV-22
domestic banking assets. The existing ceiling of 8 percent appears to be
binding on foreign banks, a large fraction of which are U.S. banks. This
legislation, which is an amendment to the Bank Act, is unusual in that
the next revision of the Bank Act was not scheduled to occur until 1990.
A general price freeze was put into effect in Sweden on April 12.
Also, the government called for freezes on both rent and dividend
increases, for restrictions on the use of credit cards, and for a
drawdown of the liquidity of corporations and local governments.
Corporations with a wage bill in excess of $2.5 million will be required
to deposit with the central bank (at 7 percent interest) a sum
corresponding to 6 percent of their wage bills. Local governments will
be required to deposit a sum equal to 3 percent of their wage bills in
similar accounts. The funds will be frozen for a maximum of two years
but may be drawn from earlier for productive investment and at the
discretion of the government.
These measures were taken in response to recent wage settlements
that were viewed as jeopardizing the government's goal of reducing
inflation, as measured by the CPI, from 8.9 percent in 1983 (Q4/Q4) to
4 percent by the end of 1984. (The recent agreement concluded with the
metalworkers implies an annual increase in wage costs, inclusive of wage
drift, of 8-1/2 to 9 percent.) Although the price freeze should increase
employer resolve against granting similar increases in subsequent negoti-
ations, the government's threat of instituting an incomes policy if indus-
try and labor representatives fail to agree to an acceptable ceiling for
wages in 1985 is expected to have a larger effect on slowing wage growth.
The government's inflation target for 1985 has been set at 3 percent.

IV-23
Debt Situation in Selected Developing Countries
Argentina's negotiations with the IMF are proceeding slowly, and
this in turn is delaying negotiations with bank creditors. Colombia is
continuing to lose reserves, and a large Colombian bank is seeking
refinancing of its external debts. Foreign banks have disbursed $3.9
billion of Brazil's $6.5 billion new money facility; performance of
Brazil's external sector has been better than expected so far this year,
though performance of the domestic economy, especially in the monetary
area, has been worse. Mexico's $3.8 billion loan is oversubscribed, but
there are still no signs of a turnaround in domestic economic activity,
and inflation so far this year is exceeding projections. Chile and
Peru's IMF programs have both received Executive Board approval. Vene-
zuela has virtually eliminated public sector interest arrears and has
implemented an austerity program, but remains somewhat reluctant to go to
the IMF. The Philippines continues to negotiate with the IMF, and bank
creditors have again extended the moratorium on debt repayments.
Argentina is continuing its slow-moving negotiations with the IMF.
Completion of a letter of intent that the IMF management would approve
now seems unlikely before mid-June. The major area under discussion is
the budget, but tough negotiations will also be required on interest rate
policy, exchange rate policy, and wage policy. An IMF staff mission
arrived in Buenos Aires May 7 to resume negotiations. Pending conclusion
of an IMF agreement, Argentina obtained a $400 million short-term credit
($100 million each from Mexico, Venezuela, and the group of banks that
constitute the commercial bank Working Committee for Argentina, and $50
million each from Brazil and Colombia). Using these funds and $100

IV-24
million from its own reserves, Argentina paid public sector interest
arrears for the fourth quarter. This payment allowed U.S. banks to keep
Argentine loans on an accrual status for the purpose of income calcula-
tions. If an IMF letter of intent has been signed by May 31 (originally
April 29), the U.S. Treasury's Exchange Stabilization Fund will lend
Argentina $300 million as a bridge to the IMF credit, to be used to
reimburse the four Latin American countries. Discussions with banks on
the possible release of the undisbursed $1 billion that remains under the
1983 medium-term loan, on debt restructuring, and on new financing remain
at a standstill. The $750 million in payments on the 1982 bridge loan
from commercial banks that were due on April 16 have been postponed until
June 15. The government is continuing to set wages, interest rates, and
exchange rate changes in relation to the projected rate of inflation.
The policy of granting retroactive wage increases when inflation exceeds
the projected rate to restore a small increase in real wages has been
modified by placing these retroactive raises on a quarterly instead of a
monthly schedule. The monthly interest rates on 30-day loans and
deposits were raised to 14 and 13 percent, respectively, at the beginning
of April, but although the CPI rose by 18.5 percent in April, these rates
have remained unchanged for May. Over the past 16 months, the official
peso price of the dollar has increased by 20 percent less than the CPI.
The free market premium for the dollar was about 55 percent at the end of
April.
Since 1980, the end of the coffee boom, Colombia's economic and
financial position has deteriorated. For over two years, there has been
a recession in domestic economic activity, with real GDP rising only

IV-25
about 1 percent per year in 1982 and 1983. The deficit of the non-
financial public sector has increased steadily and exceeded 6 percent of
GDP last year. The current account deficit was about $3 billion in both
1982 and 1983. Gross international reserves, excluding gold, which were
close to $5 billion at the end of 1981, had fallen to less than $1.3
billion by the end of March 1984. (Gold holdings on that date were
equivalent to $1.6 billion at current prices.) Since late 1982, the
authorities have tightened exchange controls, increased quantitative
restrictions on imports, and increased fiscal incentives for exporters.
They have also raised the rate of increase of the peso price of the
dollar under their crawling peg system from a 16 percent annual rate
before October 1982 to 26 percent in 1983, thereby achieving a real
depreciation of 7-8 percent in 1983. Colombia began to experience some
difficulties in obtaining new financing from foreign commercial banks in
1983, although some medium-term syndicated Eurocurrency credits and club
deals are continuing to be arranged. Money market and short-term trade
financing lines to Colombian banks and their branches in Panama began to
be reduced in 1983, partly because of financial difficulties experienced
by some of the more important Colombian banks. Last month, a large
Colombian commercial bank obtained a 90-day moratorium on most of its
short-term external debts pending conclusion of a refinancing arrange-
ment. If access to foreign bank credit narrows further, Colombia may be
forced to negotiate an IMF agreement before the end of 1984, and may have
to seek a rollover and/or restructuring of a large portion of its sched-
uled debt payments which amount to about $4 billion in 1984.

IV-26
Brazil registered a trade surplus of $3.5 billion during the first
four months of the year, compared with $1.4 billion over the first four
months of 1983, due largely to strong growth in exports. To achieve the
$9 billion trade balance target for the year, Brazil will only need
average trade balance surpluses of about $700 million per month for the
rest of the year. Domestic activity picked up slightly during the first
quarter as a result of the strong growth in exports of manufactured
goods. The rate of inflation was 229 percent for the twelve month period
ending in April of this year compared with 211 percent over the twelve
months of 1983. However, the monthly inflation rate fell to 8.9 percent
in April, a decline from the average monthly rate of more than 10 percent
in the first three months of the year. Brazil met all of the first-
quarter performance criteria under its IMF program in addition to
abolishing foreign exchange controls and clearing all arrears. Foreign
banks disbursed $3.0 billion from Brazil's new money facility in March,
and an additional $875 million (of the remaining $3.5 billion) was
disbursed in April. At present, it appears that although official
agencies have committed $2.5 billion in new money to Brazil, it is
unlikely that the full amount will be disbursed before year-end.
However, the better than expected performance of the current account may
compensate for such a shortfall.
The 1984 foreign commercial bank loan for Mexico was open for
signature on April 27. The loan is for $3.8 billion, but subscriptions
exceed $4 billion. Some banks which participated in last year's loan
have not yet made a commitment, and Mexico is continuing to pressure them
to join the syndication. There are still no signs of a turn-around in

IV-27
domestic economic activity: in 1983, real GDP was 4.7 percent lower than
in 1982 and industrial production was 8.6 percent lower. The decline
moderated somewhat in the fourth quarter when industrial production was
about 5 percent lower than a year earlier. In April, the CPI was 4.3
percent higher than in March and 69.1 percent higher than a year earlier,
and inflation in the first four months of the year has averaged 5.1
percent per month, casting doubt on whether an inflation rate of less
than 50-55 percent for the year as a whole (December-over-December) is
attainable. (The authorities have projected a 40 percent inflation
rate.) Given these inflation developments, the market is increasingly
aware that continuation of the current policy of increasing the peso
price of the dollar by 13 centavos per day would result in a signifi-
cantly overvalued peso by the end of the year. On May 3, rumors
circulated that a 10 percent devaluation was imminent and that it might
be followed by an increase in the rate of daily crawl of the peso price
of the dollar. As a result, in U.S. markets the peso fell sharply,
closing at 202 pesos per dollar on May 4 compared with 184.75 pesos on
May 2. When no change in exchange policy occurred in the ensuing days,
the rate firmed somewhat, closing at 196 pesos on May 11.
Chile's program for the second year of its stand-by arrangement was
approved by the IMF Executive Board on May 14, when a "critical mass" of
85 percent of Chile's 1984 commercial bank credit of $780 million had
been committed. Executive Board consideration had been delayed several
weeks while these committments were obtained and because the new Finance
Minister, Luis Escobar (who replaced Carlos Caceres on April 2), wished
to discuss with the Fund the possibility of incorporating more fiscal

IV-28
stimulus into the program. After several days of talks in mid-April, it
was decided that the program would remain unchanged. (The program
already contains a provision for some increase in the fiscal deficit in
the second half of this year if private sector activity remains weak;
a decision will be made in July.) Chile's Central Bank President, Hernan
Felipe Errazuriz, resigned in late April, apparently because of disagree-
ments with the new Finance Minister over the course of Chilean economic
policy. He has been named Ambassador to the United States. Francisco
Ibanez, the former Superintendent of Banks, has been appointed the new
Central Bank President. Chilean consumer prices in the first quarter of
this year were up 21 percent from the first quarter of 1983, after a 24
percent increase from the fourth quarter of 1982 to the fourth quarter of
1983. Unemployment edged up to 15.5 percent in the first quarter of 1984
from 14.6 percent in the fourth quarter of last year.
Peru's stand-by arrangement was approved by the IMF Executive Board
on April 26. Board consideration was delayed a few weeks because the
government had not taken some of the adjustment measures that were pre-
requisite and because the new Finance Minister, Jose Benavides (who
replaced Carlos Rodriguez Pastor on March 20), wanted to discuss with the
Fund the possibility of easing some of the targets. Both were reflec-
tions of growing political opposition to further austerity. In the
intervening weeks, the necessary price and tax adjustments were
announced, and the Fund agreed to raise the fiscal deficit target
slightly from 3.8 to 4.1 percent of GDP to allow for some additional
official development assistance. Peru's bank creditors, who had pre-
viously planned to disburse the final $100 million of the country's 1983

IV-29
credit when the IMF Executive Board approved the program, now plan to
disburse the funds when the 1984-85 rescheduling agreement goes into
effect, probably in July. This does not pose an immediate cash squeeze
for Peru, since the country has just made its first drawing of SDR 15
million under the stand-by arrangement and a drawing of SDR 74.7 million
under the Compensatory Financing Facility. In accordance with the
adjustment program, the rate of increase in the sole/dollar exchange rate
has been accelerated from about 4 percent per month during September-
February to about 7-1/2 percent per month in March-April, bringing it
back in line with the monthly rate of inflation.
Venezuela's newly elected government is implementing an adjustment
program aimed at both eliminating the $1 billion in private sector
interest arrears in the near term and at reducing the overall level
($34 billion) of external debt. To date, Venezuela has been reluctant to
seek IMF approval of its program, but that attitude may be changing.
Interest arrears on public sector debt were virtually eliminated in early
April. The government is expected to seek rescheduling of $14.2 billion
of 1983 and 1984 debts of the public sector. Banks are likely to insist
that private sector interest arrears be cleared up before a rescheduling
of private sector debt is negotiated. On May 3, the government announced
the imposition of a 100 percent reserve requirement on holdings of
foreign currency assets by Venezuelan banks in order to prevent specula-
tion by banks in the free exchange market. The free market rate had
depreciated to about 15-1/2 bolivars per dollar from 13 bolivars per
dollar. The central bank had been selling dollars to the banks at about
14 bolivars per dollar.

IV-30
The Philippines continues to negotiate with the IMF on a stand-by
arrangement for SDR 615 million. Prime Minister Virata has said that he
hopes to sign a letter of intent in late May. The government continued
during April and early May to take fiscal and monetary adjustment
measures. The ad valorem duty surcharge on a wide range of imports was
increased on April 11 from 5 percent to 8 percent in order to increase
government revenues. However, on May 1 President Marcos decreed a 10
percent pay increase for all government employees, and it is not yet
clear how this will affect the 1984 budget. On April 23, the central
bank again increased the reserve requirement for banks, from 23 to 24
percent, in order to restrain further domestic liquidity. The IMF team
currently in Manila will assess the impact of these measures. The
Philippines has received from bank creditors a second extension of a
90-day moratorium on the repayment of principal on non-trade external
debt originally granted last October. The new extension runs from April
16 to July 12. On April 23 the Philippine Central Bank authorized
Citibank to pay to depositors about 46 percent of the roughly $600
million in interbank deposits at its Manila branch. These deposits had
been frozen by the Philippine authorities last October. The 46 percent
figure derives from the fact that Citibank had reinvested outside the
Philippines about 46 cents of each dollar deposited with its Manila
branch. The branch will use assets outside the Philippines to pay off 46
percent of each deposit upon maturity.