financial advisors - thomson...
TRANSCRIPT
MID-MARKET M&A REVIEWFINANCIAL ADVISORS
First Quarter 2016
REUTERS / Edgar Su

Japanese Involvement Mid-Market Rankings (MM15)
11
12
13
14
15
16
17
18
Hochinma Involvement Mid-Market Rankings (MM13)
Worldwide Mid-Market Rankings (MM1)
US Target Mid-Market Rankings (MM2)
Latin America Involvement Mid-Market Rankings (MM17)
European Involvement Mid-Market Rankings (MM3)
Nordic Involvement Mid-Market Rankings (MM9)
German Involvement Mid-Market Rankings (MM6)
https://www.thomsonone.com
First Quarter 2016 | Mergers & Acquisitions | Financial Advisors
Mid-Market M&A ReviewTable of Contents
Worldwide Mid-Market M&A Deals Intelligence
UK Involvement Mid-Market Rankings (MM4)
French Involvement Mid-Market Rankings (MM5)
1
2
4
3
Ranking Criteria Summary
19
10
Australia/New Zealand Involvement Mid-Market Rankings (MM11)
5
Italian Involvement Mid-Market Rankings (MM7)
Spanish Involvement Mid-Market Rankings (MM8)
Chinese Involvement Mid-Market Rankings (MM20)
20Indian Involvement Mid-Market Rankings (MM21)
21
6
7
8
9
Hong Kong Involvement Mid-Market Rankings (MM12)
Singapore Involvement Mid-Market Rankings (MM14)
Benelux Involvement Mid-Market Rankings (MM10)
Eastern Europe Involvement Mid-Market Rankings (MM16)

#
https://www.thomsonone.com
Worldwide Mid-Market M&A up to US$500m by Rank Value Range Jan 1 - Mar 31
Jan 1 - Mar 31
Mid-Market Deals Intelligence
Costa Rica 360.0 1 0.0 1
Rank Value
US$m
10,002 ▼
Worldwide Mid-Market M&A up to US$500m by Target Industry
Visit http://dmi.thomsonreuters.com to View Archives and Order Custom League Tables
First Quarter 2016
DEALS VALUED UP TO US$500 MILLION
MID-MARKET M&A REVIEWM&A Rankings For Small-Cap Deals Valued Up To US$50m Are Also Available
3,201-5.1
-10.5-13.633.3
-50.574.8
-36.8119.9
140
840.2
▼
▼
▼
3,366.2
1584,594.9South Korea 5,057.5 ▼
2,151.6
Hong KongIndia
▲
Japan
▼▲
▼
330.0 0.03,457
16,041.7
# of
Deals
▼
158 ▲
Germany 3,053.9 322 6,111.5 389 ▼Italy 3,136.2
637 ▼France 6,510.6 644 4,724.9 629 ▲
2 -
Europe 39,147.8 3,250 47,987.1
# of
Deals
United States of America 44,580.0Canada 6,686.5 310 5,017.3
199,791.9▼
2,950.9
United Kingdom 10,237.5
366 ▲
0.0
Brazil
▼
320.8 24 ▲
1,256.5 126
185-50.0
Worldwide 189,583.3
2,540.4
Venezuela
189
Australia
Thailand 907.4
China 56,099.0
2554,429.7
---
-18.4-36.237.8
6.3
Americas 55,096.2 2,524 61,533.2
4 3
1,964 51,613.3
-
147 ▼Mexico 560.8 21
Bermuda
5,727.6
545
Denmark 928.1 87
Spain
Netherlands 5.6-42.6
-7.6151.3-28.6
1,426.5
1,356.31,287.0
Poland
Africa/Middle East/Central Asia ▼
500.0 1-
1,568.2Finland
44
303 5,796.81,299.8
302 1,323.6
114
293
66 648.8 ▲
69
616
87Singapore27
48 652.18,642.4
105 2,480.7
▲
▲
46
2691,016
144
▼▲
▲
▼1481,160.6 124 461.8
2,362.1 531,359.1
Republic of Ireland280Russian Federation 1,223.2
-1.2
-36.17.8Asia-Pacific (ex Central Asia) 80,969.3
54 1,171.22,691 2,43575,123.7
20Israel 1,147.3 36 1,009.788South Africa 748.9
3539.2-7.6
13.6
224 3,801.5
1,206
644
98Malaysia
Jan 1 -Mar 31Announced Mid-Market M&A by Target Nation Up To US$500m
4,114.2 283238
Region/Nation
1/1/2016 - 03/31/2016 1/1/2015 - 03/31/2015 % Change
in Rank
ValueRank Value
US$m
57
19.1-20.0-22.4
-7.1-11.5111.6
12.832.7
▲
291
Indonesia 1,115.0
9,412
2,518 ▼
117 1,016.6▼
▲110
9,351.0
1,992.8 ▲1,767.4
Worldwide announced Mid-Market M&A deals valued up to $500 million (including undisclosed value deals)totaled US$189.6 billion for the first quarter of 2016, a 5.1% decrease year-on-year.
Estimated global fees generated from completed Mid-Market M&A activity reached almost US$2.8 billion for thefirst quarter of 2016, according to estimates by Thomson Reuters and Freeman Consulting.
The Asia-Pacific (ex Central Analysis) region (by target domicile) led the market, with over US$81.0 billion ofannounced deal activity, representing over 42.7% share of the market.
The European region (by target domicile) led the market in deal count, with 3,250 deals for the first quarter of2016, representing 34.5% of the 9,412 deals announced worldwide.
The Real Estate sector comprised 14.5% of announced value, followed by High Technology and Industrials, with13.4% and 12.4% of the total market, respectively.
47,121.36,322.95,920.5
-
2,000
4,000
6,000
8,000
10,000
12,000
14,000
$0
$50
$100
$150
$200
$250
$300
# of
Dea
ls
Ran
k Va
lue
(US
$b)
US$200 - 500m US$100 - 200m US$50 - 100m US$0 - 50m # of Deals
14.5%
13.4%
12.4%
11.2% 10.3%
7.8%
7.1%
6.5%
5.8%
4.9%
4.7%
Real Estate
High Technology
Industrials
Energy and Power
Financials
Consumer Products and Services
Materials
Healthcare
Media and Entertainment
Retail
Consumer Staples
Telecommunications
1

* Source: Thomson Reuters/Freeman Consulting
77.0100.0
8.792.993.732.5
100.021.1
100.0
48.491.036.252.510.8
100.013.198.7
91.948.9
51.133.3
Jan 1 - Mar 31Worldwide Mid-Market M&A up to US$500m by Target Nation Region
41*
11
Deutsche Bank
KBS Corporate Sales LtdBDO
BCMS Corporate Ltd 38*14
28*5
▼-100.0947.7
5187.916
34*
1,414.5 25 84.4 ▲0.0 - - -
587.9
Lincoln International
CFI
7
41*
-
▲
▼
CITIC
13
-5
14
13 4 ▲13
Visit http://dmi.thomsonreuters.com to View Archives and Order Custom League Tables
33
31*
▲La Compagnie Financiere
▼
34* 16*
31*
189,583.3
10
830.213 ▲-
33.2
China Merchants Securities Co
Industry Total 9,412
31*
41*
34*
38*
2,284.0
26*
6
Macquarie Group
Bank of America Merrill Lynch 26*
-84.4
205
-14
44.6
-21.1
UBS
Moelis & Co
58*
26*
21* 27 21
▲
▼
169.9
8Barclays 24*
▼-4 ▼
19* 2,595.4BNP Paribas SA
31* -1
▲
Evercore Partners
Raymond James Financial Inc45.5
19
20RBC Capital Markets
Baker Tilly International
463.0
15
226*
China International Capital Co24*
19
602.3 54
28
4518
-21 ▼ 3,670.5 -39.9▼18
Ernst & Young LLP
- -23.0
48.4
▲
21▲24.4
3
JP Morgan
Citi 16* 26 25 2 ▲
7
2,297.1 12
▲32.9▼ 37.7▲ 5,812.0
31 -3 -87.3-
9
25 ▼-78
12*
▲
10.2
▲
Deloitte 15 4 27 ▼
16
21* ▼-52.8 13
26*
75.3
104.3
5
Morgan Stanley
▼ 240.2
-21.2
.728
45.62,649.6 9▼
36.6
53.4
▼
▼3,799.6
-73.8
▲-
▼-31.0
30.51
12*
5
▼
2311
3,832.1
▼▲
-32
2265.0
Credit Suisse
▼ 830.8
41.215
19*
Jefferies LLC
71,759.9
2,053.1▲20
15▲177*
▲
▲
▲
38
-45
1
28
▼▲20
16.965.3
▲
7.840
Sumitomo Mitsui Finl Grp Inc
▲ 535.6
18.8
▼-14.8
-10.3 44519
2031
46.6-11
▼-
23.9
▼
36.6
29.7▼
52*37* 22
▲
34
1923
10 ▲▼
-
Houlihan Lokey
18
▼
▲
48.12114.7
1,208.2
89* 162*
60
61
99*
61.5
Worldwide Estimated Mid-Market Investment Banking Fees by Quarter*
35.1
28.0
82483*
https://www.thomsonone.com
6.4
▼-
▼
10.4
.1
-
0.0
▲
14.3
9.6 48
9.4
453*
7.5
17
▼-1915
15
-3 -
-
-5.1
41*
2 ▲12 412 12 ▲11 2 ▲11 -2
1.1 201* 100.05.8 71* 59.25.2 83* 100.016.3 30 47.2
.6 268* 66.7
463.7
Source: Thomson Reuters/Freeman Consulting
226.1 - -28.4 ▼1,558.2 24 135.8
49* 28.25.5 77* 100.09.4 49* 47.0
▲
-
-33 100.6
-7
0.0
68*
Piper Jaffray Cos
100.0
▲
45.3
5.3
14-
33
3.9.2
7.1
16519.3
-
1.6
41*
▲
13
34.2 - 34.2 ▲1,093.1 - -8.9 ▼1,853.9 18 4.4 ▲
- 587.9 ▲9.4 - 9.4 ▲
12
8 ▲13
Southwest Securities Co Ltd 38*
▲
*tie
100.0
100.0
2,815.0
100.0▲
▲14
▼
6415
39.1
34* 89*Daiwa Securities Group Inc
100.0
1,971.873*
First Quarter 2016 │ Mid-Market M&A Up To US$500m │ Financial Advisors
Worldwide Mid-Market Rankings (MM1)
100.0
93.35 1
-69.61,269.5
12 38 ▼-6 ▼39
-22 ▼ 1,743.0 21 17.8
2,092.8
1,326.6
3,903.8 354
19.9100.0
100.055.740.0
11 10 ▲
123.8 - -79.9 ▼170.9 - 124.3 ▲356.5 - -10.3 ▼
.9 243* 100.0
▼
▲
51.926.7
9
35.123*30.2
-63.3
224* 11
80*19
-62.9
▼
1,363.8
▲
-69.3
1,047.3
1,844.82
17
21
8.9
-
1,269.3
▼1
487.6
-
100.05.8 71* 100.011.4 38 100.0
53.1
-
16
15▲
31*
-9
24.6
100.0
12▲
28* -2
-1
39.9
19▲37*
2,883.3▲
91.1146.9
18
14
-3 ▼
5
▼
2,640.0 10▼-128*
45*35*
55.1
5.4
-22.5-29.8
▼
-62.0▼8
-13
▼
-
270.8
-23.96* 7*
Advisor 2016
Imputed Fees (US$m) †
40Fees Rank
Rank Value per Advisor (US$m)
Rank Value Rank Value2016Change in
4,533.9 2
MM1 - Undisclosed Values & Values up to US$500m
# of Deals per Advisor
Rank
40 -5
1Financial Advisor
KPMGDeals
6*32
71 -17.9Rank
17 ▼
PricewaterhouseCoopers 3 1
Mizuho Financial Group -1 ▼
2016
US$m
59
2015
Jan 1 - Mar 31
Exp (%)
** Fee
113.8
IMAP
111.8
16* 3
11.1# of Deals
2Rank
9
23* 3030
12*
5363.9
17
81.0
363.5
▲
13.4
Clairfield International 21*
7*
3,250.910.1
386* 19
-40▲
▼▼
6
-81.1
5 13*Lazard 4 11
30
1,274.0
103.7
▲
Goldman Sachs & CoGram Capital
-12
146
9.0
16*
▼ -
4 43.834.8
5
7Rothschild 254
Nomura 10*
22▼
▼
-67
1,915.5Change (%)
10*
-590
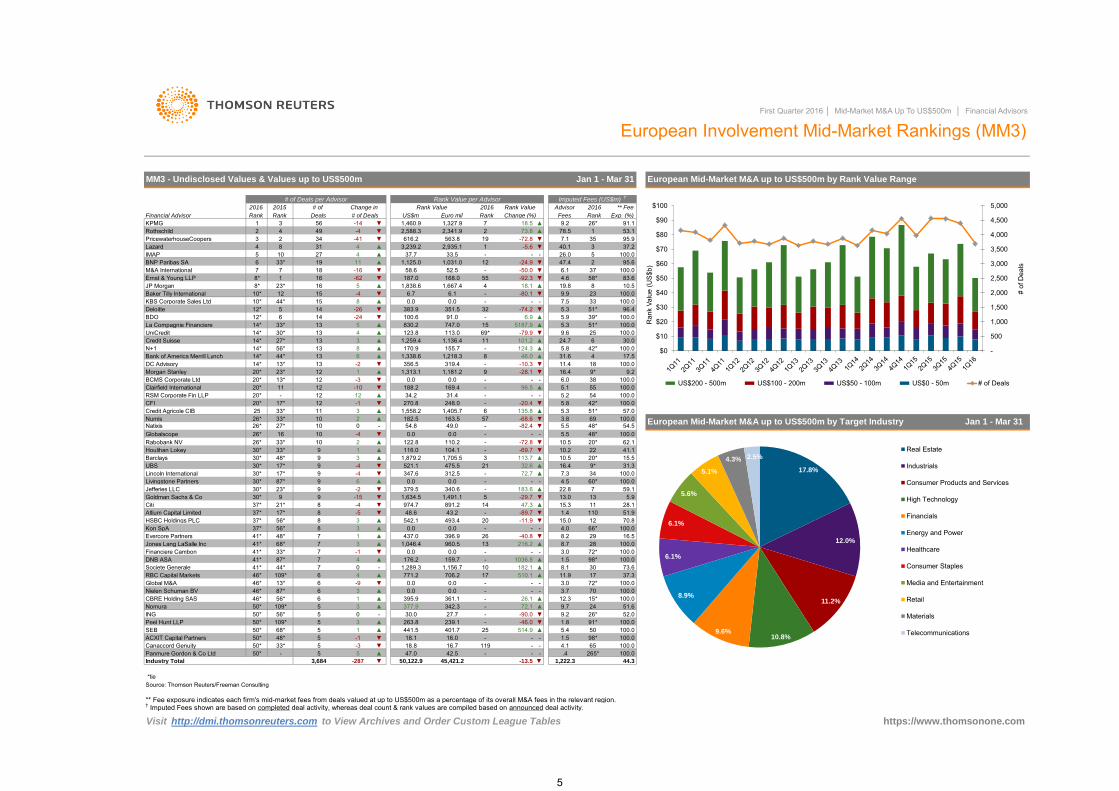
† Imputed Fees shown are based on completed deal activity, whereas deal count & rank values are compiled based on announced deal activity.** Fee exposure indicates each firm's mid-market fees from deals valued at up to US$500m as a percentage of its overall M&A fees in the relevant region.
GCA Savvian Group CorpMaxus Corporate Advisory Inc
68*114*41*58*73*
-68*49*52*
114*73*
# of
54.814.9
6
10
28.4
4
22.5 242
48.9 8263*
45.558
M&A International▲
11
41*41*41*47*47*47*50*50*50*50*50*50*
UniCreditN+1DC AdvisoryPlutus Consulting Co LtdCredit Agricole CIBRSM Corporate Fin LLPWells Fargo & CoHuatai Securities Co LtdBMO Capital MarketsLivingstone Partners
341*
-1 ▼11 6 ▲11 3
$0 $50 $100 $150 $200
2010
2011
2012
2013
2014
2015
2016
Rank Value (US$b)
Africa/Middle East Americas Asia-Pacific Europe Japan
0.0%
10.0%
20.0%
30.0%
40.0%
50.0%
60.0%
70.0%
$0
$1
$2
$3
$4
$5
1Q 2Q 3Q 4Q 1Q 2Q 3Q 4Q 1Q 2Q 3Q 4Q 1Q 2Q 3Q 4Q 1Q 2Q 3Q 4Q 1Q 2Q 3Q 4Q 1Q
2010 2011 2012 2013 2014 2015 2016
Per
cent
age
of T
otal
Fee
s
Inve
stm
ent B
anki
ng F
ees
(US
$b)
Mid-Market I.B. Fees ($500mil or less) % of Total Fees
2

410.013 ▲
2
4
Visit http://dmi.thomsonreuters.com to View Archives and Order Custom League Tables
-5 -
363.0
Financial Technology PartnersAlvarez & Marsal 36*Deloitte
Industry Total
2.1
▼
PNC Financial Services Group23* 6
-50.0
*tie
71* 4 2 ▲37* 4 -2
Clairfield International 22*
7* -4 36.0▲
102.0
▲
-62.2
96.3
8
37*
13.0
- 6
-
44
-
0.0AGC Partners 31* 37* -15
▼Citi
9
▼
▲
-8 ▼
-75.2
▲
9.0
19
166.7
20*Deutsche Bank
6
▼
6
0
▲
71* 24
9
185.0
Stephens Inc
Moelis & Co
Stifel/KBW
04
10
PricewaterhouseCoopers 22*
22*
21.3
-
-
26.3 9
.6
3*Morgan Stanley
4
▲
Evercore Partners 3* 19*
Piper Jaffray Cos
Rank
13*
▲
14
▼3*
2
100.0
Rank
13
2016
1
Rank Value
-
-32.9
0.0
133.7William Blair & Co
▼6
31*
-9 ▼
9
5
5
4
Lincoln International
The Braff Group 7
7*
40.4
318 23.7
37.5
Rank
12
Goldman Sachs & Co
7
16
11152.6▲
-
▲
-7 ▼
- -
819.3
96.9
1
Rank Value per Advisor (US$m)
▼
▲
-11* 1011* 16*
2,158.3
2
540.9-7
10
1
3,497.314
-8
# of Deals per Advisor
3*
Houlihan Lokey 20 ▲1,585.2
20162015
-21 ▼
▼
3
-5
46
763.8
-
1,588.3
▼
3.0
14
-
▲-
Fees
Imputed Fees (US$m) †
-2
14.1
1
-65.8
360.0
457.1 29
3.1
1,196.9
- - -4.8 36 82.8
107.9
22
5.73.0
-
63*2.0
-
6
36*
-3
-
0.06
36*36*
36*
31*
Cain Brothers Co.
31*
Rothschild 36*
22*
14* 24.9-60.5
Prairie Capital Advisors Inc
--
-
1722*
▲
▼▼-1 ▼
-
▲1,000.0
15.60.0 -
-13.644,580.0
- - 1.4 75*
69*100.062
57.0 -
26
20.4
First Quarter 2016 │ Mid-Market M&A Up To US$500m │ Financial Advisors
US Target Mid-Market Rankings (MM2)
63.3
3.0
1,131.0
-50.4
1,541.9
▼
100.0
16
100.0
37.4
7
18.3
7.8
16.8
13*
27.7
20.9
16.3 2316.8
101*
100.013*
29
63.6
4
100.026.4
3.6
27
38.112.4
100.0
2,159.4
-614
2
7
Jefferies LLC
JP Morgan
5*
21.9
24.159.5
Deals
158.7
1,873.62
3 ▲
# of
42.7
5
▲
Rank
-
1,567.7
Financial Advisor
Barclays
.5
79*
▲
Robert W Baird & Co Inc
11
20*
100.0
18*
15
1.2
US Mid-Market M&A up to US$500m by Rank Value Range
34.9
57.3
8.1
▼
▼
9 ▼
▼
-1
-2.7
1,208.2
▼
3*
▼
9*
▲
▼
463.0
Change (%)
48.9
Change in
# of Deals
6
Exp. (%)
Advisor 2016 ** Fee
US$m
▲
-77.00.04
UBS
3*
-
1.5
20*
6
19.8
85
6
658.9
32*
10
1,049.5
10.0
-15Credit Suisse
- 37*
19*
KPMG
32*
Wells Fargo & Co
823*
-36
▼
-0.022*
56.0▲
Cascadia Capital 36* - ▲
BMO Capital Markets
Duff & PhelpsBank of America Merrill Lynch
Lazard
16.7
11.3
-9
15
▼4
31*
Generational Equity
Oppenheimer Holdings Inc
28.3
2.0
3
7
▼
▼-
11*
-
-78.6
0.0
117*
43*
5*
▼
11*9 -13 ▼
36*
1,965
23*
14* 9*
▲- 4
-10
36* 43*
4
14*▼
1,582.716*20*
-63.4
-
14* 2
18* 9*
▲22*
-
22*
4.521.3
100.0
79.1
https://www.thomsonone.com
63*
52*34
12.1
100.0
29.7
24
US Mid-Market M&A up to US$500m by Target Industry
▼
56*
-2
27*
27*
43.74
16
342.0 37 -79.0 ▼ 24.4 10
37.8
100.026.8
20.4
▼
-▲
- -0.0
-
821.5
▼ 217.7
1113* 12
▲
-2
18 -32.1
41
32*
100.0
3.2
100.0
2.0 10.263*
106*.5
52*48*
▲
8
474.2 25
-
814.6
106*20.5
-1
32* -2
2
19
-
5 1,711.9
-
-
56*- 278.1
29.0
100.0▼ 47.2
3
▼
Macquarie Group
-24.812
▼
-▲
Jan 1 - Mar 31 22*
36*
453.7
-
27.5
100.0
16* 4 -8 ▼-4
500.0
15
-
36* 15 4
71*
--
50*
22* 32*
71* -0.04
100.050.0
▼
100.047.3
54.9
100.0
Raymond James Financial Inc
▼
-
-43.7
4
6
Chartwell Financial Advisory
RBC Capital Markets 9* 19*
Sandler O'Neill Partners
PJT Partners LP
† Imputed Fees shown are based on completed deal activity, whereas deal count & rank values are compiled based on announced deal activity.** Fee exposure indicates each firm's mid-market fees from deals valued at up to US$500m as a percentage of its overall M&A fees in the relevant region.
Source: Thomson Reuters/Freeman Consulting
▼
-
8
48.1
2
-
-
MM2 - Undisclosed Values & Values up to US$500m
▲
100.0
Jan 1 - Mar 31
11* -1 ▼14
▼463.7 - -2.2 ▼
100.0
100.0100.0-
-
-
20
0.0
0
11
Rank Value
Boenning & ScattergoodNeedham & Co LLC
-553
-
500
1,000
1,500
2,000
2,500
3,000
$0
$10
$20
$30
$40
$50
$60
$70
# of
Dea
ls
Ran
k Va
lue
(US$
b)
US$0 - 50m US$50 - 100m US$100 - 200m US$200 - 500m
15.0%
14.9%
14.4%
13.3%
9.8%
8.4%
7.5%
6.7%
4.7% 2.3%
Energy and Power
High Technology
Real Estate
Financials
Industrials
Consumer Products and Services
Healthcare
Media and Entertainment
Materials
Retail
Consumer Staples
Telecommunications
3

-2 ▼10* - -
255.0 6 86.8 ▲3* 1
Industry Total 231 -97
-3 ▼7* 1
▼Goldman Sachs & Co
Santander 16*Jefferies LLC 16* - 1 1 ▲
1 -5
Latin America Mid-Market M&A up to US$500m by Target Industry Jan 1 - Mar 31
0.0 10* -
37.0
-
--
3.4 01
-
110*
1
-
--
22
2.48.3
7* 312.3
1 55.6100.0
16*
-
2-
-
14
20*
.1
.5
16*
10*
▲
100.0
100.0100.0
- 10*-1
10*
Latin America Involvement Mid-Market Rankings (MM17)
MM17 - Undisclosed Values & Values up to US$500m
Clairfield International
Rank Value2016
64.3-
100.0
3*
3*3*
Morgan Stanley 7*
4▲
3
- 52.0
Change (%)Rank
320.9
5
4
100.0
2
4515.6
▲
-
First Quarter 2016 │ Mid-Market M&A Up To US$500m │ Financial Advisors
Fees
9.1
Latin America Mid-Market M&A up to US$500m by Rank Value Range
3*
Rank
1
Jan 1 - Mar 31
0 -2
▼
5.5
1
8
20.0
7
Artica Participacoes e Assesso 2 9
0
152
Arab Banking Corporation
Exp. (%)
** Fee
-▼
▼
▲
-
-
91.8
Advisor
4.510*
-
-
0.0
*tie
16*16*
-0.0 10* 100.0
100.0
.5
4.0.5
0.010*
0.0
2016
# of Deals per Advisor
8
▼
# of Deals
4
Rank Value per Advisor (US$m)
-44.6
7*
Rank Value# of 2016
▲
6.1
1.7
▲0.0
-
5.4
2
-- 3.9
1.0
-
0
▼
▲
-
PJT Partners LP
100.0
-
-
7
-4.5-
28.3
16*
2
100.02.0
▲
-
7*
16* 10*
84.6
Imputed Fees (US$m) †
100.0
2.0 16* 100.0
https://www.thomsonone.com
61.3
16* -1.5 16* 12.3
7
1
▲ 0.0
- .9▲
1
0
▲
** Fee exposure indicates each firm's mid-market fees from deals valued at up to US$500m as a percentage of its overall M&A fees in the relevant region.† Imputed Fees shown are based on completed deal activity, whereas deal count & rank values are compiled based on announced deal activity.
3,286.2 -29.8 ▼
20*
16*
95.0
Source: Thomson Reuters/Freeman Consulting
Lazard
1
3*
Financial Advisor
Banco BTG Pactual SA
-
Itau Unibanco 7
10*
10*
-9.3
5*
7*
2 ▲
7*
10*
2-2
Greenhill & Co, LLC
4
535.6
▼ 3
12*10*
▼
Change in
100.0
1.5
5*BR Partners
7*
7* 1 -
-
-8
-
-23*
0
27*
0.0
APOYO Consultoria SAC
12.3
10*
20*
20* 1
IGC Partners
Banco Bradesco SA
Credit Suisse
2
1 -0.0
▼
PricewaterhouseCoopers
165.9
7*
-4
-10*
Deals
1
3
Citi
16*
1
2
Rank Rank
10*
20*
1
10*
0
-
1.1
2
IMAP
BNP Paribas SA
JP Morgan
-
128.6▲
0.0
-
-
16*0.0
-M&A International
-0.07* 375.3
Rothschild0.0
16*
--3 ▼
▲
BBVA -1 0.01 10*
-
Moelis & Co
1.0
2
20.0
US$m
-
10*
0.03360.0
0.0
Visit http://dmi.thomsonreuters.com to View Archives and Order Custom League Tables
1
20*
10*
10*
▲
100.0
40.9100.00
5
12*9
5.3
- 23*1
2
0
2015
-
9 -
50
100
150
200
250
300
350
400
450
500
$0
$2
$4
$6
$8
$10
$12
$14
$16
$18
$20
# of
Dea
ls
Ran
k Va
lue
(US
$b)
US$200 - 500m US$100 - 200m US$50 - 100m US$0 - 50m # of Deals
26.1%
20.2%
13.3%
12.2%
10.6%
6.4%
6.1%
3.1%
Energy and Power
Financials
Consumer Staples
Materials
Industrials
Consumer Products and Services
Healthcare
Retail
High Technology
Telecommunications
Real Estate
4
Source: Thomson Reuters/Freeman Consulting
SEB 50* 68* 5 1 ▲ 441.5 401.7 25 514.9 ▲ 5.4 50 100.0ACXIT Capital Partners 50* 48* 5 -1 ▼ 18.1 16.0 - - - 1.5 98* 100.0Canaccord Genuity 50* 33* 5 -3 ▼ 18.8 16.7 119 - - 4.1 65 100.0Panmure Gordon & Co Ltd 50* - 5 5 ▲ 47.0 42.5 - - - .4 265* 100.0
*tie
▲
10
9 -28.1
▼
8
▼
1.4
42*
72.7-
▲0.0
47.3
9
-79.9
8
▲
17*
41* 48*
-4
16Globalscope
37*
26*
▲
Industry Total
UBS
Houlihan Lokey
68*
Goldman Sachs & Co
Barclays
13* 6 -9
4
30*
Credit Agricole CIB
▲
▼
▲
34
1
▲
Jan 1 - Mar 31
14
54.5100.0
100.0
21*
-
113.7
▲
8 3 ▲
30*
3
▲
▼13
188.2
11
17*
-287
100.07.3
31.334
159.7
347.6
5
70.8
▲
66*
1036.8
41*
48.6
▲
-2
Rank Exp. (%)
▲
10
3
European Mid-Market M&A up to US$500m by Rank Value Range
▲
99
-4
European Mid-Market M&A up to US$500m by Target Industry49.0
270.8 248.01,558.2
-
▼ --5 110
176.2
▲
100.0
First Quarter 2016 │ Mid-Market M&A Up To US$500m │ Financial Advisors
110.2
31.4
7.5
163.5
7
Jan 1 - Mar 31
15JP Morgan 8*
BNP Paribas SA 6 1119
58*
-20.45.2
▼ 16.4
11
42*
356.5 319.48
14*
▼
5
-
33*
12*
1
13
13*
KBS Corporate Sales Ltd
Change (%)
▲563.8
▼52.5
Advisor
1
216.2
0.0
41* -7
▼
1 -40.8
7
▲
Societe GeneraleRBC Capital MarketsGlobal M&A
▲
-13.5
5.9 39*5.3
-
Rank Value per Advisor
Rank Value
▼
Citi
41*
542.1 12
0.0 0.0 - - -
8.1
-46.0 ▼
41*46*46*
1,289.3 1,156.7 10 182.1 ▲771.2 706.2 17 510.1
▲56*
44.3
493.4
▲
- 26.15 3 ▲
37*
100.0
50,122.9
Financiere Cambon
Evercore Partners
5 0
98*
Visit http://dmi.thomsonreuters.com to View Archives and Order Custom League Tables
Livingstone Partners
437.0
HSBC Holdings PLC
14Altium Capital Limited
DNB ASA100.0
46* 87* 6 3 ▲56*
1.5
0.0
0.0
16.5100.0
72*-
- -395.9 361.1
3
Jones Lang LaSalle Inc 280.033*
87* 7
8.7
▲
Jefferies LLC
45,421.2▼
13
100.0
99
37*
29
-
▼
-
--
▲
▼
▼
-
0.0
974.7
4.0
11
-11,046.4
-4
21
960.5
48*
10
312.5
9
20*
26*
20*
▼
7
10.5
340.61,491.1
▲
33*
13.0
30
-117*
46*
3,684
2▼ -
▼
▼
56*
-82.4
-72.8
5.3
-3.8
-11.9
33*
8
30*
1,634.515.3
15.0
8.2
16.420*
17*
3.7 70
▼
37*13▼
30*9*9
9
104.1
475.5
3.0
396.9
▼
-4
3
-
12RSM Corporate Fin LLP
▲
-
▼
Rank
CFI
0.0
-
5.1
5.8
3
18
3 51*
14*
-62
100.0
96.5-
135.8
Lazard
12
5.824.7101.2
7
4
16
6
1,031.0
26*
La Compagnie Financiere6.9
-72.8 ▼
▲12
** Fee
95.6
6
100.0
44*
747.0
-74.2
124.314*
-80.1
155.7
100.0
100.0
1,838.683.6
33.5
▼-92.38
37.712
25
6.7
351.5
226.0
Credit Suisse
DC Advisory
▲
30.0
5
-41 ▼49
46.0-10.3
7.1
▲
1,125.0
55
383.9100.6
▼
▲
20162016
Financial Advisor
2016
0.0 0.0
-
21
-
Deals
PricewaterhouseCoopers
100.0
▲
2
1216
-26
78.5
-5.6
6
5
33
9*
4
1,181.2
4
13
▼
▼
2015
MM3 - Undisclosed Values & Values up to US$500m
91.1
8*
8
▲
Rothschild
# of Deals
Imputed Fees (US$m) †
Fees
3 56
▼
100.0
2310.5
18.5
1,259.4 1,136.4UniCredit
23*100.0
18.1
192
Baker Tilly International
-2
3,239.2
6.1
▲
15.532.6
- 62.122
https://www.thomsonone.com
40.1
0.0
Nomura
▲-10-3 38
Ernst & Young LLP
BDO
-▼
▼34.2-
37.33.0 72* 100.0
342.3 - 72.1 ▲30.0 27.7 - -90.0 ▼
263.8 239.1 -
6
55
Rank
KPMG
M&A International
Natixis572
6.1
9.6
27 -
▲
▲
-
▼47.4
▼
Clairfield International
Bank of America Merrill Lynch
27* 13
12
100.0
-24
20
1,667.4
8
▼
▲
5.3
0
1,338.6
183.6
-69.7
33*
20*13
14
10*
Kon SpA
54.80.0
▼
-16
▲
11.4
73.8
4
▼
1,218.3
123.8
4
18
13
5.5
170.9
14*
95.935
Rabobank NV
37.2IMAP
N+1 14* 56*▲
4
100.0
100.069
Deloitte
23* 5
31.6
12*15
8
13*Morgan Stanley
▲
7
32
57.0
12
-
54
100.012.3 15* 100.09.7 24 51.69.2 26* 52.01.8 91* 100.0
-109* 5 3 ▲
377.950*INGPeel Hunt LLP
56*
† Imputed Fees shown are based on completed deal activity, whereas deal count & rank values are compiled based on announced deal activity.** Fee exposure indicates each firm's mid-market fees from deals valued at up to US$500m as a percentage of its overall M&A fees in the relevant region.
1,222.3
50*50*
0.0 0.0 -
73.611.9 17
Numis
Nielen Schuman BVCBRE Holding SAS
US$m
1 ▲109*
9.2
-
-1,313.1
Rank Value
10*
Euro mil
1,460.9
830.2
1,327.92,588.3 2,341.9616.2
2,935.1
168.0
9.9
43.2
1,879.2 1,705.5 ▲521.1
44* 7 0 -
-89.7
# of Deals per Advisor
# of Change in
4
Rank
31-
-14
BCMS Corporate Ltd
51*
European Involvement Mid-Market Rankings (MM3)
Lincoln International
-24.9
100.0
-
96.4
-0.0169.4
91.0
374.619.8
▲51*15
69*11
53.1
122.8
-
10.2-
5.9
41.1
9.2
48*
100.017.5
5187.9
▼
100.0-
51.9
-
▲
-50.0
113.0
187.058.6
10.5
3
▼
1,405.7-68.6
20*-
60*-
▼
48*
6
6.0-
5.5
22.8
116.0
4.5379.5 -
-29.7
▼182.5
28.1
59.1
109* 6 4 ▲▼
20*
120*
12
44*
14* 30*
▼
-4
5
26
891.2
26* 33*
30*
1027*
25
30* 23*
26*
87*
-15
-4
33* 1 ▲30*
6
10
37
-
500
1,000
1,500
2,000
2,500
3,000
3,500
4,000
4,500
5,000
$0
$10
$20
$30
$40
$50
$60
$70
$80
$90
$100
# of
Dea
ls
Ran
k Va
lue
(US
$b)
US$200 - 500m US$100 - 200m US$50 - 100m US$0 - 50m # of Deals
17.8%
12.0%
11.2%
10.8% 9.6%
8.9%
6.1%
6.1%
5.6%
5.1%
4.3% 2.5% Real Estate
Industrials
Consumer Products and Services
High Technology
Financials
Energy and Power
Healthcare
Consumer Staples
Media and Entertainment
Retail
Materials
Telecommunications
5

** Fee exposure indicates each firm's mid-market fees from deals valued at up to US$500m as a percentage of its overall M&A fees in the relevant region.
34* 7* 3 -9 ▼ 313.6 217.5 15* -75.5 ▼ 8.0 11* 4.6
0▲17*
▲
▲
▼
4 ▲
-
17.1
4
-
Houlihan Lokey
CFI
Rank
11
12
RBC Capital Markets
Ernst & Young LLP
2
885
WH Ireland Ltd
PricewaterhouseCoopers
Clairfield International
Bank of America Merrill Lynch
JP Morgan
Peel Hunt LLP
Lazard
Numis
M&A International
KBS Corporate Sales Ltd
▼
--
Rank Value Rank Value
4▲
▲511.6
33.7
25
11
-
-
399.2
0.9▼
44*
8
0.0
▼
6
-68.6
4*
2
▲
▼- -
.1
-
-
44*
72*
** Fee
-
HSBC Holdings PLC
▼15.6
-
Deals
0.0
-
1
5
8
303.2
205.4
https://www.thomsonone.com
424*
-96.4
FTI Consulting Inc
Catalyst Corporate Finance24*
2
Barclays 9.8
80*.5
Jan 1 - Mar 31
▼
# of Deals per Advisor
DC Advisory
RSM Corporate Fin LLP
Industry Total
KPMG
9*
--
BDO
-84.7
44*
12
-21.2
913.4
28*1
-
24*
12.1
4
▲3100.0▲
-
4
-3
100.0
▲
463.3
843.8
5
-
28*
-
5
17*
8.1 5.7
-
100.08.3100.0
100.0
0.0
-
-21.7-1.8
.4
100.0
37.4
568.4
-
2.3
▲
-104
1.4
100.0
24*
25*
3
4 4
UK Mid-Market M&A up to US$500m by Target Industry Jan 1 - Mar 31
100.0
72*
Visit http://dmi.thomsonreuters.com to View Archives and Order Custom League Tables
Societe Generale 34* - 3 3 ▲ 737.6 510.3 5 - - 5.0 22* 100.0William Blair & Co 34* 72* 3 2 ▲ 115.9 79.5 - - - 6.2 17 100.0Goldman Sachs & Co
44*
100.0
613.4
23 - -
231.3.5 80* 100.0
-37.90.0 0.0
0.0
- -23.0237.0 165.7 21
42.55*
25*-
-220.0 150.8
17,786.0
- -85.1 ▼277.6 17 -16.1 ▼231.5 161.9 22 -44.1 ▼127.0 89.9
327.0
2.2 43* 100.08.9 9
6*
47.0
▲ ▼
▲
17*
72*
100.0
Fees
116*
1.7
11.9-
5.2-68.6
4
BCMS Corporate Ltd
8
216.9
-26.5
9*
Baker Tilly International 3* 6
6
2*
13*44*10*
14.9▼
Evercore Partners
1 ▼
72.1
437.0
55*38
† Imputed Fees shown are based on completed deal activity, whereas deal count & rank values are compiled based on announced deal activity.
50
▲
▲ 54
1.33.3 -24*
24*finnCap Ltd 2.8
12.65.8
3IMAP
25*
521.511
MM4 - Undisclosed Values & Values up to US$500m
▼
250.1 175.0 4.5▲
3
1
10
-64.4
First Quarter 2016 │ Mid-Market M&A Up To US$500m │ Financial Advisors
.8
▼
46.4
1
▲▲1
182.5 128.60.0
25*
-
5
5
▲ -28.6
738.9
423.2
19.3
-46.66.4
10
US$m
43.011
-
12
5
89.9
122*
▼
6
▲Change (%)
-46.0
-3
13
24*
10
14.9
1 22.5
59*100.0
Change in
13*
2.2
2.315.6
0.0 -
1.2 3.2
2016
7*85.6
0.0610.7
17*
3.9
60.7
34
3
100.0100.0
10
0.0
GBP mil
351.2 242.123.6
2015
-
22*
4.2
43*
9*
▼
6*
9
▼
9
4*
7.5
100.0
36.9
Credit Suisse
Rank Value per Advisor
Financial Advisor
100.0# of Deals
Imputed Fees (US$m) †
7.5
1
▲
34.2Rothschild
# of
6.0 1916.0
-
▲
15*
Rank
47*
31
21
-
-
-16-4
12*
UK Involvement Mid-Market Rankings (MM4)
14
Advisor2016
39
6
2
41*4
32.3
10*7.7
3*
-Rank
1517*
8.0
▲
Rank
-
11*
-9
13*13*
▼
-9.7
241.2
UK Mid-Market M&A up to US$500m by Rank Value Range
10
100.0
49
Panmure Gordon & Co Ltd
--
1
4.5
1,112.1
0.0
6583.9-
30.4
0.0
17*
775.3
-
2016
3
-
270.1
100.0
100.0
100.0
-
-8
100.02.579*
▲
Exp. (%)
91.7
17*
100.0
850.0
235*17* 5
356.5
▲
-9
▼
13* 2.0
8.1
100.0
24*
▼ 0.0
12,391.4
9.9 5* 53.5
-1 ▼
*tie
Source: Thomson Reuters/Freeman Consulting
12
263.8
234.3
7▲
-
9.9
0.0
▲
8 ▼
Altium Capital Limited
22.4
27.8
17* 44*Livingstone Partners
9.7
4
100.04
7-
24*
14 343.1 ▲31.3 21.9
▲
-
33.1127.0
202 57.6
0.0
▲▼▲▼
4
▲
5
-13
▼19
149.6
364.6
-
▲▼▲▲▲ 0.0 0.0 - - -
▲
▼
34*34*34*34*
-▲▲
30.6 21.2
195.2
▲
4 876.7
184.4
17*
3*
3
2
▼6*
- - -0.0 - - -
34*34*34*
246.3
4
-
7.8 5.4
-
▲▼-
3 272* 3 235* 3 0
-134.1 95.0 -
0.0
Jefferies LLCInvestecJones Lang LaSalle IncMorgan StanleyUBSCenkos Securities PLCLincoln InternationalNatixisN+1GP Bullhound LtdCitiLEK Consulting IncGroupe BPCESpencer House Partners LLPDeloitteSmith Square Partners LLP
10* 4 -572* 3 228* 3 -144* 3 128* 3
24*34*34*34*34*34*
- 3 3
34*34* 3 3
72* 3 2
34*
17* 3 -435* 3 0
-1- 3 3
28* 3 -172* 3 272*
20 22.51.3 55* 100.04.3 30 100.01.5 52* 100.0.3 119* 100.0
1.0 62* 100.04.0 33 31.5
76* 77.8.5 80* 100.0
- 1.0 62* 100.01.0 62* 100.0- - -.7
▼
▼-
0.0 - - -0.0 0.0 - - -20.5 14.0 58 -98.1 ▼
131.2 92.3 - 36.8 ▲
- -
-
200
400
600
800
1,000
1,200
$0
$5
$10
$15
$20
$25
$30
$35
$40
# of
Dea
ls
Ran
k Va
lue
(US
$b)
US$200 - 500m US$100 - 200m US$50 - 100m US$0 - 50m # of Deals
24.6%
13.4%
11.6% 10.7%
9.6%
9.2%
7.1%
4.3%
3.3% 3.1%
3.0% Real Estate
Financials
High Technology
Industrials
Consumer Products and Services
Consumer Staples
Energy and Power
Retail
Materials
Healthcare
Media and Entertainment
Telecommunications
6
14*
14*
# of Deals per Advisor
▲
4
46*
▲
† Imputed Fees shown are based on completed deal activity, whereas deal count & rank values are compiled based on announced deal activity.
Source: Thomson Reuters/Freeman Consulting
171.70.0
Bryan Garnier & Co
3
20*.5
▲
▲
Clipperton Finance SARL
-3
0
1
▲
-
Philippe Villin Conseil
0.0
8
9*
9*
108.8
-
2.0
-
55*
Rank
1
-
1
-3
3.0
7
10
-Lincoln International
13*
49.0
6.6
Natixis
# of
▼
Societe Generale 14.9
Euro mil
3
26
4
▲7
320* 1
127.6
.9
100.0
-99.410
232.5
5 ▼▲
14*
4
1.3
CM-CIC Conseil SAS
162*
13
0.0
-
First Quarter 2016 │ Mid-Market M&A Up To US$500m │ Financial Advisors
218.1
6
1,405.7
-
2*32.4
0.0
312
.6
.9
56*
100.0
0.0
69.1
51.8
100.0
Rank
8*
91.0
16
0.0
▲
6
▲
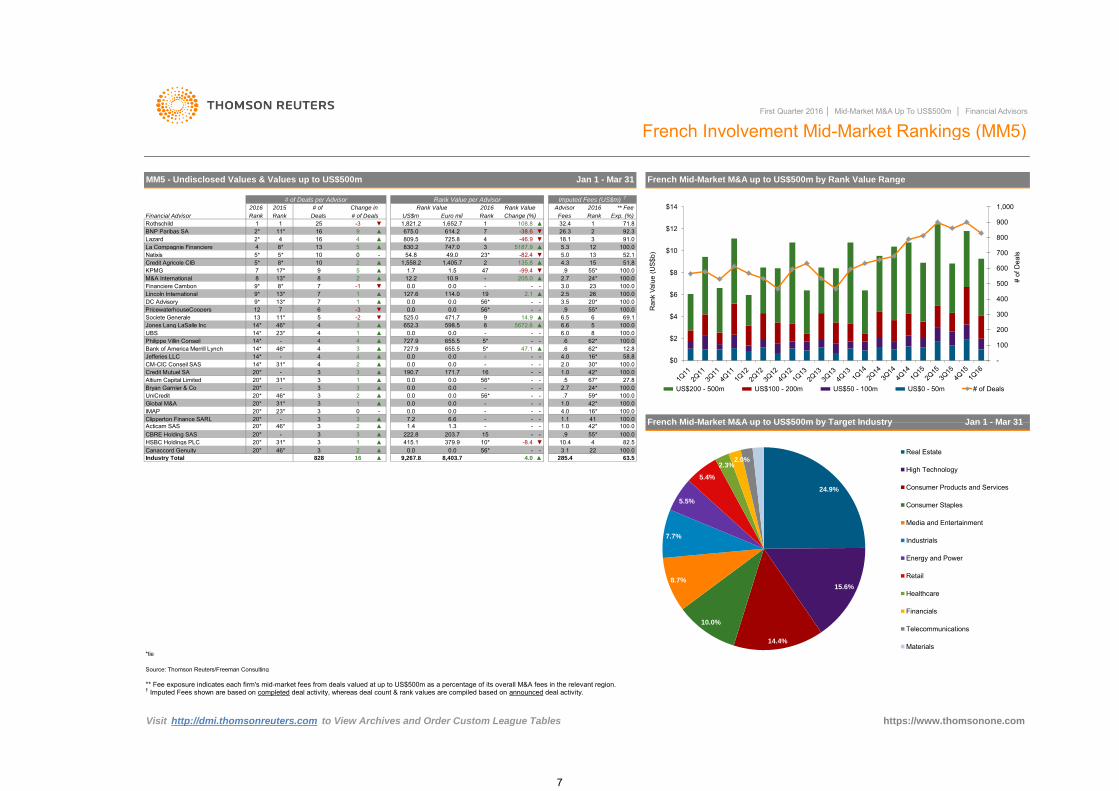
MM5 - Undisclosed Values & Values up to US$500m
3.1
▼
-
French Involvement Mid-Market Rankings (MM5)
Advisor 20162016 Rank Value ** Fee
French Mid-Market M&A up to US$500m by Rank Value Range
20*3
14*
-1
▼
7
71.8
▲
Visit http://dmi.thomsonreuters.com to View Archives and Order Custom League Tables
0.0
▲23*
Jefferies LLC
190.720*
9,267.8
4
1
1.0-
1.1
24*
Rank Value per Advisor
-0.0
0.0.65*
42*56*
100.0
92.3
228,403.7 4.0▲
-▲
3 2 0.0 0.0379.9
0.0
19 2.1
13
▲
▲
-
56*
20*
100.0
.9
-
20* 3- 1.0
31*
100.0
203.7
56* - -
100.0
6.6 41
UniCredit
Canaccord Genuity
-
0.0
5
▲1
59*3
IMAP
*tie
French Mid-Market M&A up to US$500m by Target Industry Jan 1 - Mar 31
Global M&A
82.54
0.0727.9▲
598.5
9*
4
https://www.thomsonone.com
-
-
▼
5.0
7
100.0Acticam SAS
10.9
2
100.0
52.1
12.2
26.3
Change (%)
3 5187.9
▲Lazard 16
1,821.2
Jan 1 - Mar 31
809.5 725.8 4
Change in
-46.9-38.6
2
614.2675.0
747.0830.2
▲
▼47
-
0.0▼
5*
▲
▲
138*
6.5
100.0100.0
135.8
205.0
1
2.7
▼
-82.4
0.0 0.0
11*
13*
4
5*
9
5-
1
2015
0.0
652.3▲
-
11*
14*
0
- - 42*
8
3
-
23*
655.5
46* 3 0.0
4 16*
8
3
-220*
2
42*
1.4
8*
▲
20*
98
20* -
2.7
20*▲ 7.23
100.0100.0
▲
3
100.010.4▼415.1
16
CBRE Holding SAS
0.0
285.4
12
63.5
3
15 -
30*
67*
3
20*
-
46*
-
▲
100.0
24*
-
▲
3
DC Advisory
727.9 655.5
100.0
-
Fees
7
Rothschild
Industry Total 828
-
6.04
- -
14*
3
10* -8.4
-
3 ▲ 0.0
▲
12.8Bank of America Merrill Lynch
97
46*
-
Altium Capital Limited
▲Credit Agricole CIB
Financial Advisor
UBS
4.0
▲ 222.8
Financiere Cambon
1.0
20*
▲47.1
23*5*
-Credit Mutuel SA
0.0
31*
46*
4
Deals
1
-2
54.8
471.7
1,652.7
5*15
Imputed Fees (US$m) †
Rank Value
4.3
US$m
BNP Paribas SA
La Compagnie Financiere
100.0
5.3
31*
2 ▲
0.04
-
PricewaterhouseCoopers
114.0
1,558.2
62*
▲Jones Lang LaSalle Inc
KPMG
HSBC Holdings PLC
M&A International
2016
Rank # of Deals
17*13*
31* 1
4
25
** Fee exposure indicates each firm's mid-market fees from deals valued at up to US$500m as a percentage of its overall M&A fees in the relevant region.
Exp. (%)
21.7 1.5
27.8
5
-
55*
-
3.5
16* 100.0
100.0
58.84.0
- - -
56* - -
5672.6
100.0
62*
525.0
0.0-
--
55*-
Rank
.7
-
-
-
100
200
300
400
500
600
700
800
900
1,000
$0
$2
$4
$6
$8
$10
$12
$14
# of
Dea
ls
Ran
k Va
lue
(US
$b)
US$200 - 500m US$100 - 200m US$50 - 100m US$0 - 50m # of Deals
24.9%
15.6%
14.4%
10.0%
8.7%
7.7%
5.5%
5.4%
2.3% 2.0%
Real Estate
High Technology
Consumer Products and Services
Consumer Staples
Media and Entertainment
Industrials
Energy and Power
Retail
Healthcare
Financials
Telecommunications
Materials
7

Altium Capital Limited-
GP Bullhound Ltd
0.0 --
100.0
15.3
14*
-
17.9
15.2
100.0
14*-
6,912.0
-2
2ABN AMRO BankDeloitte
perspektiv GmbH.7
29*
Goldman Sachs & Co
-
488.0 2
Bank of America Merrill Lynch
3*
▼-2
▲
# of Deals per Advisor
2015
Financial Advisor
23*
▲
Rank
3
Deals
3*
1
8
4
Concentro Management AG
1*
5*
11*120.1
28
2.0
14*29*
42*
0.0
454.5
-
362.2
-14* -
14*14* 8*
.5
▲ 0.0 0.0123*2
-
0
100.0
10.02.0
.2
-
23*
40* ▲
-
38
29*-
▼
1.5
-
5*806.7
140.0
8.8
21*
20162016 # of
Exp. (%)Fees
IMAP
-3
421*
10*
▲
Advisor
Imputed Fees (US$m) †
Change (%)
5
Rank Value
Rank
1*Rothschild
Rank
6.8
Change in
Lazard
PricewaterhouseCoopers
14*
14*
14* 40*
** Fee exposure indicates each firm's mid-market fees from deals valued at up to US$500m as a percentage of its overall M&A fees in the relevant region.† Imputed Fees shown are based on completed deal activity, whereas deal count & rank values are compiled based on announced deal activity.
21* 1.0
21*
-26.0
Clairfield International
Credit Agricole CIBAllert & Co GmbH
100.0
10
21*
125.0
0.0
Rank Value
-
100.0
100.0
-1
IEG-Investment Banking
-64.9
Rank
-
23*
10*
- 100.0
-
.521*
14*
18
415.0
39
-
100.0
100.0100.0
100.0
-
JP Morgan21*Globalscope
10.0 20 19
.81.5
1.2▲
4
3.4
40.5
1.0
-
1
-
20*
1.7
▼
100.0
Jan 1 - Mar 31
Rank Value per Advisor
MM6 - Undisclosed Values & Values up to US$500m
5*US$m
ACXIT Capital Partners
4
-
3 0.0-
▼8*
28.7Mummert & Company
--
0.0
100.0
** Fee
5*
3
71
▼-
21*
-
German Mid-Market M&A up to US$500m by Target Industry Jan 1 - Mar 31
First Quarter 2016 │ Mid-Market M&A Up To US$500m │ Financial Advisors
Global M&A36.0
15*
0.0
▲▼
909.4
0.0
0.0
10*33.0
14*
German Mid-Market M&A up to US$500m by Rank Value Range
21*0.0
0.0-
-4
1 ▲
0.0
100.0
73*
▲2.5
3.4134.0
10*
3
20*-
5*14*
7324.0
-12
20
0.0
21*0.0
-
459.4 419.5
German Involvement Mid-Market Rankings (MM6)
1.0
11.0
-100.0
3▲
21*
-
KPMG
11*
- 4
# of Deals
2016
15 -65.5
▲
2
2208.1
21*
324.6
0.0
0 -
-2 0.0
13-4
4
18.1 16.0
2.5▲
-
31.3
1
-
0.0
▼
-
110.6 ▼
1
▼
▲
0.0
3
4
Source: Thomson Reuters/Freeman Consulting
19BDO 11*
529.5
5*
--
-21*2
46.7468Industry Total 163.7
▼
▼
-
0.0-
100.0
100.0100.0
3* 43.9
5*
20*
▲
836.3
1.5
3.4
2
BNP Paribas SA
-42*
23*
0.0 0.0
10* 23*
-3
.4
2
3
Commerzbank AG
-3*
*tie
https://www.thomsonone.com
-▲
-
-110 ▼
-▼
0.02 -1
2 ▼
2
Visit http://dmi.thomsonreuters.com to View Archives and Order Custom League Tables
100.0
0.040*
UniCredit
-45.4
23*
10* 3*
3*
14*
0.0
3
Euro mil
5.0459.48 419.5
0.0
-
5*
15*
▲
2
8*
▼
14*
2
3*5* ▲
15*
2
14* 40* 121
2
5
-
16.5
6,288.9
-
100
200
300
400
500
600
700
$0
$2
$4
$6
$8
$10
$12
# of
Dea
ls
Ran
k Va
lue
(US
$b)
US$200 - 500m US$100 - 200m US$50 - 100m US$0 - 50m # of Deals
34.0%
19.7% 10.5%
8.6%
6.8%
5.1%
4.3%
4.2%
2.8% 2.2% Real Estate
Industrials
High Technology
Healthcare
Telecommunications
Financials
Materials
Energy and Power
Retail
Media and Entertainment
Consumer Products and Services
Consumer Staples
8
*tie
▼ 2.0 16* 100.0Jefferies LLC 23* - 1 1 ▲Societe Generale 23* 22* 1 0 -
0.0 0.0 - - - .5 31* 100.028.6 25.3 23* - - - - -28.6 25.3 23* - - - - -0.0 0.0 - - - .5 31* 100.00.0 0.0 - - - .5 31* 100.00.0 0.0 - - - - - -
361.0 325.0 10* -20.3
- 1 1 ▲Kobo Capital Ltd 23* - 1 1 ▲Savio & Partners 23* - 1 1 ▲Aquin & Cie AG 23* - 1 1 ▲
Philippe Villin Conseil
3
1-
0.0 28*
-
3
18.7
100.0
-
100.0
25*
Rank Value per Advisor# of Deals per Advisor
10
22
70.0
▼
Deals
4
361.08
4*
91.5
8.33.1
▼23* - 1Unione di Banche Italiane Scpa
.5 100.0
140.0100.0
93.7
103.3 17 - -19.0 17.5 25 61.0 ▲0.0 0.0
88.3
22*88.3
0.0
-2*
12
13162.1
- -
11
25*
-
2015
-
-78.5
2*
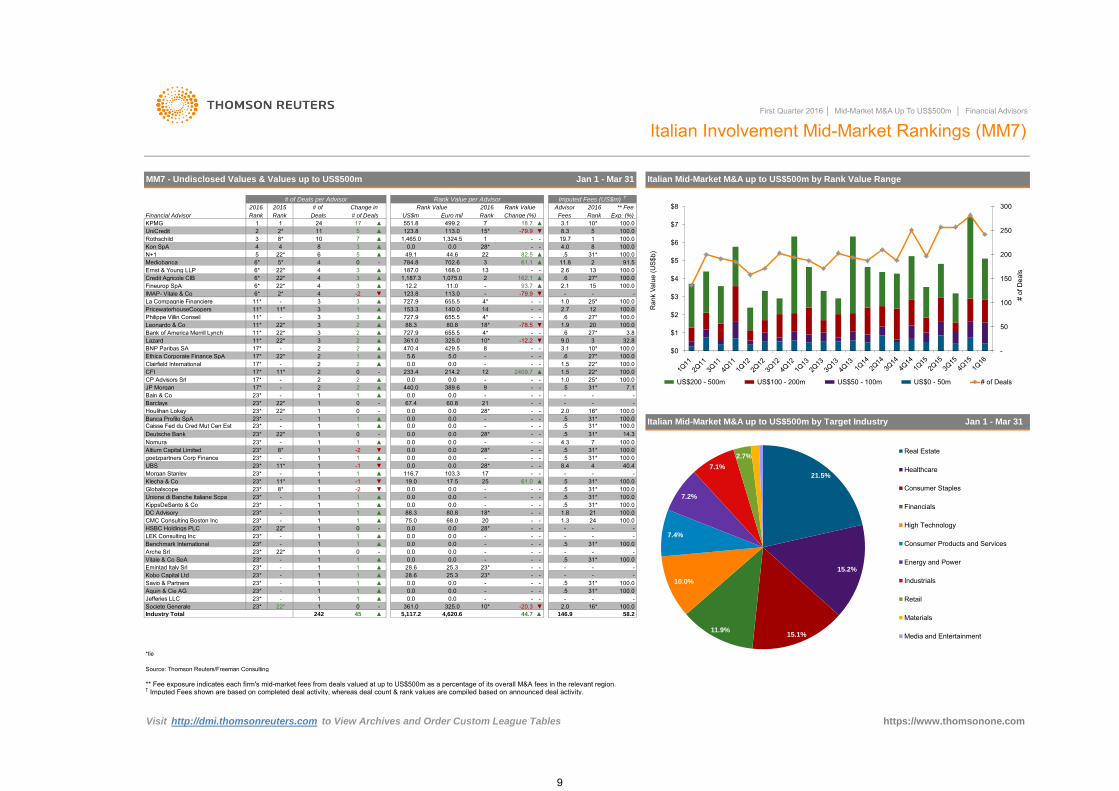
Italian Involvement Mid-Market Rankings (MM7)
-116.7
15*
655.5
-
0.0
Visit http://dmi.thomsonreuters.com to View Archives and Order Custom League Tables
5
▲
** Fee
19.728* 100.0
2016
# of Deals Change (%)
551.8
1,324.5
7
-▼
Rank Value
Rank
▲Euro mil
▲KPMGUniCredit
HSBC Holdings PLC
23* -
LEK Consulting IncBenchmark InternationalArche Srl
Deutsche Bank
- - -
--
27*3
Bank of America Merrill Lynch
PricewaterhouseCoopersLa Compagnie Financiere
-9.0.62
3.1
-153.3
2
-0.0 0.0 -
2016Rank Value
Leonardo & Co
27*
3.8
-
First Quarter 2016 │ Mid-Market M&A Up To US$500m │ Financial Advisors
Italian Mid-Market M&A up to US$500m by Rank Value Range
Fineurop SpAIMAP- Vitale & Co
27*
655.5
187.0 168.0
31*
15
Fees
▲8
-
1
-1 ▼
- 31*
4
Globalscope
Jan 1 - Mar 31
0.0 0.0
▲
CP Advisors Srl
22* -
214.2
0.0
.5 31* 100.0- - -
Ethica Corporate Finance SpAClairfield International
JP Morgan
0.0 0.0 - - -
-12.2
- -
23*
- -
0.01 ▲
45
▲ 80.8
BNP Paribas SA
146.9
-
100.0
0.0 0.0
1
Houlihan Lokey
2 0.0
31*
Vitale & Co SpA 23* - 1 1 ▲Emintad Italy Srl 23*
-
100.0
▲0
0.0
1
1
-
-
1 ▲
-
233.4
10*
0.0
100.01 -
21 100.0KippsDeSanto & Co
▲
23*23*23*
- -
Lazard
-
100.00.0 -
44.7 ▲
2
goetzpartners Corp Finance
-
▲
-
16*
22*
https://www.thomsonone.com
11* 1
-2
31*.5
27*
- - -.5
1 ▲
0.0CFI
Bain & Co
31*
-31*
.5
0.0 -
7.1
1 0Caisse Fed du Cred Mut Cen Est 23* -
Altium Capital Limited 23* 8* 28* - - .5
1.3-
- -
▼
11*
3
.5
▼
12 22*1.5
22*
22*
8* 1
5.0
1.02
▲
2
-
4*
1
Nomura0.0
-0.0
7
-9
2.7
-
1,465.0
727.9
.6
12.2 11.01,187.3 1,075.0
Italian Mid-Market M&A up to US$500m by Target Industry
0.0 0.0 -
58.2242
DC Advisory 23* -
-
0.0
40.4
-
.5
Klecha & Co 23*
18* - -
4,620.6
14.30.0
Barclays -0.0-
UBS 23* 11* 1 -1 ▼Morgan Stanley 23* - 1
8.4
** Fee exposure indicates each firm's mid-market fees from deals valued at up to US$500m as a percentage of its overall M&A fees in the relevant region.
Source: Thomson Reuters/Freeman Consulting
31*--
10.0
4.3
-100.0
31* 100.0.5 31* 100.0.5 31* 100.0
1.8
Industry Total
Banca Profilo SpA
100.0
23*CMC Consulting Boston Inc 24 100.0- -
100.0
28*
1
0.0
160.8
2.00
.5
1 ▲23* - 1 1
-
▲
4
▲123.8 113.0
18*3
11*
499.2
Change in
245
3
5,117.2
-
-223*
-
23*
▲1
† Imputed Fees shown are based on completed deal activity, whereas deal count & rank values are compiled based on announced deal activity.
3 --
17*
11* ▲▲
N+1
100.0
▲
2.6
4
100.0
5.6
14▲
- 100.0-
▲
Rank
-
727.9
6*
61.1
11*
3
22*
11*
444
8
3
22*
1
MM7 - Undisclosed Values & Values up to US$500m
10*Financial Advisor
1.9
Mediobanca
Credit Agricole CIB
Kon SpA
702.613
2
123.8 113.0
Rank
Rothschild
1
.6
6*1.0
100.0
22*
-
5*
▲
3
2▲
3
17*
1 0 -
0.0
23*
23*
-
- -
0.0
0.0 .5 31* 100.0- 100.01 1
100.0
11*
23*
17*
17*
-
-
▲
23*
67.4
22* 0.0
100.0
Ernst & Young LLP
5
3
-
-
202 80.8
56
17*
727.9 -
▼
-
▲ 49.1
100.0
389.6
17*
10*
1
- .6
32
28* -
-
11*
6*
6*
1 ▲22* 1 0 -
- 1 1
22*
Imputed Fees (US$m) †
▲
11.8 2
-
-2
2
▲1
Advisor
-
100.0
82.5-
4.0
100.0
-
Rank
▲ 32.8▲
44.6
-
22*
▼
-
784.8
▲
-0.0 0.0 28* -
-
- -0.0
1
▲▲
3655.5
8*
17
-
2
Exp. (%)
Jan 1 - Mar 31
1.5
1 0 -
75.0 68.0 20 -
2016
2.1
-
-79.94
325.0470.4
100.0
23*
3
US$m
# of
▲
-1
4*
▲ 429.52 -
22*
-79.9
-11*
2-
6*0
440.0
21
2409.72-
▲- 1 1 ▲
22*
-
50
100
150
200
250
300
$0
$1
$2
$3
$4
$5
$6
$7
$8
# of
Dea
ls
Ran
k Va
lue
(US
$b)
US$200 - 500m US$100 - 200m US$50 - 100m US$0 - 50m # of Deals
21.5%
15.2%
15.1% 11.9%
10.0%
7.4%
7.2%
7.1%
2.7% Real Estate
Healthcare
Consumer Staples
Financials
High Technology
Consumer Products and Services
Energy and Power
Industrials
Retail
Materials
Media and Entertainment
9

0
2016
-- 1 1 ▲- 1 1 ▲
11*
100.0
16*
-
12*12*
110* -
.5
10*
-
-5*
-
-
330.7 302.8
Rank
0 0
0
.5 23*
-0 0 10* - -0 0
0
16*10*
00
▲
-
2,222.9
Advisor
13-
77.2 71.0 5 -80.5 ▼0 0
10* - -0 0 10* -
12*
1.6
12* 0 10* - -
0
100.0
Lazard
8
▲
91.3
5*
100.0
5*-
Visit http://dmi.thomsonreuters.com to View Archives and Order Custom League Tables
.5
-100.0
0
.6
100.0
-
3.4 6
- -
-98 69.9
- 1
Spanish Mid-Market M&A up to US$500m by Target Industry
01
0
610*
-
Jan 1 - Mar 31
30.51.0
--
155
-
0
1 ▲14* 1 0 -
▼
.5 23*
100.012*12*12*12*12*12*
-
1 -1 ▼-
Cushman & Wakefield IncBanco BTG Pactual SACredit Agricole CIB
† Imputed Fees shown are based on completed deal activity, whereas deal count & rank values are compiled based on announced deal activity.** Fee exposure indicates each firm's mid-market fees from deals valued at up to US$500m as a percentage of its overall M&A fees in the relevant region.
Citi
1 1 ▲Needham & Co LLCVitale & Co SpA
5-
https://www.thomsonone.com
100.0
-
1
12*
12*
-44.92,445.2
BCMS Corporate Ltd
100.0
14*-
-▲
-2
10*
43.13
Rank Value
296.0
10*
51*
2015
100.0.5 23* 100.0
JP MorganM&A International
Santander
-
1
-
0
Spanish Mid-Market M&A up to US$500m by Rank Value Range
3
Jan 1 - Mar 31
Rank
0
100.0
10*1 1 ▲14* 1 0
-
BBVA
100.0
KPMG
23*
-3
-5
5* 10*
-1
1*
21*- 1.0
Fees
3
▼ ▼7
4.6
▲-
1
2
12*
Spanish Involvement Mid-Market Rankings (MM8)First Quarter 2016 │ Mid-Market M&A Up To US$500m │ Financial Advisors
Rank Value per Advisor
N+1 2
BNP Paribas SA
-12*0
1
1.0
0 -
10*-70.2 ▼
63.0 1.5
1.2-
GBS Finanzas SA
22
.6-18
1.0
1-
---
Natixis
-
1
MM8 - Undisclosed Values & Values up to US$500m
5*
234.4
3
▲
-17
0
14*
-
100.0100.0100.0100.0
100.0
Deals
5.5
▼100.0
5
2
Imputed Fees (US$m) †
Noqca Partners
23*-
PricewaterhouseCoopers
83.8# of Deals
21*Ernst & Young LLP
# of Deals per Advisor
1.0
41
▼
10-96.3
1.9
3100.0
▼
-
85.2US$m
3*
▲Rank
** Fee
Exp. (%)
▲
-
Industry Total
Financial Advisor
▲
10*
11*Rank
Deloitte
-
-0
10.9Norgestion
-
15
12*
1Guggenheim Securities LLC
Deutsche Bank
2
0
2
12*
-
-
14-7*
*tie
Source: Thomson Reuters/Freeman Consulting
57.9
5*
4
Rank Value
Strata Partners LLC 10*Credit Suisse
2
IMAP
Livingstone Partners-ONE to ONE Corp Fin SL
14*
0 10*
40.0-
1
2
1 23*1
12*
-
1
0-
00
2
258.3▲
-
28.112*
-
.5
00
53.0▼
16*
Euro mil
0
▼
0
-
10.0
▲
0
14*
100.0
2016
10* - -
5*
- 1 1 ▲10* - -
- 1 1 ▲- 1 1 ▲
10*
2016# of
▲
Change in
1.8 11* 100.0.5 23* 100.0.5 23* 7.6.5 23* 100.0
2.0 9 38.5
80.0 73.9 4 - -
▲
▲Change (%)
16*
16*9
1
22 -
-1
0 00 10* - -
0 0
-
50
100
150
200
250
300
350
400
$0
$1
$2
$3
$4
$5
$6
$7
$8
$9
# of
Dea
ls
Ran
k Va
lue
(US
$b)
US$200 - 500m US$100 - 200m US$50 - 100m US$0 - 50m # of Deals
26.9%
25.1% 13.2%
10.9%
10.1%
4.7%
3.3% 2.5%
Retail
Energy and Power
Healthcare
Real Estate
Financials
Media and Entertainment
Industrials
Consumer Staples
Consumer Products and Services
High Technology
Materials
10
14*
6*
6
19*2
5
21*
-
8
14
149.75,415.8
243.1 ▲
4.4
0
3
▲
14*
9
--6 75.0 68.0 -67.4
US$m
2 19*-
0
4.3
3
5.4
316.7 4
41*
.5
05 18968.8
7243.8
-
37*
Visit http://dmi.thomsonreuters.com to View Archives and Order Custom League Tables
14*-
2347.2
▼
-19*
514.9-2 165.8
▲
5.8
-.5
116.1
3* 60*
3-34.7
30* -21
6*
Change in
1
224.2
100.0
Rank Value per Advisor
25*-
-15
3
0 -
2
441.5SEB
Ernst & Young LLP
1.5159.77.0
17*14
29
44*
-23.4
-82.2
Rank
6*
33.5
▼
▲2.0
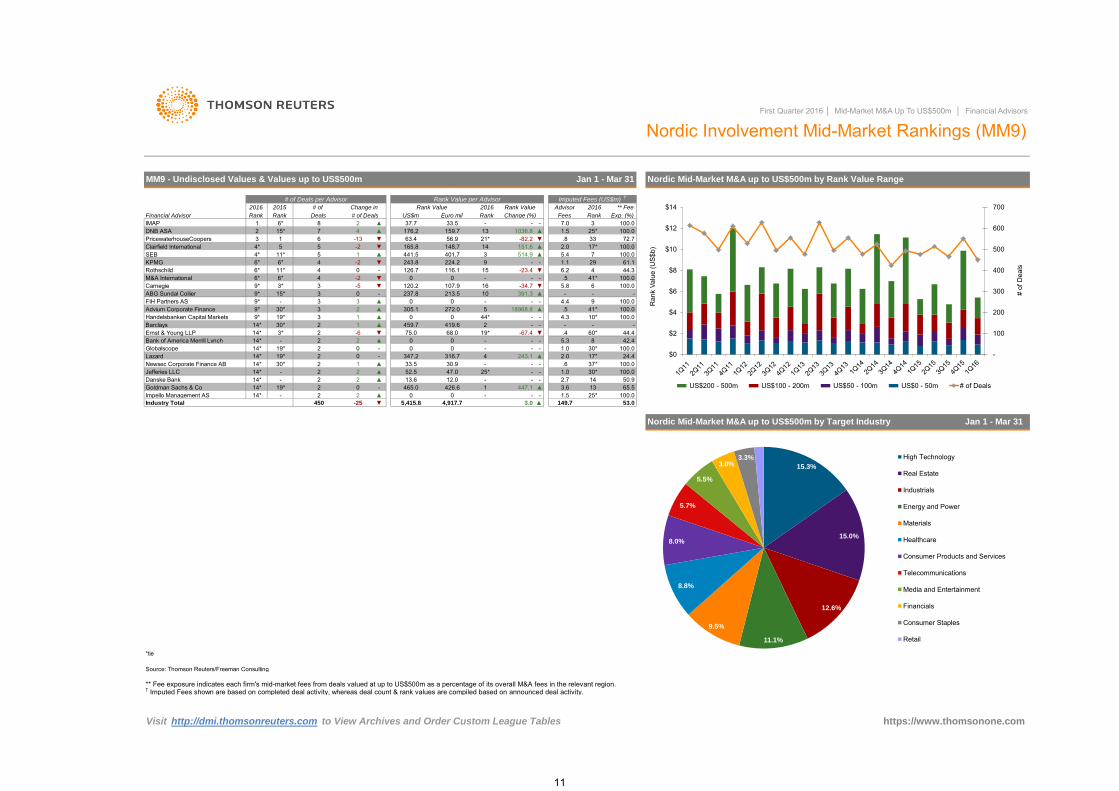
Nordic Mid-Market M&A up to US$500m by Rank Value Range
6*
2016
176.2
419.6
4
4*
1036.8
Rank
Jan 1 - Mar 31
1.1
3
37.7
▼126.7
9*
-9
5
-
Euro mil
-
▼
-13▼
100.0-
15*
4
M&A International
100.0100.09* 30*
72.73 56.9 ▼
3
272.0
10
0
120.2
Change (%) Fees
44.34
--
-
11* 04 6.2
107.9
▲
▼-
Carnegie
Advium Corporate Finance
Nordic Involvement Mid-Market Rankings (MM9)
2016 2015
Rothschild
DNB ASA
KPMG 4
44.4
8
# of Deals per Advisor
100.0
9*
61.1
▼
16-
-53*41*
** Fee
34*
50.9
- -
7
▲
1
Imputed Fees (US$m) †
-
9* -
Rank Value
-2
Financial Advisor
151.6
▲
Clairfield International
-
2
2.0 17*
5.314*
33
100.0
2-
Rank
Handelsbanken Capital Markets 9*
401.7
▼ABG Sundal Collier
14* 24.4
IMAP 1
Jan 1 - Mar 31
14*
100.0
459.7
5
3FIH Partners AS
6*
-
.4Bank of America Merrill LynchGlobalscope
148.7
-237.8 213.5
0-
0▲
2 15*
14*Jefferies LLC
0
** Fee exposure indicates each firm's mid-market fees from deals valued at up to US$500m as a percentage of its overall M&A fees in the relevant region.
Source: Thomson Reuters/Freeman Consulting
-25* - - 1.0
Danske Bank- 2 ▲ 52.5 47.0
Nordic Mid-Market M&A up to US$500m by Target Industry
30*▲ 33.5 30.9 - -
2
Deals
MM9 - Undisclosed Values & Values up to US$500m
53.0
1.0 30*
Rank
2016 Rank Value
11* 1
▼
.863.4
▲
6* -2
-
▲
Goldman Sachs & CoImpello Management AS
▼
12
▲PricewaterhouseCoopers
6
10*
2.7
100.02 0
14*19*
Barclays
Lazard
*tie
13
2
-25
.6
# of Deals
# of
-
19*
42.4
▲
-
0
2
Advisor
† Imputed Fees shown are based on completed deal activity, whereas deal count & rank values are compiled based on announced deal activity.
▲
0
391.3
Exp. (%)
100.0
14*-
100.0
100.0100.0
Newsec Corporate Finance AB
- 0
0
3.0 ▲Industry Total
14* 2 0 -- 2 2 ▲
3.6 13 65.51.5
First Quarter 2016 │ Mid-Market M&A Up To US$500m │ Financial Advisors
305.1
-
▲
2 ▲ 13.6 12.0 -
30*
-
4,917.7450
465.0 426.6 1 447.1 ▲0 0 - - - 25* 100.0
https://www.thomsonone.com
-
100
200
300
400
500
600
700
$0
$2
$4
$6
$8
$10
$12
$14
# of
Dea
ls
Ran
k Va
lue
(US
$b)
US$200 - 500m US$100 - 200m US$50 - 100m US$0 - 50m # of Deals
15.3%
15.0%
12.6%
11.1%
9.5%
8.8%
8.0%
5.7%
5.5%
3.8% 3.3% High Technology
Real Estate
Industrials
Energy and Power
Materials
Healthcare
Consumer Products and Services
Telecommunications
Media and Entertainment
Financials
Consumer Staples
Retail
11
-
▲
8*
32 0
8
8*
3
10*
8*
1
6
32*
▼5,219.8
0
15* ▲
9 2
30.0 27.7
Visit http://dmi.thomsonreuters.com to View Archives and Order Custom League Tables
0 -
0
014*
Jan 1 - Mar 31
92.6
# of Deals RankEuro mil
-
▼
100.0
-
▼
-2 ▼ 0 0 - - -
-▲
▼-69.5
25*4*
Change (%)
9.1
1
57.6
20
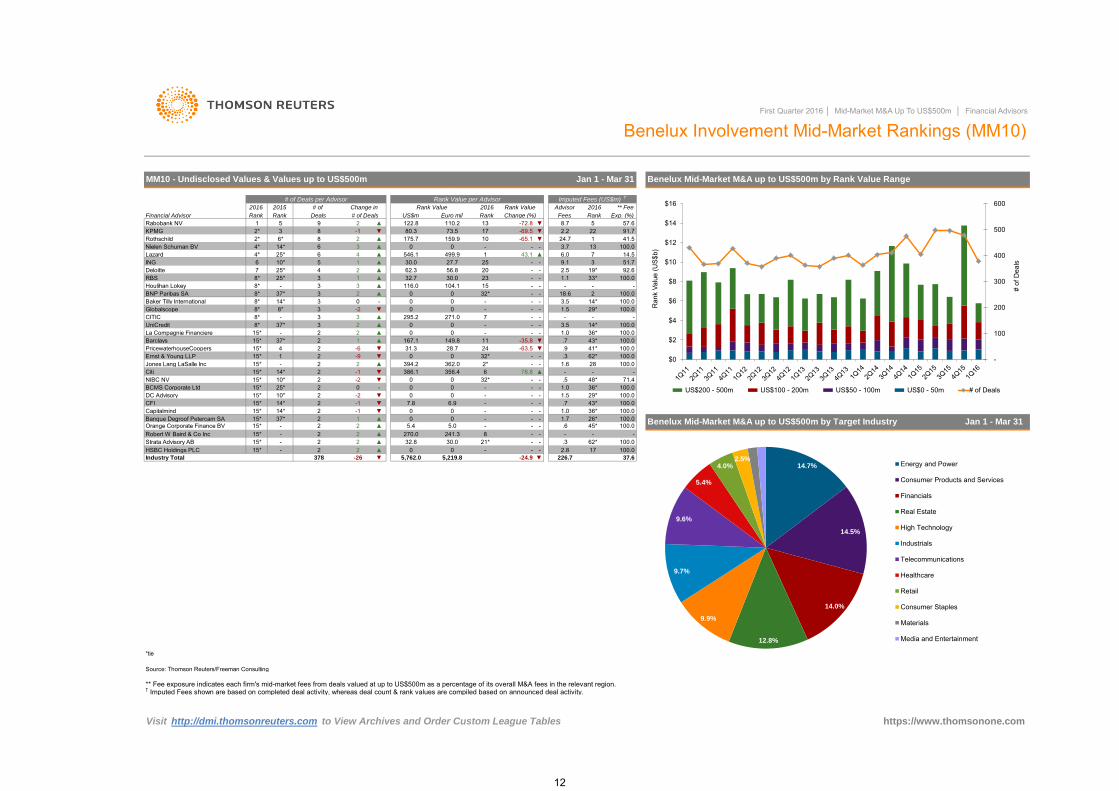
Benelux Mid-Market M&A up to US$500m by Rank Value Range
29*
▼
-
122.8
-
-
▲
2
-
2
1.7 26*
270.0
394.2-
2 ▲0
14.5
Advisor
▲
37* 2
32.8 21*
356.4-
386.1
33*
-
25*5
▼-63.5
Capitalmind
-
100.0
3 -
6
▼ 7.8
4* 14*
271.0
2
▼
0 -
30.0
15* 14*
Rank
8*
2
-
Deloitte
14*
CITIC
KPMG
0
Banque Degroof Petercam SA 15*
15*
15*
▼ -2*
-175.7
254
-
32*
2
3
0
2*
3
2
116.0
CFI 2 -1
8*
2*
▲499.9
62.3
-9
15*
-26
Rothschild
Lazard
15*
BCMS Corporate Ltd
15*
23132
8*
-
56.825*
8*
6*
HSBC Holdings PLC
2
Jan 1 - Mar 31
# of Deals per Advisor
2
7
28.71
-
100.0
-
45* 100.0
0
14*
62*
-
-
31.3
22 -1
15* 14*
100.0
https://www.thomsonone.com
-35.8
▼
-
10
.9
378Industry Total
2
100.0
10*
UniCredit
-
2.5
Benelux Involvement Mid-Market Rankings (MM10)
0
73.5 17 ▼
-100.0
37.6
100.0100.0
71.4
100.0
-
100.0
-
Benelux Mid-Market M&A up to US$500m by Target Industry
Exp. (%)
41.5
US$m
Rank Value
-0
1.6
-
Fees
13
2.8 17-
-
-
0 - -
0546.1
▲1
159.93
1-
-
24
-
Change in
-
-
2.2
6.0
8.7
1.1
295.2 7
.76.9 - --1 ▼ 0 0
▲
-
-
1.0
15
241.3
2016
2
-2
167.1
▲0
-
▲0
▲-
0
-
226.7
62*15* -
-24.95,762.0
- -
2 8
-
149.8
Deals
- 2
5
46
0
Rank
15*362.0
.3
5
-78.8
100.02
▲
† Imputed Fees shown are based on completed deal activity, whereas deal count & rank values are compiled based on announced deal activity.** Fee exposure indicates each firm's mid-market fees from deals valued at up to US$500m as a percentage of its overall M&A fees in the relevant region.
Source: Thomson Reuters/Freeman Consulting
*tie
ING
Nielen Schuman BV
80.3-72.8
3 8 2224.7
▲
-
100.0
37*
37*
Barclays
CitiJones Lang LaSalle Inc
36*
15*41*
36*
-
PricewaterhouseCoopers
La Compagnie Financiere2
25*
Imputed Fees (US$m) †
.5
-65.1
32*
43.1
▲
Financial Advisor
18.6
.7
3.5
1.5
- -
37*
2016 ** Fee
0
MM10 - Undisclosed Values & Values up to US$500m
Rank
Rank Value
-1
3
# of 2015
15*
Globalscope
100.0
-
3.5Baker Tilly InternationalBNP Paribas SA
▲
2
Rabobank NV
Houlihan Lokey
3.7
19*
73
RBS
28-
▼ 014*
8*
▲
--
First Quarter 2016 │ Mid-Market M&A Up To US$500m │ Financial Advisors
-6
▲-2
- 2 2 ▲ 5.4 5.0 - - - .6
1.0
Orange Corporate Finance BV
1.0
▼0
43*
1
Rank Value per Advisor
13
NIBC NV
Ernst & Young LLP
DC Advisory 15* 10* 2
15*
100.0
51.7
100.0
Strata Advisory AB 15* -Robert W Baird & Co Inc
1.5 29* 100.0
100.0
- .3
-
30.0-
100.0
91.7110.2
- - -
30
0▼
2
2
2016
104.132.7
36*48*
-
11-
0
3
▲
43*4
-
6
-
1 ▲
-
100
200
300
400
500
600
$0
$2
$4
$6
$8
$10
$12
$14
$16
# of
Dea
ls
Ran
k Va
lue
(US$
b)
US$200 - 500m US$100 - 200m US$50 - 100m US$0 - 50m # of Deals
14.7%
14.5%
14.0%
12.8%
9.9%
9.7%
9.6%
5.4%
4.0% 2.5%
Energy and Power
Consumer Products and Services
Financials
Real Estate
High Technology
Industrials
Telecommunications
Healthcare
Retail
Consumer Staples
Materials
Media and Entertainment
12

Financial Advisor
026*136.9
-13*
1
3*
-
--
Visit http://dmi.thomsonreuters.com to View Archives and Order Custom League Tables
3 149.0
▼
US$m
-
-
Rank Value
- .1
1 ▲- 1
3
6*
9
192.9
13*13*
13*13*13*
-
-
20*
0
-
1
-
2
-
VTB Capital 100.0
11
4.02
0
▲
739*
3.3
Akis Bagimsiz Denetim veCBRE Holding SASNewsec Corporate Finance AB
▲
22*
-
▼
-6*22
1-
6*
1
13*
-
▲
Rank
-- 1
- 1 1
-
▲- 1
▲
1 ▲
-
UniCreditBarons Financial Services Ltd
1
-
-Colliers Macaulay NichollsScotiabank
Deutsche Bank26*-
Sumitomo Mitsui Finl Grp Inc
1
-▲
▲
-12
13* 214.2
22* -
Source: Thomson Reuters/Freeman Consulting
0
FIDEA
0
22*
25.0
4.0
N+1
0
-
.5
22*
15* 122* -
4,709.8
Rothschild
▲22*
Change (%)
2016
-
2
▼-
-2
100.0
18.5 17.0
19
1.0
-
46.0
-
JP Morgan26.9
10
100.0
** Fee
-
-
2
-
▲
.6
1
1
100.0
100.0100.0
-
-11
-
48.8
2
Exp. (%)
-
Change in Advisor
0
2
-
20162015
▲
16
▲
Eastern European Mid-Market M&A up to US$500m by Rank Value Range
1
6*
1.3
https://www.thomsonone.com
EE Mid-Market M&A up to US$500m by Target Industry Jan 1 - Mar 31
13*
100.0
4*-
.4
-
8
1
Fees
-2
13*1
-
96.4
100.039*
-
-
-
-
6* -
100.0
Jan 1 - Mar 31
100.0.8
Rank Value
First Quarter 2016 │ Mid-Market M&A Up To US$500m │ Financial Advisors
-
Deals
MM16 - Undisclosed Values & Values up to US$500m
# of Deals per Advisor
0
18
11
0
6* 241.3
011 ▲
▲
13*
2016
13.6
Trigon
-86
69
1
13*
▲
23
0
17
--
▲
-
76.3
0262.2
8-2
CFILazard
22*▲
-
15*
16*
KPMG5
# of
296.1221.3 201.1
3
18
22*
15
--3
Rank
32.8
.1
30.3358.8
0
-
1
IMAP
86.0
-22*
1
Ernst & Young LLP
KBC Group NV
35
395.5
-3▼
-3*
3
▲
1
24*
-1-
-198.3 176.5
-
74*
6
95.9
Industry Total
-3 ▼
13*
-▲
-
131.5
3.022*
2
-
100.0
1
Deloitte
1-
-
0
23.0
50.1
- -
3* 00
▼324.0
03*
BNP Paribas SA
1
1
2
15* 1
-
3.73*
0
# of Deals
-
-
1
18
100.0
▲- 1 1 ▲- 1
2
Danske Bank
1.1
14
▲
Morgan StanleyHolon Sp zoo
15*
-Bank of America Merrill Lynch
1
13*
-.5
4,257.1735
0
5
100.0
- -0 0 22* - -
1.8 1.6 20 - -108.1 98.9 9 - -239.2 220.0 4
4.8
12.0
3
6*
** Fee exposure indicates each firm's mid-market fees from deals valued at up to US$500m as a percentage of its overall M&A fees in the relevant region.† Imputed Fees shown are based on completed deal activity, whereas deal count & rank values are compiled based on announced deal activity.
13*0
-
1.5-
FirstEnergy Capital Corp
1
1
68.8
13*
-
100.0
0 22* - -1.2
Redgate CapitalCeska Sporitelna asStockdale Securities LtdCommerzbank AGConcorde MB Partners KftRota Tinmaz Degerleme vePekao Investment Banking SASEB
26*Superia
.5 26*
.6 24*
-- ▲
21 -
PricewaterhouseCoopers 100.0
-
1.5
9.8
16*
6*Rank
- 1 1 ▲15* 1 0 -
- 1 1 ▲ -1.1
*tie
13*13*13*13*13*13*13*13*13*13*13*
1 1
- -0
-
100.0
0
2
3.1
100.0
60
▲1 -
-
100.0
-
- -
-
100.0.9 22 100.00 43
0
▲
1 ▲
-
▲ 22*
▲0 0 22* - -
2.3 12
- -
100.0- - -.5 26* 100.0- - -
1.0 20* 100.0.5 26* 100.0- - --
33.5 30.9 13 - -0 0 22* - -0 0 22* - -0 0 22* - -0 0 22* - -0
29.6 -
--
Eastern Europe Involvement Mid-Market Rankings (MM16)
Euro mil
Imputed Fees (US$m) †
Rank
Rank Value per Advisor
100.0
100.0
100.0
▲
Cushman & Wakefield Inc
100.06.6 6.0 19 450.0
- 1 1 ▲- 1 1
0
-
200
400
600
800
1,000
1,200
$0
$2
$4
$6
$8
$10
$12
# of
Dea
ls
Ran
k Va
lue
(US
$b)
US$200 - 500m US$100 - 200m US$50 - 100m US$0 - 50m # of Deals
26.9%
14.2%
12.0% 8.7
7.6
6.8%
6.2%
5.3%
5.2%
5.2%
Energy and Power
Financials
Retail
Consumer Products and Services
Telecommunications
High Technology
Real Estate
Media and Entertainment
Industrials
Consumer Staples
Materials
Healthcare
13

Amasse Capital Ltd 33* 51* 3 1 ▲ 435.3 - 4297.0 ▲ - - -Duff & Phelps 33* - 3 3 ▲ 645.7 18 - - - - -
Deutsche Bank
70*
88*
8.7
Hochinma Involvement Mid-Market Rankings (MM13)
▼
444.4
19.4 -
-55.8 65*5
86*
534.5
4
535.6Rank
345*
4 5.4
13596.4
51*25* -33* 86*
4
50*
7*
23
1
16
10
527.4
China Securities Co Ltd 9* -19 1,635.6 6
7*
41*US$m
Rank Value
# of Deals
28
.6
-23.0Gram Capital
51*
6*
1145*
2016
.1▲
5947.7
Rank
▲▲
16*
25*
20*
33*
27*
2
Citi
Imputed Fees (US$m) †
249.9
4.4
9*
15*
-211
21* 27* 1
▲
49.3
3
▲
48
66.7
40.0
1,326.6
2,026.4
▼
320 ▲
▲
3
29*
.1▼
-86.3
1,853.9
First Quarter 2016 │ Mid-Market M&A Up To US$500m │ Financial Advisors
Rank Value
17.3
92.7
▲100.0
3
▲77,393.2
-66.2
3
▼ .6-
3
-Asian Capital (Corp Fin) Ltd
-632.8
▲3 -1 ▼
▲
39*
33* 86* 3 2
-
Haitong Securities Co Ltd
CITIC
https://www.thomsonone.com
16* 9*
4
100.0
Rank
19
▼6
▲11
Industry Total
▲
2.8
17
1870*
1
3*
1
▼
PricewaterhouseCoopers
701.3
▲
11
100.0
Axis Bank Ltd
45*
9*
-2812*.4
# of
100.0
5
1
.260.80
29*
339.8
1,363.8
100.0
Aijian Securities Company Ltd100.0
- - - -
-
25*
16* 39*
83.3
JP Morgan
Guosen Securities Co Ltd-
100.0CIMB Group Sdn Bhd
7
1
93.312*
1134.1
289.0
Hochinma Mid-Market M&A up to US$500m by Rank Value Range
14▲
3
-
516.3
▲
-33*
Industrial Securities Co LtdDongxing SecuritiesBank of China Ltd
5
32
5
5
6
33* 86*
42.9
-
5
7
GF Securities
New Times Securities Co LtdGuoyuan Securities Co LtdFTI Consulting Inc
-36.1
Fees
61.5
50*
Advisor
234.0
- 1.3-
41
Hochinma Mid-Market M&A up to US$500m by Target Industry Jan 1 - Mar 31
-35.4
▲
88*
24-36.8
448.0
14
▲
** Fee
100.0
10.6
▼ .7
3*
▲
Rank Value per Advisor (US$m)
Jan 1 - Mar 31
1.8
82.1
9
- -13.3
65*
.5
2
27*
13
▼ 4.0
11*
27* 915*
2015
▲
.3
-395.1
816.9
27.9
694.5
732.2
33.2
▲
977.9
Lazard
Deals
▲25*25*
21*
2
-
4
-
1
-9
25*
88.9
24*
MM13 - Undisclosed Values & Values up to US$500m
▲
1,971.8
558.9
3
88*
100.0
-
Rothschild 25* 20*
-1
5
50.6
-
165.6
1.6
35*
22*
12
4
16.9
87.8
4
▲
▼
22
56.6
▼
.2
3
3
71.0
6
▲
41.7
▲
-
7
▲
2114.7 ▲
-38.8 ▼
.1
10
4
Visit http://dmi.thomsonreuters.com to View Archives and Order Custom League Tables
33*33*
3
KPMG
Source: Thomson Reuters/Freeman Consulting
8
-51.6
.4 59*
- 79.2 ▲11.5
33*
71.4
Kingston Corporate Finance Ltd-Mizuho Financial Group
UBS
.31.9China Construction Bank
Guotai Junan Securities
Goldman Sachs & Co
.8Ernst & Young LLP
-
Great Wall Securities Co Ltd
-▼
33*
167.0
211.1
-7
33*
3.2
-0.2
-62.5
2
30
16.7
▼
767.0
21
-19 - -798.2 12 - -311.1
- -140.5 - -
16.2 ▲
7 -
3
3.3
1.3▲
5
70*4
15
100.040.4
▲
258.5
▼
▼
** Fee exposure indicates each firm's mid-market fees from deals valued at up to US$500m as a percentage of its overall M&A fees in the relevant region.† Imputed Fees shown are based on completed deal activity, whereas deal count & rank values are compiled based on announced deal activity.
57.3100.0
2 ▲ 107.9 - -21.9 ▼ 11.83 -4 ▼3 3
11*---
86*86*
-
33*33*
33*33*
▲3 3 ▲3 3 ▲3 2 ▲3 2
39*
▼39▼
▼▼
0 -
▲
2016
1,844.8
Nuada Ltd
54.8
387.9 38
795.2 13
86*
Somerley
Southwest Securities Co Ltd 7
Bank of America Merrill LynchChangjiang Securities Co LtdClairfield InternationalBDO
-1
*tie
2016
51*
# of Deals per Advisor
21.4▲
21885.2
7 ▲
6.7
2 ▲
94.7100.0
-85.1
▲
▼
3
China Galaxy Securities Co 3 ▲
-3.5Shenwan Hongyuan Securities Co
14
1,694.4
20*
51*5.9
-▲
China International Capital Co
12* 2
Rank
6*-
109.4 60▼526.6
-38.4
9.6
1066
▲
59*6*20626.9
▲
4- 477.4
.7 41*
851*
3
39*
-81.8
▼
▼
-4
86* 4
25 279.2
Morgan Stanley
8.9-
4
16
▲
9
16*
1.6
-
.211*
7
6
0▲ ▲
12*
21*21*
9*
Huatai Securities Co LtdChina Merchants Securities Co
Change (%)
▲ ▼
▼
2
169.9
Financial Advisor
Industrial & Comm Bank China32.2
18
27*
25*
16*China Renaissance Partners
2,063
3.3 - -95.5 ▼
0.6
Exp. (%)
40.4
12.9
100.0
100.0
▲ 47.2 -▲ 56.6
-38.3
-
867.7
-2 ▼ 45 -79.3
6.4
-
666.7 17
5 ▲
16
15-
3.65.5
Change in
5.7 10 31.1.0 102* -.6 45* 100.0.5 50* 100.027*
-8
Credit Suisse 33*
2906.5
625.2
▲
.2 70* 100.0- - -
-
500
1,000
1,500
2,000
2,500
3,000
$0
$20
$40
$60
$80
$100
$120
# of
Dea
ls
Ran
k Va
lue
(US
$b)
US$200 - 500m US$100 - 200m US$50 - 100m US$0 - 50m # of Deals
17.2%
14.9%
9.6%
9.5% 9.5%
8.7%
8.6%
6.3%
5.7%
5.5%
4.1% High Technology
Industrials
Real Estate
Energy and Power
Financials
Materials
Healthcare
Consumer Products and Services
Media and Entertainment
Consumer Staples
Retail
Telecommunications
14

.3 30 100.00 - - - .5 24* 100.00 - - - 2.0 7* 100.0
15.8 - - - .1 34* 100.0134.8 16 - - - - -
0 - - - 2.0 7* 31.7
18*18*18*18*18*18*18*18*18*
31* 1 0 -- 1 1 ▲- 1 1 ▲- 1 1 ▲- 1 1 ▲- 1 1 ▲- 1 1 ▲- 1 1 ▲- 1 1 ▲- 1 1 ▲- 1 1 ▲
-
24*
-
Asian Capital (Corp Fin) Ltd
Moelis & CoLY Capital LtdDuff & PhelpsGoldman Sachs & Co
18*
0
215.1
173.1
-
- - .2
11
Hong Kong Mid-Market M&A up to US$500m by Target Industry
34*
-
-
-96.1
204.2 7* -
48.9
100.0
-
-
53
7*
-
10* 100.023.2 - - - .4
-
0
1
2431* Jan 1 - Mar 31
▼
.4
▲
18*
† Imputed Fees shown are based on completed deal activity, whereas deal count & rank values are compiled based on announced deal activity.
-21.3 - 108.8
-
2.3
-
9*100.02
29*
0.7 -
1
-
18* -
1
1
14,377.4 7.5
-
-
- -
▲
18*
-
-
Visit http://dmi.thomsonreuters.com to View Archives and Order Custom League Tables
9*
-
9*2
-
56.6
31*▼
18*
1.9
KPMG
JP Morgan
-
-
1
▲
22
- --
-
---
100.0
154.9
Deals
31*
▲
-
3
-
--
1
-
1
1
▲
-
2
3.5▼
-
31*23.6
0
1
1
2 -
▲-
100.0
10.6
.1
45.3
▲
-
-
- - -
-
-
438.5
314.4
-
18*
39.8-
-
1
-
▲
** Fee exposure indicates each firm's mid-market fees from deals valued at up to US$500m as a percentage of its overall M&A fees in the relevant region.
Source: Thomson Reuters/Freeman Consulting
-
-
18*
18*
Industry Total
Veda Capital Ltd
*tie
0
100.0
▲
HSBC Holdings PLCBDOCBRE Holding SASDonvex Capital LtdTC Capital Asia LtdAlliance Capital Partners LtdAllen & Co Inc
▲18*
1
9*
▲
1
-1875.4
34.60 100.0
-
204.2
25
-
Cassel Salpeter & Co LLC28 -91.9 ▼
-
3.2
-
18*
Earlybirdcapital Inc
Platinum Securities Co Ltd3
-
14
382
-
754.3
-
0
31*
6
1
31*
2
18*
11
-
75.5▲
9*
-77.1
-
-
TC CapitalBridge Partners Capital Ltd
UniCredit
Mizuho Financial Group
-90.6
1
-
Quam Securities Co Ltd
NRA Capital Pte Ltd
-31*
171.6
US$m
▲
-
2
▼
-8 ▼Amasse Capital Ltd 4*
4
# of Deals per Advisor
2
Kingston Corporate Finance Ltd
14* 1 -
-15 -
-
2
3
2
▼- 154.8
▼
31.7
.4
China Galaxy Securities Co178.6
--8
100.0
21 ▲
9
3 --91.0
9*
4* -
14*
14*
3
2
27*
Hong Kong Mid-Market M&A up to US$500m by Rank Value Range
.6
2016
First Quarter 2016 │ Mid-Market M&A Up To US$500m │ Financial Advisors
4297.04
4
22
Rank Value per Advisor (US$m)
CITIC
2016
-1
Rank Value
▼4*
-
▲
MM12 - Undisclosed Values & Values up to US$500m
4* -
2016
Gram Capital
Rank
Advisor
Fees
100.0▲Haitong Securities Co Ltd
0
100.0
18*
9*
1* 3
37.4
▼
- 1 1
https://www.thomsonone.com
-
▲
1 -
-
-47.9
39*
▲1 1
-0
- .1
-
▲
Aijian Securities Company Ltd18*
-
-
100.0
Guotai Junan Securities
1
19
Rothschild
▲ - -
1
▲
UBS
-
11*.2
10.7
CIMB Group Sdn Bhd
▲
18*18*18*
18*
-
BNP Paribas SA
18*
-
- 1 1
1
31*
Colliers Macaulay Nicholls
9*
Hong Kong Involvement Mid-Market Rankings (MM12)
100.021
9*
31*
18* -
2
Rank ValueChange in
-
-
5
Rank
▲
-
-
3.2
0
3.7
2015
419.4
13
2.8
43
33
FTI Consulting IncSouthwest Securities Co Ltd
0
-
1-
-
▲
9*
18*Investec--
- 1 1 ▲
1-
-
** Fee
Rank
Somerley
4*
Rank
Morgan Stanley
Financial Advisor
-
▲435.3
-▲
44.4▲
229.4 10*20-4 .5
9
▲
1
▲16.6
1*1*
23
55.0
58.3
China Construction Bank
Huatai Securities Co Ltd
China Merchants Securities Co
Nuada Ltd
# of Deals
5-
14*
14*
-Lincoln International
2Euto Capital Partners Ltd
-
-
1985.7
-
0
18*-▲
3.3
18*
-6.9
10
▲
17 -
27*
1-
1
-
34*-0
116.8
-
-
-
Imputed Fees (US$m) †
-
14*
China Everbright Ltd - .7
▲
21.3 --
-
201.8
-
100.0
-
4
-
▼23
1 -1
-
-
0-
2
1.8
Change (%)
279.2
Jan 1 - Mar 31
Exp. (%)
100.0▲
527.4
# of
72.81
15.818*
▲
1
14* 1 -1 ▼
100.0
-66.2 ▼
100.0
-
22
-
47.2
1.1
0 41* - - - - -0 - - - .2 31* 100.0
173.1 11* - - 1.8
0
-
-
--45.5
-
6
39*
27* 100.011.1 - - - - - -15.8 - - -
-
100
200
300
400
500
600
$0
$2
$4
$6
$8
$10
$12
$14
$16
$18
$20
# of
Dea
ls
Ran
k Va
lue
(US$
b)
US$200 - 500m US$100 - 200m US$50 - 100m US$0 - 50m # of Deals
19.0%
17.3%
10.6%
10.1%
8.4%
8.1%
7.4%
7.3%
5.9%
4.6% Real Estate
Financials
Energy and Power
Industrials
High Technology
Materials
Media and Entertainment
Healthcare
Consumer Products and Services
Consumer Staples
Retail
Telecommunications
15
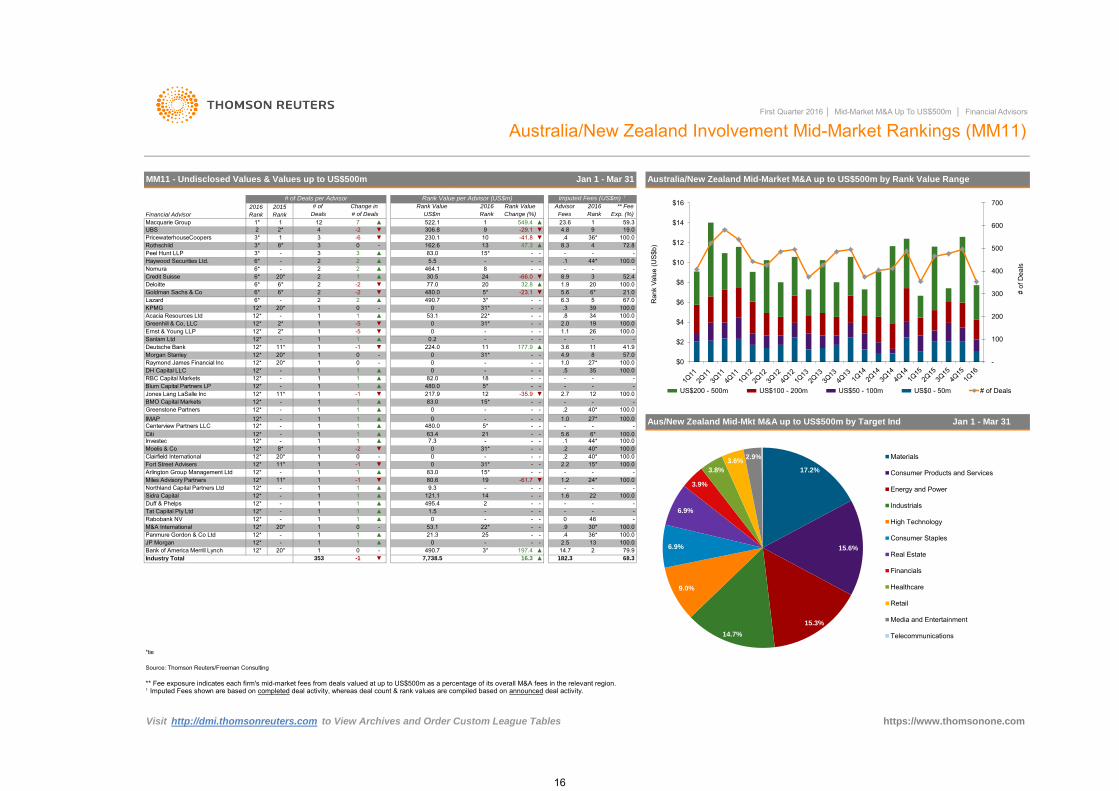
Panmure Gordon & Co Ltd 12* - 1 1 ▲ 21.3 25 - - .4 36* 100.0JP Morgan 12* - 1 1 ▲ 0 - - - 2.5 13 100.0Bank of America Merrill Lynch 12* 20* 1 0 - 490.7 3* 197.4 ▲ 14.7 2 79.9
Tat Capital Pty Ltd 12* - 1 1 ▲ 1.5 - - - - - -Rabobank NV 12* - 1 1 ▲ 0 - - - 0 46 -M&A International 12* 20* 1 0 - 53.1 22* - - .9 30* 100.0
Duff & Phelps 12* - 1 1 ▲ 495.4 2 - - - - -
12*▲
3*
Raymond James Financial Inc
RBC Capital Markets
BMO Capital Markets
-
▲▼ 12
-
- 1 1 ▲- 1 1 ▲
-
8
-1 -35.9
7.3 - - -
9.3 - -
12*
Visit http://dmi.thomsonreuters.com to View Archives and Order Custom League Tables
35-
5.6
-
-▼
18
217.91
12*12*
-
3-
- 2-2
1
12*
▼
- 1
6*
-
0
-
9
20
44*-
1
110.2
Aus/New Zealand Mid-Mkt M&A up to US$500m by Target Ind
--
-
Australia/New Zealand Mid-Market M&A up to US$500m by Rank Value Range
100.0
-
19.0
-
-
-
-
---
1
1
1.9
-
12
Australia/New Zealand Involvement Mid-Market Rankings (MM11)
3
US$m
Advisor
100.0
8.310
-66.0
▼
-
-
-
Rank
11* 3.6
2* -5
-
-▲
Rank Value per Advisor (US$m)
Rank
1*
-11
20*-1
1
-
5
Rank
83.0
12*
6*
4
▼8.9
162.6
464.1
-23.1-2
0-
-
-
-82.0
3*
2016
522.1
20*6*
177.9
2.0
0
5.5
Rank Value
8
2
12*
27*
Jan 1 - Mar 31
2
2016
-
306.8
.1
6*
12*
20*
490.7
▲
1100.0
Acacia Resources Ltd12*
12*-
▼
▼
-
▼ 4.8100.0
▲
22
▲32.8
▲
Rank Value
-51-
2* -
1
59.3
3▲ -
▼
-
6*
30.5
6.3
-
# of Deals per Advisor
▲Peel Hunt LLP
Financial Advisor
100.0
480.067.0
2
-29.1
6*Haywood Securities Ltd.Nomura
▲
19 ▼
-
1
** Fee
Exp. (%)
1
6*
-6
15*
-
24
Ernst & Young LLP
-11
19Greenhill & Co, LLC
Rank
Jones Lang LaSalle Inc
https://www.thomsonone.com
1315*
-
12*
83.0
Lazard▼
-
4
MM11 - Undisclosed Values & Values up to US$500m
▲
11*
39.3
-
3
53.10
▲
2UBS
5*20
26
-
-
3
- 022*
100.0▼1
21.0
-
.5
16.3
1 12Blum Capital Partners LP
Sanlam Ltd1.1 100.0
.8100.020* 31*
Deutsche BankMorgan Stanley
31*
6*
1
2
57.0
-
1
-
-480.0
-
- -
031*0
-
▲
100.0100.0
-
0
▼
-
4.9
-41.9
▲
Industry Total
Jan 1 - Mar 31
2.7
7,738.5353 182.3
8* 1 -2 ▼20* 1 0
Goldman Sachs & Co
Credit Suisse
.4
# of
6*
DH Capital LLC
5*
-
0
8*
112*
1
0341 -
12*
549.4
Deloitte
2
Rothschild
3*
52.4
Change in
First Quarter 2016 │ Mid-Market M&A Up To US$500m │ Financial Advisors
PricewaterhouseCoopers
2016
68.3
2*
*tie
** Fee exposure indicates each firm's mid-market fees from deals valued at up to US$500m as a percentage of its overall M&A fees in the relevant region.
Source: Thomson Reuters/Freeman Consulting
† Imputed Fees shown are based on completed deal activity, whereas deal count & rank values are compiled based on announced deal activity.
▲-1
KPMG
Deals
23.6▲
77.0
-
2
-
-
1
480.0
224.0
1.0
21 - -1 ▲
.2 40* 100.01.0 27* 100.0- - -
5.6 6* 100.0
-
5* - -63.4
-
- -83.0 15*
- -
-11*
▲
0 - - -0
1 -1 ▼- 1 1 ▲
11* 1 -1 ▼
1.6 22 100.0
0 31* - -0 - -
- 1 1
12*12*12*12*12*12*12*12*12*
- 1
-80.6 19 -61.7
Greenstone PartnersIMAPCenterview Partners LLCCitiInvestecMoelis & CoClairfield InternationalFort Street AdvisersArlington Group Management LtdMiles Advisory PartnersNorthland Capital Partners Ltd
-
12*12*
- 1 1 ▲- 1 1 ▲
-▼
▼-41.8
▲
230.1
7
3*
2015
Change (%)
Macquarie Group# of Deals
-2
12*Sidra Capital - 1 1 ▲ 121.1 14 -
-
24* 100.0- - -
1.2
100.0
36*72.847.3
1
Imputed Fees (US$m) †
Fees
.1 44* 100.0
.2 40* 100.0
.2 40* 100.02.2 15*
-0 31*
-
100
200
300
400
500
600
700
$0
$2
$4
$6
$8
$10
$12
$14
$16
# of
Dea
ls
Ran
k Va
lue
(US
$b)
US$200 - 500m US$100 - 200m US$50 - 100m US$0 - 50m # of Deals
17.2%
15.6%
15.3%
14.7%
9.0%
6.9%
6.9%
3.9%
3.8%
3.6% 2.9% Materials
Consumer Products and Services
Energy and Power
Industrials
High Technology
Consumer Staples
Real Estate
Financials
Healthcare
Retail
Media and Entertainment
Telecommunications
16

--
-
620*
-2
2
Visit http://dmi.thomsonreuters.com to View Archives and Order Custom League Tables
3*
Rank Deals
2015
-
11
2.1 100.0
-
2 -1
12 - - .1 15*
Singapore Involvement Mid-Market Rankings (MM14)
100.0
--
-
Rank
-
First Quarter 2016 │ Mid-Market M&A Up To US$500m │ Financial Advisors
Nomura
-AMMB Holdings Bhd
2
# of Deals per Advisor
20*
2
▲54.7
1
Amidas Partners Inc
3-
1
Rank Value
7.4 ▲
108.8 -69.1
5 ▲ 4,388.0
-
▲
-61.6
-
Industry Total
Jan 1 - Mar 31
-
https://www.thomsonone.com
-
-
1.4
Jan 1 - Mar 31
Change (%)
** Fee
44.3
.8
▼
3
-
3.0
-7
100.0
69.1
Macquarie Group1
33.3
-
-
10
-
-
628.0
-
Credit SuisseFinancial Advisor
Deutsche Bank
4JP Morgan
12*
-0
0
0
0Evercore Partners
DBS Group Holdings 12*
-
-
-
1 ▲
-
Wells Fargo & Co
Morgan Stanley
-
1
▲- 1
1*
100.0
PricewaterhouseCoopersNRA Capital Pte Ltd
1
Rank Value per Advisor (US$m)
RankFees
100.0▲
7*
7*12*
-
▲
▲1
Change in 2016
# of Deals
407.34
Rank Value
100.0
-759.3105.7
2
7
-- 100.0
--
5Exp. (%)
2016
Singapore Mid-Market M&A up to US$500m by Rank Value Range
2
-▼
# of Advisor
--
-
3
-
14.5 1
12* - 13
-
5 -
-
20*
3.9477.4
20*
3*
3*
5
.32
8-
Imputed Fees (US$m) †
MM14 - Undisclosed Values & Values up to US$500m
▲
2016
Citi
3
7* -
US$m Rank
** Fee exposure indicates each firm's mid-market fees from deals valued at up to US$500m as a percentage of its overall M&A fees in the relevant region.† Imputed Fees shown are based on completed deal activity, whereas deal count & rank values are compiled based on announced deal activity.
▼
- 1 -
-
-- -
CIMB Group Sdn Bhd
100.0- -- -- -- -
18 -20* - -
3.9
2▲▲
-
3*
▲
3.7
▲
1
Source: Thomson Reuters/Freeman Consulting
-
- 1 1 ▲- 1
- 1 1 ▲1 1 ▲
12*12*12*12*12*12*12*12*
-3*
3*
0.7
*tie
-8.0
- -0 20* - -0 20* -
-
7*
2
3
7*
12*Asian Corporate Advisors Pte - 1 1 ▲ 13.6
.1----00 -
-
2
-
1 -2
7*
▲2
17 -3
-230.5
-
62.2 9 -1 ▲0 -
- 1 1 ▲- 1
19
-7*
15*
1 ▲
▲3.9 15* - -6.0 14 - -3.5 18 - -
Singapore Mid-Market M&A up to US$500m by Target Industry
15* -90.3 ▼
84.6 8 526.7
7* 1
7* 1
12*12*12*12*12*
195
Ernst & Young LLPUnited Overseas Bank LtdPlutus Consulting Co LtdRHBBank of America Merrill LynchDeloitteCanaccord Genuity
0 20* - -0
-
-6.5
▲
20*▲-
-
GCA Savvian Group Corp
▼0 20* - -
22.8 11▲
2
-
1
7*
3 00
4
Jefferies LLCMalayan Banking BhdKGI Financial Services GroupSimmons & Co InternationalHSBC Holdings PLC
3* 1 -1 ▼- 1 1
1 ▲- 1 1 ▲
407.3 3* - - -- - -- - -.5 10 100.0.2 12* 6.7
-
50
100
150
200
250
300
$0
$2
$4
$6
$8
$10
$12
# of
Dea
ls
Ran
k Va
lue
(US
$b)
US$200 - 500m US$100 - 200m US$50 - 100m US$0 - 50m # of Deals
26.5%
13.8%
13.0%
12.5%
11.2%
7.4%
6.7%
3.2% 2.7%
Industrials
High Technology
Consumer Products and Services
Real Estate
Retail
Materials
Consumer Staples
Energy and Power
Financials
Healthcare
Media and Entertainment
17
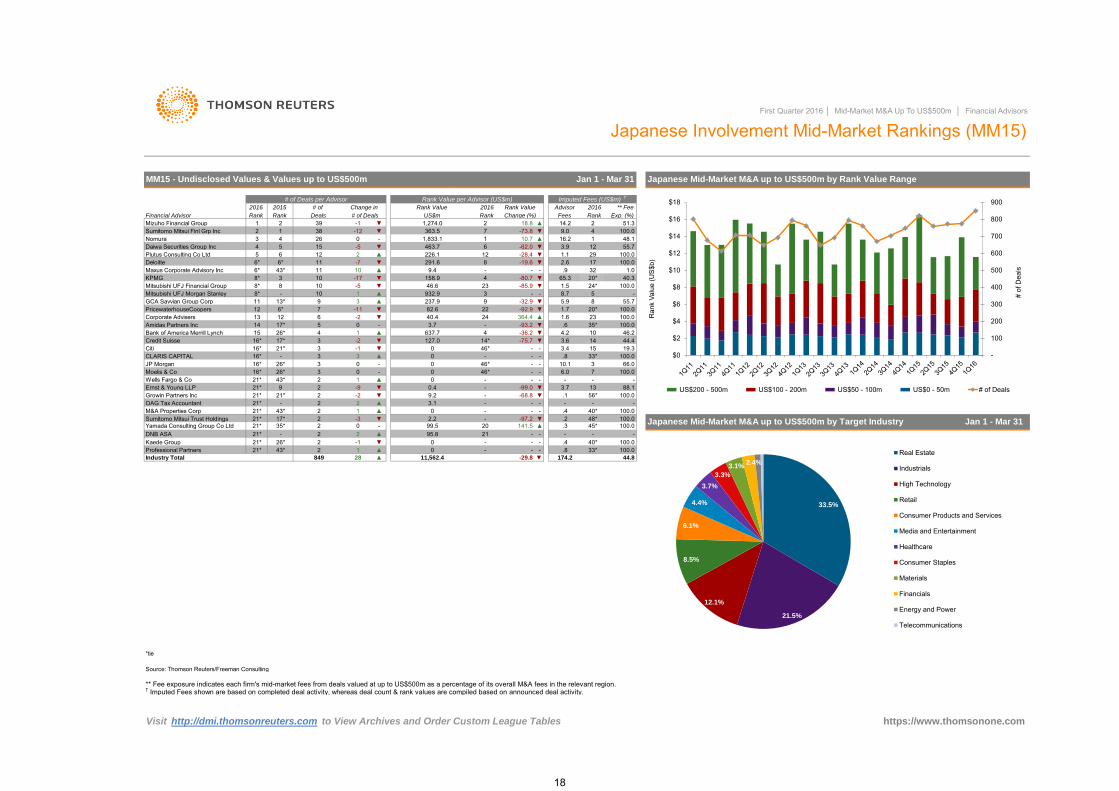
Visit http://dmi.thomsonreuters.com to View Archives and Order Custom League Tables
Industry Total
1
-
12
14 17*
▼
-
100.0100.0100.0▲ .3
Bank of America Merrill Lynch
Deloitte
-21*
2
*tie
▼
88.1
28
3
https://www.thomsonone.com
45*
6*
- - - .8-1
95.8 21 --
55.7100.0100.0
Change in
-
100.0
▼
3
- -
9.0
Exp. (%)
** Fee
22Rank
▼1
0
-13
.1-2
3
43*
2016
5.9932.9 3
4
Rank Fees
▼
-8
.9158.9
24*
-32.9
40.3
6*
16.215
# of
-62.06
43*
▲
▼
18.8
2015
46.244.4
100.0
363.5
2016
▼ 1.723
-93.2
22
Financial Advisor
2016
100.0
-291.6
33*
127.0
0
4
▼
2
-21*
26*
37
237.9 9-
1.5
1
9.4
12
46.6-5
40*
3
# of Deals
Advisor
Japanese Involvement Mid-Market Rankings (MM15)
-11
2
32
100.010
100.046*
▲
4.2
10.1
12
4
-
20*
▼0.4
- -35*
0
.4
2▼
Professional Partners
-7
21* 43*
2
1 ▲
Japanese Mid-Market M&A up to US$500m by Target Industry Jan 1 - Mar 31
-▼ 0Kaede Group 21* 26*
849 ▲ 174.2 44.8
Rank Value
-40.4
▼
-73.82
11
13
910
▼-36.2
100.048.1
171.0
1
100.0▼
▼
US$m
First Quarter 2016 │ Mid-Market M&A Up To US$500m │ Financial Advisors
Japanese Mid-Market M&A up to US$500m by Rank Value Range
5
15
-19.6
.6
12 6*8GCA Savvian Group Corp
▼ -92.955.7
026
Mizuho Financial Group
Corporate Advisers 100.0
29
10.7-12
-
1,274.0
364.43.7 -
24
3.6
-80.7
▲
7
1.1
Rank Value
14.2
▲4 5
4-5
11
-3.4
-
3.1
-171011 10 ▲
2Daiwa Securities Group Inc
Sumitomo Mitsui Finl Grp Inc
Plutus Consulting Co Ltd▼
DealsRank Change (%) Rank
238*
6*KPMG 3
-11 2 39
5
-
9
-
21*
▲
9.2
38
-28.4
1,833.1 1
- 8.7
2.6
65.3
MM15 - Undisclosed Values & Values up to US$500m
Nomura463.7226.1
Rank Value per Advisor (US$m) Imputed Fees (US$m) †
Jan 1 - Mar 31
51.3
Mitsubishi UFJ Financial Group -85.9
6 12▼
▼
# of Deals per Advisor
Wells Fargo & Co
2
26*
21*
21*21*
-1-2
3.7- -99.0-
3JP Morgan
-9
Yamada Consulting Group Co Ltd
-68.8
0
21*
.4
16*
21*-▲
- - - 40*
0
-0
-
▲.2▼
-DNB ASA
-
-97.2-
Citi -46*
21*
048*Sumitomo Mitsui Trust Holdings
-2-
-46*
Ernst & Young LLP
-
2
3
2
0
OAG Tax Accountant 21* -
26*16* 17*
▼
CLARIS CAPITAL 3-
82.6
Credit Suisse
Growin Partners Inc
▼▼
-
- .816*
Maxus Corporate Advisory Inc-7
▲PricewaterhouseCoopers
100.0
66.0
99.5 202 ▲
-3
† Imputed Fees shown are based on completed deal activity, whereas deal count & rank values are compiled based on announced deal activity.** Fee exposure indicates each firm's mid-market fees from deals valued at up to US$500m as a percentage of its overall M&A fees in the relevant region.
3
2.2 - ▼
2M&A Properties Corp
56*▼
Moelis & Co
17* 243*
-
19.3
100.0
141.5
-
33*
0
-
-2
13*
16*
▼
5▼
88* -
▲1 4637.7150Amidas Partners Inc
3.9
▲10
▼
0
-75.714*
16*
6.0
35*
20*
14
Mitsubishi UFJ Morgan Stanley
1.6
11,562.4 -29.8
Source: Thomson Reuters/Freeman Consulting
6
1
8*
▲
▼
-
100
200
300
400
500
600
700
800
900
$0
$2
$4
$6
$8
$10
$12
$14
$16
$18
# of
Dea
ls
Ran
k Va
lue
(US$
b)
US$200 - 500m US$100 - 200m US$50 - 100m US$0 - 50m # of Deals
33.5%
21.5%
12.1%
8.5%
6.1%
4.4%
3.7%
3.3%
3.1% 2.4%
Real Estate
Industrials
High Technology
Retail
Consumer Products and Services
Media and Entertainment
Healthcare
Consumer Staples
Materials
Financials
Energy and Power
Telecommunications
18

Guotai Junan Securities 17* 9* 4
26
4 2 ▲795.2 12
.3 38*
15* 47*
▲ 477.4
21
3
234.0 39 -79.3
323.2
1.3
-
3 ▲
Change (%) Fees
# of Deals per Advisor
-▲
364.9 ▲ .2
▲
3
▲ 503.5
3
- - -
100.024* 4 2
.2 42* 100.0
66.7
5 ▲ 1,363.8 6 33.2 ▲ .2 42* 40.0CITIC 3* 7* 14
57* 100.07 ▲ 1,971.8 1 947.7
MM20 - Undisclosed Values & Values up to US$500m Jan 1 - Mar 31 Chinese Mid-Market M&A up to US$500m by Rank Value Range
11 1,326.6 7
2 18* 19 16 ▲
4 ▲ 1,694.4 4 258.5 ▲ .7 24* 100.0
5.5 4 82.1
Guosen Securities Co Ltd 12*
▲ 1.6 15* 61.5
China Renaissance Partners 12* 4* 6 -3 ▼ 448.0 26 -62.5 ▼ 5.9 2 40.4
Deutsche Bank 17* 47* 4
24* 13
-81.8 ▼
- - -
Gram Capital 1China International Capital Co ▲ 4.6 5 14.8Southwest Securities Co Ltd 3* 4* 14
First Quarter 2016 │ Mid-Market M&A Up To US$500m │ Financial Advisors
Chinese Involvement Mid-Market Rankings (MM20)
.1
42* 100.0140.5 - -
516.3 19 92.7 ▲ -
- - - -
109.4
China Galaxy Securities Co
China Securities Co Ltd 7
17* 13* 4 -1
Industrial & Comm Bank China
534.5
Exp. (%)
10 93.3
-2 ▼ 16.7China Construction Bank 17*
Rank
China Merchants Securities Co 5 2114.7▲
9* 1
Lazard
2016
9* 24* 7 5 ▲ 1,244.9 8 658.2 ▲ 2.3 12 20.5
1,853.9 2 4.4 ▲ .6
Industry Total
Huatai Securities Co Ltd 6
-
2015 # of
3 -4 ▼
# of Deals
11 -2
Dongxing Securities 23* - 3
Rank Value
79.2
1,844.8 3 169.9
▲311.1 -100.0
66* -
Haitong Securities Co Ltd 9* 24* 7 5 ▲
8 2 ▲ 835.9 10 -4.0 ▼ 4.0 7 15.2-1 ▼
-36.1
527.4 17 301.4 ▲ 1.9 14 100.0
New Times Securities Co Ltd
- .2 42* 0.6
▲
867.7
▲
7 -28
▼
5
1,635.69Morgan Stanley 8 9*
5
513.7
▼ .1 57* 100.0
Chinese Mid-Market M&A up to US$500m by Target Industry Jan 1 - Mar 31
FTI Consulting Inc 17* - 4 4 ▲Great Wall Securities Co Ltd 23* 47* 3 2 ▲GF Securities 23* 18* 3 0 -Mizuho Financial Group 23* - 3 3 ▲Kingston Corporate Finance Ltd 23* 24* 3 1 ▲Aijian Securities Company Ltd 23*
54.8 - - -
3 3
60.8 ▲
2 ▲ 107.9 - -21.9 ▼ 11.2 1
- -52.0
1,390 238 ▲ 64,661.5 20.2 ▲ 123.3 34.6
https://www.thomsonone.com
▼ 2.9 9 100.0526.6 18 -
387.9 31 -38.8 ▼ .2
Visit http://dmi.thomsonreuters.com to View Archives and Order Custom League Tables
8 44.4Somerley 23* 6 3 -5 ▼
*tie
Source: Thomson Reuters/Freeman Consulting
** Fee exposure indicates each firm's mid-market fees from deals valued at up to US$500m as a percentage of its overall M&A fees in the relevant region.
Guoyuan Securities Co Ltd 17* 24*
18* 26
27*
27*
57*
27*
-
24* 6
2315* - 5 5 ▲
83.3
47* 3 2
2
▲ 3.3 - -76.3 ▼ .5
.5
▼ .1
Shenwan Hongyuan Securities Co 12* 13* 6 1 ▲
Citi
.5
20 179.3
3.3 - -
4 ▲ 158.4 - 32.0 ▲
Industrial Securities Co Ltd 23* 7*
▼100.0
42* 100.023Financial Advisor Rank Rank Deals
16 71.4 ▲
289.0 35
2016 Rank Value Advisor 2016 ** Fee
2.8
Rank Value per Advisor (US$m) Imputed Fees (US$m) †
▼
▲
0
3
2 ▲-
9 -
20* 100.0694.5 13 2906.5 ▲
100.0
US$m Rank
-84.8 ▼19.4 -
41.720* 100.0
- -74.1182.3 -
Bank of China Ltd 23*
Credit Suisse 23* 47*
- 1.3
426.7 27 -52.1 ▼ 3.2BDO 23*
3 ▲ 632.8 15 - - - - -
37*
645.7
† Imputed Fees shown are based on completed deal activity, whereas deal count & rank values are compiled based on announced deal activity.
11
32.2 ▲ .4 33*
Change in
37*37*
Duff & PhelpsJP MorganKPMGLa Compagnie FinancierePiraeus Bank SAQuam Securities Co LtdUBS
- 3 3 ▲47* 3 2 ▲47* 2 1 ▲47* 2 1 ▲
- 2 2 ▲- 2 2 ▲
47* 2 1 ▲- -
.4 33* 100.0- - -.4 33* 100.0
5.7 3 31.1
Golden Sun Securities Co LtdNuada LtdPacific SecuritiesSinolink Securities Co LtdBank of America Merrill Lynch
- 2 2 ▲47* 2 1 ▲
- 2 2 ▲9* 2 -4 ▼- 2 2 ▲
470.1 25 -43.3
14 - -305.2 - 270.8 ▲
8.8 --
-2.4 11 9.7
154.8 - - -190.2 - 3296.4 ▲
23*23*37*37*
476.5 24
37*37*
-401.5 - - -
816.9
37*
100.0.2 42* 100.0- - -- -
Donvex Capital LtdGoldman Sachs & CoAnglo Chinese Corp Finance
- 2 2 ▲47* 2 1 ▲
- 2 2 ▲
214.1 .4 33* 100.01.6 15* 15.5- - -
-▼-
▼-
-
Changjiang Securities Co Ltd 23* 47* 3
- - -313.6 - - -156.8 - - -
-
37*37*37*37*37*
-83.9 54 -90.0
- - -4.4 6 11.7.3 38*
-
200
400
600
800
1,000
1,200
1,400
1,600
1,800
2,000
$0
$20
$40
$60
$80
$100
$120
# of
Dea
ls
Ran
k Va
lue
(US
$b)
US$200 - 500m US$100 - 200m US$50 - 100m US$0 - 50m # of Deals
19.6%
14.4%
10.4%
8.8% 8.5%
7.9%
7.6%
7.0%
5.8%
5.7%
4.2% High Technology
Industrials
Real Estate
Materials
Energy and Power
Healthcare
Financials
Consumer Products and Services
Media and Entertainment
Consumer Staples
Retail
Telecommunications
19
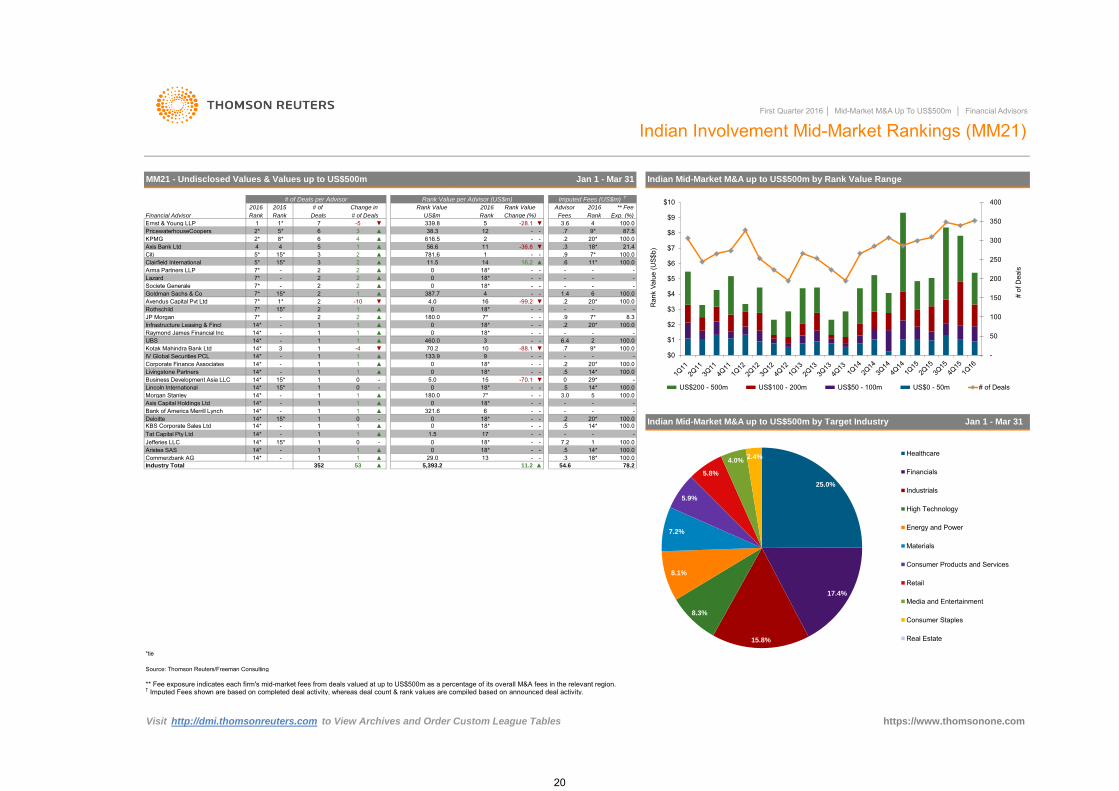
20* 100.0.5 14* 100.00 29*
18* 21.48* 6 4
▲ 781.6 1 - -
# of Deals per Advisor Rank Value per Advisor (US$m) Imputed Fees (US$m) †
11 -36.8 ▼ .3
2016 2015 # of Change in Rank Value 2016 Rank Value Advisor 2016 ** Fee
Financial Advisor Rank Rank Deals # of Deals US$m Rank Change (%) Fees Rank Exp. (%)
- - .2 20* 100.05 1 ▲
Citi 5* 15*
87.5▲ 616.5 2
.9 7* 100.0
Lazard 7* - 2 2 ▲ 0 18* - - - - -Societe Generale 7* -
Ernst & Young LLP 1 1* 7 -5 ▼ 339.8 5 -28.1 ▼ 3.6 4 100.0PricewaterhouseCoopers 2* 5* 6 3 ▲
2
3 2
KPMG 2*Axis Bank Ltd 4 4 56.6
Avendus Capital Pvt Ltd 7* 1* 2 -10 ▼ 4.0 16 -99.2 ▼ .2 20* 100.0Rothschild 7* 15* 2 1 - - - - -▲ 0 18*
3
Goldman Sachs & Co 7* 15* 2 1 ▲ 387.7 4 - - 1.4 6 100.0
Infrastructure Leasing & Fincl 14* - 1 1 ▲ 0 18* - - .2 20* 100.0Raymond James Financial Inc 14* - 1 1 ▲ 0 18* -
- 2
- - -
2 ▲ 180.0 7* - - .9 7*
460.0UBS 14* --
14*14*14*14*14*14*
Kotak Mahindra Bank LtdIV Global Securities PCLCorporate Finance AssociatesLivingstone PartnersBusiness Development Asia LLCLincoln International
3 1 -4 ▼- 1 1 ▲- 1
0
78.2
Indian Mid-Market M&A up to US$500m by Target Industry Jan 1 - Mar 31
https://www.thomsonone.com
352 53 ▲ 5,393.2 11.2 ▲ 54.6
Visit http://dmi.thomsonreuters.com to View Archives and Order Custom League Tables
15* 1 0 - 18* - - .5 14* 100.0
*tie
Source: Thomson Reuters/Freeman Consulting
** Fee exposure indicates each firm's mid-market fees from deals valued at up to US$500m as a percentage of its overall M&A fees in the relevant region.† Imputed Fees shown are based on completed deal activity, whereas deal count & rank values are compiled based on announced deal activity.
14*14*14*14*14*14*14*14*14*
-100.0100.0
-100.0100.0100.0
Industry Total
8.3
- - 6.4 2 100.0
JP Morgan 7*
Arma Partners LLP 7* - 2 2 ▲ 0
First Quarter 2016 │ Mid-Market M&A Up To US$500m │ Financial Advisors
Indian Involvement Mid-Market Rankings (MM21)
MM21 - Undisclosed Values & Values up to US$500m Jan 1 - Mar 31 Indian Mid-Market M&A up to US$500m by Rank Value Range
38.3 12 - - .7 9*
- -
2 ▲ 0 18*
1 1 ▲
- - - - -
1 ▲- 1 1 ▲
15* 1 0 -
70.2 10 -88.1 ▼133.9 9 - -
0 18* - -0 18* - -
5.0 15 -70.1 ▼ -
.7 9* 100.0- - -.2
18* - - -5* 15* 2 ▲ 11.5 100.0Clairfield International 3 14 16.2 ▲ .6 11*
---
15*--
15*--
1 ▲1 1 ▲1 1 ▲1 0 -1 1 ▲1 1 ▲1 0 -1 1 ▲1 1 ▲
1 3.0--.2.5-
7.2.5.3
-29.0 13 - -
180.0 7* 5--
20*14*
-1
14*18*
100.0-
Morgan StanleyAxis Capital Holdings LtdBank of America Merrill LynchDeloitteKBS Corporate Sales LtdTat Capital Pty LtdJefferies LLCAristea SASCommerzbank AG
-0 18* -
321.6 6 -0 18* -0 18* -
1.5 17 -0 18* -0 18* -
-------
-
50
100
150
200
250
300
350
400
$0
$1
$2
$3
$4
$5
$6
$7
$8
$9
$10
# of
Dea
ls
Ran
k Va
lue
(US
$b)
US$200 - 500m US$100 - 200m US$50 - 100m US$0 - 50m # of Deals
25.0%
17.4%
15.8%
8.3%
8.1%
7.2%
5.9%
5.8%
4.0% 2.4% Healthcare
Financials
Industrials
High Technology
Energy and Power
Materials
Consumer Products and Services
Retail
Media and Entertainment
Consumer Staples
Real Estate
20

-
-
-
-
-
Asia-PacificKelvin BianTel: +852 3761 1852E-mail: [email protected]
-JapanKaori Motohashi (Ishida) Tel: +813 6441 1338
-
A tender/merger transaction is considered to be effective at the time of consummation of the merger or the date on which it is declared wholly unconditional.
Financial and legal advisors receive full credit for each deal on which they provide financial or legal advisory services, unless they represent minority sellers or advise on only a portion of the transaction or Thomson Reuters has not been made aware of their participation in that transaction. For pending transactions, advisors to targets of multiple bids receive credit for the transaction agreed to or, in the absence of an agreement, the value of the highest offer.
Any Involvement league tables include deals where the target, acquiror, or either ultimate parent are domiciled (nation of headquarters) in the specified region or nation.
League tables include rank eligible mergers, acquisitions, repurchases, spin-offs, self-tenders, minority stake purchases and debt restructurings.
League tables, commentary, and charts citing announced activity are based on Rank Date and include intended, pending, partially complete, completed, pending regulatory, and unconditional transactions. Rank Date is defined as the earliest public announcement of when a value can be applied to a transaction.
Americas
Ranking Criteria Summary
Announced league tables include all deals that were announced between January 1, 2016 and March 31, 2016 and of which Thomson Reuters was made aware. All current data and previous year's data is as of 06:00pm EST on April 11, 2016.
https://www.thomsonone.com
While Thomson Reuters has used reasonable endeavors to ensure that the information provided in this document is accurate and up to date as at the time of issue, neither Thomson Reuters nor its third party content providers shall be liable for any errors, inaccuracies or delays in the information, nor for any actions taken in reliance thereon, nor does it endorse any views or opinions of any third party content provider. Thomson Reuters disclaims all warranties, express or implied, as to the accuracy or completeness of any of the content provided, or as to the fitness of the content for any purpose to the extent permitted by law. The content herein is not appropriate for the purposes of making a decision to carry out a transaction or trade and does not provide any form of advice (investment, tax, legal) amounting to investment advice, nor make any recommendations or solicitations regarding particular financial instruments, investments or products, including the buying or selling of securities. Thomson Reuters has not undertaken any liability or obligation relating to the purchase or sale of securities for or by any person in connection with this document.
© 2016 Thomson Reuters. All rights reserved.
Thomson Reuters and the Thomson Reuters logo are registered trademarks and trademarks of Thomson Reuters and its affiliated companies. Any third party name or mark herein belongs to the relevant third party.
Europe, Middle East & AfricaEwelina Jarecka
Deals with undisclosed dollar values are rank eligible but with no corresponding Rank Value. Non-US dollar denominated transactions are converted to the US dollar equivalent at the time of announcement of terms.
First Quarter 2016 │ Mid-Market M&A Up To US$500m │ Financial Advisors
Robert Levine
E-mail: [email protected]
E-mail: [email protected]
E-mail: [email protected]
Tel: +44 (0) 207 542 2246
If you would like to participate in the submissionprocess, receive quarterly press releases, or havequestions about league table criteria pleasecontact:
Tel: +1 646 223 5682
21
Thomson Reuters Solutions for the Deal Making Community
FOR STRATEGY AND PLANNING TEAMSFOR INFORMATION PROFESSIONALSSDC Platinum is the world’s foremost financial transactions database, covering new issues, M&A, syndicated loans, private equity, project finance, poison pills, and more.
Solution for:• Market Analysis & Trends (Geography, Sector, Asset Class, Deal Type, Deal Size, etc.)• Deal Origination (Debt Maturity Analysis, Company Lifecycle including Private Equity)• Pitch Creation (Firm Credentials, Representative Acquirors)• M&A Targeting (Active Strategic/Sponsor Acquirors, Target Company Screener)• Negotiation (T&C Benchmarking)
Thomson Reuters Deals Business Intelligence enables you to slice and dice our renowned Deals and Fees data to create ad hoc reports, analyze market trends, benchmark your performance and identify opportunities – all within a tool built into your workflow in Excel®, saving you valuable time and giving you a competitive edge.
Solution for:• Conducting market analysis and identifying trends• Benchmarking your performance and monitoring competitors• Targeting clients by wallet size and banking relationship• Allocating resources more effectively by evaluating and analyzing lost deals
FOR INVESTMENT BANKERS
©2016 Thomson Reuters
evaluating and analyzing lost deals
Send us a sales enquiry at: financial.thomsonreuters.com/salesRead more about our products at: financial.thomsonreuters.com/products
To purchase individual Thomson reuters Deals or League Table reports, please contact our Thomson Reuters On Demand group:
Email: [email protected]
Access unique analysis for free anytime using Thomson Reuters Deals Intelligence website and receive regular updates, delivered direct to your inbox.
Go to: dmi.thomsonreuters.com/dealsintelligence
Thomson Reuters Eikon is the most intuitive and comprehensive way of staying informed. With natural-language search, you can quickly find global information,news, charts and analytics. Company and industry views provide top-level summaries, and then detailed information is just a click away. Identify new opportunities and gain deep understanding of markets, industries, companies and events.
Thomson Reuters Eikon also includes an Add-In for Microsoft® Office to help you increase your efficiency. From screening and targeting to comparables analysis, building league tables, valuing a company
and developing a client pitch book, you can do all this without leaving Microsoft Office. Search and autosuggest features in Excel make model-building easier.
Solution for:• Managing Client Relationships• Deal Origination• New Issues Pre-Marketing/Roadshows• Financial Modeling• Customized League Tables• Simple Deals screening• Valuation analysis and comparabledeal screening• On-brand pitch book creation
©2016 Thomson ReutersThomson Reuters and the Kinesis logo are trademarks of Thomson Reuters.
22