final solar noise report 020210
TRANSCRIPT
2/3/2010
NOISE REPORT
ODOT Solar Highway Project: West Linn Site Clackamas County
Prepared by:
Oregon Department of Transportation Geo-Environmental Section
February, 2010
2/3/2010
2
TABLE OF CONTENTS
1.0 SUMMARY.............................................................................................................. 3 2.0 BACKGROUND ...................................................................................................................3
2.1 Project Site and Surroundings …………………………………………………………...3 2.2 Applicable Regulations …………………………………………………………………….4 2.3 Background on Noise ………………………………………………………………………5
3.0 METHODOLOGY …………………………………………………………………… ……7 4.0 NOISE LEVELS ………………………………………………………………………… ..8
4.1 Solar Inverter Noise ………………………………………………………………………...8 4.2 Measured Noise Levels ……………………………………………………………….….10 4.3 Calculated Existing Noise Levels Before Inverter Installation ………………..…11 4.4 Calculated Noise Levels with Inverters …………………………………………..…...12 4.5 Discussion of Calculated Noise Levels for Specific Hours, Specific Seasons 13
5.0 ADDITIONAL SITE CHARACTERISTICS …………………………………………………..15 5.1 Topography………………………………………………………………………… 15 5.2 Noise Level Shielding from Trees ………………………………………………………15
6.0 CONCLUSIONS ………………………………………….……………………………….16 7.0 REFERENCES …………………………………………………………………………...16
Tables Table 1 Perceived Change in Noise Levels Table 2 Addition of Inverter Noise at 50 Feet Table 3 Inverter Noise Levels at Various Distances with Four Inverters at IM7 Table 4 Summary of Measured Noise Data for Average Noise Hour Table 5 Estimated Noise Levels at Average Traffic Noise Hour: Measured Noise Levels and
Calculated Inverter Noise Levels at Residential Receivers (Leq/dBA) Table 6 Estimated Noise Levels at Peak Traffic Noise Hour: Measured Noise Levels and
Calculated Inverter Noise Levels at Residential Receivers (Leq/dBA) Table 7 Estimated Noise Levels at Quiet Traffic Noise Hour: Measured Noise Levels and
Calculated Inverter Noise Levels at Residential Receivers (Leq/dBA) Table 8 Seasonal Changes in Noise Level Relative to Hour of Day Table 9 Comparison of New Source Contribution Noise Levels to Industrial New Source
Standard Table 10 Change in Noise Levels with Increasing Horizontal Distance from I-205 Figures Figure 1 Vicinity Map Figure 2 Noise Levels of Common Outdoor and Indoor Activities Figure 3 Noise Measurements and Calculated Noise with Inverter Noise Contribution Figure 4 Changes in Noise Levels at Residences by Hour of Day Appendices Appendix A Additional Noise Levels for Additional Inverter Scenarios Appendix B Noise Monitoring Sheets Appendix C Noise Monitoring Photographs
2/3/2010
3
NOISE REPORT Solar Highway Project
Clackamas County
1.0 Summary This report analyzes the potential changes in noise levels resulting from the proposed Solar Highway Project in West Linn, Oregon. The project will place solar arrays and inverters on the north side of I-205 to generate approximately 3,000,000 kilowatt-hours of renewable energy to power the Oregon transportation system. The project will place between 13,000 and 17,000 panels and ten 260 kilowatt (kW) inverters at the site. Solar inverters will be clustered at 3 separate locations with 3 to 4 inverters at each location for a total of 10 inverters. Changes to the noise environment which is dominated by the traffic noise from I-205, due to either the noise emitted from the solar inverters or as a result of on-site tree removal are analyzed in this report as part of the National Environmental Policy Act (NEPA) process. The conservative analysis determined that during the day the solar inverters will increase noise levels at residential receivers (receiver) by 2 dBA or less and that this change will not be perceptible to human ears1. However, in spring and summer, during the 1st hour and last two hours of daylight when traffic noise is reduced, solar inverters may increase noise levels at the closest residences by 3 dBA or less. This change is just perceptible to human ears. At night, the inverters will not emit any sound. The effects of tree removal on the project site will not cause clearly noticeable changes in noise levels (5 dBA). The trees slated for removal are not currently dense or tall enough to provide shielding for the residences located along the northern edge of the right-of-way (ROW) from I-205 traffic noise. Once the project is in place, additional noise monitoring will be conducted to determine if mitigation needs to be considered.
2.0 Background
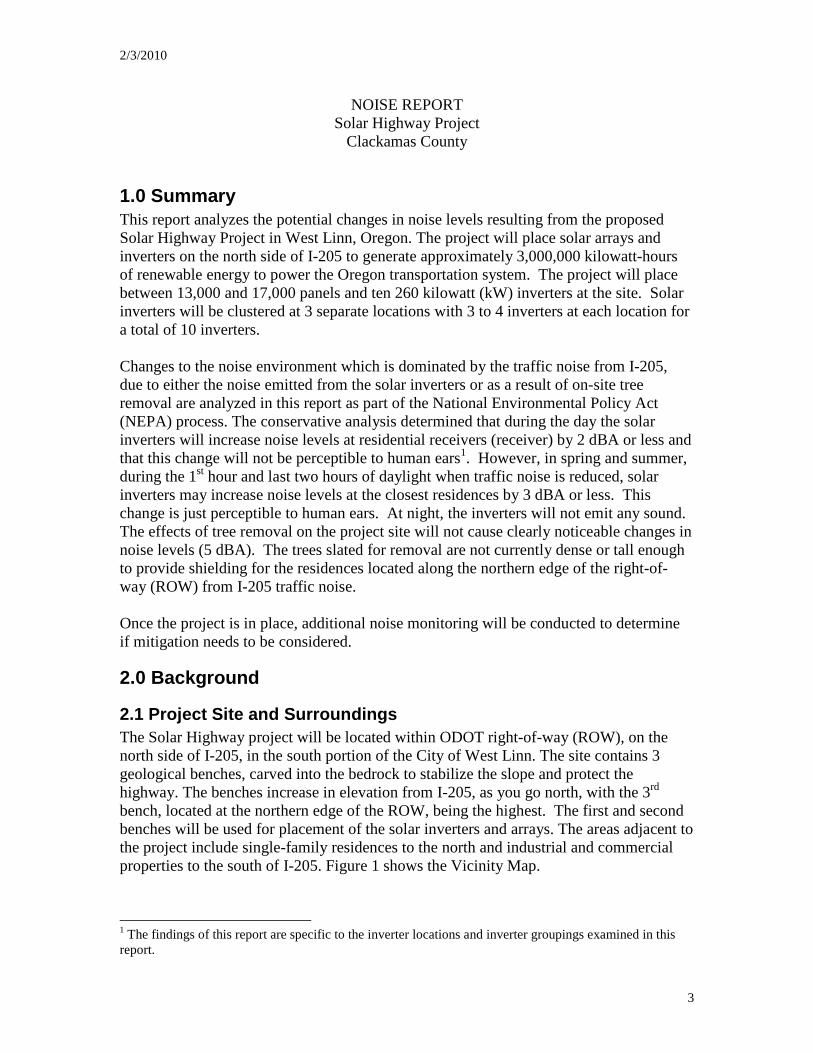
2.1 Project Site and Surroundings The Solar Highway project will be located within ODOT right-of-way (ROW), on the north side of I-205, in the south portion of the City of West Linn. The site contains 3 geological benches, carved into the bedrock to stabilize the slope and protect the highway. The benches increase in elevation from I-205, as you go north, with the 3rd bench, located at the northern edge of the ROW, being the highest. The first and second benches will be used for placement of the solar inverters and arrays. The areas adjacent to the project include single-family residences to the north and industrial and commercial properties to the south of I-205. Figure 1 shows the Vicinity Map.
1 The findings of this report are specific to the inverter locations and inverter groupings examined in this report.
2/3/2010
4
2.2 Applicable Regulations Noise impacts from highway transportation projects are regulated by 23 CFR 772, however, for this project there are no changes to the number of lanes or the vertical or horizontal roadway alignment or traffic volumes, distributions, or speeds; therefore, 23 CFR 772 is not applicable to this project.
2/3/2010
5
The Oregon Revised Statues (ORS Chapter 467) Noise Control and Oregon Administrative Rules (OAR Division 35) Noise Control Regulations were reviewed for applicability. Although the site is unzoned highway ROW and currently not classified as industrial use, the project could be considered a new industrial/commercial noise source and thus subject to state noise regulations (OAR 340-035-0035). The total noise level contributed from this new source is summarized in the results tables and compared to the applicable noise standard (Table 9). The National Environmental Policy Act (NEPA) requires that the environmental impacts from federally funded projects be evaluated and therefore the change in noise levels for the project with solar inverters will be evaluated. Because the site is unzoned highway right-of-way, the City of West Linn’s noise zoning codes are not applicable. The City staff requested that the Noise Report for the West Linn Solar Highway Project include a discussion of potential changes to the noise levels resulting from tree removal. The City also requested that ODOT provide a comparison of ambient noise levels to new noise levels with inverter noise contribution to determine if there would be an increase in noise levels.
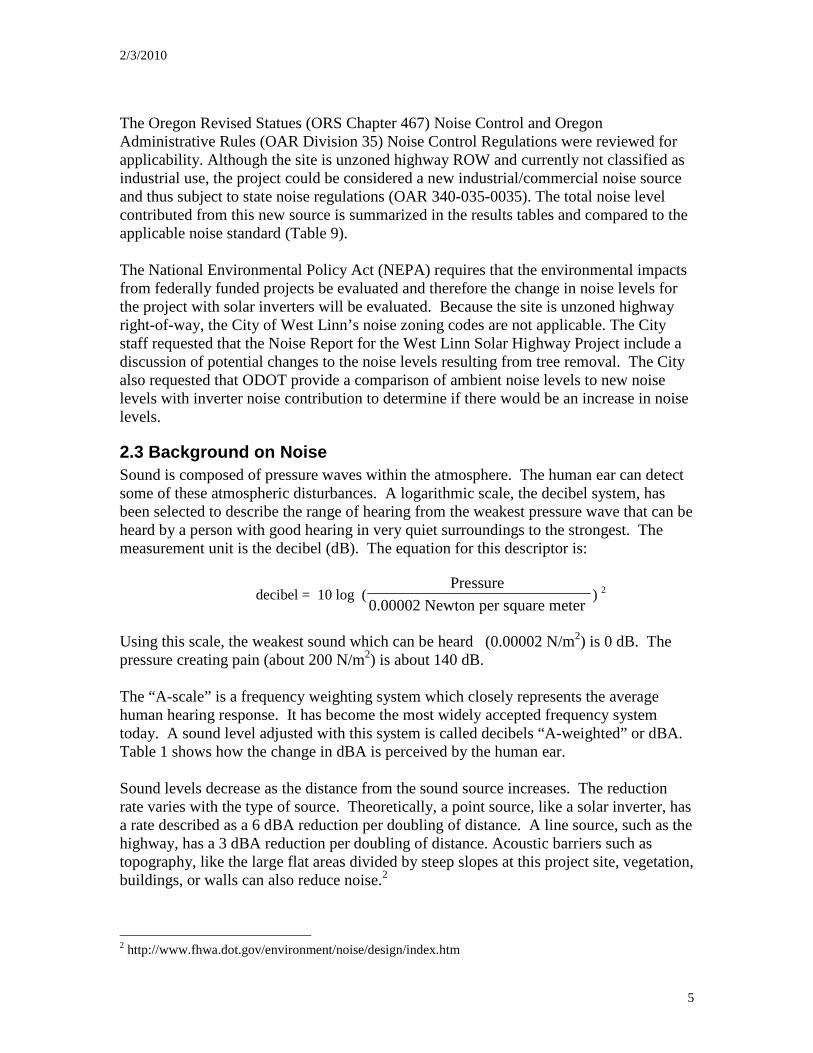
2.3 Background on Noise Sound is composed of pressure waves within the atmosphere. The human ear can detect some of these atmospheric disturbances. A logarithmic scale, the decibel system, has been selected to describe the range of hearing from the weakest pressure wave that can be heard by a person with good hearing in very quiet surroundings to the strongest. The measurement unit is the decibel (dB). The equation for this descriptor is:
decibel = 10 log ( Pressure
0.00002 Newton per square meter ) 2
Using this scale, the weakest sound which can be heard (0.00002 N/m2) is 0 dB. The pressure creating pain (about 200 N/m2) is about 140 dB. The “A-scale” is a frequency weighting system which closely represents the average human hearing response. It has become the most widely accepted frequency system today. A sound level adjusted with this system is called decibels “A-weighted” or dBA. Table 1 shows how the change in dBA is perceived by the human ear. Sound levels decrease as the distance from the sound source increases. The reduction rate varies with the type of source. Theoretically, a point source, like a solar inverter, has a rate described as a 6 dBA reduction per doubling of distance. A line source, such as the highway, has a 3 dBA reduction per doubling of distance. Acoustic barriers such as topography, like the large flat areas divided by steep slopes at this project site, vegetation, buildings, or walls can also reduce noise.2
2 http://www.fhwa.dot.gov/environment/noise/design/index.htm
2/3/2010
6
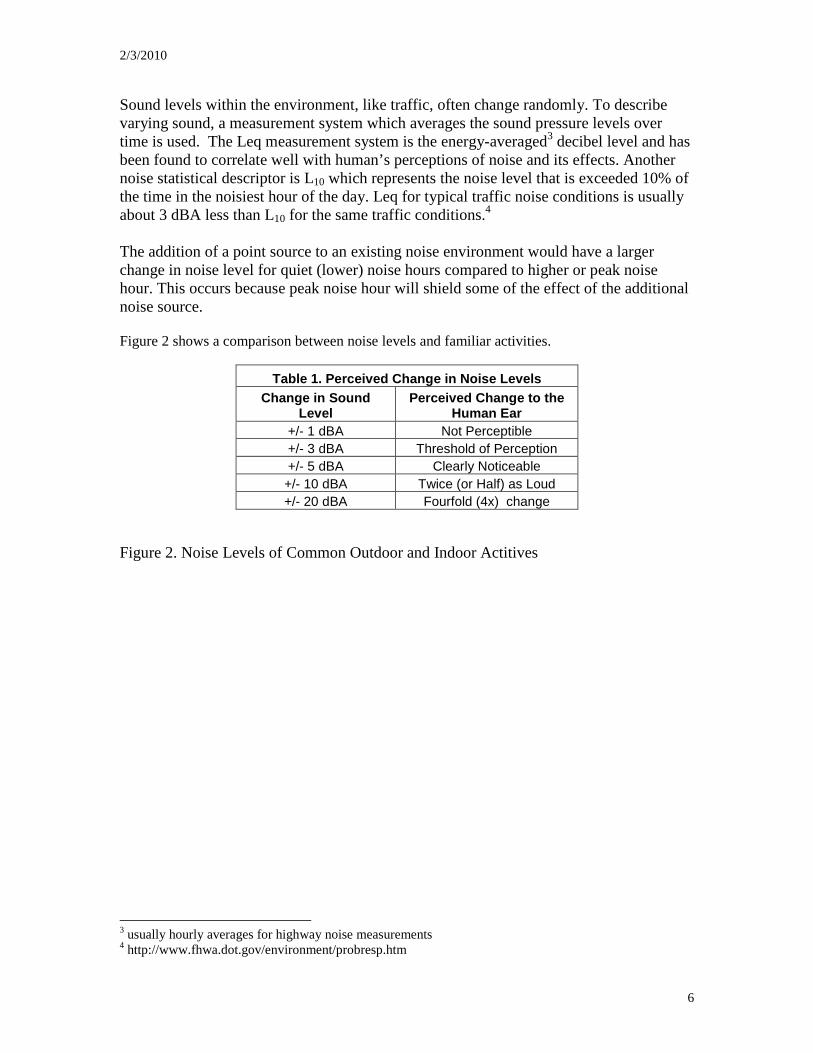
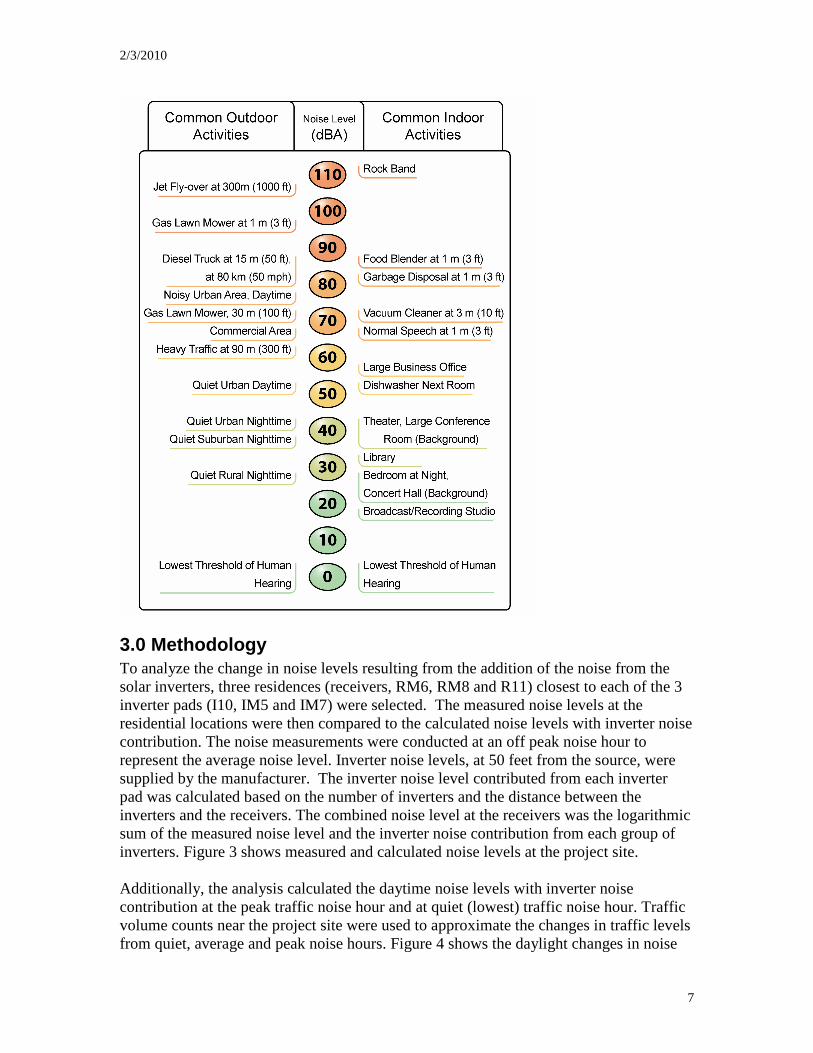
Sound levels within the environment, like traffic, often change randomly. To describe varying sound, a measurement system which averages the sound pressure levels over time is used. The Leq measurement system is the energy-averaged3 decibel level and has been found to correlate well with human’s perceptions of noise and its effects. Another noise statistical descriptor is L10 which represents the noise level that is exceeded 10% of the time in the noisiest hour of the day. Leq for typical traffic noise conditions is usually about 3 dBA less than L10 for the same traffic conditions.4 The addition of a point source to an existing noise environment would have a larger change in noise level for quiet (lower) noise hours compared to higher or peak noise hour. This occurs because peak noise hour will shield some of the effect of the additional noise source. Figure 2 shows a comparison between noise levels and familiar activities.
Table 1. Perceived Change in Noise Levels Change in Sound
Level Perceived Change to the
Human Ear +/- 1 dBA Not Perceptible +/- 3 dBA Threshold of Perception +/- 5 dBA Clearly Noticeable +/- 10 dBA Twice (or Half) as Loud +/- 20 dBA Fourfold (4x) change
Figure 2. Noise Levels of Common Outdoor and Indoor Actitives
3 usually hourly averages for highway noise measurements 4 http://www.fhwa.dot.gov/environment/probresp.htm
2/3/2010
7
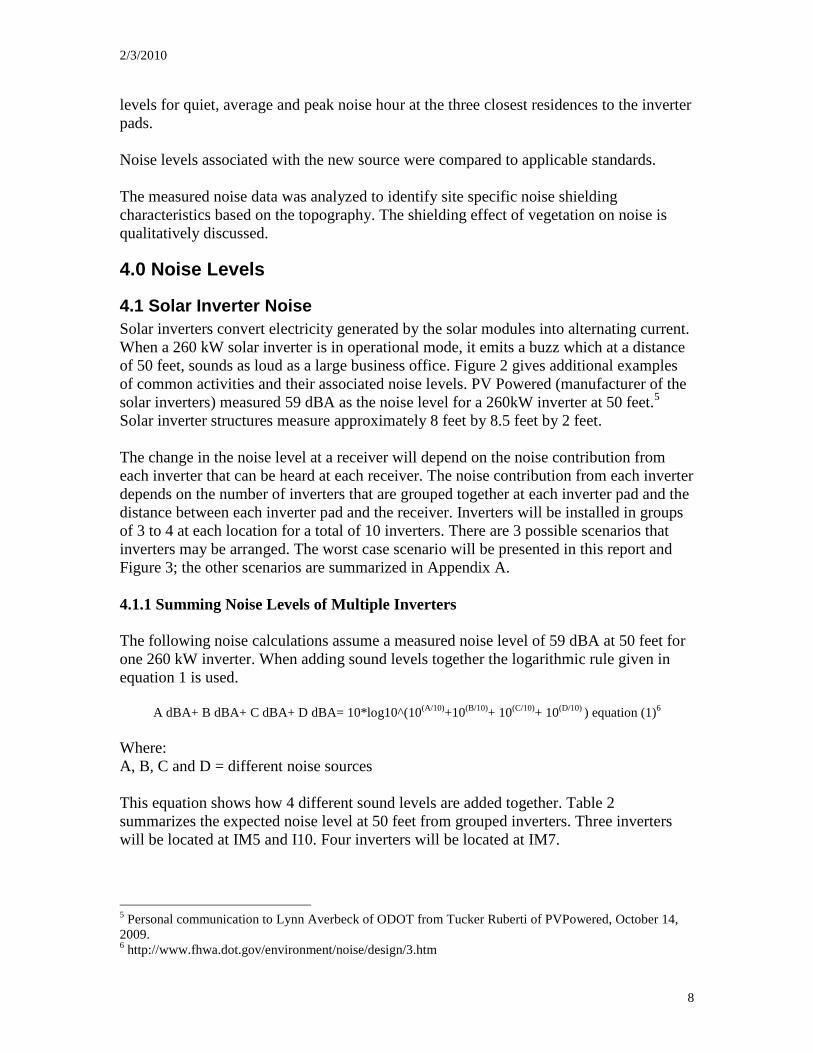
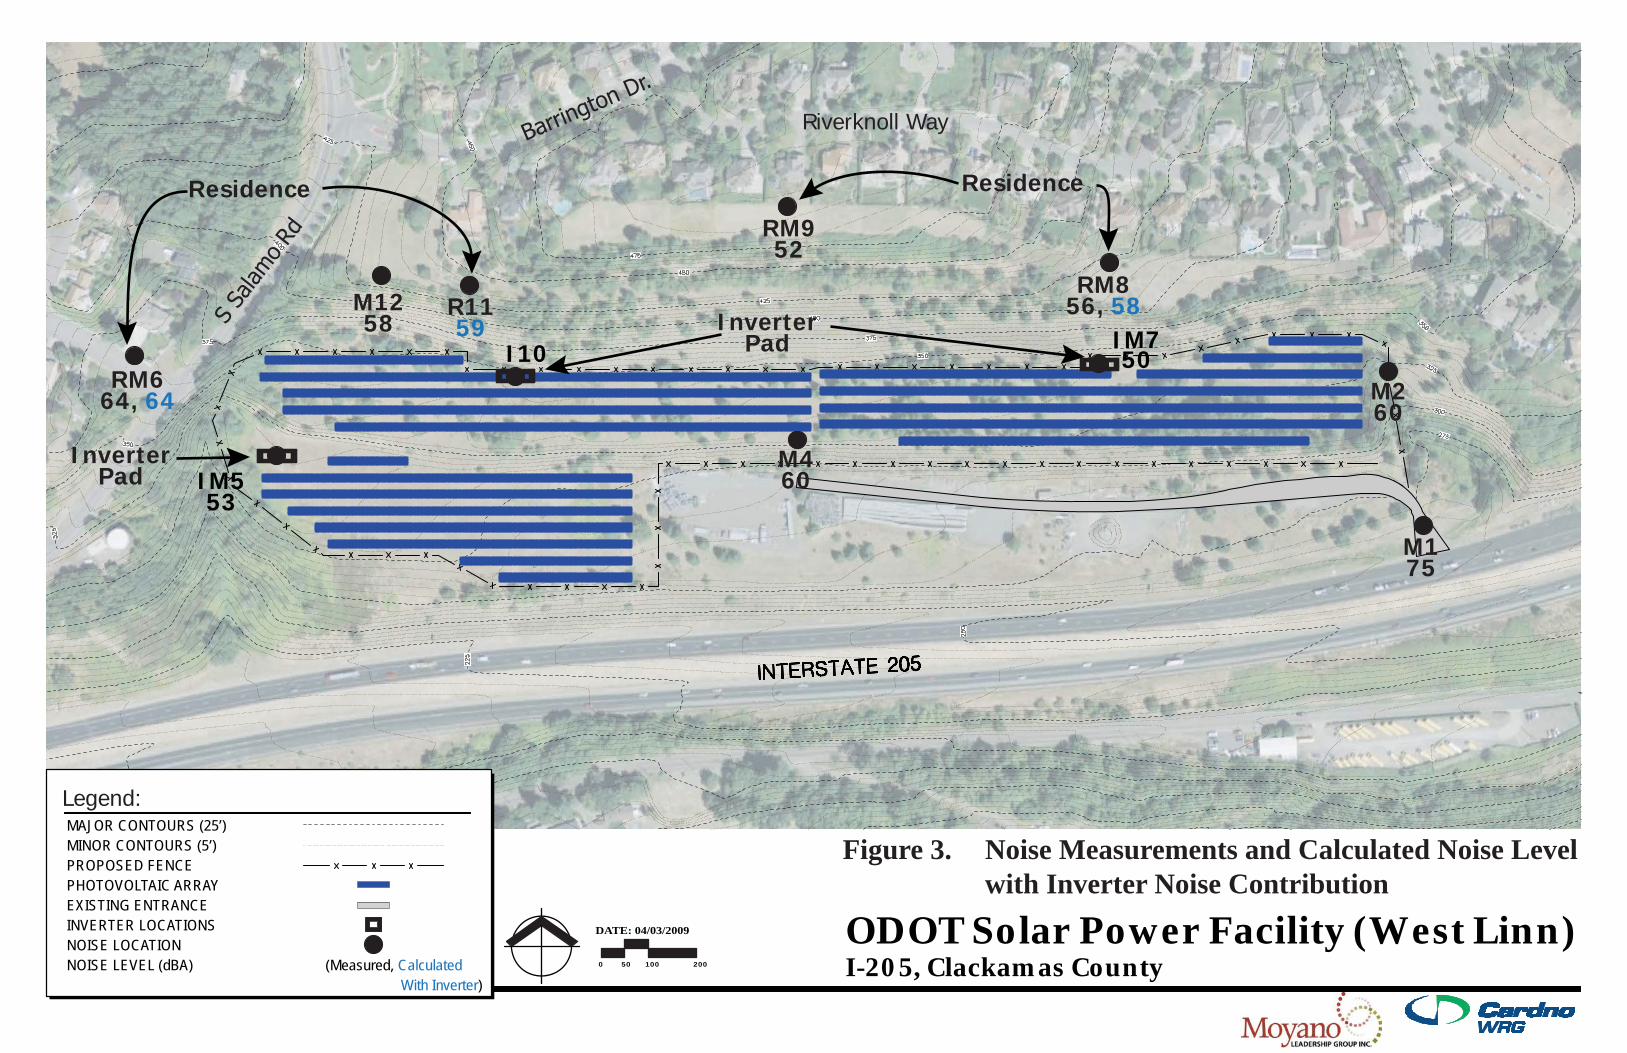
3.0 Methodology To analyze the change in noise levels resulting from the addition of the noise from the solar inverters, three residences (receivers, RM6, RM8 and R11) closest to each of the 3 inverter pads (I10, IM5 and IM7) were selected. The measured noise levels at the residential locations were then compared to the calculated noise levels with inverter noise contribution. The noise measurements were conducted at an off peak noise hour to represent the average noise level. Inverter noise levels, at 50 feet from the source, were supplied by the manufacturer. The inverter noise level contributed from each inverter pad was calculated based on the number of inverters and the distance between the inverters and the receivers. The combined noise level at the receivers was the logarithmic sum of the measured noise level and the inverter noise contribution from each group of inverters. Figure 3 shows measured and calculated noise levels at the project site. Additionally, the analysis calculated the daytime noise levels with inverter noise contribution at the peak traffic noise hour and at quiet (lowest) traffic noise hour. Traffic volume counts near the project site were used to approximate the changes in traffic levels from quiet, average and peak noise hours. Figure 4 shows the daylight changes in noise
2/3/2010
8
levels for quiet, average and peak noise hour at the three closest residences to the inverter pads. Noise levels associated with the new source were compared to applicable standards. The measured noise data was analyzed to identify site specific noise shielding characteristics based on the topography. The shielding effect of vegetation on noise is qualitatively discussed.
4.0 Noise Levels
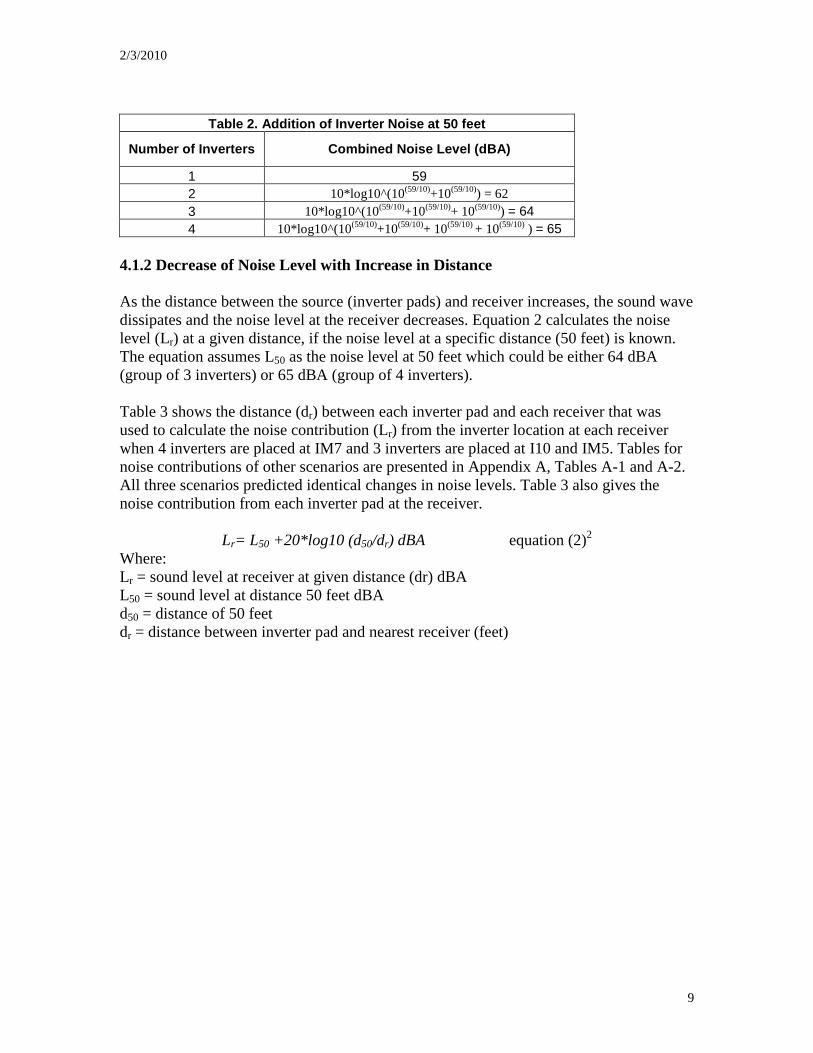
4.1 Solar Inverter Noise Solar inverters convert electricity generated by the solar modules into alternating current. When a 260 kW solar inverter is in operational mode, it emits a buzz which at a distance of 50 feet, sounds as loud as a large business office. Figure 2 gives additional examples of common activities and their associated noise levels. PV Powered (manufacturer of the solar inverters) measured 59 dBA as the noise level for a 260kW inverter at 50 feet.5 Solar inverter structures measure approximately 8 feet by 8.5 feet by 2 feet. The change in the noise level at a receiver will depend on the noise contribution from each inverter that can be heard at each receiver. The noise contribution from each inverter depends on the number of inverters that are grouped together at each inverter pad and the distance between each inverter pad and the receiver. Inverters will be installed in groups of 3 to 4 at each location for a total of 10 inverters. There are 3 possible scenarios that inverters may be arranged. The worst case scenario will be presented in this report and Figure 3; the other scenarios are summarized in Appendix A. 4.1.1 Summing Noise Levels of Multiple Inverters The following noise calculations assume a measured noise level of 59 dBA at 50 feet for one 260 kW inverter. When adding sound levels together the logarithmic rule given in equation 1 is used.
A dBA+ B dBA+ C dBA+ D dBA= 10*log10^(10(A/10)+10(B/10)+ 10(C/10)+ 10(D/10) ) equation (1)6 Where: A, B, C and D = different noise sources This equation shows how 4 different sound levels are added together. Table 2 summarizes the expected noise level at 50 feet from grouped inverters. Three inverters will be located at IM5 and I10. Four inverters will be located at IM7.
5 Personal communication to Lynn Averbeck of ODOT from Tucker Ruberti of PVPowered, October 14, 2009. 6 http://www.fhwa.dot.gov/environment/noise/design/3.htm
2/3/2010
9
Table 2. Addition of Inverter Noise at 50 feet
Number of Inverters Combined Noise Level (dBA)
1 59 2 10*log10^(10(59/10)+10(59/10)) = 62 3 10*log10^(10(59/10)+10(59/10)+ 10(59/10)) = 64 4 10*log10^(10(59/10)+10(59/10)+ 10(59/10) + 10(59/10) ) = 65
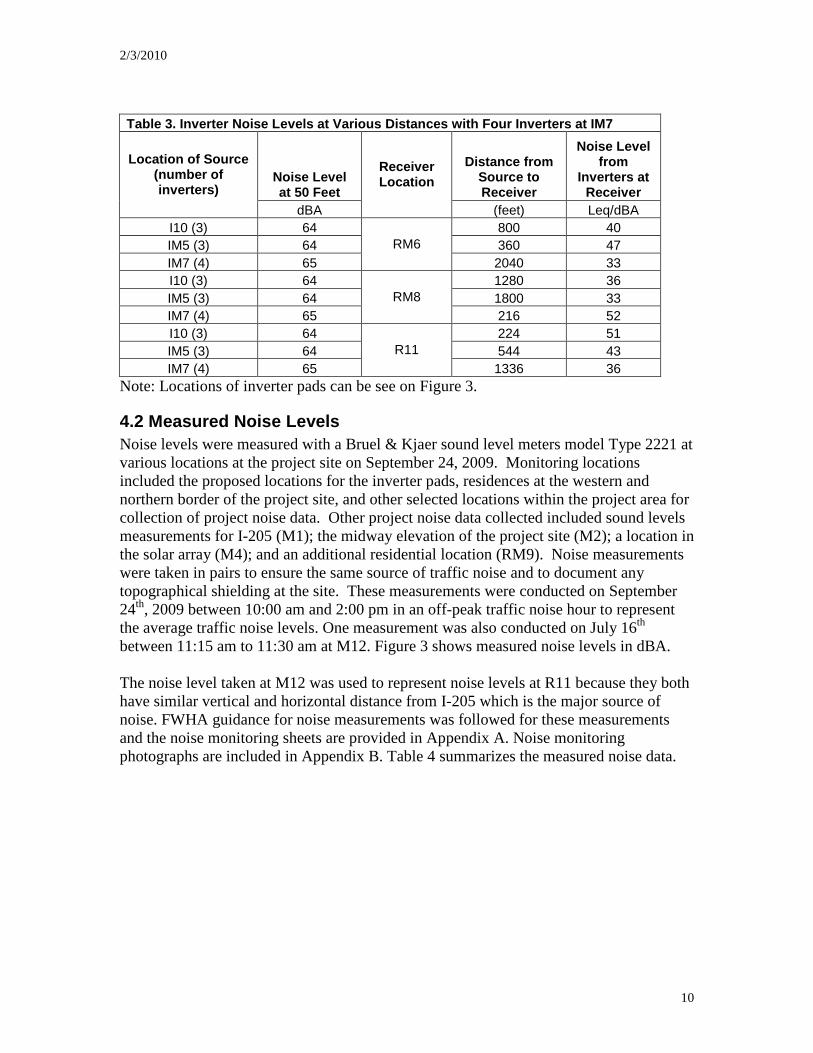
4.1.2 Decrease of Noise Level with Increase in Distance As the distance between the source (inverter pads) and receiver increases, the sound wave dissipates and the noise level at the receiver decreases. Equation 2 calculates the noise level (Lr) at a given distance, if the noise level at a specific distance (50 feet) is known. The equation assumes L50 as the noise level at 50 feet which could be either 64 dBA (group of 3 inverters) or 65 dBA (group of 4 inverters). Table 3 shows the distance (dr) between each inverter pad and each receiver that was used to calculate the noise contribution (Lr) from the inverter location at each receiver when 4 inverters are placed at IM7 and 3 inverters are placed at I10 and IM5. Tables for noise contributions of other scenarios are presented in Appendix A, Tables A-1 and A-2. All three scenarios predicted identical changes in noise levels. Table 3 also gives the noise contribution from each inverter pad at the receiver.
Lr= L50 +20*log10 (d50/dr) dBA equation (2)2
Where: Lr = sound level at receiver at given distance (dr) dBA L50 = sound level at distance 50 feet dBA d50 = distance of 50 feet dr = distance between inverter pad and nearest receiver (feet)
2/3/2010
10
Table 3. Inverter Noise Levels at Various Distances with Four Inverters at IM7
Noise Level at 50 Feet
Distance from Source to Receiver
Noise Level from
Inverters at Receiver
Location of Source (number of inverters)
dBA
Receiver Location
(feet) Leq/dBA I10 (3) 64 800 40 IM5 (3) 64 360 47 IM7 (4) 65
RM6 2040 33
I10 (3) 64 1280 36 IM5 (3) 64 1800 33 IM7 (4) 65
RM8 216 52
I10 (3) 64 224 51 IM5 (3) 64 544 43 IM7 (4) 65
R11 1336 36
Note: Locations of inverter pads can be see on Figure 3.
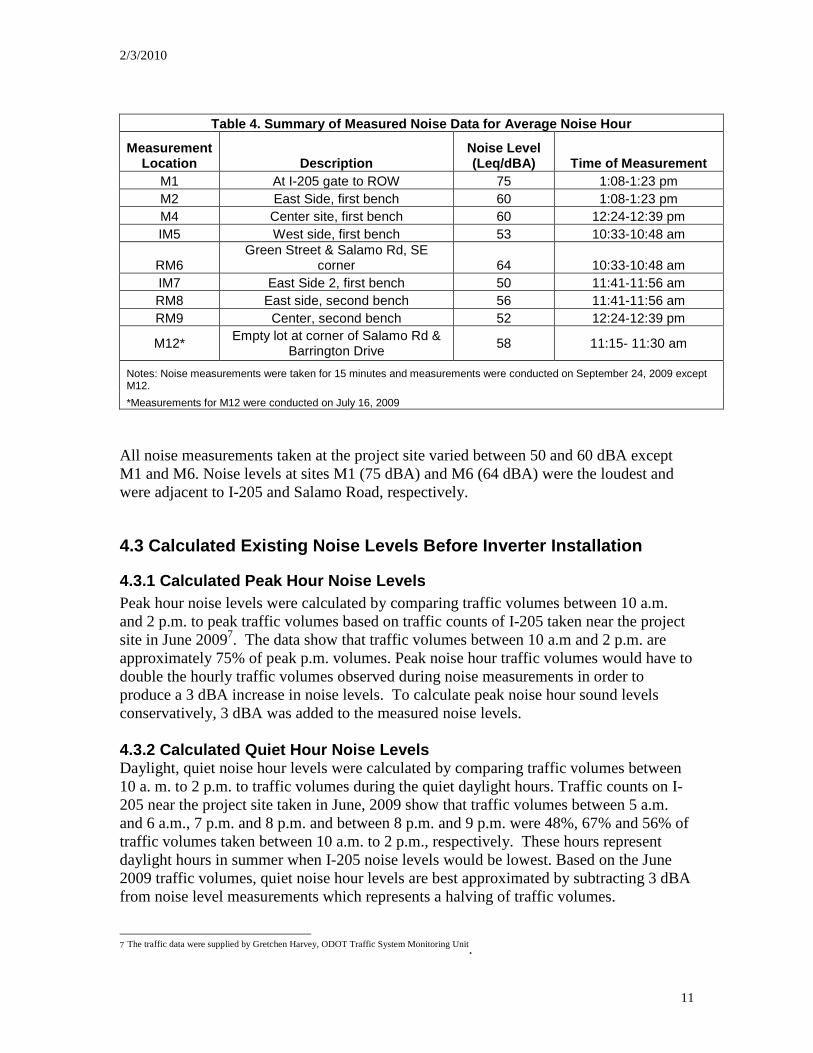
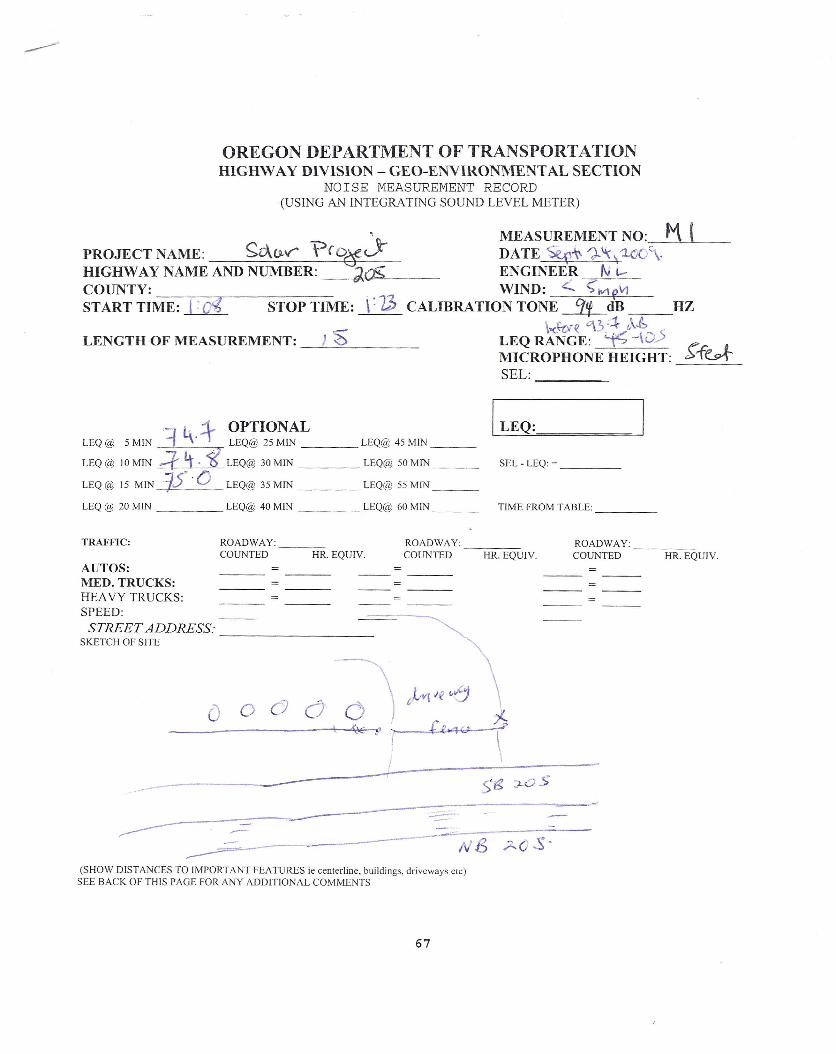
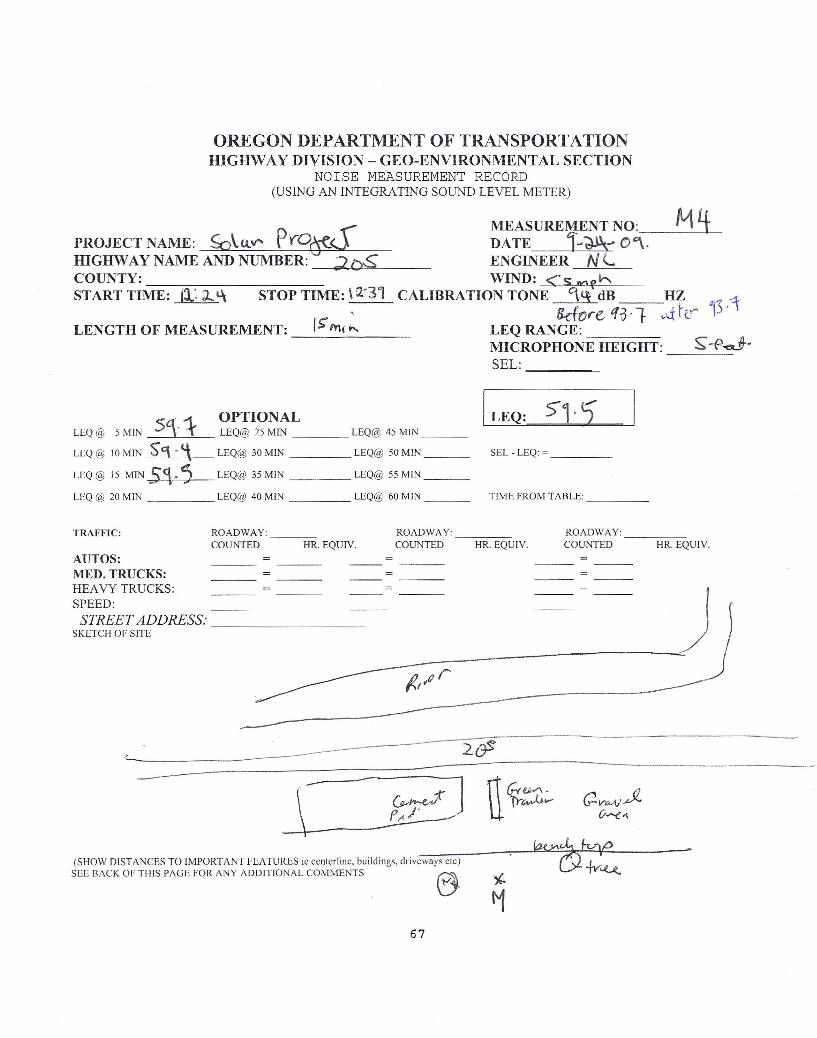
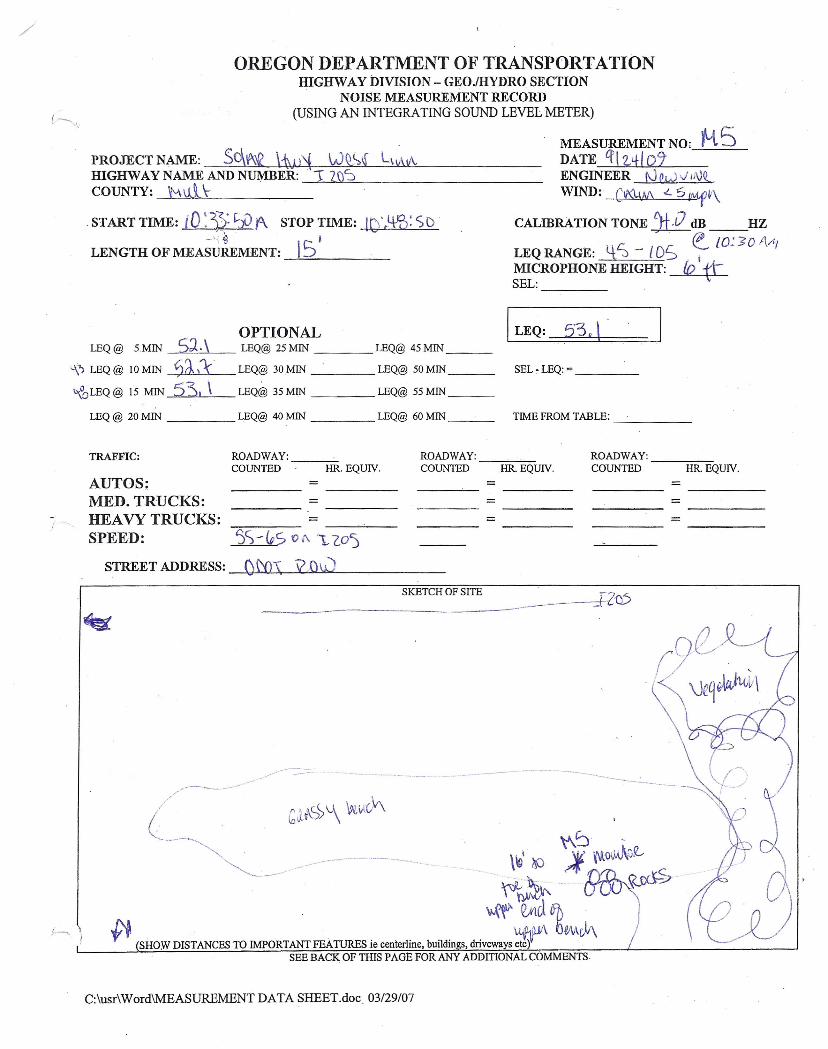
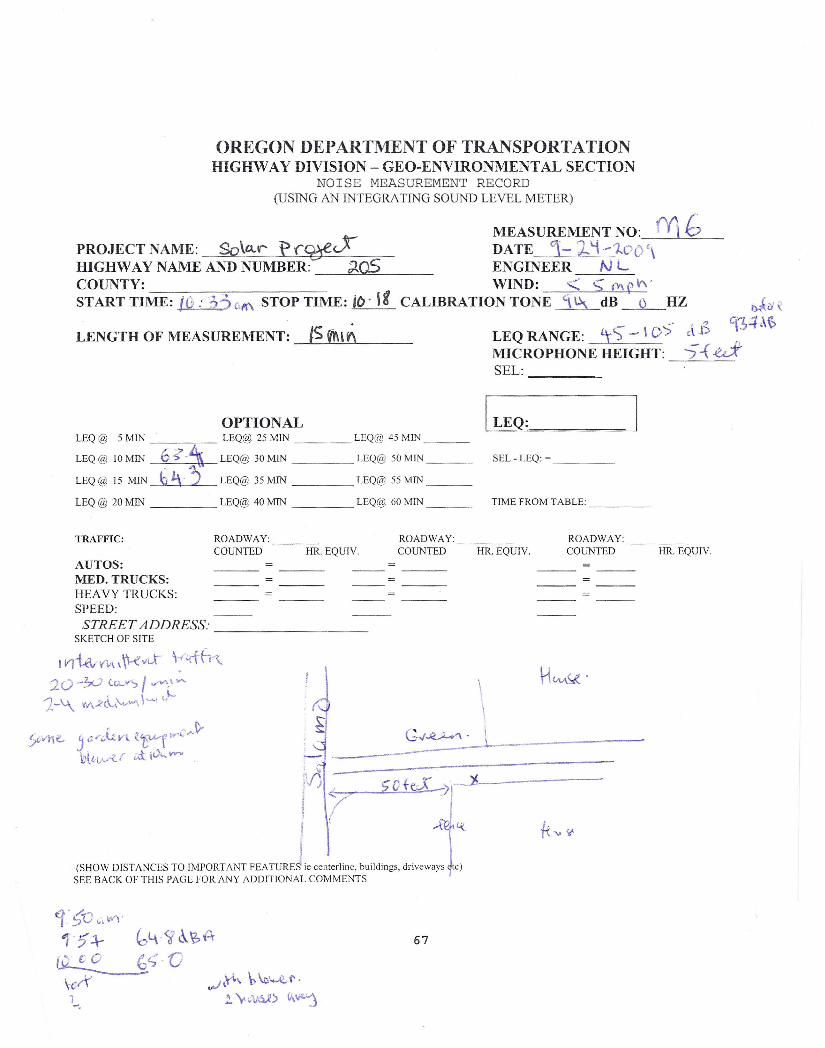
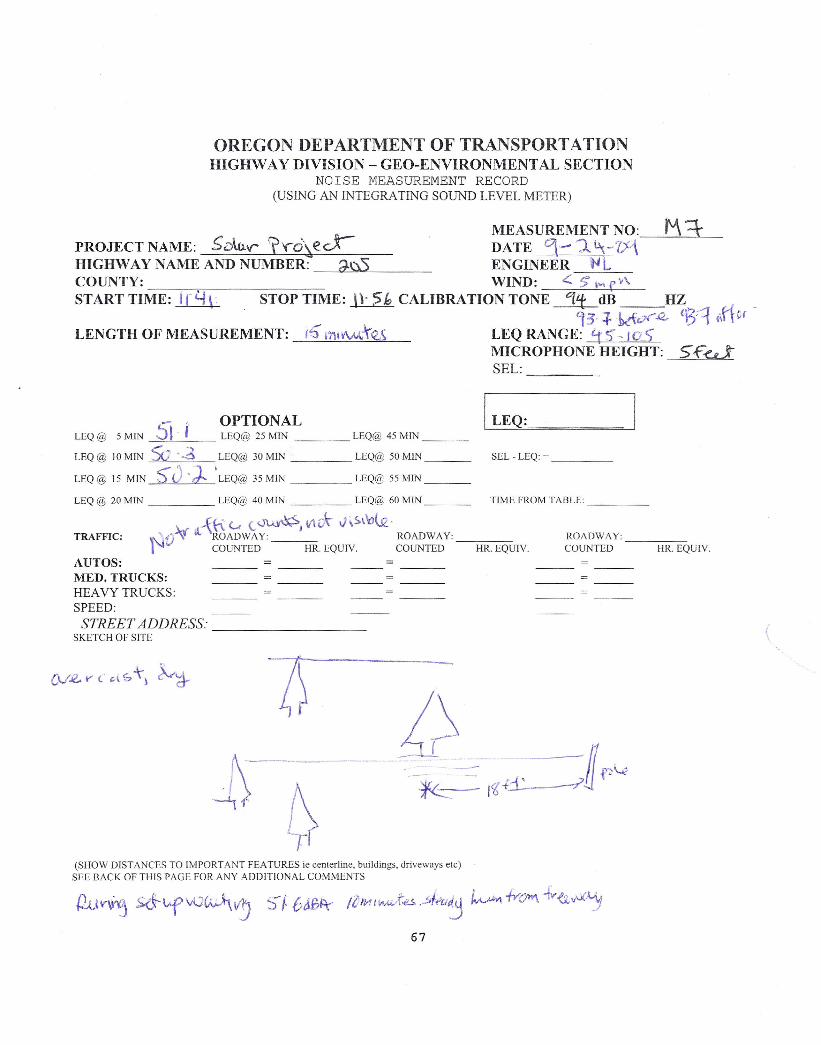
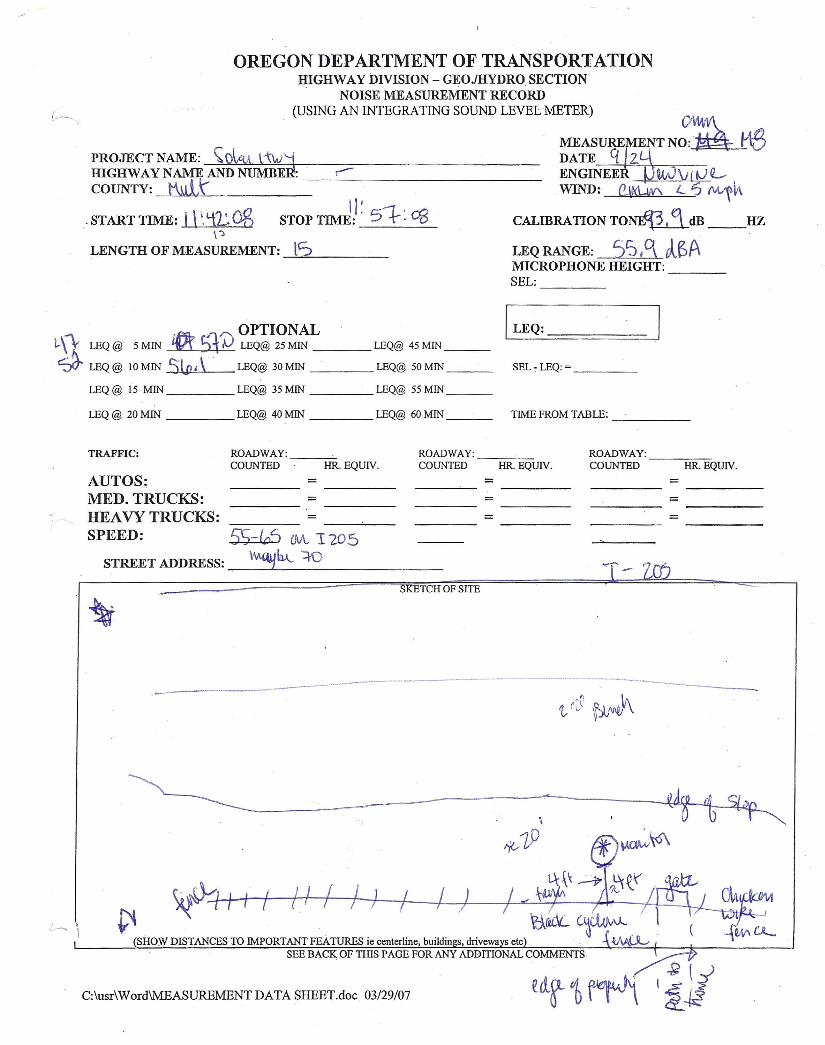
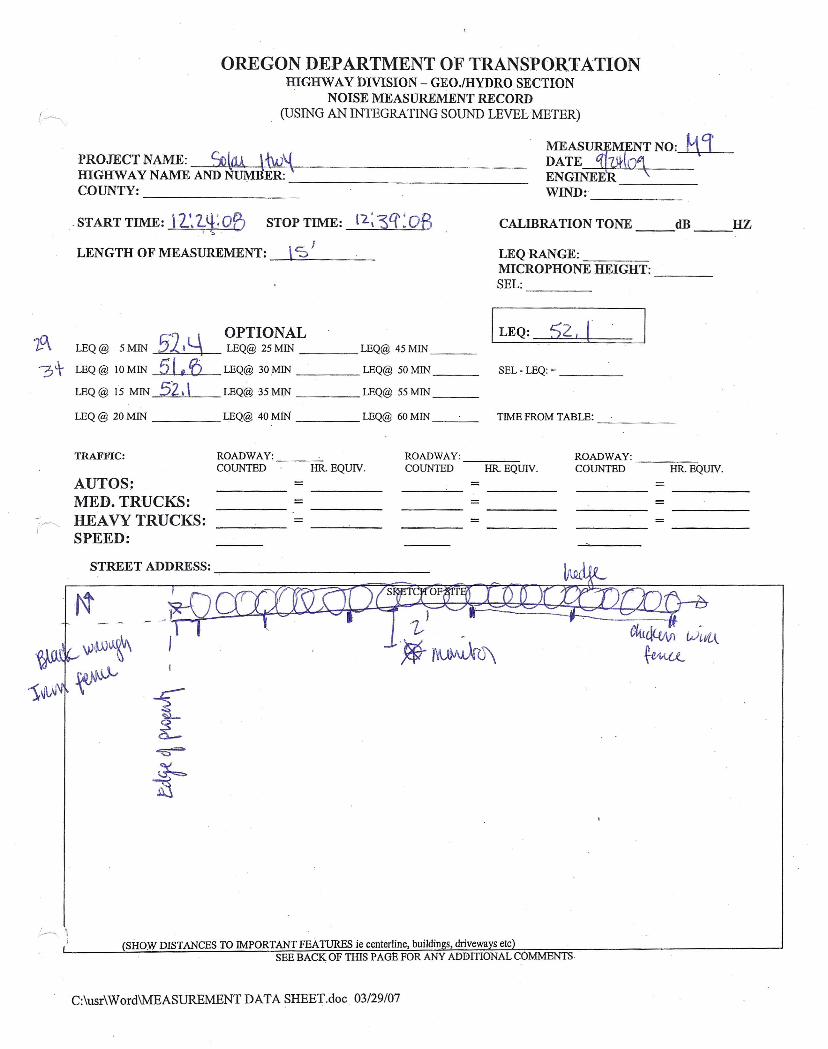
4.2 Measured Noise Levels Noise levels were measured with a Bruel & Kjaer sound level meters model Type 2221 at various locations at the project site on September 24, 2009. Monitoring locations included the proposed locations for the inverter pads, residences at the western and northern border of the project site, and other selected locations within the project area for collection of project noise data. Other project noise data collected included sound levels measurements for I-205 (M1); the midway elevation of the project site (M2); a location in the solar array (M4); and an additional residential location (RM9). Noise measurements were taken in pairs to ensure the same source of traffic noise and to document any topographical shielding at the site. These measurements were conducted on September 24th, 2009 between 10:00 am and 2:00 pm in an off-peak traffic noise hour to represent the average traffic noise levels. One measurement was also conducted on July 16th between 11:15 am to 11:30 am at M12. Figure 3 shows measured noise levels in dBA. The noise level taken at M12 was used to represent noise levels at R11 because they both have similar vertical and horizontal distance from I-205 which is the major source of noise. FWHA guidance for noise measurements was followed for these measurements and the noise monitoring sheets are provided in Appendix A. Noise monitoring photographs are included in Appendix B. Table 4 summarizes the measured noise data.
2/3/2010
11
Table 4. Summary of Measured Noise Data for Average Noise Hour
Measurement Location Description
Noise Level (Leq/dBA) Time of Measurement
M1 At I-205 gate to ROW 75 1:08-1:23 pm M2 East Side, first bench 60 1:08-1:23 pm M4 Center site, first bench 60 12:24-12:39 pm IM5 West side, first bench 53 10:33-10:48 am
RM6 Green Street & Salamo Rd, SE
corner 64 10:33-10:48 am IM7 East Side 2, first bench 50 11:41-11:56 am RM8 East side, second bench 56 11:41-11:56 am RM9 Center, second bench 52 12:24-12:39 pm
M12* Empty lot at corner of Salamo Rd &
Barrington Drive 58 11:15- 11:30 am
Notes: Noise measurements were taken for 15 minutes and measurements were conducted on September 24, 2009 except M12.
*Measurements for M12 were conducted on July 16, 2009
All noise measurements taken at the project site varied between 50 and 60 dBA except M1 and M6. Noise levels at sites M1 (75 dBA) and M6 (64 dBA) were the loudest and were adjacent to I-205 and Salamo Road, respectively.
4.3 Calculated Existing Noise Levels Before Inverter Installation
4.3.1 Calculated Peak Hour Noise Levels Peak hour noise levels were calculated by comparing traffic volumes between 10 a.m. and 2 p.m. to peak traffic volumes based on traffic counts of I-205 taken near the project site in June 20097. The data show that traffic volumes between 10 a.m and 2 p.m. are approximately 75% of peak p.m. volumes. Peak noise hour traffic volumes would have to double the hourly traffic volumes observed during noise measurements in order to produce a 3 dBA increase in noise levels. To calculate peak noise hour sound levels conservatively, 3 dBA was added to the measured noise levels. 4.3.2 Calculated Quiet Hour Noise Levels Daylight, quiet noise hour levels were calculated by comparing traffic volumes between 10 a. m. to 2 p.m. to traffic volumes during the quiet daylight hours. Traffic counts on I-205 near the project site taken in June, 2009 show that traffic volumes between 5 a.m. and 6 a.m., 7 p.m. and 8 p.m. and between 8 p.m. and 9 p.m. were 48%, 67% and 56% of traffic volumes taken between 10 a.m. to 2 p.m., respectively. These hours represent daylight hours in summer when I-205 noise levels would be lowest. Based on the June 2009 traffic volumes, quiet noise hour levels are best approximated by subtracting 3 dBA from noise level measurements which represents a halving of traffic volumes. 7 The traffic data were supplied by Gretchen Harvey, ODOT Traffic System Monitoring Unit.
2/3/2010
12
4.4 Calculated Noise Levels with Inverters
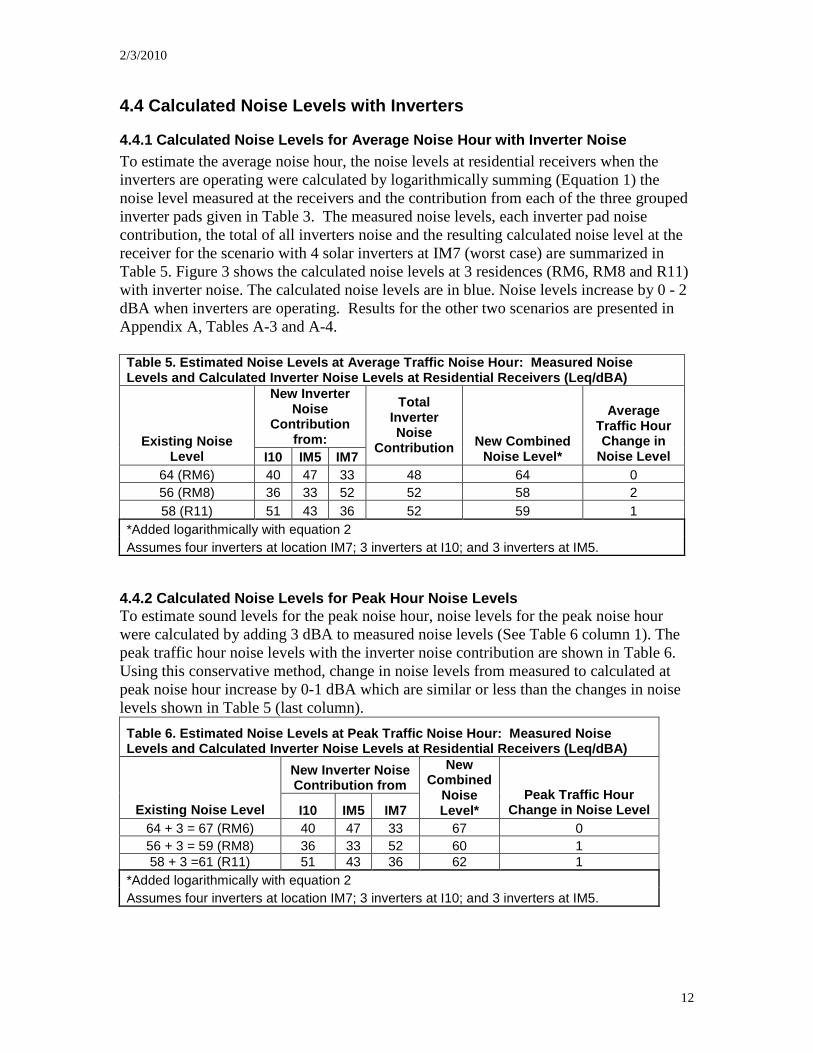
4.4.1 Calculated Noise Levels for Average Noise Hour with Inverter Noise To estimate the average noise hour, the noise levels at residential receivers when the inverters are operating were calculated by logarithmically summing (Equation 1) the noise level measured at the receivers and the contribution from each of the three grouped inverter pads given in Table 3. The measured noise levels, each inverter pad noise contribution, the total of all inverters noise and the resulting calculated noise level at the receiver for the scenario with 4 solar inverters at IM7 (worst case) are summarized in Table 5. Figure 3 shows the calculated noise levels at 3 residences (RM6, RM8 and R11) with inverter noise. The calculated noise levels are in blue. Noise levels increase by 0 - 2 dBA when inverters are operating. Results for the other two scenarios are presented in Appendix A, Tables A-3 and A-4. Table 5. Estimated Noise Levels at Average Traffic Noise Hour: Measured Noise Levels and Calculated Inverter Noise Levels at Residential Receivers (Leq/dBA)
New Inverter Noise
Contribution from: Existing Noise
Level I10 IM5 IM7
Total Inverter Noise
Contribution New Combined Noise Level*
Average Traffic Hour Change in
Noise Level 64 (RM6) 40 47 33 48 64 0 56 (RM8) 36 33 52 52 58 2 58 (R11) 51 43 36 52 59 1
*Added logarithmically with equation 2 Assumes four inverters at location IM7; 3 inverters at I10; and 3 inverters at IM5.
4.4.2 Calculated Noise Levels for Peak Hour Noise Levels To estimate sound levels for the peak noise hour, noise levels for the peak noise hour were calculated by adding 3 dBA to measured noise levels (See Table 6 column 1). The peak traffic hour noise levels with the inverter noise contribution are shown in Table 6. Using this conservative method, change in noise levels from measured to calculated at peak noise hour increase by 0-1 dBA which are similar or less than the changes in noise levels shown in Table 5 (last column).
Table 6. Estimated Noise Levels at Peak Traffic Noise Hour: Measured Noise Levels and Calculated Inverter Noise Levels at Residential Receivers (Leq/dBA)
New Inverter Noise Contribution from
Existing Noise Level I10 IM5 IM7
New Combined
Noise Level*
Peak Traffic Hour Change in Noise Level
64 + 3 = 67 (RM6) 40 47 33 67 0 56 + 3 = 59 (RM8) 36 33 52 60 1 58 + 3 =61 (R11) 51 43 36 62 1
*Added logarithmically with equation 2 Assumes four inverters at location IM7; 3 inverters at I10; and 3 inverters at IM5.
2/3/2010
13
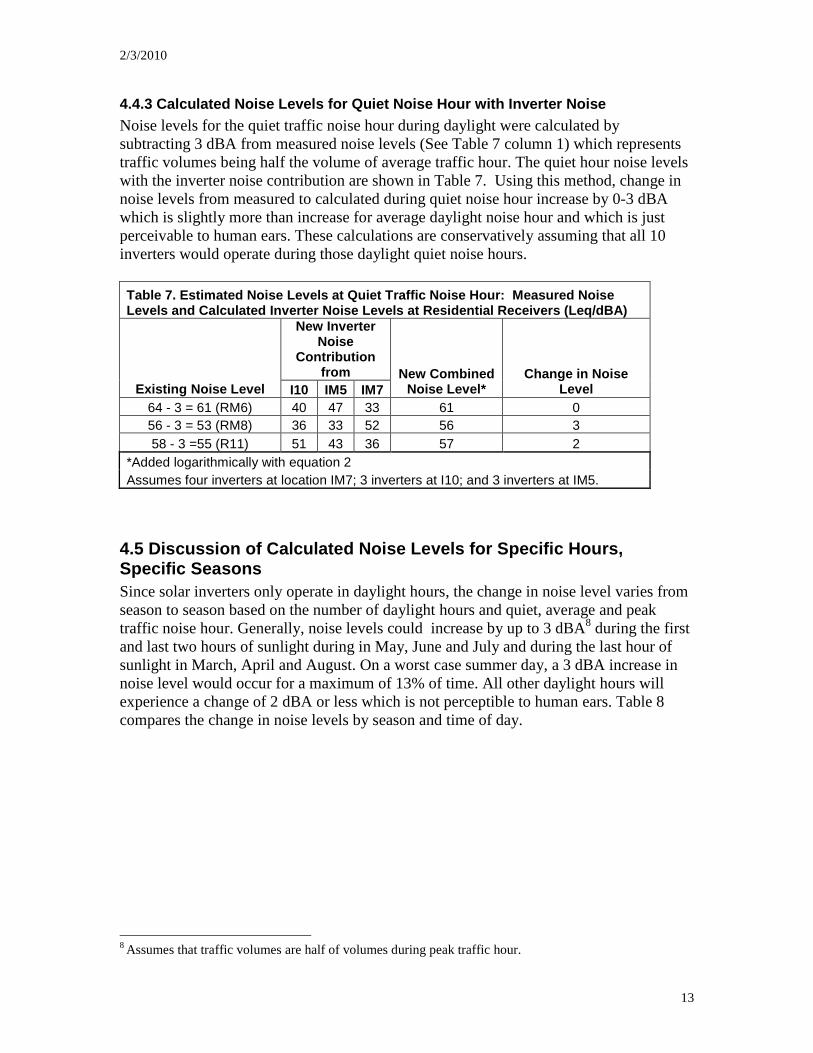
4.4.3 Calculated Noise Levels for Quiet Noise Hour with Inverter Noise Noise levels for the quiet traffic noise hour during daylight were calculated by subtracting 3 dBA from measured noise levels (See Table 7 column 1) which represents traffic volumes being half the volume of average traffic hour. The quiet hour noise levels with the inverter noise contribution are shown in Table 7. Using this method, change in noise levels from measured to calculated during quiet noise hour increase by 0-3 dBA which is slightly more than increase for average daylight noise hour and which is just perceivable to human ears. These calculations are conservatively assuming that all 10 inverters would operate during those daylight quiet noise hours. Table 7. Estimated Noise Levels at Quiet Traffic Noise Hour: Measured Noise Levels and Calculated Inverter Noise Levels at Residential Receivers (Leq/dBA)
New Inverter Noise
Contribution from
Existing Noise Level I10 IM5 IM7 New Combined
Noise Level* Change in Noise
Level 64 - 3 = 61 (RM6) 40 47 33 61 0 56 - 3 = 53 (RM8) 36 33 52 56 3 58 - 3 =55 (R11) 51 43 36 57 2
*Added logarithmically with equation 2 Assumes four inverters at location IM7; 3 inverters at I10; and 3 inverters at IM5.
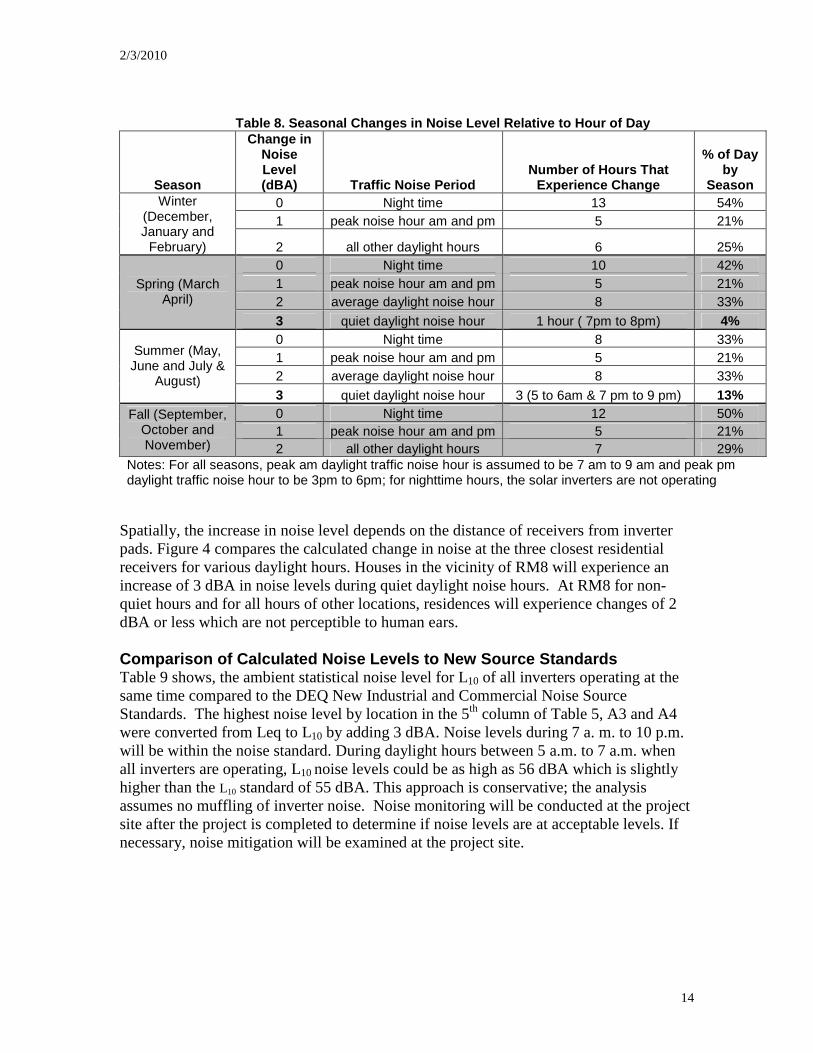
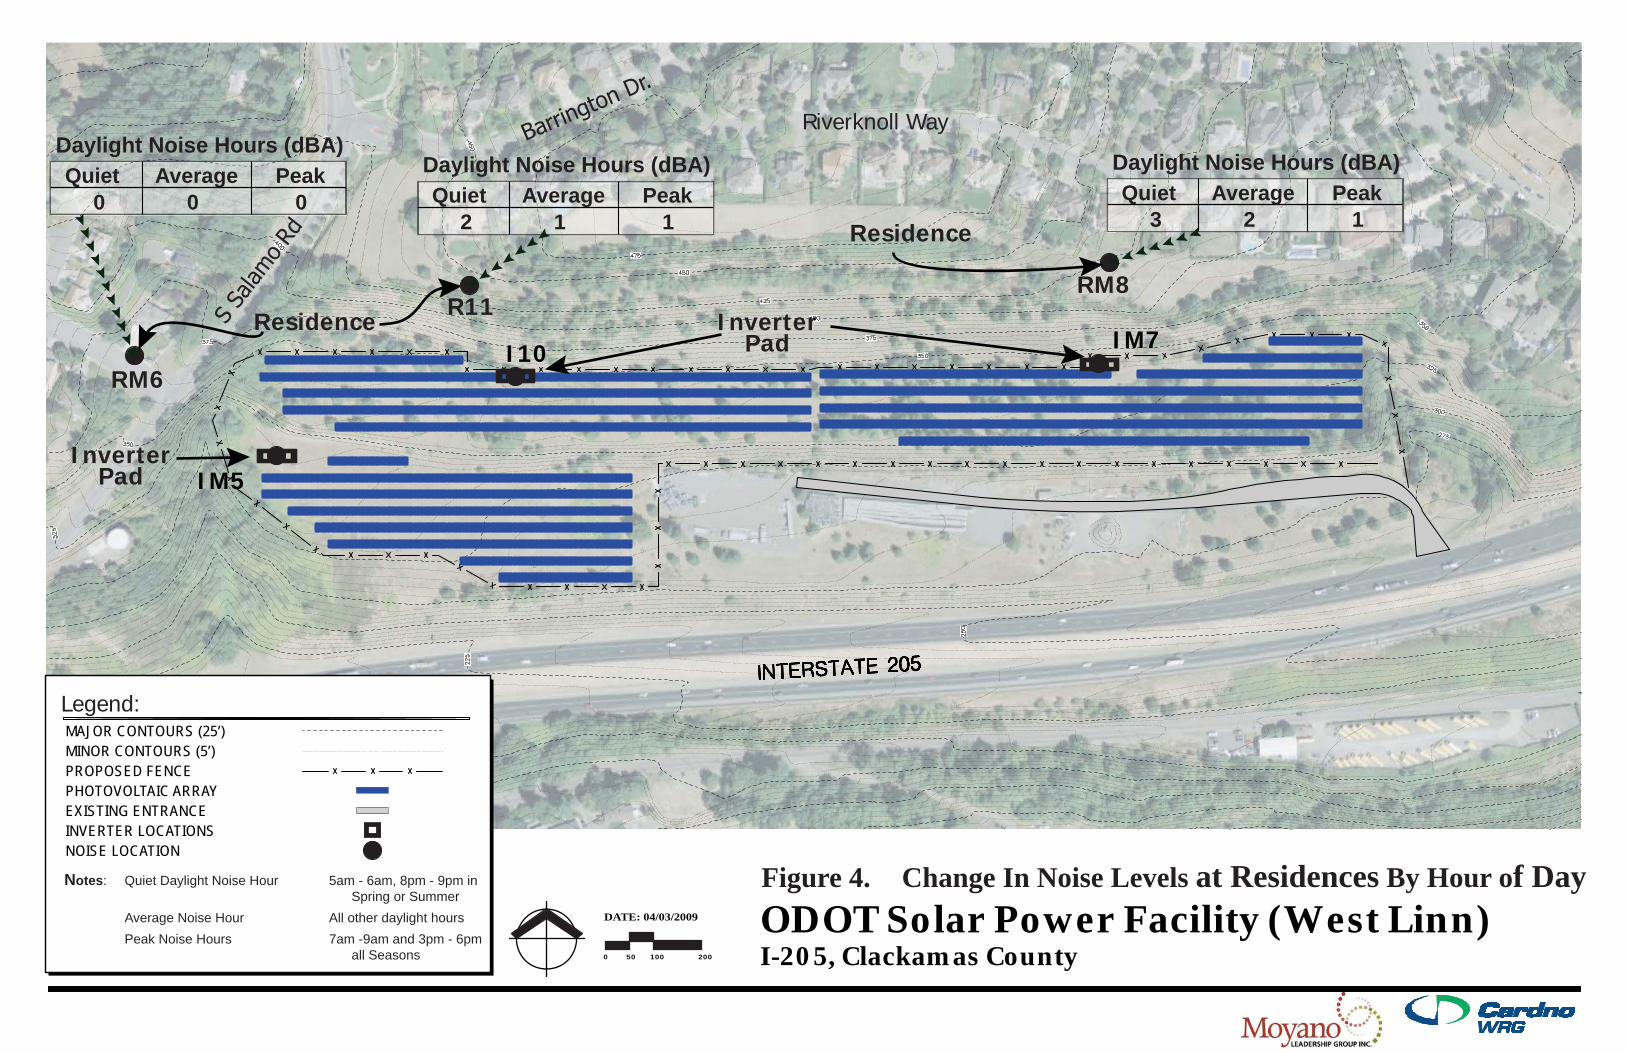
4.5 Discussion of Calculated Noise Levels for Specific Hours, Specific Seasons Since solar inverters only operate in daylight hours, the change in noise level varies from season to season based on the number of daylight hours and quiet, average and peak traffic noise hour. Generally, noise levels could increase by up to 3 dBA8 during the first and last two hours of sunlight during in May, June and July and during the last hour of sunlight in March, April and August. On a worst case summer day, a 3 dBA increase in noise level would occur for a maximum of 13% of time. All other daylight hours will experience a change of 2 dBA or less which is not perceptible to human ears. Table 8 compares the change in noise levels by season and time of day.
8 Assumes that traffic volumes are half of volumes during peak traffic hour.
2/3/2010
14
Table 8. Seasonal Changes in Noise Level Relative to Hour of Day
Season
Change in Noise Level (dBA) Traffic Noise Period
Number of Hours That Experience Change
% of Day by
Season 0 Night time 13 54% 1 peak noise hour am and pm 5 21%
Winter (December, January and
February) 2 all other daylight hours 6 25% 0 Night time 10 42% 1 peak noise hour am and pm 5 21% 2 average daylight noise hour 8 33%
Spring (March April)
3 quiet daylight noise hour 1 hour ( 7pm to 8pm) 4% 0 Night time 8 33% 1 peak noise hour am and pm 5 21% 2 average daylight noise hour 8 33%
Summer (May, June and July &
August) 3 quiet daylight noise hour 3 (5 to 6am & 7 pm to 9 pm) 13% 0 Night time 12 50% 1 peak noise hour am and pm 5 21%
Fall (September, October and November) 2 all other daylight hours 7 29%
Notes: For all seasons, peak am daylight traffic noise hour is assumed to be 7 am to 9 am and peak pm daylight traffic noise hour to be 3pm to 6pm; for nighttime hours, the solar inverters are not operating
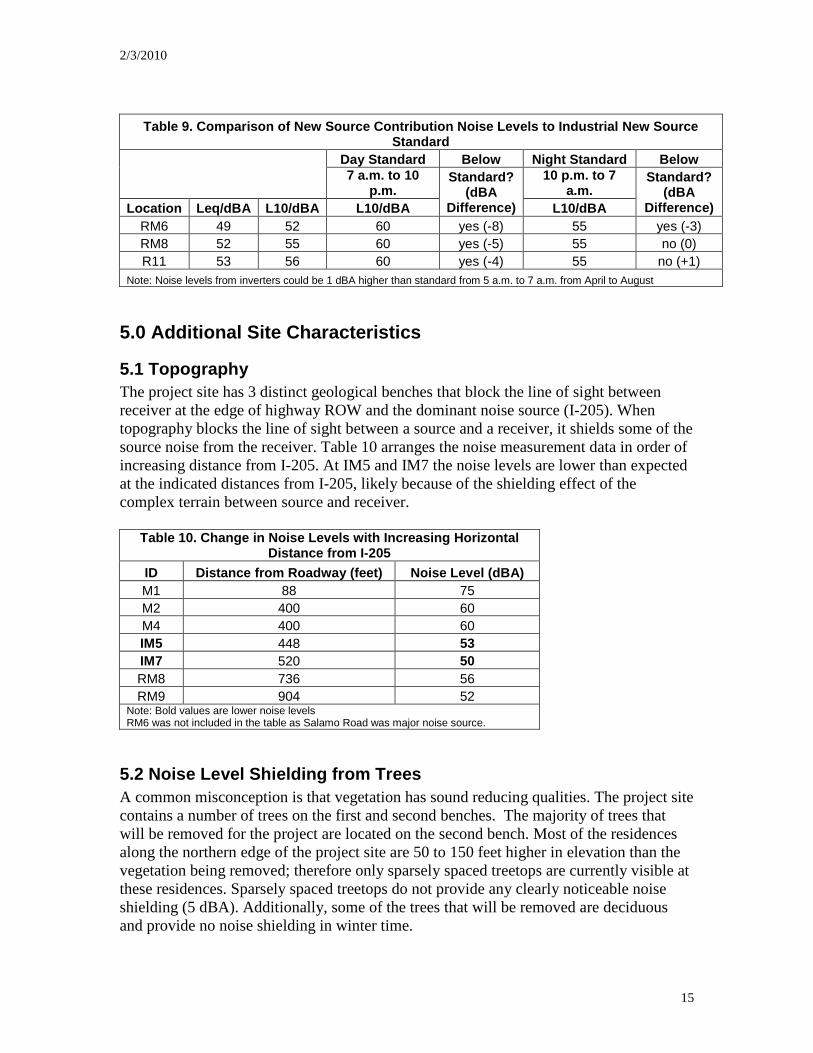
Spatially, the increase in noise level depends on the distance of receivers from inverter pads. Figure 4 compares the calculated change in noise at the three closest residential receivers for various daylight hours. Houses in the vicinity of RM8 will experience an increase of 3 dBA in noise levels during quiet daylight noise hours. At RM8 for non-quiet hours and for all hours of other locations, residences will experience changes of 2 dBA or less which are not perceptible to human ears. Comparison of Calculated Noise Levels to New Source Standards Table 9 shows, the ambient statistical noise level for L10 of all inverters operating at the same time compared to the DEQ New Industrial and Commercial Noise Source Standards. The highest noise level by location in the 5th column of Table 5, A3 and A4 were converted from Leq to L10 by adding 3 dBA. Noise levels during 7 a. m. to 10 p.m. will be within the noise standard. During daylight hours between 5 a.m. to 7 a.m. when all inverters are operating, L10 noise levels could be as high as 56 dBA which is slightly higher than the L10 standard of 55 dBA. This approach is conservative; the analysis assumes no muffling of inverter noise. Noise monitoring will be conducted at the project site after the project is completed to determine if noise levels are at acceptable levels. If necessary, noise mitigation will be examined at the project site.
2/3/2010
15
Table 9. Comparison of New Source Contribution Noise Levels to Industrial New Source
Standard Day Standard Below Night Standard Below
7 a.m. to 10
p.m. 10 p.m. to 7
a.m. Location Leq/dBA L10/dBA L10/dBA
Standard? (dBA
Difference) L10/dBA
Standard? (dBA
Difference) RM6 49 52 60 yes (-8) 55 yes (-3) RM8 52 55 60 yes (-5) 55 no (0) R11 53 56 60 yes (-4) 55 no (+1)
Note: Noise levels from inverters could be 1 dBA higher than standard from 5 a.m. to 7 a.m. from April to August
5.0 Additional Site Characteristics
5.1 Topography The project site has 3 distinct geological benches that block the line of sight between receiver at the edge of highway ROW and the dominant noise source (I-205). When topography blocks the line of sight between a source and a receiver, it shields some of the source noise from the receiver. Table 10 arranges the noise measurement data in order of increasing distance from I-205. At IM5 and IM7 the noise levels are lower than expected at the indicated distances from I-205, likely because of the shielding effect of the complex terrain between source and receiver.
Table 10. Change in Noise Levels with Increasing Horizontal Distance from I-205
ID Distance from Roadway (feet) Noise Level (dBA) M1 88 75 M2 400 60 M4 400 60 IM5 448 53 IM7 520 50 RM8 736 56 RM9 904 52
Note: Bold values are lower noise levels RM6 was not included in the table as Salamo Road was major noise source.
5.2 Noise Level Shielding from Trees A common misconception is that vegetation has sound reducing qualities. The project site contains a number of trees on the first and second benches. The majority of trees that will be removed for the project are located on the second bench. Most of the residences along the northern edge of the project site are 50 to 150 feet higher in elevation than the vegetation being removed; therefore only sparsely spaced treetops are currently visible at these residences. Sparsely spaced treetops do not provide any clearly noticeable noise shielding (5 dBA). Additionally, some of the trees that will be removed are deciduous and provide no noise shielding in winter time.
2/3/2010
16
In order to provide a clearly noticeable decrease in noise levels (5 dBA), vegetation needs to be at least 100 foot wide with a minimum height of 20 feet above the shielded property. The vegetation has to be dense enough that the noise source cannot be seen. There are many trees in the existing project area; however the trees that will be removed are not densely spaced, nor tall enough, and do not completely shield the line of sight for residences 50 to 150 feet higher in elevation than the I-205 roadway, the biggest source of noise for the project site and the surrounding areas. The trees at the project site do not provide a clearly noticeable reduction in traffic noise levels for nearby residences. Therefore the removal of trees in the project area will not create a clearly noticeable increase in the sound levels at bordering residences. The trees on the 3rd bench and at the edges of ODOT ROW will be left in place.
6.0 Conclusions The West Linn Solar Highway Project will increase noise levels for receivers outside of ODOT right-of-way by up to 2 dBA when the solar inverters operate. This change will not be perceptible to the human ear. However, in spring and summer, during the 1st hour and last two hours of daylight, solar inverters may increase noise levels at residences adjacent to RM8 by up to 3 dBA; this change is just perceptible to human ears. . Since inverters will not operate after dark, nighttime noise levels will not change. The removal of trees at the project site will not create clearly noticeable increases in I-205 noise levels at the closest residents because the trees being removed are not currently thick or tall enough to provide significant noise shielding. There will be minimal tree removal and there will be replanting of trees in other locations at the site. Additional noise shielding at residences will be provided by the site topography in instances where the line of sight between the roadway and the residences is blocked. Noise monitoring will be conducted after the project is built to confirm that noise levels are at acceptable levels as calculated in this report. If necessary, noise mitigation will be examined and addressed at the project site.
7.0 References National Environmental Policy Act (http://ceq.hss.doe.gov/Nepa/regs/nepa/nepaeqia.htm)
2/3/2010
17
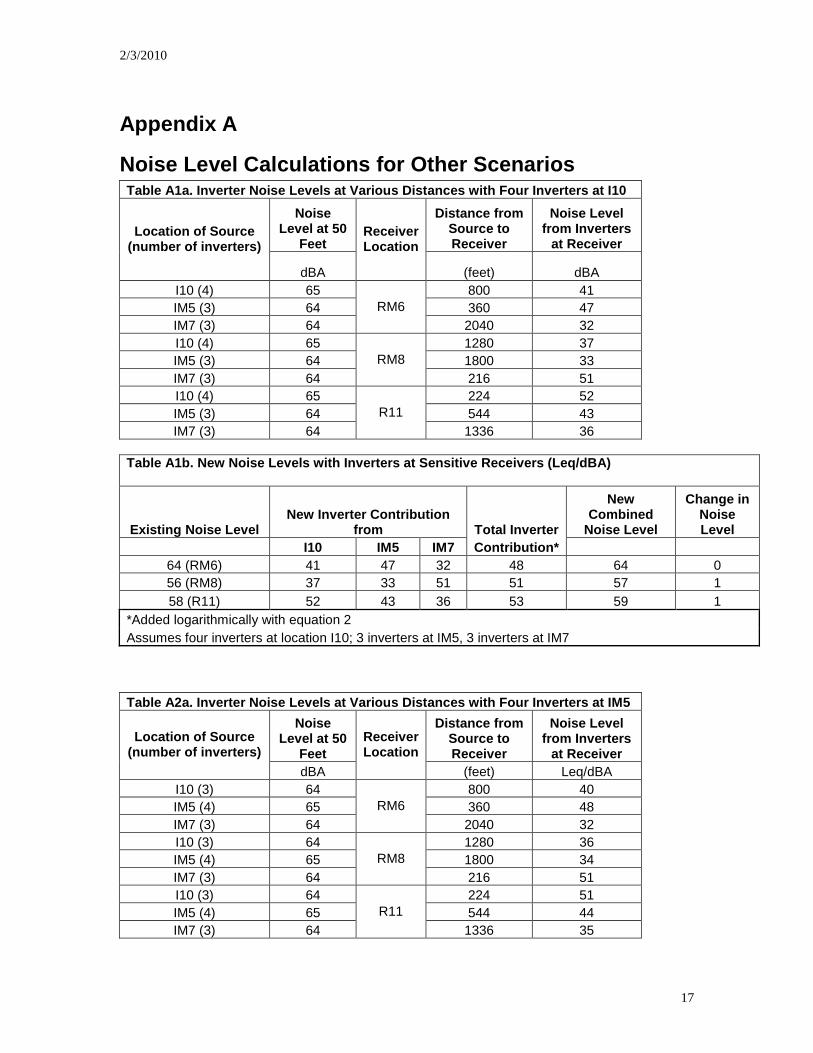
Appendix A
Noise Level Calculations for Other Scenarios Table A1a. Inverter Noise Levels at Various Distances with Four Inverters at I10
Noise Level at 50
Feet
Distance from Source to Receiver
Noise Level from Inverters
at Receiver Location of Source
(number of inverters)
dBA
Receiver Location
(feet) dBA I10 (4) 65 800 41 IM5 (3) 64 360 47 IM7 (3) 64
RM6 2040 32
I10 (4) 65 1280 37 IM5 (3) 64 1800 33 IM7 (3) 64
RM8 216 51
I10 (4) 65 224 52 IM5 (3) 64 544 43 IM7 (3) 64
R11 1336 36
Table A1b. New Noise Levels with Inverters at Sensitive Receivers (Leq/dBA)
Existing Noise Level New Inverter Contribution
from Total Inverter
New Combined
Noise Level
Change in Noise Level
I10 IM5 IM7 Contribution* 64 (RM6) 41 47 32 48 64 0 56 (RM8) 37 33 51 51 57 1 58 (R11) 52 43 36 53 59 1
*Added logarithmically with equation 2 Assumes four inverters at location I10; 3 inverters at IM5, 3 inverters at IM7
Table A2a. Inverter Noise Levels at Various Distances with Four Inverters at IM5
Noise Level at 50
Feet
Distance from Source to Receiver
Noise Level from Inverters
at Receiver Location of Source
(number of inverters) dBA
Receiver Location
(feet) Leq/dBA I10 (3) 64 800 40 IM5 (4) 65 360 48 IM7 (3) 64
RM6 2040 32
I10 (3) 64 1280 36 IM5 (4) 65 1800 34 IM7 (3) 64
RM8 216 51
I10 (3) 64 224 51 IM5 (4) 65 544 44 IM7 (3) 64
R11 1336 35
2/3/2010
18
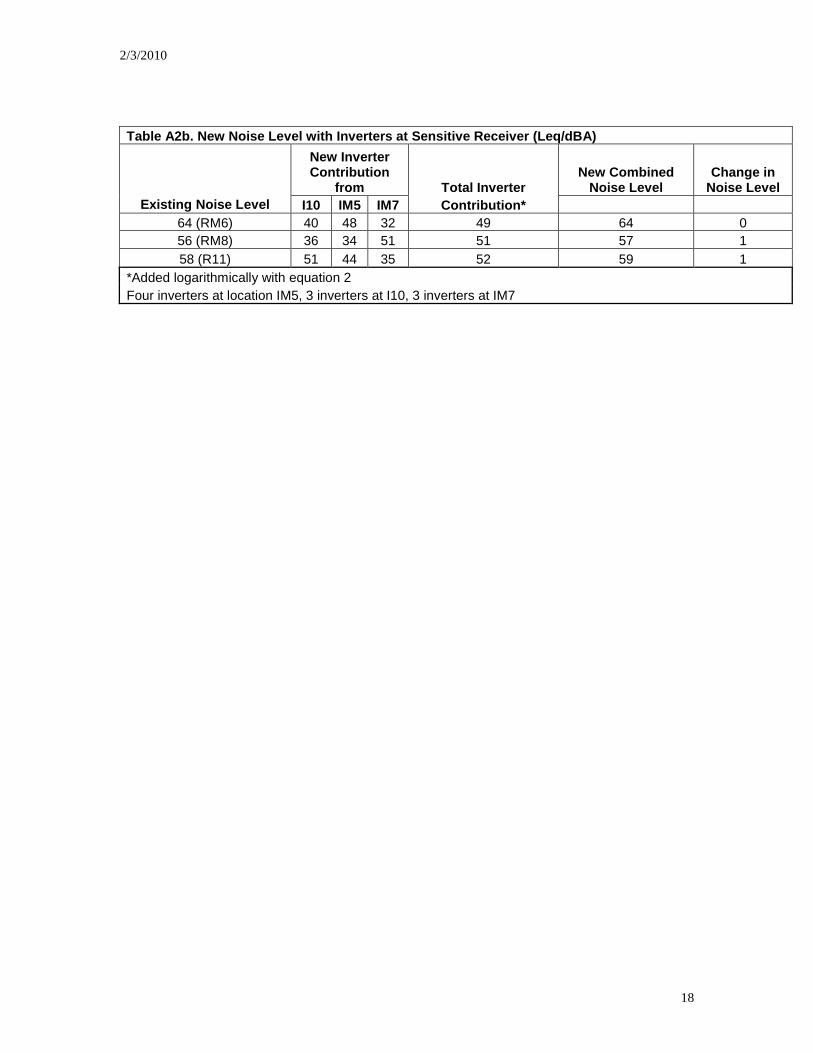
Table A2b. New Noise Level with Inverters at Sensitive Receiver (Leq/dBA)
New Inverter Contribution
from Total Inverter New Combined
Noise Level Change in
Noise Level Existing Noise Level I10 IM5 IM7 Contribution*
64 (RM6) 40 48 32 49 64 0 56 (RM8) 36 34 51 51 57 1 58 (R11) 51 44 35 52 59 1
*Added logarithmically with equation 2 Four inverters at location IM5, 3 inverters at I10, 3 inverters at IM7

2/3/2010
19
Appendix B
Noise Monitoring Sheets
,PROJECT NAME: ~c\o.V' '?fD~JHIGHW AY NAME AND NUMBER: ;)..(&COUNTY:_~_~ _ST ART TIME: I~016 STOP TIME: \ '.~
OREGON DEPARTMENT OF TRANSPORTATIONHIGHW AY DIVISION - GEO-ENVIRONMENTAL SECTION
NOISE MEASUREMENT RECORD(USING AN INTEGRATING SOUND LEVEL METER)
MEASUREMENT NO: M (DATE ~~ '?-'\',,'1.CO\.ENGINEER N L-WIND: <. <;'lV\VVJ
CALIBRATION TONE Cftt dB HZ\'<.~'~ "\3;~ t-\1;. .
LEQ RANGE: is -\0»MICROPHONE HEIGHT: ~~SEL: _
LENGTH OF MEASUREMENT: _-,-' --'S=-- _
-1 io.:t OPTIONALLEQ@ 5MfN J 'y LEQ@ 25MIN LEQ@ 45MTN _
LEQ @ 10 MIN dLt . <g LEQ@ 30 MIN LEQ@ 50 MIN _
.?e ·0LEQ@ 15 MIN J-'J LEQ@ 35MIN LEQ@ 55MIN _
LEQ @ 20 MIN LEQ@ 40 MIN LEQ@ 60 MIN _
I LEQ:
SEL· LEQ: = _
TIME FROM TABLE: _
TRAFFIC: ROADWAY: __ ----::=COUNTED HR. EQUIV.
ROADWAY: _COUNTED HR. EQUIV.
ROADWAY: _----:=-::::-:COUNTED HR. EQUIV.
AUTOS:MED. TRUCKS:HEAVY TRUCKS:SPEED:STREET ADDRESS: _
SKETCH OF SITE
<..~ \0 c7 a ) c,tv{ It"~
~ 5' t .{~i'10 :-s
\I\
I--r sg J.-.uS.-----..::- _.-
.: ------.--;-13 AO.s·,...--=-=-----"-(SHOW DISTANCES TO IMPORTANT FEATURES ie centerline, buildings, driveways ere)SEE BACK OF THIS PAGE FOR ANY ADDlTlONAL COMMENTS
67
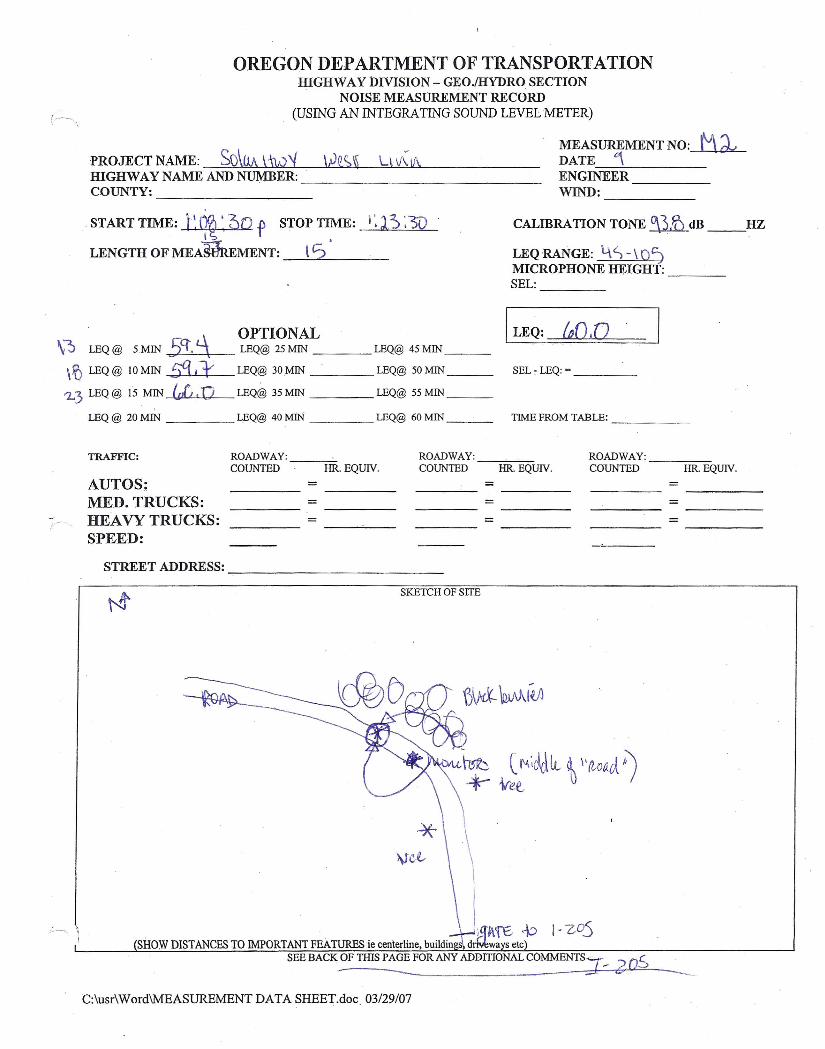
OREGON DEPARTMENT OF TRANSPORTATIONHIGHWAY DIVISION - GEO./HYDRO SECTION
NOISE MEASUREMENT RECORD(~ (USING AN INTEGRATING SOUND LEVEL METER)
MEASUREMENT No;_M dvPROJECT NAME: So\M '-"My \pQS;,§ UV\V\ DATE_1~ _IDGHWAYNAME ANDNUMBER: ENGINEER _COUNTY: WIND: -----
, OPTIONAL\~ LEQ@ 5,MIN 5q'.L\, LEQ@ 25MIN LEQ@ 45MIN _
\ IQ LEQ @ 10MIN ~ LEQ@ 30MIN LEQ@ 50 MIN _
'2...3 LEQ@ 15 MIN (,pG.Q LEQ@ 35MIN LEQ@ 55MIN _
LEQ @ 20 MIN LEQ@ 40 MiN LEQ@ 60 MIN _
"\ ~ .~ I', ,\,'2. '.~-START TIME: I' I (~ , vO f STOP TIME: ----,-,<l""",,,,,--,--,,.JJ,-,,,--VI •
LENGTH OF MEA~MENT: _...:...\?.4:.- _
CALIBRATION TONE ~dB __ HZ
LEQRANGE: 4S-\o'jMICROPHONE HEIGHT: _SEL: _
I LEQ: CoOIO ISEL ~LEQ:= _
TIMEFROM TABLE: _
TRAFFIC: ROADWAY:__ --'-COUNTED HR EQUIV.
ROADWAY:_~_COUNTED HR. EQUIV.
ROADWAY:_---::::--=-.COUNTED HR.EQUIV.
AUTOS:MED. TRUCKS:REA VY TRUCKS:SPEED:
= == = =
= =
STREET ADDRESS: ~ _
SKETCHOFSITE
-----------------~~~~------C:\usr\Word\MEASUREMENT DATA SHEET.doc 03/29107
OREGON DEPARTMENT OF TRANSPORTATIONHICHW AY DIVISION - CEO-ENVIRONMENTAL SECTION
NOISE MEASUREMENT RECORD(USING AN INTEGRATING SOUND LEVEL METER)
MEASUREMENT No:__ M_LLDATE~O~.ENGINEER N l.WIND: <'S "'--v'"
CALIBRATION TONE ~q dB HZ8{foretf=j'1 \.J~t"" 13·t
LEQ RANGE: _MICROPHONE HEIGHT:SEL: _
PROJECT NAME: £o\.QII' P'YO~HIGHW AY NAME AND NUMBER: ;;l.0..$COUNTY:_~~ _START TIME: tl: l..1..\ STOP TIME: \~~3i
,LENGTH OF MEASUREMENT: __ />"_1\1__ ( 1"0.. _
-1. OPTIONALLEQ@ 5 MIN sq. -f LEQ@ 25 MTN LEQ@ 45 Mll'l _
LEQ @ 10 MlN Sq· ~ LEQ@ 30 MlN LEQ@ 50 MlN _
LEQ @ 15 MIN ~ LEQ@ 35 MTN LEQ@ 55 MTN _
LEQ @ 20 MIN LEQ@ 40 MTN LEQ@ 60 MIN _
I 51·e:.LEQ: .l.
SEL - LEQ: = _
TIME FROM TABLE: _
TRAFFIC; ROADWAY: _COUNTED HR. EQUIV.
ROADWAY: _COUNTED HR. EQUIV.
ROADWAY: __ --,:--:COUNTED HR. EQUIV.
AUTOS:MED. TRUCKS:REA VY TRUCKS:SPEED:STREET ADDRESS:
SKETCH OF SlTE ---------
------- ..
------------------------~]..,P"tj'
-
(SHOW DISTANCES TO IMPORTANT FEATURES ie centerline, buildings, driveways ere)SEE BACK OF THIS PAGE FOR ANY ADDITIONAL COMMENTS
67
/
PROJECT NAME: So\~ HvM W~<-:,~ L\\t\v\HIGHWAY NAME ANDNUMBER: .: -"1"=--2....,().....,~~ _COUNTY: ~\M-'-"\l"""i......,\-- _
. START TIME: iO:1>:Cj)A STOPTIME: lD'.lt'0:S0-·'i ~ I
LENGTH OF MEASUREMENT: IS--'-=-----
OREGON DEPARTMENT OF TRANSPORTATIONHIGHWAY tnVISION - GEO.IHYDRO SECTION
NOISE MEASOREMENT RECORD(USING AN INTEGRATING SOUND LEVEL METER)
MEASUREMENT NO; M5DATE Cfl2Al02ENGINEER New v IJ\}Q"WIND: CIf(\.\&/\ .L..:; Nfl'\
CALIBRATION TONE ~dB __ HZc: L (/j) 1O~'30 Aftl
LEQ RANGE: Lt-,) - {D-::> . ~ .MICROPHONE HEIGHT: to ttSEL: _
LEQ @ 5.MIN 51.\0i,.'> LEQ @ 10 MIN sa ,}-~oLEQ @ 15 MIN 53i \
OPTIONALLEQ@ 25MIN LEQ@ 45MIN __
LEQ@ 30 MIN LEQ@ 50 MIN __
LEQ@ 35 MIN LEQ@ 55 MIN _
LEQ @ 20 MIN LEQ@ 40 MrN LEQ@ 60 MIN _
SEL~ LEQ: = _
TIME FROM TABLE: _
TRAFFIC: ROADWAY: ROADWAY: ROADWAY:COUNTED HR.EQUIV. COUNTED fIR EQUIV. COUNTED HR. EQUIV.
AUTOS: =MED. TRUCKS: = = =
_. HEAVY TRUCKS: =" SPEED: ,)S - loS '01'\ "1.. IO,)
STREET ADDRESS: ()~n: V.owSKETCH OF SITE IZc5--
--.~~----------~.
C:\usr\ Word\MEASUREMENT DATA SHEET. doc . 03129/07
PROJECT NAME: 9o\a.r PC*JHIGHW AY NAME AND NUMBER: ;tOSCOUNTY: ~~--------START TIME: fO :3,,3 'A\ STOP TIME: 10 . It
LENGTH OF MEASUREMENT: ~_S....!..:~-,-,-\.:....!.~ _
OREGON DEPARTMENT OF TRANSPORTATIONHIGHWAY DIVISION - CEO-ENVIRONMENTAL SECTION
NOISE MEASUREMENT RECORD(USING AN INTEGRATING SOUND LEVEL METER)
MEASUREMENT NO:~DATE tj- ',l~-l.OO'\ENGINEER NLWIND: < S" t\'\ P V\'
CALIBRATION TONE <i\.\ dB l') HZ
LEQ RANGE: LyS'- \ 0':)'MICROPHONE HEIGHT:SEL: ~
OPTIONALLEQ@ 5 MIN LEQ@ 25MIN LEQ@ 45MIN
LEQ@ IOMIN 6';'1\ LEQ@ 30MIN LEQ@ 50MIN
LEQ@ 15 MIN l?l)'J LEQ@ 35MTN LEQ@ 55 IVllN
LEQ@ 20MIN LEQ@ 40MlN LEQ@ 60MIN
I LEQ:
SEL - LEQ: = _
TIME FROM TABLE: _
TRAFFIC: ROADWAY: ROADWAY: ROADWAY:COUNTED HR.EQUIV. COUNTED HR.EQUlV. COUNTED HR. EQUlV.
AUTOS:MED. TRUCKS:REA VY TRUCKS:SPEED:STREET ADDRESS:
SKETCH OF SITE
IVJ1.w VV\ \ \\.e'.rvt- '-.[lt1·f-I\.
20 -?:xJ (v..."''> I V"'.\'" ! \ \ HlN\~'
. \ c}....1-'-\ \tv\~t\..\\.v""\ '"""' rq \~.tY\e. j c «vl.: vl (~f'..,,:,.Y or./~" . \
\\:llt-v""'U .:d: jV,,- m -
\.ir ( o;ct,eLJ y,
1 . "I"(SHOW DISTANCES TO IMPORTANT FEATURE) Ie centerline, buildings, driveways tc)SEE BACK OF THIS PAGE FOR ANY ADDITIONAL COMMENTS
67
OREGON DEPARTMENT OF TRANSPORTATIONHIGHWAY DIVISION - GEO-ENVIRONMENTAL SECTION
NOISE MEASUREMENT RECORD(USING AN INTEGRATING SOUND LEVEL METER)
MEASUREMENT No: __ M~3---,--_PROJECTNAME: 5d\.()..\("" ?Y-d~e~ DATE q-").,-\-1..i'\HIGHWAY NAME AND NUMBER: _---.i.aL.:().)""'" ""------___ ENGINEER I}i LCOUNTY: _------;--.-:--______ WIND: « > \'>'f\<"STARTTIME: iri.J\. STOP TIME: P'5b CALIBRATION TONE 0(1 dB HZ _
. 93- =1-.btt0r-Cl. ti3<f ,;f1(,{LENGTH OF MEASUREMENT: J~ "i'\IV\M.tQ.,~ LEQ RANGE: 'is' -105
MICROPHONE HEIGHT: 5.f"<.£%SEL: _
OPTIONALLEQ @ 5 MIN 5i. j LEQ@ 25 MLN LEQ@ 45 MIN _
LEQ @ 10 MLN 50 . . LEQ@ 30 MIN LEQ@ 50 MIN _
LEQ @ 15 MLN $" .J. ·LEQ@ 35 MTN LEQ@ 55 MTN _
I LEQ:
SEL . LEQ: = _
LEQ @ 20 MIN LEQ@ 40 MIN LEQ@ 60 MLN _
.:-\~ <.... c0U~J V'tOt- IJ\S\'iolQ,'1 'ov ~ ROADWAY: ROADWAY: _
COUNTED HR. EQUIV. COUNTED HR. EQUIV.
TIME FROM TABLE: _
TRAFFIC; ROADWAY: _COUNTED HR. EQUIV.
AUTOS:MED. TRUCKS:REA VY TRUCKS:SPEED:STREET ADDRESS: _
SKETCH OF SITE
(SHOW DISTANCES TO IMPORT ANT FEATURES ie centerline, buildings, driveways etc)SEE BACK OF THIS PAGE FOR ANY ADDITIONAL COMMENTS
t2t.tV\~ ~VfVV~Vlj 5'/: 6l-\P~ jOIlI'lIw.-A.es.' ..!Jf~tdj ~Vl!vOW\. .t-<ivuC-jl
67
OREGON DEPARTMENT OF TRANSPORTATIONIDGHWAY })IVISION - GEO.IHYDRO SECTION
NOISE MEASUREMENT RECORD(USING AN INTEGRATING SOUND LEVEL METER) ~
MEASUREMENTNO;~H8DATE qlclENGINEE~ J)OW\JI tJL-WIND: eJkLVv, '- &) ~~
CALIBRATION TO~dB __ HZ
LEQ RANGE: 5Sp, ~JSAMICROPHONE HEIGHT: _SEL: _
PROJECT NAME: \OVu l-tw'i----,-_----= _HIGHWAY NAME ANDNUMBER: _------'~ _COUNTY: KulK .
II' .START TIME: J V.i~.og STOP TIME: . 51-~OS
PLENGTH OF MEASUREMENT: .......:.,.lS""'· _
. . OPTIONALt..\\ LEQ@ 5MIN ~ LEQ@ 25MIN LEQ@ 45MIN _
9 LEQ @ to MIN Slo i \. LEQ@ 30MIN· LEQ@ 50 MIN _
LEQ @ 15 MIN LEQ@ 35 MIN LEQ@ 55 MIN _
LEQ @ 20 MIN LEQ@ 40 MiN' LEQ@ 60 MIN _
I LEQ: ISEL ~LEQ: = _
TIME FROM TABLE: _
TRAFFIC: ROADWAY:_---==COUNTED HR. EQUIV.
ROADWAY: _-==--=--COUNTED HR EQUIV.
ROADWAY: _----==---=COUNTED HR EQUIV.
AUTOS:MED. TRUCKS:REA VY TRUCKS:SPEED:
= = == == =
55·-~SeM- 1"205STREET ADDRESS: ...,...-_\~_~__<._bA..-:m------_
SKETCH OF SITE
_--.------~----- __ ---H-~- ....-- ------.-~~.---.'.--.--.....~ .___:... _,.....-------
~-----~-------=~--~.~~~~rjV1Y s-:
L\-\\ ~r.~\~~C-. \~WII I f I J / I ) I I) / -< ~~ 4t'll. CA'l~
N >\(v- -r ( { r (r I I I I '/ I .r: 7\ \ ~t" . . aitdL c~~ (. rW\~
(SHOW DISTANCES TO IMPORTANT FEATURES ie centerline, buildin s, drivewa s etc) v\A.CL "SEE BACK OF THIS PAGE FOR ANY ADDITIONAL COMMENTS
tdf~~~ liJic:\usr\ Word\MEASUREMENT DATA SHEET.doc 03/29107
OREGON DEPARTMENT OF TRANSPORTATIONHIGHWAY nIVISION - GEO./HYDRO SECTION
NOISE MEASUREMENT RECORD(_____ (USING AN INTEGRATING SOUND LEVEL METER)
MEAS:iM~NTNO;l13-PROJECT NAME: ~iw'( DATE ])f"-'-'lr"-'-'24-\-- __mGHW AY NAME ANDNUMBER: ENGINEE \-----COUNTY: WIND: -----
.STARTTIME: i2.·,'2:-fOB STOP TIME: 12:3l.f~oB
lc:... ILENGTH OF MEASUREMENT: _-'-_=-.J __ ,--
CALIBRATION TONE dB __ HZ
LEQRANGE:MICROPHONE=-=HE=IG=H=T=: _SEL: _
1-q 5.MIN 521L\ OPTIONALLEQ@ LEQ@ 25MIN LEQ@ 45MIN
'3+ LEQ@ IOMIN ~ pX) LEQ@ 30MIN LEQ@ 50MIN
LEQ@ 15 MIN 51.\ LEQ@ 35MIN LEQ@ 55MIN
LEQ@ 20MIN LEQ@ 40MIN LEQ@ 60MIN
I LEQ: 52, I ISEL ~LEQ: = _
TIME FROM TABLE: _. _
TRAFFIC: ROADWAY: __ -,-COUNTED HR. EQUIV.
ROADWAY:_~--==COUNTED HR. EQUIV.
ROADWAY: _COUNTED HR. EQUIV.
AUTOS:MED. TRUCKS:REAVY TRUCKS:SPEED:
= == == =
STREET ADDRESS: ...,.- _
Citld<.W) t.0~t.f~
(SHOW DISTANCES TO IMPORTANT FEATURES .ie centerline, buildin s, driveways etc) .SEE BACK OF TIllS PAGB FOR ANY ADDITIONAL COMMENTS
C:\usr\Word\MEASUREMENT DATA SHEET.doc. 03/29/07

Appendix B
Noise Monitoring Photographs
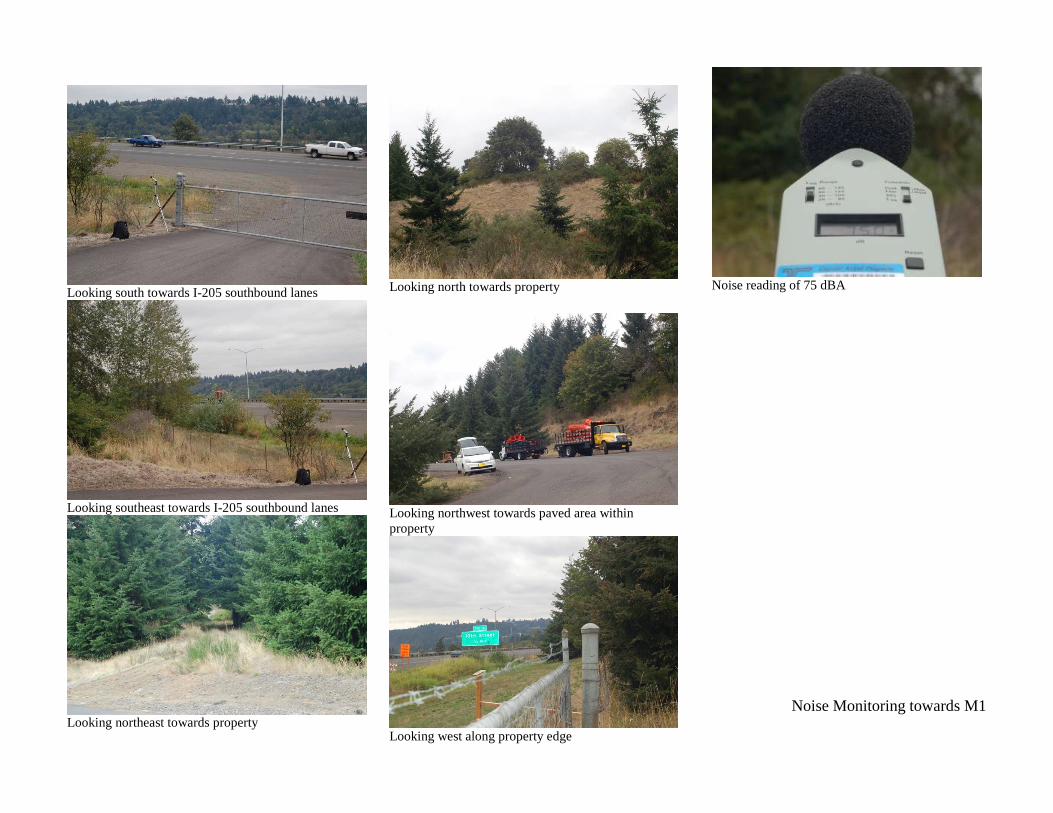
Looking south towards I-205 southbound lanes
Looking southeast towards I-205 southbound lanes
Looking northeast towards property
Looking north towards property
Looking northwest towards paved area within property
Looking west along property edge
Noise reading of 75 dBA
Noise Monitoring towards M1
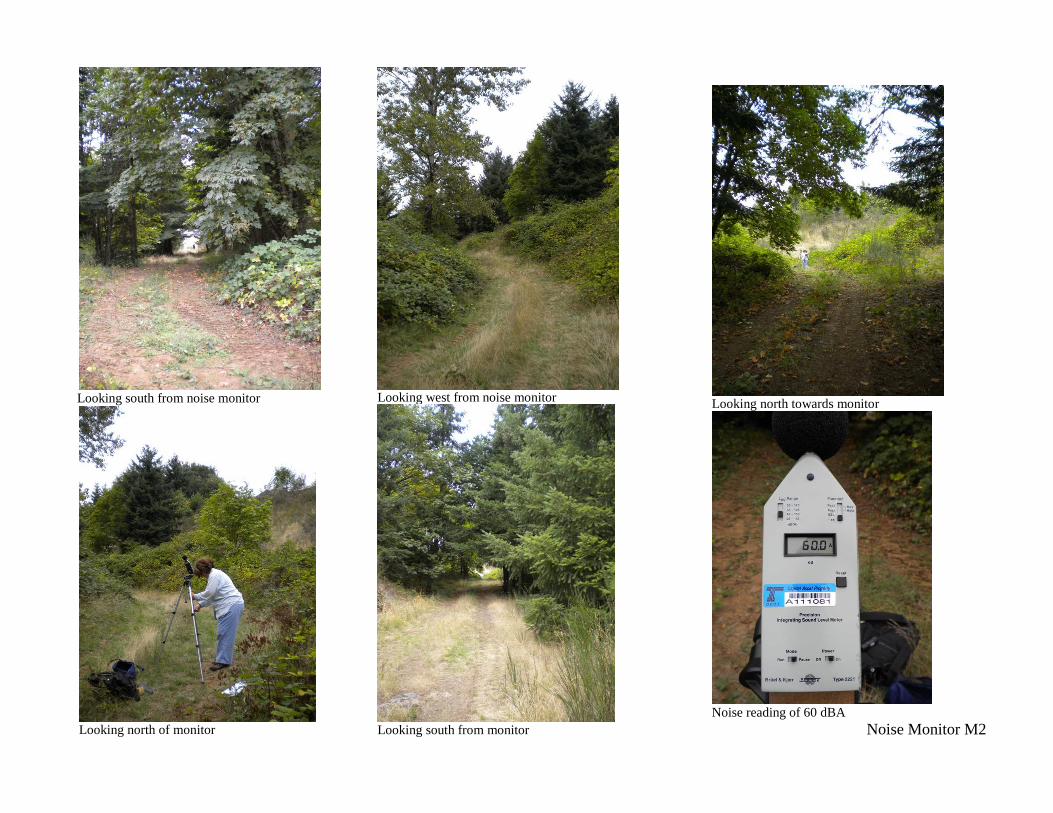
Looking south from noise monitor
Looking north of monitor
Looking west from noise monitor
Looking south from monitor
Looking north towards monitor
Noise reading of 60 dBA
Noise Monitor M2
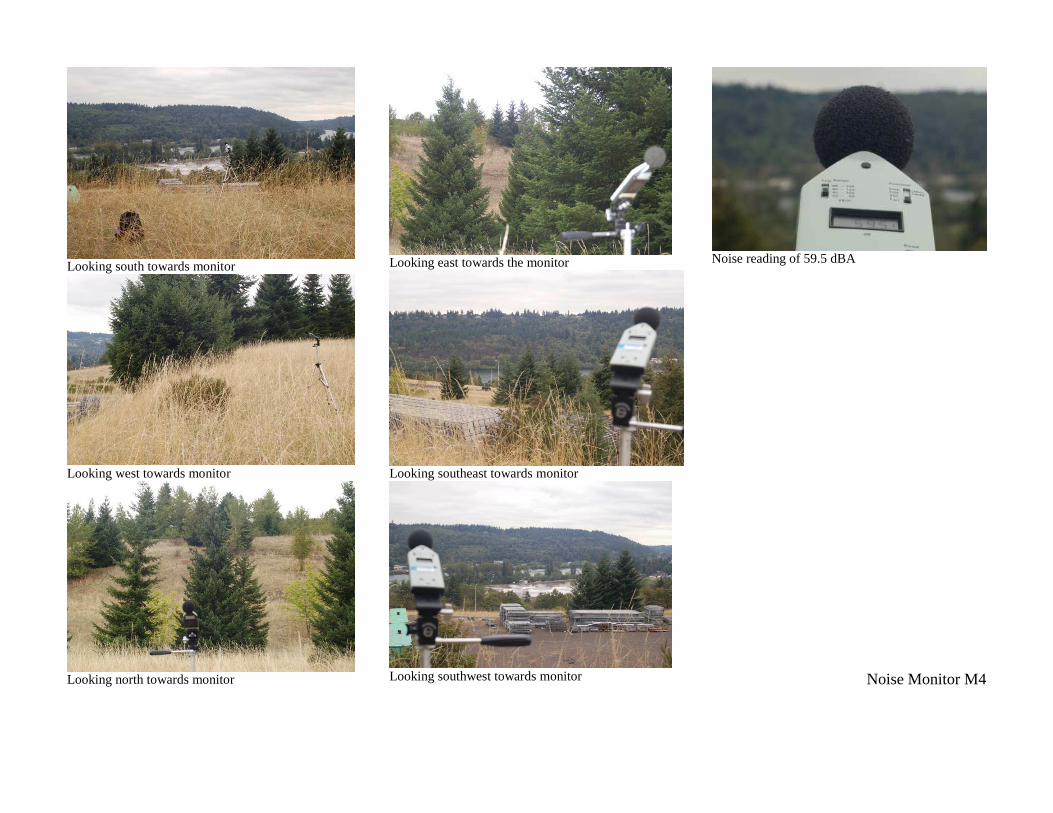
Looking south towards monitor
Looking west towards monitor
Looking north towards monitor
Looking east towards the monitor
Looking southeast towards monitor
Looking southwest towards monitor
Noise reading of 59.5 dBA
Noise Monitor M4
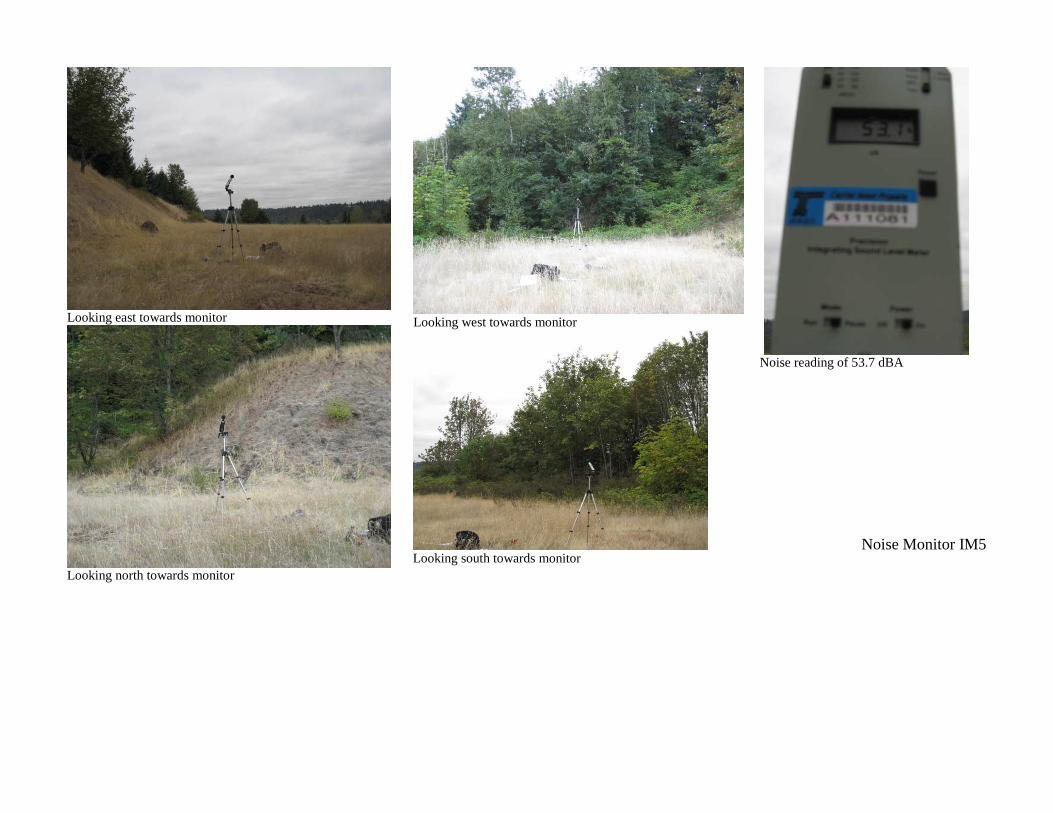
Looking east towards monitor
Looking north towards monitor
Looking west towards monitor
Looking south towards monitor
Noise reading of 53.7 dBA
Noise Monitor IM5
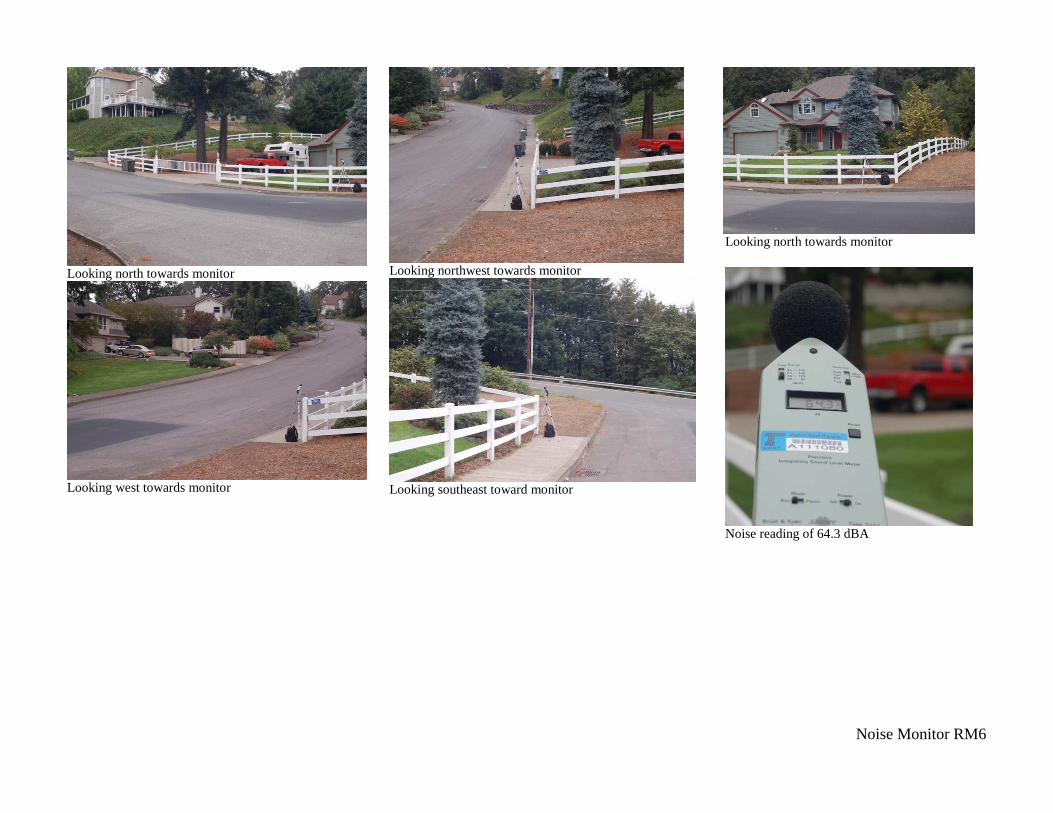
Looking north towards monitor
Looking west towards monitor
Looking northwest towards monitor
Looking southeast toward monitor
Looking north towards monitor
Noise reading of 64.3 dBA
Noise Monitor RM6
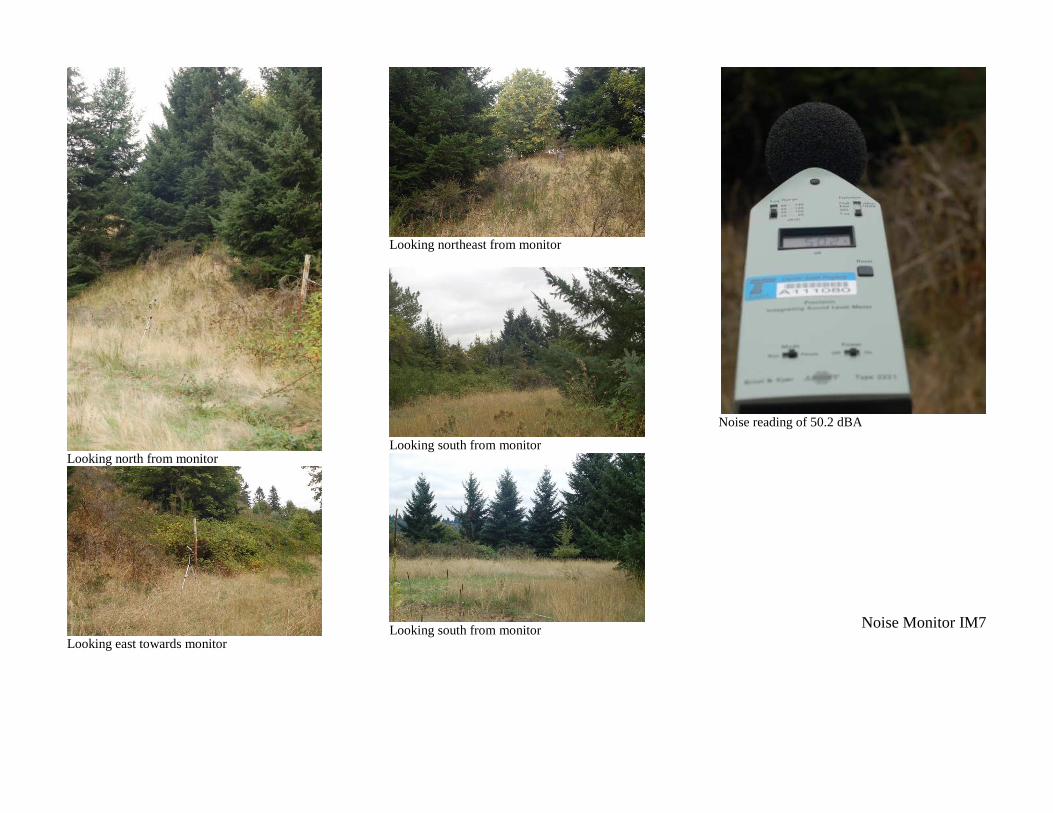
Looking north from monitor
Looking east towards monitor
Looking northeast from monitor
Looking south from monitor
Looking south from monitor
Noise reading of 50.2 dBA
Noise Monitor IM7
Looking west from monitor
Looking southwest from monitor
Looking east from monitor
Looking north from monitor
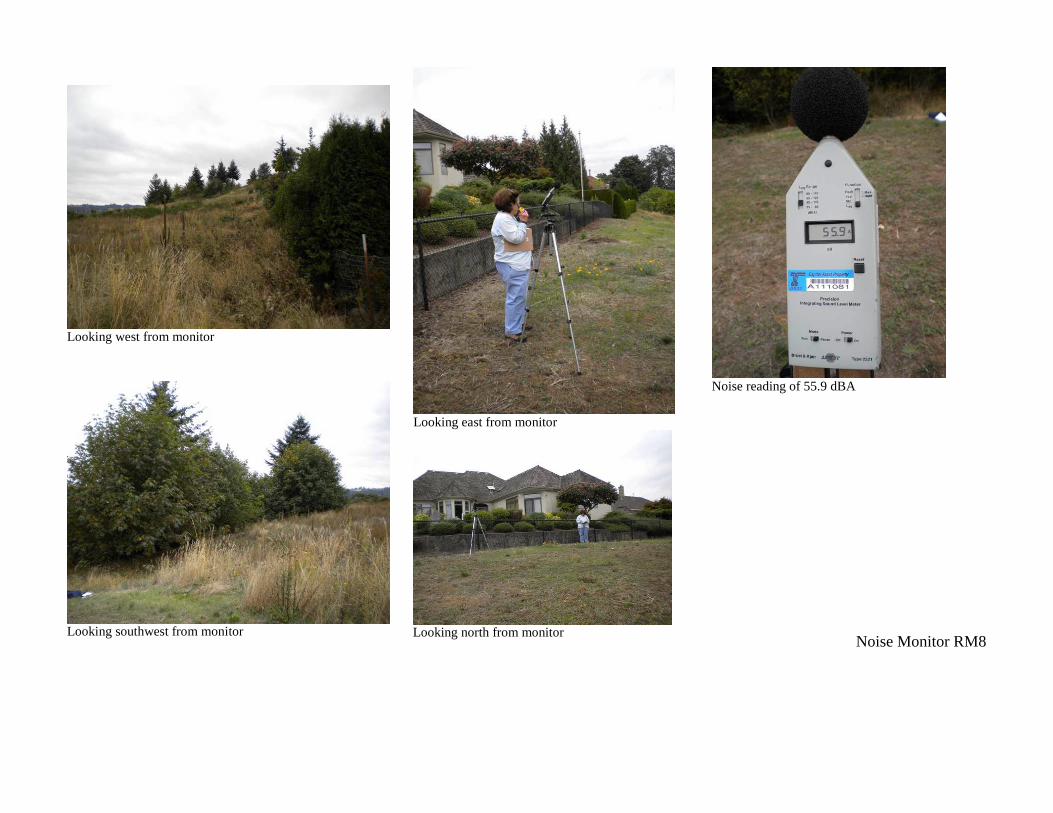
Noise reading of 55.9 dBA
Noise Monitor RM8
Looking west towards noise monitor
Looking southwest towards monitor
Looking southeast towards monitor
Looking east towards monitor
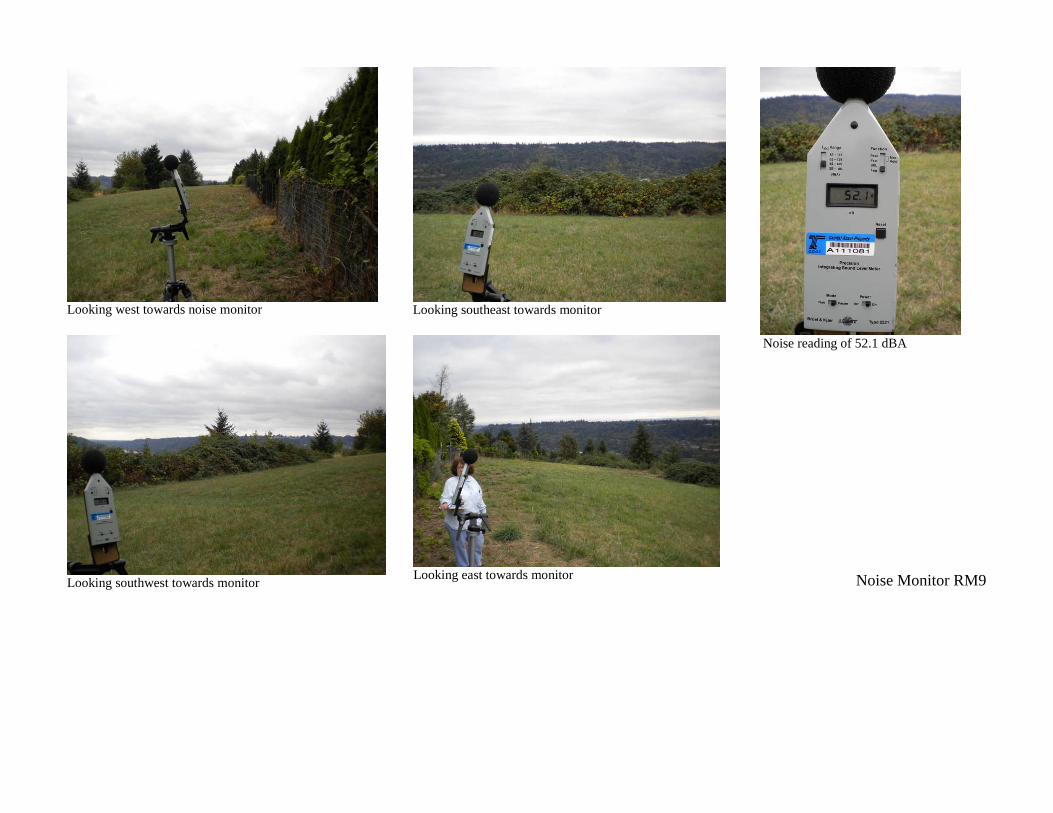
Noise reading of 52.1 dBA
Noise Monitor RM9
Looking northwest from monitor
Looking north from monitor
Looking east from monitor
Looking southeast towards monitor
Looking south from monitor
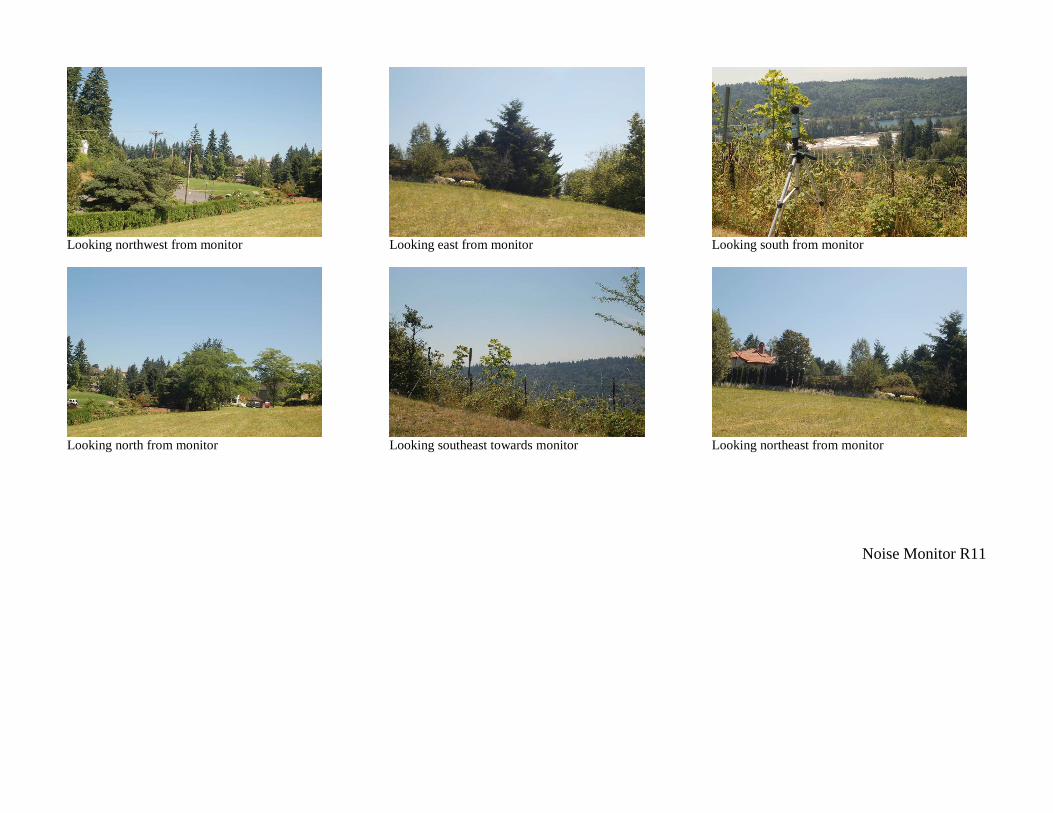
Looking northeast from monitor
Noise Monitor R11
MAJOR CONTOURS (25’)MINOR CONTOURS (5’)PROPOSED FENCEPHOTOVOLTAIC ARRAYEXISTING ENTRANCEINVERTER LOCATIONSNOISE LOCATIONNOISE LEVEL (dBA) (Measured, Calculated With Inverter)
Legend:
0 50 100 200
Riverknoll Way
RM952
M460
M1258
M260
M175
R1159
RM664, 64
RM856, 58
Figure 3. Noise Measurements and Calculated Noise Level with Inverter Noise Contribution
IM750
IM553
I10
DATE: 04/03/2009 ODOT Solar Power Facility (West Linn)I-205, Clackamas County
InverterPad
InverterPad
Residence Residence
MAJOR CONTOURS (25’)MINOR CONTOURS (5’)PROPOSED FENCEPHOTOVOLTAIC ARRAYEXISTING ENTRANCEINVERTER LOCATIONSNOISE LOCATION
Legend:
0 50 100 200
Riverknoll Way
R11
RM6
RM8
Figure 4. Change In Noise Levels at Residences By Hour of Day
IM7
IM5
I10
DATE: 04/03/2009 ODOT Solar Power Facility (West Linn)I-205, Clackamas County
InverterPad
InverterPad
Notes: Quiet Daylight Noise Hour 5am - 6am, 8pm - 9pm in Spring or Summer Average Noise Hour All other daylight hours Peak Noise Hours 7am -9am and 3pm - 6pm all Seasons
Quiet Average Peak0 0 0
Daylight Noise Hours (dBA)
Quiet Average Peak2 1 1
Daylight Noise Hours (dBA)Quiet Average Peak
3 2 1
Daylight Noise Hours (dBA)
Residence
Residence