questionnaire study of perceived noise impact in the ... · pdf file1 noisun – a project...
TRANSCRIPT
1
NOISUN – a project where noise barriers produce solar heat
Questionnaire study of perceived noise
impact in the residential area
- Before the noise barrier protection
Xuetao Zhang
SP Acoustics
July 15, 2013

2
Content
1. Background
2. Questionnaire analysis
3. Discussion
Appendix
1. Background
Action 3 of the NOISUN project is intended identifying the current noise situation in the
residential area before having the noise barrier protection, measured and perceived. This
questionnaire study is targeted to investigate the perceived noise impact. Moreover, action A3
is related to action C1 which is targeted to identify the noise situation after the noise barrier is
erected.
In the studied residential area there are many different noise sources: the highway (E20)
traffic, the railway traffic (which also induces ground vibration), aircrafts, the local road
traffic (Göteborgsvägen and Aspenäsvägen), the parking field/streets, activities of local
people or neighbours (e.g. screaming children, loud music, slamming doors, heavy footsteps,
water discharging, barking dogs, etc.), in-building facilities, maintenance or repair work (e.g.
lawnmowers, drilling machines, caretaker tractors, etc.), gulls cry, etc. As perceived noise
impact depends both on subjective factors (e.g. indulgent towards, or sensitive to noise) and
objective factors (e.g. noise level, noise type, having a quiet side or not, noise exposure in day
time or in night time), this questionnaire study will have its focus on part of the objective
factors – in what extent the residents are disturbed by the highway and the railway noise,
because the noise barrier is to reduce noise from these two noise types.
The studied residential area as well as the location of the noise barrier is shown in Fig. 1,
where the green line indicates the location of the noise barrier consisting of solar panels, the
yellow line is for the extended barrier section consisting of normal panels, and the blue line is
for the northern platform of the railway station Aspedalen (shown in Fig. 2) which reduces the
railway noise by about 8 dB. It can be seen that the residential area can further be divided into
two parts: area 1 for which the noise barrier has its full effect in reducing the railway noise
and the highway noise, and area 2 for which the noise barrier has only partial effect in
reducing the noise. In action C1 it will be interesting to look at the difference in perceived
noise impact between these two areas after having the noise barrier protection.
As a high response rate is important for the quality of a questionnaire study, the good strategy
have been applied: firstly, except a well prepared (while simplified) the questionnaire, an
information letter which explains the purpose of the study was delivered to the residents one
week before delivering out the questionnaire; secondly, after the response deadline, a remind

3
letter was delivered to those residents who had not given their answers. Moreover, as it is
Lerum municipality who delivered the questionnaire and collected the answers, people living
in the area may feel closely relevant and may more willingly give their answers. There are
also other two favoured factors: (1) people are keen on reducing the local noise impact; (2)
there are quite many retired people living in the area who have time and are willing to answer
the questionnaire.
The information letter was delivered out in the early of May and all the collected answers
were registered in an Excel data file which was ready in the early of June. The answer
distributions to each of the questions are presented in Appendix. These answer distributions
will be analysed in section 2. Further discussions will be given in section 3.
Fig. 1 The location of the noise barrier (green line + yellow line), the railway station
Aspedalen (the blue line; see also Fig. 2), and the studied residential areas (area 1 + area 2).
area 1 area 2

4
Fig. 2 The northern platform of the railway station Aspedalen.
2. Questionnaire analysis
Following ISO/TS 15666 [1] and also referring to the COST questionnaire template [2], a
questionnaire suitable for the action 3 of the NOISUN project was designed. In this simplified
questionnaire, 11 response scales (0 - 10) have been assigned to questions 1-28, where scale 0
is for no disturbance and scale 10 for extremely much disturbance. Moreover, except for
question 28, an extra scale, ‘No idea (Vet ej)’, is provided in case people cannot answer the
question by some reasons, or, simply think the question irrelevant. For questions 29 and 30,
only 3 response scales, (No, Yes, No idea), are assigned. For ‘Comments’, people can write
whatever they like to comment that will provide some detailed information such as what noise
types have been disturbing them.
Answers following the given response scales are presented in Appendix. In the following, for
simplifying the analysis, the 11 response scales are further combined into two groups: 0-5 for
less disturbed and 6-10 for much disturbed.
2.1 The response rate
The questionnaire has been delivered to 369 flats/houses in the studied residential area.
5
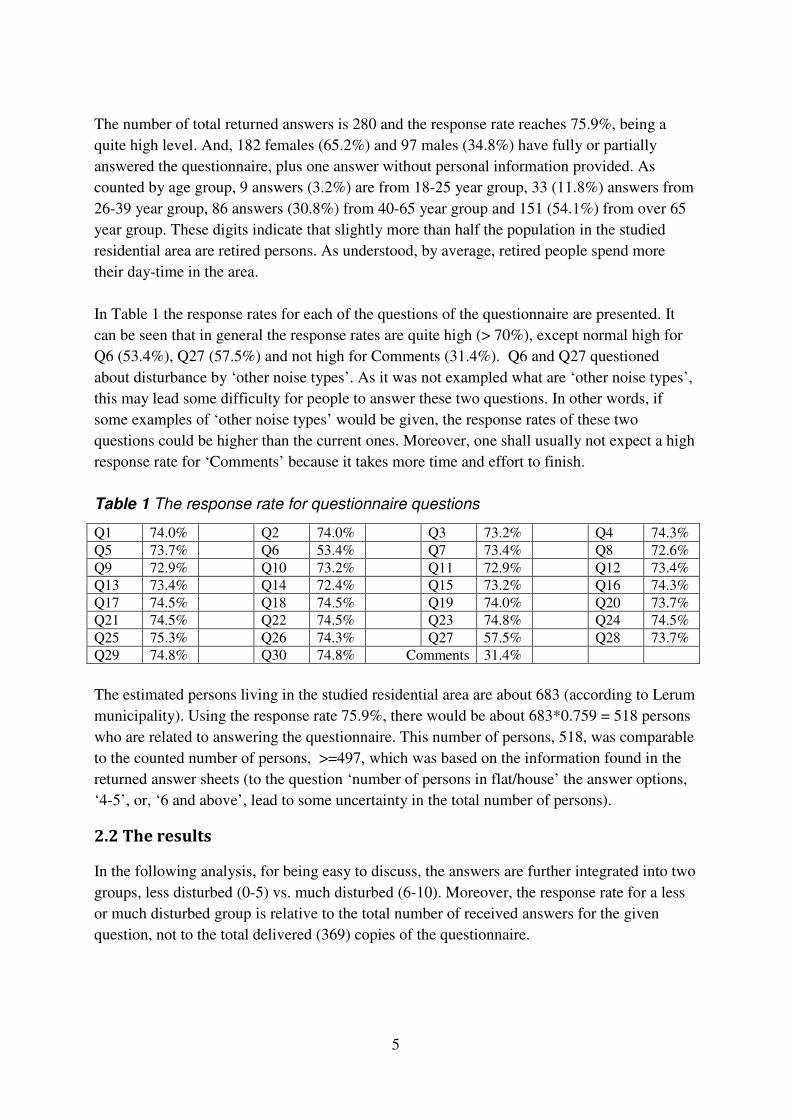
The number of total returned answers is 280 and the response rate reaches 75.9%, being a
quite high level. And, 182 females (65.2%) and 97 males (34.8%) have fully or partially
answered the questionnaire, plus one answer without personal information provided. As
counted by age group, 9 answers (3.2%) are from 18-25 year group, 33 (11.8%) answers from
26-39 year group, 86 answers (30.8%) from 40-65 year group and 151 (54.1%) from over 65
year group. These digits indicate that slightly more than half the population in the studied
residential area are retired persons. As understood, by average, retired people spend more
their day-time in the area.
In Table 1 the response rates for each of the questions of the questionnaire are presented. It
can be seen that in general the response rates are quite high (> 70%), except normal high for
Q6 (53.4%), Q27 (57.5%) and not high for Comments (31.4%). Q6 and Q27 questioned
about disturbance by ‘other noise types’. As it was not exampled what are ‘other noise types’,
this may lead some difficulty for people to answer these two questions. In other words, if
some examples of ‘other noise types’ would be given, the response rates of these two
questions could be higher than the current ones. Moreover, one shall usually not expect a high
response rate for ‘Comments’ because it takes more time and effort to finish.
Table 1 The response rate for questionnaire questions
Q1 74.0% Q2 74.0% Q3 73.2% Q4 74.3%
Q5 73.7% Q6 53.4% Q7 73.4% Q8 72.6%
Q9 72.9% Q10 73.2% Q11 72.9% Q12 73.4%
Q13 73.4% Q14 72.4% Q15 73.2% Q16 74.3%
Q17 74.5% Q18 74.5% Q19 74.0% Q20 73.7%
Q21 74.5% Q22 74.5% Q23 74.8% Q24 74.5%
Q25 75.3% Q26 74.3% Q27 57.5% Q28 73.7%
Q29 74.8% Q30 74.8% Comments 31.4%
The estimated persons living in the studied residential area are about 683 (according to Lerum
municipality). Using the response rate 75.9%, there would be about 683*0.759 = 518 persons
who are related to answering the questionnaire. This number of persons, 518, was comparable
to the counted number of persons, >=497, which was based on the information found in the
returned answer sheets (to the question ‘number of persons in flat/house’ the answer options,
‘4-5’, or, ‘6 and above’, lead to some uncertainty in the total number of persons).
2.2 The results
In the following analysis, for being easy to discuss, the answers are further integrated into two
groups, less disturbed (0-5) vs. much disturbed (6-10). Moreover, the response rate for a less
or much disturbed group is relative to the total number of received answers for the given
question, not to the total delivered (369) copies of the questionnaire.

6
2.2.1 The important noise sources
Based on the response rate for much disturbed group, the rank of important noise sources in
the studied residential area are found to be:
• Rail traffic (36.5%)
• Road traffic (26.3 %)
• Noise from neighbour (9.9 %)
• Other noise (7.6 %)
• Aircraft (6.3 %)
• In-building facilities (4.8 %)
This result indicates that aircraft noise is not serious for the residential area, because the area
is not directly under the flight route. In-building facility noise is also not important, for that
we shall thank the modern technology applied in the in-building facilities. There is one
comment about water discharging noise from the neighbour, indicating potential improvement
of the current sewer system.
There are about 10 % residents disturbed by noise from neighbours. According to received
comments, noise from neighbours can be e.g. screaming children, loud music, slamming
doors, heavy footsteps, water discharging, barking dogs, etc. The potential ways to reduce
disturbance from neighbours may be in two aspects: to regular residents’ behaviours, e.g. be
quiet between 9 pm and 7 am, and to apply acoustical measures, e.g. replacing current doors/
windows by the ones of better sound insulation, replacing current sewer system by a quieter
one, carpeting corridor floors, etc.
There are about 7.6 % residents disturbed by other noise types. According to the questions,
other noise types differ from the asked other five noise types, i.e. rail traffic, road traffic,
neighbour activities, aircraft, and in-building facilities. By reading the residents’ comments
the other noise types can be found to be: maintenance and/or repair work (e.g. lawnmowers,
drilling machines, caretaker tractors, etc.), motorcycles and mopeds, car parking, loud music
from parked cars or from restaurant, compressor sound from gas station, newspaper delivering,
gulls cry, gaping youngsters at night in the Nyebrogarden, boat traffic, etc.
Rail traffic is the most serious noise source in the studied residential area. According to the
Swedish Transport Agency, on the railway, the average daily passages are 172 passenger
trains (135 km/h) together with 50 freight trains (90 km/h). The residents’ comments
emphasized that freight trains are the most disturbing because they also induce sensible
ground vibration.
The yearly-averaged-daily traffic on the highway E20 (100 km/h, the Lerum section), in 2011,
is about 14000 vehicles (for each direction), wherein about 1200 (< 9 %) are trucks (90 km/h).
On the local road Göteborgsvägen (50 km/h), the daily traffic is about 7200 vehicles, wherein
5.1 % are trucks.

7
Around the middle of the barrier the highway E20 is about 50 m away from and about 3 m
above Göteborgsvägen, which in turn is about 0.5~1m above the wayside ground. The railway
is located between the highway E20 and Göteborgsvägen, both horizontally and vertically.
The noise barrier shall be located between the railway and Göteborgsvägen, between about 4
m and 6 m from the nearest rail. The barrier height is limited to 3 m above the railhead,
following the regulation of electrical safety for near track constructions. According to the
noise calculations, the barrier noise reduction is over 10 dB for the railway noise while only
about 4~5 dB for the E20 highway noise (because of the long distance).
2.2.2 Noise disturbances
Results presented in Tables 2 and 5 indicate that for indoors activities as well as for sleep, the
rail and road traffic are most disturbing. The next disturbing is the noise from neighbours. The
other noise types (see sub-sub-section 2.2.1 for examples) are nearly the same serious as the
noise from neighbours. Moreover, as shown in Tables 3 and 4, the rail and road traffic noise is
more disturbing when the windows are opened, or, when the residents on their balconies/
patios directly exposed to the noise.
Table 2 The percentage of the residents who suffering much sleep disturbance
Noise type Difficult to
sleep
Awakened Having worse
sleep quality
Neighbour and in-building facilities 5.9 % 8.2 % 8.2 %
Road or rail traffic 15.2 % 17.8 % 17.0 %
Aircraft 0.7 % 1.5 % 1.1 %
Table 3 The percentage of the residents whose activities in flat/house much impeded
by road or rail traffic
Activity type The ratio
Rest and relaxation 19.0 %
Conversation 14.5 %
Having bedroom window opened 34.5 %
Table 4 The percentage of the residents whose activities on the balcony/patio much
impeded by road or rail traffic
Activity type The ratio
Out stay 25.6 %
Rest and relaxation 27.6 %
Conversation 25.1 %

8
Table 5 The percentage of the residents whose indoors activities (with closed
windows) much impeded by different noise types
Noise type The ratio
Neighbour 9.8 %
In-building facilities 3.6 %
Road traffic 13.8 %
Rail traffic 21.9 %
Aircraft 2.9 %
Other noise types 9.0 %
Q28 asks: Are you indulgent towards, or sensitive to environment noise? There 12.5 %
answers are located within scales 6-10. Considering about 54.1% residents are over 65 year
old, most of them should be indulgent towards to environment noise. And, according to [3],
middle aged persons are likely to be subjectively more sensitive to noise than other age
groups.
In the studied residential area about 68.5 % residents do not have access to a quiet room in
their flat/house where they do not notice road or rail traffic noise even with the window ajar.
About 81.5 % residents do not have access to a quiet place outdoors adjacent to their
flat/house where they do not notice road or rail traffic noise. These two digits indicate the
demands to reduce noise from the rail and road traffic.
3. Discussion
The quality of a questionnaire study depends on two key factors: if the questionnaire is well
prepared and if the response rate is high, as the former factor aims at collecting necessary
information and the latter guarantees the reliability of the answering. For this questionnaire
study, the response rate is very high, as shown in Table 1 under sub-section 2.1. Thus, the
information reflected by the discussions in section 2 is highly credible. Moreover, if the
discussions in section 2 have clarified the information necessary for the project, then we can
speak that this questionnaire study is successful.
The most important noise sources in the residential area are the rail and road traffic, with the
second important one being noise from neighbours. Therefore, building up a noise barrier to
reduce noise from the rail and road traffic will in a large extent diminish the impact of
environmental noise in the studied residential area. And, it should be indicated that, a partial
of the road traffic noise which stems from Göteborgsvägen will not be reduced by the noise
barrier because Göteborgsvägen is located behind the barrier.
The noise exposure and the annoyance depend on the characters of noise sources (e.g. the
noise levels, the frequency spectra, the directivities, the vertical locations, etc.) and the
exposure modifiers [3]. For example, closer to or farther away from the noise sources, with or
without noise shielding, reflecting or absorbing façade, with the windows closed or opened,

9
the average absorption coefficient of the room surface, all these factors can modify the noise
exposure. Furthermore, some modifiers can be more important than others. As shown in
Tables 3 and 4, the residents in the area suffer more noise disturbance when the windows are
opened, or, when they use their balconies/patios. As expected, after having the noise barrier
protection, the residents will suffer less noise disturbance not only when taking indoors
activities but also when having their windows opened, or, when using their balconies/patios.
It was found that free comment in answering options is great. It provides detailed information
about different noise types, in which way and in what extent the respondents are disturbed by
the noise, their opinions on the planned noise barrier, etc. These comments are of benefit to
the questionnaire analysis.
Many respondents commented that the ground vibration induced by freight train passages is
very disturbing. As the noise barrier will only reduce the rail and road traffic noise but not the
ground vibration, this ground vibration problem will be left as an unsolved issue.
The noise barrier on the southern side of the highway E20 was finished around the end of
May, 2013, which is also the reason for a few months delay of this questionnaire study. Some
respondents commented that noise reflection from this barrier would increase the noise impact
in the residential area which is located on the northern side of the highway. However, this is
not the case. The foundation of the noise barrier on the southern side is about 2 m or more
above the highway E20. Therefore, in most situations this barrier only reflects the highway
noise up to the sky. (Of course, the rocks under the barrier do partially reflect the highway
noise back to the northern side.) Only under strong south wind the reflected highway noise
will bend down to the ground on the northern side, while in the case the wind noise will be
much stronger than the reflected highway noise.
Acknowledgement
Dag Glebe (SP) is responsible for the questionnaire design. Henrik Bengtsson and Peter
Rosengren (Lerum municipality) are in charge of delivering out the questionnaire and
collecting in the answering.
Reference
[1] ISO/TS 15666, Acoustics — Assessment of noise annoyance by means of social and
socio-acoustic surveys.
[2] COST TU0901 draft questionnaire_2011, by the courtesy of Christian Simmons, Simmons
Akustik & Utveckling AB.
[3] C. Eriksson, M.E. Nilsson and G. Pershagen, Environmental noise and health – Current
knowledge and research needs, Institute of Environmental Medicine, Karolinska Institutet,
Department of Psychology, Stockholm University, REPORT 6553, 2013.

10

11
Appendix Questionnaire result
The answer scale: 0 = not at all; 10 = vastly; No idea = irrelevant or cannot answer
Q1 – Q6: Think about the last 12 months, when you are in your flat/house - how much
disturbed or bothered you by
0
20
40
60
80
100
120
140
160
0 1 2 3 4 5 6 7 8 9 10 No
idea
Q1: Noise from neighbour
0
20
40
60
80
100
120
140
160
0 1 2 3 4 5 6 7 8 9 10 No
idea
Q2: Noise from in-building facilities

12
0
10
20
30
40
50
60
70
80
90
0 1 2 3 4 5 6 7 8 9 10 No
idea
Q3: Noise from road traffic
0
10
20
30
40
50
60
70
80
90
0 1 2 3 4 5 6 7 8 9 10 No
idea
Q4: Noise from rail traffic
0
20
40
60
80
100
120
140
160
0 1 2 3 4 5 6 7 8 9 10 No
idea
Q5: Noise from aircraft

13
Q7 – Q9: Think about the last 12 months, when you are in your flat/house - how much do you
think the noise from the neighbours and in-building facilities hamper your sleep? Does noise
from neighbours and in-building facilities lead
0
20
40
60
80
100
120
0 1 2 3 4 5 6 7 8 9 10 No
idea
Q6: Other noise
0
20
40
60
80
100
120
140
160
180
200
0 1 2 3 4 5 6 7 8 9 10 No
idea
Q7: You have difficulty to sleep

14
0
20
40
60
80
100
120
140
160
180
200
0 1 2 3 4 5 6 7 8 9 10 No
idea
Q8: You awakened
0
20
40
60
80
100
120
140
160
180
200
0 1 2 3 4 5 6 7 8 9 10 No
idea
Q9: You have worse sleep quality
15
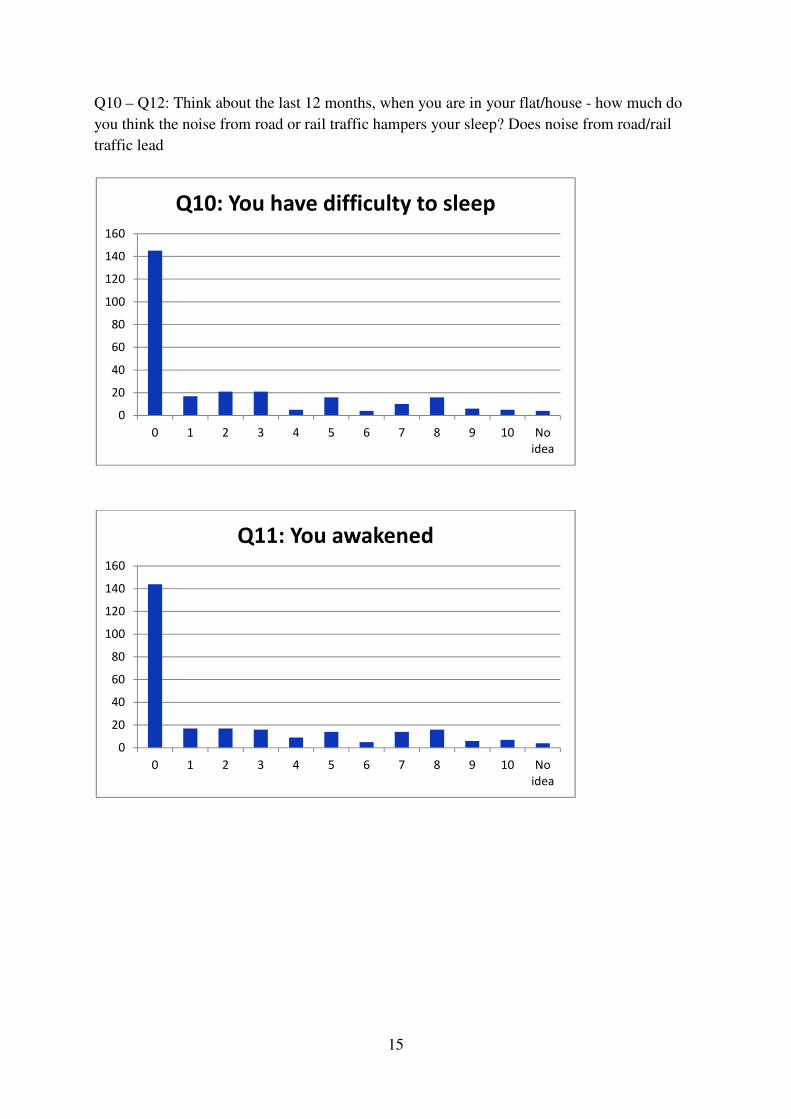
Q10 – Q12: Think about the last 12 months, when you are in your flat/house - how much do
you think the noise from road or rail traffic hampers your sleep? Does noise from road/rail
traffic lead
0
20
40
60
80
100
120
140
160
0 1 2 3 4 5 6 7 8 9 10 No
idea
Q10: You have difficulty to sleep
0
20
40
60
80
100
120
140
160
0 1 2 3 4 5 6 7 8 9 10 No
idea
Q11: You awakened

16
Q13 – Q15: Think about the last 12 months, when you are in your flat/house - how much do
you think the noise from aircraft hampers your sleep? Does noise from aircraft lead
0
20
40
60
80
100
120
140
160
0 1 2 3 4 5 6 7 8 9 10 No
idea
Q12: You have worse sleep quality
0
50
100
150
200
250
0 1 2 3 4 5 6 7 8 9 10 No
idea
Q13: You have difficulty to sleep

17
0
50
100
150
200
250
0 1 2 3 4 5 6 7 8 9 10 No
idea
Q14: You awakened
0
50
100
150
200
250
0 1 2 3 4 5 6 7 8 9 10 No
idea
Q15: You have worse sleep quality

18
Q16 – Q18: Think about the last 12 months, when you are in your flat/house - do you think
that noise from road or rail traffic interferes with or impedes the following listed activities
0
20
40
60
80
100
120
140
160
0 1 2 3 4 5 6 7 8 9 10 No
idea
Q16: Rest and relaxation are impeded
0
20
40
60
80
100
120
140
160
180
0 1 2 3 4 5 6 7 8 9 10 No
idea
Q17: Conversation is impeded

19
Q19 – Q21: Think about the last 12 months, when you are outside your flat/house on the
balcony/patio - do you think that noise from road or rail traffic interferes with or impedes the
following listed activities
0
20
40
60
80
100
120
0 1 2 3 4 5 6 7 8 9 10 No
idea
Q18: To have bed room windows
open is impeded
0
20
40
60
80
100
120
140
0 1 2 3 4 5 6 7 8 9 10 No
idea
Q19: Outdoor stay is impeded

20
0
20
40
60
80
100
120
140
0 1 2 3 4 5 6 7 8 9 10 No
idea
Q20: Rest and relaxation are impeded
0
20
40
60
80
100
120
140
0 1 2 3 4 5 6 7 8 9 10 No
idea
Q21: Conversations are impeded

21
Q22 – Q27: Think about the last 12 months, when you are indoors in your flat/house with
closed windows - how much disturbed or bothered you by
0
20
40
60
80
100
120
140
160
180
0 1 2 3 4 5 6 7 8 9 10 No
idea
Q22: Noise from neighbour
0
20
40
60
80
100
120
140
160
180
0 1 2 3 4 5 6 7 8 9 10 No
idea
Q23: Noise from in-building facilities

22
0
20
40
60
80
100
120
140
160
0 1 2 3 4 5 6 7 8 9 10 No
idea
Q24: Noise from road traffic
0
20
40
60
80
100
120
140
0 1 2 3 4 5 6 7 8 9 10 No
idea
Q25: Noise from rail traffic
0
20
40
60
80
100
120
140
160
180
200
0 1 2 3 4 5 6 7 8 9 10 No
idea
Q26: Noise from aircraft

23
Q28 – Q30:
0
20
40
60
80
100
120
140
0 1 2 3 4 5 6 7 8 9 10 No
idea
Q27: Other noise
0
20
40
60
80
100
120
0 1 2 3 4 5 6 7 8 9 10
Q28: Are you indulgent towards, or,
sensitive to environmentalal noise?

24
0
50
100
150
200
No Yes No idea
Q29: Do you hace access to a quiet
room in your flat/house where you
do not notice road or rail traffic noise
even with the window ajar?
0
50
100
150
200
250
No Yes No idea
Q30: Do you hace access to a quiet
place ourdoors adjacent to your
flat/house where you do not notice
road or rail noise?