dmr 020210 english
TRANSCRIPT
8/6/2019 DMR 020210 English
http://slidepdf.com/reader/full/dmr-020210-english 1/16
1
Saudi Stock Market Report2 Feb 2010
Market Snapshots
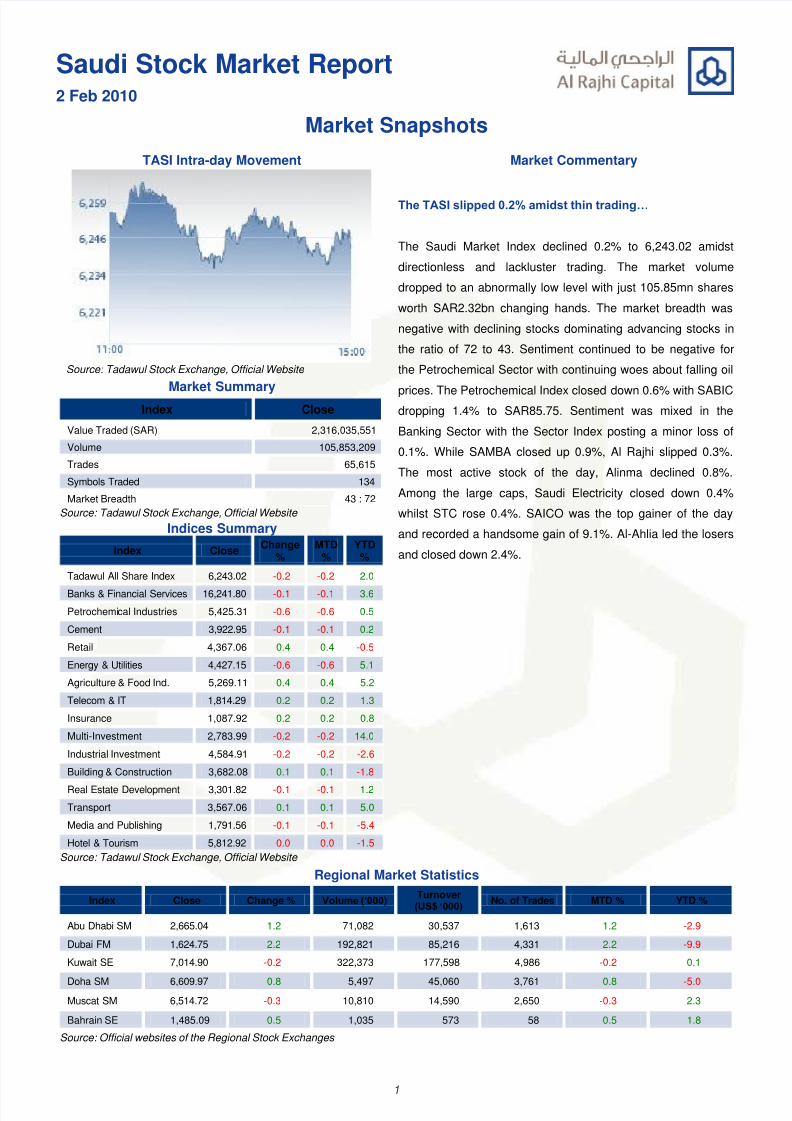
TASI Intra-day Movement Market Commentary
Source: Tadawul Stock Exchange, Official Website
The TASI slipped 0.2% amidst thin trading…
The Saudi Market Index declined 0.2% to 6,243.02 amidst
directionless and lackluster trading. The market volume
dropped to an abnormally low level with just 105.85mn shares
worth SAR2.32bn changing hands. The market breadth was
negative with declining stocks dominating advancing stocks in
the ratio of 72 to 43. Sentiment continued to be negative for
the Petrochemical Sector with continuing woes about falling oil
prices. The Petrochemical Index closed down 0.6% with SABICdropping 1.4% to SAR85.75. Sentiment was mixed in the
Banking Sector with the Sector Index posting a minor loss of
0.1%. While SAMBA closed up 0.9%, Al Rajhi slipped 0.3%.
The most active stock of the day, Alinma declined 0.8%.
Among the large caps, Saudi Electricity closed down 0.4%
whilst STC rose 0.4%. SAICO was the top gainer of the day
and recorded a handsome gain of 9.1%. Al-Ahlia led the losers
and closed down 2.4%.
Market Summary
Index Close
Value Traded (SAR) 2,316,035,551
Volume 105,853,209
Trades 65,615
Symbols Traded 134
Market Breadth 43 : 72
Source: Tadawul Stock Exchange, Official Website
Indices Summary
Index CloseChange
%MTD
%YTD%
Tadawul All Share Index 6,243.02 -0.2 -0.2 2.0
Banks & Financial Services 16,241.80 -0.1 -0.1 3.6
Petrochemical Industries 5,425.31 -0.6 -0.6 0.5
Cement 3,922.95 -0.1 -0.1 0.2
Retail 4,367.06 0.4 0.4 -0.5
Energy & Utilities 4,427.15 -0.6 -0.6 5.1
Agriculture & Food Ind. 5,269.11 0.4 0.4 5.2
Telecom & IT 1,814.29 0.2 0.2 1.3
Insurance 1,087.92 0.2 0.2 0.8
Multi-Investment 2,783.99 -0.2 -0.2 14.0
Industrial Investment 4,584.91 -0.2 -0.2 -2.6
Building & Construction 3,682.08 0.1 0.1 -1.8
Real Estate Development 3,301.82 -0.1 -0.1 1.2
Transport 3,567.06 0.1 0.1 5.0
Media and Publishing 1,791.56 -0.1 -0.1 -5.4
Hotel & Tourism 5,812.92 0.0 0.0 -1.5
Source: Tadawul Stock Exchange, Official Website
Regional Market Statistics
Index Close Change % Volume (‘000) Turnover(US$ ‘000)
No. of Trades MTD % YTD %
Abu Dhabi SM 2,665.04 1.2 71,082 30,537 1,613 1.2 -2.9
Dubai FM 1,624.75 2.2 192,821 85,216 4,331 2.2 -9.9
Kuwait SE 7,014.90 -0.2 322,373 177,598 4,986 -0.2 0.1
Doha SM 6,609.97 0.8 5,497 45,060 3,761 0.8 -5.0
Muscat SM 6,514.72 -0.3 10,810 14,590 2,650 -0.3 2.3
Bahrain SE 1,485.09 0.5 1,035 573 58 0.5 1.8
Source: Official websites of the Regional Stock Exchanges
8/6/2019 DMR 020210 English
http://slidepdf.com/reader/full/dmr-020210-english 2/16
2
Saudi Stock Market Report2 Feb 2010
Market Movers & Shakers
Top Gainers Top Losers
CompanyClosing
Price(SAR)
Change
%
Volume
(mn)
SAICO 65.75 9.1 1.39
SISCO 13.90 4.1 2.64
A.Othaim Market 57.25 3.2 0.38
ACIG 55.50 2.3 0.60
Astra Indust 35.70 2.3 0.38
CompanyClosing
Price(SAR)
Change
%
Volume
(mn)
Al-Ahlia 81.50 -2.4 0.32
U C A 36.90 -2.1 2.05
SANAD 26.80 -1.8 0.25
Gulf Union 26.80 -1.8 1.24
Gas&Industrialization 22.90 -1.7 0.20
Volume Leaders Value Leaders
CompanyClosing
Price(SAR)
Change%
Volume(mn)
Alinma 12.70 -0.8 23.88
Kingdom 7.45 -1.3 14.42
Emaar E .C 10.05 -1.5 8.35
Saudi Kayan 18.25 0.0 3.83
MA’ADEN 16.70 -1.2 2.71
CompanyClosing
Price(SAR)
Change%
Value(SAR‘mn)
Alinma 12.70 -0.8 304.26
SABIC 85.75 -1.4 149.16
Kingdom 7.45 -1.3 107.49
Al Rajhi 73.75 -0.3 90.70
SAICO 65.75 9.1 88.66
52 Week New High / Low Stocks consistently gaining / losing over last three
trading sessions (Top 6)
CompanyClosing
Price(SAR)
NewHigh(SAR)
New Low(SAR)
No stock touched new 52-week high or low
CompanyCurrent
Price(SAR)
3 DaysChange
%
3 DaysAvg.
Volume(mn)
SAICO 65.75 14.3 0.87
Arriyadh Development 12.55 4.1 1.39
Saudi Indian 53.75 3.8 0.32
NADEC 30.50 -2.9 0.08
Jazan Development 13.40 -2.9 0.45
Al Baha 18.15 -4.3 1.69
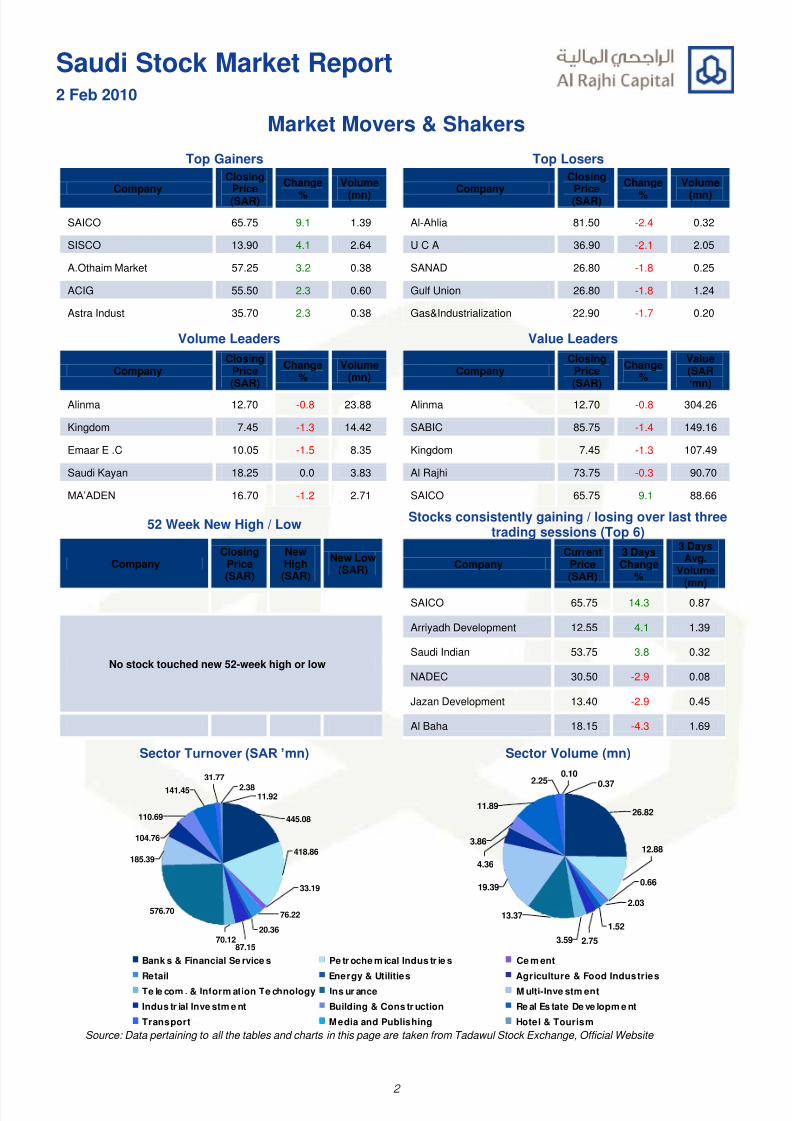
Sector Turnover (SAR ’mn) Sector Volume (mn)
445.08
11.922.38141.45
31.77
110.69
104.76
185.39
576.70
70.1287.15
20.36
418.86
33.19
76.22
2.03
0.66
1.52
12.88
2.753.59
13.37
19.39
4.36
3.86
11.89
2.25
26.82
0.10
0.37
Bank s & Financial Se rvice s Pe tr oche m ical Indus tr ie s Ce m ent
Retail Energy & Utilities Agriculture & Food Industries
Te le com . & Inform ation Te chnology Ins ur ance M ulti-Inve stm ent
Indus tr ial Inve stm e nt Building & Cons tr uction Re al Es tate De ve lopm e nt
Transport Media and Publishing Hotel & Tourism Source: Data pertaining to all the tables and charts in this page are taken from Tadawul Stock Exchange, Official Website
8/6/2019 DMR 020210 English
http://slidepdf.com/reader/full/dmr-020210-english 3/16
3
Saudi Stock Market Report2 Feb 2010
Saudi Technical Watch
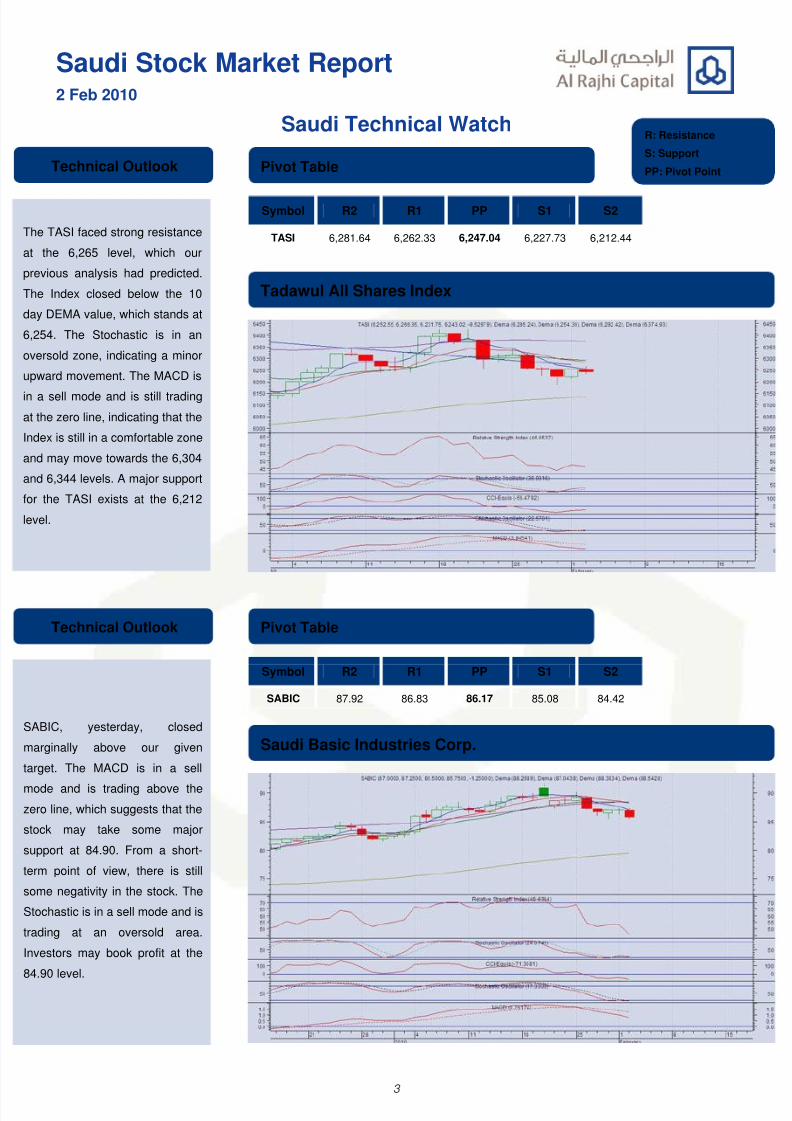
Symbol R2 R1 PP S1 S2
TASI 6,281.64 6,262.33 6,247.04 6,227.73 6,212.44
Symbol R2 R1 PP S1 S2
SABIC 87.92 86.83 86.17 85.08 84.42
The TASI faced strong resistance
at the 6,265 level, which our
previous analysis had predicted.
The Index closed below the 10
day DEMA value, which stands at
6,254. The Stochastic is in an
oversold zone, indicating a minor
upward movement. The MACD is
n a sell mode and is still trading
at the zero line, indicating that the
ndex is still in a comfortable zone
and may move towards the 6,304
and 6,344 levels. A major support
or the TASI exists at the 6,212
evel.
Technical Outlook
Tadawul All Shares Index
Pivot Table
SABIC, yesterday, closed
marginally above our given
arget. The MACD is in a sell
mode and is trading above the
zero line, which suggests that the
stock may take some major
support at 84.90. From a short-
erm point of view, there is still
some negativity in the stock. The
Stochastic is in a sell mode and is
rading at an oversold area.
nvestors may book profit at the
84.90 level.
Technical Outlook
Saudi Basic Industries Corp.
Pivot Table
R: Resistance
S: Support
PP: Pivot Point
8/6/2019 DMR 020210 English
http://slidepdf.com/reader/full/dmr-020210-english 4/16
4
Saudi Stock Market Report2 Feb 2010
Saudi Technical Watch
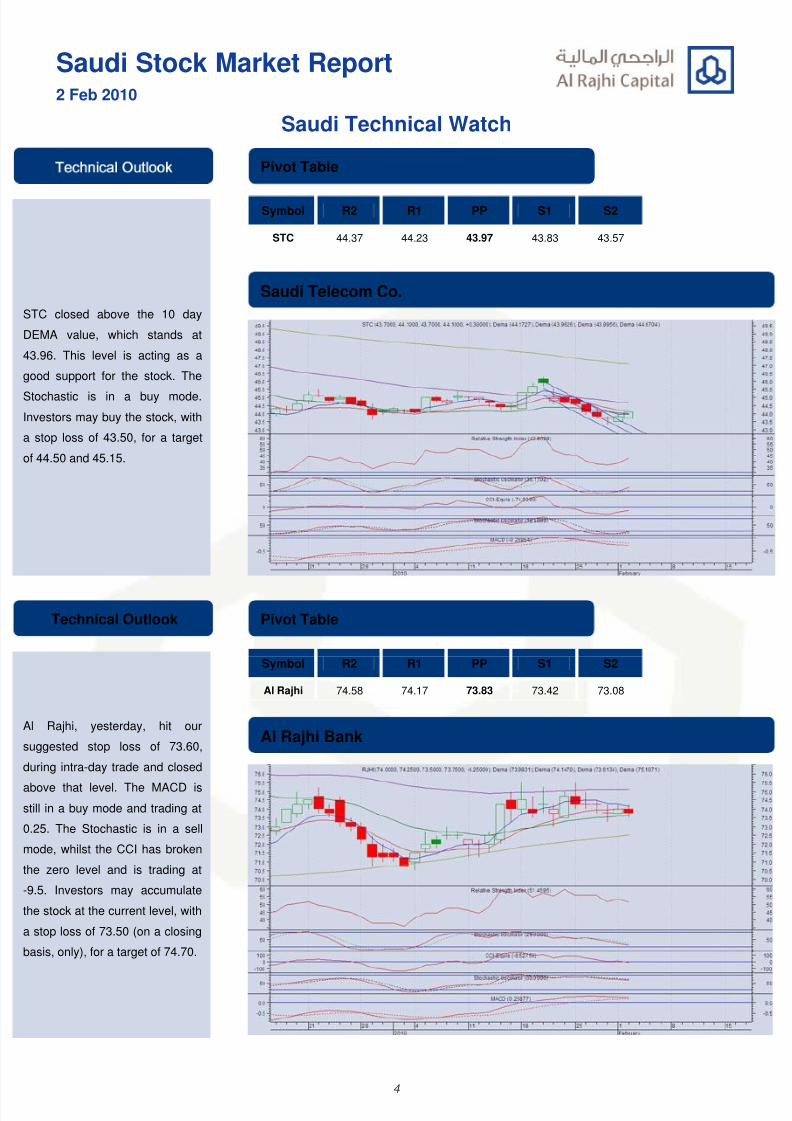
Symbol R2 R1 PP S1 S2
STC 44.37 44.23 43.97 43.83 43.57
Symbol R2 R1 PP S1 S2
Al Rajhi 74.58 74.17 73.83 73.42 73.08
STC closed above the 10 day
DEMA value, which stands at
43.96. This level is acting as a
good support for the stock. The
Stochastic is in a buy mode.
nvestors may buy the stock, with
a stop loss of 43.50, for a target
of 44.50 and 45.15.
Saudi Telecom Co.
Pivot Table
Al Rajhi, yesterday, hit our
suggested stop loss of 73.60,
during intra-day trade and closed
above that level. The MACD is
still in a buy mode and trading at
0.25. The Stochastic is in a sell
mode, whilst the CCI has broken
he zero level and is trading at
9.5. Investors may accumulate
he stock at the current level, with
a stop loss of 73.50 (on a closing
basis, only), for a target of 74.70.
Technical Outlook
Al Rajhi Bank
Pivot Table
8/6/2019 DMR 020210 English
http://slidepdf.com/reader/full/dmr-020210-english 5/16
5
Saudi Stock Market Report2 Feb 2010
Saudi Technical Watch
Symbol R2 R1 PP S1 S2
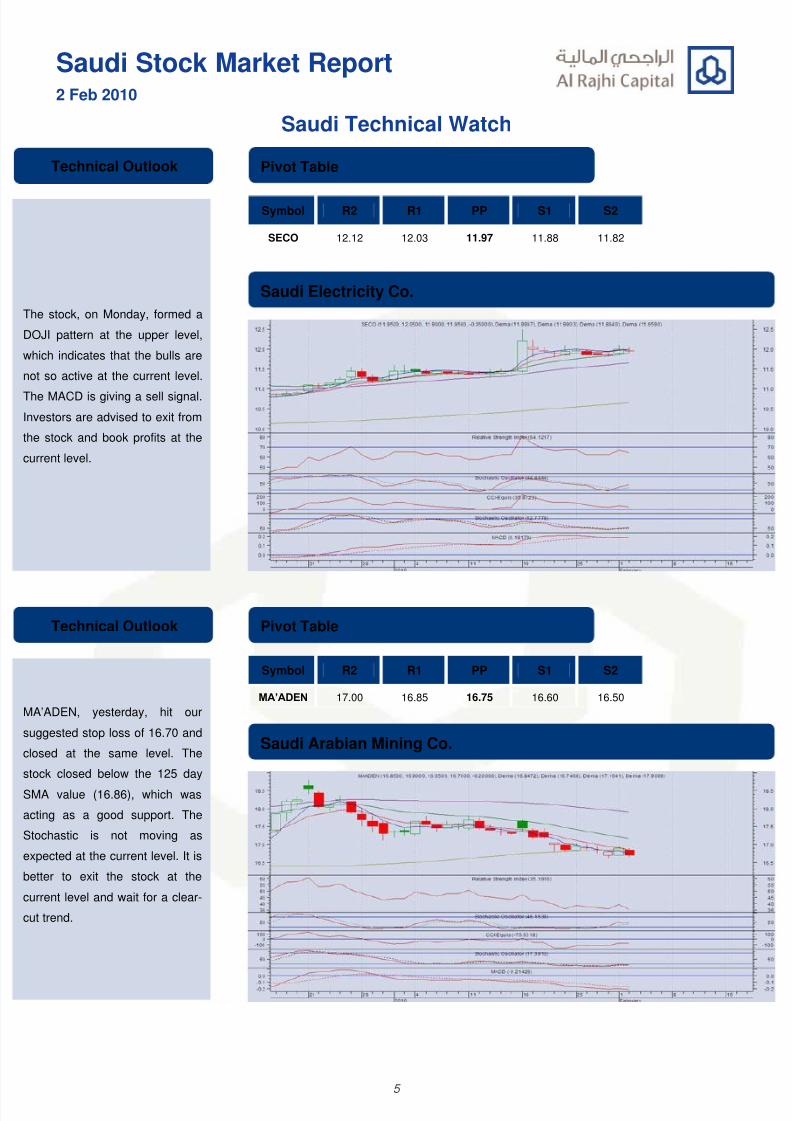
SECO 12.12 12.03 11.97 11.88 11.82
Symbol R2 R1 PP S1 S2
MA’ADEN 17.00 16.85 16.75 16.60 16.50
The stock, on Monday, formed a
DOJI pattern at the upper level,
which indicates that the bulls are
not so active at the current level.
The MACD is giving a sell signal.
nvestors are advised to exit from
he stock and book profits at the
current level.
Technical Outlook
Saudi Electricity Co.
Pivot Table
MA’ADEN, yesterday, hit our
suggested stop loss of 16.70 and
closed at the same level. The
stock closed below the 125 day
SMA value (16.86), which was
acting as a good support. The
Stochastic is not moving as
expected at the current level. It is
better to exit the stock at the
current level and wait for a clear-
cut trend.
Technical Outlook
Saudi Arabian Mining Co.
Pivot Table
8/6/2019 DMR 020210 English
http://slidepdf.com/reader/full/dmr-020210-english 6/16
6
Saudi Stock Market Report2 Feb 2010
GCC Technical Watch
Symbol R2 R1 PP S1 S2
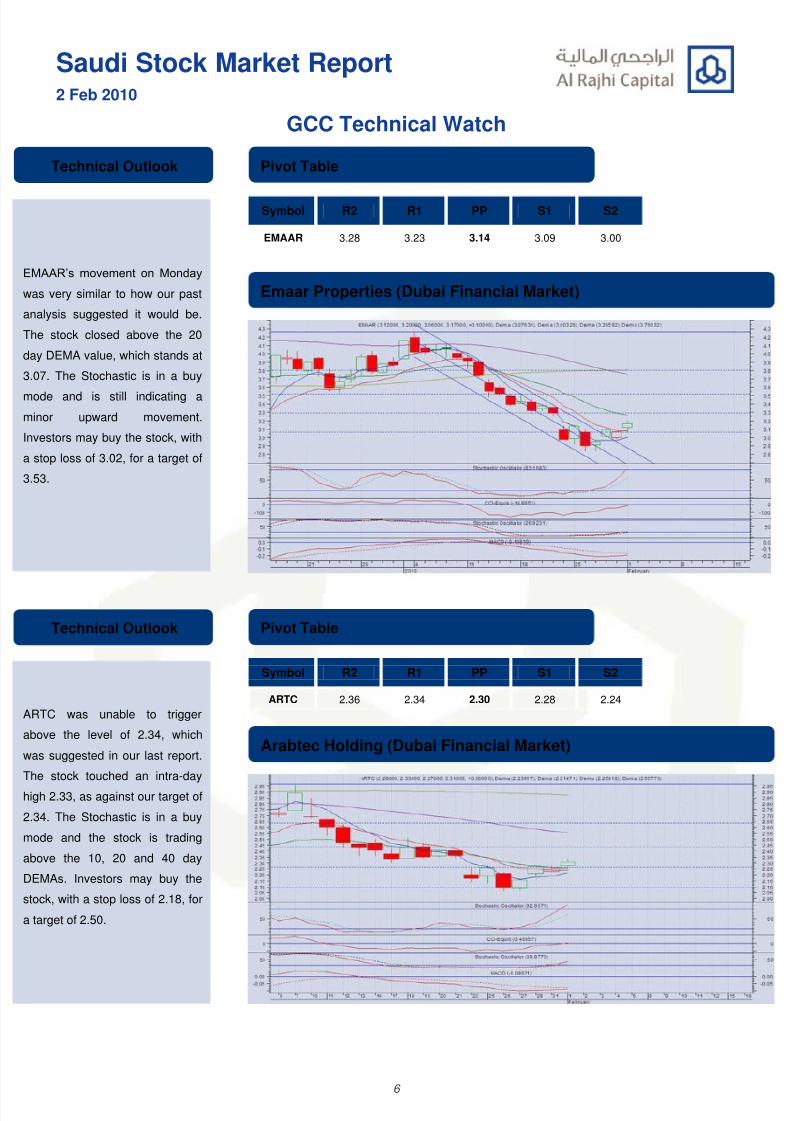
EMAAR 3.28 3.23 3.14 3.09 3.00
Symbol R2 R1 PP S1 S2
ARTC 2.36 2.34 2.30 2.28 2.24
EMAAR’s movement on Monday
was very similar to how our past
analysis suggested it would be.
The stock closed above the 20
day DEMA value, which stands at
3.07. The Stochastic is in a buy
mode and is still indicating a
minor upward movement.
nvestors may buy the stock, with
a stop loss of 3.02, for a target of
3.53.
Technical Outlook
Emaar Properties (Dubai Financial Market)
Pivot Table
ARTC was unable to trigger
above the level of 2.34, which
was suggested in our last report.
The stock touched an intra-day
high 2.33, as against our target of
2.34. The Stochastic is in a buy
mode and the stock is trading
above the 10, 20 and 40 day
DEMAs. Investors may buy the
stock, with a stop loss of 2.18, for
a target of 2.50.
Technical Outlook
Arabtec Holding (Dubai Financial Market)
Pivot Table
8/6/2019 DMR 020210 English
http://slidepdf.com/reader/full/dmr-020210-english 7/16
7
Saudi Stock Market Report2 Feb 2010
GCC Technical Watch
Symbol R2 R1 PP S1 S2
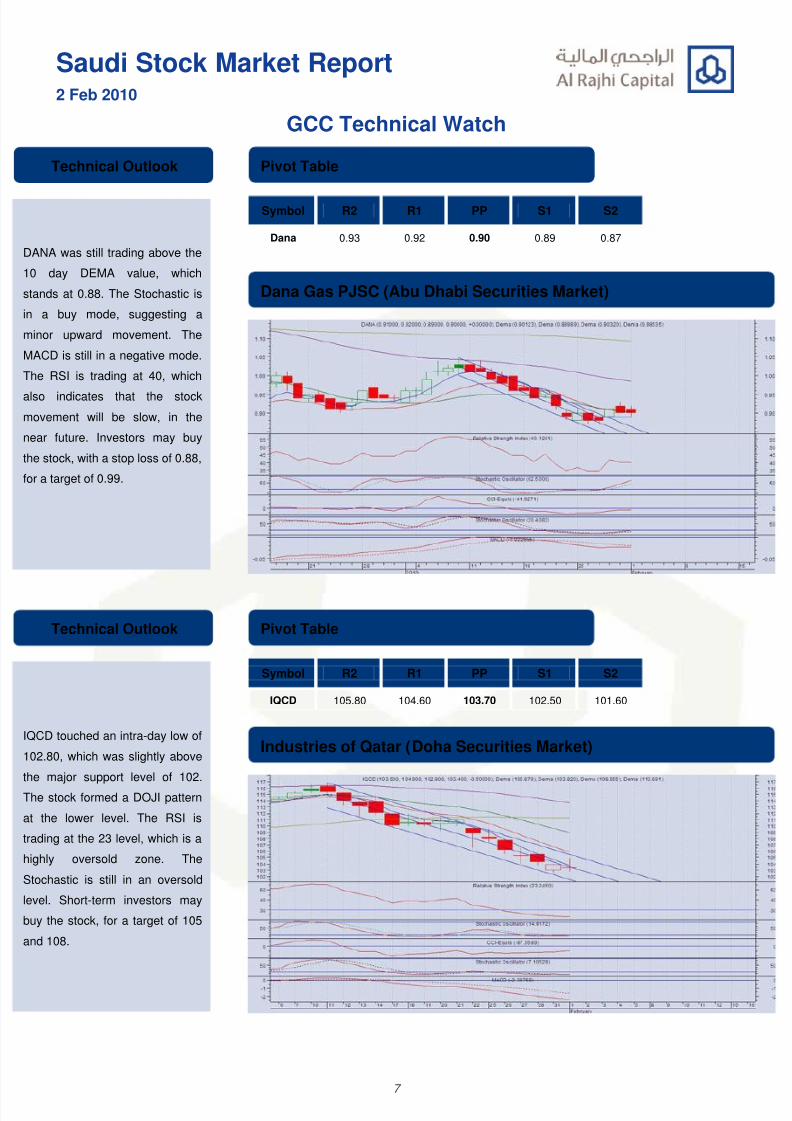
Dana 0.93 0.92 0.90 0.89 0.87
Symbol R2 R1 PP S1 S2
IQCD 105.80 104.60 103.70 102.50 101.60
DANA was still trading above the
0 day DEMA value, which
stands at 0.88. The Stochastic is
n a buy mode, suggesting a
minor upward movement. The
MACD is still in a negative mode.
The RSI is trading at 40, which
also indicates that the stock
movement will be slow, in the
near future. Investors may buy
he stock, with a stop loss of 0.88,
or a target of 0.99.
Technical Outlook
Dana Gas PJSC (Abu Dhabi Securities Market)
Pivot Table
QCD touched an intra-day low of
02.80, which was slightly above
he major support level of 102.
The stock formed a DOJI pattern
at the lower level. The RSI is
rading at the 23 level, which is a
highly oversold zone. The
Stochastic is still in an oversold
evel. Short-term investors may
buy the stock, for a target of 105
and 108.
Technical Outlook
Industries of Qatar (Doha Securities Market)
Pivot Table
8/6/2019 DMR 020210 English
http://slidepdf.com/reader/full/dmr-020210-english 8/16
8
Saudi Stock Market Report2 Feb 2010
GCC Technical Watch
Symbol R2 R1 PP S1 S2
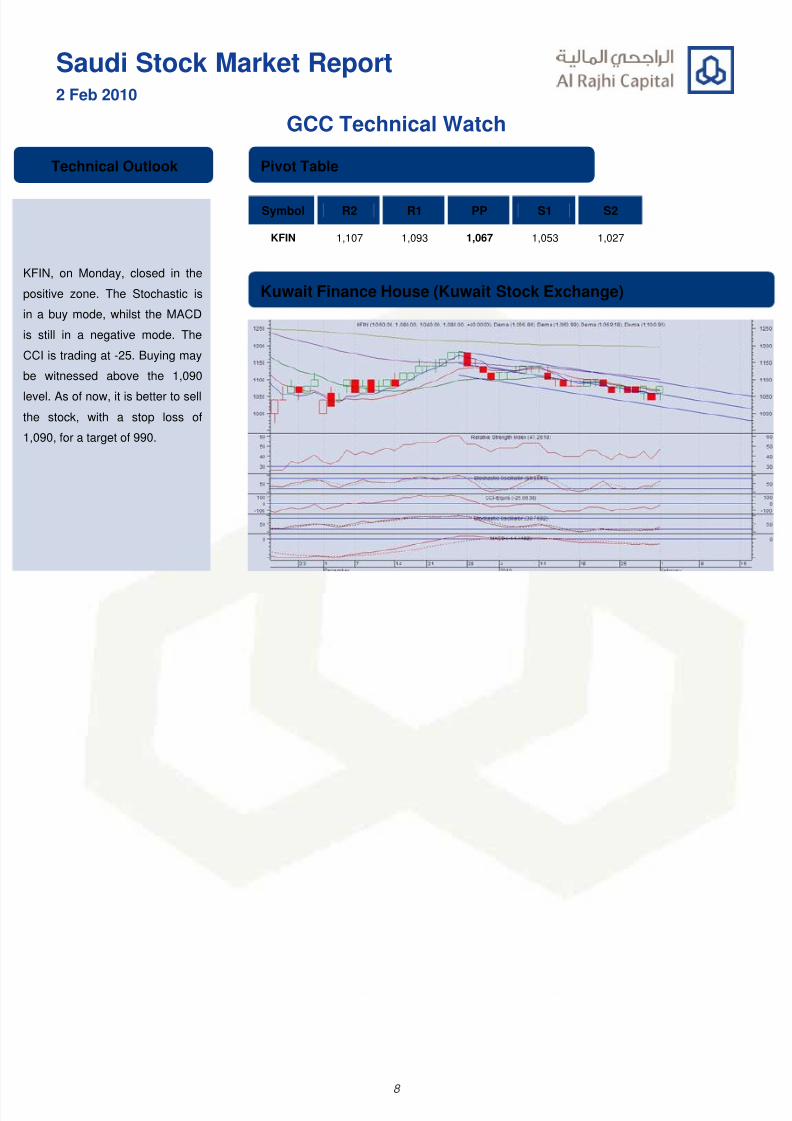
KFIN 1,107 1,093 1,067 1,053 1,027
KFIN, on Monday, closed in the
positive zone. The Stochastic is
n a buy mode, whilst the MACD
s still in a negative mode. The
CCI is trading at -25. Buying may
be witnessed above the 1,090
evel. As of now, it is better to sell
he stock, with a stop loss of
,090, for a target of 990.
Technical Outlook
Kuwait Finance House (Kuwait Stock Exchange)
Pivot Table
8/6/2019 DMR 020210 English
http://slidepdf.com/reader/full/dmr-020210-english 9/16
9
Saudi Stock Market Report2 Feb 2010
Corporate News & Announcements
Saudi developer Emaar Economic City, an affiliate of Dubai's Emaar Properties, will receive a long-term loan of
about SAR5bn from the Ministry of Finance, a source close to the deal said yesterday.
The Board of Directors of Alujain Corporation decided yesterday to appoint its member Eng. Khalid Ibrahim
Zagzoog as the Managing Director of the company effective from February 1, 2010 and for the rest of the current
board term expiring on December 31, 2011.
8/6/2019 DMR 020210 English
http://slidepdf.com/reader/full/dmr-020210-english 10/16
10
Saudi Stock Market Report2 Feb 2010
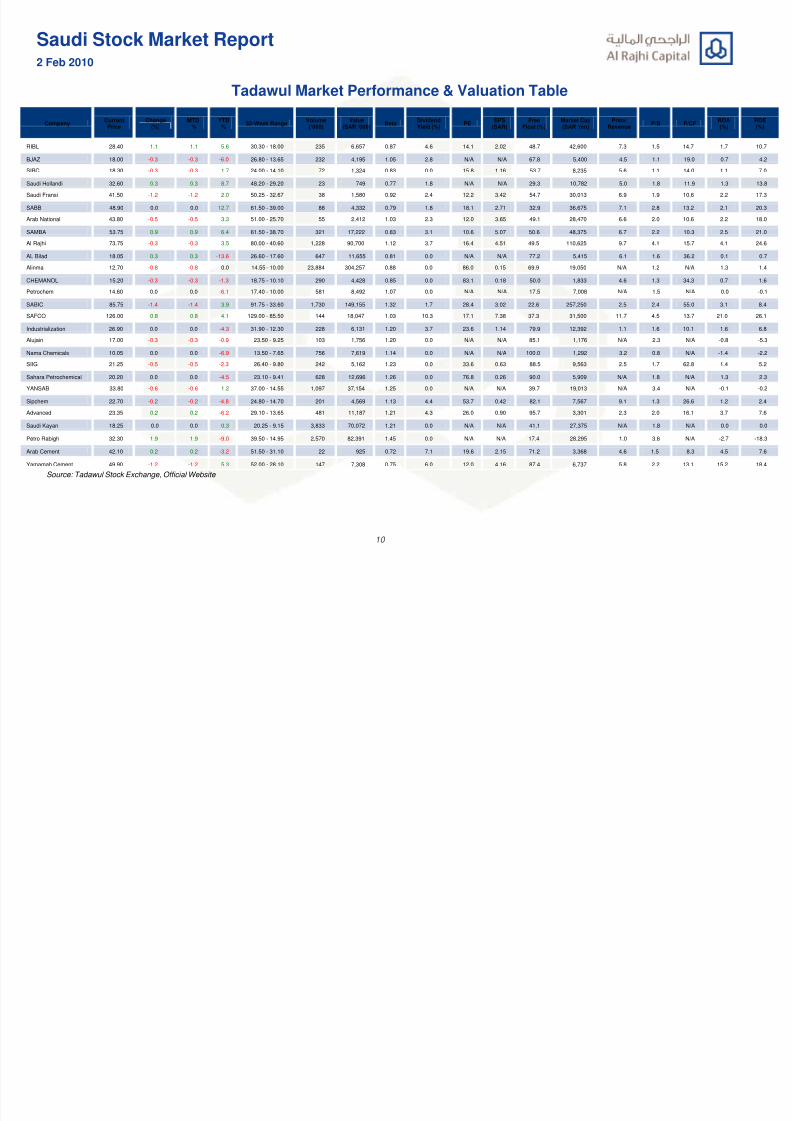
Tadawul Market Performance & Valuation Table
CompanyCurrent
PriceChange
(%)MTD
%YTD
%52-Week Range
Volume(‘000)
Value(SAR ‘000)
BetaDividendYield (%)
PEEPS
(SAR)Free
Float (%)Market Cap(SAR ‘mn)
Price/Revenue
P/B P/CFROA(%)
ROE(%)
RIBL 28.40 1.1 1.1 5.6 30.30 - 18.00 235 6,657 0.87 4.6 14.1 2.02 48.7 42,600 7.3 1.5 14.7 1.7 10.7
BJAZ 18.00 -0.3 -0.3 -6.0 26.80 - 13.65 232 4,195 1.05 2.8 N/A N/A 67.8 5,400 4.5 1.1 19.0 0.7 4.2
SIBC 18.30 -0.3 -0.3 1.7 24.00 - 14.10 72 1,324 0.83 0.0 15.8 1.16 53.7 8,235 5.6 1.1 14.0 1.1 7.0
Saudi Hollandi 32.60 0.3 0.3 8.7 48.20 - 29.20 23 749 0.77 1.8 N/A N/A 29.3 10,782 5.0 1.8 11.9 1.3 13.8
Saudi Fransi 41.50 -1.2 -1.2 2.0 50.25 - 32.67 38 1,580 0.92 2.4 12.2 3.42 54.7 30,013 6.9 1.9 10.6 2.2 17.3
SABB 48.90 0.0 0.0 12.7 61.50 - 39.00 88 4,332 0.79 1.8 18.1 2.71 32.9 36,675 7.1 2.8 13.2 2.1 20.3
Arab National 43.80 -0.5 -0.5 3.3 51.00 - 25.70 55 2,412 1.03 2.3 12.0 3.65 49.1 28,470 6.6 2.0 10.6 2.2 18.0
SAMBA 53.75 0.9 0.9 6.4 61.50 - 38.70 321 17,222 0.83 3.1 10.6 5.07 50.6 48,375 6.7 2.2 10.3 2.5 21.0
Al Rajhi 73.75 -0.3 -0.3 3.5 80.00 - 40.60 1,228 90,700 1.12 3.7 16.4 4.51 49.5 110,625 9.7 4.1 15.7 4.1 24.6
AL Bilad 18.05 0.3 0.3 -13.6 26.60 - 17.60 647 11,655 0.81 0.0 N/A N/A 77.2 5,415 6.1 1.6 36.2 0.1 0.7
Alinma 12.70 -0.8 -0.8 0.0 14.55 - 10.00 23,884 304,257 0.88 0.0 86.0 0.15 69.9 19,050 N/A 1.2 N/A 1.3 1.4
CHEMANOL 15.20 -0.3 -0.3 -1.3 18.75 - 10.10 290 4,428 0.85 0.0 83.1 0.18 50.0 1,833 4.6 1.3 34.3 0.7 1.6
Petrochem 14.60 0.0 0.0 -6.1 17.40 - 10.00 581 8,492 1.07 0.0 N/A N/A 17.5 7,008 N/A 1.5 N/A 0.0 -0.1
SABIC 85.75 -1.4 -1.4 3.9 91.75 - 33.60 1,730 149,155 1.32 1.7 28.4 3.02 22.6 257,250 2.5 2.4 55.0 3.1 8.4
SAFCO 126.00 0.8 0.8 4.1 129.00 - 85.50 144 18,047 1.03 10.3 17.1 7.38 37.3 31,500 11.7 4.5 13.7 21.0 26.1
Industrialization 26.90 0.0 0.0 -4.3 31.90 - 12.30 228 6,131 1.20 3.7 23.6 1.14 79.9 12,392 1.1 1.6 10.1 1.6 6.8
Alujain 17.00 -0.3 -0.3 -0.9 23.50 - 9.25 103 1,756 1.20 0.0 N/A N/A 85.1 1,176 N/A 2.3 N/A -0.8 -5.3
Nama Chemicals 10.05 0.0 0.0 -6.9 13.50 - 7.65 756 7,619 1.14 0.0 N/A N/A 100.0 1,292 3.2 0.8 N/A -1.4 -2.2
SIIG 21.25 -0.5 -0.5 -2.3 26.40 - 9.80 242 5,162 1.23 0.0 33.6 0.63 88.5 9,563 2.5 1.7 62.8 1.4 5.2
Sahara Petrochemical 20.20 0.0 0.0 -4.5 23.10 - 9.41 628 12,696 1.26 0.0 76.8 0.26 90.0 5,909 N/A 1.8 N/A 1.3 2.3
YANSAB 33.80 -0.6 -0.6 1.2 37.00 - 14.55 1,097 37,154 1.25 0.0 N/A N/A 39.7 19,013 N/A 3.4 N/A -0.1 -0.2
Sipchem 22.70 -0.2 -0.2 -4.8 24.80 - 14.70 201 4,569 1.13 4.4 53.7 0.42 82.1 7,567 9.1 1.3 26.6 1.2 2.4
Advanced 23.35 0.2 0.2 -6.2 29.10 - 13.65 481 11,187 1.21 4.3 26.0 0.90 95.7 3,301 2.3 2.0 16.1 3.7 7.6
Saudi Kayan 18.25 0.0 0.0 0.3 20.25 - 9.15 3,833 70,072 1.21 0.0 N/A N/A 41.1 27,375 N/A 1.8 N/A 0.0 0.0
Petro Rabigh 32.30 1.9 1.9 -9.0 39.50 - 14.95 2,570 82,391 1.45 0.0 N/A N/A 17.4 28,295 1.0 3.6 N/A -2.7 -18.3
Arab Cement 42.10 0.2 0.2 -3.2 51.50 - 31.10 22 925 0.72 7.1 19.6 2.15 71.2 3,368 4.6 1.5 8.3 4.5 7.6
Yamamah Cement 49.90 -1.2 -1.2 5.3 52.00 - 28.10 147 7,308 0.75 6.0 12.0 4.16 87.4 6,737 5.8 2.2 13.1 15.2 18.4
Source: Tadawul Stock Exchange, Official Website
8/6/2019 DMR 020210 English
http://slidepdf.com/reader/full/dmr-020210-english 11/16
11
Saudi Stock Market Report2 Feb 2010
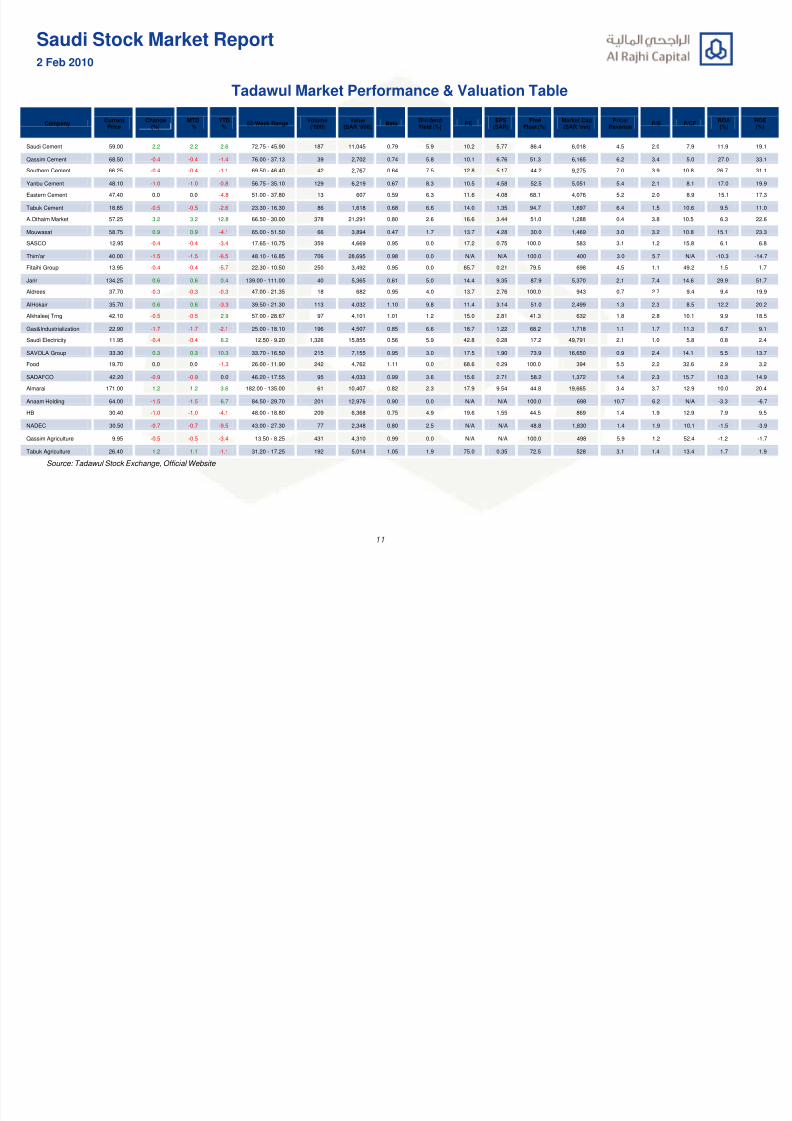
Tadawul Market Performance & Valuation Table
CompanyCurrent
PriceChange
(%)MTD
%YTD
%52-Week Range
Volume(‘000)
Value(SAR ‘000)
BetaDividendYield (%)
PEEPS
(SAR)Free
Float (%)Market Cap(SAR ‘mn)
Price/Revenue
P/B P/CFROA(%)
ROE(%)
Saudi Cement 59.00 2.2 2.2 2.6 72.75 - 45.90 187 11,045 0.79 5.9 10.2 5.77 86.4 6,018 4.5 2.0 7.9 11.9 19.1
Qassim Cement 68.50 -0.4 -0.4 -1.4 76.00 - 37.13 39 2,702 0.74 5.8 10.1 6.76 51.3 6,165 6.2 3.4 5.0 27.0 33.1
Southern Cement 66.25 -0.4 -0.4 -1.1 69.50 - 46.40 42 2,767 0.64 7.5 12.8 5.17 44.2 9,275 7.0 3.9 10.8 26.7 31.1
Yanbu Cement 48.10 -1.0 -1.0 -0.8 56.75 - 35.10 129 6,219 0.67 8.3 10.5 4.58 52.5 5,051 5.4 2.1 8.1 17.0 19.9
Eastern Cement 47.40 0.0 0.0 -4.8 51.00 - 37.80 13 607 0.59 6.3 11.6 4.08 68.1 4,076 5.2 2.0 8.9 15.1 17.3
Tabuk Cement 18.85 -0.5 -0.5 -2.6 23.30 - 16.30 86 1,618 0.68 6.6 14.0 1.35 94.7 1,697 6.4 1.5 10.6 9.5 11.0
A.Othaim Market 57.25 3.2 3.2 12.8 66.50 - 30.00 378 21,291 0.80 2.6 16.6 3.44 51.0 1,288 0.4 3.8 10.5 6.3 22.6
Mouwasat 58.75 0.9 0.9 -4.1 65.00 - 51.50 66 3,894 0.47 1.7 13.7 4.28 30.0 1,469 3.0 3.2 10.8 15.1 23.3
SASCO 12.95 -0.4 -0.4 -3.4 17.65 - 10.75 359 4,669 0.95 0.0 17.2 0.75 100.0 583 3.1 1.2 15.8 6.1 6.8
Thim'ar 40.00 -1.5 -1.5 -6.5 48.10 - 16.85 706 28,695 0.98 0.0 N/A N/A 100.0 400 3.0 5.7 N/A -10.3 -14.7
Fitaihi Group 13.95 -0.4 -0.4 -5.7 22.30 - 10.50 250 3,492 0.95 0.0 65.7 0.21 79.5 698 4.5 1.1 49.2 1.5 1.7
Jarir 134.25 0.6 0.6 0.4 139.00 - 111.00 40 5,365 0.61 5.0 14.4 9.35 87.9 5,370 2.1 7.4 14.6 29.9 51.7
Aldrees 37.70 -0.3 -0.3 -0.3 47.00 - 21.35 18 682 0.95 4.0 13.7 2.76 100.0 943 0.7 2.7 9.4 9.4 19.9
AlHokair 35.70 0.6 0.6 -3.3 39.50 - 21.30 113 4,032 1.10 9.8 11.4 3.14 51.0 2,499 1.3 2.3 8.5 12.2 20.2
Alkhaleej Trng 42.10 -0.5 -0.5 2.9 57.00 - 28.67 97 4,101 1.01 1.2 15.0 2.81 41.3 632 1.8 2.8 10.1 9.9 18.5
Gas&Industrialization 22.90 -1.7 -1.7 -2.1 25.00 - 18.10 196 4,507 0.85 6.6 18.7 1.22 68.2 1,718 1.1 1.7 11.3 6.7 9.1
Saudi Electricity 11.95 -0.4 -0.4 6.2 12.50 - 9.20 1,326 15,855 0.56 5.9 42.8 0.28 17.2 49,791 2.1 1.0 5.8 0.8 2.4
SAVOLA Group 33.30 0.3 0.3 10.3 33.70 - 16.50 215 7,155 0.95 3.0 17.5 1.90 73.9 16,650 0.9 2.4 14.1 5.5 13.7
Food 19.70 0.0 0.0 -1.3 26.00 - 11.90 242 4,762 1.11 0.0 68.6 0.29 100.0 394 5.5 2.2 32.6 2.9 3.2
SADAFCO 42.20 -0.9 -0.9 0.0 46.20 - 17.55 95 4,033 0.99 3.6 15.6 2.71 58.2 1,372 1.4 2.3 15.7 10.3 14.9
Almarai 171.00 1.2 1.2 3.6 182.00 - 135.00 61 10,407 0.82 2.3 17.9 9.54 44.8 19,665 3.4 3.7 12.9 10.0 20.4
Anaam Holding 64.00 -1.5 -1.5 6.7 84.50 - 29.70 201 12,976 0.90 0.0 N/A N/A 100.0 698 10.7 6.2 N/A -3.3 -6.7
HB 30.40 -1.0 -1.0 -4.1 48.00 - 18.80 209 6,368 0.75 4.9 19.6 1.55 44.5 869 1.4 1.9 12.9 7.9 9.5
NADEC 30.50 -0.7 -0.7 -9.5 43.00 - 27.30 77 2,348 0.80 2.5 N/A N/A 48.8 1,830 1.4 1.9 10.1 -1.5 -3.9
Qassim Agriculture 9.95 -0.5 -0.5 -3.4 13.50 - 8.25 431 4,310 0.99 0.0 N/A N/A 100.0 498 5.9 1.2 52.4 -1.2 -1.7
Tabuk Agriculture 26.40 1.2 1.1 -1.1 31.20 - 17.25 192 5,014 1.05 1.9 75.0 0.35 72.5 528 3.1 1.4 13.4 1.7 1.9
Source: Tadawul Stock Exchange, Official Website
8/6/2019 DMR 020210 English
http://slidepdf.com/reader/full/dmr-020210-english 12/16
12
Saudi Stock Market Report2 Feb 2010
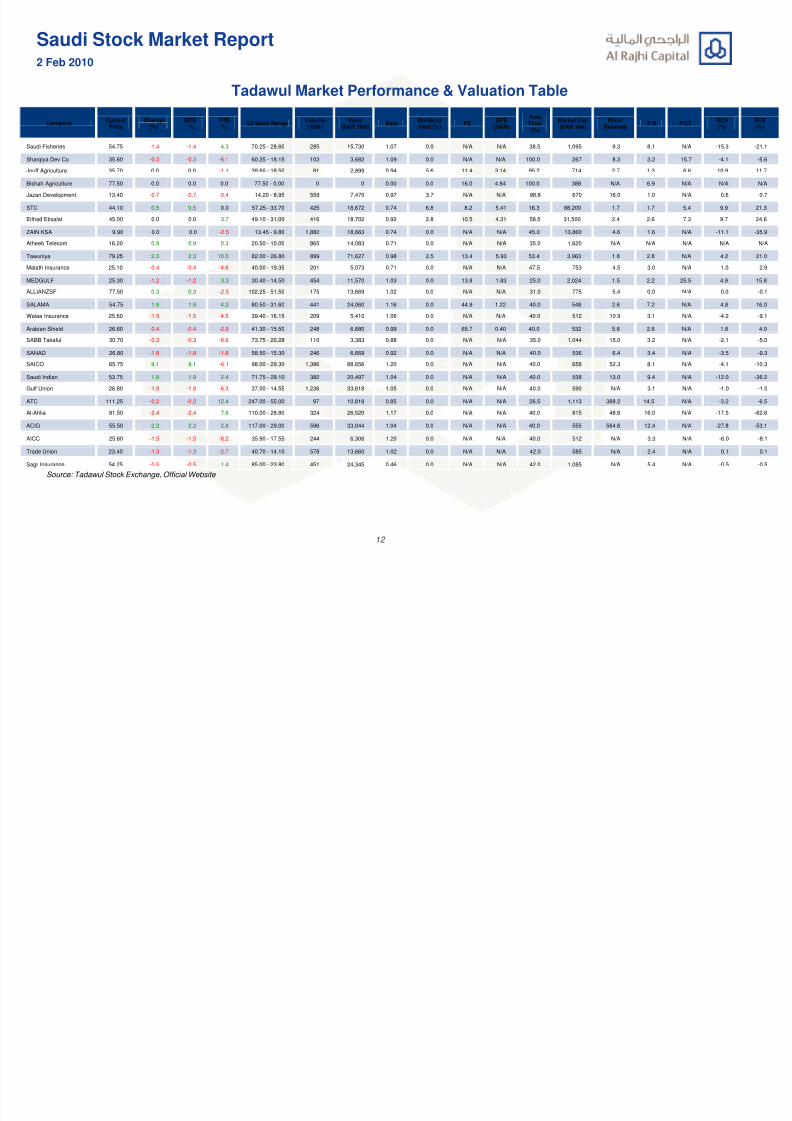
Tadawul Market Performance & Valuation Table
CompanyCurrent
PriceChange
(%)MTD
%YTD
%52-Week Range
Volume(‘000)
Value(SAR ‘000)
BetaDividendYield (%)
PEEPS
(SAR)
FreeFloat(%)
Market Cap(SAR ‘mn)
Price/Revenue
P/B P/CFROA(%)
ROE(%)
Saudi Fisheries 54.75 -1.4 -1.4 4.3 70.25 - 28.60 285 15,730 1.07 0.0 N/A N/A 38.5 1,095 9.3 8.1 N/A -15.3 -21.1
Sharqiya Dev Co 35.60 -0.3 -0.3 -6.1 60.25 - 18.15 103 3,682 1.09 0.0 N/A N/A 100.0 267 8.3 3.2 15.7 -4.1 -5.6
Jouff Agriculture 35.70 0.0 0.0 -1.1 39.60 - 18.50 81 2,899 0.94 5.6 11.4 3.14 95.2 714 2.7 1.3 6.6 10.9 11.7
Bishah Agriculture 77.50 0.0 0.0 0.0 77.50 - 0.00 0 0 0.00 0.0 16.0 4.84 100.0 388 N/A 6.9 N/A N/A N/A
Jazan Development 13.40 -0.7 -0.7 -0.4 14.20 - 8.95 559 7,470 0.97 3.7 N/A N/A 98.8 670 16.0 1.0 N/A 0.6 0.7
STC 44.10 0.5 0.5 0.0 57.25 - 33.70 425 18,672 0.74 6.8 8.2 5.41 16.3 88,200 1.7 1.7 5.4 9.9 21.3
Etihad Etisalat 45.00 0.0 0.0 3.7 49.10 - 31.00 416 18,702 0.92 2.8 10.5 4.31 58.5 31,500 2.4 2.6 7.3 9.7 24.6
ZAIN KSA 9.90 0.0 0.0 -2.5 13.45 - 9.80 1,882 18,663 0.74 0.0 N/A N/A 45.0 13,860 4.6 1.6 N/A -11.1 -35.9
Atheeb Telecom 16.20 0.9 0.9 0.3 20.50 - 10.00 865 14,083 0.71 0.0 N/A N/A 35.0 1,620 N/A N/A N/A N/A N/A
Tawuniya 79.25 2.3 2.3 10.5 82.00 - 26.80 899 71,627 0.98 2.5 13.4 5.93 53.4 3,963 1.8 2.8 N/A 4.2 21.0
Malath Insurance 25.10 -0.4 -0.4 -4.6 40.00 - 19.35 201 5,073 0.71 0.0 N/A N/A 47.5 753 4.5 3.0 N/A 1.0 2.9
MEDGULF 25.30 -1.2 -1.2 3.3 30.40 - 14.50 454 11,570 1.03 0.0 13.8 1.83 25.0 2,024 1.5 2.2 25.5 4.9 15.8
ALLIANZSF 77.50 0.3 0.3 -2.5 102.25 - 51.50 175 13,669 1.02 0.0 N/A N/A 31.0 775 5.4 0.0 N/A 0.0 -0.1
SALAMA 54.75 1.9 1.9 4.3 80.50 - 31.60 441 24,060 1.16 0.0 44.9 1.22 40.0 548 2.6 7.2 N/A 4.8 16.0
Walaa Insurance 25.60 -1.5 -1.5 -4.5 39.40 - 16.15 209 5,410 1.06 0.0 N/A N/A 40.0 512 10.9 3.1 N/A -4.2 -9.1
Arabian Shield 26.60 -0.4 -0.4 -2.9 41.30 - 15.50 248 6,680 0.99 0.0 65.7 0.40 40.0 532 5.6 2.6 N/A 1.8 4.0
SABB Takaful 30.70 -0.3 -0.3 -8.6 73.75 - 20.28 110 3,383 0.88 0.0 N/A N/A 35.0 1,044 15.0 3.2 N/A -2.1 -5.0
SANAD 26.80 -1.8 -1.8 -1.8 58.50 - 15.30 246 6,669 0.92 0.0 N/A N/A 40.0 536 6.4 3.4 N/A -3.5 -9.3
SAICO 65.75 9.1 9.1 -6.1 98.00 - 29.30 1,386 88,656 1.20 0.0 N/A N/A 40.0 658 52.3 8.1 N/A -4.1 -10.3
Saudi Indian 53.75 1.9 1.9 2.4 71.75 - 29.10 382 20,497 1.04 0.0 N/A N/A 40.0 538 13.0 9.4 N/A -12.0 -36.2
Gulf Union 26.80 -1.8 -1.8 -6.3 37.00 - 14.55 1,236 33,618 1.05 0.0 N/A N/A 40.0 590 N/A 3.1 N/A -1.0 -1.0
ATC 111.25 -0.2 -0.2 12.4 247.00 - 55.00 97 10,819 0.85 0.0 N/A N/A 26.5 1,113 388.2 14.5 N/A -3.2 -6.5
Al-Ahlia 81.50 -2.4 -2.4 7.6 110.00 - 28.80 324 26,520 1.17 0.0 N/A N/A 40.0 815 48.6 16.0 N/A -17.5 -62.6
ACIG 55.50 2.3 2.3 2.8 117.00 - 29.00 596 33,044 1.04 0.0 N/A N/A 40.0 555 564.6 12.4 N/A -27.8 -53.1
AICC 25.60 -1.5 -1.5 -8.2 35.90 - 17.55 244 6,306 1.20 0.0 N/A N/A 40.0 512 N/A 3.3 N/A -6.0 -8.1
Trade Union 23.40 -1.3 -1.3 -2.7 40.70 - 14.10 578 13,660 1.02 0.0 N/A N/A 42.0 585 N/A 2.4 N/A 0.1 0.1
Sagr Insurance 54.25 -0.5 -0.5 1.4 85.00 - 23.80 451 24,345 0.46 0.0 N/A N/A 42.0 1,085 N/A 5.4 N/A -0.5 -0.5
Source: Tadawul Stock Exchange, Official Website
8/6/2019 DMR 020210 English
http://slidepdf.com/reader/full/dmr-020210-english 13/16
13
Saudi Stock Market Report2 Feb 2010
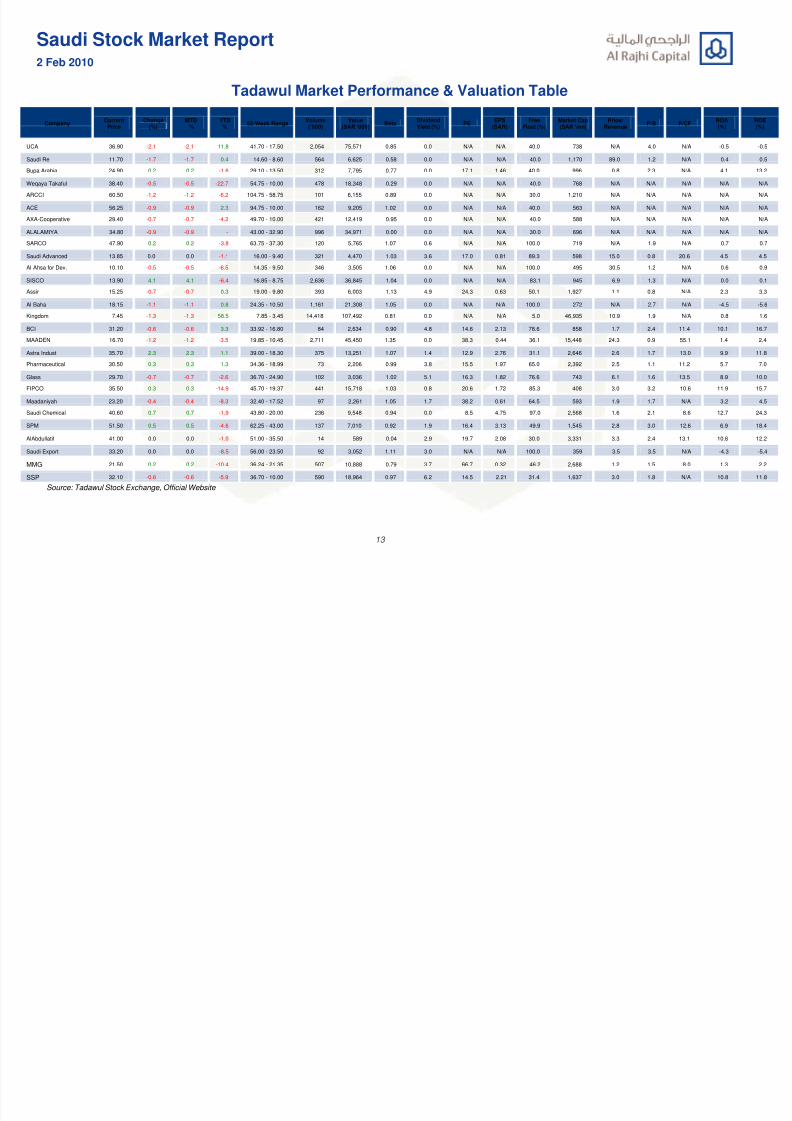
Tadawul Market Performance & Valuation Table
CompanyCurrent
PriceChange
(%)MTD
%YTD
%52-Week Range
Volume(‘000)
Value(SAR ‘000)
BetaDividendYield (%)
PEEPS
(SAR)Free
Float (%)Market Cap(SAR ‘mn)
Price/Revenue
P/B P/CFROA(%)
ROE(%)
UCA 36.90 -2.1 -2.1 11.8 41.70 - 17.50 2,054 75,571 0.85 0.0 N/A N/A 40.0 738 N/A 4.0 N/A -0.5 -0.5
Saudi Re 11.70 -1.7 -1.7 0.4 14.60 - 8.60 564 6,625 0.58 0.0 N/A N/A 40.0 1,170 89.0 1.2 N/A 0.4 0.5
Bupa Arabia 24.90 0.2 0.2 -1.6 29.10 - 13.50 312 7,795 0.77 0.0 17.1 1.46 40.0 996 0.8 2.3 N/A 4.1 13.2
Weqaya Takaful 38.40 -0.5 -0.5 -22.7 54.75 - 10.00 478 18,348 0.29 0.0 N/A N/A 40.0 768 N/A N/A N/A N/A N/A
ARCCI 60.50 -1.2 -1.2 -6.2 104.75 - 58.75 101 6,155 0.89 0.0 N/A N/A 30.0 1,210 N/A N/A N/A N/A N/A
ACE 56.25 -0.9 -0.9 2.3 94.75 - 10.00 162 9,205 1.02 0.0 N/A N/A 40.0 563 N/A N/A N/A N/A N/A
AXA-Cooperative 29.40 -0.7 -0.7 -4.2 49.70 - 10.00 421 12,419 0.95 0.0 N/A N/A 40.0 588 N/A N/A N/A N/A N/A
ALALAMIYA 34.80 -0.9 -0.9 - 43.00 - 32.90 996 34,971 0.00 0.0 N/A N/A 30.0 696 N/A N/A N/A N/A N/A
SARCO 47.90 0.2 0.2 -3.8 63.75 - 37.30 120 5,765 1.07 0.6 N/A N/A 100.0 719 N/A 1.9 N/A 0.7 0.7
Saudi Advanced 13.85 0.0 0.0 -1.1 16.00 - 9.40 321 4,470 1.03 3.6 17.0 0.81 89.3 598 15.0 0.8 20.6 4.5 4.5
Al Ahsa for Dev. 10.10 -0.5 -0.5 -6.5 14.35 - 9.50 346 3,505 1.06 0.0 N/A N/A 100.0 495 30.5 1.2 N/A 0.6 0.9
SISCO 13.90 4.1 4.1 -6.4 16.85 - 8.75 2,636 36,845 1.04 0.0 N/A N/A 83.1 945 6.9 1.3 N/A 0.0 0.1
Assir 15.25 -0.7 -0.7 0.3 19.00 - 9.80 393 6,003 1.13 4.9 24.3 0.63 50.1 1,927 1.1 0.8 N/A 2.3 3.3
Al Baha 18.15 -1.1 -1.1 0.8 24.35 - 10.50 1,161 21,308 1.05 0.0 N/A N/A 100.0 272 N/A 2.7 N/A -4.5 -5.6
Kingdom 7.45 -1.3 -1.3 58.5 7.85 - 3.45 14,418 107,492 0.81 0.0 N/A N/A 5.0 46,935 10.9 1.9 N/A 0.8 1.6
BCI 31.20 -0.6 -0.6 3.3 33.92 - 16.80 84 2,634 0.90 4.8 14.6 2.13 78.6 858 1.7 2.4 11.4 10.1 16.7
MAADEN 16.70 -1.2 -1.2 -3.5 19.85 - 10.45 2,711 45,450 1.35 0.0 38.3 0.44 36.1 15,448 24.3 0.9 55.1 1.4 2.4
Astra Indust 35.70 2.3 2.3 1.1 39.00 - 18.30 375 13,251 1.07 1.4 12.9 2.76 31.1 2,646 2.6 1.7 13.0 9.9 11.8
Pharmaceutical 30.50 0.3 0.3 1.3 34.36 - 18.99 73 2,206 0.99 3.8 15.5 1.97 65.0 2,392 2.5 1.1 11.2 5.7 7.0
Glass 29.70 -0.7 -0.7 -2.6 36.70 - 24.90 102 3,036 1.02 5.1 16.3 1.82 76.6 743 6.1 1.6 13.5 8.9 10.0
FIPCO 35.50 0.3 0.3 -14.9 45.70 - 19.37 441 15,718 1.03 0.8 20.6 1.72 85.3 408 3.0 3.2 10.6 11.9 15.7
Maadaniyah 23.20 -0.4 -0.4 -8.3 32.40 - 17.52 97 2,261 1.05 1.7 38.2 0.61 64.5 593 1.9 1.7 N/A 3.2 4.5
Saudi Chemical 40.60 0.7 0.7 -1.9 43.80 - 20.00 236 9,548 0.94 0.0 8.5 4.75 97.0 2,568 1.6 2.1 8.6 12.7 24.3
SPM 51.50 0.5 0.5 -4.6 62.25 - 43.00 137 7,010 0.92 1.9 16.4 3.13 49.9 1,545 2.8 3.0 12.6 6.9 18.4
AlAbdullatif 41.00 0.0 0.0 -1.0 51.00 - 35.50 14 589 0.04 2.9 19.7 2.08 30.0 3,331 3.3 2.4 13.1 10.6 12.2
Saudi Export 33.20 0.0 0.0 -8.5 56.00 - 23.50 92 3,052 1.11 3.0 N/A N/A 100.0 359 3.5 3.5 N/A -4.3 -5.4
MMG 21.50 0.2 0.2 -10.4 36.24 - 21.35 507 10,888 0.79 3.7 66.7 0.32 46.2 2,688 1.2 1.5 8.0 1.3 2.2
SSP 32.10 -0.6 -0.6 -5.9 36.70 - 10.00 590 18,964 0.97 6.2 14.5 2.21 31.4 1,637 3.0 1.8 N/A 10.8 11.8
Source: Tadawul Stock Exchange, Official Website
8/6/2019 DMR 020210 English
http://slidepdf.com/reader/full/dmr-020210-english 14/16
14
Saudi Stock Market Report2 Feb 2010
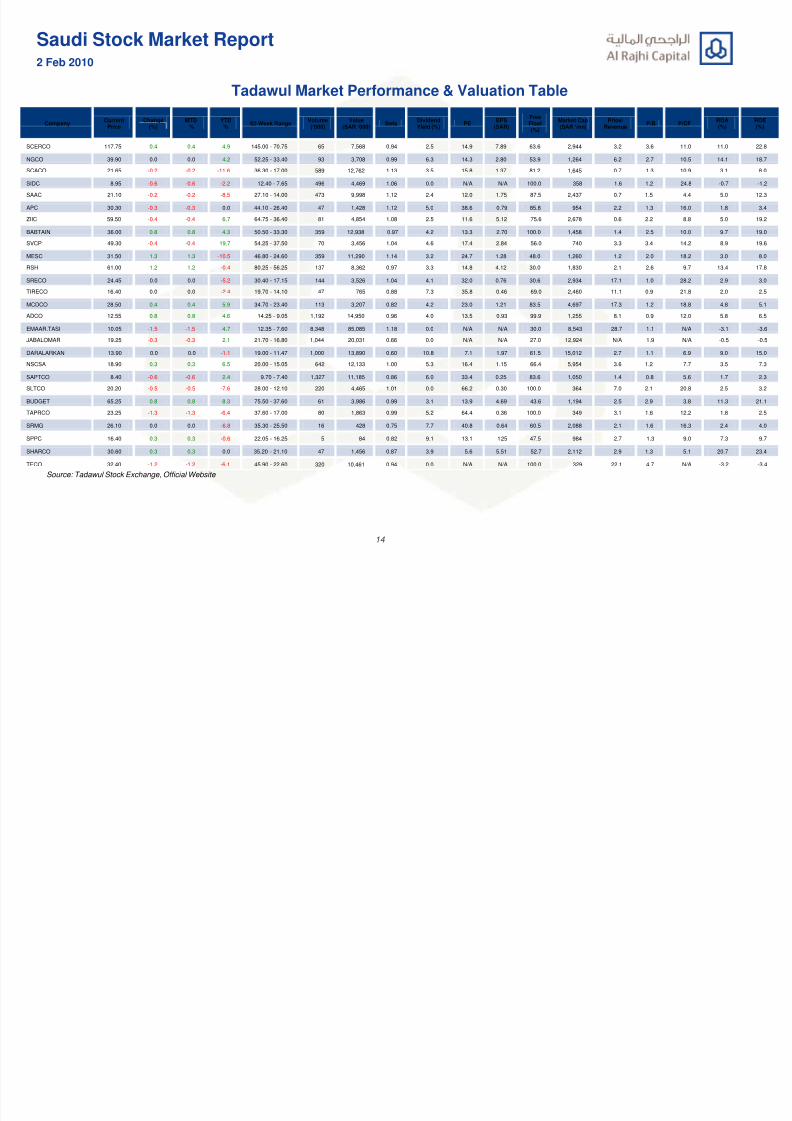
Tadawul Market Performance & Valuation Table
CompanyCurrent
PriceChange
(%)MTD
%YTD
%52-Week Range
Volume(‘000)
Value(SAR ‘000)
BetaDividendYield (%)
PEEPS
(SAR)
FreeFloat(%)
Market Cap(SAR ‘mn)
Price/Revenue
P/B P/CFROA(%)
ROE(%)
SCERCO 117.75 0.4 0.4 4.9 145.00 - 70.75 65 7,568 0.94 2.5 14.9 7.89 63.6 2,944 3.2 3.6 11.0 11.0 22.8
NGCO 39.90 0.0 0.0 4.2 52.25 - 33.40 93 3,708 0.99 6.3 14.3 2.80 53.9 1,264 6.2 2.7 10.5 14.1 18.7
SCACO 21.65 -0.2 -0.2 -11.6 36.30 - 17.00 589 12,762 1.13 3.5 15.8 1.37 81.2 1,645 0.7 1.3 10.9 3.1 8.0
SIDC 8.95 -0.6 -0.6 -2.2 12.40 - 7.65 496 4,469 1.06 0.0 N/A N/A 100.0 358 1.6 1.2 24.8 -0.7 -1.2
SAAC 21.10 -0.2 -0.2 -8.5 27.10 - 14.00 473 9,998 1.12 2.4 12.0 1.75 87.5 2,437 0.7 1.5 4.4 5.0 12.3
APC 30.30 -0.3 -0.3 0.0 44.10 - 26.40 47 1,428 1.12 5.0 38.6 0.79 85.8 954 2.2 1.3 16.0 1.8 3.4
ZIIC 59.50 -0.4 -0.4 6.7 64.75 - 36.40 81 4,854 1.08 2.5 11.6 5.12 75.6 2,678 0.6 2.2 8.8 5.0 19.2
BABTAIN 36.00 0.8 0.8 4.3 50.50 - 33.30 359 12,938 0.97 4.2 13.3 2.70 100.0 1,458 1.4 2.5 10.0 9.7 19.0
SVCP 49.30 -0.4 -0.4 19.7 54.25 - 37.50 70 3,456 1.04 4.6 17.4 2.84 56.0 740 3.3 3.4 14.2 8.9 19.6
MESC 31.50 1.3 1.3 -10.5 46.80 - 24.60 359 11,290 1.14 3.2 24.7 1.28 48.0 1,260 1.2 2.0 18.2 3.0 8.0
RSH 61.00 1.2 1.2 -0.4 80.25 - 56.25 137 8,362 0.97 3.3 14.8 4.12 30.0 1,830 2.1 2.6 9.7 13.4 17.8
SRECO 24.45 0.0 0.0 -5.2 30.40 - 17.15 144 3,526 1.04 4.1 32.0 0.76 30.6 2,934 17.1 1.0 28.2 2.9 3.0
TIRECO 16.40 0.0 0.0 -2.4 19.70 - 14.10 47 765 0.88 7.3 35.8 0.46 69.0 2,460 11.1 0.9 21.8 2.0 2.5
MCDCO 28.50 0.4 0.4 5.9 34.70 - 23.40 113 3,207 0.82 4.2 23.0 1.21 83.5 4,697 17.3 1.2 18.8 4.8 5.1
ADCO 12.55 0.8 0.8 4.6 14.25 - 9.05 1,192 14,950 0.96 4.0 13.5 0.93 99.9 1,255 8.1 0.9 12.0 5.8 6.5
EMAAR.TASI 10.05 -1.5 -1.5 4.7 12.35 - 7.60 8,348 85,085 1.18 0.0 N/A N/A 30.0 8,543 28.7 1.1 N/A -3.1 -3.6
JABALOMAR 19.25 -0.3 -0.3 2.1 21.70 - 16.80 1,044 20,031 0.66 0.0 N/A N/A 27.0 12,924 N/A 1.9 N/A -0.5 -0.5
DARALARKAN 13.90 0.0 0.0 -1.1 19.00 - 11.47 1,000 13,890 0.60 10.8 7.1 1.97 61.5 15,012 2.7 1.1 6.9 9.0 15.0
NSCSA 18.90 0.3 0.3 6.5 20.00 - 15.05 642 12,133 1.00 5.3 16.4 1.15 66.4 5,954 3.6 1.2 7.7 3.5 7.3
SAPTCO 8.40 -0.6 -0.6 2.4 9.70 - 7.40 1,327 11,185 0.86 6.0 33.4 0.25 83.6 1,050 1.4 0.8 5.6 1.7 2.3
SLTCO 20.20 -0.5 -0.5 -7.6 28.00 - 12.10 220 4,465 1.01 0.0 66.2 0.30 100.0 364 7.0 2.1 20.8 2.5 3.2
BUDGET 65.25 0.8 0.8 8.3 75.50 - 37.60 61 3,986 0.99 3.1 13.9 4.69 43.6 1,194 2.5 2.9 3.8 11.3 21.1
TAPRCO 23.25 -1.3 -1.3 -6.4 37.60 - 17.00 80 1,863 0.99 5.2 64.4 0.36 100.0 349 3.1 1.6 12.2 1.8 2.5
SRMG 26.10 0.0 0.0 -6.8 35.30 - 25.50 16 428 0.75 7.7 40.8 0.64 60.5 2,088 2.1 1.6 16.3 2.4 4.0
SPPC 16.40 0.3 0.3 -0.6 22.05 - 16.25 5 84 0.82 9.1 13.1 1.25 47.5 984 2.7 1.3 9.0 7.3 9.7
SHARCO 30.60 0.3 0.3 0.0 35.20 - 21.10 47 1,456 0.87 3.9 5.6 5.51 52.7 2,112 2.9 1.3 5.1 20.7 23.4
TECO 32.40 -1.2 -1.2 -6.1 45.90 - 22.60 320 10,461 0.94 0.0 N/A N/A 100.0 329 22.1 4.7 N/A -3.2 -3.4
Source: Tadawul Stock Exchange, Official Website
8/6/2019 DMR 020210 English
http://slidepdf.com/reader/full/dmr-020210-english 15/16
15
Saudi Stock Market Report2 Feb 2010
Definition - Technical Indicators
Candlestick Patterns, DOJI
DOJI is a form of candlestick pattern. It normally suggests major up and down movements. Trading above the DOJI is positive for the
market. Trading below the DOJI value indicates bearish momentum.
Hammer
A small body (white or black) near the high with a long lower shadow with little or no upper shadow. This indicates a bullish pattern
during a downtrend.
Inverse-black-hammer: a bottom reversal signal with confirmation the next trading day.
Moving Average, SMA (Simple Moving Average)
Normally we use the 10, 20, 50 and 125 day SMA to identify the trend. A cross-over of the short-term moving average with the long-
term moving average is positive for the market. The reverse is the case on the negative side.
DEMA - Double-smoothed Exponential Moving Average
We use the 10, 20 and 40 DEMA to identify a trend. A cross-over of the 10 and 20 DEMA gives a positive indication. A cross-over of
the 20 and 10 DEMA gives a negative indication. As long as a stock or index trades above the 40 DEMA, this gives a positive
indication for the stock or index. Trading below the 40 DEMA may create downside for a short time.
MACD - Moving Average Convergence and Divergence
The MACD has its own line period and another signal line; the dotted line indicates the signal line. When the MACD crosses the
signal line from below and trades above it, it gives a positive indication. The reverse is the situation for a bearish trend.
RSI - Relative Strength Index
When the RSI remains below 30, it indicates that a market or sttock is in oversold territory. When the RSI is above 70, it indicates
that the market/stock is in an overbought level.
Price ROC
When the Price ROC is above zero it gives positive signals for an index or stock. When the price ROC is below zero, it gives a
negative signal for the index or stock.
Stochastic Oscillators
When Stochastic Oscillators are below zero, the stock is in an oversold zone and some bounce back is expected. When Stochastic
Oscillators are above zero, the stock is in an overbought zone and some correction is expected.
Williams %R
When Williams %R is above zero, the stock is in an overbought zone and some correction is expected. When Williams %R is below
zero, the stock is in an oversold zone and some bounce back is expected.
CCI (Commodity Channel Index)
While the CCI was originally designed for commodities, the indicator also works very well with stocks and mutual funds.
There are two methods of interpreting the CCI:
1. Looking for divergences: A popular method of analyzing the CCI is to look for divergences in which the underlying security is
making new highs while the CCI is failing to surpass its previous highs. This classic divergence is usually followed by a correction in
the security's price.
2. As an overbought/oversold indicator
The CCI usually oscillates between +/-100. Readings outside these ranges imply an overbought/oversold condition.
Fibonacci Retracements
Fibonacci Retracements are based on a trend line that we draw between a significant trough and peak. If the trend line is rising, the
retracement lines will project downward; if the trend line is falling, the retracement lines will project upward. The number of Fibonacci
Retracement levels appearing on the chart depends on the range of the y-axis. If we want to see all nine retracement levels, we may
need to manually adjust the minimum and maximum values of the y-axis. Major Fibonacci Levels are 23.6%, 38.2%, 50%, 61.8%
and 100%.
8/6/2019 DMR 020210 English
http://slidepdf.com/reader/full/dmr-020210-english 16/16
Saudi Stock Market Report2 Feb 2010
Whipsaw
A whipsaw is a situation in which a share price heads in one direction, but then is followed quickly by a movement in the opposite
direction. The origin of the term is the push and pull action used by lumberjacks to cut wood with a type of saw of the same name. Gravestone Doji
In a Japanese Candle Stick chart, this is a doji candle where prices rallied but came back and closed at the level they started; the
open and close are equal.
Contact Us
Research Dept
Tel: +966 1 2119271
Fax: +966 1 2119368
Al Rajhi Capital
P.O. Box 5561 Riyadh 11432
Kingdom of Saudi Arabia
www.alrajhi-capital.com
Al Rajhi Capital is licensed by the Saudi Capital Market Authority #7068/37
Disclaimer
Information and views expressed in this report are subject to change without notice. While proper care has been taken in the
preparation of this report, we do not represent that the information contained herein is accurate, complete or free of any
errors. As such, Al Rajhi Bank or its employees can not be held liable for any losses arising from the use of this document.
This report is prepared for your information from the sources believed to be reliable and is not an offer to buy or sell
security or enter into any agreement. Al Rajhi Bank, its affiliates, subsidiaries and employees may have a position in the
financial instruments mentioned in this report. This document or its content is not to be distributed in jurisdictions outside
the Kingdom of Saudi Arabia where its distribution is restricted by law.