faculty paper series - agecon search
TRANSCRIPT

Faculty Paper Series
Faculty Paper 98-16 July 1998
Testing for Monopsony Power in Multiple Input Markets: A Nonparametric Approach with Application to Cigarette
Manufacturing
byKellie C. Raper
andH. Alan Love
Department of Agricultural EconomicsTexas A&M University
College Station, TX 77843-2124
TESTING FOR MONOPSONY POWER IN MULTIPLE INPUT MARKETS: A NONPARAMETRIC APPROACH WITH APPLICATION TO CIGARETTE
MANUFACTURING
byKellie Curry Raper
andH. Alan Love
Abstract
Monopsony power by cigarette manufacturers in procuring domestic and imported
tobacco is investigated using a nonparametric method previously developed by Love and
Shumway. Their test is extended to assess monopsony market power in multiple input
markets. Results indicate that cigarette manufacturers exert significant monopsony power in
the domestic tobacco market and exert little monopsony power in the international tobacco
market.
Keywords: market power, tobacco, nonparametric, monopsony.
JEL Classification: L1.
________
Kellie Curry Raper is an assistant professor of resource economics at the University ofMassachusetts. H. Alan Love is associate professor of agricultural economics at Texas A&MUniversity. The authors wish to thank George Davis for the use of his data set and DianaBurton and Mike Wohlgenant for helpful comments.

1
TESTING FOR MONOPSONY POWER IN MULTIPLE INPUT MARKETS: A NONPARAMETRIC APPROACH WITH APPLICATION TO CIGARETTE
MANUFACTURING
The cigarette manufacturing industry has long been touted as an example of an
imperfectly competitive industry. Given the high level of concentration that exists in this
industry, monopoly power exertion by cigarette manufacturers is certainly plausible. In
1992, the industry contained only eight firms with the four largest firms supplying ninety-
three percent of cigarette production (Census of Manufacturers). These concentration
measures, coupled with characteristics of tobacco supply, also support the possibility of
cigarette manufacturers exerting monopsony power in procuring domestic tobacco. In
1995, U.S. tobacco growers produced 1,268 million pounds of tobacco, 933 million
pounds of which was sold domestically for the production of cigarettes (USDA). While
there were over 350,000 tobacco quota owners in 1993 (USDA-ASCS), each has access to
a very limited number of buyers for the product. Tobacco is also a highly specialized crop,
in both production and use. According to Rogers and Sexton (1994), "...the relevant
markets for raw agricultural products will typically be narrower with respect to both
product class and geography than the markets for the finished products they produce”(p.
1143). The relatively inelastic supply of tobacco, due to the U.S. farm program supply
restrictions, and high buyer concentration suggest the potential for monopsony market
power exertion by cigarette manufacturers in the domestic market. The U.S. is also a
relatively large buyer in the world tobacco market. In 1993, the U.S. purchased 21 percent

2
of tobacco leaves sold on the world market (FAO), suggesting potential for monopsony
power exertion in the international market as well. The recent inquiry of the Department of
Justice (DOJ) into possible collusion by cigarette manufacturers in procuring imported
tobacco makes this an appealing analysis as well.
In this study, we extend Love and Shumway’s nonparametric monopsony power
test to consider monopsony power in two input markets. The test is implemented using
cigarette manufacturing industry data. Previous studies have considered monopoly power
exertion by tobacco processors (Ashenfelter and Sullivan; Sullivan 1985; Sumner 1981),
but cigarette manufacturers’ potential monopsony power in procuring tobacco from
domestic and international growers has received little attention1. While two-digit SIC level
manufacturing data has been used to examine market power in the industry (e.g., Roeger
1995; Hall 1988), we conduct our analysis using more specific four-digit SIC code data.
We incorporate costs of labor, advertising, capital, and materials.
This paper is organized as follows. We present a brief discussion of the U.S.
tobacco program as a potential vehicle for monopsony market power exertion. Next, we
follow Love and Shumway in developing the nonparametric test for monopsony market
power exertion in a single input market. We extend their test to assess monopsony market
power exertion in multiple input markets. We implement both tests to analyze cigarette
manufacturers’ potential monopsony power exertion in the domestic and international
tobacco markets. Empirical results are followed by concluding remarks.

3
The U.S. Tobacco Program
It is generally assumed among economists that the U.S. tobacco program is
designed to transfer income from tobacco buyers to domestic tobacco producers by
allowing producers to reduce production to less than free market quantities, thus increasing
the market price (Brown and Martin 1996; Brown 1995; Babcock and Foster 1992;
Sumner and Wohlgenant 1985; Johnson and Norton 1983). However, this belief is
predicated on the untested assumption that buyers of unprocessed tobacco behave
competitively. Given the asymmetric numbers of buyers versus sellers, this assumption may
not be valid.
Tobacco program production restrictions are administered primarily through price
supports and marketing quotas. Such policy tools are distinct, but similar, for the major
types of tobacco produced in the United States. Price support levels for both flue-cured
and burley tobacco are calculated by adjusting the preceding year’s support level by a
weighted average of changes in production costs and changes in the 5-year moving average
of market prices.2 National marketing quota levels for both tobacco varieties are
determined annually as the sum of intended purchases announced by domestic cigarette
manufacturers, the average of tobacco exports for the three preceding years, and an
adjustment to maintain loan stocks at the specified reserve-stock level of 15 percent of
basic quota, but no less than a specified minimum stock level.3 Farmers, typically
organized through cooperatives, serve as facilitators of the marketing quota and as

4
suppliers of storage capacity for reserved stocks. Cooperatives purchase tobacco when the
bid price is less than one cent above the support.
Brown and Martin contend that “the inclusion of domestic purchase intentions and
the adjustment for cooperative inventories in the quota formula makes the national
marketing quota very responsive to downward shifts in demand for U.S. tobacco” (p.446).
Though it is not the program’s intent, inclusion of cigarette manufacturer’s domestic
purchase intentions and the adjustment for reserve inventories in the quota formula may
actually allow cigarette manufacturers to shift a portion of quota rent from producers to
themselves. In effect, the quota adjustment formula gives manufacturers a large degree of
control over tobacco producers’ annual production. Indeed, at times, cigarette
manufacturers have acted to “maintain” quota by purchasing excess stocks accumulated by
cooperatives which threatened to significantly decrease the marketing quota in subsequent
years. For example, the 1994 burley tobacco stock levels would have resulted in a forty
percent quota reduction for 1995. However, cigarette manufacturers agreed to purchase
enough of the excess stocks to avoid a quota reduction (Brown 1996a). A similar situation
occurred in the flue-cured market in 1995. In this view, the tobacco marketing quota
becomes a quantity controlling device used by cigarette manufacturers to extract
monopsony rent from growers. Furthermore, with support price tied to growers’
production cost and lagged price, the support price offers tobacco producers no real
protection from this possibility. Cigarette manufacturers apparently have both the motive
(profit maximization) and means (high concentration, marketing quota and pricing

5
formulas) to extract quota rents from tobacco growers through monopsony market power
exertion.
Nonparametric Market Power Tests
Existence of market power is measured as a deviation from marginal cost pricing.
In the case of monopsony power, this translates to an input price less than the value of
marginal product (VMP). Several recent studies have developed nonparametric tests to
assess market power exertion. Ashenfelter and Sullivan (1987) employ data search
methods to measure monopoly power while Love and Shumway (1994), and Lambert
(1994), develop nonparametric monopsony market power tests using a linear programming
framework. The latter two studies assess monopsony market power in only one input
market. Nonparametric market power tests employ a revealed preference approach
founded on the Weak Axiom of Profit Maximization (WAPM). For consistency with
competitive behavior, WAPM states that the observed input and output quantity choices at
output price p and input prices r must yield profit at least as great as any other quantity set
that could have been chosen (Varian, 1992). Nonparametric market power tests exploit the
idea that firms with market power maximize profits by restricting quantities in order to
exploit the slope of output demand curves or input supply curves and that, at observed
prices, there is no other quantity choice that will yield a higher profit. Market power
exertion will be evident from the quantity choices made in each period. Nonparametric
tests offer alternatives to parametric tests of market power in that they circumvent the issue
of functional form choice for behavioral equations (Varian 1984, 1985, 1990).
6
)Bi ' p)yi & En&1
m'1rm)xmi & rn)xni & xni)rn # 0(3)
Additionally, data requirements are less for nonparametric market power tests than for
parametric tests because supply or demand relationships on the opposite side of the market
need not be specified.
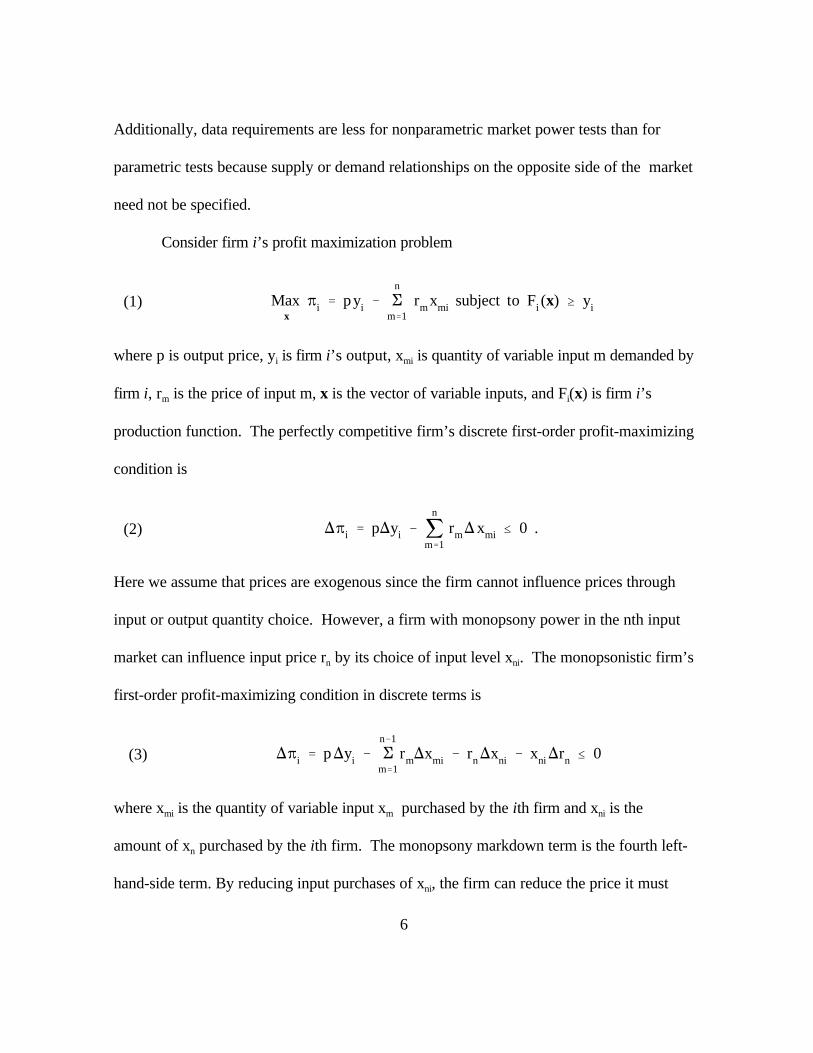
Consider firm i’s profit maximization problem
Max
xBi ' pyi & E
n
m'1rm xmi subject to Fi (x) $ yi(1)
where p is output price, yi is firm i’s output, xmi is quantity of variable input m demanded by
firm i, rm is the price of input m, x is the vector of variable inputs, and Fi(x) is firm i’s
production function. The perfectly competitive firm’s discrete first-order profit-maximizing
condition is
)Bi ' p)yi & jn
m'1
rm)xmi # 0 .(2)
Here we assume that prices are exogenous since the firm cannot influence prices through
input or output quantity choice. However, a firm with monopsony power in the nth input
market can influence input price rn by its choice of input level xni. The monopsonistic firm’s
first-order profit-maximizing condition in discrete terms is
where xmi is the quantity of variable input xm purchased by the ith firm and xni is the
amount of xn purchased by the ith firm. The monopsony markdown term is the fourth left-
hand-side term. By reducing input purchases of xni, the firm can reduce the price it must

7
pay for every unit purchased. Tests for market power exertion are based on determining
the empirical importance of the monopsony markdown term.
Market Power in a Single Input
Recent nonparametric market power tests have incorporated measures of other
variables which, if not accounted for, could distort market power measurements (Lambert;
Love and Shumway). Love and Shumway's inclusion of technical change measures is
based on previous tests for profit maximization under perfect competition by Chavas and
Cox (1988, 1990, 1992) and Cox and Chavas (1990). To incorporate technical change
measures, consider the primal profit maximization problem presented in equation (1).
Redefine Fi(x)$yi as Fi(x)$Yi(yi,A) where Yi denotes “effective output” and A>0 is a vector
of technology indices (Cox and Chavas). Fi(x) is assumed to be strictly increasing and
concave in x and Yi is assumed to be strictly increasing in yi. The firm’s profit
maximization problem when technical change measures are included becomes
Maxx
Bi ' pyi(Yi,A) & En
m'1rm xmi subject to Fi (x) $ Yi (yi,A)(4)
where yi(Yi, A) is the inverse function of Yi(y i, A). Assuming the firm chooses quantities
(x, yi) over T time periods where each time period is characterized by input prices rt, output
price pt, and technology At, it is possible to check the consistency of the decision set, Si
={x1, yi 1; x2, yi
2; ... xT, yiT} with the profit maximization hypothesis while considering the
degree of market power exertion.

8
Since a firm with monopsony power in an input market, xn, can influence input price
rn by its choice of input level , the resulting first-order profit-maximizing condition inxni
discrete terms is
p t [(yi(Yt
i , A t)& (yi(Ys
i ,A s))]& En
m'1r t
m (x tmi&x s
mi)& r sn 0
tsi (x t
ni&x sni) $ 0(5)
where )x is approximated as xt - xs, )y is approximated as yt - ys, and
This equation simply restates WAPM in terms of the0tsi ' [(r t
n & r sn ) / (x t
ni&x sni)] (x s
ni / r sn ) .
quantity choice at time t, i.e., at observed prices in time t, the observed quantity at time t
yields at least as much profit as any other quantity choice and, after appropriate
substitutions and cancellations, is identical to equation (3). The price flexibility of the ith
firm’s perceived residual supply curve, 0its, can also be written as 0ts
i ' (VMP tsni& r t
n) / r tn ,
where VMPnits is the marginal value product of the nth input for the ith firm for the time
interval ts (Love and Shumway). Thus, 0its gives a direct measure of the monopsony
Lerner index. If 0its = 0, then firm i cannot impact input price by adjusting quantity
purchased in period t, i.e. the firm has no market power. Equation (5) gives the necessary
and sufficient conditions for the firm’s decision set Si to be consistent with profit
maximization (See proposition 1 in Chavas and Cox, 1990).
Empirical implementation of the market power test requires an assumption about
the form of technical change. Chavas and Cox (1990) provide a thorough discussion of
technical change hypotheses which make the problem empirically tractable without

9
imposing a parametric model of technology. We assume the output translating case which
presumes Hicks-neutral technical change. Output translating technical change leaves the
marginal rate of substitution between inputs unchanged. It is operationalized by defining
Yi(yi ,A)=fi(yi, a+, a-) where a+ denotes positive technical change and a- denotes negative
technical change. Assuming output translating technical change gives )y = yit - at+ + at- - yi
s
+ as+ - as-.
The inequality in (5) involves variables which are not directly observable.
Therefore, the market power test consists of finding whether values exist for a+, a-, and mits
which satisfy the inequality. Since (5) is linear in the unobserved variables, we can define z
as the vector of unobserved variables, i.e. a+, a-, and mits, and rewrite (5) as d’z$c using
appropriate definitions of the matrix d and vector c (Cox and Chavas, 1990). The market
power test can now be implemented as the linear programming problem
minz
{b ))z: d ))z$c, z$0} .(6)
Since shifts in input supply unmatched by shifts in input demand will cause input price and
quantity to move in opposite directions between observations, deleting comparisons where
)rn does not have the same sign as )xni can reduce the possibility of biased market power
estimates (Love and Shumway). Such movements are clearly not attributable to market
power exertion. In practice, comparisons between time periods are deleted when )rn )xni,s…
where means “not the same sign as”, to omit supply shifts without corresponding demands…
shifts. The constraints in (6) are implemented over the time periods where s…t.

10
p t [(yi(Yt
i , A t)& (yi(Ys
i ,A s))]& En
m'1r t
m (x tmi&x s
mi)
& r sn&10
tsn&1, i(x
tn&1, i&x s
n&1,i)& r sn 0
tsni(x
tni&x s
ni) $ 0(8)
Market Power in Multiple Input Markets
The nonparametric approach to estimating market power exertion is easily extended
to measure monopsony market power in multiple input markets. Following (5), the first-
order profit maximizing condition for firm i with potential monopsony market power in
multiple input markets, n-f+1 through n, can be written generally as
p t [(yi(Yt
i , A t)& (yi(Ys
i ,A s))]& En
m'1r t
m (x tmi&x s
mi)
& En
v'n&f%1r s
vi0tsvi (x
tvi&x s
vi) $ 0(7)
where f is the number of input markets where the firm potentially exerts monopsony power
and 0vits is the respective price flexibility of firm i’s residual supply curve for input v. More
specifically, the first-order profit maximizing condition for firm i with market power in two
inputs, xn and xn-1 , is
where rn-1 is the price of input xn-1. The price flexibilities of the ith firm’s perceived residual
supply curves for xn-1 and xn are represented by 0tsn-1,i and 0ni
ts, respectively. As in the
single input case, 0tsn-1,i and 0ni
ts are direct measures of the monopsony Lerner index for the
respective inputs. Equation (8) replaces (5) as the necessary and sufficient condition for
the firm’s decision set Si to be consistent with profit maximization as represented by

11
WAPM where monopsony power is presumed in two input markets. Again, using
appropriate definitions of the matrix d and vector c and now rewriting (8) as d’z$c, we
implement the test as the linear programming problem represented in (6). We delete
comparisons between time periods when )rn-1 )xn-1,i and )rn )xni, and search over s…t. s…
s…
Data
The test must be implemented using time series data for output price and quantity
and for input prices and quantities. We implement the test using annual 1977 to 1993 price
and quantity data for outputs and inputs from the U.S. cigarette manufacturing industry.
Aggregate domestic cigarette production and price are used as measures of output quantity
and price. Input prices and quantities are included for domestic tobacco purchases,
imported tobacco, labor, materials other than tobacco, capital, and advertising. A complete
listing of variable names and definitions is included in Table 1. All indices are constructed
using 1982 as the base year. Variable names used in application are listed in parentheses.
Four types of cigarettes and their prices are used in calculating a Divisia price index
for domestic cigarette price: standard cigarettes (70 mm nonfilter), filter tip cigarettes (80
mm), king (85 mm nonfiltered and filtered) and extra long (100 mm filter tip). Price and
quantity data, along with excise tax data, for these cigarette types are taken from USDA
Tobacco Situation and Outlook (TSO). The annual prices for each type are calculated by
weighting corresponding wholesale cigarette price revisions by the fraction of the year that
the price was in effect and then subtracting the effective excise tax to reflect the final price
received by cigarette manufacturers. The resulting price index for domestic cigarette price

12
(py) is then constructed net of excise tax. Domestic cigarette production (y) is calculated
as the total value of cigarettes (net of excise tax) divided by the price index py.
Domestic tobacco price and quantity data are taken from various issues of TSO and
consist of estimated leaf tobacco used in domestic cigarette production and annual average
prices received by growers for unstemmed flue-cured, unstemmed burley, and unstemmed
Maryland tobacco. These varieties are chosen because they represent the principal types of
leaf tobacco used in domestic cigarette production. A Divisia price index for domestic
tobacco (rus) is constructed. Domestic tobacco quantity (xus) is constructed as the total
value of these three tobacco varieties used in domestic cigarette production divided by rus.
The source for imported tobacco data is the Department of Commerce’s U.S.
Imports for Consumption and General Imports: FT246 and FT247. The category of
tobacco used in cigarette production is called cigarette leaf tobacco and includes five types
of tobacco: unstemmed Oriental, unstemmed flue-cured, unstemmed burley, stemmed
tobacco except cigar leaf and scrap tobacco except cigar leaf. Price and quantity
information for these categories is used to create a Divisia price index for imported tobacco
(ri). Quantity of imported tobacco (xi) is calculated as total value of imports for these five
categories divided by ri.
Residual materials cost is calculated by subtracting the cost of domestic and
imported tobacco from cost of materials as reported in the Annual Survey of
Manufacturers, various issues. The price index of other materials is proxied by the
producer price index for materials as reported in the Economic Report of the President. A

13
quantity index for other materials (xm) is constructed by dividing the residual materials cost
by the producer price index for materials (rm).
Data on advertising expenditures for cigarette manufacturers are taken from TSO.
A quantity index for advertising (xa) is obtained by dividing the cigarette industry’s
reported annual expenditures on advertising by the cost per thousand advertising price
index for magazines. The price index for magazines is chosen as a proxy for cost per unit
of advertising (ra) since magazine advertisements represent a major portion of advertising
expenditures for cigarette manufacturers. This index is constructed from indices reported
in USDA’s Food Marketing Review, 1992-1993 and various issues of Advertising Age.
Data regarding the cost of labor and the number of employees in cigarette
manufacturing are taken from the Annual Survey of Manufacturers. Total compensation is
divided by the number of employees to calculate average annual compensation per
employee. This measure is then normalized to the base year of 1982. The resulting price
index for labor (rL) is used to obtain the quantity of labor (xL) via total compensation
divided by rL.
Capital price is calculated as the annual cost per unit of capacity where total
capacity is the proxy for quantity of capital. Total capacity is recovered by dividing actual
cigarette production by the capacity utilization rate as reported in Annual Survey of
Manufacturers. Annual total cost of capital is calculated assuming a 10 year depreciation
rate of new capital expenditures (also from Annual Survey of Manufacturers) with no
salvage value. A 5 year moving-average of Moody’s Aaa corporate bond rate from the

14
Economic Report of the President is used to estimate annual interest costs. Total annual
capital service cost is the sum of depreciation charges and interest charges. Dividing total
capital services cost by total capacity gives capital price per unit of capacity. Capital price
per unit of capacity is normalized to the base year of 1982 and the resulting index is used to
represent annual cost per unit of capacity (rc). Quantity of capacity (xc) is constructed as
total capital service cost divided by rc.
Results
Specific programming problems as defined in equations (5) and (7) for the cigarette
manufacturing industry are reported in Table 2. Test results for cases where monopsony
power is allowed in the domestic tobacco market (single input case) and where monopsony
power is allowed in both the domestic tobacco market and international tobacco market
(two input case) are presented in Table 3. In general, the results indicate that cigarette
manufacturers exert economically significant monopsony market power in the domestic
tobacco market. Average estimated monopsony Lerner indices for domestic tobacco in
both the single input case and the two input case indicate substantial departures from
competitive pricing by cigarette manufacturers. For the single input case with equal
weights of one on market power and technical change in the linear programming problem,
0us=2.02.4 Such a measure indicates that cigarette manufacturers internally value domestic
tobacco at 202 percent of the price paid to growers. Market power estimates are obtained
under various weighting schemes for bt+, bt-, custs, and ci
ts within the linear programming
problem for the two input case. The highest estimate of the monopsony Lerner index for

15
domestic tobacco is 0us =2.33. This Lerner index value occurs under several weighting
schemes, including when technical change is weighted 25 times more heavily than market
power and when market power is weighted five times more heavily than technical change.
A Lerner index value of 2.33 suggests that manufacturers internally value tobacco 233
percent higher than the price they actually pay growers.4 Even when market power weights
are assigned values 100 times greater than technical change weights, the Lerner index of
monopsony power is estimated as 0us =0.35.
Market power test results from the two input case suggest that U.S. cigarette
manufacturers’ monopsony market power in the tobacco import market is inconsequential.
The average monopsony Lerner index for the international tobacco market, 0i, is estimated
at 0.08 under almost all weighting schemes. The lone exception is 0i=0.04 when market
power is weighted 100 times greater than technical change within the linear programming
problem. Analogous to the domestic Lerner index measure, 0i=0.08 suggests that cigarette
manufacturers internally value imported tobacco at 8 percent above the price they pay on
the international market.
Monopsony Lerner index estimates for domestic tobacco and imported tobacco by
period (assuming equal weights of one) are reported in Table 4. Blank cells indicate no
detected market power exertion during that period. Period by period results are consistent
in supporting economically significant monopsony market power in the domestic tobacco
market and negligible monopsony market power by U.S. cigarette manufacturers in the
international tobacco market. In the case of domestic tobacco purchases, results indicate

16
that cigarette manufacturers exerted economically significant monopsony market power in
almost all periods prior to 1987. However, in 1987 and following years, no monopsony
market power is detected by the test. The lack of market power exertion for the later
period in the sample may be partially attributed to the Tobacco Improvement Act of 1985
which reduced price supports and quota formulas in an effort to generate more market-
oriented price and production levels. The Act also required domestic manufacturers to
purchase existing loan stocks. It is possible that these revisions lessened the capability of
domestic manufacturers to exert monopsony market power in procuring domestically
grown tobacco. Period by period measures for purchases of imported tobacco indicate that
in most years, no market power exertion is detected. However, monopsony market power
is detected in two of the most recent three years of the sample, perhaps lending support to
the DOJ’s recent inquiry into the presence of price fixing by cigarette manufacturers in the
purchase of imported tobacco.
The implications of monopsony market power exertion in the domestic market may
be illustrated using information regarding cigarette manufacturers’ cost per pack of
cigarettes (Table 5). Over the period sample, the average cost of domestic tobacco in a
pack of cigarettes is $0.04 while 0us=2.33. Recall that 0=(VMP-r)/r where r is input price.
Using rus=$0.04 to represent domestic tobacco price on a cost per pack basis, the previous
equation can be solved for VMP, i.e. the internal value of that tobacco to the cigarette
manufacturer. In this case VMP=$0.13, indicating that cigarette manufacturers value the
domestically produced tobacco in a pack of cigarettes at $0.09 higher than the price they

17
actually pay to producers for that tobacco. A similar measure can be calculated on a per
pound basis using the average price per pound of domestic tobacco for the time period
( rGus). Since rGus=$0.876 and 0us=2.33, this implies that VMP per pound for cigarette
manufacturers is $2.92, i.e. $2.04 higher than the price per pound paid to producers.
Overall, the results are not surprising, given that the U.S. cigarette manufacturing
industry is characterized domestically as a few manufacturers purchasing tobacco from a
large number of growers and internationally as facing more competition among cigarette
manufacturers. Domestically, these results indicate that tobacco program rents resulting
from reduced output are being captured, at least in part, by U.S. cigarette manufacturers
rather than by tobacco producers who are typically assumed to receive program benefits.
Conclusions
Traditional market power analyses of the cigarette manufacturing industry have
considered monopoly power exertion by manufacturers in selling cigarettes to consumers.
The characteristics of the market relationship between U.S. cigarette manufacturers and
U.S. tobacco producers make it quite plausible that manufacturers exert monopsony
market power in procuring domestic tobacco. We investigate the possibility of monopsony
market power exertion by U.S. cigarette manufacturers in both the domestic and
international tobacco markets by extending Love and Shumway’s test to include potential
monopsony market power in multiple input markets. Tests for the single input and two
input cases are implemented using annual data from the cigarette manufacturing industry.
Results in the single input case indicate a substantial departure from competitive pricing by

18
cigarette manufacturers in the input market for domestic unprocessed tobacco. This result
is supported by the outcome in the two input case. The estimate of monopsony market
power exertion by cigarette manufacturers is relatively large and of similar magnitude as in
the single input case. Results suggest that U.S. cigarette manufacturers exert little, if any,
monopsony market power in the world tobacco market. However, the most recent years in
the study reveal that perhaps market power in the import market is increasing.
Additionally, the results suggest that the benefits of the U.S. tobacco program accrue
largely to cigarette manufacturers. Our analysis suggests that policy analyses that a priori
assume tobacco program benefits accrue to quota owners should be reconsidered.

19
REFERENCES
Advertising Age, various issues.
Ashenfelter, O. and D. Sullivan. "Nonparametric Tests of Market Structure: An
Application to the Cigarette Industry." Journal of Industrial Economics.
35(1987):483-99.
Babcock, B.A. and W.E. Foster. “Economic Rents under Supply Controls with
Marketable Quota.” American Journal of Agricultural Economics. 74(August
1992):630-637.
Brown, A.B. “Burley Tobacco Situation and Outlook.”
http://ipmwww.ncsu.edu/Production_Guides/Burley/1BUDGET.html. March,
1996.
Brown, A.B. “Flue-cured Tobacco Situation and Outlook.”
http://ipmwww.ncsu.edu/Production_Guides/Flue-cured/1BUDGET.html. March,
1996.
Brown, A.B. “Cigarette Taxes and Smoking Restrictions: Impacts and Policy
Implications.” American Journal of Agricultural Economics. 77(November
1995):946-951.
Brown, A.B. and L.L. Martin. “Price versus Quota Reductions: U.S. Flue-Cured Tobacco
Policy.” Journal of Agricultural and Applied Economics. 28(December 1996:445-
452.

20
Chavas, J.P., and T.L. Cox. "A Nonparametric Analysis of the Influence of Research on
Agricultural Productivity." American Journal of Agricultural Economics.
74(August 1992):583-591.
Chavas, J.P., and T.L. Cox. "A Nonparametric Analysis of Productivity: The Case of U.S.
and Japanese Manufacturing." American Economic Review. 80(June 1990):450-
464.
Chavas, J.P., and T.L. Cox. "A Nonparametric Analysis of Agricultural Technology."
American Journal of Agricultural Economics. 70(May 1988): 303-310
Cox, T.L. and J.P. Chavas. "A Nonparametric Analysis of Productivity: The Case of U.S.
Agriculture." European Review of Agricultural Economics. 17(1990):449-64.
FAO Trade Yearbook, Foreign Agriculture Organization of the United Nations. 1993.
Hall, R.E. “The Relation between Price and Marginal Cost in U.S. Industry.” Journal of
Political Economy. 96(October 1988):921-947.
Hamilton, J.L.. “Joint Oligopsony-Oligopoly in the U.S. Leaf Tobacco Market, 1924-
1939.” Review of Industrial Organization. 9(February 1994):25-39.
Johnson, P.R. and D.T. Norton. “Social Cost of the Tobacco Program Redux.” American
Journal of Agricultural Economics. 65(February 1983):117-119.
Lambert, D.K. "Technological Change in Meat- and Poultry-Packing and Processing."
Journal of Agricultural and Applied Economics. 26(December 1994):591-604.

21
Love, H.A. and C.R. Shumway. "Nonparametric Tests for Monopsonistic Market Power
Exertion." American Journal of Agricultural Economics. 76(December
1994):1156-1162.
Roeger, W. “Can Imperfect Competition Explain the Difference between Primal and Dual
Productivity Measures? Estimates for U.S. Manufacturing.” Journal of Political
Economy. 103(1995):316-330.
Rogers, R.T. and R.J. Sexton. “Assessing the Importance of Oligopsony Power in
Agricultural Markets.” American Journal of Agricultural Economics.
76(December 1994):1143-1150.
Sullivan, D. “Testing Hypotheses about Firm Behavior in the Cigarette Industry.” Journal
of Political Economy. 93(June 1985):586-598.
Sumner, D.A. “Measurement of Monopoly Behavior: An Application to the Cigarette
Industry.” Journal of Political Economy. 89(October 1981):1010-1019.
Sumner, D.A. and M.K. Wohlgenant. “Effects of an Increase in the Federal Excise Tax on
Cigarettes.” American Journal of Agricultural Economics 67(May 1985):235-242.
United States Bureau of the Census. Annual Survey of Manufacturers. Various Issues.
1977-1993.
United States Bureau of the Census. Census of Manufacturers. Various Issues.
United States Department of Agriculture. Food Marketing Review, 1992-1993. Economic
Research Service. AER 678. April 1994.

22
United States Department of Agriculture. Tobacco Situation and Outlook. Economic
Research Service. Various Issues. 1977-1993.
United States Department of Agriculture. “Tobacco Allotted by Counties and Kind.”
Agricultural Stabilization and Conservation Service. June, 1993.
United States Department of Commerce. U.S. Imports for Consumption and General
Imports FT246 and FT247, Annual 1977-1993.
United States President. Economic Report of the President. Washington, D.C.: U.S.
Government Printing, 1993.
Varian, H.R. Microeconomic Analysis. New York, NY: W.W. Norton & Company, Inc.,
1992.
Varian, H.R. “Goodness-of-Fit in Optimizing Models.” Journal of Econometrics.
46(1990):125-140.
Varian, H.R. "Nonparametric Analysis of Optimizing Behavior with Measurement Error."
Journal of Econometrics. 30(October 1985):445-458.
Varian, H.R. "The Nonparametric Approach to Production Analysis." Econometrica.
52(May 1984):579-97.

23
NOTES
1. Hamilton analyzes cigarette manufacturing data for the period 1924-1939 for joint
oligopoly-oligopsony power. His results suggest that cigarette manufacturers
practiced oligopolistic cigarette pricing during this period, but not oligopsony price
coordination.
2. Production cost changes are weighted by one third and price changes are weighted
by two thirds. See Tobacco Situation and Outlook, December 1996, for a
description of costs included in the production cost index.
3. The minimum reserve-stock levels for flue-cured and burley tobacco are 100 million
pounds and 50 million pounds, respectively.
4. 0us represents the average 0usts over all comparisons within the sample period and
where no shifts occurred.

Table 1. Variable Definitions for Empirical Equations.
Variable Definition
py Domestic wholesale price of cigarettes, net of excise tax (Divisia index)
y Domestic quantity of cigarettes produced (1000's)
rus Domestic price per lb. pd to producers (Divisia index)
xus Domestic tobacco purchased by cigarette manufacturers (lbs)
ri Price of tobacco imports (Divisia index)
xi Imported tobacco for cigarettes (lbs)
rL Average annual compensation of workers in cigarette manufacturers ($'s)
xL Annual # of workers employed by cigarette manufacturers
rm Price of materials other than tobacco (PPI for containers)
xm Materials other than tobacco
rc Price per Unit of Capacity
xc Total annual capacity
ra Price per unit of advertising (PPI for magazine advertising)
xa Quantity of Advertising per year

Table 2. Empirical Equation for Single Input Monopsony Market Power Test andTwo Input Monopsony Market Power Test.
TEST Equation DecisionVariables
SingleInput min
a t%, a t&, 0tsus
(b t%a t%%b t&a t& % ET
t'1ET
s…tc ts0ts
us)
subject to:
p ty [(y t&a t%%a t&)&(y s&a s%%a s&)]& r t
us(x tus&x s
us)&r ti (x t
i &x si )& r t
L (x tL&x s
L)
&r tm(x t
m&x sm)& r t
a (x ta &x s
a )& r tc (x t
c &x sc ) & r s
us0tsus (x t
us&x sus) $ 0 ,
œ s…t except when r tus & r s
uss… x t
us & x sus
0tsi $ 0, œ s…t
a t%i , a t&
i $ 0, œ t
0ts
at+
at-
TwoInput min
a t%, a t&, 0tsi , 0ts
us
(b t%a t%%b t&a t& % ET
t'1ET
s…tc ts
us0tsus % E
T
t'1ET
s…tc ts
i 0tsi )
subject to:
p ty [(y t&a t%%a t&)&(y s&a s%%a s&)]&r t
us (x tus&x s
us)& r ti (x t
i &x si )& r t
L (x tL&x s
L)
&r tm(x t
m&x sm)&r t
a (x ta &x s
a )&r tc (x t
c &x sc ) &r s
us0tsus(x t
us&x sus) & r s
i 0tsi (x t
i &x si ) $ 0 ,
œ s…t except when r tus & r s
uss… x t
us & x sus ¸ r t
i & r si
s… x t
i & x si
0tsus,0
tsi $ 0, œ s…t
a t%i , a t&
i $ 0, œ t
0tsus
0its
at+
at-

Table 3. Nonparametric Test Results under Various Weighting Schemes.
TechnicalChangeWeights(bt+, bt-)
MarketPower
Weight--Domestic
(custs )
MarketPower
Weight--Imported
(cits)
DomesticTobacco
ImportedTobacco
Positive TechnicalChange
Negative TechnicalChange
00us 00i at+ at-
1 1 na 2.02 na 67.21 40.42
1 1 1 2.33 0.08 18.18 0
1 5 5 2.33 0.08 18.18 0
1 25 25 1.40 0.08 44.63 21.76
1 100 100 0.35 0.04 145.99 80.31
5 1 1 2.33 0.08 18.18 0
5 25 25 2.33 0.08 18.18 0
5 100 100 1.76 0.08 18.18 21.76
25 1 1 2.33 0.08 18.18 0

Table 4. Monopsony Market Power Estimates (00) by Time Period for Domestic andImported Tobacco Purchases.a
Year Domestic Tobacco (00us) Imported Tobacco (00i)
1977 1.50
1978 2.32
1979 7.17
1980 3.74
1981 6.22
1982 2.19
1983
1984 2.62
1985 1.46
1986 5.50
1987
1988
1989
1990
1991 0.66
1992 0.37
1993
abt=, bt-, custs, and ci
ts are equal to one for this analysis.

Table 5. Average Cost per Cigarette Pack for U.S. Cigarette Manufacturers using Four-digit SIC data
Year Labor Advertising MaterialsDomesticTobacco
ImportedTobacco Capital
TotalCost Revenue
Before TaxProfit
1977 0.02 0.02 0.03 0.03 0.01 0.00 0.13 0.20 0.07
1978 0.02 0.03 0.04 0.04 0.01 0.00 0.14 0.22 0.08
1979 0.03 0.03 0.04 0.04 0.01 0.01 0.15 0.24 0.10
1980 0.03 0.03 0.05 0.04 0.01 0.01 0.18 0.27 0.10
1981 0.04 0.04 0.06 0.04 0.01 0.01 0.20 0.31 0.12
1982 0.04 0.05 0.07 0.04 0.01 0.01 0.22 0.37 0.15
1983 0.04 0.06 0.07 0.04 0.01 0.02 0.24 0.41 0.18
1984 0.05 0.06 0.08 0.04 0.02 0.02 0.26 0.45 0.20
1985 0.05 0.07 0.08 0.04 0.01 0.02 0.27 0.50 0.22
1986 0.04 0.07 0.08 0.03 0.02 0.02 0.27 0.55 0.28
1987 0.05 0.07 0.08 0.03 0.02 0.02 0.27 0.60 0.33
1988 0.05 0.09 0.08 0.04 0.02 0.02 0.29 0.68 0.39
1989 0.05 0.11 0.08 0.04 0.02 0.02 0.31 0.78 0.47
1990 0.05 0.11 0.08 0.04 0.02 0.02 0.32 0.88 0.56
1991 0.05 0.13 0.08 0.04 0.02 0.02 0.34 0.99 0.64
1992 0.05 0.15 0.06 0.04 0.04 0.02 0.35 1.11 0.76
1993 0.05 0.18 0.06 0.03 0.04 0.02 0.38 1.07 0.69
AVG 0.04 0.08 0.07 0.04 0.02 0.02 0.25 0.57 0.31

Faculty Papers are available for distribution without review by the Department ofAgricultural Economics.
All programs and information of the Texas A&M University System are availablewithout regard to race, ethnic, origin, religion, sex and age.