adjustment of wheat production - agecon search
TRANSCRIPT

ADJUSTMENT OF WHEAT PRODUCTION TO MARKET REFORM IN EGYPT
by
Mylène Kherallah, Nicholas Minot, Peter Gruhn
MSSD Discussion Paper No. 32
Markets and Structural Studies Division
International Food Policy Research Institute (IFPRI)2033 K Street, NW
Washington, DC 20006tel: (202) 862-5600 - fax: (202) 467-4439
October 1999
Contact: Diana FloresTel. (202) 862-5655 or Fax: (202) 467-4439
This paper is based on research completed under the Egypt Food SecurityProject conducted by IFPRI in collaboration with the Ministry of Agriculture andLand Reclamation and the Ministry of Trade and Supply in Egypt and funded byUSAID Grant No. 263-G-00-96-00030-00.

i
CONTENTS
CONTENTS . . . . . . . . . . . . . . . . . . . . . . . . . . . . . . . . . . . . . . . . . . . . . . . . . . . . i
ABSTRACT . . . . . . . . . . . . . . . . . . . . . . . . . . . . . . . . . . . . . . . . . . . . . . . . . . . . iv
1. INTRODUCTION AND OBJECTIVES . . . . . . . . . . . . . . . . . . . . . . . . . . . 1
2. SURVEY DESIGN . . . . . . . . . . . . . . . . . . . . . . . . . . . . . . . . . . . . . . . . . . 4
3. BASIC CHARACTERISTICS OF WHEAT PRODUCTION . . . . . . . . . . . 6
CHARACTERISTICS AND INCOME SOURCES OF WHEAT
FARMING HOUSEHOLDS . . . . . . . . . . . . . . . . . . . . . . . . . . . . . . 6
LAND USE AND CROP PRODUCTION . . . . . . . . . . . . . . . . . . . 10
INPUT USE . . . . . . . . . . . . . . . . . . . . . . . . . . . . . . . . . . . . . . . . . 15
COSTS AND RETURNS OF WHEAT PRODUCTION . . . . . . . . 24
WHEAT USAGE AND MARKETING . . . . . . . . . . . . . . . . . . . . . . 27
WHEAT CONSUMPTION PATTERNS . . . . . . . . . . . . . . . . . . . . 33
4. WHEAT SUPPLY RESPONSE . . . . . . . . . . . . . . . . . . . . . . . . . . . . . . . 37
5. CONCLUSIONS AND POLICY IMPLICATIONS . . . . . . . . . . . . . . . . . . 40
ENDNOTES . . . . . . . . . . . . . . . . . . . . . . . . . . . . . . . . . . . . . . . . . . . . . . . . . . . 44
REFERENCES . . . . . . . . . . . . . . . . . . . . . . . . . . . . . . . . . . . . . . . . . . . . . . . . . 46

ii
LIST OF TABLES
Table 1–Sources of income and income shares . . . . . . . . . . . . . . . . . . . . . . . . . 9
Table 2–Measures of the importance of each crop to wheat farmers . . . . . . . 12
Table 3–Average area, production, yield, value, and value per
hectare by crop . . . . . . . . . . . . . . . . . . . . . . . . . . . . . . . . . . . . . . . . . . . 13
Table 4–Characteristics of crop sales by crop . . . . . . . . . . . . . . . . . . . . . . . . . 14
Table 5–Percentage of farmers applying wheat seed by variety
and region . . . . . . . . . . . . . . . . . . . . . . . . . . . . . . . . . . . . . . . . . . . . . . . 17
Table 6–Fertilizer usage by type and region
(Percentage of wheat farmers) . . . . . . . . . . . . . . . . . . . . . . . . . . . . . . . 19
Table 7–Labor usage in wheat production by labor type and
total area category . . . . . . . . . . . . . . . . . . . . . . . . . . . . . . . . . . . . . . . . . 20
Table 8–Use and ownership of animals by type . . . . . . . . . . . . . . . . . . . . . . . . 21
Table 9–Revenue and costs of wheat production . . . . . . . . . . . . . . . . . . . . . . 25
Table 10–Revenue and costs of wheat production per unit of input
by farm size category . . . . . . . . . . . . . . . . . . . . . . . . . . . . . . . . . . . . . . . 27
Table 11–Average wheat usage in 1998 . . . . . . . . . . . . . . . . . . . . . . . . . . . . . 28
Table 12–Characteristics of wheat sale transactions by type of buyer . . . . . . 31
Table 13–Percentage of households that consume different grain products . . 34

iii
Table 14–Percentage of households that consume different grain
products by wealth category . . . . . . . . . . . . . . . . . . . . . . . . . . . . . . . . . 35
Table 15–Average annual consumption of different wheat products . . . . . . . . 35
Table 16–Elasticities of output supply and input demand with
respect to prices . . . . . . . . . . . . . . . . . . . . . . . . . . . . . . . . . . . . . . . . . . 38
LIST OF FIGURES
Figure 1–Wealth distribution by wealth quintiles . . . . . . . . . . . . . . . . . . . . . . . . 7
Figure 2–Farm size distribution by wealth quintiles . . . . . . . . . . . . . . . . . . . . . . 7
Figure 3–Geographical distribution of wealth . . . . . . . . . . . . . . . . . . . . . . . . . . . 8
Figure 4–Distribution of wheat farms by farm size . . . . . . . . . . . . . . . . . . . . . . 10
Figure 5–Distribution of wheat farms by value of crop sales . . . . . . . . . . . . . . 15
Figure 6–Percentage of wheat consumption and sales over total
harvest by farm size . . . . . . . . . . . . . . . . . . . . . . . . . . . . . . . . . . . . . . . . 29

iv
ABSTRACT
In response to slow growth in the agricultural sector and as part of a general shift
towards a more market-oriented economy, the Government of Egypt started
liberalizing the agricultural sector in 1987. Controls over wheat production and
marketing were eliminated and wheat producer prices were brought closer to
international levels. As a result, there has been remarkable increases in wheat
crop area and yields, causing wheat production to triple from 1986 to 1998. This
study analyzes the results of a survey of 800 Egyptian wheat farmers in order to
address three issues that are of interest to agricultural reform policy in Egypt.
First, what are the patterns in wheat production and marketing that have
emerged following the economic reforms? Second, why is the government
unable to purchase more than a small portion of national wheat production?
Third, how does wheat supply and input demand respond to wheat and input
prices?
The survey indicates that Egyptian wheat production is based on small-scale
farms, yet these farms are highly commercialized and the use of inputs such as
labor, fertilizer and irrigation, is intensive. The government has problems
v
reaching its wheat procurement target because most of the wheat produced is
consumed in the rural areas and farmers prefer to sell to traders because of
better prices and location. Econometric analysis of the survey data suggests
that wheat farmers respond significantly to crop and input prices. The estimated
own-price supply elasticity is 0.3, implying that the use of price policy alone to
pursue wheat self-sufficiency would be costly and ill-advised.
1
1. INTRODUCTION AND OBJECTIVES
Wheat is the most important staple crop produced in Egypt. It occupies about
32.6 percent of the total winter land area and is mostly used to make bread, a
very important component of the Egyptian diet. Average consumption of wheat
and wheat products is about 200 kilograms (kg) per capita per year, one of the
highest levels in the world.
Prior to 1987, the Government of Egypt (GOE) maintained tight control over the
production and marketing of wheat. Farmers were required to allocate 27.5
percent of their agricultural land to the production of wheat. They also had to sell
a specific quota of wheat to the government at a fixed price that was, in general,
much lower than international prices. During this period, wheat production
stagnated while consumption kept rising.
In response to the slow growth in the agricultural sector and as part of a general
shift towards a more market-oriented economy, the GOE started liberalizing the
agricultural sector in 1987. As a result of the reforms, wheat area restrictions,
quotas and fixed procurement prices were removed. Furthermore, a new more
liberal framework was established for the trading of wheat grain and flour and the

2
compulsory delivery program was replaced with an optional program. The
procurement price became a floor price and was announced prior to the planting
season. It was also brought closer to international prices.
The agricultural reforms initiated in 1987 had a dramatic impact on the wheat
sector. From 1986 to 1998, the wheat area doubled, yields increased by 50
percent, and wheat production more than tripled. These remarkable results are
attributed to several factors that were associated with the reform programs,
including higher relative wheat prices; the adoption of higher yielding seed
varieties that were also more resistant to heat, drought, and salinity; the
implementation of improved cultivation practices; and a more liberal policy
environment which allowed farmers to base their crop planting decisions on
market forces and provided them with a greater incentive to grow wheat. The
resulting rise in wheat production also led to a significant improvement in the
wheat self-sufficiency ratio from 21 percent in 1986 to 46 percent in 1998.
This study analyzes the results of a survey of 800 wheat farmers in order to
address three issues. First, what are the patterns in wheat production and
marketing that have emerged following the economic reforms? National
statistics document the growth in area and yield, but we hope to provide a more
detailed picture of the characteristics of wheat farmers, role of wheat in farmers’

3
crop rotations, patterns of input use, costs of production, and food consumption
patterns. Second, why is the government unable to purchase more than a small
portion of national wheat production? The government is particularly interested
in wheat usage and marketing patterns in order to explain why it has been
unable to increase procurement of wheat for the subsidized bread channel.
Third, how does wheat supply and input demand respond to wheat and input
prices? These parameters are necessary ingredients for informed analysis of
wheat policy in Egypt.
The remainder of this paper is organized as follows. The next section describes
the design of the wheat producers survey. Section 3 presents the characteristics
of the wheat production sector in Egypt based on the survey results. It is
followed by Section 4 which analyzes the supply response of farmers to policy
changes. The last section concludes the study with policy implications.

4
2. SURVEY DESIGN
In 1998, a survey of Egyptian wheat farmers was carried out by the International
Food Policy Research Institute (IFPRI) and the Ministry of Agriculture and Land
Reclamation (MALR) in Egypt, with financial support from the United States
Agency for International Development (USAID). The sample of the 1998 Egypt
Wheat Producer Survey (EWPS) was designed to be representative of farm
households growing wheat in the 1997-1998 season. It uses a four-stage
stratified random sample which relies, in part, on lists of wheat farming
households prepared by the MALR.
Because each wheat farmer in Egypt did not have an equal probability of being
selected for the sample, we need to apply weights in analyzing the data. The
weights (also called expansion factors) are the inverse of the probability of
selection. Thus, if wheat farmers in a region were under-represented in the
sample, the weights compensate for this by giving greater weight to these farms
in the calculation of national averages and percentages . 1

5
The survey used a 23-page pre-coded questionnaire covering the following
topics: household characteristics, crop production and sales, wheat usage,
wheat and bread consumption, use of labor and other inputs, ownership of
assets, credit, sources of income, and farmer perceptions.

6
3. BASIC CHARACTERISTICS OF WHEAT PRODUCTION
CHARACTERISTICS AND INCOME SOURCES OF WHEAT FARMING
HOUSEHOLDS
Analysis of the EWPS suggests that around 54 percent of household heads are2
literate, even though only 47 percent received any formal education. About 64
percent of wheat farmers consider farming as their main activity; other primary
activities include employment in the public and/or service sectors.
In Figures 1 and 2, average wealth and farm size are disaggregated by wealth
quintiles . We use the value of consumer durables as a measure of wealth and,3
thus, a proxy for the standard of living of the households. Average wealth
ranges from LE 173 for the poorer households to LE 18,226 for the wealthiest
ones. These figures indicate a highly concentrated distribution of wealth where
81 percent of all consumer durables are owned by 20 percent of the wheat farm
population. Figure 2 shows that farm size is positively associated with household
wealth. Figure 3 indicates that there are differences in wealth distribution by
geographical region. Average household wealth is significantly higher in Nubaria

Wealth Quintile
54321
Mea
n F
arm
Siz
e
5
4
3
2
1
0
7
and the Frontier regions compared to other regions . In the Nile valley regions,4
average wealth is higher in the Delta regions than in Middle and Upper Egypt.
Figure 1–Wealth distribution by wealth quintiles
Source: IFPRI 1998 EWPS data
Figure 2–Farm size distribution by wealth quintiles
Source: IFPRI 1998 EWPS data

Governorate Category
FrontierNubariaUpper EgyptMiddle EgyptWest DeltaEast Delta
16000
14000
12000
10000
8000
6000
4000
2000
0
8
Figure 3–Geographical distribution of wealth
Source: IFPRI 1998 EWPS data
The major sources of income for wheat farmers are crop sales and consumption
of home produced crops. As Table 1 indicates, 97 percent of wheat farm
households derive in-kind income from consumption of their own crops while 89
percent of the households receive income from crop sales. Income shares from
crop sales and crop home consumption are 30 and 25 percent respectively. Over
three-quarters of the wheat farmers had income from livestock activities, but they

9
account for just 20 percent of income. Wages from non-agricultural activities
provide 12 percent of total income.
Table 1–Sources of income and income shares
Income source Percent of households that Average income sharereceive this type of income
(percent of household) (percent of total income)Agricultural wage income 17 4 Other wage income 45 12
Non-farm self-employment15 4
Crop sales 89 30 Home cons of crops 97 25 Animal product sales 75 11 Animal product home cons. 83 9 Remittances 7 2 Transfers 18 2 Other 4 1 Total 100Source: IFPRI 1998 EWPS data
Virtually all wheat farm families (97 percent) own their house, and have electricity
(96 percent), but only 16 percent own a telephone. However, over 50 percent of
them do have access to a telephone. The average distance from the house to a
paved road and a bakery are 0.8 and 3.1 km, respectively.
LAND USE AND CROP PRODUCTION

10
The vast majority of Egyptian wheat farms are small, irrigated, and owner-
operated. The average farm size is 1.7 hectares (ha), but 50 percent cultivate
less than 1.0 ha (see Figure 4). The largest farms are found in Nubaria and the
Frontier, where the averages are over 2.5 hectares.
Figure 4–Distribution of wheat farms by farm size
Source: IFPRI 1998 EWPS data
Irrigation is almost universal in Egyptian agriculture, allowing the cultivation of
summer and winter crops and a cropping intensity ratio of 1.9 . More than three-5
quarters of the land of wheat farmers is irrigated by pump from a canal. One

11
exception to this pattern is that in the Frontier, irrigation water comes from wells,
both private and public.
The survey also confirms that wheat plays an important role in wheat farmers
crop rotations. The most common winter-summer rotations are wheat-rice (20
percent of the cultivated area), berseem-cotton (12 percent), wheat-maize (10
percent), and berseem-maize (8 percent). Four fifths of the wheat farmers in
Egypt grow wheat every year. This implies that although 1.67 million households
grow wheat in a given year, approximately 2 million households grow wheat
overall. Interestingly, only 58 percent of the smallest wheat farmers grow wheat6
every year, compared to 92 percent in the category of the largest wheat farmers.
The explanation appears to be that small farms have fewer plots (just 2 on
average) so it is more difficult to grow wheat every year and rotate winter crops.
Wheat farmers devote one half of their winter crop land (or slightly less than one
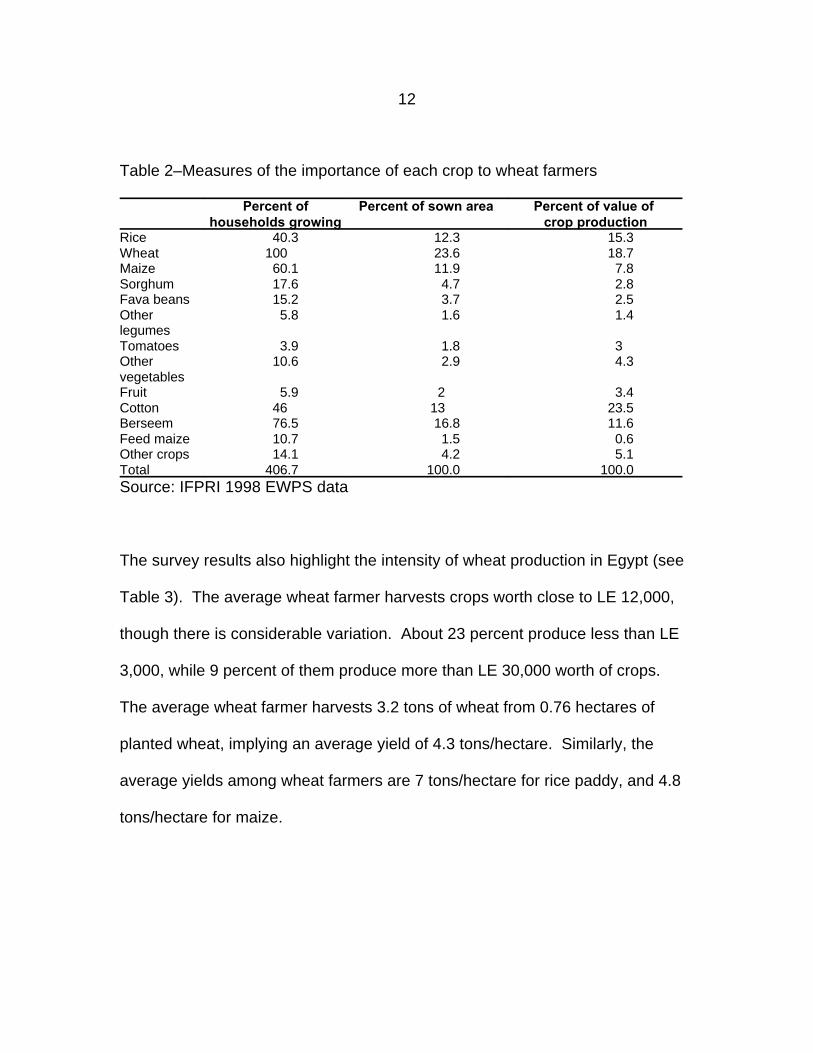
quarter of their total sown area) to wheat (see Table 2). In terms of the value of
production, the most important crops grown by wheat farmers are cotton (24
percent of the total), wheat (19 percent), and rice (15 percent). Cotton, fruits,
and vegetables account for a larger share of the value of production than of area
because value per hectare is higher than for staple foods.
12
Table 2–Measures of the importance of each crop to wheat farmers
Percent of Percent of sown area Percent of value of households growing crop production
Rice 40.3 12.3 15.3Wheat 100 23.6 18.7Maize 60.1 11.9 7.8Sorghum 17.6 4.7 2.8Fava beans 15.2 3.7 2.5Other 5.8 1.6 1.4legumesTomatoes 3.9 1.8 3Other 10.6 2.9 4.3vegetablesFruit 5.9 2 3.4Cotton 46 13 23.5Berseem 76.5 16.8 11.6Feed maize 10.7 1.5 0.6Other crops 14.1 4.2 5.1Total 406.7 100.0 100.0Source: IFPRI 1998 EWPS data
The survey results also highlight the intensity of wheat production in Egypt (see
Table 3). The average wheat farmer harvests crops worth close to LE 12,000,
though there is considerable variation. About 23 percent produce less than LE
3,000, while 9 percent of them produce more than LE 30,000 worth of crops.
The average wheat farmer harvests 3.2 tons of wheat from 0.76 hectares of
planted wheat, implying an average yield of 4.3 tons/hectare. Similarly, the
average yields among wheat farmers are 7 tons/hectare for rice paddy, and 4.8
tons/hectare for maize.

13
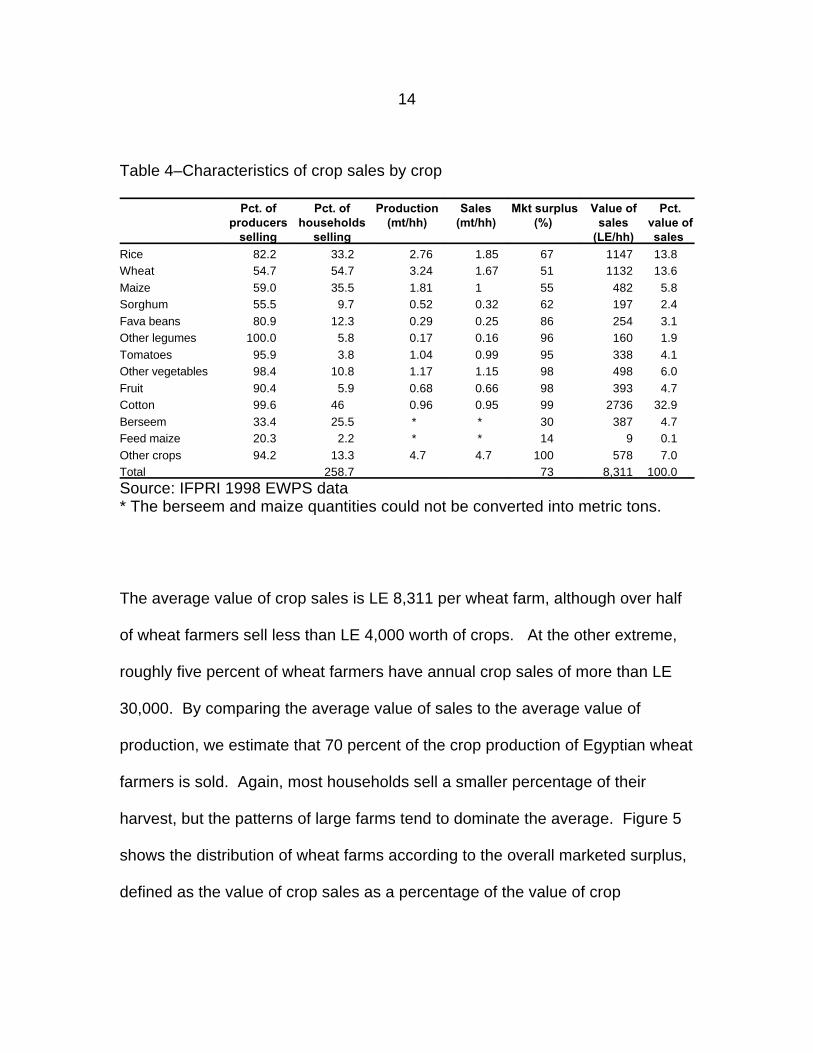
Finally, the survey indicates that Egyptian wheat farmers are highly
commercialized (see Table 4). The market surplus ratio is between 50 and 707
percent for the main food grains: rice, wheat, maize, and sorghum. For legumes,
fruits, and vegetables, 85-98 percent of the harvest is sold. Virtually all (99
percent) cotton is sold. This pattern is not the result of a few large producers, as
shown by the high proportion of producers that sell some of their output. Even for
the basic grains (wheat, maize, and sorghum) the proportion of growers that sell
part of their crop is over half. The least commercialized crops are berseem and
feed maize, grown mainly for on-farm use as animal feed.
Table 3–Average area, production, yield, value, and value per hectare by crop
Sown area Production Yield Value per farm Value perhectare
(ha/hh) (mt/hh) (mt/ha) (LE/hh) (LE/ha) Rice 0.39 2.76 7 1,808 4,581 Wheat 0.76 3.24 4.28 2,208 2,915 Maize 0.38 1.81 4.76 922 2,420 Sorghum 0.15 0.52 3.45 330 2,205 Fava beans 0.12 0.29 2.44 296 2,520 Other legumes 0.05 0.17 3.36 166 3,289 Tomatoes 0.06 1.04 18.47 357 6,358 Other vegetables 0.09 1.17 12.36 505 5,356 Fruit 0.06 0.68 10.49 398 6,163 Cotton 0.42 0.96 2.29 2,764 6,615 Berseem 0.54 * * 1,364 2,536 Feed maize 0.05 * * 71 1,456 Other crops 0.13 4.7 35.01 598 4,454 Total 3.20 17.42 8.01 11,787 3,913
Source: IFPRI 1998 EWPS data* The berseem and feed maize quantities could not be converted to metric tons.
14
Table 4–Characteristics of crop sales by crop
Pct. of Pct. of Production Sales Mkt surplus Value of Pct.producers households (mt/hh) (mt/hh) (%) sales value of
selling selling (LE/hh) sales
Rice 82.2 33.2 2.76 1.85 67 1147 13.8 Wheat 54.7 54.7 3.24 1.67 51 1132 13.6 Maize 59.0 35.5 1.81 1 55 482 5.8 Sorghum 55.5 9.7 0.52 0.32 62 197 2.4 Fava beans 80.9 12.3 0.29 0.25 86 254 3.1 Other legumes 100.0 5.8 0.17 0.16 96 160 1.9 Tomatoes 95.9 3.8 1.04 0.99 95 338 4.1 Other vegetables 98.4 10.8 1.17 1.15 98 498 6.0 Fruit 90.4 5.9 0.68 0.66 98 393 4.7 Cotton 99.6 46 0.96 0.95 99 2736 32.9 Berseem 33.4 25.5 * * 30 387 4.7 Feed maize 20.3 2.2 * * 14 9 0.1 Other crops 94.2 13.3 4.7 4.7 100 578 7.0Total 258.7 73 8,311 100.0
Source: IFPRI 1998 EWPS data* The berseem and maize quantities could not be converted into metric tons.
The average value of crop sales is LE 8,311 per wheat farm, although over half
of wheat farmers sell less than LE 4,000 worth of crops. At the other extreme,
roughly five percent of wheat farmers have annual crop sales of more than LE
30,000. By comparing the average value of sales to the average value of
production, we estimate that 70 percent of the crop production of Egyptian wheat
farmers is sold. Again, most households sell a smaller percentage of their
harvest, but the patterns of large farms tend to dominate the average. Figure 5
shows the distribution of wheat farms according to the overall marketed surplus,
defined as the value of crop sales as a percentage of the value of crop

15
production. The market surplus ratios are highest in Nubaria and the Frontier,
and are higher (on average) among large and wealthy farmers.
Figure 5–Distribution of wheat farms by value of crop sales
Source: IFPRI 1998 EWPS data
INPUT USE
Seeds and Fertilizers
Before the agricultural reforms of 1987, about 61 percent of the total cultivated
wheat area in Egypt was sown with lower-yielding, longer stalked wheat varieties
(Sallam et al. 1989). Low government-set prices of wheat skewed farmers'
16
incentives such that they preferred to sow long stalked, large straw producing
traditional varieties that sold at a market price of LE 160 per mt, while the wheat
itself could only be sold at the fixed price of LE 120 per mt (Harik 1996). With the
liberalization of wheat and other agricultural markets, the adoption of higher-
yielding, heat and pest tolerant, semi-dwarf varieties began to take off.
The primary type of bread wheat variety currently used by farmers in Egypt is
Sakha 69 (See Table 5). About 48 percent of the wheat farmers purchased
Sakha 69 in the 1997/98 cropping season. It is the most intensively cultivated
seed variety in the Delta and Frontier regions, and to a lesser extent in Middle
Egypt. Older Sakha varieties, such as Sakha 8 and Sakha 61 continue to be
sown, primarily in Nubaria, the Frontier and the West Delta. The second most
popular seed variety is Giza 164. This higher yielding, rust-resistant and heat-
tolerant bread wheat variety, is sown by nearly 40 percent of wheat farmers in
Upper Egypt and 10 percent of wheat farmers in Middle Egypt.

17
Table 5–Percentage of farmers applying wheat seed by variety and region
Variety East Delta West Delta Middle Upper Nubaria Frontier OverallEgypt Egypt
Traditional 0.1 1.9 1.0 10.2 0.0 0.0 3.1 Beni Suef 0.0 0.0 23.1 0.0 0.0 0.0 3.4 Giza 164 0.0 0.0 9.8 39.7 0.0 0.0 10.2 Sakha 8 1.9 6.0 0.0 0.5 77.2 15.0 3.2 Sakha 61 1.7 10.3 0.0 0.0 0.0 0.0 4.0 Sakha 69 67.2 68.0 37.1 0.9 0.0 49.4 47.9 Sidas 1.3 1.1 13.6 14.4 14.8 0.0 6.0 90s MVs 0.0 4.3 0.0 0.5 0.0 0.0 1.6 Older MVs 0.4 0.3 0.0 0.0 0.0 6.2 0.2 Stored seeds 27.4 8.1 15.3 33.9 8.0 29.4 20.4 Source: IFPRI 1998 EWPS data
Beni Suef and Sohag are durum wheat varieties. Unlike bread varieties, durum
wheat is primarily milled into semolina flour for the production of pasta products.
Beni Suef is currently cultivated in Middle Egypt - primarily Minia, where about 23
percent of wheat farmers grow it. A further 20 percent of the wheat farmers use
various varieties of seeds stored from the previous years harvest. Use of stored
seed is most common in the Frontier, Upper Egypt, and the East Delta. Lastly,
while about 3 percent of farmers continue to use traditional varieties in Egypt, 9
percent of the farmers in Upper Egypt continue to sow Giza 156 and Baladi
wheat varieties, which are more susceptible to lodging and typically have lower
yields than the newer modern varieties.

18
Nearly 55 percent of the farmers obtain their wheat seeds from cooperatives and
about 14 percent purchase them from traders. A further 27 percent obtain their
seed from either other farmers or from their pervious years' harvest.
Cooperatives and traders provide mainly modern varieties, while other farmers
provide over 85 percent of the traditional varieties purchased by farmers.
Farmers typically travel about 0.5 km to purchase seeds, with cooperatives
usually closer than traders and village banks. Seeds retail for about LE 1.47 per
kg on average. Application rates are about 162 kg/ha.
Nitrogenous fertilizer application rates in Egypt are among the highest in the
world. According to the EWPS, the three most widely used fertilizers by Egyptian
wheat farmers are ammonium nitrate (AN), urea, and single superphosphate
(SSP) (See Table 6). In the 1997/98 cropping year, nearly 100 percent of wheat
farmers used some form of nitrogenous fertilizer - usually urea or AN - and 44
percent used SSP on their wheat fields. Application rates are about 394 kg/ha
for urea and 336 kg/ha for SSP. Less than one percent apply potash to their
wheat fields. As Table 6 shows, urea is used most intensively in Middle and
Upper Egypt, while AN and SSP are the predominant fertilizers used in the Delta.
In the newly reclaimed lands of Nubaria, because of the lower soil fertility, all
farmers applied AN and SSP to their wheat fields. In addition, a number of
farmers in Nubaria applied ammonium sulfate and potassium sulfate to their

19
fields, presumably to help deal with sulphur and/or potassium deficiencies within
the soil. In the Frontier, wheat farmers rely more on manure to provide nutrients
for plant growth than on inorganic fertilizers.
About 45 percent of the farmers purchase their fertilizer from cooperatives and
41 percent from agricultural traders. Farmers rely principally on inorganic
fertilizers and crop rotation to maintain the fertility of their wheat fields; use of
manure is limited.
Table 6–Fertilizer usage by type and region (Percentage of wheat farmers)
Region OverallEast West Middle Upper Nubaria FrontierDelta Delta Egypt Egypt
Urea 42 47 73 90 0 32 58 Ammonium nitrate 74 60 42 44 100 0 58 Ammonium sulphate 0 0 0 0 25 0 0 Superphosphate 64 65 18 4 100 32 44 Potassium sulphate 0 0 2 0 10 0 0 Other fertilizer 6 5 5 2 0 0 5 Manure 10 6 11 8 17 68 9 Source: IFPRI 1998 EWPS data
Labor
Unlike many other countries in the world, Egypt produces wheat in a labor
intensive manner. On average, farmers use 79 person-days of labor on each
hectare of wheat during the growing season. The single most labor intensive

20
activity is harvesting; over 23 person-days of labor are devoted to harvesting one
hectare of wheat and 16 person-days to threshing.
Labor use varies with farm size. As shown in Table 7, households with small
farms use more labor, most of which is family labor, to produce a hectare of
wheat. Large farms, by contrast, use less labor per hectare, most of which is
hired, and more machinery. Wage rates in wheat production are about LE 8 to
15 per day, depending on the activity and the period of the year.
Table 7–Labor usage in wheat production by labor type and total area category
Farm size quintile Overall
Smallest 2 3 4 Largest
Family 65.6 48.1 35.4 26.5 14.4 40.6 Hired 36.3 33.9 36.1 32.2 43.3 36.2 Exchange 2.3 3.5 1.3 1.9 .2 1.9 Total 104.2 85.5 72.8 60.6 57.8 78.7
Source: IFPRI 1998 EWPS data
Agricultural machinery and animal ownership
Shortages of family labor and high wage rates for hired labor during peak periods
have been an impetus for the mechanization of Egyptian agriculture (Khan
1993). Tractors are used by virtually all wheat farmers (99 percent), albeit for an
average of just three-quarters of a day over the wheat season. Despite high
usage in wheat farming, tractors are owned by only 14 percent of wheat farmers;

21
the remainder rent. Wealthier and larger farmers are more likely to own a tractor
than poorer households. On average, the daily rental rate for a tractor is LE 116.
Although 93 percent of wheat farmers use pumps to irrigate their wheat fields,
only 58 percent own a water pump. The remainder rent pumps from friends and
neighbors.
Nearly all wheat farmers in Egypt own poultry or other fowl, and goats or sheep
(see Table 8). About 83 percent of wheat farmers own a mule or a donkey, and
76 percent use them in their wheat farming activities.
Table 8–Use and ownership of animals by type
Animal traction Percent who Number Percent who Percent who Percent whoown owned used own rented used
Camel 3 1.2 3 4 7 Ox/Cow/Bull 77 3.3 3 0 3 Horse 3 1.6 1 0 1 Mule/Donkey 83 1.3 73 4 76 Sheep/Goat 100 6.2Fowl 100 44.3
Source: IFPRI 1998 EWPS data
Credit
According to the EWPS, few wheat farmers are able to purchase inputs on
credit. Cash transactions account for 92 percent of fertilizer purchases, 95
percent of seed purchases, and 98 percent of the purchases of agricultural

22
chemicals. On the other hand, 24 percent of the wheat farmers were able to
obtain a loan for the 1997-98 season, and 30 percent had received a loan within
the past five years. Virtually all the loans (96 percent) came from the Principal
Bank for Development and Agricultural Credit (PBDAC) which offers loans at
below-market interest rates (11-13 percent per year). The average loan is for LE
3,454 with a repayment period of 302 days.
Access to credit varies according to household wealth, in part because PBDAC
uses the amount of land under cultivation as an important criterion in the
allocation of credit. Just 12 percent of the poorest wheat farmers had obtained a
loan compared to 24 percent on average. Furthermore, poorer farmers received
smaller loans, the average amount one third less than the overall average.
Poorer households were also more likely to use the loans for non-business
purposes. Twenty four percent of the poorest loan recipients used the loan for
consumption or home improvement, compared to just 6 percent of the richest
loan recipients.
In addition, access to credit varies by region. Government policy ensures that
wheat farmers in Nubaria are favored with good access to low-interest credit. A
majority of the Nubaria wheat farmers in the EWPS sample obtained a loan in
1997-98, and the average interest rate was just 10 percent. In contrast, the

23
proportion of wheat farmers receiving loans in the two Delta regions was less
than 15 percent.
Land
As part of the economic reforms, land rental prices have been liberalized. Wheat
farmers in the EWPS report that land rents have increased by about 76 percent
since 1992-93, equivalent to a 17 percent increase in real terms. Increases have
been particularly large in the governorates of Giza, Qalubia, and Beheira, which
are close to Cairo, and where agricultural land is relatively scarce. About 62
percent of the wheat farmers in Egypt report that the removal of the land rent
ceiling has had little effect on their household. Furthermore, relatively few of the
poorest households (30 percent) indicated that the new land law had made them
worse off.
These results can be better understood in light of land ownership patterns.
According to the EWPS, the overwhelming majority (90 percent) of the land
cultivated by wheat farmers is owned by the farm household. Just 8 percent is
rented and the remainder is sharecropped. Not surprisingly, the proportion of
rented area is much higher (about 24 percent of total land area) for the poorer
than the wealthier households (about 4 percent). This implies that about three
quarters of the poorest wheat farmers are not directly affected by the
24
liberalization of land rents. The survey also reveals that a significant portion of
the rented land is rented by relatively large and wealthy farmers. For example,
almost 45 percent of the land rented by Egyptian wheat farmers is rented by
those in the top two quintiles. This suggests that the benefits of land rent
controls were not necessarily well targeted to the poor.
COSTS AND RETURNS OF WHEAT PRODUCTION
In this section, we describe the revenue and costs associated with wheat
production in Egypt. We calculate the gross value of wheat production as the
value of wheat sales, the value of wheat retained for home consumption, and the
value of wheat stalks produced. The returns to family labor and family-owned
assets are calculated as the gross value of wheat production minus the cost of
hired labor, seed (including retained seed), fertilizer, other inputs, land rental,
equipment rental, and animal rental for wheat production. We do not attempt to
estimate the overall cost of production because of the conceptual and practical
difficulties of imputing a value for family labor and family-owned land.
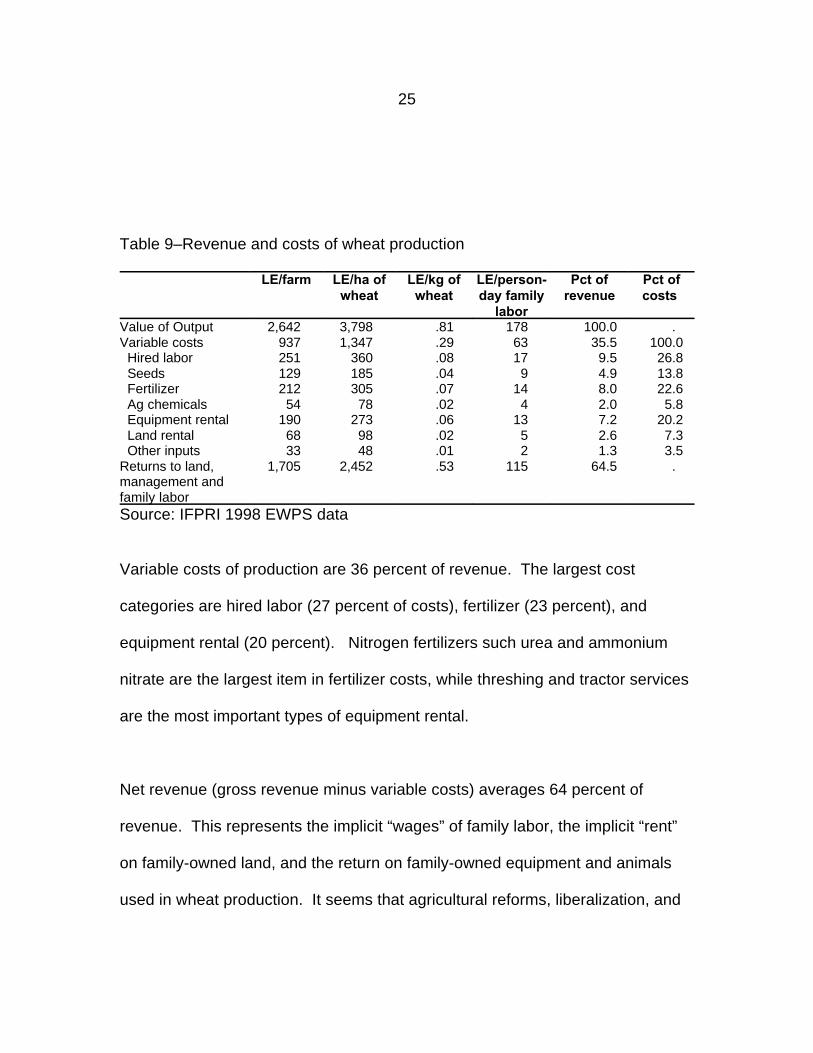
The gross revenue from wheat production, defined as the value of wheat and
stalk production, is LE 2,642 per farm or LE 0.81 per kilogram of wheat produced
(see Table 9). The value of wheat grain is LE 0.68 per kilogram, but stalks add
another 19 percent to the value of the grain.
25
Table 9–Revenue and costs of wheat production
LE/farm LE/ha of LE/kg of LE/person- Pct of Pct ofwheat wheat day family revenue costs
laborValue of Output 2,642 3,798 .81 178 100.0 . Variable costs 937 1,347 .29 63 35.5 100.0 Hired labor 251 360 .08 17 9.5 26.8 Seeds 129 185 .04 9 4.9 13.8 Fertilizer 212 305 .07 14 8.0 22.6 Ag chemicals 54 78 .02 4 2.0 5.8 Equipment rental 190 273 .06 13 7.2 20.2 Land rental 68 98 .02 5 2.6 7.3 Other inputs 33 48 .01 2 1.3 3.5 Returns to land, 1,705 2,452 .53 115 64.5 . management andfamily laborSource: IFPRI 1998 EWPS data
Variable costs of production are 36 percent of revenue. The largest cost
categories are hired labor (27 percent of costs), fertilizer (23 percent), and
equipment rental (20 percent). Nitrogen fertilizers such urea and ammonium
nitrate are the largest item in fertilizer costs, while threshing and tractor services
are the most important types of equipment rental.
Net revenue (gross revenue minus variable costs) averages 64 percent of
revenue. This represents the implicit “wages” of family labor, the implicit “rent”
on family-owned land, and the return on family-owned equipment and animals
used in wheat production. It seems that agricultural reforms, liberalization, and

26
the use of modern technology have all contributed to changes in farmer
profitability. About 64 percent of households reported that wheat profitability has
increased since 1995.
Looking at crop budgets across farm-size categories, gross revenue per ton is
essentially constant, being determined by market prices, but variable costs
decline with farm size. This is largely due to the fact that larger farms rent a
smaller share of the cultivated land. Thus, returns to family labor and family-
owned assets rise from LE 473/ton for the smallest farm-size category to LE
551/ton in the largest (see Table 10). Gross revenue per hectare is somewhat
higher among smaller farms due to more intensive cultivation and higher yields.
However, per-hectare costs are also higher among small farms, largely due to
the cost of renting land. The combined effect is that the net revenue is
somewhat (13 percent) higher for the largest farm-size category than it is for the
smallest. And finally, the returns per person-day rise sharply as farm size
increases. This is not surprising since labor productivity is strongly influenced by
the amount of other factors of production per worker, and by definition large
farms offer more land per family member.

27
Table 10–Revenue and costs of wheat production per unit of input by farm sizecategory
Farm size category Smallest 2 3 4 Largest Overall
Revenue per metric ton 807 806 817 795 824 810Cost per metric ton 334 338 321 274 272 290Returns per metric ton 473 468 496 522 551 530Revenue per hectare 3,878 4,445 4,037 3,967 3,593 3,798Cost per hectare 1,606 1,866 1,586 1,366 1,187 1,347Returns per hectare 2,272 2,578 2,451 2,601 2,405 2,452Revenue per person-day 65 93 115 170 379 178Cost per person-day 27 39 45 58 125 63Returns per person-day 38 54 70 111 253 115Source: IFPRI 1998 EWPS data
WHEAT USAGE AND MARKETING
In 1998, the average quantity of wheat harvested per wheat farm household was
3.25 tons (see Table 11). Extrapolating to the national level, this implies a
harvest of 5.4 million tons of wheat. Of the total quantity harvested, about 52
percent was sold, 31 percent was used for household consumption, 7 percent
was stored for other uses, and 6 percent was given out as gift or other. The
remaining 5 percent was used to pay farm workers or landlords, stored for seed,
and used as animal feed.

28
Table 11–Average wheat usage in 1998
Activity Quantity per wheat National quantity Percent offarm (kg) (mmt) quantity
harvestedHarvested 3252 5.42 100Sold for cash 1701 2.83 52.3Consumed in household 993 1.65 30.6Stored for other uses 230 0.38 7Used for gifts and other 185 0.31 5.7Used to pay workers 83 0.14 2.6Stored to use as seed 32 0.05 1Used as animal feed 14 0.02 0.4Used to pay land rent 11 0.02 0.3
Source: IFPRI 1998 EWPS data
The share of wheat used for household consumption is highest for small farmers
and tends to decrease with farm size (see Figure 6). Conversely, the share of
wheat sold increases with farm size. In small farms, most wheat is used for
subsistence and therefore only a small amount of wheat harvested is left to be
sold. As farm size increases, however, once wheat used for household
subsistence has been allocated, the rest of the wheat is sold. Therefore, wheat
sales tend to increase more than proportionately with farm size.

Consumed Sold
Farm size quintile1 2 3 4 5
0
10
20
30
40
50
60
70
80
29
Figure 6–Percentage of wheat consumption and sales over total harvest by farm
size
Source: IFPRI 1998 EWPS data
As expected, we also find that the frequency and volume of wheat sales is
correlated with farm size. Whereas 63 percent of households in the smallest
farm-size quintile never sell wheat, about 67 percent of the largest farm-size
quintile always sell wheat. Most small-scale farmers grow wheat for subsistence.
As farm size increases, farmers sell the additional volume of wheat that will not
be used for own household consumption. On average, about a little less than
one-third of the farmers never sell wheat, and a little more than one-third always
sell wheat. The rest either sell rarely, sometimes, or frequently. On a volume
basis, a little more than one-third of all farmers sell more than 50 percent of their
wheat; another one-quarter of farmers sell less than 50 percent; and less than 10
percent of all farmers sell all their wheat. However, even if most farmers sell less

30
than 50 percent of their wheat, those that sell more wheat own larger farms so
that overall more than 50 percent of all wheat production is sold.
As noted earlier in Table 11, 52 percent of the wheat harvested by farmers is
sold. Table 12 below shows the characteristics of the wheat sale transactions by
the type of buyer. The types of wheat buyers include private traders, neighbors,
public mills, cooperatives, the village banks, the MALR, and others. The Ministry
of Trade and Supply (MOTS) uses the public mills, the cooperatives, and the
village banks (which are the branches of the PBDAC) to buy the wheat from the
farmers on its behalf. This government procured wheat is then channeled to the
public mills to make the subsidized 82 percent wheat flour for the baladi bread
and flour subsidy program. The MALR, on the other hand, contracts with large
scale farms to multiply wheat seeds.
The numbers in Table 12 indicate that about 39 percent of the wheat farm
households sell to traders, while only 6 percent sell to their neighbors, and less
than 5 percent sell to either the mills, the cooperatives or the village banks.
Private traders receive two-thirds of all the wheat sold by farmers, or the
equivalent of 1.88 mmt of wheat on a nation-wide basis. The next largest
marketing outlets for farmers are the mills and the village banks, each buying
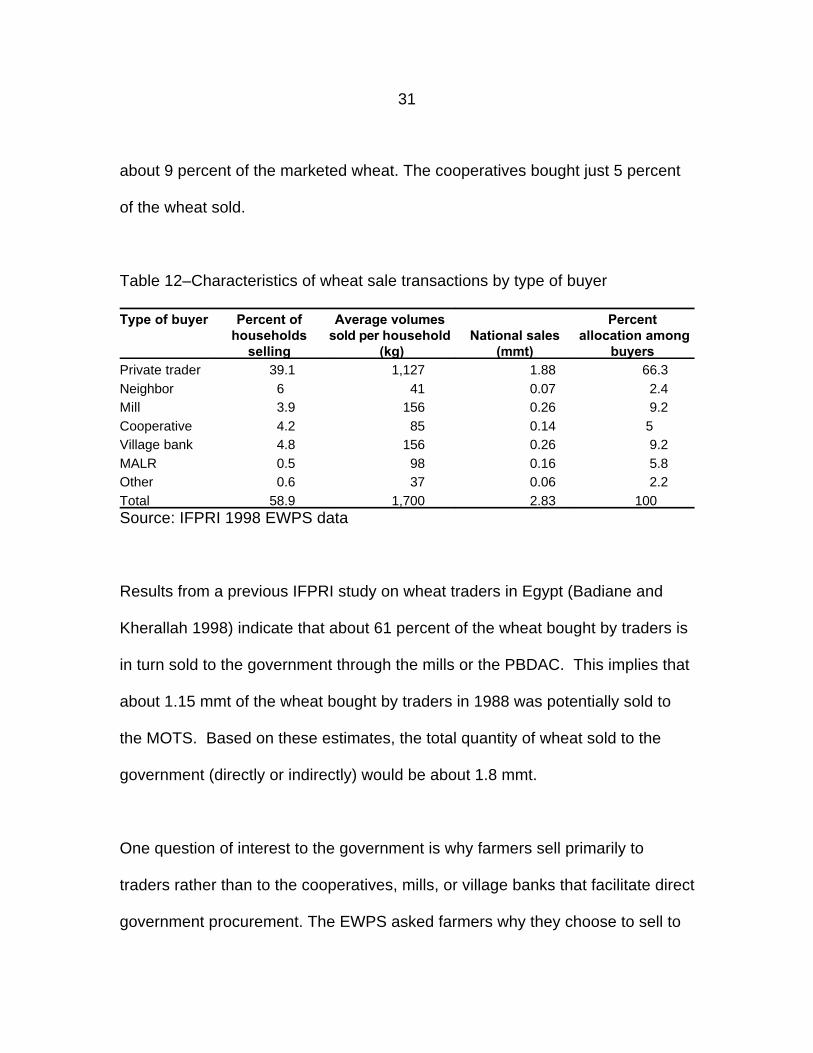
31
about 9 percent of the marketed wheat. The cooperatives bought just 5 percent
of the wheat sold.
Table 12–Characteristics of wheat sale transactions by type of buyer
Type of buyer Percent of Average volumes Percent households sold per household National sales allocation among
selling (kg) (mmt) buyers Private trader 39.1 1,127 1.88 66.3 Neighbor 6 41 0.07 2.4 Mill 3.9 156 0.26 9.2 Cooperative 4.2 85 0.14 5 Village bank 4.8 156 0.26 9.2 MALR 0.5 98 0.16 5.8 Other 0.6 37 0.06 2.2 Total 58.9 1,700 2.83 100Source: IFPRI 1998 EWPS data
Results from a previous IFPRI study on wheat traders in Egypt (Badiane and
Kherallah 1998) indicate that about 61 percent of the wheat bought by traders is
in turn sold to the government through the mills or the PBDAC. This implies that
about 1.15 mmt of the wheat bought by traders in 1988 was potentially sold to
the MOTS. Based on these estimates, the total quantity of wheat sold to the
government (directly or indirectly) would be about 1.8 mmt.
One question of interest to the government is why farmers sell primarily to
traders rather than to the cooperatives, mills, or village banks that facilitate direct
government procurement. The EWPS asked farmers why they choose to sell to
32
one buyer rather than another. Two main reasons were good prices (60 percent)
followed by close location (23 percent). Regarding price, the average price paid
to farmers by traders (LE 0.67 per kg) was at least as high as the price paid by
regular government outlets such as the mills, village banks, and cooperatives (LE
0.64 to 0.66 per kg). It is also toward the top of the range of government
procurement prices, which range from LE 0.63 to LE 0.67 per kg depending on
quality.
Regarding the location of sale, traders usually purchase wheat on the farm (64
percent) or at a market (25 percent). In contrast, in order to sell to a mill,
cooperative, or village bank, it is necessary for the farmer to transport the
harvest to these sites. These findings confirm earlier reports by Badiane and
Kherallah (1998) that farmers prefer to deal with traders because they offer
better prices, they buy smaller quantities, and they pick up the wheat from the
farmers' dwelling saving on transport costs. In some cases, traders also give an
advance to the farmer.
On-farm wheat storage is quite common. Almost all wheat farmers use their own
house to store their wheat (the exception is the Frontier, where most farmers do
not have wheat storage capacity). Farmers very rarely rent storage space. The
average quantity of wheat in storage is very seasonal. The quantity of wheat

33
stored reaches a peak after harvest in April/May at about 1.1 to 1.4 mt and
declines gradually down to 150 kgs just before the next harvest season of the
following year. Most of the wheat (86 percent) is stored for consumption
throughout the year rather than for sale.
WHEAT CONSUMPTION PATTERNS
In order to shed more light on wheat marketing decisions, this section describes
the consumption patterns of staple grains (wheat, rice, and maize) among wheat
farmers. The most widely consumed grain product in our sample was home-
baked bread from wheat produced on the farm, reported by 91 percent of the
households. As shown in Table 13, most households also make other wheat
products from their own harvest (65 percent), bake bread from purchased flour
(70 percent), buy rice (62 percent), and buy baladi bread (59 percent) . A8
minority of wheat farmers consume rice that they produced, purchased fino
bread, and bread from purchased wheat.

34
Table 13–Percentage of households that consume different grain products
Pct consuming one Pct consuming Pct consuming or more months seven or more every month
per year months of the year per year
Purchased baladi bread 59.2 43.3 37.2 Purchased fino bread 30.1 19.8 9.8 Bread from bought flour 70.0 23.8 18.1 Bread from bought wheat 15.5 7.2 3.1 Purchased rice 62.4 56.5 54.5 Bread from own wheat 90.9 78.3 58.3 Other from own wheat 64.6 30.8 20.9 Rice from own harvest 42.4 40.8 38.4Source: IFPRI 1998 EWPS data
Baladi bread is purchased by somewhat more than half of the wheat farmers,
regardless of wealth category (see Table 14). In contrast, the proportion of
households buying fino bread rises from just 7 percent in the poorest category to
55 percent in the richest. This reflects the higher cost of fino bread which makes
it a "luxury" good among grain products. The percentage of wheat farm
households consuming home-made bread from purchased flour and purchased
wheat tends to decline in the high-wealth categories, reflecting the higher
opportunity cost of time of these households.

35
Table 14–Percentage of households that consume different grain products bywealth category
Wealth category Poorest 2 3 4 Richest Purchased baladi bread 56 66.3 50.8 57.7 64.8 Purchased fino bread 6.8 33.8 21.7 31.1 55.0 Bread from bought flour 81.8 75.5 62.0 67.1 64.5 Bread from bought wheat 22.4 26.7 14.1 9.6 6.3 Purchased rice 70.4 63.3 55.2 65.8 58.8 Bread from own wheat 93.6 97.5 81.0 93.8 88.5 Other from own wheat 56.2 61.3 63.3 68.6 73.3 Rice from own harvest 37.0 47.0 39.1 35.9 52Source: IFPRI 1998 EWPS data
The EWPS highlights the high level of wheat consumption in rural Egypt.
Egyptian wheat farmers purchase 242 loaves of baladi bread per person per
year or 31.5 kg/person/year. Among those that buy it, the average is 410
loaves/person/year or 53 kg/person/year. The average consumption of fino
bread is about one half that of baladi bread (84 loaves/person/year or 15
kg/person/year) (see Table 15).
Table 15–Average annual consumption of different wheat products
Annual consumption in original form Annual consumption in wheatequivalent
kg/household kg/person Percent kg/household kg/person Percent
Purchased baladi bread 211.6 31.5 14.0% 194.6 28.9 12.5% Purchased fino bread 82.6 15.2 5.5% 86.7 16.0 5.6% Purchased flour 197.0 25.2 13.1% 260.1 33.2 16.7% Purchased wheat 66.8 10.1 4.4% 66.8 10.1 4.3% Own wheat 949.4 126.2 63.0% 949.4 126.2 61.0% Total 1507.3 208.2 100.0% 1557.6 214.5 100.0%
Source: IFPRI 1998 EWPS data
36
Combining information on the purchase of wheat products (in wheat equivalent)
with information on wheat sales, we calculate the net sales of wheat by wheat
farmers. The net position of households is important because it determines
whether they would lose or gain from higher wheat prices in the absence of
subsidies. Although two-thirds of Egyptian wheat farmers sell wheat, less than
half (46 percent) are net sellers, whose wheat sales exceed the grain equivalent
of their purchases of bread and other wheat products. Just 4 percent are self-
sufficient, without purchases or sales of wheat or wheat products. One half of
the Egyptian wheat farmers are net buyers, whose wheat purchases (expressed
in grain equivalent) exceed their sales. Most of these households are wheat
farmers that do not sell wheat at all and supplement their wheat production with
purchases of bread and other wheat products.

37
4. WHEAT SUPPLY RESPONSE
This section uses the EWPS and multiple regression analysis to study the
differences in household-level input use and output supply as a function of
regional differences in input prices, output prices, and fixed factors available to
the household. The model includes five equations: the supply of wheat and the
demand for four variable inputs: hired labor, nitrogen-based fertilizer,
phosphorus-based fertilizer, and agricultural machinery rental. We estimate
jointly output supply and input demand using seemingly unrelated regression in
order to impose the symmetry conditions associated with production theory. We
focus on the wheat supply results (more details are provided in Kherallah et al,
1999).
The results of the regression analysis indicate that wheat supply is significantly
affected by wheat prices, wage rates, nitrogen fertilizer prices, the education of
the head of household, farm size, whether or not the farm is in the new lands,
and buffalo ownership. Table 16 summarizes the price elasticities estimated
from the model. The R correlation coefficient for the wheat supply equation is2
0.53, implying that approximately one half of the household-level variation in
wheat supply can be explained by the model. The coefficient on the price of
wheat is statistically significant at the 10 percent level and corresponds to a price
38
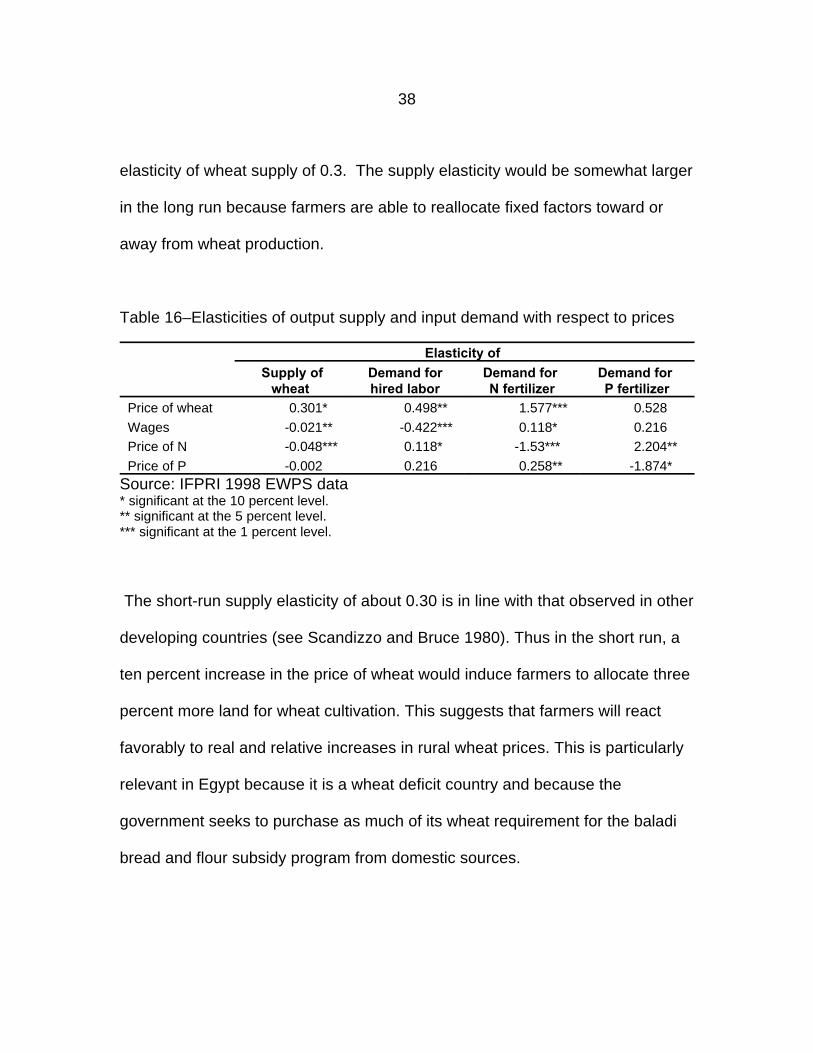
elasticity of wheat supply of 0.3. The supply elasticity would be somewhat larger
in the long run because farmers are able to reallocate fixed factors toward or
away from wheat production.
Table 16–Elasticities of output supply and input demand with respect to prices
Elasticity of
Supply of Demand for Demand for Demand for wheat hired labor N fertilizer P fertilizer
Price of wheat 0.301* 0.498** 1.577*** 0.528
Wages -0.021** -0.422*** 0.118* 0.216Price of N -0.048*** 0.118* -1.53*** 2.204**
Price of P -0.002 0.216 0.258** -1.874*Source: IFPRI 1998 EWPS data* significant at the 10 percent level.** significant at the 5 percent level.*** significant at the 1 percent level.
The short-run supply elasticity of about 0.30 is in line with that observed in other
developing countries (see Scandizzo and Bruce 1980). Thus in the short run, a
ten percent increase in the price of wheat would induce farmers to allocate three
percent more land for wheat cultivation. This suggests that farmers will react
favorably to real and relative increases in rural wheat prices. This is particularly
relevant in Egypt because it is a wheat deficit country and because the
government seeks to purchase as much of its wheat requirement for the baladi
bread and flour subsidy program from domestic sources.

39
Two of the three input prices are significant at the 5 percent level. The elasticity
of wheat supply with respect to the wage rate indicates that a 10 percent
increase in the wage rate would reduce wheat supply by 0.2 percent. Similarly, a
10 percent increase in the price of nitrogen fertilizer is associated with a 0.5
percent decrease in wheat supply. One implication of this finding is that a
reduction in fertilizer price (due to a subsidy for example) would have only a
modest effect on wheat production.
The size and composition of the household have no significant effect on wheat
production, but the education of the head of household appears to have a
significant positive effect on wheat production, perhaps reflecting greater
managerial capacity.
The price of berseem (or clover) which normally competes with wheat, was
tested in some alternative versions of the model but it was not statistically
significant. Although normally we would expect a higher price of berseem to be
associated with lower wheat production, this relationship may be weak or non-
existent in Egypt because most berseem is retained for domestic use rather than
sold.

40
5. CONCLUSIONS AND POLICY IMPLICATIONS
The wheat production sector in Egypt has undergone significant changes since
the beginning of the market reform programs in 1987. The removal of minimum
wheat area requirements, the elimination of compulsory delivery of wheat
quotas, and the liberalization of producer prices have increased the profitability
of wheat-based crop rotations and led to the adoption of higher yielding varieties
and modern production technology. The result has been a remarkable increase
in wheat crop area and yields, causing wheat production to increase from 1.9
mmt in 1986 to about 6 mmt in 1998, or 46 percent of total consumption.
Furthermore, the quantity of domestic wheat procured by the government for its
82 percent wheat flour and baladi bread subsidy program has increased from
less than 0.1 mmt in 1986 to 1.8 mmt in 1998. However, the continued growth in
domestic consumption has kept wheat imports in the range of 6 to 7 mmt per
year.
The survey indicates that Egyptian wheat production is based on small-scale
farms, yet these farms are highly commercialized. Wheat yields are high
because of the intensive use of labor, fertilizer, and irrigation. Cooperatives
continue to play an important role in seed distribution, but private traders have

41
come to dominate wheat marketing and the distribution of agricultural chemicals.
Farmers buy fertilizer from cooperatives and traders in roughly equal amounts.
Although some activities in Egyptian wheat production are mechanized, such as
land preparation, water pumping, and threshing, ownership of tractors and
threshers is rare. Mechanization is only possible because of the development of
an active rental market in agricultural machinery.
Although Egypt's wheat production has grown substantially in recent years, the
government has problems reaching its wheat procurement targets. A recurring
question among policymakers is why such a small portion of national production
is available for purchase by the government. Our results suggest that most of
the wheat produced is consumed in the rural areas. Half is retained by wheat
farmer households, 29-32 percent is purchased by the government, and the
remainder is consumed by non-wheat-farming rural households and, to a lesser
extent, wheat farmers who are net buyers. Using data from the EWPS, we
estimate that roughly half of Egyptian wheat farmers are net buyers who
complement their own production with the purchase of wheat products.
The survey also sheds light on why wheat farmers sell two thirds of their
marketed surplus to traders rather than to cooperatives, mills, and village banks

42
that channel wheat directly to the government. The two main factors are price
and location: traders pay prices at least as good as other buyers and they more
often pick up the harvest on farm.
Given the high level of wheat consumption in rural areas, the cost of increasing
deliveries of domestic wheat to the government are considerable. To do so, the
GOE would have to increase the procurement price substantially above
international prices. When procurement prices are above international prices, as
they currently are, the government incurs the budgetary costs of subsidizing its
wheat producers. In addition, increasing the incentive for farmers to sell the
wheat they have set aside for home consumption will encourage them to
purchase more subsidized flour and bread, resulting in higher costs to the
consumer subsidy system.
Wheat self-sufficiency is often cited as a goal of Egyptian wheat policy.
Achieving this goal using price policy would be very costly and ill-advised. This
study finds that the supply elasticity of wheat is 0.3, implying that an increase in
wheat self-sufficiency from 50 to 55 percent (that is, a 10 percent increase in
wheat production) would require an increase in wheat prices of roughly 30-35
percent in the short run. This finding supports conclusions of an analysis by

43
Löfgren and Kherallah (1998). They find that raising the wheat self-sufficiency
rate from 47 percent to 60 or 70 percent through higher producer prices would
involve increased subsidy costs of LE 1.5 billion and LE 3.3 billion (0.7 and 1.6
percent of GDP) respectively. This result highlights the difficulty in achieving, or
even increasing, wheat self-sufficiency through price policy alone.
Instead of subsidizing producer prices, the GOE would be better off investing in
research and infrastructure. Government investment into research for the
development of higher yielding wheat varieties would not only increase wheat
production, farmer productivity and farm income, but should also help make
more wheat available for the baladi bread and flour subsidy program without
increasing per unit subsidy costs. Furthermore, as Egyptian agriculture and diets
diversify into the production, export and consumption of higher-valued products,
infrastructure investments would facilitate the marketing and export of these
commodities.

Wg 'DPPd
Ad
SAd
Gd
SGd
Hg
SHg
44
1.Because the sample was selected in a four-stage process, the calculation of
the weighting factor involves four terms:
where
W = weighting factor for basin group g in district dg
D = number of districts selectedP = total wheat production in EgyptP = wheat production in selected district dd
A = total arable land in district dd
SA = arable land in the MALR-selected basin groups of district dd
G = total number of MALR-selected basin groups in district dd
SG = number of IFPRI-selected basin groups in district dd
H = total number of households in basin group gg
SH = number of selected households in basin group g g
The first term is a ratio of wheat production because the probability of selecting
districts was proportional to wheat production. Similarly, the second term is a
ratio of areas because MALR selected basin groups with probability proportional
to arable land area. The third and fourth terms are the inverse of the proportion
of units selected, reflecting the fact that the units (basin groups and households,
respectively) were selected with equal probability.
2. All the statistics reported in Section 3 are weighted averages or percentages.
ENDNOTES

45
3. Each quintile groups 20 percent of the households, ranked by the value of
their consumer durables. For example, the first quintile represents the 20
percent of households with the smallest value of consumer durables while the
fifth quintile is made up of the wealthiest 20 percent of the households.
4. Results from Nubaria and the Frontier should be interpreted with caution
because of the small sample size: 30 households in Nubaria and 20 in the
Frontier.
5. The cropping intensity ratio is calculated as the sum of sown area across
seasons divided by the annual cultivated area.
6. This figure is estimated by adding the total number of every-year wheat
farmers to: twice the number of every-two-year farmers, three times the number
of every-three-year farmers, and so on. This calculation adjusts for the
undercounting of occasional wheat farmers in the sample.
7. The market surplus ratios are calculated as the total volume of sales as a
percentage of the total volume of production. As a result, it is more influenced
by the patterns of large producers than small producers.
8. There are two main commercial types of bread in Egypt: baladi bread (made
from 82 percent extraction rate wheat flour) which is subsidized, and fino bread
(made from 72 percent extraction rate wheat flour) which is sold at free market
prices. Fino flour is usually considered of better quality than baladi flour.
46
REFERENCES
Badiane, O. and M. Kherallah. (1998). Evolution of Wheat Policy in Egypt andAdjustment of Local Markets. IFPRI Donor Report submitted (incollaboration with the Ministry of Agriculture and Land Reclamation andthe Ministry of Trade and Supply, Egypt) to USAID. Washington D.C.:IFPRI.
Harik, I. (1996). Economic Policy Reform in Egypt. Gainesville, FL: UniversityPress of Florida.
Khan, A. U. (1993). Agricultural Mechanization and Farm Equipment Supply. InThe Agriculture of Egypt. Ed. G. M. Craig. Oxford, UK: Oxford UniversityPress.
Kherallah, M. and N. Minot, and P. Gruhn. (1999). Adjustment of WheatProduction to Market Reform in Egypt. IFPRI Donor Report submitted (incollaboration with the Ministry of Agriculture and Land Reclamation andthe Ministry of Trade and Supply, Egypt) to USAID. Washington D.C.:IFPRI.
Löfgren, H. and M. Kherallah. (1998). A General Equilibrium Analysis ofAlternative Wheat Policy Scenarios for Egypt. IFPRI Donor Reportsubmitted (in collaboration with the Ministry of Agriculture and LandReclamation and the Ministry of Trade and Supply, Egypt) to USAID. Washington D.C.: IFPRI.
Sallam, M. S., M. H. Z. Shaker, A. A. Abdel-Wahab, R. A. Hatab, I. M. Gamasy,and A. G. Sayed. (1989). Constraints facing Productivity of Wheat andExtension Possibilities for Improving it Productivity in Sohag and QenaGovernorates, Upper Egypt. Cairo, Egypt: MALR, ARC/AERDRI.
Scandizzo, P. and C. Bruce. (1980). Methodologies for Measuring AgriculturalPrice Intervention Effects. Staff Working Paper No. 394. Washington, DC:World Bank. As cited in Sadoulet, E., and A. de Janvry. (1995).Quantitative Development Policy Analysis. Baltimore, MD: Johns HopkinsUniversity Press.
Sharma, M., and M. Zeller. (1998). A Household-Level Analysis of CreditTransactions in Egypt. Draft report to USAID, Egypt. Washington, DC:International Food Policy Research Institute.