the clean development mechanism - agecon search
TRANSCRIPT

TheClean DevelopmentMechanism
Felicia Müller-Pelzer
HWWA-Report
244Hamburgisches Welt-Wirtschafts-Archiv (HWWA)
Hamburg Institute of International Economics2004
ISSN 0179-2253

The HWWA is a member of:
• Wissenschaftsgemeinschaft Gottfried Wilhelm Leibniz (WGL)• Arbeitsgemeinschaft deutscher wirtschaftswissenschaftlicher Forschungsinstitute
(ARGE)• Association d‘Instituts Européens de Conjoncture Economique (AIECE)

The Clean DevelopmentMechanismA Comparative Analysis of Chosen Methodologies forMethane Recovery and Electricity Generation
Felicia Müller-Pelzer
This paper was prepared in the author’s co-operation with the HWWA Research Pro-gramme „International Climate Policy“. It draws on the author‘s diploma-thesis at theUniversity of Cologne.

HWWA REPORTEditorial Board:
Prof. Dr. Thomas StraubhaarDr. Otto G. MayerPD Dr. Carsten HefekerDr. Konrad LammersDr. Eckhardt Wohlers
Hamburgisches Welt-Wirtschafts-Archiv (HWWA)Hamburg Institute of International EconomicsÖffentlichkeitsarbeitNeuer Jungfernstieg 2120347 HamburgPhone: +49-040-428 34 355Fax: +49-040-428 34 451e-mail: [email protected]: http://www.hwwa.de/
Felicia Müller-PelzerVon-Claer-Straße 453639 KönigswinterPhone: +49-2223-279194Fax: +49-2223-28752e-mail: [email protected]

I
Contents
Abbreviations III
Preface 1
Abstract 2
1. INTRODUCTION 3
2. THE CONCEPT OF ADDITIONALITY OF THE CDM AND THE ME-THODOLOGY APPROACH
7
2.1 The History of Negotiations 7
2.1.1 From the Conference in Rio until Today 7
2.1.2 The Instruments of Flexibility 12
2.2 The Clean Development Mechanism 17
2.2.1 Definition 17
2.2.2 The Concept of Additionality 19
2.2.3 The Concept of Methodologies 35
2.2.4 Proceeding and Acceptance of a CDM Project Activity 38
3. COMPARATIVE ANALYSIS OF CHOSEN METHODOLOGIES 42
3.1 Description of Methodologies for Methane Recovery and ElectricityGeneration
42
3.1.1 Introductory Remarks 42
3.1.2 Selection: Building Clusters and Weighting 42
3.1.3 Description of Chosen Methodologies 45
3.1.4 Comparison of Selected Methodologies 52
3.2 Implementation of the Concept of Additionality 72
3.2.1 Problems of Implementation 72
3.2.2 Alternatives to the Present Proceeding 87

II
3.2.3 Simplified Proceeding 89
4. CONCLUSION AND OUTLOOK 95
References 97
Annex 103
Figure 1 Hot Air 10
Figure 2 Total Mitigation Costs (both countries commited to reducingemissions)
13
Figure 3 Total Mitigation Costs (Country A committed, Country B notcommitted
14
Figure 4 Additional Emission Reductions 20
Figure 5 UNFCCC CDM Project Activity Cycle 39
Figure 6 Overview on Clustering and Weighting of the SubmittedMethodologies
43
Figure 7 Methods for the Calculation of the Emission Reductions 67
Figure 8a Proposals Made by the Chosen Methodologies 70
Figure 8b Proposals (continuation) 71
Figure 9 IRR: Comparison of Projects 75
Figure 10 Exclusion of Sources from the Calculation of Emission Re-ductions
85
Figure 11 Baseline Selection Procedure 90
Figure 12 Additionality Assessment Procedures 91
Figure 13 Boundaries for the Baseline and the Project Activity 93
Figure 14 Methods for the Calculation of Emission Reductions 94
III
Abbreviations
AIJ Activities Implemented JointlyAAU(s) Assigned Amount Unit(s)BAU Business-As-UsualBM Build MarginCDM Clean Development MechanismCDM-AP (CDM) Accreditation PanelCEF(s) Carbon Emission Factor(s)CER(s) Certified Emission Reduction(s)CERUPT Certified Emission Reduction Unit Procurement TenderCM Combined MarginCPCB Central Pollution Control BoardCH4 MethaneCO2 Carbon DioxideCO2 equiv. CO2 equivalentCOP Conference Of the PartiesCOP/MOP Conference Of the Parties serving as the Meeting Of the PartiesDNA Designated National AuthorityDOE(s) Designated Operational EntityDSM Demand Side ManagementEAF Effectiveness Adjustment FactorEB (CDM) Executive BoardEIT(s) Economy(/ies) In TransitionER(s) Emission Reduction(s)ERU(s) Emission Reduction Unit(s)ET Emission TradingGDP Gross Domestic ProductGEF Global Environment FacilityGHG(s) Greenhouse Gas(es)HFC(s) Hydrofluorocarbon(s)IET International Emissions TradingIPCC Intergovernmental Panel on Climate ChangeIRR Internal Rate of ReturnJI Joint ImplementationLDC Least Developed CountriesLFG Landfill GasMCMM Modified Combined Margin MethodMeth Panel (CDM) Methodology PanelMLF Multilateral FondMOP Meeting of the PartiesMSW Municipal Solid WasteN2O Nitrous OxideNGO Non-Governmental OrganizationNM New baseline and monitoring MethodologyNPV Net Present ValueODA Official Development AssistanceOM Operational MarginPCF Prototype Carbon Fund

IV
PDD Project Design DocumentPFC(s) Perfluorocarbon(s)PPA Power Purchase AgreementsPPs Project Participant(s)RMU(s) Removal Unit(s)SDDP Stochastic Duo Dynamic ProgrammingSF6 Sulfur HexafluorideSSc Panel (CDM) Small Scale PanelT&D Transmission and DistributionUNCED United Nations Conference on Environment and DevelopmentUNFCCC United Nations Framework Convention on Climate ChangeWWF World Wildlife Fund

1
PREFACE
This report analyses a quickly evolving policy area – the definition of baselinemethodologies under the Clean Development Mechanism (CDM) of the Kyoto Protocol.The CDM allows industrialised countries to acquire emissions credits (CertifiedEmission Reductions, CERs) from projects that reduce greenhouse gas emissions indeveloping countries. To prevent issuance of fake CERs, a complex body of rules hasbeen developed that includes several checks and balances. In this context, the situationthat would have prevailed if the CDM project had not taken place is of crucialimportance. If the baseline is overestimated, the amount of CERs issued will also be toohigh. In the Marrakech Accord of 2001 which defines the implementation rules of theKyoto Protocol, only three principles for baseline setting are given. The detailed rulesare developed in a bottom-up process that involves submission of a draft baselinemethodology by the developer of the first project of a specific type. During the last 12months, methodologies have been submitted for a wide range of projects and manysubmissions have been refused. Particularly the question of additionality, i.e. whether aproject would have happened anyway or is only developed due to the CDM incentive,has taken prominence.
Felicia Müller-Pelzer compares the different methodologies and gives their firstcomprehensive analysis. She has profited from working with the UNFCCC Secretariatduring preparation of this report and thus was able to get rare first-hand insights in themethodology development process. As the CDM can only become relevant if thebaseline methodology setting process is objective and transparent, this research both haspolicy relevance and also direct importance for project developers.
Axel MichaelowaHead of Programme International Climate Policy

2
ABSTRACT
This paper explores chosen CDM methodologies for methane recovery and electricitygeneration regarding their additionality assessment.
First, a brief outline of the historical evolution will be given and the three flexibilitymechanisms (the Emission Trading, the Joint Implementation and the CleanDevelopment Mechanism) will be defined. Against this background, the paper willillustrate the working of the CDM, discuss the additionality concept, show limitations ofthe additionality assessment and explain the impact of the baseline setting.
Second, chosen methodologies will be compared and explored with the aim to identifyproblems of implementation. In order to make the analysis understandable, a firstsection explains how the methodologies were chosen. This section is then followed by abrief description of the underlying project activities. Subsequently, the author willoppose and discuss the different paths taken by the methodologies. In doing so,contradictions will be identified. Some methodologies go further than others. Some arevery general in their approach and others are very project specific. These findings revealthe potential for further generalization and simplification of the methodologies.
In addition, the comprehensive evaluation makes it possible to draw conclusions aboutthe outcome of the methodologies and to identify problems with implementing theultimate objective of the United Nations Framework Convention [UNFCCC (1992),Article 2]. The main problem lays in the information asymmetry. But inaccuracies inquantitative and qualitative assessments also affect the outcome of the methodologies.Further, a distortion of the results can be provoked by an inadequate setting of theboundaries, an inaccurate leakage assessment and related uncertainties. Finally, theemission reductions can only be estimated correctly if an appropriate method is chosento calculate the emission reductions.
Moreover, alternative proceedings to the present UNFCCC methodology approach andtheir possible impact on the CDM will be briefly discussed. Based on these results, theauthor will make suggestions on how to proceed in the future, especially how tocoordinate and consolidate the methodologies. A simplified approach will berecommended to guarantee an effective additionality assessment and an efficientstructure.
3
1. INTRODUCTION
Climate change is a problem of global scale significantly increasing the level ofuncertainty of ecological and economical conditions, undermining the forecasts forgrowth and development and thereby threatening global prosperity. Recent climatemodels and results from extensive scientific research show, that the impacts of climatechange are likely to be serious. It is extremely probable that the anthropogenicgreenhouse gas emissions play a significant role in this process.
Global warming is provoked by an increased concentration of greenhouse gases in theatmosphere1, such as CO2, CH4 and N2O. Emissions arise in all the sectors of aneconomy2, especially industrial processes, the building sector, the traffic and transportsector as well as in the agriculture sector.
Possible impacts consist of a variety of non-linear changes:Due to the thermal expansion of water3 and the polar melting process, the sea levelincreases and threatens the most low-lying countries (e.g. Bangladesh, small islandstates) exposing them to the risk of becoming totally or partially submerged. Theweather, too, will become more extreme: the differences in temperature will becomegreater; the winds will get stronger and take new routes causing storms to occur moreoften. Terrestrial and aquatic ecological systems are thus vulnerable and some specieswill not be able to adapt to the altered climate. The consequence is an increased dangerto biodiversity.
But also socio-economic systems like forestry, fisheries and agriculture are threatened.Through a shifting of the temperature zones, the output of agriculture changes and thefood provisions become insecure. Health risks will increase because of a tightenedsupply of drinking water. This induces that epidemics such as malaria and cholera willincreasingly appear.
Still, it is controversial what exactly will happen in future: With which probability, howfast and in which dimension will these developments take place? The knowledge ofnatural variability is still fragmentary. This is why the anthropogenic contribution toclimate change is not yet clearly determinable. However, the Intergovernmental Panel
1 See Forner, Claudio (2004)2 See Michaelowa, Axel / Dutschke, Michael (2002), p. 23 See Forner, Claudio (2004)

4
on Climate Change (IPCC) states that “a discernible human influence on climate”4 is ofa high probability.
Indisputably, the biggest polluters today are the industrial countries and therefore carrythe main responsibility. This is all the more the case as the traditionally disadvantageddeveloping countries (and above all the least developed countries (LDC) are especiallyexposed to the negative impacts and will carry the biggest burden. However, in thefuture, the developing countries are likely to become the bigger polluters, as theiremissions are rising at a very high rate.5
This is a typical constellation of an open access regime from which nobody can beexcluded, not even if social welfare is damaged. The polluter behaves as he does,because he does not directly feel the effect of his behaviour: On the one hand, thechanges take place with a large time lag, and on the other hand, the negative impacts donot affect only him, but the whole society.
Against this background, the United Nations Framework Convention on ClimateChange (UNFCCC) has established a global action plan to mitigate GHG emissions inorder to protect and conserve the climate. The ultimate objective of the Convention6 isto stabilize the atmospheric GHG concentration at a safe level and at the same time toenhance sustainable development. However, the Convention failed to set binding targetsand therefore, the implementation has suffered difficulties.
To strengthen the work of the UNFCCC, the Kyoto Protocol was created. The industrialcountries and the economies in transition (EITs) committed themselves to reducing theiremissions to 5.2% below 1990 emissions level. The developing countries refused toadopt mitigation targets. In fact, the developing countries face a dilemma: On the onehand, the worldwide mitigation activities are of their special interest, because there is ahigh degree of probability that the developing countries will suffer most from climate
4 IPCC (1995), chapter 85 See Forner, Claudio (2004)6 See UNFCCC (1992), Article 2: “The ultimate objective of this Convention and any related legal
instruments that the Conference of the Parties may adopt is to achieve, in accordance with the relevantprovisions of the Convention, stabilization of greenhouse gas concentrations in the atmosphere at alevel that would prevent dangerous anthropogenic interference with the climate system. Such a levelshould be achieved within a time-frame sufficient to allow ecosystems to adapt naturally to climatechange, to ensure that food production is not threatened and to enable economic development toproceed in a sustainable manner.

5
change.7 But on the other hand, they fear their growth prospects will be burdened byentering into binding commitments.
But this conflict could be diminished, because of the three flexibility mechanisms thatwere created to facilitate the ratification of the Kyoto Protocol. These “KyotoMechanisms” shall allow a sustainable and efficient reduction of the GHG emissionswith the least possible social cost. One of these instruments is the Clean DevelopmentMechanism (CDM), which is of the highest interest for the developing countries. Itenables them to attract foreign investments to their countries in order to enhancesustainable development and reduce GHG emissions. In return, the investors obtaincertificates, the Certified Emission Reduction Units (CERs), which the industrialcountries can use to meet their emission reduction commitments. The CDM projectactivities have to be submitted to the CDM Executive Board (EB), which decides, ifthey deserve to be promoted.
This paper will analyse the first step in the process of acceptance of CDM projectactivities, which is currently taking place: the creation of methodologies. Thesemethodologies will be the basis for assessing project activities submitted to the EB.Therefore, it is crucial that the proceedings of the methodologies are cost-efficient andeffective regarding the achievement of the two main goals: the identification of projectactivities leading to additional emission reductions and the enhancement of sustainableinvestments. Additionality here means, that the emission reductions result from theimplementation of the project activity and that this project activity would not haveoccurred without the CDM.
As the creation of the methodologies is still in process, there are no reliable results (e.g.on the outcome of the methodologies or on related costs) from implemented projectactivities yet available. This is why it is not yet possible to measure the quality of themethodologies. This will only be the case, when the first project activities have beenaccepted and the assessment based on the methodologies has taken place. Therefore, anexplicit cost benefit analysis cannot be presented in this paper; neither the costs nor thebenefits are foreseeable. As a result, this paper will not provide an exact quantificationof costs and benefits of the current “proposed new methodologies”. It is rather theobjective to show, where critical issues exist in the additionality assessment. Thequality of the methodologies will be estimated analysing chosen methodologies andreferring to official UNFCCC documents as well as to specialized literature. The
7 See Michaelowa, Axel / Dutschke, Michael (2002), p. 1

6
proposed new methodologies and the UNFCCC documents are publicly available on theUNFCCC website. As the CDM is a fast developing subject of a high actuality, articlesdealing with the CDM and the additionality issue have been continuously published.The articles that were used for this paper were published above all by scientificinstitutes in newspapers and/or online.
In research, two main positions can be identified: Some authors, e.g. Michaelowa8,defend that the additionality assessment of a CDM project activity has to rely on a testof investment additionality in order to exclude free riders. Others, e.g. Rentz9, believethat this approach neglects risks and barriers to investment, and further leads to a verylow participation and the dominance of a phenomenon called the Grubb’s paradox (referto the section 2.2.2.3). The Grubb’s paradox means that the least efficient projects arethe most likely to be accepted. Instead, they propose, above all, to enhance participationto make the CDM workable.
Most of the articles used refer to economic literature, while some are based on studieson similar processes of project acceptance. For example, they analyse the admissionprocess of the Activities Implemented Jointly (AIJ), which are the forerunner of theCDM and the JI project activities. Moreover, the admission process of the MultilateralFond (MLF) and the one of the Global Environmental Facility (GEF) are analysed.Experience gained from Demand Side Management (DSM) programs in the UnitedStates is also used.10 However, the similarities between these programs and the CDM,especially concerning the additionality test, are not sufficient. The cited programs werelaunched earlier and disposed of less practical experience, which explains why theirassessment is not as far-reaching as it is now claimed for the CDM methodologies. Theyrepresent more a pre-step in the discussion.
During the past years, the additionality definition has gained clearness and the demandfor accuracy of the assessment has grown steadily. Against this background, this paperapproaches the subject analysing the currently submitted methodologies. Together withthe experience gained from other programs, it is possible to estimate the tendency ofthe methodologies’ outcome. In the future, with a clear definition of additionality, withwell structured assessment procedures and with the experience from the first
8 See Greiner, Sandra / Michaelowa, Axel (2003), p. 5ff.9 See Rentz, Henning (1998)10 See Sugiyama, Taishi / Michaelowa, Axel (2000), p.7

7
implemented project activities, the outcome of the methodology approach will be easierto measure. The methodologies can then be accordingly adjusted.
In this paper, the first look will be at the issue of the additionality under the historicaldevelopment and the discussion in literature. At the beginning, there will be a briefoutline of the historical evolution and a presentation of the three flexibility instruments.Then, the working of the CDM will be explained and the concept of the additionalitywill be discussed, comparing different interpretations of additionality, showing thelimits of the additionality assessment and explaining the impact of the baseline setting.
Second, chosen methodologies will be analysed in order to draw conclusions referringto the output of the methodologies, as well as to show the difficulties and to makesuggestions for improvement. In order to make the following analysis understandable,the process of how the methodologies were chosen will be explained and the underlyingproject activities will be briefly summarized. Next, the results of the comparativeanalysis will be presented. The different paths taken by the methodologies will beopposed to each other and discussed. In doing so, contradictions can be identified. Somemethodologies go further than others. Some are very general in their approach andothers are very project specific. As a next step, conclusions will be drawn from theanalysis, and problems with implementing the ultimate objective of the Convention willbe identified. It will then be briefly discussed, what alternative proceedings to thepresent methodology approach could have been chosen and how this would probablyhave influenced the outcome of the CDM. Based on these results, suggestions will bemade on how to proceed in the future. A simplified approach will be recommended toguarantee an effective additionality assessment and an efficient structure.
2. THE CONCEPT OF ADDITIONALITY OF THE CDM AND THEMETHODOLOGY APPROACH
2.1 The History of Negotiations
2.1.1 From the Conference in Rio until Today
The global movement for protection of the world climate began during the 1980’s. Itwas initiated by the first oil crisis and became public through the report “Limits toGrowth” by the Club of Rome in 1972. In its statements, the Club of Rome came to thedark result that by the year 2000 all the world's energy resources would be consumed.

8
As a result of this declaration, populations started panicking. Continuous growth ofeconomies was called into question, because it was supposed that the relationshipbetween growth and energy consumption was irreversible. However since the 1960’s,due to enhanced energy efficiency, an uncoupling of growth and energy needs can beobserved. This is why limiting growth is no more in the focus of scientific discussion toreduce growth, but reducing GHG emissions, which are a result from productiveprocesses of an economy.
By publishing its First Assessment Report in 1990, the Intergovernmental Panel onClimate Change (IPCC), founded one year before, placed the climate change problemfirmly on the global agenda. For the year 2100 it forecasted11, assuming no emissionreduction procedures take place, an increase in temperature between 1.5 and 4.5 °C andan increase of the sea level ranging from 70 to 100 cm. The IPCC declared thatimmediate emission reductions by 60% were required in order to stabilize theconcentration of greenhouse gases at the level of that time (1990)12. In 1995, however,the second IPCC report made slightly more moderate forecasts, predicting an increase intemperature between 1 and 3.5°C and an increase of the sea level ranging from 15 to 95cm. Nevertheless, even those more moderate values were considered as threatening.
Against this backdrop, the United Nations Conference on Environment andDevelopment (UNCED) took place in Rio de Janeiro in 1992. During this conference aworld treaty, entitled the United Nations Framework Convention on Climate Change(UNFCCC) was drawn up and the Conference of the Parties (COP)13 was established asthe supreme body of the Convention. In spite of a “lack of full scientific certainty”, theUnited Nations recognised an urgent need to face the “threats of serious or irreversibledamage” to the climate system.14 But the UNFCCC on its own, being a non-bindingagreement, turned out to be insufficient in avoiding dangerous interference with theclimate system. The final declaration made in 1995 at COP1, known as the BerlinMandate, called for the strengthening of the UNFCCC by establishing specific andbinding targets and timetables for developed countries.
During the third Conference on Climate Change in sequence, COP3 in Kyoto, a far-reaching decision was made: The intense political negotiations culminated in the
11 See Dutschke, Michael / Michaelowa, Axel (1998): Der Handel mit Emissionsrechten für Treib-
hausgase, p. 1612 See UNFCCC (1992), Article 4 (2b)13 For a list of all the COPs see Annex 1 of this paper.14 UNFCCC (1992), Article 3.3

9
adoption of the so called “Kyoto-Protocol”. The Parties listed in Annex I of the KyotoProtocol agreed to accept specific, binding emission targets for the period 2008-2012.The mitigation requirement is defined as the difference between Business-As-Usual(BAU) emissions in 1990 and the maximum emissions allowed (assigned amount) bythe Protocol. The emission targets refer to six different greenhouse gases known as the“Kyoto gases”: carbon dioxide (CO2), methane (CH4), nitrous oxide (N2O),hydrofluorocarbons (HFCs), perfluorocarbons (PFCs) and sulphur hexafluoride (SF6).15
The so called Annex I countries committed themselves to reducing their emissionsjointly by 5.2 % (base year 1990) until 2010; compared to what the IPCC reportsclaimed, this is a quite moderate target. Annex I countries are those that are mentionedin the Annex I of the UNFCCC16 and generally recognized as industrial economies oreconomies in transition (EITs). Non-Annex I countries are those that are recognized asdeveloping countries. The Non-Annex I countries refused to commit themselves tobinding emission targets because of their unstable economic state and their, in manycases, so far negligible emissions.
But the Kyoto Protocol cannot be enforced until it has been ratified by at least 55countries and covers at least 55% of the emission reduction targets. So far, 120countries have already ratified the Protocol but still only cover 44.2% of the emissionreductions.
The United States is estimated to account for roughly half to two thirds of the requiredERs under the Kyoto Protocol17 being the largest emitter of GHGs. US emissions havegrown steadily since 1990 and are expected to keep growing, whereas their mitigationcommitment is to reduce emissions by 7% referring to the level of 1990. On thecontrary, in most EITs, such as Russia, the Ukraine and a number of Eastern Europeancountries, emissions are predicted to stay below target levels even if no emissionreduction measures are undertaken. Due to prolonged economic recession, actualemissions are much lower than the targets and are unlikely to reach the target levelduring the commitment period.
15 Kyoto Protocol (1997), Annex A16 See Annex 3 of this paper.17 See Jotzo, Frank / Tanujaya, Olivia (2001), p. 1

10
This difference between Business-As-Usual (BAU) emissions and Kyoto targets iscalled hot air18, which is illustrated in Figure 119.
Although estimates concerning the size hot air will reach vary widely, there is littledoubt that hot air will be substantial.20 If Russia would ratify the Kyoto Protocol, morethan 55% of the emission reductions would be covered and the Protocol could enter infoforce. Russia’s economy would profit from the ratification, as it could act as the biggestsupplier of certificates on the market. As a result of its economical collapse, Russiadisposes of a lot of hot air. The reduced energy consumption is a concomitant of thedecline in industrial production in Russia. Therefore, Russia could profitably sell theamount of certificates based on economic data of 1990 at the market and thereby notchup a strong competitive advantage. However, without the ratification of the UnitedStates, hot air could become an important threat for the whole CDM program. In fact, itcould probably crowd out the entire CDM, as the demand for credits on the globalcarbon market would then be inferior to the overwhelming offer consisting of a hugepart of hot air from the EITs.
18 “Hot air” is called the difference between emission allowances provided to countries and the
forecasted emissions, when emissions are predicted to stay below Kyoto target levels even if noemission reduction measures are undertaken.
19 See Michaelowa, Axel (2001), p. 520 See Jotzo, Frank / Tanujaya Olivia (2001), p.1f.
Emission target - BAU emissions = Hot air
1999 2000 2008 2010
BAU emissions path
Emissions
Kyoto budget
Hot airTarget
Time
Figure 1: Hot Air

11
Once the Kyoto Protocol has entered into force, the first Meeting of the Parties (MOP)will take place. The parties admitted to this meeting will be all the countries that haveratified the Kyoto Protocol. It is highly likely that not all Annex I countries will beallowed to participate, so that the Parties taking part in the MOP can differ from theParties of the COP. Nevertheless, the COP will also serve as the MOP for cost savings.The MOP will thus take place in connection with the COP, but will exclude all Partiesnot having ratified the Kyoto Protocol. Therefore, reference will be made to theseconferences as COP/MOP21.
In order to speed the process up or, in the worst case, to prevent an entire failure of theagreement, Parties decided to introduce three flexibility mechanisms (the EmissionTrading, the Joint Implementation and the Clean Development Mechanism) in advancewithout the Kyoto Protocol having entered into force. In doing this they intend toimprove applicability and allow for an early start of the Protocol. At COP4 (1998), theParties agreed on a work program (“Buenos Aires Plan of Action”) to elaborateprinciples, modalities, rules and guidelines for the implementation of the KyotoProtocol including the three flexibility mechanisms. However, they failed to produceresults until COP6 (The Hague, November 2000), which is why the negotiating duringthe conference turned out to be unsuccessful and was forwarded to COP6 part II whichtook place in Bonn in July 2001. The result of this conference was the “BonnAgreements”, which reflected consensus on many key issues, however, many detaileddecisions had to be postponed to COP7 (2001) in Marrakesh. Finally, COP7 can bedescribed as a break through for the implementation of the Kyoto Protocol and theflexibility mechanisms. The Parties adopted a package of decisions (“MarrakeshAccords”), and made recommendations for COP/MOP1. Detailed baseline rules wereleft to be defined by the CDM Executive Board (EB), which supervises the CDM underthe guidance of the COP/MOP.22 The EB members were immediately elected by theCOP in Marrakesh, and the EB even had its first meeting at the end of the conference.The EB is responsible for recommendations on further modalities and procedures oramendments, issues surrounding new methodologies, reviewing positions with regard tosimplified methodologies and procedures, the accreditation process of DesignatedOperational Entities (DOE’s), the public availability of information, and informationdatabases and registries surrounding the CDM. As the EB has to comply with all thesetasks, it has the right to establish panels to help to bring their work forward23. Three 21 See Kyoto Protocol (1997), Article 12.422 See Decision 17/CP.7, Annex, para. 523 See Decision 17/CP.7, Annex, para. 18: “The Executive Board may establish committees, panels or
working groups to assist it in the performance of its functions. The Executive Board shall draw on the

12
expert panels were created at the fifth session of the EB: the Accreditation Panel (CDM-AP), the Small Scale Panel (SSC Panel) and the Methodology Panel (Meth Panel)24.Regarding the CDM baseline and monitoring methodologies, the EB has approved nineof the 35 proposed new methodologies (NM0001, NM0004, NM0005, NM0007,NM0010, NM0016, NM0019, NM0021, and NM0023), but in none of the cases withoutmaking changes to the proposals.25
2.1.2 The Instruments of Flexibility
The three “Kyoto mechanisms”26 were designed at COP4 to promote a prompt start ofthe Protocol from which an increased research and development on climate friendlytechniques is expected. These three instruments shall help Annex I countries tocooperate with other countries to achieve their emission targets at the least possible cost.
The flexibility mechanisms are largely perceived as a strength of the Kyoto Protocol.They embody the concept that mitigation activities translate into instruments calledcarbon credits, which can be traded between countries, and/or between entities toachieve the quantified emission limitations and reduction commitments. The threeflexibility mechanisms aim at reducing the mitigation costs by offering the Parties theopportunity to cut emissions more cheaply abroad than at home. Annex I countries cancut emissions where it is the cheapest to do so, as the impact on the global atmosphereremains the same. Profound differences between the countries in e.g. energy sources,energy efficiency and waste management are responsible for the differences in themarginal costs of emission reduction.
The following two figures (Figure 2 and Figure 3) illustrate how costs can be saved dueto the use of the flexibility mechanisms:
Two cases can be distinguished: Figure 2 refers to the situation when both countrieshave committed themselves to reducing emissions (for simplification, both countries
expertise necessary to perform its functions, including from the UNFCCC roster of experts. In thiscontext, it shall take fully into account the consideration of regional balance.”
24 See http://cdm.unfccc.int/EB/Panels, 2003-12-27: “The Executive Board at its fourth meeting 9-10June 2002 held in Bonn, agreed to establish the panel which is to develop recommendations to theBoard on guidelines for methodologies for baselines and monitoring plans (Meth Panel)…”
25 As at 15 November 200326 See Dutschke, Michael / Michaelowa, Axel (1998): Der Handel mit Emissionsrechten für
Treibhausgase, p.16ff.

13
have the same reduction target in Figure 2)27, while Figure 3 shows the situation whenone country is committed to reducing (e.g. an Annex I country) and the other country(e.g. a Non-Annex I country) is not.
In both situations, the marginal costs of emission reduction in Country A (MC Country A)are high compared to the marginal costs of Country B (MC Country B). As the globalemissions limit is fixed (ER Target), Emission Trading (ET) leads to a reduction ofdomestic mitigation in the high-cost country and to a rise in emission reductions in thelow-cost country. Thus, the total amount of emission reductions is achieved with theminimal total costs (light grey area). This generates a increase in social welfare (darkgrey area).
27 See Dutschke, Michael / Michaelowa, Axel (1998), p. 62
Figure 2: Total Mitigation Costs (both countries committed to reducing emissions)
Amount of ER Units
Cost / ER Unit
ER TargetCountry B Country A
MC Country A
MC Country B
Cost Curve Country A
Cost Curve Country B
Increase in Social Welfare

14
In order to be eligible to participate in the flexibility mechanisms, the Parties need toratify the Kyoto Protocol and comply with the methodological and reportingcommitments. Apart from public entities, private entities are also allowed to participateunder the responsibility of their governments.
The three flexibility mechanisms are:• the Emission Trading (ET),• the Joint Implementation (JI), and• the Clean Development Mechanism (CDM)
All three flexibility mechanisms allow credits to be gained from action taken in othercountries. The Assigned Amount Units (AAUs), the Removal Units (RMUs) theEmission Reduction Units (ERUs) and the Certified Emission Reductions (CERs) areaccounting equivalents. Each unit is equal to one metric tonne of emissions (measuredin CO2 equivalents28). AAUs are issued on the basis of an assigned amount29. RMUs
28 For a table of the global warming potential of the greenhouse gases relative to carbon dioxide, see
Annex 2 of this paper
Figure 3: Total Mitigation Costs (Country A committed, Country B not committed)
Am ount of ER Units
Cost / ER Unit
ER Target
Country B Country A
M C Country A
Cost Curve Country A
Cost Curve Country B
Increase in Social W elfare
C o s t / E R U n it
15
are issued on the basis of sink activities30. ERUs originate from JI activities and CERsfrom CDM activities.
Emissions Trading (Article 17, Kyoto Protocol):“International Emissions Trading” (IET) allows countries with emission targets to tradecarbon credits. Under Emissions Trading, certificates are bought and sold on the globalcarbon market. Offer and demand create a market price for emissions resp. emissionreductions, which reveals the marginal costs of abatement throughout the economy.According to its specific cost structure for reducing emissions, a country can either buyAAUs (when its costs of emission reduction are higher than the market price of thecertificate) or sell AAUs (when it is cheaper for the country to reduce emissions than toacquire AAUs at the global carbon market). In a working market, countries with lowerreduction costs will reduce more emissions than countries with higher reduction costs.Thereby social costs are minimized and a social optimum can be reached. Similarly,ERUs from Joint Implementation activities, CERs from Clean Development Mechanismactivities and RMUs from sink activities can be transferred and acquired. Parties musthold a minimum of certificates in their national registry for security reasons.
Joint Implementation (Article 6, Kyoto Protocol):JI projects are undertaken by an Annex I Party and take place in the territory of anotherAnnex I country. JI projects can either be investments in emission reduction orsequestration. They have to lead to additional emission reductions or removals forwhich the investing Party earns ERUs. If the PPs do not respect the compulsory annualreview, or if the reviews have not been draw up on the basis of the binding guidelines,ERUs will not be generated. Nuclear projects are not eligible and sink projects have toconform to the rules on land use, land-use change and forestry sector. ERUs under JIcan only be generated from 2008 onwards.
Clean Development Mechanism (Article 12, Kyoto Protocol):The CDM is a mechanism for clean development within countries without bindingemission reduction targets. It has been designed to involve developing countries into theclimate change debate and to enable them to voluntarily commit themselves to reductiontargets. At the same time, the CDM gives Annex I Parties the opportunity to invest inNon-Annex I countries, and to get as a return “Certified Emission Reductions” (CERs),which they are able to use to meet their emission targets. Thereby, the CDM assists
29 See Kyoto Protocol (1997), Article 3.7 and 3.830 See Kyoto Protocol (1997), Article 3.3 and 3.4

16
developed countries in complying with their reduction commitments at the lowest cost.These investments have to provide benefits to the host country31 concerning GHGmitigation plus increased potential for economic growth and sustainable development inthe host country. The CDM is expected to promote project activities that involve anenvironment-friendly technology transfer to the host country. Independently from this,the technology and financial transfer commitments of Annex II Parties of the KyotoProtocol are separate and remain valid.32 As in the case of JI projects, CDM projectactivities have to lead to additional emission reductions or removals. The approval of allParties is needed to launch a project activity33 under the CDM. The approval may begained from the Designated National Authorities (DNAs)34. At COP9 modalities andprocedures for afforestation and reforestation activities have been specified for the firstcommitment period. Up to 1% of the Party’s emissions in its base year may be achievedby forest management activities including potential CDM sink projects. Nuclearactivities are not eligible under the CDM. To allow a prompt start to the CDM, CERsobtained through project activities from the year 2000 up to the commencement of thefirst commitment period can be issued as soon as the Kyoto Protocol enters into force.The EB is the supervisory body of the CDM and operates itself under the authority ofthe COP/MOP. It is composed of 6 representatives from Non-Annex I countries and 4from Annex I countries. The key tasks of the EB are first to accredit operational entities,which will validate the project and verify the monitoring, second to develop simplifiedmethodologies for small scale project activities and third to approve or reject proposednew baseline and monitoring methodologies.
Nevertheless, three main weaknesses of the Kyoto mechanisms are discussed:First, emission reductions abroad reduce efforts made in home countries and hinderimprovements of the domestic environmental situation. On a global level, this isirrelevant; however, it makes a difference for domestic policies.
Second, above all NGO’s argue that certificates for emissions lead to the perception thata “right to emit” exists. The Marrakesh Accords reject this reproach by declaring that
31 See Kyoto Protocol (1997), Art. 12, 3a32 See UNFCCC (1992), Article 4 (5); see Annex 5 of this paper33 See UNFCCC website, the CDM PDD Glossary of terms: “A project activity is a measure, operation
or an action that aims at reducing greenhouse gases (GHG) emissions. The Kyoto Protocol and theCDM modalities and procedures use the term “project activity” as opposed to “project”. A projectactivity could, therefore, be identical with or a component or aspect of a project undertaken orplanned.”
34 See UNFCCC website, Designated National Authorities

17
the Kyoto Protocol has not established any “right, title or entitlement”35 to emit, on thecontrary, it has introduced an obligation to reduce emissions. Tradable certificates try tointegrate external effects by giving a price to emissions that so far are for nothing.External effects are a consequence of either unclearly defined property rights or ofproperty rights where enforcement is accompanied by prohibitively high costs. In thecase of external effects, undesirable relationships between market players appear. Ifthere are no satisfying private agreements to internalize these externalities (e.g. becauseof the related high transaction costs), market allocation is negatively affected.
Finally, there is the criticism that the Kyoto mechanisms do not entirely guarantee theadditionality of the emission reductions. In the Marrakesh Accords, additional emissionsare defined the following:
“Emission reductions are considered to be additional, if - measuredagainst the baseline - they are additional to those that would have occurredin the normal course of events.”36
Fictitious credits (e.g. from hot air or tropical air37) are not related to emissionreductions which go beyond those of the reference case. This shows that the implicitrecognition of fictitious credits contradicts the concept of additionality and is thereby adefinite limitation of the Kyoto mechanisms.
2.2 The Clean Development Mechanism
2.2.1 Definition
The CDM is an international instrument that consists of two components: it has beenconceived to promote cost-effective climate change mitigation, along withsustainable development in Non-Annex I countries.
The fulfilment of the second component lays in the responsibility of the host country.An assessment of this aspect by an independent operational entity is considered to be
35 Marrakesh Accords (2001), Decision -/CP.7 (Mechanisms), Principles, nature and scope of the
mechanisms pursuant to Articles 6, 12 and 17 of the Kyoto Protocol, p. 5136 Kyoto Protocol (1997), Article 12.5c37 “Tropical air” is the term for credits generated from CDM project activities without representing
additional emission reductions.

18
very costly. As this aspect is one of the most important reasons for a developing countryto take part in a CDM project activity, the EB considered it appropriate to put thedecision into the hands of the host country if the criteria for sustainable development ofthe project activity are fulfilled38. This is criticised by many NGO’s. They argue thatthe ecological and social interdependencies are often not sufficiently controlled by hostcountry governments. Therefore, the World Wildlife Fund (WWF) has created a labelcalled “Golden Standard” for project developers that apply stricter modalities andprocedures. The Golden Standard stands for a higher quality in sustainable developmentcontrol.
Annex I countries have committed themselves to reducing emissions for the period2008-2012. Yet, it does not matter where these emission reductions are achieved. Byparticipating in the CDM, Annex I countries get the opportunity to transfer the anywaybinding emission reductions to Non-Annex I countries. For Annex I countries, it isattractive to invest in state-of-the-art technologies in developing countries because ofthe bigger GHG mitigation potential. The reference technology in developing countriesis typically more carbon-intensive39 than in an industrial country. This leads to a highercost-effectiveness of mitigation investments in developing countries. The reductionachieved through the same project in a developing country is bigger than it would be inan industrialised country. One unit in emission reductions in the developing countrycosts less than in the Annex I country.
Especially in poorly developed markets, financial incentives provided through CDMprojects can help project participants40 (PPs) to cover the higher costs of the newtechnologies or help to remove market barriers. Thereby, the CDM supports the
38 See Decision 17/CP.7, pre-ambular part: “Affirming that it is the host Party's prerogative to confirm
whether a clean development mechanism project activity assists it in achieving sustainabledevelopment”; para. 40a): “The designated operational entity shall […] (p)rior to the submission ofthe validation report to the executive board, have received from the project participants writtenapproval of voluntary participation from the designated national authority of each Party involved,including confirmation by the host Party that the project activity assists it in achieving sustainabledevelopment”.
39 The Carbon intensity is the amount of carbon emissions released per unit of energy. Developingcountries still rely heavily on traditional carbon intensive energy sources (coal, oil and natural gas),whereas in the industrial countries, a process of decarbonisation due to technological progress istaking place.
40 See UNFCCC website, the CDM PDD Glossary of terms: “In accordance with the use of the termproject participant in the CDM modalities and procedures, a project participant is either a Partyinvolved or, in accordance with paragraph 33 of the CDM modalities and procedures, a private and/orpublic entity authorized by a Party to participate, under the Party’s responsibility, in CDM projectactivities.”
19
developing countries in pursuing sustainable economic growth from the start41. Unlessthe developing countries do not receive part of the CERs, which they can sell at themarket, the only incentives for them to engage in the CDM are the positive impacts onlocal development such as capital transfer, capacity building, job creation, and reducedpollution of the local environment42.
2.2.2 The Concept of Additionality
2.2.2.1 Why Additionality Assessment?
Why is additionality such an important issue? Why does additionality not need to betested for emission reduction activities in the same Annex I country? Why does itbecome decisive, when emission reductions are achieved in another country?
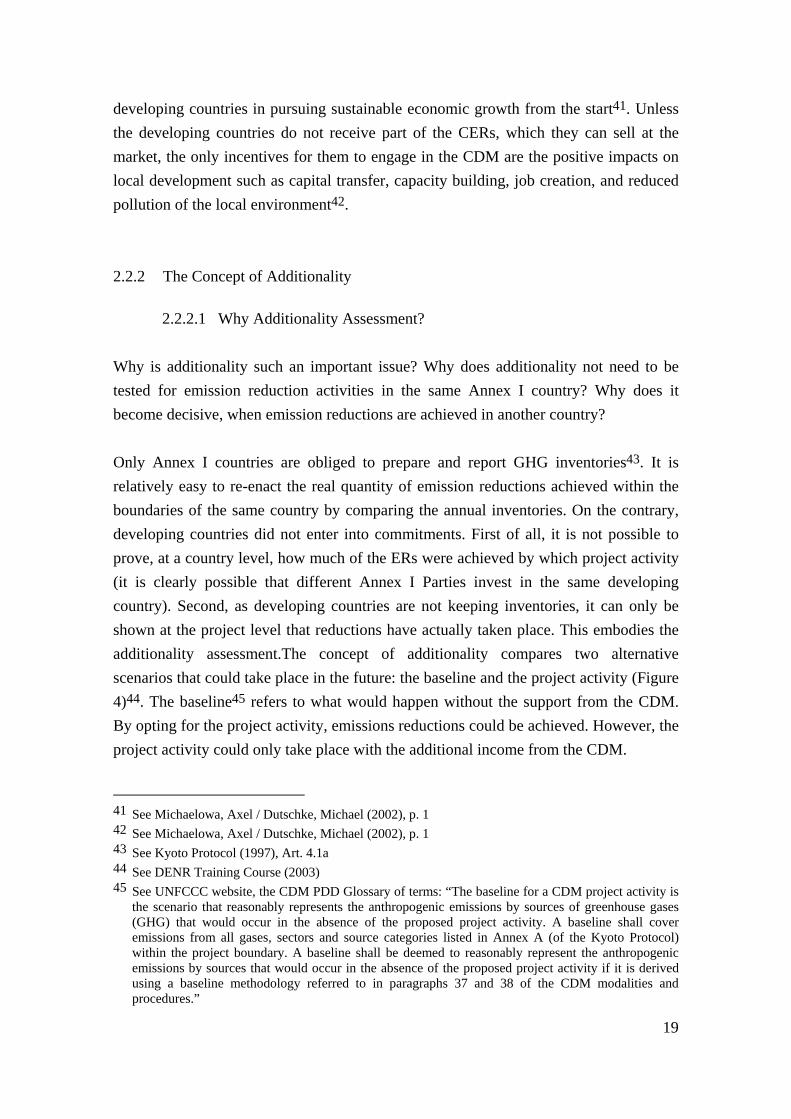
Only Annex I countries are obliged to prepare and report GHG inventories43. It isrelatively easy to re-enact the real quantity of emission reductions achieved within theboundaries of the same country by comparing the annual inventories. On the contrary,developing countries did not enter into commitments. First of all, it is not possible toprove, at a country level, how much of the ERs were achieved by which project activity(it is clearly possible that different Annex I Parties invest in the same developingcountry). Second, as developing countries are not keeping inventories, it can only beshown at the project level that reductions have actually taken place. This embodies theadditionality assessment.The concept of additionality compares two alternativescenarios that could take place in the future: the baseline and the project activity (Figure4)44. The baseline45 refers to what would happen without the support from the CDM.By opting for the project activity, emissions reductions could be achieved. However, theproject activity could only take place with the additional income from the CDM.
41 See Michaelowa, Axel / Dutschke, Michael (2002), p. 142 See Michaelowa, Axel / Dutschke, Michael (2002), p. 143 See Kyoto Protocol (1997), Art. 4.1a44 See DENR Training Course (2003)45 See UNFCCC website, the CDM PDD Glossary of terms: “The baseline for a CDM project activity is
the scenario that reasonably represents the anthropogenic emissions by sources of greenhouse gases(GHG) that would occur in the absence of the proposed project activity. A baseline shall coveremissions from all gases, sectors and source categories listed in Annex A (of the Kyoto Protocol)within the project boundary. A baseline shall be deemed to reasonably represent the anthropogenicemissions by sources that would occur in the absence of the proposed project activity if it is derivedusing a baseline methodology referred to in paragraphs 37 and 38 of the CDM modalities andprocedures.”

20
According to that, these ERs would not take place without the CDM and are thereforeadditional. Emission reductions have to be credible, that is to say real, measurable andlong-term46 in order to meet the sustainability criterion.
EmissionReductions
CO2 Emissions
CDM project CO2 emissions (observable)
Real, measurable& long-termAdditional
Years
Baseline scenario CO2 emissions
(that would occur)
}
Free riding: PPs that claim credits for a project activity that would have beenundertaken anyway and is thereby not additional, are called free riders. If not identified,they get credits for their normal behaviour. These CDM credits going to free riders failtheir target of creating incentives for mitigation activities. For climate change, the CDMis an emission neutral mechanism. As the amount in emission reductions istheoretically predetermined by the official emission targets, free rider effects in relationto the CDM lead to a deviation from the reduction targets and thus to an increase inGHG emissions. Lazarus, Kartha et al. (2000) point it out:
“It is […] imperative that policy makers devise and adopt a CDM regimethat effectively encourages legitimate projects, while rigorously screeningout non-additional activities.” 47
46 See Kyoto Protocol (1997), Article 12.5b47 Bernow, Steve / Kartha, Sivan / Lazarus, Michael / Page, Tom (2000), p. ES-3
Figure 4: Additional Emission Reductions

21
In order to reduce this risk, Parties intend to allow the CDM crediting, only until acertain percentage of a country’s emission target is reached48.
The opposite of free riding is free driving: These are positive impacts of the CDM onclimate change without credit generation. For example, the adoption of energy-efficientCDM technologies could change the public perception and establish a generallyaccepted standard for companies to select less carbon-intensive technologies instead ofthe conventional ones. If used more frequently in developing countries, regenerativeenergies will probably face fewer barriers of implementation like limited informationand a lack in skilled labour. The CDM could thereby even enhance the general marketadoption rate for new technologies. In addition to that, the existence of a mitigationpotential in the developing countries would be demonstrated by the number of CDMproject activities and possibly push the developing countries towards bindingcommitments. A country where a big number of CDM projects are undertaken entersinto argumentative difficulties when trying to maintain that there is so far no reductionpotential in the country. For scientific analysis, a drawback is that free driving isdifficult to measure.
Dealing with additionality, it is crucial to clearly separate on the one hand the definitionof additionality and, on the other hand, the assessment of additionality.49 In thefollowing, different interpretations of the additionality concept will be discussed andlimitations to the additionality assessment will be shown.
2.2.2.2 Interpretations of the Additionality Concept
Additionality is defined by the Kyoto Protocol as the central criterion for the acceptanceof a project activity under the CDM. The COP defined additionality as following:
“A CDM project activity is additional if anthropogenic emissions ofgreenhouse gases by sources are reduced below those that would haveoccurred in the absence of the registered CDM project activity.”50
48 See Kyoto Protocol (1997), Art. 12.3b49 See Forner, Claudio (2004)50 Kyoto Protocol (1997), Article 12, para. 5 (3)

22
However, it has not been officially declared so far, which criteria are to be consideredfor the assessment of additionality in the concrete cases. This definition is notsufficiently specific, so different interpretations of the additionality concept existsimultaneously, which partly overlap each other and lead to very different results. Themost prominent interpretations discussed in literature51 and during UN negotiations aredescribed below:
Activity Additionality and Intensity Additionality: The additionality concept consistsof two components: The activity additionality, which represents the qualitative view andthe intensity additionality, which is the quantitative view.
In the case of the activity additionality, the entire project activity has to be additional,i.e. if the project activity is different from what would happen in the baseline scenario, itis considered to be additional.
In contrast, however, the intensity additionality assumes that the activity additionality isgiven and only asks how much additional emission reductions are generated by theproject activity. If the quantity is positive, the project activity is considered to beadditional.
Investment additionality: Behind the concept of investment additionality stands theidea of a rational investor52 who facing alternatives chooses more value over less valueand prefers less risk over more risk. Based on this definition, investment additionalitymeans that the project activity, without the support from CDM, will not be undertakenbecause of not being the economically most attractive course of action. However, it iscloser to reality to assume that the investor makes his decisions under boundedrationality53. Then, it is possible that a project activity is not undertaken, due to barriersof implementation (e.g. lack of information and unavailability of credits for smallinvestors), although it would be the economically most attractive course of action.
When investment additionality is assessed, project activities with a negative net presentvalue (NPV) and those with a positive NPV are distinguished: If the project activity iseconomically unprofitable, i.e. it has positive implementation costs, it is referred to as
51 See Langrock, Thomas / Michaelowa, Axel / Greiner, Sandra (2000), p. 752 See Markowitz, Harry (1952)53 See Simon, Herbert A. (1957)
23
“economical regret”54 and is assumed to be additional. On the contrary, if the projectactivity is economically feasible, it is referred to as “economical no-regret” 55 and canonly be considered as additional, if there is a profound analysis of barriers showing thatit will not be implemented without the support from CDM.Deriving from this theoretical background, project activities can be classified into fourtypes56:
1) A project activity that has a negative net present value (NPV) without thesupport of the CDM is considered to be additional.
2) A project activity that has a positive net present value (NPV) without thesupport of the CDM, but whose internal rate of return would be inferior tomarket interest resp. the minimal reimbursement, is considered to beadditional.
3) A project activity that has a positive net present value (NPV) without thesupport of the CDM, whose internal rate of return is superior to marketinterest resp. the minimal reimbursement, but is of an unusually high marketrisk, which could not be reimbursed by the flow back of capital, can possiblybe considered as additional.
4) A project activity that has a positive net present value (NPV) without thesupport of the CDM, whose internal rate of return is superior to marketinterest resp. the minimal reimbursement, which can be reimbursed by theflow back of capital irrespective of an unusually high market risk cannot beconsidered as additional.
It is a question of how strictly investment additionality has to be interpreted to decide iftype 3 project activities are still additional. Type 1 project activities are clearly notprofitable without the CDM, provided that there is no existing policy making the projectactivity obligatory and there are no other development funds available. Type 2 projectactivities are also almost certainly additional, as they would not be undertaken undernormal market conditions. But type 3 project activities cannot be classifiedunambiguously by quantitative criteria, as risks cannot be measured objectively. Risksare always investor specific. Each investor has a different utility function and level ofrisk aversion. Type 4 project activities are indisputably non-additional, because they areprofitable and can be considered as identical to the BAU scenario. 54 See Shrestha, Ram M. / Timilsina, Govinda R. (1999), p. 74ff.55 See Shrestha, Ram M. / Timilsina, Govinda R. (1999), p. 74ff.56 See Shrestha, Ram M. / Timilsina, Govinda R. (1999), p. 74ff.; see Michaelowa, Axel / Fages,
Emmanuel (1999), p.17ff.
24
Criteria for additionality assessment can be derived from parameters like the IRR, theNPV and the payback period.
Environmental additionality: Environmental additionality is a term used by PPs fordescribing the situation when a project activity causes emission reductions, i.e. intensityadditionality. The problem was that the PPs did not address the activity additionality atall. They reduced the additionality concept only to question whether emissionreductions were taking place, without asking if these emission reductions would nothave taken place anyway57. This is why references to “environmental additionality”made by PPs in a Project Design Document (PDD) or a methodology were rejected bythe EB.
Financial additionality: This aspect of additionality is still discussed verycontroversially. At COP 7, it was decided that a project activity has to be financiallyadditional, i.e. it shall not divert other funds. A CDM activity should be additional toOfficial Development Assistance (ODA), Global Environment Facility (GEF) and otherfinancial commitments of Annex I countries58, because it could direct developmentassistance towards emission credit generating activities and away from other worthydevelopment objectives. However, it could happen that CDM investments are onlyattracted towards a developing country, because of the ODA or other public financing.
Behavioural additionality: According to Meyers59, behavioural additionality would bea better notion than investment additionality. Thereby, the author wants to make it clearthat barriers can determine investment decisions. In the end, investor’s behaviourwithout the CDM is relevant to determine the additionality and to show that the projectactivity is not the baseline. The concept makes sense, but putting it into practice facesthe same difficulty of assessment as the concept of investment additionality.
Technology additionality: Technology additionality means that more efficient andmore modern technology is introduced only because of the CDM. Behind thisconviction stands the idea that – because of market failure – there is not enoughinnovation taking place. This definition is close to a technocratic attitude, whichconsiders the technology curve (what is technologically feasible) as supply curve (what
57 See e.g. NM000358 See Decision 15/CP.7: “Emphasizing that public funding for clean development mechanism projects
from Parties in Annex I is not to result in the diversion of official development assistance and is to beseparate from and not counted towards the financial obligations of Parties included in Annex I.”
59 See Meyers, Stephen (1999), p. 3
25
is economically feasible)60. A technocrat would sustain that the decision of feasibilitydoes not refer to the whole product bundle, but to only one component, the technology.However, if the whole product bundle is attractive to consumers, it will catch on in aworking market. But if the market is distorted, it is indeed possible that such attractivetechnologies cannot be introduced.
Sustainable additionality: The CDM has a double function: The CDM has beendesigned, on the one hand, to help achieve the emission targets and on the other, tocontribute to a sustainable development. Sustainable additionality refers to the secondcomponent. The attitude “a ton is a ton is a ton” refers to rather short-term targetsconcentrating on the emission reductions. A long-term perspective requires theconsistency with other dimensions of sustainability. Michaelowa and Dutschke describethis difficulty: “The CDM is explicitly serving two masters.”61 The interpretations ofadditionality described before do not deal explicitly with this second function of theCDM. So far, sustainability of the project activity has to be controlled by the hostcountry. An additional assessment by an independent operational entity62 is consideredto be too costly to be carried out because of the complexity of sustainability.
Additionality at a macro-level or at a micro-level: Additionality can be measured at amacro-level or at a micro-level. At a macro-level, externalities do not have to beaccounted for, as social welfare is measured. In contrast to this, at a micro-level,externalities play an important role and additionality can only be measured if thediscount rate and the risk level are known, so that risk-neutral costs can be calculated.63.This can lead to very different results. For example, if, in a country, there is a regulationin place for landfill gas (LFG) recovery, but it is not enforced and landfill gas leaks intothe atmosphere. At a macro-level, project activities capturing LFG emissions will not beadditional, as there is an existent policy. On the contrary, at a micro-level, the projectactivity is additional, as it would not happen without the incentive from the CDM. Theother way around, it could be the case that the state subsidises a carbon-intensivetechnology. Investments in less-carbon intensive technologies would not be undertaken,because of their competitive disadvantage and would therefore be additional at a micro-and at a macro-level. The situation would change immediately, if this subsidy was now
60 See Schulz, Walter (2002), p. 55ff.61 Michaelowa, Axel / Dutschke, Michael (2002), p. 762 Required by the Golden Standard (further explained in section 3.2.1.1 of this paper.); see Langrock,
Thomas / Sterk, Wolfgang (2003), p. 8ff.63 See Langrock, Thomas / Michaelowa, Axel / Greiner, Sandra (2000), p. 8; see Sugiyama, Taishi /
Michaelowa, Axel (2000), p. 3

26
phased out. Arguing at a macro-level, the project activities would turn non-additionalfrom this change on. In order to prevent such a negative outcome of the CDM projectactivities, a country may tend to stick to inefficient policies.
2.2.2.3 Limitations of the Additionality Assessment
On the one hand, there is a general trade off between the necessary accuracy ofassessment, and on the other hand, the achievement of the lowest possible transactioncosts as well as the stimulation of a broad participation in the CDM64. A strictadditionality assessment is a very costly procedure, but on the other hand, a lack inassessment accuracy creates environmental costs that accrue due to climate change.Transaction costs (most prominently treated by Coase65 and Williamson66) are calledthe opportunity costs in terms of time, energy and money associated with initiating andcompleting transactions. They occur in any market economy and can easily representone third of the GDP of a country. In developing countries, they are thought to make upan even higher fraction. The main types of transaction costs are search and informationcosts, bargaining and decision costs, policing and enforcement costs. In addition tothose, for the CDM project activities, special transaction costs arise67 due to theadministrative process: baseline determination costs, approval costs, validation costs,registration costs, monitoring costs, verification costs, review costs, certification costs,enforcement costs and brokerage costs. The level of transaction costs depends above allon the rules of the CDM, the degree of utilization of the methodologies and the degreeof standardization of the procedures.68 High transaction costs may discourage marketparticipants from undertaking a transaction.
The optimal result is in the minimum of the total costs consisting of environmental costsand transaction costs. At this point, sufficiently GHG mitigation is achieved at areasonable cost. However, where this state will be reached is difficult to determine,because the relevant costs are not yet measurable as no CDM project has beenimplemented so far. But some tendencies may be identified: The higher the participationin the CDM, that is to say the more transactions of the same type that are carried out, the
64 See Friedman, Shari (1999), p. 162ff.65 See Coase, Ronald H. (1991)66 See Williamson, Oliver E. (1985)67 See Michaelowa, Axel / Stronzik, Marcus (2002), p. 10f.68 See Michaelowa, Axel / Stronzik, Marcus (2002), p. 11
27
smaller the transaction costs per project activity are. Through standardization of theassessment, too, transaction costs can be reduced significantly.
Grubb’s Paradox: The economically most interesting and promotion worthy projectactivities are those at the margin. They are efficient and nearly commercially viable, butbecause of a market distortion not feasible without the support from the CDM. Thoseproject activities confronted with a strict additionality assessment, which puts thethreshold for additionality high, have little possibility of being accepted. Hence, aproject activity with higher costs would have better chances because of being obviouslyeconomically unattractive. This means that the stricter the additionality assessment gets,the less efficient the accepted project activities are. Michael Grubb describes this: The“most ‘cost-effective’ projects may be the least ‘additional’ and strict projectadditionality would give perverse policy incentives.”69 The CDM would then promoteonly the “high-hanging fruits”, meaning the investments that would almost certainly bepassed over. But this is not efficient as the “low-hanging fruit”, the economically moreattractive projects, are not picked.
The concept of additionality has been applied before in Demand Side Management(DSM) in the US, by the Multilateral Fund (MLF) for the Montreal Protocol to controlOzone Depleting Substances, and by the Global Environmental Facility (GEF) fundingfor the UNFCCC. But it has never been applied as a quantitative scientific base beforethe CDM. To overcome this paradox, methodological development and experience areneeded, which can be gained during the first stage of the CDM. For an interim period,looking at how the concept is implemented can be helpful. All information has to bemade openly accessible70 on the Internet in order to enhance transparency and publicpressure. But on the other hand, even doing so transparency will remain difficult toachieve as for each project activity the situation is idiosyncratic, and thereby difficult toassess.
2.2.2.4 Baseline Setting
The most crucial component for determining additionality is the baseline setting.Additional emission reductions are defined by comparing the emissions of a reference
69 See Sugiyama, Taishi / Michaelowa, Axel (2000), p. 470 See Marraskesh Accords (2001), Draft decision -/CMP.1 (Article 12) Appendix D 9, p. 94 and Draft
decision -/CMP.1, Modalities for the accounting of assigned amounts under Article 7, paragraph 4, ofthe Kyoto Protocol, Annex II E, p. 112ff.

28
scenario to the emissions of the project activity scenario. Additionality determination isthereby strongly affected by the selection of the reference scenario, which is called the“baseline”. The baseline case throws up the “what-if“-question and represents whatwould happen without the help from the CDM. Would the same project activity beachieved even without the support from the CDM? Would there be anothereconomically attractive project to the project developer? Would the technology in placebe used further, which would correspond to the BAU case?
Again the trade off between the two main objectives of the Kyoto mechanisms, theenvironmental integrity and the economic efficiency, creates conflicts. In order toachieve environmental integrity, a baseline has to be transparent and conservative,whereas to be economically efficient, a baseline has to be simple, practical feasible andadjustable to changing conditions. The baseline shall be a conservative estimate offuture development in order to prevent tropical air. But the more accurate theassessment is, the more cost intensive it gets. This trade off exists and cannot beovercome. The entire fulfilment of both targets, i.e. a perfect achievement of themitigation target at minimal transaction costs, is not feasible. The challenge is to findout, how methodologies have to be designed to reach the state where the cost associatedwith the project activity assessment and the cost associated with a reduced accuracy ofassessment are minimal.
The methods for setting a hypothetical baseline can be classified into two generalapproaches: top-down and bottom-up approaches71. This differentiation refers to theprocess of decision making. In a top-down process, the decision is taken by a panel ofexperts and then applied to the project activities. On the contrary, in a bottom-upprocess, the proposals are submitted by the PPs.
The top-down approach can create an incentive for macro cheating, e.g. to keep thebaseline emissions high for the purpose of over-crediting and attracting moreinvestment to the country, whereas the bottom-up approach can enhance micro cheating,e.g. to submit a methodology that makes free rider project activities appear CDMworthy.
71 See Baumert, Kevin (1999), p. 144ff.

29
The aggregation level of the baseline may vary from a perfectly standardized approach(benchmark-type approach) to a completely unstandardized approach (project-specificapproach).72
A benchmark73 is a quantitative performance standard (an emission rate or level),which is derived from official data for a country, a region, a sector, or a technology.Project activities that generate fewer emissions than the “standard activity” areconsidered to be additional, whereas project activities with higher emissions areexcluded from the CDM. The emission reductions of a proposed project activity arethen calculated deducting the emissions of the project from the established baselineemissions. Benchmarks are aggregated, because they apply a standard across a numberof CDM projects. They measure only the intensity additionality using intensity oroutput-based indicators74, but not activity additionality. This eliminates the need forproject-specific baselines.
An aggregated baseline disposes of many advantages concerning the target ofeconomic efficiency. The transaction costs for the baseline setting are distributed over alarge group of projects. The bigger the scope is, the more cost-effective the top-downbaseline is. The lower costs and the lower associated risk could have the secondaryeffect that participation in the CDM is encouraged. In addition to that, emission rates ofcountries and sectors are becoming more comparable and investment will be attracted towhere the highest reduction potential is, that is to say to the most inefficient countriesand sectors. The LDC (least developed countries) would benefit from this effect.Another strength of the benchmark approach is its ability to discover leakage75. Ifstrong leakage is very likely, benchmarks are useful to prevent cheating because of theirintegrating scope.
But on the other hand, there are also many disadvantages of the benchmark approach.The up-front development costs are relatively high, because of the complexmeasurement requirements and the lack of data availability in many developingcountries. It is true that with a greater baseline aggregation, the total transaction costsdiminish, but at the same time environmental integrity can suffer because of reducedaccuracy. The optimal aggregation level is difficult to determine. In general, the more
72 See Lazarus, Michael / Kartha, Sivan / Bernow, Stephen (2001), p. 873 See Friedman (1999), p. 162 ff.74 See Lazarus, Michael / Kartha, Sivan / Bernow, Stephen (2001), p. 2175 Emissions resp. emission reductions caused by the project activity, but not under the control of the
project developer, are called leakage. Leakage is further treated under 2.2.2.5.

30
homogeneous a country, region, sector or technology is, the more accurate thebenchmark approach is.
On the contrary, project-specific baselines are determined on a case-by-case basis. Thereference case there is a specific technology or scenario. Both intensity and activityadditionality are measured. The project-specific baselines do not run the risk of setting astandard wrongly and thereby discouraging participation or encouraging free-riding as itcan be a problem of the benchmark approach. Project-specific baselines tend to bringout more accurate and case-specific estimations. However, varying assumptions candrastically alter the resulting emission reductions. This opens a way for micro-cheating.In addition to that, both the up-front developing costs as well as the projects proponent’scosts are very high due to the low level of aggregation.
After having weighted up the pros and cons of the benchmark approach and the project-by-project approach, the UNFCCC decided to make a call for project specific baselines,which are elaborated in a bottom-up process by the PPs themselves.76
2.2.2.5 Key Parameters for Baseline Setting
The baseline setting depends on the following parameters77:
• a baseline can be historical or forward-looking,• the lifetime of the equipment has to be determined,• the lifetime of the baseline has to be chosen,• a baseline can be determined ex-ante or ex-post,• the boundaries have to be specified• the leakage has to be accounted for, and• the uncertainties have to be estimated
Historical or forward-looking: The official data used for the baseline can be currentresp. past data (historical baseline) or forecasted data (forward-looking baselines). Anhistorical baseline is rather static. Its general weakness of backwards oriented historical
76 See Marrakesh Accords (2001), Draft decision -/CMP.1 (Article 12), Modalities and procedures for a
clean development mechanism as defined in Article 12 of the Kyoto Protocol, Annex G, 45 (a) and(c), p. 83
77 Deduced from the UNFCCC form for proposed new baseline and monitoring methodologies: F-CDM-PNM

31
approaches is, that they do not capture current marginal opportunities. The next plantbuilt for example could be a less carbon-intensive technology. The quality of theforward-looking baseline is dependent on the reliability and credibility of the forecastdata.
Lifetime of the equipment: The lifetime of the equipment determines when it has to bereplaced. There are two possible views: the economic lifetime and the technical lifetime.For entrepreneurs, the economic lifetime is more relevant. As soon as anothertechnology turns out to be more profitable (including switching costs), the rationallyacting investor will shift to it, unless there are more than solely economic objectivesplaying a dominant role.
Lifetime of the baseline: The lifetime of the baseline depends on the project’s lifetime(depending itself on the lifetime of the equipment). If no readjustment of the baseline ispermitted during the crediting period, the lifetime of the baseline is equal to thecrediting lifetime. In the Marrakesh Accords78, it has been decided to standardise thecrediting lifetime giving the PPs the choice between two possibilities: or a fixedcrediting period of 10 years or a renewable (max. twice) baseline of 7 years each.
The setting of the crediting lifetime is an ambiguous issue: A long crediting periodencourages engagements in long term emission reductions, as the long term impacts ofthe project activity are taken into account. But with a longer crediting period complexityand uncertainty also grows and thereby the costs and the risk of cheating. On thecontrary, a short crediting lifetime does not further complicate the estimation andcalculation of emission reductions. Above all project activities linked to a high initialinvestment, but with a relatively steady development afterwards, only need to overcomethe initial difficulty. Here, a short crediting period would be suitable.79 The drawback isthat project activities with short-time effects get a competitive advantage under a short-time crediting period. This would be contradictory to the sustainability target of theCDM, which aims at promoting long-term emission reductions. Therefore, the EBdecided to give the PPs the choice between the two mentioned, both relatively long-term, crediting periods.
78 See Marrakesh Accords (2001), Draft decision -/CMP.1 (Article 12), Modalities and procedures for a
clean development mechanism as defined in Article 12 of the Kyoto Protocol, Annex G, 49 (a) and(b), p. 84
79 See Langrock, Thomas (2004)

32
Ex-ante or ex-post baseline: A baseline, being a hypothetical construct, which isuncertain by definition, cannot be controlled ex-post. It is always established at a certainpoint in time reflecting the actual expectations for the future. Therefore a baseline isprincipally a static construct. An estimate is always determined in advance, and ex-postdetermination is no more an estimate, but a reality. However, if conditions changeduring the crediting period as profoundly and unpredictably, that a less carbon-intensivetechnology or even the project activity itself becomes economically attractive, it makessense to readjust the baseline. This would enhance transparency and consistency, butis contradictory to the theoretical construct of the baseline. In addition, an ex-postadjustment would lead to a higher uncertainty for the project promoter. But on the otherhand, under the new favourable conditions, the project activity benefits from acompetitive advantage that compensates the PPs for the credits lost. In order to reduceuncertainty for the project developer, a compromise could be reached: monitoring of thepolitical and economic conditions and regular (not continuous) possibilities for updates(e.g. every 5 years) can be included into the methodology.
Some methodologies tried to create an ex-post baseline based on a comparison approachusing a control group. Yet, for some technologies, it is difficult to find an appropriate,sufficiently similar control group. Taking the example of a landfill, a control groupwould need exactly the same conditions (e.g. quantity of wells, depth, amount of waste,consistency of waste). Because of a lack of similarity, this approach has so far beenrejected by the EB when proposed in a methodology80.
Boundaries: Baseline boundaries refer to the baseline scenario and project boundariesto the project activity scenario.
All procedures, processes and transactions that are under the control of the PPs shallbe included into the boundaries81. The wider the boundary is drawn, the more impactsand interdependencies are taken into account, but, at the same time, the less cost-effective the assessment is as the complexity is growing. Therefore, a compromise hasto be reached: Boundaries should be tightly related to the processes for which CERs willbe claimed. If there are indirect effects on emissions, they shall be treated separately asleakage.
80 See proposed new methodologies NM0003 and NM003481 See Marrakesh Accords (2001), Decision -/CP.7 (Article 6), Guidelines for the implementation of
Article 6 of the Kyoto Protocol, Appendix B, 4c, p. 66

33
Therefore, emissions only have to be addressed, if they significantly affect thecalculation of the project activity’s impact, negligible emissions should just be named.In contrast, if the emissions outside the boundary are significant, but the measurementwould turn out to be too costly, they can be excluded, but have to be treated asuncertainties and not as leakage. However, a threshold has to be fixed (e.g. a percentageof the totally claimed emission reductions, which is expected with a determinedprobability).
Looking at several project activities simultaneously, another issue appears: theboundaries of one project activity can overlap with those of another, if off-siteemissions are included into the boundary (e.g. one step up-stream and one step down-stream). It could happen that the off-site emission reductions for one project areidentical to the on-site reductions of another. This could lead to double counting andthereby to over-crediting, which has to be avoided.
Emissions occurring within the project boundaries are called direct emissions, whereasindirect emissions occur outside of the project boundaries, in particular leakage orspill-overs (also called “positive leakage”). The spatial dimension of boundary settingrefers to the geographic area: the emissions occur either on-site or off-site. Thetemporal dimension is reflected in the crediting period.
Leakage: Emissions or emission reductions that occur outside the project boundary andthat are uncontrollable by the PPs, but measurable and attributable to the CDM projectactivity, are typically called leakage82. In general the term leakage refers to the negativeimpacts on climate change (e.g. emissions due to transport), but positive leakage alsoexists (e.g. reduction of barriers of implementation).
Following Michaelowa and Fages83, there is no systematic tendency in undistortedmarkets for project-specific baselines to show excessive emission reductions, i.e. anegative leakage.
82 See Decision 17/CP. 7, Draft decision -/CMP.1 (Article 12), para. 51, “Leakage is defined as the net
change of anthropogenic emissions by sources of greenhouse gases which occurs outside the projectboundary, and which is measurable and attributable to the CDM project activity.”; see Decision17/CP. 7, Draft decision -/CMP.1 (Article 12), para. 52, “The project boundary shall encompass allanthropogenic emissions by sources of greenhouse gases under the control of the project participantsthat are significant and reasonably attributable to the CDM project activity.”
83 See Michaelowa, Axel / Fages, Emmanuel (1999), p. 11

34
Following Lazarus et al.84, leakage can be deducted either ex-ante by adding theleakage to the project emissions resp. discounting the CERs or ex-post by keeping partsof the CERs back for deduction of the leakage measured.
A special effect, sometimes defined as a form of leakage, is the so called reboundeffect. Above all, DSM and demand reduction programs (e.g. fuel switching) areaffected by this form of leakage. When project activities reduce the energy demand (e.g.by increasing efficiency), this can lead to a price reduction. The low price, on the otherhand, increases purchasing power. A fraction of the emission reductions due to energysavings is offset by increased consumption. This is called the rebound effect. However,Lazarus et al.85 state that this is no form of leakage, as the effect occurs actually withinthe boundaries. In fact, the baseline has not been correctly defined because it ignoresthat the grid is characterised by an undersupply.
Uncertainties: Uncertainties have to be monitored during the duration of the projectactivity to assure that the project activity is additional. They can be built into theformula as variables. Uncertainties can be addressed qualitatively ex-ante, which maybe substantiated by a quantitative estimate. Its validity can be controlled ex-post.
2.2.2.6 Conclusions
This section showed that the concept of additionality has to be clearly defined in orderto be operational. The implementation of the additionality concept encounters two maindifficulties: the transaction costs grow with increased assessment accuracy and the mostcost-ineffective project activities have the best chances to get accepted under the CDM(Grubb’s paradox). To determine in advance, which scenario would occur in theabsence of the CDM, standardised, analytical mechanisms for designing forecastingmodels and collecting data are necessary. Eventual shortcomings in the baseline settinglead to wrong results in the additionality assessment and conflicting interests of theparties involved make the baseline setting a highly political issue.
84 See Lazarus, Michael / Kartha, Sivan / Bernow, Stephen (2001), p. 5485 See Lazarus, Michael / Kartha, Sivan / Bernow, Stephen (2001): p. 56

35
2.2.3 The Concept of Methodologies
The UNFCCC has chosen to apply a project-by-project assessment to test theadditionality and to quantify the emission reductions. Proposals will be elaborated in abottom-up process.86
Yet, this procedure can get very complex and expensive, if for each project activity, thebaseline setting has to be carried out ad-hoc and if the monitoring is highly case-specific. In addition, if the analysis is not based on the same assumptions, the resultsfrom the assessment of different project activities will, in all probability, not becomparable to each other.
This shows that, in order to make the CDM workable, the transaction costs have to bereduced and the consistency has to be enhanced. Therefore, methodologies have to beelaborated. The methodologies shall be applicable to a number of project activities. Thesame assumptions and rules will be applied to all the project activities submitted to theEB, which helps to treat the proposals in a fair way. Methodologies approved by the EBare made publicly available on the UNFCCC website.
This is a step towards standardisation, but it does not reach as far as multi-projectbaselines do. The standardisation87 of the baseline procedures has already beenundertaken. In the Project Design Document (PDD), published on the UNFCCCwebsite, the project developer has to provide project specific values for a number ofbaseline parameters. The next step, now addressed by the Methodology Panel, is thestandardisation of baseline parameters to determine multi-project parameter values,such as the fuel technology assumed for the baseline scenario, the scope of theboundaries, and the method for the calculation of ERs. Multi-project baselines would goeven further standardising baseline emission factors applicable to a multitude ofproject activities.
At COP7, the Parties decided to give more guidance to the PPs for the elaboration ofmethodologies. They fixed the following principles in order to ensure the quality of themethodologies88:
86 See Marrakesh Accords (2001), Draft decision -/CMP.1 (Article 12), Modalities and procedures for a
clean development mechanism as defined in Article 12 of the Kyoto Protocol, Annex G, 45 (a) and(c), p. 83
87 See Report of the Workshop on Baselines for JI and CDM projects (2003), Catrinus Jepma, p. 388 See Lazarus, Michael / Kartha, Sivan / Bosi, Martina (2002), p. 17f.

36
2.2.3.1 The Principle of Transparency and Conservativeness
Many aspects of evaluating a project activity are subjective, i.e. there is a range ofinterpretations. In order to reduce the potential of gaming, the Parties state in decision17 that a baseline shall be “reliable, transparent and conservative”89. Thus, the PPs shalldemonstrate through their methodology that they do not disguise any facts, but on thecontrary, that they are actively building confidence by explicitly choosing the mostconservative estimates and approaches. PPs can give a signal of quality to the DOEs byopenly exposing these wide ranges of interpretation, providing a clear documentation,justifying their interpretation and always choosing the most conservative estimate90. Atransparent, verifiable and credible documentation will have better chances to passvalidation.
2.2.3.2 Accuracy
The GHG emission reductions shall be “real and measurable, and an accurate reflectionof what has occurred within the project boundary”91. In testing the additionality of theproject activities, a methodology shall be as accurate and rigorous as necessary in orderto keep the free riders off, but without discouraging the submission of really additionalproject activities. A very strict assessment with little chances for the PPs to make theirproject activity pass the procedure is contra productive. The participation would be toolow and the whole CDM would fail to kick start92. On the other hand, too many freeriders will make the market price of the CERs decrease and destroy the confidence inthe mechanism.
2.2.3.3 Cost-Effectiveness
The bottom-up creation of methodologies goes hand in hand with high costs in theinitial state. Methodologies need to become standardized in order to achieve costreductions in the later states and to become manageable. For standardization, sufficientdata has to be captured first. The idea is to use the first period as a kick start for the
89 Decision 17/CP.7, pre-ambular part90 See Lazarus, Michael / Kartha, Sivan / Bernow, Stephen (2001): p. 991 Decision 17/CP.7, App. C (a) (iii)92 See Marrakesh Accords (2001), Decision -/CP.7 (Article 12), Modalities and procedures for a clean
development mechanism as defined in Article 12 of the Kyoto Protocol, p. 68

37
CDM. The experience of the implemented project activities will help to better define thescope and standard values for the baselines.93 During the first commitment period, theeffects of the methodologies will become visible. Adjustments to the methodologieswill then be made for the second commitment period.
2.2.3.4 Adequate Incentives
A kick start clearly will not happen, if additionality assessment is too tight andparticipation thereby too small. This is why straightforward methodologies are neededfor the majority of cases. It makes sense to create more detailed methodologies forproject activities with a strong impact, e.g. which claim a large amount of credits and/orwhich are of a very large scale, as well as for project activities, which are of a high riskof error. In general, for all types of project activities, the assessment costs should remainrelatively small in relation to project activity’s implementation costs so as not to cutdown the participation.94
2.2.3.5 Practicality and Applicability
A methodology that needs a lot of detailed data cannot be applied to a situation withstrong institutional constraints, low availability and scarce reliability of the data. It isnecessary first of all, to ensure that the data is regularly collected and publicly availableas well as easily accessible. Further on, the PPs shall be informed, where to find the datasources needed for their calculations, as research to fill eventual data gaps requires timeand money. In addition to that, default methods have to be established for situations,where data is missing and cannot be procured95. Apart from the practicability aspect, amethodology should be applicable to a range of project activities in different countriesin order to reduce transaction costs.
93 See Heister, Johannes (1999), p. 394 See Lazarus, Michael / Kartha, Sivan / Bernow, Stephen (2001): p. 995 For an example, see NM0032 in chapter 3 of this paper
38
2.2.3.6 Consistency and Reproducibility
The Parties decided to promote “consistency, transparency and predictability”96 of theresults from the methodologies. Otherwise, contradictions in the rigours of assessmentbetween the methodologies would make the methodologies appear arbitrary andquestion the whole approach. Only if a general frame of rules and guidance withoutinherent contradictions has been created, can the assessment process be recognised asvalid97. This implies a continuous adaptation of the methodologies to changingconditions. By applying an objective and systematic procedure, reproducibility of theresults shall be guaranteed.
2.2.4 Proceeding and Acceptance of a CDM Project Activity
2.2.4.1 Project Activity Cycle
All information has to be made publicly available98 and all proceedings of the EB andthe Supervisory Committee have to be open to observers99.
The project activity cycle is illustrated in Figure 5100.
The first step for PPs that would like to submit a project activity to the EB forvalidation/registration is to fill out the Project Design Document (PDD) elaborated bythe EB. For further guidance they can refer to a glossary of terms, which has beendeveloped by the EB on the basis of the decisions made concerning the modalities andprocedures.101
96 Decision 17/CP.7, App. C (a) (ii)97 See Lazarus, Michael / Kartha, Sivan / Bernow, Stephen (2001): p. 998 See Marrakesh Accords (2001), Draft decision -/CMP.1, Modalities for the accounting of assigned
amounts under Article 7, paragraph 4, of the Kyoto Protocol, Annex II E, p. 112ff.99See Marrakesh Accords (2001), Draft decision -/CMP.1 (Article 6) Guidelines for the implementation
of Article 6 of the Kyoto Protocol, Annex C, p. 59, and Draft decision -/CMP.1 (Article 12)Modalities and procedures for a clean development mechanism as defined in Article 12 of the KyotoProtocol, Annex C, p. 77
100 See UNFCCC website, the CDM project activity cycle101 See Decision 17/CP.7, Appendix B

39
PPs that want to propose a new methodology cannot directly address the EB. They areobliged to select one designated operational entity (DOE) from the list provided at theUNFCCC web site.
The DOEs102 are independent auditing companies. It is their task to validate the projectactivity against the requirements of the CDM 103 founding their evaluation on thePDD104 submitted by the PPs.Through a DOE, the proposal has to be submitted to the EB for review. A newmethodology has to be submitted together with the draft PDD. The project activity onlycan enter the validation and registration process after having the approval for the newmethodology.
Methodologies approved by the EB are publicly available at the UNFCCC website andcan be used by other project developers. If the PPs use a methodology that has alreadybeen approved, they can submit their project activity directly for validation andregistration.
A validated project activity then passes to the EB for official registration. This is theprerequisite for the following steps: verification, certification and issuance of CERs.
102 See Decision 17/CP.7, Art. 12, 7.103 See Decision 17/CP.7104 See Decision 17/CP.7, Appendix B
Figure 5: UNFCCC CDM Project Activity Cycle
Design
M onitoring
Validation/Registration
Verification/Certification
Issuance
PP
DOE 1
EB
DOE 2
CER
PP
EB
AE
EB & COP/MOP
DOE
DNA
Accreditation/designation

40
During the crediting period, another DOE is responsible for a periodic independentreview and for an ex-post control of the monitoring of the additional reductions inanthropogenic emissions by sources of greenhouse gases. The certification is the finaldocument assuring that, during the crediting period, the project activity achievedadditional emission reductions. This assurance is the basis for the issuance of CERs.
2.2.4.2 Guidelines for the Project Participants
This is to summarise which guidelines have been established so far and have to be takeninto account in the further analysis.
The PPs are allowed to choose the most appropriate approach for the baseline settingout of the following three105, providing a justification of the choice in the PDD:
a) “Existing actual or historical emissions, as applicable” (historical baseline)b) “Emissions from a technology that represents an economically attractive
course of action, taking into account barriers to investment” (forward-looking baseline)
c) “The average emissions of similar project activities undertaken in theprevious five years, in similar social, economic, environmental andtechnological circumstances, and whose performance is among the top 20 %of their category” (control group approach)
Further, the EB suggests four possibilities106 for providing evidence of theadditionality of the proposed project activity:
a) “A flow-chart or series of questions that lead to a narrowing of potentialbaseline optionsand/or
b) A qualitative or quantitative assessment of different potential options and anindication of why the non-project option is more likelyand/or
105 Decision 17/CP.7, Art. 48.106 EB10, Annex 1, A.2.

41
c) A qualitative or quantitative assessment of one or more barriers facing theproposed project activity (such as those laid out for small-scale CDM projectactivities)and/or
d) An indication that the project type is not common practice (e.g. occurs in lessthan [<x%] of similar cases) in the proposed area of implementation, and notrequired by a Party’s legislation/regulations.”
The drawback of these suggestions is that the four additionality tests are not entirelyequivalent. In order to assure that the methodologies treat the project activities equally,further guidance is needed from the EB.107
In the Marrakesh Accords108 it has been set up that two alternative crediting periodsare eligible:
a) A renewable crediting period of 7 years (maximal 21 years)b) A fixed crediting period of 10 years
Definitions of boundaries109 and leakage110 have been provided in the MarrakeshAccords. So far, the EB has not yet decided, how emissions being under the control ofthe project developers and attributable to the project activity are related to the categoriesof direct and indirect emissions.
2.2.4.3 Conclusions
This section explained the concept of the methodologies and showed the theoreticalbackground and the decisions already taken by the EB. In the following section, it willbe analysed how the concepts and guidelines are put into practice and how to optimisetheir implementation.
107 See Jung, Martina / Michaelowa, Axel (2003), slide 5108 See Marrakesh Accords (2001), Draft decision -/CMP.1 (Article 12), Modalities and procedures for a
clean development mechanism as defined in Article 12 of the Kyoto Protocol, Annex G, 49 (a) and(b), p. 84
109 See Marrakesh Accords (2001), Decision -/CP.7 (Article 6), Guidelines for the implementation ofArticle 6 of the Kyoto Protocol, Appendix B, 4c, p. 66
110 See Marrakesh Accords (2001), Draft decision -/CMP.1 (Article 12), Modalities and procedures for aclean development mechanism as defined in Article 12 of the Kyoto Protocol, Annex G, 51, p. 84

42
3. COMPARATIVE ANALYSIS OF CHOSEN METHODOLOGIES
3.1 Description of Methodologies for Methane Recovery and ElectricityGeneration
3.1.1 Introductory Remarks
It is essential for the discussion of methodologies that there is no confusion between theassessment of the methodology and the assessment of the project activity. Themethodology is the means to assess the project activity. The submitted methodologymay be acceptable, while the project activity may not. These two levels are sometimesdifficult to separate.
To draw this line of separation is even more complicated, as the construction ofmethodologies stands in a direct interdependence with the related project activityregarding country specific, sector specific and technology specific information. For thecurrent state, it is important that the approach presented in the methodology isprincipally correct and suitable to the conditions of the project activity. It is then thetask of the DOE to control if the given information is credible.
For this paper, all proposed new methodologies where considered until 15 November2003. Methodologies submitted afterwards were no longer able to be included into thisresearch. All methodologies submitted by the PPs to the Secretariat of UNFCCC andcited in this paper are available on the UNFCCC website (http://cdm.unfccc.int).
The following analysis will examine the consistency across chosen methodologies aswell as draw conclusions for simplification and improved proceeding of additionalityassessment.
3.1.2 Selection: Building Clusters and Weighting
In order to compare the submitted methodologies, they were grouped according to theproject type. The results were the following six clusters: methane recovery (from landfilling), electricity generation, energy efficiency, manure management, fuel switchingand fugitive emissions (not from land filling).
As a next step, those methodologies which address the additionality assessmentsufficiently were identified (highlighted in Figure 6). Methodologies not dealing

43
profoundly with this issue were considered irrelevant for this research. There are twokinds of cases in which the additionality assessment was considered to be insufficient:In the first case, methodologies only deal with the concept of “environmentaladditionality” (NM0003, NM0006 and NM0008). As stated in section 2.2.2.2, thisinterpretation of the additionality concept is too narrow. In the second case,methodologies do deal with additionality too superficially (NM0025, NM0026,NM0033 and NM0034) or not at all (NM0011, NM0012, NM0013).
The methodologies NM0002, NM0009, NM0014 and NM0015 are not listed in Figure6, because they have been rejected by the EB. The project developers then improvedand resubmitted the methodologies again to the Secretariat. NM0002 was resubmitted asNM0029 and NM0009, NM0014 and NM0015, all three together, as NM0019.
Methane Recovery (from land filling)NM0004: Salvador Da Bahia Landfill Gas ProjectNM0005: Nova Gerar Landfill Gas to Energy ProjectNM0010: Durban Landfill-gas-to-electricity projectNM0021: Cerupt methodology for landfill gas recoveryNM0032: Municipal Solid Waste Treatment cum Energy Generation,Lucknow, India
Figure 6: Overview on Clustering and Weighting of the Submitted Methodologies
Electricity GenerationNM0001: Vale do Rosario Bagasse Cogeneration (VRBC) ProjectNM0006: El Canada hydroelectric projectNM0008: Penas Blancas hydroelectric projectNM0010: Durban Landfill-gas-to-electricity (South Africa)NM0011: 26 MW bagasse/biomass based cogeneration power project, Koppa,IndiaNM0012: Wigton wind farm projectNM0013: Felda Lepar Hill Palm Oil Mill Biogas Project in MalaysiaNM0019: A.T. Biopower rice husk power projectNM0020: La Vuelta y la Herradura hydroelectric project
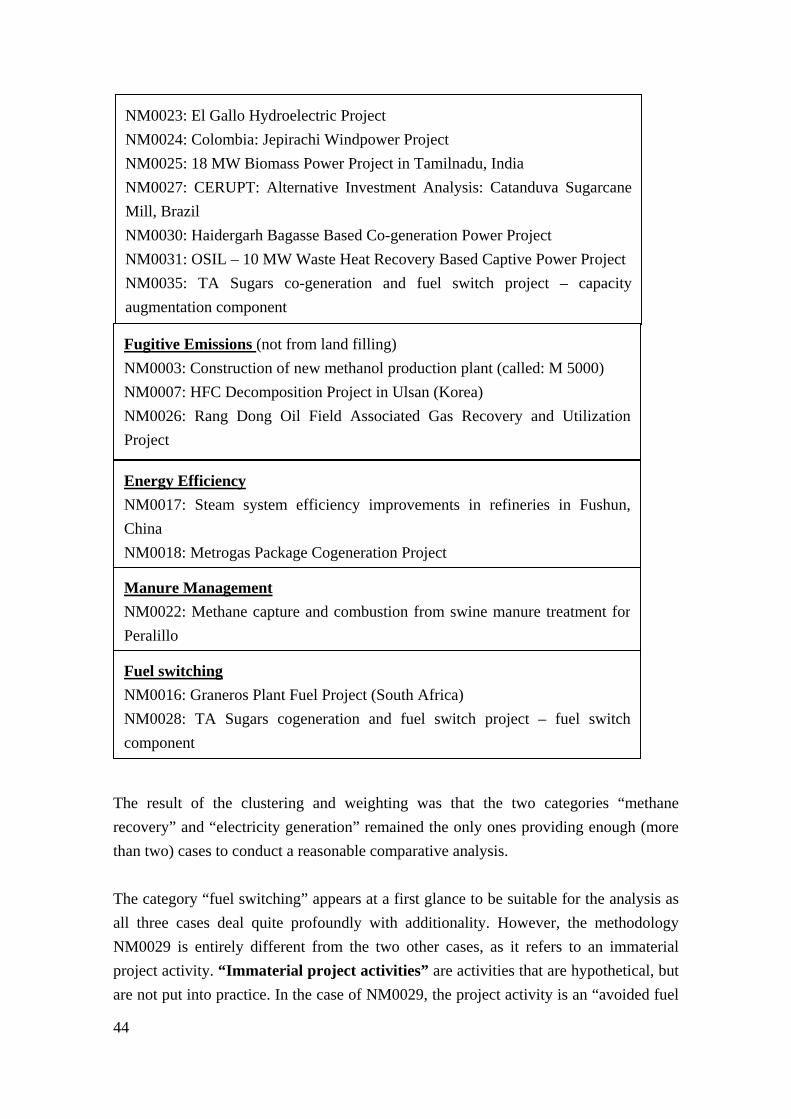
44
The result of the clustering and weighting was that the two categories “methanerecovery” and “electricity generation” remained the only ones providing enough (morethan two) cases to conduct a reasonable comparative analysis.
The category “fuel switching” appears at a first glance to be suitable for the analysis asall three cases deal quite profoundly with additionality. However, the methodologyNM0029 is entirely different from the two other cases, as it refers to an immaterialproject activity. “Immaterial project activities” are activities that are hypothetical, butare not put into practice. In the case of NM0029, the project activity is an “avoided fuel
Energy EfficiencyNM0017: Steam system efficiency improvements in refineries in Fushun,ChinaNM0018: Metrogas Package Cogeneration Project
Manure ManagementNM0022: Methane capture and combustion from swine manure treatment forPeralillo
Fuel switchingNM0016: Graneros Plant Fuel Project (South Africa)NM0028: TA Sugars cogeneration and fuel switch project – fuel switchcomponent
NM0023: El Gallo Hydroelectric ProjectNM0024: Colombia: Jepirachi Windpower ProjectNM0025: 18 MW Biomass Power Project in Tamilnadu, IndiaNM0027: CERUPT: Alternative Investment Analysis: Catanduva SugarcaneMill, BrazilNM0030: Haidergarh Bagasse Based Co-generation Power ProjectNM0031: OSIL – 10 MW Waste Heat Recovery Based Captive Power ProjectNM0035: TA Sugars co-generation and fuel switch project – capacityaugmentation component
Fugitive Emissions (not from land filling)NM0003: Construction of new methanol production plant (called: M 5000)NM0007: HFC Decomposition Project in Ulsan (Korea)NM0026: Rang Dong Oil Field Associated Gas Recovery and UtilizationProject

45
switching” from charcoal to coal. Because of a new policy, the Brazilian charcoal lostits competitive advantage regarding coal. As users of charcoal are now obliged toreforest the quantity needed to produce the charcoal they consume, charcoal turned outto be more expensive than coal. A reasonable reaction of the affected businesses wouldbe to change from charcoal to coal. This substitution from a “cleaner” energy source toa more CO2 intensive one could be prevented by the CDM. Additional income fromcredits could compensate the competitive disadvantage. However, the category“immaterial project activities” is very controversial category. An additionalityassessment cannot create unequivocal and indisputable results. Some experts object tothis kind of project activities that credits must not be gained for maintaining a BAUscenario, but for investments in mitigation techniques. Further, they reject this projectcategory because of its high inherent uncertainty. Other experts are in favour of“immaterial project activities”, because, compared to the baseline, emission reductionsare actually generated. They argue that the reasoning behind the concept is rational andnot more hypothetical than any other baseline. To conclude, NM0029 is a special case,the other two cases do not offer enough material to conduct a separate analysis andtherefore, this category has not been chosen.
The category “fugitive emissions” is separate from “methane recovery”, because it alsocovers other GHGs and other technologies than land filling. The category of “fugitiveemissions” is very heterogenic, as the technologies differ widely. Therefore, it isunsuitable for a comparative analysis.
3.1.3 Description of Chosen Methodologies
Methodologies are submitted by the PPs. The Parties participate in a CDM projectactivity either directly by the government being listed as a PP in the PDD, or indirectlyrepresented by a public body or private company. Those private companies can be e.g.suppliers, developers, engineering and consulting companies. Corresponding to theParties involved, project activities are classified as being unilateral, bilateral ormultilateral. Unilateral CDM project activities are undertaken by the DesignatedNational Authorities (DNA) of a Non-Annex I country on its own. This is an interestingoption if the country disposes of enough capital and know-how. The Party has theopportunity to sell directly the credits gained in the market for certificates. BilateralCDM project activities represent the original idea of the CDM between an Annex IParty and a Non-Annex I Party. Multilateral project activities are undertaken by severalAnnex I Parties together, which either join forces within the scope of the project activity

46
or which are united by an official entity e.g. a development fund like the PrototypeCarbon Fund (PCF) of the World Bank.
All projects are required to meet the mitigation objective as well as the sustainabilityobjective. But sustainability has not yet been explicitly defined by the EB. The EBunderstands this criterion as the enhancement of economic growth and development ofthe area, but does not approach ecological questions concerning interactions with otherecosystems. They only refer to the part of emission reductions.
3.1.3.1 Description of Methane Recovery Project Activities
Methane (CH4) is the second contributor to climate change after carbon dioxide (CO2),but its influence on the greenhouse effect is considered to be 21 times bigger than theone of CO2 (the factor to express CH4 in terms of CO2 equiv. is 21). Although it is not yetas present in the atmosphere as carbon dioxide, methane concentrations have more thandoubled over the last two centuries largely due to human-related activities. In order tohalt the annual rise in methane concentrations, reductions of about 10 % in emissionsfrom these anthropogenic sources would be necessary.111
Landfill gas is created by anaerobic decomposition, which is the process ofdecomposing garbage buried in the landfills. The decay produces natural gas consistingof approximately 50 % methane. When untapped and unmanaged, this gas can leak intothe atmosphere. This gas leakage not only poses a threat to the environment andsurrounding properties, as fires and explosions can occur, but the bad odour also affectsliving conditions.
This explains why recovery and use of methane generated in municipal solid waste(MSW) landfills has strong global and local environmental and economic benefits:Apart from climate protection, the methane mitigation at landfills has positive effects onair and groundwater quality and further on health and living conditions.
In order to recover the landfill gases, a gas collection system has to be implementedconsisting of a piping and well network. Pollution of groundwater can be prevented byadding a leachate drainage system. For excess landfill gas, flaring equipment is needed
111 See EPA, GHG Info (2003)

47
and in the case of power production, an electricity generation plant and generators haveto be added.
The following projects are about landfill gas capture, flaring and renewable energygeneration. To make it easier to understand the proceeding of the methodologies thepaper further deals with, a short description of each project is provided:
NM0004: VEGA Bahia Tratamento de Residuos S.A. (Brazil); SUEZ Environnement(France); ICF ConsultingThe project activity consists of installing the equipment for methane capture and flaringat the landfill Aterro Metropolitano do Centro. Subsequently, a landfill-gas-to-energytechnology will be added. However, this methodology only takes into account the firststep. The project activity encloses flaring with controlled burning. By optimising thewaste decomposition, it will be possible to increase the waste disposal volume. Theproject, with a pre-determined capture and flaring percentage, was auctioned by a callfor tender. The actual project developer got the contract and is even able to exceed thefixed target; yet, this would not create any additional benefits for him.
NM0005: EcoSecurities; S.A. Paulista (Brazil); World Bank Netherlands CleanDevelopment Facility (WB NCDF)NovaGerar is a joint venture between EcoSecurities (an environmental financecompany) and S.A. Paulista (a Brazilian civil engineering and construction firm). S.A.Paulista possesses a 20 year concessionary licence to manage two landfills (Lixao deMarambaia and Aterro Sanitario de Adrianopolis). NovaGerar has been created toexplore the gas collection and utilization activities related to the project. The projectincludes electricity generation, but the PPs do not claim CERs for electricity generation.Therefore, only the methane recovery methodology applies. 12 MW are the expectedcapacity for electricity generation. The mitigation activity combines combustion of therecovered gas and flaring of the excess gas.
NM0010: Durban Solid Waste (DSW) (South Africa); The Ethekwini Municipality(South Africa); The Prototype Carbon Fund (PCF); The Republic of South AfricaIn contrast to the projects described so far, this project claims CERs for electricitygeneration. Therefore, both, a methane recovery and a electricity generationmethodology, have to be applied. The objective is to enhance the collection of landfillgas at three landfill sites. The electricity generated will be introduced to the grid. Therewill be reduced emissions related to coal-fired power production (which is commonpractice in South Africa) as well as adverse impacts related to the transportation of coal

48
and coal mining (dust and acid mine drainage). In order to improve water quality, wellsneed to be installed for leachate removal.
NM0021: ONYX (France); SASA (ONYX subsidiary in Brazil)This project will take place in the City of Tremembé, Sao Paulo. The operator is SASA,the Brazilian subsidiary of Onyx. The landfill is divided into two disposals, and anothernew area is planned. The mitigation project will introduce the latest European wastemanagement standards to the landfill. Some electricity will be generated but will onlybe used on-site. This explains why no CERs will be claimed for electricity generation. Iflater electricity is fed into the grid, an electricity generation methodology, as forNM0010, will have to be used.
NM0032: Infrastructure Development Finance Company Limited; Asia BioenergyLimited (India, Austria, Singapore); Lucknow Nagar Ninam; Uttar Pradesh PowerCorporation Limited; Ministry of Non-conventional Energy Sources; PrototypeCarbon Fund (PCF)This project is located in the town of Lucknow in the state of Uttar Pradesh, India. Thetechnology to be introduced is called biomethanation of municipal solid waste treatmentwith power generation. Biomethanation is the term for an enhanced methane productionby anaerobic digestion of biodegradable organic matter, catalyzed by enzymes secretedby micro organisms. The project consists of three separate components that result inemission reductions: biomethanation and capture of municipal solid waste and therebyreduction of methane escaping into the atmosphere, displacement of fossil fuel duringpower generation at the project site, and displacement of chemical fertilizer by organicfertilizer from biomethanation. The last part is not covered by the proposedmethodology and will be treated in a separate methodology.
3.1.3.2 Description of Electricity Generation Project Activities
Power generation from renewable energy – e.g. wind, solar radiation, hydro power,earth energy, and biomass – provides heat and electricity from natural resources that arenot depleted over time. Resources which can be used without an impact on the climatesystem are called zero-emission sources. Zero-emission technologies do either notgenerate emissions (e.g. water power) or generate emissions that are exactly as high aswhat has been absorbed before in the lifecycle (e.g. biomass). Oil, gas and coal are notconsidered as zero-emission fuels, because the absorbance of emissions and the re-emission do not take place in one lifecycle. However, not all uses of renewable energy

49
are zero-emission technologies, due to the fact that they are not all sustainable andenvironment friendly. For example, large hydroelectric projects, which pen up waterreservoirs behind dams, can have negative environmental impacts on rivers, fish, andsurrounding land. All the same, producing power from trees or other biomass sourcesthat are not exploited in a sustainable way, but are harvested too quickly withoutallowing enough time for regeneration, is contra-productive. GHG emissions produced,when the wood or biomass is burned, can then not be adequately offset by new growth.
As the submitted energy generation methodologies all deal with zero-emissiontechnologies and the supply of electricity to the grid, they have a similar structure andbecome comparable, even though they use different renewable technologies. Electricityis produced from different combustion processes: Bagasse is the organic waste fromsugar cane cultivation, and rice husk is the organic waste from rice cultivation. Further,landfill gas is used. Other technologies are wind power, energy from waste heatrecovery and hydroelectric activities. Hydroelectric projects are so far considered tohave more positive than negative impacts on climate change, but there is a discussiongoing on to exclude big hydroelectric projects from eligibility, as they are very likely todestroy nature. The combined production of heat and electricity which is known to be ofhigh efficiency is called cogeneration.
To make it easier to follow the proceeding of the methodologies, which will beanalysed, a short description of the project activities is following:
NM0001: Vale do Rosário Bagasse Cogeneration (VRBC); Vale do Rosário SugarMill (VR); Econergy Brasil (ECONERGY); Swedish Energy AgencyThis is a bagasse cogeneration project. It consists of expanding the mill’s cogenerationsystem in order to increase its efficiency and to add value. Therefore, a shift from low-pressure to high-pressure boilers is necessary. The mitigation project supports theeconomic development of the country. There will be different project phases. In aninitial phase, a capacity of 4 MW will be reached, whereas in the later project phasescapacity can get as high as 35 MW. The project was considered by the projectdevelopers prior to the electricity market deregulation in Brazil, but had beenabandoned.
NM0010: refer to the description of methane recovery project activities (section 3.1.3.1)

50
NM0019: A.T. Biopower Co. Ltd. (ATB) (UK); Rolls-Royce Power Ventures Ltd.(RRPV) (UK); Al Tayyar Energy Ltd. (ATE) (Thailand); The Engineering BusinessDivision of the Electricity Generating Authority of Thailand (EGAT EB)This project plans to use rice husks that would otherwise be burned in the open air orleft to decay for energy generation. It will be the task of the project developers toconstruct and operate a new rice husk power plant in Pichit province. The grossgenerating capacity will reach approximately 22 MW (net 20 MW). NM0019 statesthat, following scientific forecasts, Thailand’s demand for electricity will double from2001 to 2012. By increasing the capacity, the project will contribute to securing steadysupply sources. In addition to that, the mitigation project improves the disposal of amajor source of agricultural waste and delays or even displaces carbon intensive fuels inthe grid, which is dominated by natural gas, lignite and imported fuel oil.
NM0020: Republic of Colombia; Empresas Públicas de Medellín E.S.P. (EEPPM);Electric Power Development Company, Ltd. (Japan)This is a hydroelectric project consisting of two hydroelectric plants in a chain. It willhave a total installed capacity of 31.5 MW. La Vuelta is located in the upper part of theriver and will have a capacity of 11.7 MW, whereas La Herradura lays in the lower partand will reach a capacity of 19.8 MW. In addition to representing a zero-emissiontechnique, which will reduce GHG emissions, it will improve the electricity service inColombia and contribute to the regional development.
NM0023: Mexico; Impulsora Nacional de Electricidad (INELEC), S.A. de C.V.;Corporación Mexicana de Hidroelectricidad, S.A. de C.V.; Scudder Latin AmericanPower Fund (SLAP); Prototype Carbon Fund (PCF)This is also a hydroelectric project, which makes use of an existing dam, at theCutzamala River in the state of Guerrero. By feeding electricity to the grid, it avoidselectricity generation and CO2 emissions at fossil fuel fired power plants. The capacitywill reach 30 MW. Due to a lack of funds, clean energy generation has never beenimplemented, although the energy demand is increasing. For sustainable development,growth diversification in the grid is indispensable.
NM0024: Empresas Públicas de Medellín (EEPPM); the Prototype Carbon Fund(PCF); the Republic of ColombiaThis project is a wind based generation facility. It will be located in Wayuu IndigenousTerritory in the North-eastern region of the Atlantic Colombian coast, within the regionof Uribia in the Department of Guajira. The construction will be completed in January2004. The electricity generated will be fed to the Colombian National Interconnected

51
System (SIN). The facility will deliver around 68.3 GWh/year. The aeolic capacityaddition of 19.5 MW is relatively small in relation to the installed net capacity of 13.2GW of the grid. In spite of this, it is a very useful project activity, because of theincreasing energy demand. It will not displace other facilities, but eventually delaythem. In Colombia, energy facilities are mostly thermal.
NM0027: Grupo Virgolino de Oliveira; Catanduva Sugarcane Mill; Ecoinvest; TheMinistry of Science and Technology of the Federative Republic of Brazil; TheMinistry of Housing, Spacial Planning and Environment of the Netherlands; Senter,Dutch governmental agency (CERUPT) 112
This is a project that uses bagasse to produce energy. First, the electricity generated willbe used for the production of sugar and alcohol on-site. Then, the surplus of electricity(surplus capacity equalling about 19.5 MW) will be commercialized. The project is nowin the setting-up phase with financial structuring, Power Purchase Agreements (PPA)and turnkey services under negotiation. The capacity of the electricity plant will be of25 MW. GVO is the parent company of Usina Catanduva Sugar Mill and plans to startoperation in 2004.
NM0030: Balrampur Chini Mills Limited (India)This is another bagasse cogeneration project with a 20 MW nominal capacity. Thefacility will operate for 320 days per year, with 200 days of crushing season and 120off-season days. The PPs ensure that there is sufficient bagasse available, so this willnot create leakage. The facility will utilize available mill generated bagasse effectivelyfor generating steam and electricity, for meeting on-site consumption and for exportingthe surplus electricity to the grid. On-site consumption consists of the sugar plantrequirements of steam and power, the auxiliary power as well as the steam requirementsof the cogeneration unit itself. This increase in capacity is very welcome to the region,as there is already a power deficit in Uttar Pradesh.
NM0031: OSIL; Ministry of Environment & Forestry, IndiaThis is a project that aims at recovering wasted heat in a coal based rotary kiln forsponge iron making. Energy efficiency has a high potential of being improved at thisfacility, as a significant amount of waste gases at 800°C are exhausted from the Direct
112 CERUPT (the Certified Emission Reduction Unit Procurement Tender) is the public tendering
procedure of the Governmental Agency Senter. It has been argued that the Dutch approach does notfully correspond to the requirements of Article 12 of the Kyoto Protocol. Many NGO’s (like “CDMwatch”) claim that the CERUPT benchmarks are not conservative and that most CERUPT projectsturn out to be BAU projects, i.e. non-additional; see CDM watch (2004).
52
Reduction Iron (DRI) kiln and released into the atmosphere. The sensible heat containedin the waste gases will be recovered and utilized to meet the total power requirement ofOrissa Sponge Iron Limited (OSIL) and Orissa Steel Works (OSW).
NM0035: Thiru Arooran Sugars Ltd, India; Prototype Carbon Fund (PCF)In this case, a sugar cogeneration facility is already in place. The cogeneration unitsproduce enough steam and electricity from bagasse to satisfy sugar mill demands duringcrushing season. By installing high efficiency boilers and additional turbines, efficiencycould be enhanced, and the excess power could be fed to the grid. During off-season,coal or lignite will be used instead of bagasse in an early project phase, but graduallythese energy sources will be substituted by agro-biomass. This methodology deals withthe capacity augmentation component, whereas another methodology (NM0028) onlytreats the fuel switching component.
3.1.4 Comparison of Selected Methodologies
Based on the criteria responsible for the additionality of a project activity, which havebeen explained in section 2.2.2, the methane recovery methodologies and the electricitygeneration methodologies will now be analysed and compared.
3.1.4.1 Methane Recovery
Baseline SelectionMost methane recovery methodologies start by explaining what the baseline scenario isand how it has been identified by using a Scenario Analysis. Apart from NM0004, allmethodologies use this approach. NM0004, however, starts with a pre-determinedbaseline scenario. The PPs support their approach referring to the fact that, in thisspecial case, there has been a call for tender with a determined percentage of methane tobe recovered. As the contract has been signed, the PPs declare the contract scenario asthe only possible baseline scenario. Still, it should be addressed, if there is a possibilityof renegotiation.
NM0005 states at the beginning, that the methodology is only applicable, if the BAUscenario is the baseline. This restriction is permissible, because this is the output of thescenario analysis in this case and this is the basis for all further calculations provided bythis methodology.

53
In order to choose the baseline scenario, a wide set of arguments is presented. NM0010defines them clearly by differentiating between legislation (regulatory requirements /policy), landfilling capacity, costs, environmental issues and revenue. They can beclassified into qualitative (cost, revenue) and quantitative criteria (legislation, capacity,environment).
Additionality AssessmentAfter having determined the baseline scenario, it has to be demonstrated that thebaseline scenario is not identical with the scenario of the project activity. Themethodologies proceed respectively in another way, if there is a policy in place or not.
If there is no policy in place, e.g. NM0021 can be used. The legal requirements aretested to ensure that all relevant regulations have been dealt with. Then, NM0021 makesa quantitative analysis comparing the baseline scenario to the project activity. It has tobe shown, that the project activity is not the least-cost-opportunity. As an alternative,NM0005 compares the IRR of the project activity either to the IRR of the baselinescenario or, alternatively, to bond rates or other hurdle rates. NM0005 also provides asensitivity analysis of the calculation of the IRR.
After having tested the quantitative aspects, NM0021 continues with a qualitativeassessment. This assessment consists of a barrier analysis (also applied by NM0010), atest that shows that the project activity is “not common practice” and a credibilityestimate.
The barrier analysis, the methodologies apply, can be systematised in three maincategories: structural criteria (investment barrier, barrier due to prevailing practice,technological barrier and limited information), institutional barriers such as policies orregulations and rather strategic, company internal criteria (e.g. managerial resources,organizational capacity, financial resources and capacity to absorb new technologies).
The test, showing if a project activity is “not common practice” in the country, dealswith a barrier of implementation. If the corresponding technology is implemented inless than 5 % of the cases, NM0021 considers the project activity as being “not commonpractice” in the country.
Lastly, credibility is assessed by analysing if the financing perspective is realistic. Theanalysis checks if the PPs can count on sufficient local support, if physical obstructions

54
like availability of fuels, skilled employees and techniques exist, and finally, if futurelegislation, if enforced, could influence the baseline.
Another approach is chosen in the case of an existing policy. Two situations arepossible: the over-performance (NM0004) and the non-compliance (NM0032).
In the case of over-performance, a quantitative analysis is chosen. The baseline ischaracterized by the implementation of the contract or policy in place, whereas theproject activity comprises an over-performance of the contract, i.e. the emissionreductions are higher than the contract requires. The underlying argument of NM0004 isthat the over-performance would not create additional revenues, as the quantity inemission reduction is fixed in the contract and related to fixed revenue. Therefore, asimple cost comparison is sufficient to show that the project activity would not beundertaken.
In the case of non-compliance, a qualitative analysis is applied. First of all, the reasonshave to be specified by the PPs e.g. financial reasons (no support by municipal bodies),no allocation or appropriation by the state or the government. As a next step, a barrieranalysis is conducted examining investment barriers, technological barriers and barriersdue to prevailing practice. In NM0032, this analysis is followed by a description statingthat the BAU scenario is identical with the baseline scenario, specifying the percentageof compliance and explaining how measures will be implemented under the CDM toincrease compliance.
Baseline SettingTechnology specific, country (region) specific and project specific components can beidentified. Technology specific and country (region) specific components can bestandardized, whereas project specific components have to be assessed for each projectactivity submitted.
The setting of the baseline type is project specific. NM0004, NM0005, NM0010,NM0021 choose a forward-looking baseline, whereas NM0032 uses an historicalbaseline. This can be explained by the fact that NM0032 is the case of a non-compliedregulation. The assumption is that in the baseline scenario “nothing would change”, i.e.the BAU scenario.
The crediting lifetime is project specific and coincides with the operational lifetimeexcept for NM0004 (with an operational lifetime of 17 years) and NM0021 (with an

55
operational lifetime of 30 years). NM0004, NM0005, and NM0010 use a renewablecrediting period of 3 times 7 years, whereas for NM0021 and NM0032 a fixed creditingperiod113 of 10 years is chosen.
Boundaries have to be equivalent for the baseline scenario and the project scenario.The boundaries are addressed as following:
The geographic boundary is generally defined as the actual and future project site(s) ofthe BAU activity. In most cases (NM0004, NM0005, NM0010, NM0032), only thedirect on-site emissions are included into the boundary. This is a narrow definition.Only the CERUPT methodology, NM0021, includes all direct emissions. A narrowboundary turns measurements of emission reductions less complex, but, at the sametime, runs the risk of excluding other decisive emissions. Therefore, an accurate leakageassessment is crucial in conjunction with a narrow boundary.
The system boundary is very important for project activities generating electricity withlandfill gas as a fuel. If no CERs are claimed for displaced grid electricity, the systemboundary consists of the power purchase options and eventual autogeneration options(NM0010). If, on the other hand, unused excess capacity is supplied to the national grid,for which CERs are claimed (NM0005), the electric system forms the system boundary.Methodologies for project activities not generating electricity only take the urban wastemanagement system as a system boundary (NM0032)
All emissions not comprised in the boundaries are considered as leakage, i.e. all indirecton- and off-site & direct off-site emissions (NM0004, NM0005, NM0010, andNM0032), except in the CERUPT case, where leakage covers only the indirectemissions (NM0021).
Direct on-site emissions in the baseline come from the uncontrolled release of landfillgas (NM0005). Emissions from transportation of leachate are excluded for simplicityand conservativeness (NM0021). In the project scenario, the main emissions are thefugitive landfill gas emissions (NM0005, NM0021). The following are emissionsconsidered to be negligible: First, CO2 emissions generated from CH4 produced byplastics decomposition (NM0004, NM0032) are not included for simplicity, i.e. becauseof their small amount. For the same reason, emissions from the use of auxiliary andback-up power either from the grid or from a generator using landfill gas or diesel are
113 Required by CERUPT and the PCF

56
excluded (NM0021). The energy used for preparing the gas for final use is alsoconsidered to be negligible (NM0021).
Direct off-site emissions in the baseline case are emissions from the use of gridelectricity (NM0004, NM0005) and in the project scenario, the transportation ofequipment to the project site and the use of electricity generated from landfill gas(NM0004, NM0005, and NM0021). The electricity from landfill gas is a positiveleakage for NM0004 and NM0005, but not for the CERUPT methodology, for which itbelongs into the boundaries. All direct off-site emissions are excluded forconservativeness.
Indirect on-site emissions in the baseline scenario are not identified. In the projectscenario, emissions from electricity used for operation of lights and fans on-site areexcluded by NM0005 and NM0010, because electricity from the landfill gas is carbonneutral. Emissions from the construction of the project are excluded as well by NM0005and NM0010, since those emissions would occur with an alternative project in thebaseline, too.
Indirect off-site emissions can be generated from transport of waste to the landfill inthe baseline scenario as well as in the project scenario and are therefore excluded(NM0005, NM0021). Emissions from the grid electricity for pumping during the yearare also excluded, because they are considered to be negligible (NM0004, NM0032).
In the proposed methodologies, leakage seems to be negligible. This warrants thenarrow boundary. Although in principle, the boundary setting is project specific, atechnology specific standardization of the boundary including only the direct on-siteemissions makes sense, because, generally, the leakage occurring seems to benegligible.
The uncertainties addressed generally refer to the conditions under which themethodology is applicable and to the risk that the key assumptions could not be met(NM00010), e.g. the tariffs for electricity (NM0005, NM0010) and the performance ofthe plant are uncertain. It cannot be proved definitely that the setting of plausiblealternatives in the scenario analysis has been done correctly. Further, the financialanalysis could be not conservative enough and the financial assessment applied to aborderline case might lead to wrong results (NM0005). Especially for the technology oflandfill gas recovery, the quantity of CH4 released to atmosphere in the baseline remainsuncertain, because there are commonly no CH4 release monitoring systems in landfills

57
of developing countries and for this reason the baseline has to be constructed withouthistorical data supporting the trends114.
Concerning the baseline setting, the general conditions are country specific:NM0004 states for Brazil that, the typical recovery of methane or biogas is minimal andthat there is no regulation in place. 20% recovery is therefore a very conservativeestimate. NM0005 proved by a control group approach that uncontrolled release oflandfill gas (LFG) to the atmosphere is the prevailing practice. The minimal standard forlandfill gas collection systems is fixed by regulation requiring 40 passive drainage wellsat approximately 50 m intervals reaching 2 m in depth. NM0021 points out, that thelandfill gas is only required to be vented in order to avoid the risk of explosion, becausethe current priority of national policy is to prevent the illegal dumping and to improvethe conditions at official landfill sites.
In South Africa (NM0010), monitoring of CO2 and CH4 concentrations at all hazardousand large landfill sites is required. The concentration of the flammable gas in the airmust not exceed 1% and the concentration of CO2 must not exceed 0.5% by volume. Ifthe methane concentration exceeds 5% in the air, permanent venting systems becomeobligatory. Hence, the cost for gas capture and flaring are still so high that it is notprobable to be prescribed in the near future. Therefore, the currently existing wells,which would continue to operate with a declining efficiency, would not be replaced andno further wells would be installed. On the other hand, in the case of NM0010, the fact,that there are existing wells, is project specific, because they were originally only put inplace to control for odour, to guarantee local safety as well as to investigate the potentialfor electricity generation. But these plans had been abandoned for cost reasons.
On the contrary, in India, there is a policy in place (MSW Management Rules, 2000),but NM0032 underlines, that it is not enforced. The percentage of compliance isreflected in the yearly compliance report (published by Central Pollution Control Board,CPCB). NM0032 proposes to set the baseline assuming an increasing percentage ofcompliance starting in 2003 with a compliance of 0% in order to achieve compliance of50% in 2015.
Calculation of ERsAll methodologies monitor the landfill gas that is captured. This differential is taken torepresent the ERs. This proceeding does not entirely follow the additionality concept: it
114 See Hanna, Javier (2004)
58
is not possible to say, that a ton of methane collected is equal to one ton of methane notreleased into the atmosphere, because the new gas collection system itself has aninfluence on the generation of GHGs. Therefore, the emissions captured are not entirelyequal to the emission reductions achieved. Still, it would be less accurate to useestimations for modelling the baseline emissions to compare them directly to theemissions of the project activity. A monitoring of the baseline emissions (beinghypothetical) is not possible, if the project activity has once been put into practice. Inorder to satisfy the additionality criteria, a correction factor has to be applied. Thesolution might be a default factor, which is deducted from the emissions captured. Theremaining emissions recovered are then considered to represent the emission reductions.In order to determine the baseline emissions equally for each landfill gas recoveryproject activity, a technology specific standardized calculation method has to beemployed.
NM0005 uses the Effectiveness Adjustment Factor (EAF) to compare the gascollection system of the baseline to the one of the project scenario. The EAF isdetermined by the frequency and the depth of the gas wells, the suction applied to thewells, and the efficiency of flares (the results are highly site specific). NM0005 forexample reduces the estimated baseline emissions by 25%. In the case of NM0004, theeffectiveness of the gas collection system is not estimated, because of the projectspecific circumstances: there exists the tender contract, which is taken as the baselinescenario, and it is believable that the project developer will be able to comply to it,because its performance has been among the top 20% in the previous five years.
The model for calculating the emission reductions is very technology specific: Allmethodologies except NM0032 apply the First Order Decay Model to measure theemission reductions. This model is generally applicable to landfill gas recovery projectactivities, which dispose of the data needed. The results are project specific, as themethane generation rate (depending on the waste composition (organic fraction) and theoverall waste disposal practice) is highly site specific. The decay rate instead, which isanother parameter of the model, is country/region specific as it depends on thetemperature and humidity of the landfill.
In the case of a lack of data availability, like in India (NM0032), the IPCC defaultmethod, which is a mass balance approach that involves estimating the degradableorganic carbon content in the solid waste to calculate the CH4 that can be generated by

59
the waste115, may be used instead. The monitoring of the quantity of waste received atthe landfill and of the quantity of methane flared has to be continuous, as it can vary bymore than 20% during a day (amount of LFG collected, percentage of LFG that is CH4,flare working hours), the flare emissions have to be quarterly analysed. This is alsotechnology specific.
3.1.4.2 Electricity Generation
Baseline SelectionSimilar to methane recovery methodologies, most electricity generation methodologiesstart with the identification of the baseline scenario. Therefore, the PPs use either aScenario Analysis or Series of Questions. However, NM0023 and NM0019 compare apre-determined baseline scenario to the project activity without discussing otheroptions.
The Series of Questions are applied by NM0001 in a well structured way, but remainunclear and confusing in the case of NM0020.NM0001 asks four questions concerning the hypothetical behaviour of:
1) The public sector (eventual policies and plans),2) The private sector (referring to historical similar plants and other possible
investors and their access to resources),3) The present promoter (this has to be done by a barrier analysis, but in special
cases, e.g. for a small-scale project, it is sufficient to add a convincing papertrail demonstrating that the project activity has been conceived andimplemented only because the project activity was in the running for theCDM),
4) Public sector’s policies and programs
Instead of this clearly structured approach, NM0020 poses a confusing set of questionse.g. referring to policies (regulatory and institutional conditions), to market barriers(risks, economically attractive course of action) and other barriers. Finally, it addressesthe question of how the CDM would help to overcome the named barriers, but withoutsupplying clear criteria. It only states that the project activity has been considered for a
115 See Hanna, Javier (2004)

60
long time, but was never undertaken. It then states that the CDM changed the attitude ofthe PPs now perceiving the project activity under the CDM as an opportunity.
The other possible approach is the Scenario Analysis. Similarly to the methane recoverymethodologies, it starts by identifying possible future scenarios which will then be putthrough a quantitative (NM0010, NM0020, and NM0035) and/or a qualitativeassessment (NM0024, NM0027, and NM0035). NM0030 does not conduct a profoundassessment. It only discusses the different options under plausibility aspects. Themethodologies NM0010, NM0019 and NM0023 state that they are only applicable, ifthe BAU scenario is the baseline scenario.
For the qualitative assessment, the following criteria can be identified: NM0010 andNM0035 assess legislations and national policies, NM0010 and NM0020 explain costreasons (NM0020 restricting the analysis to developer’s projects), NM0010 treats atechnology barrier and NM0035 looks at the power requirements in the grid.
The quantitative assessment offers two variations to proceed:NM0024 and NM0035 use the least cost planning. First, all alternatives within theboundaries of the baseline scenario are identified. Then, investment costs are estimated,and the least cost option is considered to be the baseline scenario (NM0035). Finally,the investment costs are estimated for the project activity (NM0035). As NM0035 isrelated to a capacity augmentation, it also estimates the increased electricity generation.NM0024 points out that, for this analysis, key parameters like the project lifetime andthe discount rate have to be specified in the PDD.
Another criterion, the internal rate of return (IRR), is used by NM0027. This is asuitable criterion if the projects, apart from provoking costs, create benefits. NM0027compares the IRR of several scenarios to each other and chooses the activity with thehighest IRR as the baseline scenario. However, investment theory teaches that theselection between projects cannot be based on a direct comparison of the IRRs. The IRRmay only be used in reference to the market interest. Therefore, the proceeding ofNM0027 at this point of the analysis is not valid.
Additionality AssessmentThe assessment, whether the project activity is not the baseline, can be donequantitatively or qualitatively.

61
NM0010, NM0027 and NM0031 choose a quantitative approach using a comparativecost analysis. This is applicable if income from the project activity is not substantial.
NM0010 compares the cost for purchasing power (baseline scenario) to those ofautogeneration (project activity). For this analysis, reliable market data is needed. If thedata is not available, a continuous monitoring could be an alternative. The difficulty isthat a baseline cannot be determined ex-post, as the point of reference is the decisiontoday which relays on an ex-ante estimation for what will happen in future. However, anex-post reassessment of the baseline is indispensable, if conditions have changed andthe PPs would, at a certain point in time, have adopted the project activity even withoutthe CDM. From this point on, the project activity would no longer produce credits.
NM0031, on the other hand, compares the project activity not to the market prices, butto the costs of its own fuel based power plant, as this would be the baseline scenario forthe OSIL activity.
A qualitative approach is chosen by NM0001, NM0019, NM0020, NM0023, NM0024,NM0027 and NM0031. As well as in the case of the methane recovery methodologies,the electricity generation methodologies look at different barriers, which can be put intofive groups: institutional barriers, structural barriers, strategic barriers116, the rubric“how to overcome” these barriers and the analysis of similar activities.
Regulatory barriers (NM0023, NM0027, and NM0031) and national policies (NM0019)belong to the rubric of institutional barriers.
Six structural barriers can be identified. NM0027 deals with a barrier due to limitedinformation. A barrier to investment is largely cited (NM0001, NM0019, NM0020,NM0023, NM0024 and NM0027), referring for example to the access to capital, a lackof funding, the perceived market risk, a low return of investment and cost/profitlimitations. Another barrier, only named by NM0019, is the political gaming. Two othermarket barriers described are the technological barrier (NM0019, NM0024, NM0027and NM0031) and the barrier due to prevailing practice (NM0019, NM0020 andNM0030). The last barrier, which is very similar to the barrier due to prevailingpractice, occurs if a project activity is “not common practice”117 (NM0023, NM0024,NM0027, NM0030, NM0031 and NM35): NM0024 states that technologies applied in
116 See Wied-Nebbeling, Susanne (2004), pp. 8-12117 See EB10, Annex 1, A.2.

62
less than 5 % of the cases in the country or in less than 5 locations are to be consideredas “not common practice”. NM0030 stands for another percentage referring to thePareto 80/20 Rule: the methodology pretends that the Pareto Rule claims that 20% ofthe technologies implemented are “not common practice”. This interpretation is wrong,as the 80/20 Rule refers to the efficiency in production processes and means that 80% ofthe benefits come from only 20% of the effort118. All the same, NM0031 considerstechnologies with a market share smaller than 20% to be “not common practice”. But itdoes not state why exactly this percentage has been chosen.
Comparable to the cases of methane recovery, PPs enumerate strategic barriers, i.e.company related barriers like corporate culture (NM0001), corporate decision-makingcriteria and opportunity costs (NM0001), managerial resources (NM0019, NM0027),financial resources (NM0027), capacity e.g. organisational capacity and capacity toabsorb new technologies (NM0023, NM0027).
The rubric “how to overcome” shows how the CDM helps the PPs to overcome thebarriers named before (NM0023).
NM0023 chooses an additional barrier test to examine if similar activities have beensuccessful. The activities have to be similar, in the sense of a control group approach,which refers to several criteria, like the country, the technology, the scale, and theenvironment. If the other activities have not been successful, this is interpreted as asignal for a barrier. If they have been successful, further analysis is needed to prove whythe proposed project activity would instead be unlikely to take place. However, it can bedifficult to find a control group of activities that are similar enough to allow conclusionsto be drawn.
Baseline settingAgain, as for methane recovery methodologies, technology specific, country (region)specific and project specific components may be identified.
The setting of the baseline type is project specific. NM0010, NM0019, NM0023,NM0024, NM0027, and NM0035 choose a forward-looking baseline, whereasNM0001, NM0020, NM0030, and NM0031 use a historical baseline.
118 See Meth Panel Recommendation for NM0030 (2003)
63
Here, the crediting lifetime often differs from the operational lifetime of the projectactivity (mentioned in brackets, if different). NM0010, NM0019 (minimum of 25years), NM0020 (50 years), NM0023 (25 years) and NM0024 use a renewable creditingperiod of 3 times 7 years, whereas for NM0027 (25 years)119, NM0030 (20 years),NM0031 (20 years) and NM0035120 (15 years) a fixed crediting period of 10 years ischosen.
BoundariesThe baseline boundary and the project boundary should have the same scope and beconstructed following the same rules. The scope of the boundary is project specific.Nevertheless, there is a common basis where all methodologies start from:
In all cases, geographic boundary comprises the project site including all theequipment (e.g. NM0001: cogeneration equipment and bagasse storage). It then has tobe examined to see if other facilities (e.g. NM0001, NM0030: nearby facilities) could beaffected by the project activity (e.g. NM0001, NM0030: change in fuel consumption).
The system boundary is generally the interconnected system. For NM0010, not onlythe power purchase option, but also the autogeneration option is part of the systemboundary. NM0027 and NM0030 do not include the interconnected grid into theboundary, stating that the impacts are not under the control of the project developers.Significant imports or exports have to be considered. For example, NM0023 andNM0024 make the conservative assumption that the import comes from zero-emissionfuels. This means that they do not claim CERs for reducing carbon-intensive electricityimports. The export of electricity is taken into account using national data.
The emissions should be classified as direct on-site, direct off-site, indirect on-site orindirect off-site. Emissions outside of the boundary are automatically leakage. It has notbeen clearly defined, if the boundary should always include all direct emissions andmitigation like the CERUPT methodologies do (NM0027 in the case of electricitygeneration and NM0021 in the case of methane recovery). Most methodologies includeonly the direct on-site emissions and some of the off-site emissions in their boundary.
How far related activities have to be included into the boundary, is a very projectspecific decision, which has to be controlled by the DOE. It is a conservative approach
119 Required by CERUPT120 Required by the PCF
64
if some baseline emissions are not included into the calculation (e.g. NM0019). Thiscan, at the same time, reduce complexity. Emissions only necessitate being included, ifthey are bigger in the project scenario than in the baseline scenario.
Significant emissions from transport and construction (excluded by NM0031 becausethe amounts are negligible and the emissions occur only during the first project phase)of e.g. a new plant or transmission lines (NM0030) should be considered (e.g. NM0019and NM0020). If a fuel has to be supplied, emissions from the fuel handling, includingextraction, processing (NM0023) as well as transportation of fuel, material or perhapseven manpower (e.g. NM0019, NM0030) to project site and on-site, have to beconsidered. Impacts of a start-up / auxiliary / back-up fuel, if needed (e.g. NM0019,NM0027), have to be estimated.
Transmission and distribution (T&D) losses should be included, if they are significantand higher in the project scenario than in the baseline scenario like NM0030 suggests,but they may be excluded like in NM0001, if they are estimated to be equally high inthe baseline and in the project scenario.
The emission reductions through replaced heat or electricity production at the projectsite that are an indirect effect of the project activity (NM0027) may be included into thecalculation.
The most important part of the baseline emissions consists of the direct emissions fromthe power produced in the grid without the project activity implemented (NM0027).The related emissions are rather country specific.
It is generally stated by the methodologies that only significant emissions necessitatebeing included into the calculation. However, only NM0027 makes the effort toformulate a concrete threshold: significant means that the respective emissions arebigger than 1 % of the total emissions. This threshold applies to emissions inside theboundaries as well as to leakage. Concerning the estimation of leakage, which, even ifprincipally measurable, remains of very high subjectivity, it would not be a conservativeapproach to claim credits for positive leakage, nor to claim the whole quantity ofcalculated CERs in the case of significant leakage. However, it would be artificially andcost intensive to force PPs to include negligible leakage that is difficult to estimate intothe calculations. In order to make the issue of leakage measurement more “user-friendly”, it makes sense that leakage just has to be named, until it is significant.Nevertheless, the negligibility should be demonstrated by applying mathematical rules

65
e.g. a specific percentage of the ERs created by the project activity or of the totalemissions like in NM0027 (<1%). The way leakage is calculated has to be provided forverification. If leakage is, on the contrary, significant, a default percentage has to bededucted from the CERs. The height of this percentage is very case specific and has tobe validated by the DOE. A default portion would simplify the proceeding. If leakageexists but cannot be measured, it can only be addressed under the rubric of uncertainty.
Some technology specific components can be identified:Bagasse is considered to be a zero-emission fuel. This means that CO2 from bagassecombustion is carbon neutral and can be ignored (e.g. NM0019). All the same, it isconservative to ignore N2O emissions from bagasse combustion for the baselinescenario and for the project scenario, as by the rotting of bagasse, there is much moreN2O generated. The baseline scenario should be determined conservatively. Forexample, if the bagasse, like explained in NM0019, would be left to rot on the field, it isa simplifying and conservative assumption to say that all surplus bagasse would beburned open air. As CO2 and N2O are not relevant, only CH4 would be accounted for.Energy-from-bagasse project activities typically mention CH4 and CO2 emissions in thebaseline case from bagasse storage. But these emissions may be excluded, becausecogeneration projects neither increase the bagasse production nor extend the term of theBAU bagasse storage. The process of decomposition advances quite slowly. NM0001,NM0019 and NM0027 state that their bagasse, which is well exposed to oxygen,produces less anaerobic methane (approximately 80% of CO2 and only 20% of CH4) asin the baseline case, where it would be left to rot. In addition to that, the amount ofstored bagasse is limited to a time smaller than one year and the remaining bagasse isburned before the next harvest season. Further, the quantity of energy used forpreparing the gas for final use should be estimated. In the case of restricted bagasse,the project may lead at other facilities to a diversion from biomass to a more carbon-intensive fuel (NM0001, NM0019). If the impacts of the tight supply are significant,they may be taken into account using a discount factor (NM0019).
During hydroelectric projects, CH4 may leak into the atmosphere from the reservoirbecause of organic matter decomposition in the flooded areas (NM0023). Anothersource of emissions is the CO2 from the cement plant, which produces the concreteused for construction of the project (NM0020). CH4 emissions from displaced hydroenergy in other plants are considered by NM0020 to be in most cases negligible.
Uncertainties: The uncertainties refer to the accuracy of projections e.g. the baselinescenarios, the models, algorithms and parameters for baseline emission calculations, the

66
assumptions concerning the marginal costs, the development of generation mix, theoutput of the plants and the development of emission factors during the crediting period.
Uncertainty may be reduced by conservative assumptions or by monitoring the activityrelated data ex-post and using it in the actual computation of CERs: the ex-post CEFshould replace the ex-ante CEF if it represents a lower value. But uncertainties are onlyreduced from the point of view of the credit issuing body. Taking the ex-post values, theuncertainty for the project developers increases as their calculations are based on the ex-ante estimations.
Concerning the baseline setting, several issues are country specific: the availability ofofficial grid data, official projections for the annual grid and assumptions concerningthe mode of disposal for unwanted agricultural residue (NM0019).
The methodologies all have something in common, which is that the baseline scenario isnot one specific alternative project. On the contrary, the impact of the project activity isdispersed throughout the electric sector’s operation and expansion, as the most likelynon-project option is to use power from the grid. Therefore, the project activity willdisplace or delay an equivalent amount of grid electricity, which can be generated byfossil fuel, but also by renewable energy sources.
Calculation of the Emission Reductions:The annual grid average carbon emission factor (CEF) is calculated using official dataof and projections for the national, regional or local electricity grid. The CEFs refer tothe different kinds of electricity generation. For the sake of conservatism, the CEF foreach electricity generation type should be based on the best technology available in theparticular grid and include future technological improvements. The CEFs should resultin an average weighted CEF for the whole baseline scenario.
The PPs have chosen various options belonging to three main groups of methods: theDispatch Approach, a very accurate but complex method, the System AverageApproach, a simpler but more transparent method, and marginal approaches.
These methods are illustrated in Figure 7 and explained in the following.

67
The Dispatch Model:The Dispatch Model, also known as the production cost model, is the most sophisticatedapproach. It can be applied ex-post for verification or ex-ante if a model is used tosimulate the complex operations of the interconnected grid system responding to avolatile demand. Taking into account both short term marginal costs and long termmarginal costs (also called marginal capacity costs), this approach covers adjustments ofthe current system as well as impacts on capacity addition. However, its implementationis costly and data requirements are high. NM0020 fixes ex-ante baseline parameters, butadmits that there is still an ex-post component, because the calculation uses values ofthe situation where the project activity has been implemented. NM0024 clearly definesits approach as an ex-post dispatch analysis, pointing out the increased accuracy andreliability of data. However strictly spoken, as discussed in section 2.2.2.5, an ex-postbaseline setting contradicts the concept of a baseline, which is an ex-ante estimation.
The System Average Approach:On the contrary, this is the easiest method to calculate the emission reductions achievedby supplying the less carbon intensive energy to the grid. It is calculated by taking theweighted average emissions rate of all current operating electricity plants in thecountry resp. region. In the case of NM0010, the grid emission rate is calculated from
Figure 7: Methods for the Calculation of the Emission Reductions
Combined Margin
OM BM
only OM
the 20% or 5 most recentweighting
½ OM ½ BM
single proxy plant
forecasted data (MCMM)
Calculation of Emission Reductions for Electricity Generation Project Activities
DispatchGrid Average
specific alternative
computerized optimization model
all
only BM
excludezero-emission, must-run and
low-cost
sources included

68
the grid operator reported data for annual CO2 emissions and power output. It averagescoal-fired power plants and other less carbon-intensive power sources. Themethodology argues that this is conservative, because the project is a must-run-capacityand will affect the whole supply mix. The project activity’s impact on the currentcapacity is decisive. On the contrary, NM0010 states that the impact on green fieldprojects can be neglected as the South African grid is characterized by its overcapacityand the project activity’s contribution to the grid is very small.
This example shows that it depends on the one hand on the type of electric grid and onthe other hand on the project activity itself, why an approach is conservative or not. Insection 3.2.1.2, this finding will be used for suggestions of improvement.
The Operational Margin (OM) Method:The OM refers to adjustments in the existing grid mix due to the project activity. Theplanning horizon is rather short-term. Therefore, the short term marginal costs (= theoperating costs for the last unit produced by a plant to meet the demand) are relevant.The emissions produced by the plants, which are on the margin, are taken to calculatethe carbon emission factors (CEF).
As explained in NM0030, four main approaches may be distinguished to calculate anOM: The calculation of the OM can follow a dispatch analysis, which would be asimilar calculation like it has been explained for the Dispatch Model, but only referringto the short term marginal costs. A dispatch decrement analysis is a less costly andless complex alternative, which continuously analyses dispatch data in order to achieveempirical evidence on how the load is covered. The simplest method would be ageneration weighted-average of all resources, assuming that the project avoids aproportional fraction of all generating units in the system, but which can create largeinaccuracies not providing realistic baselines in some cases. A modified method is theweighted average of all resources except zero-emission, low-cost and must-runfacilities. This approach is more accurate for projects that displace peak-load facilitiesin grids, where zero-emission, low-cost and must-run facilities cover only the base load.But if there is a possibility that the project activity displaces also zero-emission, low-cost and must-run facilities like in hydro-dominated grids, only a certain portion (e.g. acountry specific percentage) may be excluded from the OM. Otherwise, this approachwould no longer be conservative. There are different options to calculate the portion tobe excluded: the most sophisticated option is to determine the hours per year in whichzero-emission, low-cost and must-run facilities also cover middle- and peak-load. Thedrawback: the data is often difficult to obtain in developing countries. Another option is
69
to simply exclude the base load zero-emission, low-cost and must-run facilities based onmeasured historical data. Any generation above the base load is assumed to be part ofthe OM.
The Build Margin (BM) Method:The BM stands for the investment alternatives in other sources of electricity, i.e. itrepresents adjustments of green field projects due to the project activity. The planninghorizon is rather long-term. Planned projects may be entirely displaced or only delayedby the project. Since the project activity may affect all prospective new capacity, theBM baseline should generally reflect all power plant types to be added to a system.NM0030 characterises two options for calculating the BM: if sufficient data is availablethe average of recent capacity additions is taken, estimated by choosing either thegeneration-weighted average emissions rate of the most recent 20% of plants built (on ageneration basis), or the most recent 5 plants, whichever is greater. Alternatively, asingle proxy plant type may be defined as the lowest cost resource (region specific).Also national policies for the expansion have to be taken into account.
If it is rather unlikely that certain sources will be displaced or delayed by the projectactivity, they may be excluded from the calculation of the BM. For example, NM0030excludes large-scale projects bigger than 250 MW and public-sector long term energysystem planning. This avoids the exclusion of the next most recent projects from theBM, which are probably affected by the project activity.
Nevertheless, BM predictions are very vague, especially in developing countries andmarkets where new technologies are emerging, because it is just an assumption thathistoric and current expansion data is indicative for future capacity increase.
The Combined Margin (CM) Method:The combined margin is composed of both the operating margin and the build margin,because most project activities have short as well as long term impacts. The weightingis dependent from a variety of factors. The default weighting chosen in themethodologies NM0001, NM00023 and NM0031 is ½ OM and ½ BM, at least for thefirst crediting period. NM0001 sets the combined margin for the second and thirdeventual crediting period equal to the BM, reasoning that in later stages, only the longterm impact remains relevant. The Modified Combined Margin Method (MCMM) is amodification of the Combined Margin Method. In the MCMM, the baseline emissionfactor is sensitive to sector wise capacity additions.

70
Figures 8a and b provide an overview of the proposals made by the chosen electricitygeneration methodologies.
NM0010: grid average emission rate (coal-fired power plants and other lesscarbon-intensive power sources).NM0031: CM= ½ OM + ½ BM. OM: weighted average emissions (in kgCO2 equiv. / kWh) of current generation mix (in case of a hydro-dominated gridlow-cost must-run hydro power may be excluded), BM: generation weightedaverage of the 20% recently built or 5 most recent, (if project size less than 1%of the grid size, ex-ante calculations with future capacity additions notnecessary), ex-ante calculation with future capacity additions to be performedat an interval of 5 years.NM0023: CM= ½ OM + ½ BM (default weighting may be varied). OM:generation weighted average excluding sources with zero- and low-operationcost (hydro, geothermal, wind, solar, nuclear, low-cost biomass), BM:generation weighted average of the 20% recently built or 5 most recent (evensmall projects may at least delay the commissioning of new generationsources).NM0001: CM= ½ OM + ½ BM for the first 7 or 10 year crediting period.Only BM for the remaining two 7-year crediting periods, with its re-calculation in years 8 and 15 to reflect the evolution of the power market. OM:generation weighted average excluding sources with zero- and low-operationcost (wind, sun, biomass, hydro (only base load hydro excluded) and nuclear.),BM: generation weighted average of the 20% recently built or 5 most recentplants excluding new installations of electric supply capacity (and similarcapacity under construction) in individual plants that are larger than 250 MW.
Figure 8a: Proposals Made by the Chosen Methodologies
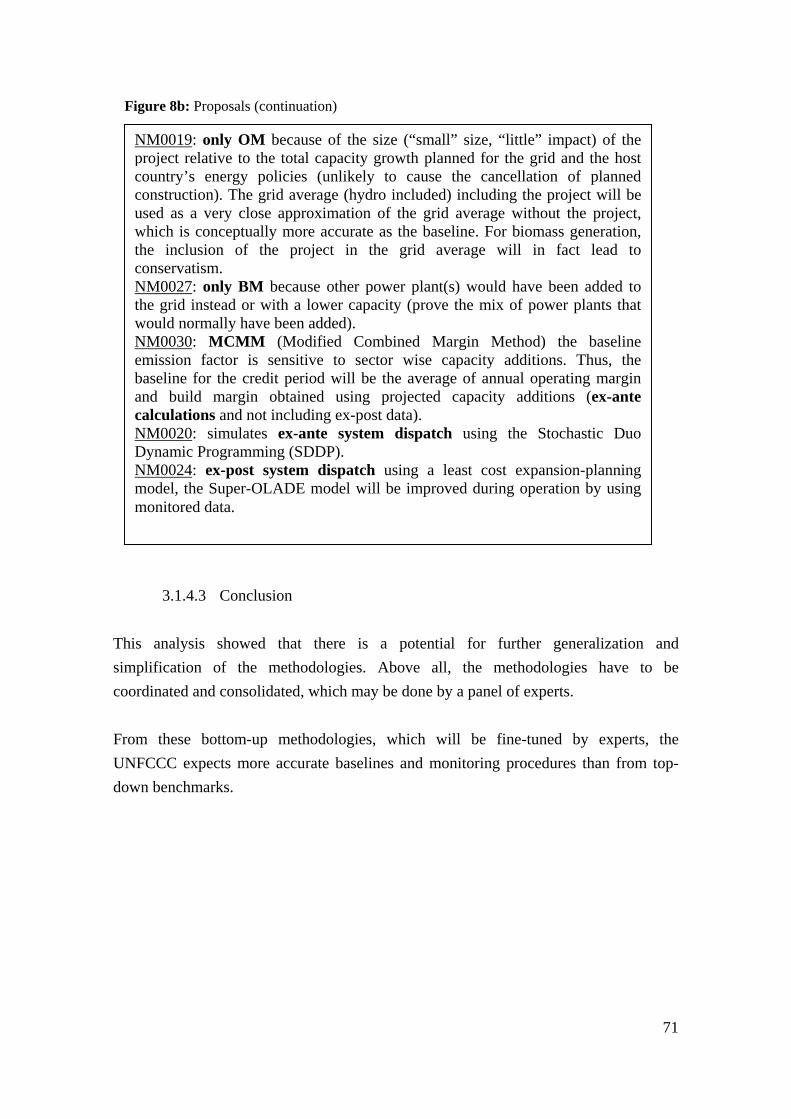
71
3.1.4.3 Conclusion
This analysis showed that there is a potential for further generalization andsimplification of the methodologies. Above all, the methodologies have to becoordinated and consolidated, which may be done by a panel of experts.
From these bottom-up methodologies, which will be fine-tuned by experts, theUNFCCC expects more accurate baselines and monitoring procedures than from top-down benchmarks.
NM0019: only OM because of the size (“small” size, “little” impact) of theproject relative to the total capacity growth planned for the grid and the hostcountry’s energy policies (unlikely to cause the cancellation of plannedconstruction). The grid average (hydro included) including the project will beused as a very close approximation of the grid average without the project,which is conceptually more accurate as the baseline. For biomass generation,the inclusion of the project in the grid average will in fact lead toconservatism.NM0027: only BM because other power plant(s) would have been added tothe grid instead or with a lower capacity (prove the mix of power plants thatwould normally have been added).NM0030: MCMM (Modified Combined Margin Method) the baselineemission factor is sensitive to sector wise capacity additions. Thus, thebaseline for the credit period will be the average of annual operating marginand build margin obtained using projected capacity additions (ex-antecalculations and not including ex-post data).NM0020: simulates ex-ante system dispatch using the Stochastic DuoDynamic Programming (SDDP).NM0024: ex-post system dispatch using a least cost expansion-planningmodel, the Super-OLADE model will be improved during operation by usingmonitored data.
Figure 8b: Proposals (continuation)

72
3.2. Implementation of the Concept of Additionality
3.2.1 Problems of Implementation
3.2.1.1 Principal Agent Problem
The main problem lays in the information asymmetry121 between the PPs andUNFCCC. The relationship between these actors can be described using the principalagent model: The principal hires the agent to perform tasks on his behalf, but he cannotcontrol if the agent performs them in the principal’s interest, as the incentives of theagent may differ from those of the principal.122
In this case, the PPs are the agents and the UNFCCC (represented by DOEs and the EB)is the principal. They can propose project activities and get a kind of “contract” forCER’s, when their project activity is accepted. The DOEs, who assess the projectactivity, can simply give a judgement basing their analysis on the plausibility of thedocumentation, but the DOEs do not dispose of all the information the PPs have. It iseither impossible or too expensive for the DOEs to monitor the agent’s decisions andperformance. The PPs pursue their special interest, which is to get their project activityaccepted by the EB. If the PPs are not free-riders, there is no direct conflict of interest inassessing additionality. However, if they are free-riders, the interests differ substantiallyand the PPs will try to present the project activity in a way that makes it acceptable forthe CDM. They will submit financial data that artificially raises costs, and try to makethe project activity appear as environmentally friendly as possible and the baseline ascarbon-intensive as possible.
Special transaction costs arise, when the principal tries to ensure that the agent acts inprecisely the way the principal would like. These transactions costs from investigationand selection processes, information gaining and monitoring activities as well asresidual losses are called agency costs. To resolve the conflict of interest, the principalcan create special incentives for the agent to behave in a conform manner.
The problems between the principal and the agent can be differentiated into adverseselection and moral hazard:
121 See Varian, Hal R. (2004), p. 686ff.122 See Fritsch, Michael / Wein, Thomas / Ewers, Hans-Jürgen (2003), p. 290ff.
73
Adverse selection123 is a problem that occurs before the project activity has beenaccepted. PPs can give wrong information to the DOEs in order to appear CDM worthy.This is because of Grubb’s paradox, which states that less financially viable projectactivities have greater chances of being accepted. Those project activities that reallyneed support from the CDM may not even have the resources for procuring as muchexpertise as the competing firms.
By a bottom-up approach, the PPs are free to propose a methodology. Due to theconflict of interest, they will propose exactly those assessments, which are favourablefor them. On the contrary, the CDM program has to find out, which proceedings andcontrol mechanisms sort out the highest number of free-riders. Bottom-up approachesare a good tool to get ideas that are elaborated by practical people. This has a positiveimpact on the acceptance of the control mechanisms, plus is close to the market andensures that implementation is feasible for the PPs. However, the proposals tend to berather lax, and the approach chosen is the most favourable that exists for the submittedproject activity, as PPs would like to get their projects accepted. Therefore, the bottom-up proposals are a good starting point to prevent negative effects of top-down criteria.But if the additionality assessment is ever expected to really put off a high percentage ofthe free-riders, adjustments have to be made by a panel of experts in order to make theanalysis stricter.
On the contrary, moral hazard124 occurs after the acceptance and during theimplementation of the project activity. Emission reductions are to be monitored duringthe crediting period. The results can be modified / manipulated by the PPs without theDOE noticing.
In order to overcome these problems, either the principal or the agent has to becomeactive.
The principal can choose strategies creating incentives for the agent, e.g. by controllingthe agent’s performance and introducing performance-related components or byoffering long-term contracts. The control of the agent’s performance is calledscreening125 and is carried out by the DOEs: The agent’s performance cannot beexplicitly measured, but the DOEs are able to analyse if the methodology is suitable for
123 See Akerlof, George (1970), see Varian, Hal R. (2004), p. 690ff.124 See Varian, Hal R. (2004), p. 692125 See Fritsch, Michael / Wein, Thomas / Ewers, Hans-Jürgen (2003), p. 297ff.
74
the project activity. The first DOE assesses the additionality. This part of the screeningbelongs to the phase before project has been accepted. If the project activity passes thisbefore-the-fact screening, it gets accepted by the EB. During the crediting period,emission reductions are controlled by a second DOE, which assesses if thedocumentation is plausible plus if the facilities and assets are existent. As long asconsequences can easily be monitored, the after-the-fact control is more effective.
For the agents, i.e. the PPs, it is uncertain, if the project activity will pass the control.Michaelowa et al. describes this as “the knack of a good CDM project developer (…) to‘smell’ at which combination of financial indicators and barriers the project is stillaccepted…”126 It is difficult to measure uncertainty in advance and therefore it is alsodifficult to determine, what assessments – quantitative or qualitative – lead to betterresults. By signaling127 their CDM worthiness, the PPs can try to actively influence thedecision taking of the EB. This can be achieved by clear documentation as well as byconservative estimations. Another possibility to signal the quality of the proposedproject activity even to outsiders is represented the label “Golden Standard” created bythe WWF. These project activities go further than the UNFCCC PDD requires. Aboveall, this label stands for ecological integrity applying a stricter assessment of the projectactivity’s effects on sustainability. Proceeding like this, they pretend to exclude nearlyall of the free riders. Yet, deeper assessment goes hand in hand with a cumbersomeprocess with very high transaction costs.
It is obvious that the PPs have plenty of possibilities for cheating, above all in thebeginning, when DOEs are not yet as familiar with the technologies and industrystandards in different countries.
Another difficulty in the control process is that the agent’s costs can rise so high thatparticipation decreases. This is not at all intended by the control procedures, as theCDM will only “survive”, if it is popular.
126 Kaupp, Albrecht / Liptow, Holger / Michaelowa, Axel (2002), p. 3127 See Varian, Hal R. (2004), p. 694, See Fritsch, Michael / Wein, Thomas / Ewers, Hans-Jürgen
(2003), p. 298ff.
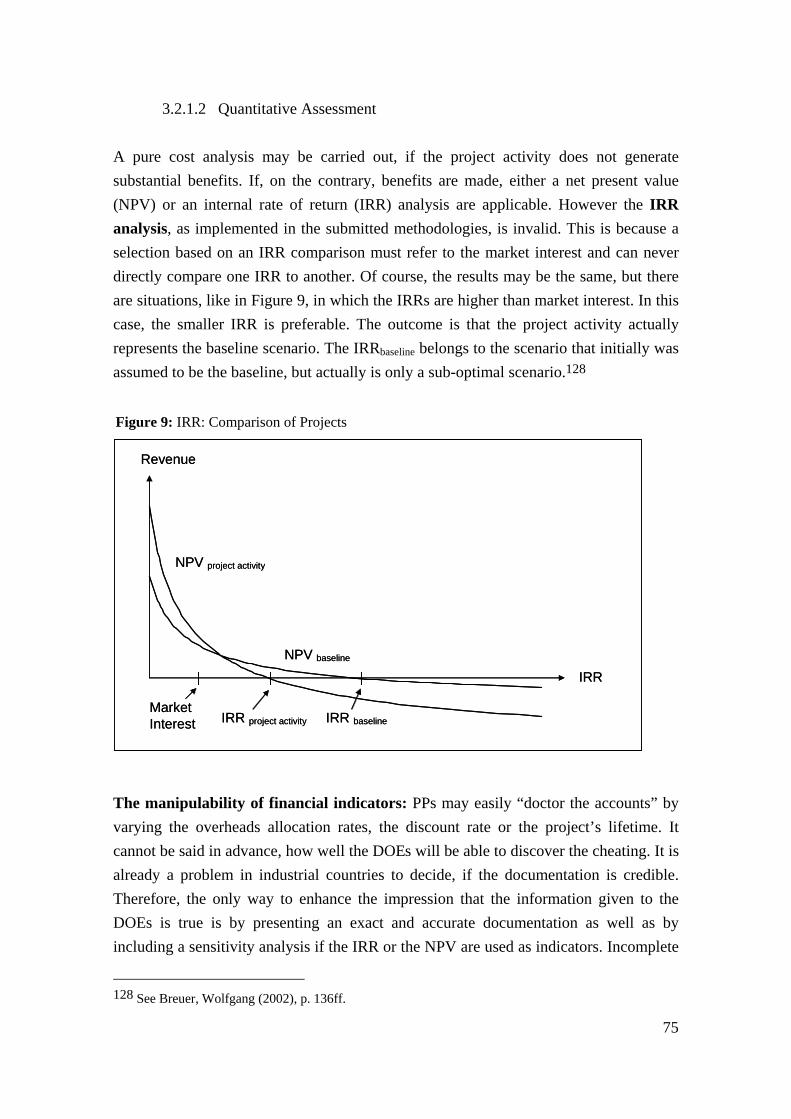
75
3.2.1.2 Quantitative Assessment
A pure cost analysis may be carried out, if the project activity does not generatesubstantial benefits. If, on the contrary, benefits are made, either a net present value(NPV) or an internal rate of return (IRR) analysis are applicable. However the IRRanalysis, as implemented in the submitted methodologies, is invalid. This is because aselection based on an IRR comparison must refer to the market interest and can neverdirectly compare one IRR to another. Of course, the results may be the same, but thereare situations, like in Figure 9, in which the IRRs are higher than market interest. In thiscase, the smaller IRR is preferable. The outcome is that the project activity actuallyrepresents the baseline scenario. The IRRbaseline belongs to the scenario that initially wasassumed to be the baseline, but actually is only a sub-optimal scenario.128
The manipulability of financial indicators: PPs may easily “doctor the accounts” byvarying the overheads allocation rates, the discount rate or the project’s lifetime. Itcannot be said in advance, how well the DOEs will be able to discover the cheating. It isalready a problem in industrial countries to decide, if the documentation is credible.Therefore, the only way to enhance the impression that the information given to theDOEs is true is by presenting an exact and accurate documentation as well as byincluding a sensitivity analysis if the IRR or the NPV are used as indicators. Incomplete
128 See Breuer, Wolfgang (2002), p. 136ff.
Figure 9: IRR: Comparison of Projects
IRR
Revenue
IRR baselineIRR project activityMarket Interest
NPV project activity
NPV baseline
IRR
Revenue
IRR baselineIRR project activityMarket Interest
NPV project activity
NPV baseline

76
and unclear documentation should be assumed to be wrong and be rejected by theDOEs.
3.2.1.3 Qualitative Assessment
A straightforward investment analysis is not the most suitable assessment, whenfinancial motives do not (fully) determine the baseline scenario. This is the case in mostdeveloping countries suffering from market distortions. The predominant factors areconstraints that result in barriers of implementation.Baumol et al. defines a barrier as the following:
“… (A) barrier is an undefined object whose presence is to be judged onlyin terms of its undesirable consequences for social welfare.”129
Barriers are a natural phenomenon of any market. But there are some barriers, whichcan cause market failure. These barriers indicate that the market does not allocateresources efficiently. However, market regulation is principally considered as the mostsuccessful way to guarantee high social welfare. That is why interventions have to bejustified, i.e. they have to show that there is a market failure leading to undesirableresults. Furthermore, the effects that intervention itself has on social welfare have to bestudied.
The most prominent possible reasons for a market failure in the model of perfectcompetition are external effects, indivisibilities, lack in information and lack ofadaptability.130
External effects lead to a mis-pricing of the relevant good or service resulting in over-or under-consumption.131 There can be negative externalities such as air pollution andpositive externalities such as experience, a public good, gained through research anddevelopment activities. Indivisibilities can create a barrier to entry for small investors,which cannot reach the optimal business size. A lack in information and a lack ofadaptability are, in the model of perfect competition, no reason for market failure.Asymmetric information can be overcome by screening and signalling activities.
129 Baumol, William J. / Panzar, John C. / Willig, Robert D. (1988), p. 5130 See Fritsch, Michael (1993), p. 1131 See Golove, William H. / Eto, Joseph H. (1996), p. 18
77
Innovations are generally fraught with a high risk of failure. The risk aversion isreflected in the investor’s discount rate. Still, a high discount rate does not automaticallyindicate a market failure.132 It is not possible to determine that an investor’s attitude is“too risk averse”, as neither an “optimal risk aversion” nor an “optimal rate ofinnovation” can be defined objectively. This judgement would be a pretension ofknowledge.
However, in a market with imperfect competition, the bargaining power of the playersis not equally distributed133. Players with strong bargaining power are likely to behavein their self-interest and to exploit the advantages.
The nirvana fallacy134 argues that the conditions of the model of perfect competitiondo not apply to real markets, because perfect competition is an unobtainable ideal.Nevertheless, they give a good orientation for further analysis of situations underimperfect competition.
Arrow135 recommends relaying further on the concept of transaction costs. Prohibitivetransaction costs can impede a market to work properly. For example, in developingcountries, especially in least developed countries136, factor immobility poses bigproblems. Geographical and occupational immobility of labour causes unemploymentand productive inefficiency. In addition, the access to financial resources is oftenlimited, which inhibits investments. Those market barriers can result in an exclusion ofpeople on low income from financial resources, but also from essential goods andopportunities (food, clothing, housing, and education).
The consequence is to examine, if the proposed interventions actually represent thesecond-best-strategy to overcome the market imperfection and if they can compromiseother public or social values.It has to be tested, whether the intervention
• is based on a pretension of knowledge,• is efficient,• is close to the market,
132 See Golove, William H. / Eto, Joseph H. (1996), p. 8133 See Golove, William H. / Eto, Joseph H. (1996), p. 19134 See Demsetz, Harold (1969); see Fritsch, Michael / Wein, Thomas / Ewers, Hans-Jürgen (2003), p.
64ff.135 See Arrow, Kenneth J. (1969), pp. 59-73136 See Greiner, Sandra / Michaelowa, Axel (2003)

78
• helps enhancing competition and• is sustainable.
The CDM is no typical governmental intervention, but has a similar effect like asubsidy. Project activities which generate additional emission reductions get asupplemental income from the issuance of the CERs. The detailed additionalityassessment of the CDM tries to prevent a pretension of knowledge. Nevertheless, it isnot possible to analyse all eventual direct and indirect discrimination effects on otheractivities (e.g. the assessment of sustainability). The efficiency of the CDM depends onits scope and the cost of its structure. By using the project-by-project approach, theCDM is very close to the market, the PPs being fully responsible of their project. In therubric “how to overcome” the barriers, it is demonstrated how the CDM enhancescompetition and reduces market imperfection. The sustainability of the project activityhas to be guaranteed by the host country and is not explicitly controlled.
In the following, the barriers for a qualitative additionality assessment used in thechosen methodologies will be discussed. Yet, it is not possible to measure the effect abarrier will have on the additionality of the concrete project activity. Therefore, thisaspect has to be addressed argumentatively by the PPs in the PDD. This is why therubric of “how to overcome” the mentioned barriers is indispensable for a goodmethodology. The PPs have to show ex-post, how exactly the additional income fromthe CERs helped them to overcome the assumed barriers.137 Although, this is not aguarantee for a correct barrier analysis, the more concrete the analysis becomes, themore difficult it is for the PPs to cheat.
Barriers can be put into three main groups: structural barriers, institutional barriersand strategic barriers.138
Six barriers could be defined as structural barriers.Three of the market barriers, which are identified by the methodologies, can besuspected to cause market failure: the barrier to investment (i.e. a lack of financialresources because of indivisibilities), the barrier due to limited information and thebarrier due to political gaming.
137 See Langrock, Thomas (2004); see Greiner, Sandra / Michaelowa, Axel (2003), p. 21138 See Wied-Nebbeling, Susanne (2004), p. 8-12

79
1. Barrier to investment: If financial resources are badly accessible to small investors,the necessary resources can quickly exceed the investor’s potential. Such a barrier toinvestment would not be accepted if the additionality assessment would refer to amacro-level. Other investors disposing of more resources would employ the project, if itwas attractive.
2. Barrier due to limited information: This barrier, under perfect competition, isrejected for not being sound and strong enough. However, empirically, imperfectinformation139 is a prominent barrier under imperfect competition, above all indeveloping countries, because information is a very costly good. This is consistent withthe concept of bounded rationality.140
3. Barrier due to political gaming: The implementation of a project activity can beprevented because of a lack of political feasibility or because of unequally distributedpolitical bargaining power.
Further on, the methodologies use three other criteria, which refer to very similarconcepts:4. Technology barrier5. Barrier due to prevailing practice6. Not common practice
The technology barrier states that a certain clean technology has no chance to beintroduced to the market. The reason is that the technology has never or seldom beenapplied in the country before. That is to say, it has a very small market share. There, thetechnology barrier touches the barrier due to prevailing practice, which states that a newtechnology has no chance on the market because the technology in place is dominant.The new technology that is “not common practice” involves a higher risk. To be morespecific, a lack in qualified labour, in experience and capacity may be the underlyingreasons. Altogether, this makes the project economically unattractive.
On a working market, these barriers can be overcome, if the project itself is worthwhile,as it will attract the necessary resources to the country. But in many developingcountries this is not the case. For example, for reasons like the low standard of living orpolitical disturbances, qualified labour is not willing to move there. Not all developing
139 See Golove, William H. / Eto, Joseph H. (1996), p. 5140 See Simon, Herbert A. (1957)
80
countries are affected equally by these difficulties. There are e.g. Latin-Americancountries, which still attract qualified labour, capital and companies, whereas manyAfrican countries face far more severe problems.
However, using terms like “technology barrier”, “barrier due to prevailing practice” and“not common practice”, another interpretation comes up. The fact that technologicallyfeasible innovations are not directly implemented could be interpreted as being a signalfor a barrier. But this would be a technocratic interpretation.141 An innovation canestablish itself in a working market, if the whole product bundle is convincing. It is notenough to only look at the technical component and at what is environmentallyfeasible.142 Innovations that do not satisfy the consumer under all aspects of the wholeproduct bundle are, in the end, not competitive enough and therefore, are not worthbeing promoted by the CDM.
In order to create a transparent methodology and to prevent wrong interpretations ofambiguous terms, it would be better to subsume the real underlying disadvantages, suchas the lack of qualified labour, the lack of experience and capacity, directly under thestructural barriers. Then, there will be no misunderstandings and above all the leastdeveloped countries (LDC) will be credible in putting forward these barriers. Above all,it cannot be in the interest of a clear additionality assessment to inflate one and the samedisadvantage by listing it under three different categories. Additionality assessmentprocedures need to be as clear and unambiguous as possible.
If the PPs would instead use the criterion “common practice” in a different context, i.e.in order to determine the baseline, it could be useful: Taking as an example a village,that is only equipped to generate electricity by using diesel for 3 hours per day, whereasall neighbour villages already have electricity 24 hours a day. To determine the baselinecorrectly, the question is, if the 3 hours a day of diesel technology should be consideredas the baseline scenario or, if the 24 hours a day should be viewed as “commonpractice”. In this case – just for baseline determination – the concept of “commonpractice” is justified.143
141 See Schulz, Walter (2002), p. 55ff.142 See Golove, William H. / Eto, Joseph H. (1996), p. 18143 See Netto, Maria (2003)

81
Institutional barriers:The only institutional barriers addressed are the policies and regulations. They caninfluence market transactions in diverse directions. Some policies create politicalmarket distortions, whereas others remove them. Regulations can reduce negativeenvironmental externalities and/or enhance energy conservation. They can also help lessemission intensive technologies to get a competitive advantage over more emissionintensive technologies, like the CDM does.
So far, it is not yet possible to say, if the CDM will get a high participation and animportant role for reaching mitigation commitments. But if it will, even the existence ofthe CDM itself could have an impact on the baseline144. For example, it could slowdown policies in favour of low-carbon technologies in developing countries. By puttingan environmentally friendly policy into practice, a government would diminish itschances for getting CDM project activities accepted. Depending on the scope the CDMwill get, it could have negative drawbacks on national policies.
However this will only become a problem, if the CDM reaches a high importance in themarket. Then, a special regulation would become necessary. In order not to destroy theincentive for the implementation of a national policy, three possible solutions areavailable:
The first possibility is that the project developer only gets the credits from the CDM (ifthe national subsidy is higher than the income from the CDM credits, the projectdeveloper could get paid out the remaining part of the subsidy). The second possibilityis that the project activity is not accepted under the CDM because of an existing policy,but this could destroy the incentive to put the new policy into practice. The thirdpossibility is that the project developer gets a portion of the CDM credits and a portionof the national subsidy, but this is difficult to put it into practice.
In any case, an over-promotion has to be prevented, as this would be likely to createwrong incentives. But until the CDM manages to get such a strong influence, the effectson local policies will be negligible.
Strategic barriersThe only strategic barriers, the methodologies deal with, are company related barrierssuch as corporate decision-making criteria and opportunity costs, managerial resources,
144 See Discussion during Meth Panel 8 (2003)

82
financial resources and capacity e.g. organisational capacity and capacity to absorb newtechnologies. However, these barriers mentioned in the methodologies will always existand as they belong to any market, they cannot be accepted as barriers that indicate amarket failure.
On the contrary, the underlying barriers like investment barriers and informationbarriers have to be named openly. If these constraints are already exposed under thestructural barriers, they should not be quoted again under a different name. This wouldlead to an inflation of the additionality assessment, while it is the objective to keep themethodology slim and clearly arranged.
In addition to this general evaluation, further research on how important which barriersare is indispensable.
3.2.1.4 Quantitative versus Qualitative Criteria
At a first glance, one could think that quantitative criteria are more objective. But theyare not by definition more reliable than qualitative criteria. While some data can bechecked using market information, company-specific information is difficult toevaluate. Financial data can be manipulated so that even the DOEs cannot make it out.There will always be some risk of tropical air and there will be no way to achieve 100%accuracy.
3.2.1.5 Boundaries, Leakage and Uncertainties
BoundariesMore guidance is needed for the setting of the boundaries and the inclusion or exclusionof emissions or emission reductions. Some methodologies (e.g. NM0001) directly statethat some emissions are negligible and therefore not included; whereas others (e.g.NM0030) leave the decision open to the project developer. It would be better to proceedlike it has been done in NM0027, fixing the concrete threshold and then explaining, whywhich emission has been included or excluded. Thereby the methodology is becomingclearer and easier to apply under different project conditions.
In general, an approach explaining under which conditions what decision has to betaken is more useful than project specific pre-determined decisions. For example,

83
NM0035 is a bit more open to other project types including considerations forhydroelectric projects (land inundation), which is a good step into the direction ofcomprehensive methodologies.
LeakageResulting from the definition of the boundaries, leakage, too, is very project specific. Itmay cover a variety of effects, e.g. electricity used from the grid, competitive effects(supply of biomass), emissions due to transportation or industry shifting from onecountry to another. Some types of leakage, e.g. the tight supply of biomass, can bestandardized for biomass project activities. As it will always remain a problem toquantify the portion, which should be deducted from the calculated emission reductions,a standard percentage should be fixed. This will eventually reduce accuracy, but a caseby case determination of the percentage may cause high transaction costs. In time,accuracy can increase through advances in knowledge and more experience.Subsequently, for the second crediting period, the proposal made by Geres andMichaelowa145 to create a leakage matrix opposing possible kinds of leakage todifferent project types, could be put into practice. The correction factors would then bedetermined by independent experts and adopted by the EB. Geres and Michaelowa pointout that it is not the aim of this method to lead to a perfect theoretical evaluation of theleakage, but to create an incentive for the project developer to keep negative leakageeffects small.
UncertaintiesNo single baseline can be considered as being perfect because of the inherentuncertainty. The following types of baseline uncertainty can be distinguished146:
• project performance uncertainty, which relates to uncertainty about theactivity level of the project over the crediting lifetime,
• measurement uncertainty, which relates to uncertainty about the quality ofthe data (e.g. how well is output measured?),
• counterfactual uncertainty, which deals with the fact that the baseline ishypothetical and thus by definition unknown; and
• background uncertainty, which relates to a range of possible external factorssuch as economic growth, international prices of oil and gas, nationalpolicies, legislation and international political developments.
145 See Geres, Roland / Michaelowa, Axel (2002), p. 8146 See Report of the Workshop on Baselines for JI and CDM projects (2003), Katherine Begg,
p. 9

84
3.2.1.6 Emission Reductions: which approach to choose?
The strength of the CM methodology is its simplicity, robustness andcomprehensiveness. There is only a limited quantity of data necessary, which may beprocured without difficulties in most cases147. It is applicable to most electricity-to-the-grid project activities, as the proceeding is very standardized (there is a potentialfor multi-project baselines), and at the same time, the results are very project specific.Basing the calculations on the default CM, it is possible that future standardizedemission factors can be developed for different regions in order to create multi-projectbaselines. It is appropriate to take the CM as a default method148 consisting of:
• the OM, which would be the generation weighted average without zero-emission, low-cost and must-run resources, and the BM, which would be, for thefirst crediting period (7 or 10 years), the outcome of a generation weightedaverage of the 20% recently built or 5 most recent projects.
• For eventually following crediting periods, only the BM, calculated using newconstruction data, would be taken as the baseline.
During the first years after implementation of the project activity, the OM is moreimportant for the calculation of the emission factors, because the system only reboundswith a delay. Later, the BM becomes more relevant. Therefore, at the beginning,emphasis should be placed on the OM and at the end emphasis should be placed on theBM. This scheme is applied by the default CM method in the case of a renewablecrediting period.
However, the appropriateness of a method applied is depended on two components:• the type of project activity and• the kind of interconnected grid system.
For a technology that replaces peak load, another calculation method should be applied,than for must-run (e.g. hydro) or volatile (e.g. solar and wind) technologies. Concerningthe type of grid, project activities may encounter very different conditions: for example
147 See Lazarus, Michael / Kartha, Sivan / Bosi, Martina (2002): p. 44: “As demonstrated by the
CERUPT methodology in use for small-scale projects, the data for an approach like this are readilyavailable and the calculations are straightforward (CERUPT, 2001, volume 2c).”
148 See Lazarus, Michael / Kartha, Sivan / Bosi, Martina (2002): p. 44; see Bosi, Martina / Laurence,Amy (2002), p. 37

85
Brazil has a hydro-dominated grid, whereas South-Africa has a coal dominated grid andeven has an excess supply.
For a technology displacing peak load, the emission factor does not need to include thebase load sources, however, including those sources does make the estimate moreconservative. Nevertheless, if the grid is dominated by a special technology, it has to beproved, which part of it belongs to the base load and which part covers the shoulders ofthe load curve.
On the contrary, if a must-run or volatile technology is implemented, it cannot beassumed that only peak load is displaced. It is not conservative to exclude must-run,low-cost and zero-emission fuels. If, in the case of the volatile technology, there is adistinguishable pattern, eventually some sources can be excluded during certain seasons.This pattern can be revealed by a time-of-use analysis. However, this analysis is costlyand labour intensive.
The relationships between the type of project activity and the type of grid are illustratedin Figure 10.
By using the proposed default CM method, hydro-dominated grids would tend to over-estimate baseline emissions. First, a threshold has to be defined, which percentage of
Figure 10: Exclusion of Sources from the Calculation ofEmission Reductions
type of the grid
hydro-dominated
no domination
What to exclude?
dominated by low
cost coal
exclude baseline hydro
exclude baseline coal
excludezero fuels,
must-run and low cost
project type
peak load
must runall plants of
the grid, nothing
excludable
volatile
if a pattern: time-of-use

86
hydro-electric generation has to be reached in the grid mix (e.g. > 50%) to consider agrid being hydro-dominated. In a hydro-dominated grid, only base load hydro-electricsources may be excluded for conservatism.On the contrary, in a grid that is dominated by a cheap fossil fuel (e.g. South Africa),it might be necessary to exclude the fossil fuel used as a must-run to cover the baseload, if it is not displaced e.g. by the project activity itself being a must-run.
The Dispatch Model can only be used, when the large amount of data is available ataffordable costs, e.g. for a grid owner, who, in any case, has to monitor the grid mix.
The System Average Approach is suitable for special project activities. The smallerthe differences between the carbon intensities of the fuels used in the grid, the smallerthe differences between the marginal approach and the average approach are.
The South African case (NM0010) is an ideal example where the grid average over allplants is conservative. In addition to the criterion of the carbon intensities, NM0010 liststhe following three criteria:
• the project activity is a must-run capacity affecting the whole supply mix(therefore average over all plants),
• the project activity’s contribution to the grid is very small (would onlydelay and not displace eventual projects, therefore has only small impact onBM), and
• there is overcapacity in the grid (no significant impact on BM).
The BM is difficult to calculate in the case of overcapacity. The question has to beaddressed, if the last 5 constructed plants or the last 20% of installed capacity are aplausible approach for future investments, or if forecasted data would be more reliable.There is also another question in reference to the weighting, because a 50/50 weightingof the OM and the BM could be inadequate for a system with overcapacity. The SystemAverage Approach avoids these difficulties.
Referring to the other proposals made, the following conclusions can be drawn:Lazarus, Kartha and Bosi state149 that any project activity, even if it is very small, hasan impact on the BM. Yet, for the sake of simplicity, a project activity may only use theOM, if there is overcapacity in the grid and the project activity’s impact on the grid is
149 See Lazarus, Michael / Kartha, Sivan / Bosi, Martina (2002): p. 33 and p. 38

87
minimal (e.g. < 1%). On the contrary, the proposal to only use the BM, because otherpower plants would have been added to the grid, is not logical, because any project hasan impact on the current grid mix. The OM cannot be neglected just because the projectactivity displaces new green field projects instead of only delaying them.
MCMM: This method tries to overcome the inaccuracies in BM determination due tothe historical and current data used in the default CM. The MCMM establishes the BMon forecasted data. Depending on the kind of grid, this can be a reasonable solution.However, it has to be examined, if calculations should exclusively be based on ex-anteforecasted data, or if, in addition, ex-post data should be monitored.
In general, should the methodologies use ex-ante or ex-post data? It is correct that theex-post baseline calculation is contradictory to the definition of the baseline. But theoverwhelming Principal Agent Problem suggests, for the sake of conservatism, tomonitor ex-post data and then, to choose between the ex-ante and the ex-post value thelower one.
3.2.2 Alternatives to the Present Proceeding
3.2.2.1 Auction
Alternatively to the bottom-up process chosen by the UNFCCC, governments coulddecide to invite tenders for the implementation of GHG mitigation projects. Thecontract would be awarded to the most cost-efficient offer.
However, two difficulties may occur: Governments, the same as individuals, do not actunder perfect and complete information, and can err in their interpretation of situations.Under this conditions, it cannot be guaranteed, that governments choose the most cost-effective offer. In addition to sub-optimal decisions due to limited information,governments do not necessarily behave like a “benevolent dictator”. On the contrary,they can be corrupt. The integrity of governments is not always a foregone conclusion,neither in industrial countries with democratic systems nor in developing countries,where the educational level is low and where political disturbances are frequent.
This leads to the conclusion that an auction does not principally lead to better solutionsthan the approach chosen by the UNFCCC.
88
3.2.2.2 Benchmark
As discussed before in section 2.2.2.4, an aggregated approach opens a way to costreduction. However, a benchmark’s outcome is relatively uncertain referring to the levelof accuracy. A benchmark reduces the additionality assessment to its intensitydimension. Therefore, it has been rejected by the UNFCCC, which instead decided toapply the project-by-project approach providing a higher accuracy.
3.2.2.3 Lax Additionality Testing
The costs that accrue to the PPs may be reduced by softening the additionalityassessment. The outcome of such an assessment would be that nearly all proposed newproject activities would be considered additional. Yet, this would most probably lead toan under-achievement of the Kyoto targets because of wide-ranging free riding. AsNon-Annex I countries are not obliged to establish inventories, the real quantity in GHGmitigation would become a matter of faith. The Annex I countries would transfer mostof their emission reduction activities to Non-Annex I countries, because of the low costsfor emission reductions there. A lax additionality assessment could lead to a race to thebottom of the certificate’s price and thereby threaten the survival of the CDM.
3.2.2.4 Heavy Bureaucratic Additionality Testing
At a first glance, a very strict additionality testing appears to be the best choice toeliminate free riders. Yet, as explained in section 2.2.2.3, Grubb’s paradox shows that,under such an assessment, the least cost-effective projects are likely to be promoted andnot those at the margin. However, if the market was working, the projects at the margin,which are more efficient, would be the next to be implemented. These projects areworth being promoted, whereas inefficient and ineffective projects should not be furthersubsidized.
Apart from that, a very complex and expensive assessment keeps the number ofsubmitted projects low. The high transaction costs of the bottom-up process can thenonly be distributed on a small number of projects, which results in high costs per projectactivity. This shows that, due to the low participation, the entire CDM could fail underthis very strict and costly assessment.

89
It is difficult to determine exactly the point at which the assessment is getting too strict.Therefore, during the first implementation phase, it will probably become necessary toadapt the severity of the assessment according to actual participation and transactioncosts.
3.2.2.5 Recommendations
It cannot definitively be said if an auction or a benchmark would deliver better resultsthan the chosen bottom-up project-by-project approach. However, it has been shownthat neither the lax additionality testing nor the heavy bureaucracy is a positivealternative. Therefore, a simplified additionality assessment is recommendable, whichgives guidance to the PPs in order to assure the quality of assessment and, at the sametime, reduces costs through standardization.
3.2.3 Simplified Proceeding
A good methodology should be drafted to lead to the optimum in the trade off betweenthe elimination of free rider effects, low transaction costs and a high participation in theCDM.
A small quantity of free riders may be tolerable, as free rider effects can be offset byfree driver effects. Yet, free driver effects are not measurable. The consequence is that itcan only be estimated, how much free riding is acceptable without threatening theimplementation of the Kyoto targets.
In order to achieve high participation and low transaction costs, it is necessary toestablish clear, simple and well accepted criteria for additionality assessment and to cutthe structural costs rigorously by standardising the proceeding.
The methodology should demand a certain effort from the PPs. Free riders, who are notwilling to make this effort, will be directly turned off. In addition, most of the impudentfree riders will not pass the assessment, as all information will be made publiclyavailable, plus the DOEs control the credibility of all data and statements. Nevertheless,some free riders will always be unrecognized. If the negative effect of those free ridersis more than compensated by the free driver effects, it is not detrimental to theachievement of the Kyoto targets. The occurrence of free driving, due to a change in
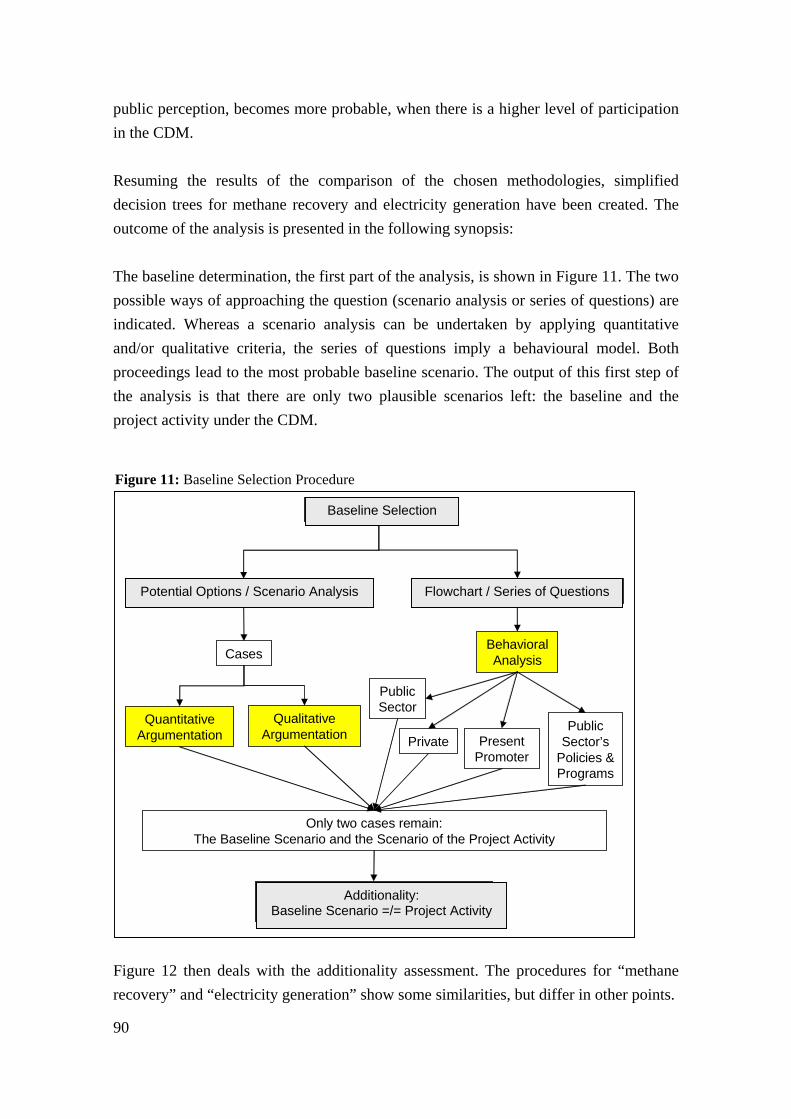
90
public perception, becomes more probable, when there is a higher level of participationin the CDM.
Resuming the results of the comparison of the chosen methodologies, simplifieddecision trees for methane recovery and electricity generation have been created. Theoutcome of the analysis is presented in the following synopsis:
The baseline determination, the first part of the analysis, is shown in Figure 11. The twopossible ways of approaching the question (scenario analysis or series of questions) areindicated. Whereas a scenario analysis can be undertaken by applying quantitativeand/or qualitative criteria, the series of questions imply a behavioural model. Bothproceedings lead to the most probable baseline scenario. The output of this first step ofthe analysis is that there are only two plausible scenarios left: the baseline and theproject activity under the CDM.
Figure 12 then deals with the additionality assessment. The procedures for “methanerecovery” and “electricity generation” show some similarities, but differ in other points.
Baseline Selection
Potential Options / Scenario Analysis Flowchart / Series of Questions
Cases
Quantitative Argumentation
Qualitative Argumentation
Only two cases remain:The Baseline Scenario and the Scenario of the Project Activity
Additionality:Baseline Scenario =/= Project Activity
Public Sector
Private Present Promoter
Public Sector’s
Policies & Programs
Behavioral Analysis
Figure 11: Baseline Selection Procedure
Baseline Selection
Potential Options / Scenario Analysis Flowchart / Series of Questions
Additionality:Baseline Scenario =/= Project Activity
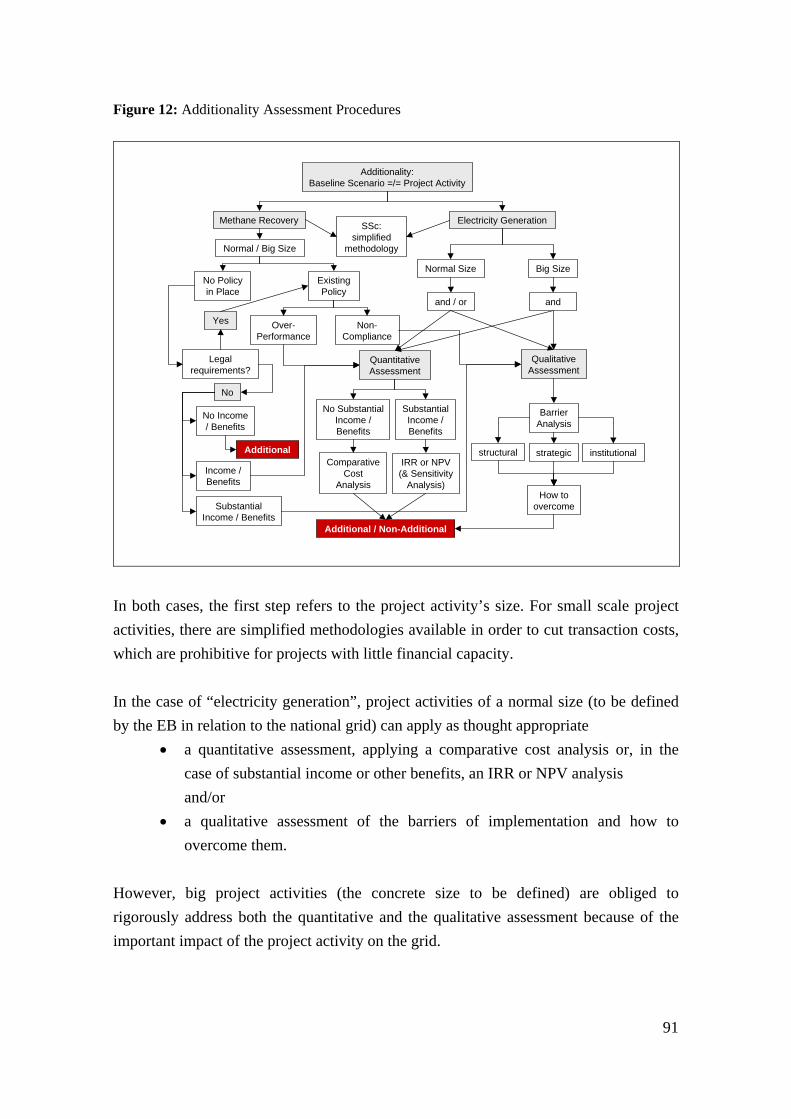
91
Figure 12: Additionality Assessment Procedures
Additionality:Baseline Scenario =/= Project Activity
Methane Recovery
No Policyin Place
Electricity Generation
ExistingPolicy
Legalrequirements?
No Income/ Benefits
SubstantialIncome / Benefits
Income /Benefits
Additional
Non-Compliance
Over-Performance
QuantitativeAssessment
QualitativeAssessment
No SubstantialIncome /Benefits
SubstantialIncome /Benefits
IRR or NPV(& Sensitivity
Analysis)
ComparativeCost
Analysis
BarrierAnalysis
How toovercome
Normal Size Big Size
and / or and
SSc:simplified
methodologyNormal / Big Size
Additional / Non-Additional
Yes
No
structural institutionalstrategic
In both cases, the first step refers to the project activity’s size. For small scale projectactivities, there are simplified methodologies available in order to cut transaction costs,which are prohibitive for projects with little financial capacity.
In the case of “electricity generation”, project activities of a normal size (to be definedby the EB in relation to the national grid) can apply as thought appropriate
• a quantitative assessment, applying a comparative cost analysis or, in thecase of substantial income or other benefits, an IRR or NPV analysisand/or
• a qualitative assessment of the barriers of implementation and how toovercome them.
However, big project activities (the concrete size to be defined) are obliged torigorously address both the quantitative and the qualitative assessment because of theimportant impact of the project activity on the grid.

92
In the case of “methane recovery”, the next step is the differentiation between projectactivities with policies in place and without.
If the PPs state that there is no policy in place, there is still a rebound mechanism, wherethey have to expose all relevant legal requirements. If no legal requirements can beidentified through this test, additionality will be determined following the income orother benefits created through the project activity. If there is no income or other benefitsgenerated, the project is assumed to be additional. On the contrary, if the project activityyields income or other benefits, a quantitative assessment (IRR or NPV) has to beundertaken. If the project activity is not the economically most attractive course ofaction, it is assumed to be additional. However, if the income or benefits created aresubstantial, a qualitative assessment has to be carried out in addition to the quantitativeassessment.
In the case of a policy in place, it has to be differentiated between over-performance bythe project developer or non-compliance in the country. In the first case, a quantitativeanalysis has to follow, whereas in the second case, a qualitative analysis is appropriate.
In Figure 13, the setting of the boundaries is illustrated. First, the scope of the boundaryhas to be determined. The boundary consists of a geographic boundary and, if electricityis generated, a system boundary. The geographic boundary includes the project site andeventually other affected facilities. The system boundary includes the different powerpurchase options and eventual autogeneration options if no CERs are claimed fordisplaced grid electricity. In contrast, if CERs are claimed for displaced grid electricity,the system boundary covers the interconnected electricity grid system including onlysignificant imports and exports. As a second step, the emissions occurring have to bespecified and put into the categories direct on-site or off-site emissions and indirect on-site or off-site emissions. Direct on-site emissions are always considered as being insidethe boundary. Indirect emissions are considered as leakage. Direct off-site emissionscan either be included into the boundary or have to be considered as leakage. Here,further guidance is needed from the EB. As a last step, it has to be decided, whichemissions are finally included into the calculation of emission reductions. Negligibleemissions can be excluded for the sake of simplicity. Project emissions can be excludedif they are offset by baseline emissions. Baseline emissions can always be excluded, asthis makes the estimate more conservative. In all other cases, the emissions have to beincluded.

93
Figure 13: Boundaries for the Baseline and the Project Acivity
Boundariesfor the baseline andthe project activity
geographicboundary
if electricityis generated
1. Scope 2. Emissions
directon-site
directoff-site
indirecton-site
indirectoff-site
3. Exclude/ Include
exclude negligibleemissions: specify
threshold
exclude project activityemissions that areoffset by baseline
emissions
conservative: excludebaseline emissions
otherwise include!
project site(+ otherfacilities)
Leakage
power purchaseoptions /
autogeneration
interconnectedelectric grid
system(+ significant
imports/exports)
systemboundary
No CERs fordisplaced grid
electricity
CERs claimedfor displacedgrid electricity
Finally, Figure 14 gives a synoptic overview on the methods to calculate the emissionreductions achieved by the project activity. In the case of methane reduction, the choiceof the appropriate model is very clear, only depending on the data availability: withsufficient data available, the First Order Decay Model is chosen, and under limited dataavailability, the IPCC Default Method has to be chosen. Lastly, the correction factor forthe estimate of baseline efficiency, the Efficiency Adjustment Factor, has to bedetermined. Then, the CERs are able to be calculated.
In the case of electricity generation, the procedure for selecting an appropriate method ismore complex. Principally, the Combined Margin (CM) is taken as the default method,if there is not one specific alternative to be displaced by the project activity. If theproject developer disposes of the data needed to conduct a dispatch analysis, he is verywelcome to use this accurate method. Instead of the CM, the grid average may only bechosen under specific conditions: In order to make the result of the average methodcome close to the results of a marginal method, the differences of the carbon intensitiesin the grid have to be relatively small. Further, the contribution of the project activity to

94
the grid should be small and the grid should be characterised by overcapacity. This is toensure that the impact on green field projects is, for the sake of simplicity, negligible.
The Combined Margin consists of the Operational Margin (OM) and the Build Margin(BM) weighted equally. For the sake of simplicity, exclusively the OM may be taken inthe case of a small contribution of the project activity to a grid with overcapacity. For asecond or third crediting period, exclusively the BM may be used.
From the calculation of the OM resp. the grid average, sources may be excludedfollowing the project type and the type of grid, as illustrated in the decision tree and forthe reasons explained in section 3.2.1.2. The calculation of the BM can either be basedon a single proxy plant, on recent capacity additions (the 20% or 5 most recent) or onforecasted data.
Figure 14: Methods for the Calculation of Emission Reductions
default method: CM
OM BM
only OM
the 20% or 5 most recent
weighting
default½ OM ½ BM
single proxy plant
forecasted data
electricity generation
dispatchgrid average
specific alternative
computerized optimization model
type of the grid
hydro-dominated
no domination
sources to exclude
dominated by low
cost coal
exclude baseline hydro
exclude baseline coal
excludezero emission, must-run and
low cost
project type
peak load
must runnothing
excludablevolatile
if a pattern: time-of-use
Calculation of emission reductions
methane recovery
applicable ifsmall differences between carbon intensities in grid
small contribution to the grid
overcapacityData
availability
First Order Decay Model
IPCC Default Method
determination of the EAF
high low
only BM
applicable if
in the 2nd and 3rd
crediting period
grid average default method:CM dispatch

95
4. CONCLUSION AND OUTLOOK
The objective of this paper was to identify critical issues of the additionality assessmentof CDM methodologies. Therefore, a comparative analysis of chosen methodologieswas carried out, which led to the following conclusions:
There is a standardisation potential of some baseline parameters: The referencetechnology (i.e. the technology currently implemented in the country) as well as thenational policies and regulations are country specific and can get standardised. Thecalculation of the emission reductions has both technology and country specificelements, which can be represented as variables in a general calculation model.
The additionality assessment may be further simplified: More guidance is neededconcerning the quantitative and qualitative tools. It has to be specified under whatconditions which quantitative indicator is applicable. The qualitative analysis needsmore simplicity and clarity which can be achieved by reducing the test to the decisivebarriers.
Furthermore, it has been shown that the cheating of the PPs is not entirely avoidable:Quantitative indicators may be manipulated by varying the lifetime, the discount rate orthe overheads allocation rates in the calculation. Quantitative indicators do no better.The existence of market barriers and their influence on the project activity is difficult tomeasure, since the estimation is very subjective and difficult to prove. The PPs’argumentation can become more reliable, if they concretely and in detail show exactlyhow the CDM helps them to overcome the barriers, e.g. by listing the costs a barriercreates to them, and how these are covered by the credits from the CDM.
In effect, a methodology only can establish, how the PPs have to proceed, i.e. whichsteps they have to complete. But the real control lies in the hands of the DOEs gettinginsight into detailed documentation during the validation and verification activities.
Most of the analysed methodologies already meet high demands regarding theiradditionality assessment. Therefore, the priority now should be to consolidate themethodologies, to enhance the participation and to reduce the structural costs of theCDM.

96
Participation can be enhanced through clear and simple guidelines giving moreguidance to the PPs. By disposing of simplified and cost-effective methodologies, thePPs will encounter fewer difficulties in submitting their project activity.
Especially the first stage of the CDM will be essential for gathering experience on theconcrete project activities. In the longer run, costs may be reduced through furtherstandardization based on the experience gained from the first project activitiesimplemented.
It would be a great achievement to create conservative multi-project baselines, forexample by constructing a project type matrix with standardised emission factors asproposed by Michaelowa150, differentiating between the host countries. At this point,the stage of multi-project baselines would be reached. The up-front costs of developingthis matrix and the costs arising during the project activity cycle to the PPs are relativelylow.
The destiny of the CDM is still vague, not only because of its shortcomings, but alsobecause of the uncertain future of the entire Kyoto Protocol. Scenarios range from acollapsing CDM to a working mechanism that helps to reduce the mitigation costs,reach the emission targets of the Kyoto Protocol and enhance sustainable developmentin developing countries.151 The recommendations made in this paper aim at creatingmethodologies which are cost-efficient and accurate enough to make the CDMworkable.
150 See Michaelowa (1999), p. 14151 See Grubb, Michael et al. (2003), p. 1

97
REFERENCES
Primary Sources
Baumol, William J. / Panzar, John C. / Willig, Robert D. (1988): “Contestable Marketsand the Theory of Industry Structure”, revised edition, Orlando, Florida, USA, 1988.
Breuer, Wolfgang (2002): “Investition I – Entscheidungen bei Sicherheit”, 2. Aufl.,Betriebswirtschaftlicher Verlag Dr. Th. Gabler GmbH, Wiesbaden 2002.
CDM Watch (2004): “The Cerupt portfolio - a step backwards for climate protection”,http://www.cdmwatch.org/cerupt_list.php (2004-02-23).
Coase, Ronald H. (1991): “The Institutional Structure of Production”, Nobel PrizeLecture, Stockholm, 9 December 1991.
DENR Training Course (2003): “CDM baseline methodologies: The devil is in thedetail”, Department of Environment and Natural Resources (DENR) Training Course4 - 6 November 2003, Climate Change Information Center, Manila Observatory,Ateneo de Manila Universityhttp://cd4cdm.org/countries%20and%20regions/Asia/Philippines/Training%20Workshop/bm/baseline.ppt (2003-12-12).
Decision 15/CP. 7: “Decision 15/CP.7 Principles, nature and scope of the mechanismspursuant to Articles 6, 12 and 17 of the Kyoto Protocol”, decision of the Conferenceof the Parties at its seventh session on the facilitation of the prompt start and themodalities and procedures for a clean development mechanism (CDM), Marrakesh2001,http://cdm.unfccc.int/EB/Panels/COPMOP#MP18 (2003-12-27).
Decision 17/CP.7: “Decision 17/CP.7 Modalities and procedures for a cleandevelopment mechanism as defined in Article 12 of the Kyoto Protocol”, decision ofthe Conference of the Parties at its seventh session on the facilitation of the promptstart and the modalities and procedures for a clean development mechanism (CDM),Marrakesh 2001,http://cdm.unfccc.int/EB/Panels/COPMOPMP18 (2003-12-27).
Demsetz, Harold (1969): “Information and Efficiency: Another Viewpoint”, in: Journalof Law and Economics, Vol. 12, April 1969, pp. 1-23.
EB 10, Annex 1: Annex 1 to the Meeting Report to the 10th Meeting of the ExecutiveBoard, 28 - 29 July 2003, http://cdm.unfccc.int/EB/Meetings (2003-12-09).
EPA, GHG Info (2003): “Methane and other gases”, United States EnvironmentalProtection Agency (EPA), 2 July 2003, http://www.epa.gov/outreach/ghginfo (2004-02-06).
F-CDM-PNM: “CDM: Proposed new methodology form” http://cdm.unfccc.int/pac/howto/CDMProjectActivity/NewMethodology/index.html (2004-02-16).
Fritsch, Michael / Wein, Thomas / Ewers, Hans-Jürgen (2003): “Marktversagen undWirtschaftspolitik – Mikroökonomische Grundlagen staatlichen Handelns”, 5. Aufl.,Verlag Franz Vahlen, München 2003.
IPCC (1995): “IPCC Second Assessment Report: Climate Change 1995, Summary forPolicymakers: The Science of Climate Change - IPCC Working Group I”,http://www.ipcc.ch/pub/reports.htm (2004-01-03).

98
Kyoto Protocol (1997): “The Kyoto Protocol”, Kyoto 1997, http://unfccc.int/resource/docs/convkp/kpeng.html (2003-09-04).
Marrakesh Accords (2001): “The Marrakesh Accords and the Marrakesh Declaration”,Marrakesh 2001, http://unfccc.int/cop7/documents/accords_draft.pdf (2003-09-04).
Meth Panel Recommendation for NM0030 (2003): “Pointwise Clarification of ProjectProponent to Meth Panel comments on NM0030”,http://cdm.unfccc.int/methodologies/process (2004-01-04).
NM0001 – NM0035: “Proposed New baseline and monitoring Methodologies”,http://cdm/unfccc.int (2003-12-15).
Simon, Herbert A. (1957): “Models of Man. Social and Rational”, New York: JohnWiley and Sons, Inc., 1957.
UNFCCC (1992): “United Nations Framework Convention on Climate Change”, Rio deJaneiro 1992, http://unfccc.int/ (2003-09-04).
UNFCCC website, the CDM project activity cycle: http://cdm.unfccc.int/pac/index.html (2003-09-05).
UNFCCC website, Designated National Authorities: http://cdm.unfccc.int/DNA, (2003-12-27).
UNFCCC website, the CDM PDD glossary of terms: http://cdm.unfccc.int/pac/howto/CDMProjectActivity/Reference/Documents, (2004-01-04).
van Ierland, Ekko C. / Gupta, Joyeeta / Kok, Marcel T.J. (2003): “Issues in InternationalClimate Policy: Theory and Policy”, Edward Elgar Publishing Limited, Cheltenham,UK, 2003.
Varian, Hal R. (2004): “Grundzüge der Mikroökonomik”, 6.. Aufl., OldenbourgWissenschaftsverlag GmbH, 2004, aus dem Amerikanischen übersetzt von Prof. Dr.Reiner Buchegger, Originaltitel: “Intermediate Microeconomics”, Sixth Edition, W.W. Norton & Company, Inc., New York, USA.
Wied-Nebbeling, Susanne (2004): “Preistheorie und Industrieökonomik”, 4. Aufl.,Springer-Verlag, Berlin, 2004.
Williamson, Oliver E. (1985): “The Economic Institutions of Capitalism”, New YorkFree Press, 1985.
Secondary Sources
Articles
Akerlof, George (1970): “The Market of Lemons: Quality, Uncertainty, and the MarketMechanism”, in: The Quaterly Journal of Economics, Vol. 84, 1970, pp. 488 – 500.
Arrow, Kenneth J. (1969): “The Organization of Economic Activity: Issues Pertinent tothe Choice of Market Versus Non-Market Allocation”, in: Analysis and Evaluationof Public Expenditure: The PPB System, Vol. 1, U.S. Joint Economic Committee,91st Congress, 1st Session, Washington, D.C., U.S. Government Printing Office,1969, pp. 59-73.

99
Baumert, Kevin (1999): “Understanding Additionality”, in: Goldemberg, José / Reid,Walter (eds.): “Promoting development while limiting greenhouse gas emissions”,Methodological Issues, Chapter 9, United Nations Publications, 1999, pp. 140 – 150.
Bernow, Steve / Kartha, Sivan / Lazarus, Michael / Page, Tom (2000): “Cleanergeneration, free riders, and environmental integrity: Clean Development Mechanismand the Power Sector” – An analysis for the World Wildlife Fund, Tellus Instituteand Stockholm Environment Institute – Boston Center, Climate Policy,2000,www.tellus.org/seib/publications/CDM_Renewables&FreeRiders.pdf (2003-09-11).
Bosi, Martina / Laurence, Amy (2002): “Road-Testing Baselines for Greenhouse GasMitigation Projects in the Electric Power Sector”, OECD and IEA Information Paper,with contributions from Pedro Maldonado, Roberto Schaeffer, André Felipe Simões,Harald Winkler and Jean-Marc Lukamba, Paris, October 2002,www.iea.org/envissu/cop8/roadtesting.pdf (2004-02-01).
Dutschke, Michael / Michaelowa, Axel (1998): “Der Handel mit Emissionsrechten fürTreibhausgase“, HWWA-Report Nr. 187, Hamburg Institute of InternationalEconomics, 1998 www.hwwa.de/Publikationen/Report/1998/Report187.pdf (2003-10-02).
Friedman, Shari (1999): “The Use of Benchmarks to Cetermine Emissions Additionalityin the Clean Development Mechanism”, in: “CDM Workshop – Workshop onBaseline for CDM-Proceedings”, The New Otani, Tokyo, 25-26 February 1999, pp.159 – 167, http://www.gispri.or.jp/english/symposiums/pdf/CDMWorkshop.PDF(2003-10-10).
Fritsch, Michael (1993): “Markt, Marktversagen und die Evaluation technologie-politischer Förderprogramme”, Discussion Paper, Faculty of Economics andBusiness Administration, Bergakademie Freiberg, Technical University, November1993.
Geres, Roland / Michaelowa, Axel (2002): “A qualitative method to consider leakageeffects from CDM and JI projects”, in: Energy Policy, Vol. 30, 2002, pp. 461-463,http://www.hwwa.de/Projekte/Forsch_Schwerpunkte/FS/Klimapolitik/PDFDokumente/Michaelowa,%20Geres%20(2002).pdf (2003-11-12).
Golove, William H. / Eto, Joseph H. (1996): “Market Barriers to Energy Efficiency: ACritical Reappraisal of the Rationale for Public Policies to Promote EnergyEfficiency”, Energy & Environment Division, Lawrence Berkeley NationalLaboratory, University of California, Berkeley, CA, March 1996,http://eetd.lbl.gov/ea/EMS/reports/38059.pdf (2004-02-03).
Greiner, Sandra / Michaelowa, Axel (2003): “Defining Investment Additionality forCDM Projects – Practical Approaches”, in: Energy Policy, Vol. 31, 2003, pp. 1007-1015.
Grubb, Michael et al. (2003): “A Strategic Assessment of the Kyoto-Marrakesh System- Synthesis Report”, Michael Grubb, Tom Brewer, Benito Müller, John Drexhage,Kirsty Hamilton, Taishi Sugiyama and Takao Aiba with contributions from AnjuSharma, Axel Michaelowa, Christian Azar and Jacqueline Karas; The Royal Institueof affairs, Sustainable Development Program, Briefing Paper No. 6, June 2003,http://www.wwf.ru/resources/publ/book/eng/68/ (2004-01-15).

100
Heister, Johannes (1999): “World Bank Research on Methodology for AIJ/JI/CDMProjects – Status Report”, Carbon Offsets Team, World Bank, February 5, 1999;prepared for World Bank - Norway AIJ Program Steering Committee Meeting,Oslo,12.February1999,http://wbln0018.worldbank.org/essd/essd.nsf/0/84713a9312b674bf8525693800774907/$FILE/AIJ-methodology-status.doc (2004-01-15).
Jotzo, Frank / Michaelowa, Axel (2002): “Estimating the CDM market under theMarrakesh Accords”, in: Climate Policy, Vol. 2, 2002, pp. 179 – 196,http://www.sciencedirect.com/science/article/B6W88-4607X0R-1/2/b09b3b6edee618a141aa87ad801c186e (2003-12-18).
Jotzo, Frank / Tanujaya, Olivia (2001): “Hot Air vs. CDM - Limiting supply to makeKyoto work without the US”, Final draft, 10 July 2001www.pelangi.or.id/database/Model/h-air-cdm-paper.doc, (2003-12-18).
Kaupp, Albrecht / Liptow, Holger / Michaelowa, Axel (2002): “CDM is not aboutsubsidies – it is about additionality.”, in: Energise, Vol. 1, No. 3, 2002, pp. 8-9,http://www.hwwa.de/Projekte/Forsch_Schwerpunkte/FS/Klimapolitik/PDFDokumente/Kaupp,%20Liptow,%20Michaelowa%20(2002).pdf(2003-10-08).
Langrock, Thomas / Michaelowa, Axel / Greiner, Sandra (2000): “Defining InvestmentAdditionality for CDM Projects – Practical Approaches”, HWWA discussion paper106, Hamburg Institute of International Economics, 2000,http://www.hwwa.de/Publikationen/Discussion_Paper/2000/106.pdf (2003-10-09).
Langrock, Thomas / Sterk, Wolfgang (2003): “Der Gold Standard - Kriterien für JI undCDM-Projekte”, Wuppertal Institut für Klima, Umwelt und Energie, Policy PaperNo. 4/2003, Wuppertal.
Lazarus, Michael / Kartha, Sivan / Bernow, Stephen (2001): “Project Baselines andBoundaries for Project-Based GHG Emission Reduction Trading – A Report to theGreenhouse Gas Emission Trading Pilot Program”, Tellus Institute, April2001,http://www.gert.org/guidance_documents/documents/pdf/TellusBBReport.PDF(2003-10-28).
Lazarus, Michael / Kartha, Sivan / Bosi, Martina (2002): “Practical BaselineRecommendations for Greenhouse Gas Mitigation Projects in the Electric PowerSector”, Organisation for Economic Co-operation and Development (OECD) andInternational Energy Agency (IEA) Information Paper,http://www.oecd.org/dataoecd/45/43/1943333.pdf (2003-12-29).
Meyers, Stephen (1999): “Additionality of Emissions Reductions from CleanDevelopment Mechanism Projects: Issues and Options for Project-LevelAssessment”, Energy Analysis Department, Environmental Energy TechnologiesDivision, Lawrence Berkeley National Laboratory, University of California,Berkeley, CA, July 1999, http://ies.lbl.gov/iespubs/43704.pdf (2003-11-14).
Michaelowa, Axel (1999): “Baseline methodologies for the CDM – which road totake?”, presentation at Institute of Global Environment and Society (IGES), 23 June1999, http://www.ghgprotocol.org/docs/Axel_Baseline.pdf (2003-09-19).

101
Michaelowa, Axel (2001): “Rio, Kyoto, Marrakesh – groundrules for the global climatepolicy regime”, HWWA discussion paper 152, Hamburg Institute of InternationalEconomics, 2001,http://www.hwwa.de/Publikationen/Discussion_Paper/2000/152.pdf (2003-09-18).
Michaelowa, Axel / Dutschke, Michael (2002): “Integration of climate and developmentpolicies through the Clean Development Mechanism”, in: European Association ofDevelopment Research and Training Institutes (EADI) / Groupement d’InterêtScientifique pour l’Etude de la Mondialisation et du Développement (GEMDEV)(eds.): “Europe and the South in the 21st century. Challenges for renewedcooperation, Karthala, Paris, 2002http://www.hwwa.de/Projekte/Forsch_Schwerpunkte/FS/Klimapolitik/Publikationen%202001.htm (2003-10-20).
Michaelowa, Axel / Stronzik, Marcus (2002): “Transaction costs of the KyotoMechanisms”, HWWA discussion paper 175, Hamburg Institute of InternationalEconomics, 2002, in: Climate Policy, Vol. 3, No. 3, pp. 261-278,http://www.hwwa.de/Projekte/Forsch_Schwerpunkte/FS/Klimapolitik/Publikationen%202001.htm (2003-10-18).
Report of the Workshop on Baselines for JI and CDM projects (2003): “StandardisingJI & CDM baseline procedures”, Groningen, The Netherlands, 6 - 7 November 2003,www.northsea.nl/jiq/repwp.pdf (2003-12-01).
Rentz, Henning (1998): “Joint Implementation and the question of additionality – aproposal for a pragmatic approach to identify possible Joint Implementationprojects”, in: Energy Policy, Vol. 26, No. 4, pp. 275-279.
Shrestha, Ram M. / Timilsina, Govinda R. (1999): “The additionality criterion foridentifying clean development mechanism projects under the Kyoto Protocol”, in:Energy Policy, Vol. 30, No. 1, 2002, pp. 73-79.
Sugiyama, Taishi / Michaelowa, Axel (2000): “Reconciling the Design of CDM withInborn Paradox of Additionality Concept”, CRIEPI Working Paper Nr. Y00905,Tokyo, http://www.hwwa.de/Publikationen/Discussion_Paper/2000/106.pdf (2003-10-09).
Unpublished Sources
Discussion during Meth Panel 8 (2003): Discussion held by the Methodology Panel onits 8th meeting, 3 – 5 November 2003, Bonn.
Forner, Claudio (2004): E-mail comment by Claudio Forner, UNFCCC Secretariat, 25February 2004.
Hanna, Javier (2004): E-mail comment by Javier Hanna, UNFCCC Secretariat, 25February 2004.
Jung, Martina / Michaelowa, Axel (2003): “Consistency of additionality determinationand the Executive Board’s decisions”, COP 9 Side Event, Constructive dispute overdifferent additionality concepts of CDM, Milan, 6 December 2003.
102
Langrock, Thomas (2004): Interview with Thomas Langrock held at the WuppertalInstitut, 22 January 2004.
Netto, Maria (2003): Interview with Maria Netto held at the UNFCCC Secretariat,Bonn, 2003.
Schulz, Walter (2003): “Politik zur Verringerung der Treibhausgasemissionen undBedeutung der Opportunitätskosten“, in: Vorlesung „Kosten und Preise II“, “Exkurszu Kapitel V Rentenbesteuerung: Opportunitätskosten“, EnergiewirtschaftlichesInstitut (EWI), Universität zu Köln, Sommersemester 2003, pp. 1-9.
Schulz, Walter (2002): “Least-Cost Planning (LCP) – Integrated Resource Planning(IRP)“, in: Vorlesung „Einführung in die Energiewirtschaftslehre“,Energiewirtschaftliches Institut (EWI), Universität zu Köln, Wintersemester2002/2003, pp. 55 – 57.
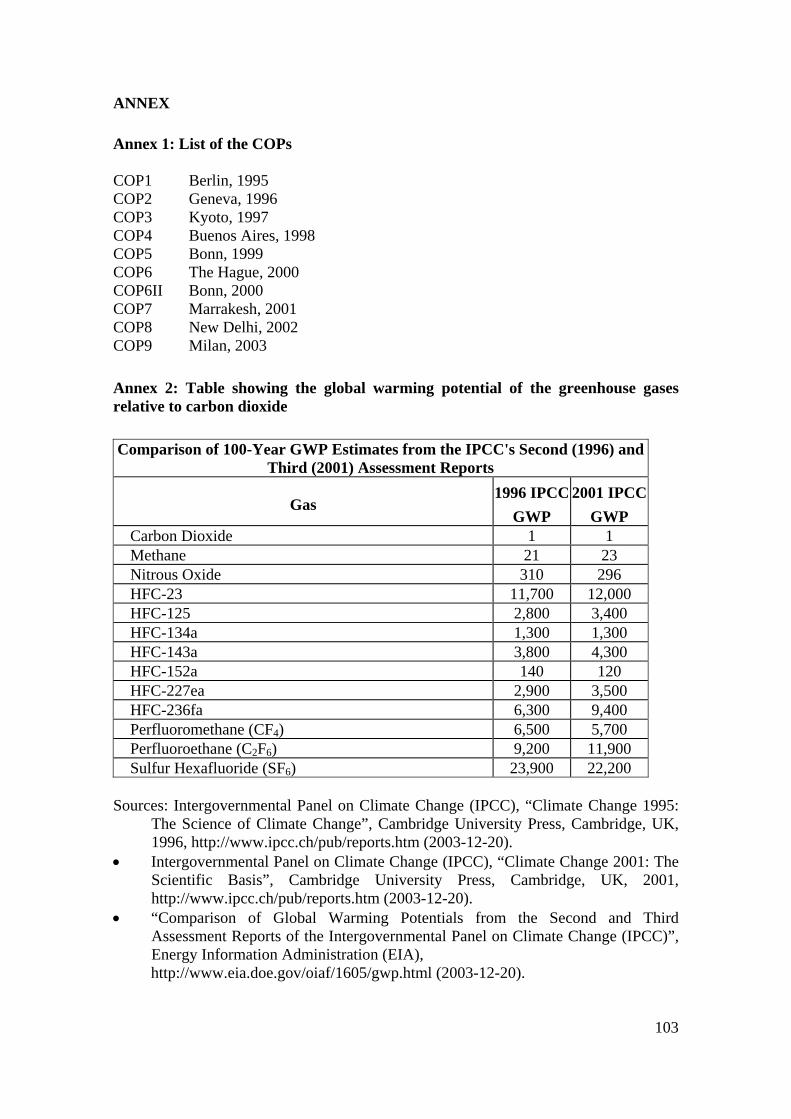
103
ANNEX
Annex 1: List of the COPs
COP1 Berlin, 1995COP2 Geneva, 1996COP3 Kyoto, 1997COP4 Buenos Aires, 1998COP5 Bonn, 1999COP6 The Hague, 2000COP6II Bonn, 2000COP7 Marrakesh, 2001COP8 New Delhi, 2002COP9 Milan, 2003
Annex 2: Table showing the global warming potential of the greenhouse gasesrelative to carbon dioxide
Comparison of 100-Year GWP Estimates from the IPCC's Second (1996) andThird (2001) Assessment Reports
Gas1996 IPCC
GWP2001 IPCC
GWP Carbon Dioxide 1 1 Methane 21 23 Nitrous Oxide 310 296 HFC-23 11,700 12,000 HFC-125 2,800 3,400 HFC-134a 1,300 1,300 HFC-143a 3,800 4,300 HFC-152a 140 120 HFC-227ea 2,900 3,500 HFC-236fa 6,300 9,400 Perfluoromethane (CF4) 6,500 5,700 Perfluoroethane (C2F6) 9,200 11,900 Sulfur Hexafluoride (SF6) 23,900 22,200
Sources: Intergovernmental Panel on Climate Change (IPCC), “Climate Change 1995:The Science of Climate Change”, Cambridge University Press, Cambridge, UK,1996, http://www.ipcc.ch/pub/reports.htm (2003-12-20).
• Intergovernmental Panel on Climate Change (IPCC), “Climate Change 2001: TheScientific Basis”, Cambridge University Press, Cambridge, UK, 2001,http://www.ipcc.ch/pub/reports.htm (2003-12-20).
• “Comparison of Global Warming Potentials from the Second and ThirdAssessment Reports of the Intergovernmental Panel on Climate Change (IPCC)”,Energy Information Administration (EIA),http://www.eia.doe.gov/oiaf/1605/gwp.html (2003-12-20).

104
Annex 3: Annex I to the United Nations Framework Convention on ClimateChange (UNFCCC)
(Differences to Annex B of the Kyoto Protocol printed in bold)
AustraliaAustriaBelarus a/
BelgiumBulgaria a/
CanadaCroatia a/*Czech Republic a/*DenmarkEuropean Economic CommunityEstonia a/
FinlandFranceGermanyGreeceHungary a/
IcelandItalyJapanLatvia a/
Liechtenstein *Lithuania a/
LuxembourgMonaco *NetherlandsNew ZealandNorwayPoland a/
PortugalRomania a/
Russian Federation a/
Slovakia a/*Slovenia a/*SpainSwedenSwitzerlandTurkeyUkraine a/
United Kingdom of Great Britain and Northern IrelandUnited States of America
a/ Countries that are undergoing the process of transition to a market economy.* Countries added to Annex I by an amendment that entered into force on 13
August 1998, pursuant to decision 4/CP.3 adopted at COP3.

105
Annex 4: Annex B to the Kyoto Protocol
(Differences to Annex I to the UNFCCC printed in bold)
AustraliaAustriaBelgiumBulgaria a/
CanadaCroatia a/
Czech Republic a/
DenmarkEstonia a/
European CommunityFinlandFranceGermanyGreeceHungary a/
IcelandIrelandItalyJapanLatvia a/
LiechtensteinLithuania a/
LuxembourgMonacoNetherlandsNew ZealandNorwayPoland a/
PortugalRomania a/
Russian Federation a/
Slovakia a/
Slovenia a/
SpainSwedenSwitzerlandUkraine a/
United Kingdom of Great Britain and Northern IrelandUnited States of America
a/ Countries that are undergoing the process of transition to a market economy.
“The Parties included in Annex B may participate in emissions trading for the purposesof fulfilling their commitments under Article 3. Any such trading shall be supplemental

106
to domestic actions for the purpose of meeting quantified emission limitation andreduction commitments under that Article.”(Kyoto Protocol, Article 17)
Annex 5: Annex II to the United Nations Framework Convention on ClimateChange (UNFCCC)
AustraliaAustriaBelgiumCanadaDenmarkEuropean Economic CommunityFinlandFranceGermanyGreeceIcelandIrelandItalyJapanLuxembourgNetherlandsNew ZealandNorwayPortugalSpainSwedenSwitzerlandTurkeyUnited Kingdom of Great Britain and Northern IrelandUnited States of America
“The developed country Parties and other developed Parties included in Annex II shallprovide new and additional financial resources to meet the agreed full costs incurred by14 developing country Parties in complying with their obligations under Article 12,paragraph 1. They shall also provide such financial resources, including for the transferof technology, needed by the developing country Parties to meet the agreed fullincremental costs of implementing measures that are covered by paragraph 1 of thisArticle and that are agreed between a developing country Party and the internationalentity or entities referred to in Article 11, in accordance with that Article. Theimplementation of these commitments shall take into account the need for adequacy andpredictability in the flow of funds and the importance of appropriate burden sharingamong the developed country Parties.”(UNFCCC, Article 4.3)