the pennsylvania state university - agecon search
TRANSCRIPT
Maternal Human Capital and Childhood Stunting In Nepal: A Multi-Level Modeling Approach
Authors
Sundar S. Shrestha The Pennsylvania State University
Department of Agricultural Economics and Rural Sociology 308 Armsby Building
University Park, PA, USA 16802
Jill L. Findeis The Pennsylvania State University
Department of Agricultural Economics and Rural Sociology 112E Armsby Building
University Park, PA, USA 16802
Selected Paper prepared for presentation at the American Agricultural Economics Association Annual Meeting, Portland, OR, July 29-August 1, 2007
Copyright 2007 by [Sundar S. Shrestha and Jill L. Findeis]. All rights reserved. Readers may make verbatim copies of this document for non-commercial purposes by any means, provided that this copyright notice appears on all such copies.

Maternal Human Capital and Childhood Stunting In Nepal: A Multi-Level Modeling Approach
Sundar S. Shrestha and Jill L. Findeis
Abstract. Childhood stunting among preschool-age children stands as a serious public health problem to be addressed in Nepal. Applying the multi-level modeling approach to nationally representative data, in the overall, we provide evidence that the negative influence of maternal own education to childhood stunting occurs especially for mother’s higher level of education, but there exists substantial residential variations. Most interestingly, we provide new evidence of a strong negative community externality of maternal education on childhood stunting, even if mothers of children are uneducated. We also find mother’s height is negatively related to childhood stunting, regardless of mother’s educational attainment and place of residence, providing evidence of intergenerational transmission of maternal health.
Introduction
Childhood stunting1 is a serious public health problem in developing countries. Nutritional
deprivation in childhood has been shown to have not only strong negative associations with the
cognitive development of children and the productivity and economic development of nations
but also a strong positive association with morbidity and mortality of people during childhood
and adulthood (Martorell and Ho 1984; Senauer and Garcia 1991; WHO 2000; Case et al. 2002;
Chang et al. 2002; MOH/N et al. 2002; United Nations 2002; Behrman and Rosenzweig 2004;
de Onis et al. 2004). The seriousness of the childhood undernutrition problem is well
acknowledged in the Millennium Development Goals (MDGs) both at global and national levels
(United Nations 2002; United Nations Country Team of Nepal 2002). Nonetheless,
disproportionately large proportions of preschool-age children -- age below five years – living in
developing countries are still stunted. Half of these children live in South Asia including Nepal,
and Nepal ranks the second worst among South Asian countries in prevalence of stunting
(UNICEF 2006). In 2001, the prevalence of stunting in Nepal was estimated at 51% (MOH/N et
1 Stunting reflects the long-term growth faltering resulting from inadequate nutrition and/or recurrent illness. A child is classified as stunted if the height-for-age falls below minus 2 standard deviations from the median height-for-age of the National Center for Health Statistics (NCHS)/World Health organization (WHO) reference population.
1

al. 2002). A critical understanding of why such a large proportion of children are still stunted is
important for effective policy action.
Recently, maternal human capital as a potential determinant of childhood undernutrition has
attracted considerable research interest among sociologists, demographers, economists, and
many others. According to human capital theory, education and health are two key endowments.
While many claim that maternal education makes a significant positive contribution to child
health (Strauss 1990; Thomas et al. 1991; Behrman and Rosenzweig 2002), others warn that the
estimated relationship may be overestimated in the absence of important community context
variables (e.g., Desai and Alva 1998). Additionally, past studies have failed to capture the full
effects of maternal education, such as the community-externality (spillover) of maternal
education. Evidence of positive spillover effects of community maternal education on reducing
fertility and mortality has recently been documented (McNay et al. 2003; Moursund and Kravdal
2003; Kravdal 2004). Intergenerational transmission of maternal health, which can in part be
attributed to spillover of genetic endowments, has received limited attention with a few
exceptions (Strauss 1990; Thomas et al. 1991; Behrman and Rosenzweig 2002).
This study, using multi-level modeling applied to nationally-representative data from Nepal,
examines the extent to which maternal education -- including the community maternal education
-- and maternal health shape stunting outcomes of preschool-age children. An analysis is also
extended to a restricted sample including only children from uneducated mothers to ascertain
whether or not community-externality of maternal education is robust when children from
educated mothers are excluded. Lastly, residential variation on the effect of maternal human
capital is examined by analyzing rural and urban sub-samples.
2

Review of Literature
Maternal education as a potential determinant and mechanisms through which it influences
child health have been widely studied by economists, demographers and other social scientists
(Caldwell 1979; Grossman and Kaestner 1997; Handa 1999; Variyam et al. 1999; Pongou et al.
2006). According to household production theory, maternal education positively affects child
health through greater allocative efficiency. More educated mothers are more able to acquire and
process health information than less educated ones (Grossman and Kaestner 1997). Cowell
(2006) provides three broad explanations of how education influences health behavior among
adults. These include efficiency mechanism, unobserved heterogeneity, and future opportunity
costs. The same explanations may also explain the link between maternal education and child
health. In terms of efficiency mechanism, as mentioned by Grossman and Kaestner (1997),
educated persons allocate their resources more efficiently to obtain better health. According to
the unobserved heterogeneity explanation, education affects health because education proxies
unobserved variables such as time preference. Finally, the future opportunity cost explanation
posits that any utility improving future outcomes such as income can affect current behavior. The
education of parents also indirectly affects the health production function of children through
increased wages and income (Kassouf and Senauer 1996). Further, education improves mother’s
ability to access to resources for investment in child health and access to health services
(Caldwell 1979) and break traditional taboos regarding dietary intake (Pongue et al. 2006).
Although past studies have documented a negative relationship between mother’s education
and long-term nutritional deprivation, these studies are limited to the mother’s individual
education. Above and beyond the mother’s education, the education of others including the
community-level education of mothers may play an important role. Other social scientists have
3

put forth diffusion theory to explain the community externalities of maternal education that may
affect individual fertility behavior and child mortality (e.g., Montgomery and Casterline 1996;
Kravdal 2004). According to diffusion theory, the diffusion of innovative ideas takes place
through social influence and social learning. Peer pressure and authority constitute the key
elements of the social influence mechanism that is believed to affect the behavior of others. The
social learning may occur due to interpersonal interactions and learning by observation.
There is no study, to the best of our knowledge, analyzing the effect of community-level
education on child stunting. Kravdal (2004) has demonstrated the limitation of taking an
individual-level perspective on education and argues that the individual-level perspective fails to
encompass the full impact of education on child mortality in India. The inability to capture the
full effect of education is likely to arise from the heterogeneity in community settings. The
beneficial impact of education of mothers in the community above and beyond individual
education on child health arises from peer or spillover effects. The community-effect of
education on child health can have stronger effects in a developing country context, where only a
small share of women has formal education and where social interaction among community
members is strong.
Recently, the community-level effect of education has been examined on contraceptive use
(McNay et al. 2003, Moursund and Kravdal 2003) and mortality (Kravdal 2004). Although
maternal community-level effect of education has been ignored in the child health literature, the
relevance of community-level unobserved factors is pointed out by Desai and Alva (1998). They
show that even the incorporation of location of residence (rural/urban) variables weakens the
effect of education on child nutrition; this effect is further weakened if a community-fixed effect
is incorporated, demonstrating that the effect of education without considering community
4
contexts is biased. However, their study does not take into account the potential effect of
community-level education of mothers on child health. This study aims to fill this gap.
On the effect of the nutritional status of the mother on child health, Kebebe (2005) mentions
that a nutrition spillover from mother to child can occur in part through sharing the genetic
endowment or through behavioral effects. However, many studies on child health and its
socioeconomic determinants ignore parent’s health in the specification of models. The health
economics literature considers that genetic endowment and behavior can substitute or
complement the production of health (Ganz 2001). The fundamental role of genetic endowments
on the production of child health is also recognized in other social science fields including
economics (Haughton and Haughton 1997; Black et al. 2005; Kebede 2005).
In the economics literature, height is a commonly used measure to capture the
intergenerational transmission of genetic endowments and unobserved family background
characteristics (Strauss 1990; Kassouf and Senauer 1996; Burgard 2002; Kebede (2005). The
estimated impact of education while ignoring parents’ health is, therefore, argued to be
overestimated (Behrman and Wolfe 1987). Kebede (2005) states that even the effect of income
may be biased if unobserved heterogeneity originates from parent’s health.
Kassouf and Senauer (1996), based on an analysis of data from the 1989 National Health
and Nutritional Survey of Brazil for children aged 2-5 years, found that mother’s and father’s
standardized height-for-age positively and significantly contributed to child height-for-age.
Similarly, using 1996 Brazil Demographic and Health Survey (DHS) data for children aged 6 to
59 months, Burgard (2002) found that children of mothers who are 10 centimeters taller (height
unstandardized) are 36% less likely to be stunted. Another study, based on five Sub-Saharan
African counties, showed that height and weight-for-age of parents positively contributed to
5
height-for-age of children aged 1 to 35 months, showing the intergenerational chain of poor
nutrition (Madise et al. 1999). Fedorov and Sahn (2005), based on a longitudinal study based on
the Russian Living Standard Measurement Survey (1992-2001), found similar effects for
mother’s and father’s heights; however, Glick and Sahn (1998) found that the effect of mother’s
height was higher than father’s in South Africa. A study of children below 6 years of age using
the 1985 Living Standard Measurement Survey of Cote d’Ivoire showed that the effect of log of
mother’s standardized height was significant on height-for-age of children. A study using data
from Vietnam showed that taller parents have taller children (Haughton and Haughton 1997).
These studies generally do not account for unobserved heterogeneity at higher levels and
important community characteristics including community education of mothers.
Data
The data for this study is from the 2001 Nepal Demographic and Health Survey (NDHS).
The NDHS is a nationally-representative comprehensive survey of demographic and health
indicators including maternal and child health (MOH/N et al. 2002). The sampling procedure
consists of a two-stage stratified random sample of households. In the first stage, a systematic
sampling with probability proportional to size was used to select 257 primary sampling units
(PSUs) -- 42 in urban areas and 215 in rural areas. In the second stage, an average 34 households
from each PSU were selected by using a systematic sampling procedure on the complete list of
households within each PSU. Each PSU is comprised of a ward and sub-ward. Ward is the
smallest political unit. In this study, PSU is used to represent community or cluster. The survey
also collected geo-reference data for PSUs using the Global Positioning System (GPS), which
made it possible to use altitude of place of residence in the models.
6
This study uses data from 6,125 children aged below five years (1 month to 59 months)
nested in 4,250 households and 248 communities and their mothers aged 15-59 years inclusive.
Anthropometric data on weight and height were collected from children and mothers. An average
household has 1.5 children, ranging from 1 to 6 children. At the community- level, the average
number of children is 26, ranging from 2 to 34. Slightly more than half (52%) of households
have only one eligible child. As almost half of households have at least two eligible children and
the number of households in the sample is fairly large, this study uses three-level multi-level
models. The rationale for this model is discussed.
Conceptual Framework
The conceptual framework for this study is drawn from the nutrition model used by
Behrman and Deolalikar (1988), which is based on the Becker’s (1981) household economic
model. It is assumed that a household aims to maximize the following joint utility function
Uj = U(H, C, l) (1)
where Uj is the joint utility function of the jth household with mother and father. The utility
parents derive is dependent on the nutritional health status of a child (H), the consumption of
goods and services from the market (C) and amount of leisure time (l). The household maximizes
the joint utility function subject to the full-income constraint that includes budget and time
constraints and the ith child’s health production function (Hi). The health of child is considered as
a household-produced good. The health production function of an individual child is specified as
Hi = H(Ii, Gi, Chi;φ, θ,ψh,ψc ) (2)
where Hi represents the health outcome of the ith child. The Ii is the child health input including
dietary intake, child care time by parents, and the medical care provided when the child is sick;
Gi is the child’s health endowment, which is unobservable but is proxied by parent’s health; Chi
7

is the child’s observable characteristics including age, birth order, size at birth and sex; φ
represents observable household characteristics including maternal education, mother’s height,
age, father’s education, household wealth, ethnicity and household size; θ is community
characteristics including access to health services, market price of consumption goods and
services, micro-environmental conditions such as altitude, geographical location such as regions
and community-level education of mothers; ψh is the unobserved household attributes such as
quality of parenting, household public goods such as floor space and level of sanitation. These
attributes are common to children within the household; whereas ψc represents community
attributes such as sanitation condition, exposure to infection, and community location, which are
common to children in households within the same community.
Equation 3 provides the budget constraint faced by the household, that is
pC+ p’Ih = wL +M (3)
where p is the vector of prices of market goods and services and p’ is the price of health inputs.
The Ih represents amount of health inputs. The household income comprises of income from
wage earnings (wL) at wage rate w and non-wage income (M). The time constraint facing the
household in terms of wage labor (L) is
L = T-Lh-l (4)
Where the T represents the total time endowment of the household, which is allocated among
wage labor (L), time to children including time for preparing food (Lh) and leisure (l). By
combining equations 3 and 4, the full-income (F) constraint is
pC+ p’Ih = w(T-Lh-l) + M = F (5)
8
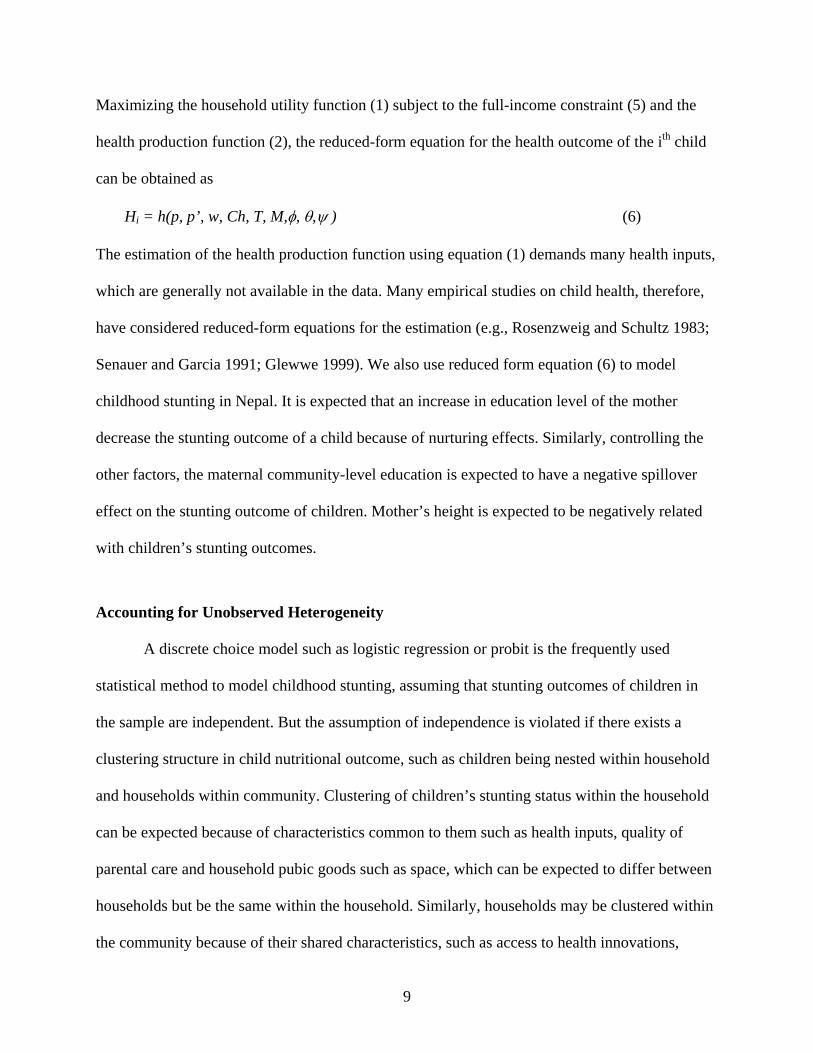
Maximizing the household utility function (1) subject to the full-income constraint (5) and the
health production function (2), the reduced-form equation for the health outcome of the ith child
can be obtained as
Hi = h(p, p’, w, Ch, T, M,φ, θ,ψ ) (6)
The estimation of the health production function using equation (1) demands many health inputs,
which are generally not available in the data. Many empirical studies on child health, therefore,
have considered reduced-form equations for the estimation (e.g., Rosenzweig and Schultz 1983;
Senauer and Garcia 1991; Glewwe 1999). We also use reduced form equation (6) to model
childhood stunting in Nepal. It is expected that an increase in education level of the mother
decrease the stunting outcome of a child because of nurturing effects. Similarly, controlling the
other factors, the maternal community-level education is expected to have a negative spillover
effect on the stunting outcome of children. Mother’s height is expected to be negatively related
with children’s stunting outcomes.
Accounting for Unobserved Heterogeneity
A discrete choice model such as logistic regression or probit is the frequently used
statistical method to model childhood stunting, assuming that stunting outcomes of children in
the sample are independent. But the assumption of independence is violated if there exists a
clustering structure in child nutritional outcome, such as children being nested within household
and households within community. Clustering of children’s stunting status within the household
can be expected because of characteristics common to them such as health inputs, quality of
parental care and household pubic goods such as space, which can be expected to differ between
households but be the same within the household. Similarly, households may be clustered within
the community because of their shared characteristics, such as access to health innovations,
9
exposure to infection, market and climatic conditions, which are common to households within a
community but differ across communities. This shows that the child stunting outcome is likely to
vary simultaneously at individual, household and community levels.
In the existence of clustering of child nutritional outcomes, the use of approaches such as
logistic regression yield estimates that are less efficient than the generalized least squares
estimates that are based on the true structure of the residual covariance matrix. Additionally,
these approaches do not allow an avenue for exploring clustering structure (Goldstein 1991).
Two approaches: fixed effects and random effects model are suggested to take into account the
unobserved factors. However, given that stunting outcome is dichotomously measured the fixed
effects estimators are likely to suffer from the incidental parameters problem (refer to,
Wooldridge 2002). This may occur because fixed effects estimators rely on estimation of
constants based on cluster observations, which are fixed and may be quite small. This leads to
inconsistent estimates of constants as well as parameters. Also, the estimator is biased if cluster
observations are small. On the other hand, in the random effects models the expected value of
cluster heterogeneity, the idiosyncratic error term and covariance between cluster heterogeneity
and idiosyncratic error are assumed to be zero.
Considering the dichotomously measured stunting variable and small number of cluster
observations, a multi-level modeling approach with a random-intercept specification model is
adopted, which is described in section it follows.
10
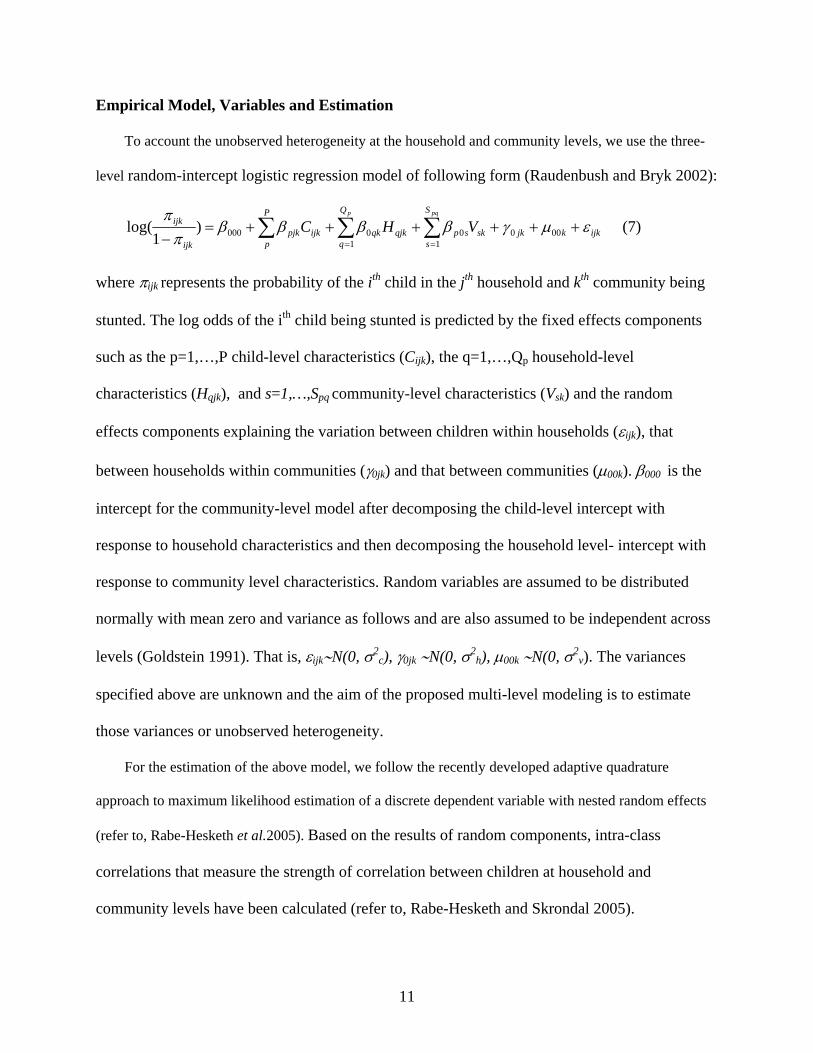
Empirical Model, Variables and Estimation
To account the unobserved heterogeneity at the household and community levels, we use the three-
level random-intercept logistic regression model of following form (Raudenbush and Bryk 2002):
ijkkjksk
S
sspqjk
Q
qqk
P
pijkpjk
ijk
ijk VHCpqp
εμγββββπ
π++++++=
− ∑∑∑==
0001
01
0000)1
log( (7)
where πijk represents the probability of the ith child in the jth household and kth community being
stunted. The log odds of the ith child being stunted is predicted by the fixed effects components
such as the p=1,…,P child-level characteristics (Cijk), the q=1,…,Qp household-level
characteristics (Hqjk), and s=1,…,Spq community-level characteristics (Vsk) and the random
effects components explaining the variation between children within households (εijk), that
between households within communities (γ0jk) and that between communities (μ00k). β000 is the
intercept for the community-level model after decomposing the child-level intercept with
response to household characteristics and then decomposing the household level- intercept with
response to community level characteristics. Random variables are assumed to be distributed
normally with mean zero and variance as follows and are also assumed to be independent across
levels (Goldstein 1991). That is, εijk∼N(0, σ2c), γ0jk ∼N(0, σ2
h), μ00k ∼N(0, σ2v). The variances
specified above are unknown and the aim of the proposed multi-level modeling is to estimate
those variances or unobserved heterogeneity.
For the estimation of the above model, we follow the recently developed adaptive quadrature
approach to maximum likelihood estimation of a discrete dependent variable with nested random effects
(refer to, Rabe-Hesketh et al.2005). Based on the results of random components, intra-class
correlations that measure the strength of correlation between children at household and
community levels have been calculated (refer to, Rabe-Hesketh and Skrondal 2005).
11

The key independent variables of interest include mother’s own education, the community
means of mother’s education and mother’s health measured as height of mother. Based on years
of schooling, mother’s education is categorized into three categories: no education, primary level
(<=grade 6) and higher than primary level (primary +). Children of mothers with no education
are treated as the reference category, with two categories of dummy variables being created. The
community mean education is measured as the mean level of education of mothers in the
community they belong to, as measured in Kravdal (2004). Height of the mother, measured in
centimeters, is specified as a continuous variable.
The child-specific variables included in the models are age, age-squared, birth order, size at
birth, and sex of child. The age of the child measured in months and birth order are specified as
continuous variables. Child’s size at birth is specified dichotomously as ‘1’ if mother’s response
to child size at birth was ‘average or greater than average’ and ‘0’ if otherwise. It is often argued
that the measured birth size may be highly correlated with nutritional outcomes such as stunting.
The child size at birth variable is based on a subjective response and it is not clear whether the
response represent the length or weight of the newly born child. Further, the Pearson correlation
coefficient between stunting and size at child’s birth is -0.11. Therefore, this variable is specified
in the model and is expected to capture in part genetic endowments of parents and prenatal
health. The sex of child is also specified as a dichotomous variable as ‘1’ if child is girl or ‘0’ if
boy.
Breastfeeding is often considered as important child-specific variable (e.g., Madise et al.
1999). However, this variable is not used in the models for two important reasons. First, breast
feeding in Nepal is almost universal; only 0.3% of children in the sample were reported as not
being breast-fed by mothers. Further, while it could be argued that duration of time breast
12
feeding since birth will influence stunting outcomes, child age is strongly correlated with breast
feeding duration. Age of child (and age-squared) is controlled in the models, with age likely
accounting for breast-feeding duration in its effect. This important relationship needs to be
recognized.
The household-level covariates controlled in the models include education of father, age of
mother, a household wealth index and ethnicity. The education of father is based on the survey
response from the child’s mother. Father’s education is classified into four categories: no
education (reference category), primary level, secondary and higher level, and ‘do not know’.
Age of mother is specified as a continuous variable. A household wealth index2 is used as a
proxy for household income. Inclusion of income is considered to create a serious endogeneity
problem, while household wealth index is considered to be far less problematic (Smith et al.
2004). Instead of using household wealth index as a continuous variable, household wealth
quintiles (five quintiles) are used to control for household’s differential ability to invest in child
health. The effect of household wealth quintiles are measured as opposed to a reference category,
i.e., Quintile-I. Caste/ethnicity is relevant at it reflects household’s socio-cultural background
which is likely to affect childhood stunting. Ethnic backgrounds are categorized into five
caste/ethnic groups: High-caste-Hindu (reference category), Low-caste-Hindu, Hill-Tibeto-
Burmese, Terai-Tibeto-Burmese, and ‘other’ ethnic group. In general, High-caste-Hindus are
socio-economically better off compared with other caste/ethnic groups. Household’s experience
of child mortality is often used to capture the vulnerability of households in raising healthy child
(e.g., Madise et al. 1999) and also to control for sample selectivity bias, as child health studies
only include those currently living. The household experience of child mortality in the last five
2 The household wealth index is constructed based on principal component analysis of household assets and amenities including water source, toilet facilities. In some studies, the water source and toilet facilities are specified as separate variables, however.
13
years is not included in the models estimated here because it is not clear whether or not child
death was nutrition-related.
Altitude-- measured as the distance above mean sea level in meters according to GPS unit
measurements-- is one of the key community-level variables included in the models to control
micro-climatic local environment that affect child nutrition. Access to health services is critical
in explaining child health. Because of the absence of variable measuring the access to health
services for children in the community, we created community-level access to health services as
the proportion of households in the community reporting the distance to health services to access
medical help as a large problem. It is derived from the mother’s questionnaire whether distance
to health services to receive medical help for her a large problem, a small problem or no
problem. The response was recoded dichotomously as ‘1’ if response is a large problem and ‘0’
otherwise. We also control the extent of urbanization creating an urban variable as ‘1’ if
community is designated as urban and ‘0’ if community is rural. Developmental regions are also
included to capture variation in the extent of development, treating the Eastern region as
reference and other regions such as the Central, Western, Mid-Western and Far-Western regions
as dummy variables.
One of the concerns about estimating the effect of community-level maternal education is
that this variable may also proxy the effect of community-level economic conditions and
community-level environmental sanitary conditions. Therefore, to estimate the net effect of
community-maternal education, a community economic status variable was created as
community-level median value of the households’ wealth index. Similarly, a community-level
sanitation deprivation index was created using principal component analysis of proportion of
households in the community having poor toilet facilities, poor drinking water sources, use of
14

traditional cooking fuels such as wood and cow dung, and traditional unfinished floor materials
such as earth, mud and dung. A series of preliminary logistic regression models were estimated
including these community-level variables. However, the results were not satisfactory, likely due
to fairly high correlations between community-health access, community sanitary index and
community wealth index, as might be expected. Therefore, instead of using all of these variables,
only the community health access variable is used in the estimated models. It should be
recognized that the estimated coefficient of community health access variable, in part, may
capture the influence of community wealth condition and also community sanitary condition.
Results
Descriptive Results
Table 1 reports descriptive statistics for variables included in the models: for the whole
sample, for children whose mothers are uneducated, and for the rural/urban residential models3.
The table also reports one-way analysis of variance (ANOVA) results comparing the variable
means between the rural and urban sub-samples. Only the summary statistics of dependent and
key independent variables are briefly described here (for control variables refer to Table 1).
Slightly more than half of preschool-age children in Nepal are found to be afflicted with long-
term nutritional deprivation. Significant variation in the prevalence of stunting between rural and
urban children is observed, with the average prevalence being higher in rural communities (52%)
than in urban locations (38%). Among children of uneducated mothers, prevalence of stunting is
higher (55%) than overall prevalence regardless of maternal education and place of residence,
indicating that childhood stunting outcome is attributed to mother’s education attainment. About
3 Tables showing results from residential models (Rural and Urban Models) are not included in the paper to save the space. However, the results are discussed in the text. These tables are available from authors on request.
15

one-fourth of mothers of eligible children have formal schooling, and about half of these have
attained higher than primary-level schooling. Also observed is significant variation in the breadth
(percent of mothers educated) and the depth (average number of years of schooling) of maternal
education by residence. In urban communities, more than half (55%) of mothers have some level
of schooling as compared to one-fifth (21%) of mothers in rural communities. At the
community-level, the mean level of education among mothers of preschool-age children in 2001
is 1.4 years. Again, there is a statistically significant difference in the community-level mean
level of schooling between rural and urban mothers. The average height of a mother in the full
sample is 150 cm, which does not vary by place of residence.
(Table 1 about here)
Unobserved Heterogeneity in Childhood Stunting
Except for the urban model, in all other models, the estimated coefficients for the
household- and community-level variances were highly significant, indicating the existence of
unobserved heterogeneity in child stunting at higher levels. Given that the random-intercept
logistic and logistic regression models are quite different types, the usual likelihood ratio test
cannot be performed to ascertain which model better performs. However, highly significant
coefficients of random variables together with the larger log likelihood values suggest that the
random-intercept logistic regression model out-performs the logistic regression model, except for
the urban model. Hence, except for the urban model (logistic regression), for all other models the
random-intercept logistic regression models were estimated, controlling child-, household- and
community-level characteristics. The random effects results in the Tables 2 and 3 provide the
extent to which the childhood stunting variance is shared by unobserved factors at household-
and community-levels.
16
(Tables 2 and 3 about here)
The coefficients of both household- and community-level variances are statistically
significant in all the models, providing evidence that the variance in child stunting in Nepal is
attributed to unobserved heterogeneity at the household and community levels. The calculated
intra-class correlations show that the share of household-level heterogeneity in the total variance
of child stunting ranges from 18% to 19%, while that of community-level heterogeneity is 3%.
The correlation coefficient value reflects the degree of inequality in stunting between similar
children at the household and community levels. The extent of inequality between similar
children is six times greater among households than that among communities. The results
suggest that children of some households in the community have a higher risk of being stunted
than children in other households.
Maternal Own Education and Child Stunting
For the overall model, results show that compared to children with uneducated mothers,
those with of mother with primary-level education is statistically not different in stunting
outcome. However, those of mothers with higher than primary-level education have 24% lower
odds of being stunted. Note that the coefficient of higher than primary-level education is
statistically significant only at 10% level (Table 2). Many past studies, however, have concluded
that maternal education is a significant predictor of child long-term nutritional status. Most of
those studies have failed to account for many important variables including household- and
community-level heterogeneity and community context variables including community-level
maternal education. Our results show that failure to account for those factors yields
overestimated effects of maternal own education especially at lower level of schooling.
17

Interestingly, the residential models show quite different effects of maternal education on
child nutrition in rural and urban communities. In the rural model, the coefficients for mother’s
primary-level and higher than primary-level education are less than one and significant in initial
models. For instance, children with mothers who have primary level education have 22% lower
odds of being stunted compared with those from uneducated mothers. Similarly, for mothers who
have higher than primary-level education, the odds of children being underweight is 26% less
than that of children with uneducated mothers. The inclusion of household- and community-level
variables still retains the significance (at 10% level) of the coefficient for mother’s primary
education with a slight reduction in the value of the coefficient (odds ratio = 0.79) but the
coefficient for mother’s higher than primary-level education becomes insignificant. In the urban
model, the coefficient for mother’s higher than primary-level education is insignificant. But in
contrast, the coefficient for mother’s primary-level education exceeds one and is significant at
10% level. The results show that even mothers’ lower levels of education are important in rural
communities but this is not the case in urban communities. The lack of significance of coefficient
for mother’s secondary and higher than primary-level education may have been due to the
mediating effect of community education of mother as well as other household-level factors such
as wealth.
Community-Level Externality of Maternal Education
In the whole sample model (Table 2), the coefficient for community-level maternal
education is negative and statistically highly significant in all three model specifications.
According to the expanded model (Model-III), every unit increase in community-level maternal
education reduces the likelihood of children being stunted in the community by 13%. This result
provides evidence of a strong positive externality (spillover) of community-level maternal
18

education on long-term nutritional health of children, even after controlling child-, household-
and other community-level factors including community access to health services. Most
interestingly, results show that even children from uneducated mothers positively benefit from
the community externality of maternal education (Table 3), suggesting that improved nutritional
technology and practices are ‘spilled over’ to uneducated mother through social interaction
or/and social influence. The children from uneducated mothers are 12% less likely to be stunted
for each unit increase in the community-level education of mothers. The residential models also
show that children in both urban and rural places benefit nutritionally from community-level
education of mothers. However, the benefits vary in their extent. Rural children from uneducated
mothers have 11% lower odds of being stunted for every unit increase in community-level
maternal education, controlling all other factors. It is almost twice as high if children are from
uneducated mothers in urban communities. This difference may have been due to higher level of
community-level maternal education in urban communities as compared to that in rural
communities.
Based on the results from children of uneducated mother model, one might argue that the
these results do not support the universal education proposed in Millennium Development Goals
as there seems that it is not necessity to educate every mother in the society. This argument may
not be valid for number of reasons. First, results provide a clear evidence that maternal own
education is crucial for reducing childhood stunting in Nepal. Next, even the educated mothers
seem to benefit from community-level maternal education as shown by whole model and
residence models. Further, as shown by rural and urban model results, the negative spillover
effect of community-level maternal education on childhood stunting seems to be stronger if
community-level maternal education is higher. Lastly, from the holistic perspective results
19

provide further evidence that children of educated children are far better off than those from
uneducated mothers.
Intergenerational Transmission of Health
The results from the whole sample model show that the coefficients of mother’s height are
statistically highly significant across all three specifications and are robust (Table 2). Controlling
all other factors, every centimeter increase in height of mother decreases the odds of children
being stunted by 8%. The same level of effects (round up) is also evident even if the mothers are
uneducated at all (Table 3) or the places they live, providing a strong evidence that the
intergenerational transfer of mother’s height to long term nutritional status of child is robust
regardless of mother’s education and the extent of urbanization of place of residence. This
illustrates that the effect of mother’s height on stunning of child to the greater extent captures the
genetic transformation than the current health environment.
Other Factors Influencing Child Stunting
As reported in other studies, child age appears to be a strong determinant of child stunting in
all models. The highly significant positive and negative signs of coefficients for the age and age-
squared variables show that child age has a concave relationship with stunting outcome. The
effect of child age may have also captured some influence of breast feeding practices which
varies by age of the child. Birth order appears to be another significant determinant of child
stunting except in the urban model. The odds of being stunted increases with birth order. The
coefficient for size at birth is highly significant and robust, except in urban model. A child with
size at birth perceived as equal or more than average in the community is 47-49% less likely to
be stunted. It is not clear whether subjective response of size at birth measure the length or
20

weight of the child; however it seems that the size at birth that reflects the genetic endowments
of parents and also fetus health during pregnancy is very important factor shaping the child
health in later life. Statistically, while there appears to be no sex differential in childhood
stunting in overall and urban models, it appears to be case in rural communities and among
children from uneducated mothers; girls have higher odds of being stunted than boys.
Despite the fact that both breadth and depth of education of father’s is higher than the
mother’s, it is interesting that the father’s education is not related to child stunting (Table 2).
This appears to be true even if mothers are uneducated (Table 3). In the rural model, however,
the effect of father’s higher than primary-level education is negative and significant at 10% level,
but is not significant in the urban model. Mother’s age is found to have a significant negative
relationship with child stunting in both the whole sample model and the rural model. The
household wealth index quintiles stand out as another significant factor negatively shaping child
stunting, except in urban model. As compared to household wealth Quintile-I, an increase in
household wealth quintile lowers the odds of children being stunted. The ethnic background of
children appears to be another important determinant of child stunting. Although High-caste-
Hindus are socio-economically better off than any other ethnic group, the Hill-Tibeto-Burmese
ethnic group children have lower odds of being stunted as compared to children from high-caste-
Hindu children, except in urban areas. Similarly, in rural locations, children of the Terai-Tibeto-
Burmese ethnic group appear to be less likely to be stunted than those of High-caste-Hindu.
Besides social and economic factors, culturally-influenced food practices and genetic factors
may have played an important role.
21
The altitude of current place of residence appears to be important factors shaping childhood
stunting in Nepal, except in urban communities. Every unit (500 masl) increase in altitude is
likely to increase childhood stunting by 20%-23%. Child stunting is observed to vary by
development region. As opposed to children from the Eastern region, children in the rural areas
and overall (whole sample) in the Central and Western regions of Nepal have higher odds of
being stunted. The coefficients for the mid- and Far-Western regions are not statistically
significant. Similarly, there appears to be no regional variation among urban children.
Conclusions
This study offers additional insights into our understanding of the key determinants of long-
term child nutritional deprivation. Net of household-level and community-level factors, the
variation in child stunting is significantly attributed to household-level and community-level
heterogeneity. As can be expected, the share of household-level heterogeneity is substantially
greater than that of community-level heterogeneity. The multi-level modeling approach adopted
in this study is found to be an improvement over the simple logistic regression approach, as
children are nested within households and households within communities, because of
characteristics common to children at higher levels.
In the overall, the negative influence of maternal own education on child stunting is seen
only with higher level of education, however, residential models show quite interesting results;
in rural communities children benefit even from mothers’ lower levels of education but this is
not the case in urban communities. Results show that even when household-level and
community-level factors are controlled, the negative influence of community-level maternal
education stands out to be robust in explaining long-term child nutritional deprivation. This
result is consistent regardless of urbanization of community, but varies in extent. Most
22
interestingly, even children whose mothers are uneducated are found to benefit from education of
other children’s mothers in the community, providing evidence of negative externality (spillover
effect) of community-level maternal education in shaping childhood stunting in Nepal.
Results also provide evidence that even when size at birth and other child-, household- and
community-level variables are controlled, the child stunting outcome is negatively related to
mother’s height, regardless of mother’s education and urbanization of community where child is
raised. The notion that a taller mother tends to have a taller child relative to his/her age provides
evidence of the intergenerational transmission of genetic endowment and in part the effect of
post-natal environmental effects. It should be noted that the estimated coefficient for mother’s
height can be biased in the absence of father’s height. The father’s height was not included
because this variable is not recorded by the survey for the fathers of all children.
Among other factors, child age and size at birth are important child-specific factors.
Similarly, household wealth status and ethnic background are strong predictors of long-term
childhood stunting. Development regions represent the key community variables showing
significant variation in long-term child nutritional deprivation, within the Eastern region being
better off than other regions especially Central and Western.
Our findings suggest that long-term nutritional deprivation among children in Nepal can be
alleviated to a great extent through promotion of education of mothers and women while taking
into consideration of geographical inequality in problems of stunting. The Central and Western
regions as well the higher altitude places of Nepal should be the focal points for public health
interventions.
23
References
Becker, G. S. 1981. A Treatise on the Family. Cambridge, MA: Harvard University Press. Behrman, J. and A. Deolalikar. 1998. “Health and Nutrition.” In H. Chenery and T. N.
Srinivasan (eds.). Handbook of Development Economics Vol. 1. North Holland, Amsterdam.
Behrman, J. R. and M. R. Rosenzweig. 2002. “Does Increasing Women’s Schooling Raise the Schooling of the Next Generation?” American Economic Review 92(1): 323-34.
Behrman, J. R. and M. R. Rosenzweig. 2004. “Returns to Birthweight.” The Review of Economics and Statistics 86(2): 586-601.
Behrman, L. and B. Wolfe. 1987. “How Does Mother’s Schooling Affect Family Health, Nutrition, Medical Care Usage and Household Sanitation.” Journal of Econometrics 26: 185-204.
Black, S. E., P. J. Devereux, and K. G. Salvanes. 2005. “Why the Apple Doesn't Fall Far: Understanding Intergenerational Transmission of Human Capital.” American Economic Review 95(1): 437-49.
Burgard, S. 2002. “Does Race Matter? Children’s Height in Brazil and South Africa.” Demography 39(4): 763-90.
Caldwell, J. 1979. “Education as a Factor in Mortality Decline.” Population Studies 33(3): 395-13.
Case, A., D. Lubotsky, and C. Paxon. 2002. “Economic Status and Health in Childhood: The Origin of Gradient.” American Economic Review 92(5): 1308-34.
Chang, S. M., S. P. Walker, G. McGregor, and C. A. Powell. 2002. “Early Childhood Stunting and Later Behavior and School Achievement.” J. Child Psychol. Psychiatry 43: 775-83.
Cowell, A. J. 2006. “The Relationship between Education and Health Behavior: Some Empirical Evidence.” Health Economics 15: 125-46.
de Onis, M., M. Blossner, E. Borghi, E. J. Frongillo, and R. Morris. 2004. “Estimates of Global Prevalence of Childhood Underweight in 1990 and 2015.” The Journal of the American Medical Association 291: 2600-06.
Desai, S. and S. Alva. 1998. “Maternal Education and Child Health: Is There a Strong Causal Relationship?” Demography 35(1): 71-81.
Fedorov, L. and D. E. Sahn. 2005. “Socioeconomic Determinants of Children's Health in Russia: A Longitudinal Study.” Economic Development and Cultural Change 53: 479–500.
Ganz, M. L. 2001. “Family Health Effects: Complements or Substitutes.” Health Economics 10: 699-714.
Glewwe, P. 1999. “Why Does Mother’s Schooling Raise Child Health in Developing Countries? Evidence from Morocco.” The Journal of Human Resources 34(1):124-59.
Glick, P. and D. E. Sahn .1998. “Maternal Labor Supply and Child Nutrition in West Africa.” Oxford Bulletin of Economics and Statistics 60(3): 325-55.
Goldstein, H. 1991. “Multilevel Modeling of Survey Data.” The Statistician 40(2): 235-44. Grossman, M. and R. Kaestner. 1997. “Effects of Education on Health.” In J.R. Behrman and
N.G. Stacey (eds.). The Social Benefits of Education. Ann Arbor MI: University of Michigan Press.
Handa, S. 1999. “Maternal Education and Child Height.” Economic Development and Cultural Change 47(2):421-39.
24

Haughton, D. and J. Haughton. 1997. “Explaining Child Nutrition in Vietnam”. Economic Development and Cultural Change 45(3): 541-56.
Jelliffe, D. B. 1966. The Assessment of the Nutritional Status of the Community. WHO Monograph No. 53. Geneva: World Health Organization.
Kassouf, A. L. and B. Senauer. 1996. “Direct and Indirect Effects of Parental Education on Malnutrition Among Children in Brazil: A Full Income Approach.” Economic Development and Cultural Change 44(4): 817-38.
Kebede, B. 2005. “Genetic Endowments, Parental and Child Health in Rural Ethiopia.” Scottish Journal of Political Economy 52(2): 194-221.
Kravdal, ∅. 2004. “Child Mortality in India: The Community-Level Effect of Education.” Population Studies 58(2):177-92.
Madise, N. J., Z. Matthews, and B. Margetts. 1999. “Heterogeneity of Child Nutritional Status Between Households: A Comparison of Six Sub-Saharan African Countries.” Population Studies 53(3): 331-43.
Martorell, R. and T. J. Ho. 1984. “Malnutrition, Morbidity and Mortality.” Population and Development Review 10: 49-68.
McNay, K., P. Arokiasamy, and R. H. Cassen. 2003. “Why are Uneducated Women in India Using Contraception? A Multilevel Analysis.” Population Studies 57(1): 21-40.
MOH/N, New ERA, and ORC Macro. 2002. Nepal Demographic and Health Survey 2001. Calverton, Maryland: Family Health Division, Ministry of Health; New ERA; and ORC Macro.
Montgomery, M. R. and J. B. Casterline. 1996. “Social Learning, Social Influence, and New Models of Fertility.” Population and Development Review 22: 151-75.
Mosley, W. H., and L. C. Chen. 1984. “An Analytical Framework for the Study of Child Survival in Developing Countries.” Population and Development Review 10 (supplement): 25-45.
Moursund, A. and ∅. Kravdal. 2003. “Individual and Community Effects of Women’s Education and Autonomy on Contraceptive Use in India.” Population Studies 57: 285-302.
Pongou, R., M. Ezzati, and J. Saloman. 2006. “Household and Community Socioeconomics and Environmental Determinants of Child Nutritional Status in Cameroon.” BMC Public Health 6: 98.
Rabe-Hesketh, S., A. Skrondal, and A. Pickles. 2005. “Maximum Likelihood Estimation of Limited and Discrete Dependent Variable Models with Nested Random Effects.” Journal of Econometrics 128: 301-23.
Rabe-Hesketh, S., and A. Skrondal. 2005. “Multilevel and Longitudinal Modeling Using Stata.” College Station, Texas: Stata Press.
Raudenbush, S. W. and A. S. Bryk. 2002. “Hierarchical Linear Models: Applications and Data Analysis Methods.” Thousand Oaks: Sage.
Rosenzweig, M. R., and T. P. Schultz. 1983. “Estimating a Household Production Function: Heterogeneity, the Demand for Health Inputs, and Their Effects on Birth Weight.” The Journal of Political Economy 91(5):723-46.
Senauer, B., and M. Garcia. 1991. “Determinants of the Nutrition and Health Status of Preschool Children: An Analysis with Longitudinal Data.” Economic Development and Cultural Change 39 (2): 371–89.
25
Strauss, J. 1990. “Households, Communities, and Preschool Children’s Nutrition Outcomes: Evidence of Rural Cote d’Ivoire.” Economic Development and Cultural Change 38: 231-61.
Thomas, D. J. Strauss, and M. H. Henriques. 1991. “How Does Mother’s Education Affect Child Height?” Journal of Human Resources 26: 183-211.
UNICEF. 2006. “Progress for Children: A Report Card on Nutrition #4.” New York: United Nations Children’s Fund.
United Nations Country Team of Nepal. 2002. “Millennium Development Goals, Nepal.” Progress Report 2002. Katmandu, Nepal: United Nations House.
United Nations. 2002. “Millennium Development Goals.” http://www.un.org/millenumgoals. Variyam, J. N., J. Blaylock, B. Lin, K. Ralston, and D. Smallwood. 1999. “Mother’s Nutrition
Knowledge and Children’s Dietary Intakes.” Amer. J. Agr. Econ. 81: 373-84. WHO. 2000. Turning the Tide of Malnutrition: Responding to the Challenge of the 21th
Century Geneva: World Health Organization. http://www.who.int/nut/nutrition3.htm.Wooldridge, J. M. 2002. Econometric Analysis of Cross Section and Panel Data. Cambridge:
The MIT Press.
26
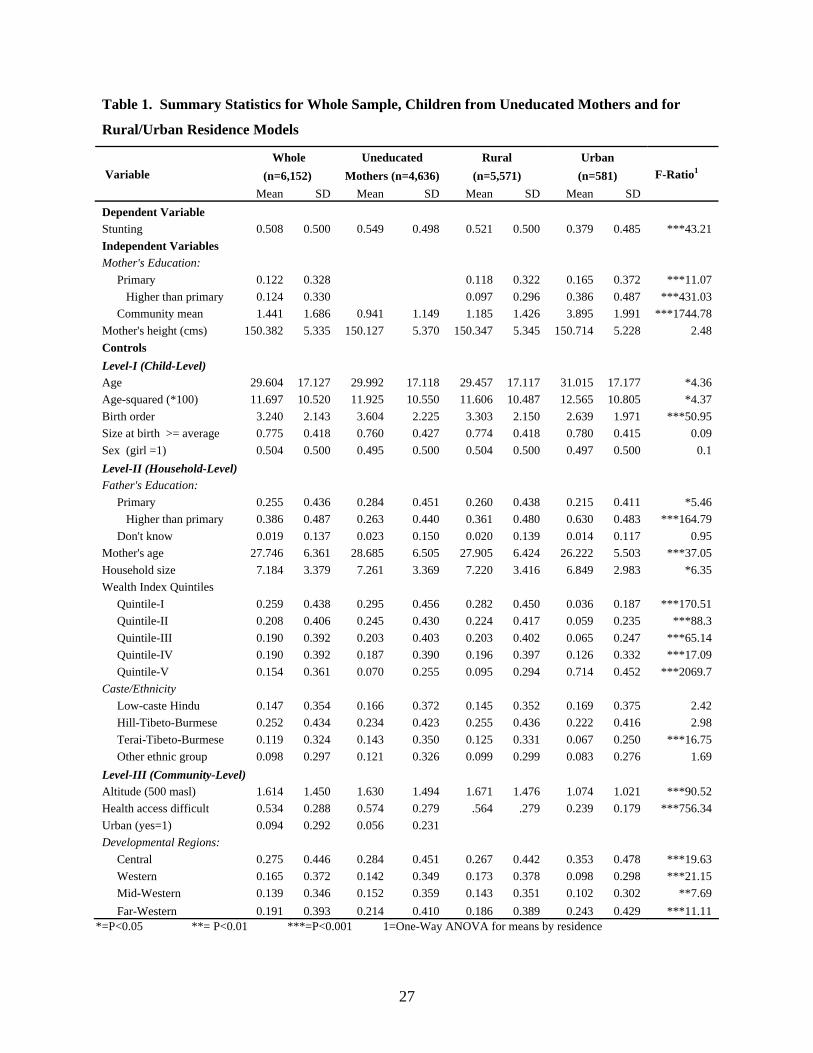
Table 1. Summary Statistics for Whole Sample, Children from Uneducated Mothers and for
Rural/Urban Residence Models
Whole Uneducated Rural Urban Variable (n=6,152) Mothers (n=4,636) (n=5,571) (n=581) F-Ratio1 Mean SD Mean SD Mean SD Mean SD Dependent Variable Stunting 0.508 0.500 0.549 0.498 0.521 0.500 0.379 0.485 ***43.21 Independent Variables Mother's Education: Primary 0.122 0.328 0.118 0.322 0.165 0.372 ***11.07
Higher than primary 0.124 0.330 0.097 0.296 0.386 0.487 ***431.03 Community mean 1.441 1.686 0.941 1.149 1.185 1.426 3.895 1.991 ***1744.78 Mother's height (cms) 150.382 5.335 150.127 5.370 150.347 5.345 150.714 5.228 2.48 Controls Level-I (Child-Level) Age 29.604 17.127 29.992 17.118 29.457 17.117 31.015 17.177 *4.36 Age-squared (*100) 11.697 10.520 11.925 10.550 11.606 10.487 12.565 10.805 *4.37 Birth order 3.240 2.143 3.604 2.225 3.303 2.150 2.639 1.971 ***50.95 Size at birth >= average 0.775 0.418 0.760 0.427 0.774 0.418 0.780 0.415 0.09 Sex (girl =1) 0.504 0.500 0.495 0.500 0.504 0.500 0.497 0.500 0.1 Level-II (Household-Level) Father's Education: Primary 0.255 0.436 0.284 0.451 0.260 0.438 0.215 0.411 *5.46
Higher than primary 0.386 0.487 0.263 0.440 0.361 0.480 0.630 0.483 ***164.79 Don't know 0.019 0.137 0.023 0.150 0.020 0.139 0.014 0.117 0.95 Mother's age 27.746 6.361 28.685 6.505 27.905 6.424 26.222 5.503 ***37.05 Household size 7.184 3.379 7.261 3.369 7.220 3.416 6.849 2.983 *6.35 Wealth Index Quintiles Quintile-I 0.259 0.438 0.295 0.456 0.282 0.450 0.036 0.187 ***170.51 Quintile-II 0.208 0.406 0.245 0.430 0.224 0.417 0.059 0.235 ***88.3 Quintile-III 0.190 0.392 0.203 0.403 0.203 0.402 0.065 0.247 ***65.14 Quintile-IV 0.190 0.392 0.187 0.390 0.196 0.397 0.126 0.332 ***17.09 Quintile-V 0.154 0.361 0.070 0.255 0.095 0.294 0.714 0.452 ***2069.7 Caste/Ethnicity Low-caste Hindu 0.147 0.354 0.166 0.372 0.145 0.352 0.169 0.375 2.42 Hill-Tibeto-Burmese 0.252 0.434 0.234 0.423 0.255 0.436 0.222 0.416 2.98 Terai-Tibeto-Burmese 0.119 0.324 0.143 0.350 0.125 0.331 0.067 0.250 ***16.75 Other ethnic group 0.098 0.297 0.121 0.326 0.099 0.299 0.083 0.276 1.69 Level-III (Community-Level) Altitude (500 masl) 1.614 1.450 1.630 1.494 1.671 1.476 1.074 1.021 ***90.52 Health access difficult 0.534 0.288 0.574 0.279 .564 .279 0.239 0.179 ***756.34 Urban (yes=1) 0.094 0.292 0.056 0.231 Developmental Regions: Central 0.275 0.446 0.284 0.451 0.267 0.442 0.353 0.478 ***19.63 Western 0.165 0.372 0.142 0.349 0.173 0.378 0.098 0.298 ***21.15 Mid-Western 0.139 0.346 0.152 0.359 0.143 0.351 0.102 0.302 **7.69 Far-Western 0.191 0.393 0.214 0.410 0.186 0.389 0.243 0.429 ***11.11
*=P<0.05 **= P<0.01 ***=P<0.001 1=One-Way ANOVA for means by residence
27
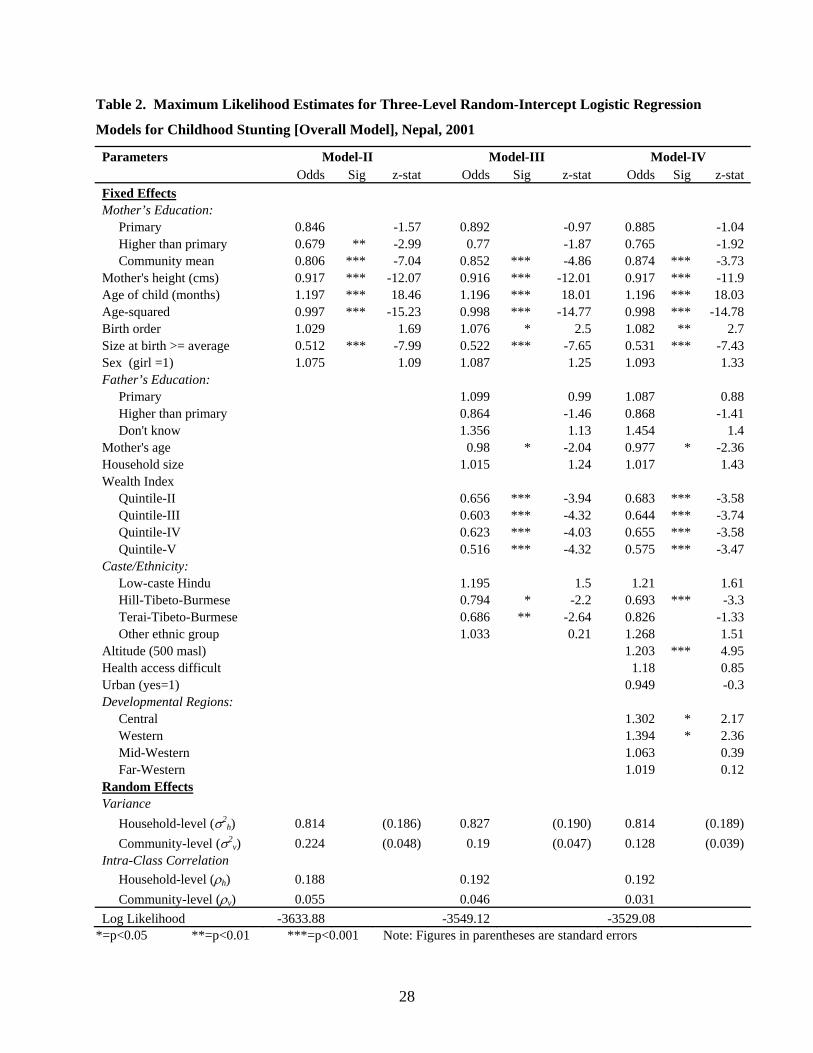
Table 2. Maximum Likelihood Estimates for Three-Level Random-Intercept Logistic Regression
Models for Childhood Stunting [Overall Model], Nepal, 2001
Parameters Model-II Model-III Model-IV Odds Sig z-stat Odds Sig z-stat Odds Sig z-stat Fixed Effects Mother’s Education: Primary 0.846 -1.57 0.892 -0.97 0.885 -1.04 Higher than primary 0.679 ** -2.99 0.77 -1.87 0.765 -1.92 Community mean 0.806 *** -7.04 0.852 *** -4.86 0.874 *** -3.73 Mother's height (cms) 0.917 *** -12.07 0.916 *** -12.01 0.917 *** -11.9 Age of child (months) 1.197 *** 18.46 1.196 *** 18.01 1.196 *** 18.03 Age-squared 0.997 *** -15.23 0.998 *** -14.77 0.998 *** -14.78 Birth order 1.029 1.69 1.076 * 2.5 1.082 ** 2.7 Size at birth >= average 0.512 *** -7.99 0.522 *** -7.65 0.531 *** -7.43 Sex (girl =1) 1.075 1.09 1.087 1.25 1.093 1.33 Father’s Education: Primary 1.099 0.99 1.087 0.88 Higher than primary 0.864 -1.46 0.868 -1.41 Don't know 1.356 1.13 1.454 1.4 Mother's age 0.98 * -2.04 0.977 * -2.36 Household size 1.015 1.24 1.017 1.43 Wealth Index Quintile-II 0.656 *** -3.94 0.683 *** -3.58 Quintile-III 0.603 *** -4.32 0.644 *** -3.74 Quintile-IV 0.623 *** -4.03 0.655 *** -3.58 Quintile-V 0.516 *** -4.32 0.575 *** -3.47 Caste/Ethnicity: Low-caste Hindu 1.195 1.5 1.21 1.61 Hill-Tibeto-Burmese 0.794 * -2.2 0.693 *** -3.3 Terai-Tibeto-Burmese 0.686 ** -2.64 0.826 -1.33 Other ethnic group 1.033 0.21 1.268 1.51 Altitude (500 masl) 1.203 *** 4.95 Health access difficult 1.18 0.85 Urban (yes=1) 0.949 -0.3 Developmental Regions: Central 1.302 * 2.17 Western 1.394 * 2.36 Mid-Western 1.063 0.39 Far-Western 1.019 0.12 Random Effects Variance Household-level (σ2
h) 0.814 (0.186) 0.827 (0.190) 0.814 (0.189) Community-level (σ2
v) 0.224 (0.048) 0.19 (0.047) 0.128 (0.039) Intra-Class Correlation Household-level (ρh) 0.188 0.192 0.192 Community-level (ρv) 0.055 0.046 0.031 Log Likelihood -3633.88 -3549.12 -3529.08
*=p<0.05 **=p<0.01 ***=p<0.001 Note: Figures in parentheses are standard errors
28
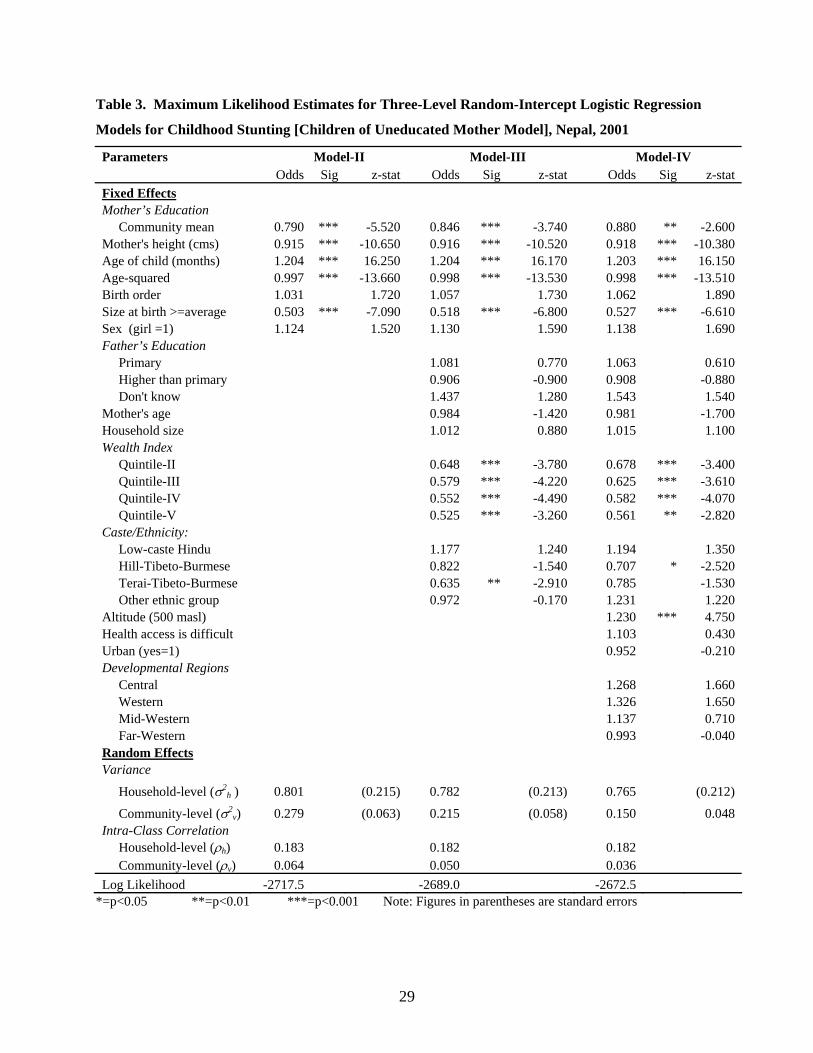
Table 3. Maximum Likelihood Estimates for Three-Level Random-Intercept Logistic Regression
Models for Childhood Stunting [Children of Uneducated Mother Model], Nepal, 2001
Parameters Model-II Model-III Model-IV Odds Sig z-stat Odds Sig z-stat Odds Sig z-stat Fixed Effects Mother’s Education Community mean 0.790 *** -5.520 0.846 *** -3.740 0.880 ** -2.600 Mother's height (cms) 0.915 *** -10.650 0.916 *** -10.520 0.918 *** -10.380 Age of child (months) 1.204 *** 16.250 1.204 *** 16.170 1.203 *** 16.150 Age-squared 0.997 *** -13.660 0.998 *** -13.530 0.998 *** -13.510 Birth order 1.031 1.720 1.057 1.730 1.062 1.890 Size at birth >=average 0.503 *** -7.090 0.518 *** -6.800 0.527 *** -6.610 Sex (girl =1) 1.124 1.520 1.130 1.590 1.138 1.690 Father’s Education Primary 1.081 0.770 1.063 0.610 Higher than primary 0.906 -0.900 0.908 -0.880 Don't know 1.437 1.280 1.543 1.540 Mother's age 0.984 -1.420 0.981 -1.700 Household size 1.012 0.880 1.015 1.100 Wealth Index Quintile-II 0.648 *** -3.780 0.678 *** -3.400 Quintile-III 0.579 *** -4.220 0.625 *** -3.610 Quintile-IV 0.552 *** -4.490 0.582 *** -4.070 Quintile-V 0.525 *** -3.260 0.561 ** -2.820 Caste/Ethnicity: Low-caste Hindu 1.177 1.240 1.194 1.350 Hill-Tibeto-Burmese 0.822 -1.540 0.707 * -2.520 Terai-Tibeto-Burmese 0.635 ** -2.910 0.785 -1.530 Other ethnic group 0.972 -0.170 1.231 1.220 Altitude (500 masl) 1.230 *** 4.750 Health access is difficult 1.103 0.430 Urban (yes=1) 0.952 -0.210 Developmental Regions Central 1.268 1.660 Western 1.326 1.650 Mid-Western 1.137 0.710 Far-Western 0.993 -0.040 Random Effects Variance
Household-level (σ2h ) 0.801 (0.215) 0.782 (0.213) 0.765 (0.212)
Community-level (σ2v) 0.279 (0.063) 0.215 (0.058) 0.150 0.048
Intra-Class Correlation Household-level (ρh) 0.183 0.182 0.182 Community-level (ρv) 0.064 0.050 0.036 Log Likelihood -2717.5 -2689.0 -2672.5
*=p<0.05 **=p<0.01 ***=p<0.001 Note: Figures in parentheses are standard errors
29