experimental design, synthesis and application of
TRANSCRIPT

Louisiana State UniversityLSU Digital Commons
LSU Doctoral Dissertations Graduate School
2009
Experimental Design, Synthesis and Application ofMolecular Micelle Modified PolymericNanoparticles for Drug Delivery Systems and FreeRadical DetectionGabriela M. Ganea VisserLouisiana State University and Agricultural and Mechanical College, [email protected]
Follow this and additional works at: https://digitalcommons.lsu.edu/gradschool_dissertations
Part of the Chemistry Commons
This Dissertation is brought to you for free and open access by the Graduate School at LSU Digital Commons. It has been accepted for inclusion inLSU Doctoral Dissertations by an authorized graduate school editor of LSU Digital Commons. For more information, please [email protected].
Recommended CitationGanea Visser, Gabriela M., "Experimental Design, Synthesis and Application of Molecular Micelle Modified Polymeric Nanoparticlesfor Drug Delivery Systems and Free Radical Detection" (2009). LSU Doctoral Dissertations. 3299.https://digitalcommons.lsu.edu/gradschool_dissertations/3299

EXPERIMENTAL DESIGN, SYNTHESIS AND APPLICATION OF MOLECULAR
MICELLE MODIFIED POLYMERIC NANOPARTICLES FOR DRUG DELIVERY
SYSTEMS AND FREE RADICAL DETECTION
A Dissertation
Submitted to the Graduate Faculty of the
Louisiana State University and
Agricultural and Mechanical College
In partial fulfillment of the
Requirements for the degree of
Doctor of Philosophy
in
The Department of Chemistry
By
Gabriela M. Visser
B.S., University of Bucharest, Romania, 1997
M.S., University of Bucharest, Romania, 2004
December 2009

ii
To my Romanian and Dutch families, my mother, Cristina, who is my continuous inspiration, my
sister, Daniela, who empowers me with her strength, and my husband, Richard, whose
unconditional love and support have kept me going on
through this journey.
iii
ACKNOWLEDGEMENTS
This work was accomplished with the support of many professors, students, and colleagues to
whom I am deeply thankful.
Dr. Isiah M. Warner, for his tremendous patience, wisdom, and knowledge. Working in your
research group was the best experience of my life. You helped me develop valuable skills that
otherwise I would not have known. I greatly appreciate your guidance, ethics, enthusiasm and
commitment to science.
Committee Members: Dr. Doug Gilman, Dr. Jack Losso, Dr. Cristina Sabliov, and Dr. Ray
Ferrell, for their time and helpful discussions. Special thanks to Dr. Cristina Sabliov for her
advice and great interest in my research, and Dr. Jack Losso, for his contribution in the
cytotoxicity studies and our many discussions regarding antioxidants and natural products.
Dr. Sayo O. Fakayode, for sharing his knowledge in chemometrics and statistical analysis. I am
convinced that my success has started when we discussed about my first experimental design.
Dr. Cornelus van Nostrum, for the collaboration work in his lab at Utrecht University, The
Netherlands, as well as his critical and honest feedback.
Post doctoral researchers and graduate students of the Warner Research Group, for
challenging me with questions in group meetings, brainstorming, laughs, friendship and support
over the years.
Undergraduate students: Paulina Kolic, for her hard work during two summer semesters,
helping me when I needed it the most, and Abei Ishola and Stephen Maffett, who found time to
work on my projects between their tests and finals.
Karen Mcdonough, for her help in cell culture studies, including weekends and late nights.
Matthew Brown and Ying Xiao, for their assistance in microscopy.

iv
TABLE OF CONTENTS
DEDICATION ……………………………………………………………………………... ii
ACKNOWLEDGEMENTS ………………………………………………………………... iii
LIST OF TABLES ………………………………………………………………………..... vii
LIST OF FIGURES ………………………………………………………………………... viii
LIST OF ABBREVIATIONS …………………………………………………………….... xi
ABSTRACT………………………………………………………………………………… xiv
CHAPTER 1. INTRODUCTION …………………………………………………………. 1
1.1 Nanotechnology and Drug Delivery Systems ………………………………... 1
1.2 Polymeric Nanoparticles as Drug Delivery Systems ……………………….... 4
1.2.1 Methods of Preparation ……………………………………………... 6
1.2.2 Characterization of Polymeric Nanoparticles ………..……..………. 7
1.2.2.1 Size and Polydispersity ………………………………….. 8
1.2.2.2 Zeta Potential …………………………………………..... 9
1.2.2.3 Morphology …………………………………................... 11
1.2.2.4 Drug Loading ……………………………………………. 11
1.3 Molecular Micelles …………………………………………………………... 17
1.3.1 Comparison with Conventional Micelles …………………………… 17
1.3.2 Molecular Micelles in Nanoparticle Synthesis ……………………… 19
1.4 Antioxidants ………………………………………………………………….. 19
1.4.1 Nutrition, Disease Prevention, and Therapy ………………………... 20
1.4.2 Quinones …………………………………………………………….. 22
1.4.3 Antioxidant Delivery ………………………………………………... 25
1.5 Free Radicals …………………………………………………………………. 26
1.5.1 Oxidative Stress and Free Radicals …………………………………. 26
1.5.2 Methods for Free Radical Detection ………………………………... 28
1.5.3 Free Radical Fluorescent Sensors ...……………………………….... 29
1.6 Chemometrics and Optimization Design …………………………………….. 31
1.7 Scope of Dissertation ………………………………………………………… 34
1.8 References ……………………………………………………………………. 36
CHAPTER 2. EXPERIMENTAL DESIGN AND MULTIVARIATE ANALYSIS FOR
OPTIMIZING POLY (D,L-LACTIDE-CO-GLYCOLIDE) (PLGA)
NANOPARTICLE SYNTHESIS USING MOLECULAR MICELLES …...
43
2.1 Introduction …………………………………………………………………... 43
2.2 Experimental …………………………………………………………………. 46
2.2.1 Materials …………………………………………………………….. 46
2.2.2 Synthesis of Molecular Micelles ……………………………………. 47
2.2.3 Nanoparticle Synthesis ……………………………………………… 47

v
2.2.4 Central Composite Experimental Design and Multivariate
Analysis ……………………………………………………………...
47
2.2.5 Nanoparticle Purification …………………………………………… 49
2.2.6 Nanoparticle Characterization ………………………………………. 49
2.3 Results and Discussions ……………………………………………………… 50
2.3.1 Optimization of Nanoparticle Synthesis …………………………..... 50
2.3.1.1 Factors Affecting Particle Size ..……………………….... 54
2.3.1.2 Factors Affecting Polydispersity ………………………... 59
2.3.1.3 Validation of the Regression Model …………………….. 62
2.3.2 Characterization of Optimally Synthesized PLGA Nanoparticles …. 63
2.3.2.1 Particle Size and Size Distribution………………………. 63
2.3.2.2 Zeta Potential ……………………………………………. 66
2.3.3 Nanoparticle Morphology …………………………………………... 67
2.4 Conclusions …………………………………………………………………... 69
2.5 References …………………………………………………………………..... 69
CHAPTER 3. THE EFFECT OF MOLECULAR MICELLES ON SYNTHESIS
AND PROPERTIES OF THYMOQUINONE-LOADED
POLY(D,L LACTIDE-CO-GLYCOLIDE) NANOPARTICLES ………….
72
3.1 Introduction …………………………………………………………………... 72
3.2 Materials and Methods ……………………………………………………...... 76
3.2.1 Materials …………………………………………………….............. 76
3.2.2 Cell Cultures ……………………………………………………........ 77
3.2.3 Synthesis of PLGA Nanoparticles ……………………………........... 78
3.2.4 Nanoparticle Characterization ……………………………................. 79
3.2.5 Thymoquinone Quantification ……………………………................ 79
3.2.6 Optimization of Entrapment Efficiency …………………………….. 80
3.2.7 In vitro Controlled Release ……………………………..................... 80
3.2.8 Antioxidant Activity of TQ-loaded Nanoparticles ………………...... 81
3.2.9 Cytotoxicity of TQ-loaded Nanoparticles …………………………... 81
3.3. Results and Discussion ……………………………………………………..... 82
3.3.1 Nanoparticle Characterization……………………………………….. 82
3.3.2 Optimization of TQ Entrapment Efficiency ………………………… 83
3.3.3 The Effect of Molecular Micelles on the Entrapment Efficiency …... 89
3.3.4 Release Profile of Optimized TQ-loaded PLGA Nanoparticles…….. 89
3.3.5 Antioxidant Activity of Optimized TQ-loaded PLGA
Nanoparticles ………………………………………………………...
91
3.3.6 Cytotoxicity of TQ and Optimized TQ-loaded Nanoparticles …........ 93
3.4 Conclusions …………………………………………………………………... 98
3.5 References …………………………………………………………………..... 99
CHAPTER 4. FLUORESCENT RATIOMETRIC MOLECULAR MICELLE -
MODIFIED POLY(D,L LACTIDE-CO-GLYCOLIDE)
NANOPARTICLES FOR DETECTION OF HYDROXYL RADICALS …
103
4.1 Introduction …………………………………………………………………... 103
4.2 Experimental …………………………………………………………………. 107
4.2.1 Materials …………………………………………………………….. 107
4.2.2 Synthesis of Coumarin Functionalized Molecular Micelles .….......... 107

vi
4.2.3 Nanoparticle Synthesis ……………………………………………… 109
4.2.4 Nanoparticle Characterization ………………………………………. 109
4.2.5 Dye Content ………………………………………………………… 110
4.2.6 Hydroxyl Radical Generation ……………………………………….. 110
4.2.7 Fluorescence Spectroscopy …………………………………………. 111
4.2.8 In vitro Detection of Hydroxyl Radicals ……………………………. 111
4.3 Results and Discussion ………………………………………………………. 111
4.3.1 Nanoparticle Characterization ………………………………………. 111
4.3.2 Nanoparticle Reaction with Hydroxyl Radicals …………………….. 113
4.3.2.1 Effect of Coumarin Location ……………………………. 114
4.3.2.2 Effect of Reaction Time …………………………………. 116
4.3.2.3 Effect of Nanoparticle Concentration …………………… 117
4.3.2.4 Effect of Hydroxyl Radical Concentration ……………… 118
4.3.3 Reaction with Other Radicals ……………………………………….. 120
4.3.4 In vitro Detection of Hydroxyl Radicals ……………………………. 120
4.4 Conclusions …………………………………………………………………... 122
4.5 References …………………………………………………………………..... 123
CHAPTER 5. CONCLUSIONS AND FUTURE STUDIES …………………………........ 126
APPENDIX I GENERAL SYNTHESIS SCHEME OF MOLECULAR
MICELLES ……………………......................……………………...
130
APPENDIX II EXPERIMENTAL CONDITIONS USED IN THE CENTRAL
COMPOSITE DESIGN ……......................…………………….........
132
APPENDIX III RESULTS OF ANALYSIS OF VARIANCE FOR CENTRAL
COMPOSITE DESIGN ………………...............................................
133
APPENDIX IV FLUORESCENCE OF NEUTRAL RED LOADED PLGA
NANOPARTICLES ………………....................................................
135
APPENDIX V COPYRIGHT AGREEMENT LETTER……………………………. 137
VITA …………………………………………………………………...…………………... 138
vii
LIST OF TABLES
Table Page
1.1 Differences between HPLC modes ………………………………………………. 16
1.2 Free radical fluorescent sensors ………………………………………………….. 30
2.1 Levels of design variables investigated in the central composite design ………… 49
2.2 The responses (particle size and PDI) used in the central composite design …….. 52
2.3 Results of analysis of variance for particle size (molecular micelles) …………… 54
2.4 Experimental and predicted particle size (Zave) and PDI ………………………… 64
2.5 Experimental zeta potential of PLGA nanoparticles before dialysis, after
dialysis and after freeze-drying (n=3) …………………………………………….
66
3.1 Physico-chemical properties of TQ-loaded PLGA nanoparticles (n=4)………….. 83
3.2 Experimental conditions used in Box-Behnken experimental design ……………. 85
3.3 Analysis of variance for Box-Behnken model …………………………………… 88
3.4 Predictability of Box-Behnken model ……………………………………………. 89
3.5 Effect of emulsifier on entrapment efficiency of TQ-loaded PLGA nanoparticles
(n=4) ………………………………………………………………..
90
3.6 DPPH scavenging activity of TQ and TQ-loaded PLGA nanoparticles (n=3) …... 92

viii
LIST OF FIGURES
Figure Page
1.1 Principal characteristics of drug delivery systems ………………………………. 3
1.2 Nanospheres and nanocapsules as drug delivery systems ……………………….. 5
1.3 Basic principle of emulsification solvent evaporation method. …………………. 6
1.4 Methods for nanoparticle characterization. DLS – Dynamic Light Scattering;
TEM – Transmission Electron Microscopy; HPLC – High Performance Liquid
Chromatography ………………………………………………………………….
8
1.5 Dynamic light scattering instrumentation .………………………………………. 10
1.6 Jablonski Diagram representing the energy levels and processes of molecular
excited state. FL – fluorescence; IC – internal conversion; ICX – intersystem
crossing; PH – phosphorescence …………………………………………………
13
1.7 Instrumentation for spectroscopic methods. A) UV-Vis Spectroscopy; B)
Fluorescence Spectroscopy ..……………………………………………………..
14
1.8 High performance liquid chromatography system ..……………………………... 15
1.9 Comparison between conventional micelles and molecular micelles .…………... 18
1.10 Natural and synthetic antioxidants .……………………………………………… 21
1.11 Role of coenzyme Q10 in respiratory chain .…………………………………….. 23
1.12 Benzoquinone – based anticancer drugs .………………………………………... 25
1.13 Generation of reactive oxygen species ..…………………………………………. 26
1.14 The balance between reactive oxygen radical species and antioxidants ..……...... 27
1.15 Methods of detection for oxidative stress .………………………………………. 29
1.16 Types of optimization designs .………………………………………………….. 33
2.1 Chemical structure of investigated molecular micelles. (A) poly (sodium N-
undecenyl sulfate) (poly-SUS); (B) poly (sodium N-undecenyl-glycinate) (poly-
SUG); (C) poly (sodium N- undecenyl-leucyl-valinate)
(poly-L-SULV) .………………………………………………….........................
48
2.2 Proposed mechanism of PLGA nanoparticle formation by use of emulsification
solvent evaporation using molecular micelles as emulsifiers .…….......................
51
ix
2.3 Response surface corresponding to particle size for PLGA nanoparticles
prepared with A) SDS; B) PVA C) poly-SUS; D) poly-SUG; E) poly-L-SULV
(right side – response surface for PLGA concentration and emulsifier
concentration; and left side – response surface for homogenization time and
sonication speed) ....................................................................................................
57
2.4 Response surface corresponding to polydispersity index for PLGA nanoparticles
prepared with A) SDS; B) PVA; C) poly-SUS; D) poly-SUG; E) poly-L-
SULV(right side – response surface for PLGA concentration and emulsifier
concentration; and left side – response surface for homogenization time and
sonication speed) …………………………………………....................................
60
2.5 Experimental particle size (A) and PDI (B) of PLGA nanoparticles before
dialysis, after dialysis and after freeze-drying (n = 3). 1S-5S refer to optimized
experiments leading to the minimum particle sizes; 1P-5P refer to optimized
experiments leading to the minimum PDI values ………......................................
65
2.6 Typical micrographs of freeze-dried PLGA nanoparticles obtained with
molecular micelles A) poly-SUS; B) poly-SUG; C) poly-L-SULV at 33,000x
magnification (right) and 160,000x magnification (left) .......................................
68
3.1 Structures of molecular micelles used as emulsifiers in the nanoparticle
synthesis (n is the length of carbon chain; x indicates the polymerization
site) .……………………………………………………........................................
77
3.2 Synthesis of TQ-loaded PLGA nanoparticles by emulsification solvent
evaporation using molecular micelles as emulsifiers …………………………….
78
3.3 Transmission electron micrograph of TQ-loaded PLGA nanoparticles
(magnification 33,000x) prepared with poly-SHG ................................................
84
3.4 Response surface for entrapment efficiency represented as a function of A) TQ
(mg) and PLGA (mg); and B) TQ (mg) and poly-SUG (% w/v). The highest
entrapment efficiency is shown by the red zones ..................................................
86
3.5 Release profile of TQ-loaded nanoparticles prepared with various
molecular micelles ……………………………………………………………….
91
3.6 Cell viability of A) Hs578Bct normal breast cells; B) MCF-7 breast cancer cells;
and C) MDA-MB-231 breast cancer cells incubated with TQ .………………….
94
3.7 Cell viability of Hs578Bct normal breast cells in the presence of blank and TQ-
loaded nanoparticles ...............................................................................................
96
3.8 Cell viability of MCF-7 cancer cells (left); and MDA-MB-231 cancer cells
(right) incubated with blank PLGA nanoparticles and
TQ-loaded PLGA nanoparticles …………………………….................................
98

x
4.1 Design of the ratiometric nanosensor .………………………................................ 106
4.2 Synthesis of C3C-poly-Nε-SUK micelle ...............................................................
108
4.3 TEM micrograph of C3C-poly-Nε-SUK – modified PLGA nanoparticles ...........
112
4.4 Normalized fluorescence of nanoparticles after the reaction with OH• (0.07
mg/mL nanoparticles, 200µM CuSO4, 20 mM H2O2 and 200 µM ascorbic acid;
5 minutes; total volume was 500 mL) .…………………………...........................
114
4.5 Effect of C3C location. Corrected fluorescence of nanoparticles after the
reaction with OH• (0.07 mg/mL nanoparticles, 200µM CuSO4, 20 mM H2O2
and 200 µM ascorbic acid; 5 minutes; total volume was 500 mL) ........................
115
4.6 Effect of reaction time on fluorescence ratio after the reaction of
nanoparticles with OH• (0.07 mg/mL nanoparticles, 200 µM CuSO4, 20 mM
H2O2 and 200 µM ascorbic acid; total volume 500 mL) …………........................
116
4.7 Fluorescence spectra of nanoparticles after the reaction with OH• (0.03, 0.07,
0.10, 0.14, 0.21 mg/mL nanoparticles, 400 µM CuSO4, 20 mM H2O2 and 200
µM ascorbic acid, incubated for 5 min; total volume 500 mL) .............................
117
4.8 (A) Fluorescence spectra of nanoparticles after the reaction with OH•
(0.07mg/mL nanoparticles, 20 mM H2O2, 200 µM ascorbic acid, and 10, 20, 30,
40, 50, 100, 200, 400, and 1000 µM CuSO4, incubated for 5 min; total volume
500 mL); (B) logarithmic I450/I528 ratio as a function of CuSO4
concentration .........................................................................................................
119
4.9 Fluorescence spectra of nanoparticles after the reaction with various radicals
(0.07 mg/mL nanoparticles, and OH• (400 µM CuSO4, 20 mM H2O2 and 200
µM ascorbic acid), O2-• (200 µM KO2), H2O2 (20 mM), OCl
- (200 µM NaOCl),
1O2 (200 µM H2O2 + 200 µM NaOCl) ...................................................................
121
4.10 Fluorescence micrographs of nanoparticle response in MCF-7 cells exposed to
H2O2 – induced oxidative stress (400 µM), before the addition of H2O2 (top left
corner), at t = 10, 20, and 40 minutes after the addition of H2O2 ..........................
123
xi
LIST OF ABBREVIATIONS
Abbreviation Name
17-AAG 17-allylamino-17-demethoxygeldanamycin
17-DAAG 17-dimethylaminoethylamino-17-demethoxy-geldanamycin
7-OH C3C 7-hydroxy coumarin 3-carboxylic acid
ANOVA Analysis of variance
ATCC American Tissue Culture Collection
BHA 4-methoxy-2-tert-butyl phenol
BHT 2,6 di-tert-butyl p-hydroxytoluene
C3C Coumarin 3-carboxylic acid
C3C-poly-Nε-SUK Coumarin 3-carboxylic acid functionalized poly (sodium N-
undecenyl-Nε-Boc lysinate)
CCD Central composite experimental design
CMC Critical micelle concentration
DCC N,N’-dicyclohexylcarbodiimide
DCM Dichloromethane
DLS Dynamic light scattering
DMAB Dodecyl dimethyl ammonium bromide
DMF Dimethyl formamide
DMSO Dimethyl sulfoxide
DPPH 2,2-diphenyl-1-picrylhydrazyl
EE % Entrapment efficiency
EHS Environment Health and Safety
xii
EPR Electron Paramagnetic Resonance
FDA Food and Drug Administration
FL Fluorescence
IC Internal conversion
ICX Intersystem crossing
GSP Glutathione peroxidase
HPLC High Performance Liquid Chromatography
MLR Multilinear regression
MTS 3-(4,5-dimethylthiazol-2-yl)-5-(3-carboxymethoxyphenyl)-2-
(4-sulfo-phenyl)-2H-tetrazolium salt
NeR Neutral red
NHS N-hydroxysuccinimide
NNI National Nanotechnology Initiative
NQO1 NADH quinone oxidoreductase
O/W Oil-in-water emulsion
PDI Polydispersity index
PEG Poly (ethylene glycol)
PH Phosphorescence
PLGA Poly(lactide-co-glycolide)
Poly-Nε-Boc-SUK Poly (sodium N-undecenyl-Nε-Boc lysinate)
Poly-SHG Poly(sodium N-heptenyl-glycinate)
Poly-SDG Poly(sodium N-decenyl-glycinate
Poly-SUA Poly(sodium N-undecenyl-alaninate)
Poly-SUG Poly (sodium N-undecenyl-glycinate)
xiii
Poly-SUL Poly(sodium N-undecenyl-leucinate)
Poly-L-SULV Poly (sodium N-undecenyl-L-leucyl-valinate)
Poly-SUS Poly (sodium N-undecenyl sulfate)
Poly-SUV Poly(sodium N-undecenyl-valinate)
PVA Poly (vinyl alcohol)
Q10 Ubiquinone, coenzyme Q10
ROS Reactive oxygen species
SDG Sodium N-decenyl-glycinate
SDS Sodium dodecyl sulfate
SECCA Succinimidyl ester of coumarin 3-carboxylic acid
SHG Sodium N-heptenyl-glycinate
SOD Superoxide dismutase
SUA Sodium N-undecenyl-alaninate
SUG Sodium N-undecenyl-glycinate
SUL Sodium N-undecenyl-leucinate
SUV Sodium N-undecenyl-valinate
TBHQ Tert-butyl hydroquinone
TEM Transmission Electron Microscopy
TFA Trifluoroacetic acid
TPGS Tocopheryl polyethylene glycol succinate
TQ Thymoquinone

xiv
ABSTRACT
Biodegradable and biocompatible polymeric nanoparticles such as poly (lactide-co-glycolide)
(PLGA) nanoparticles have been extensively studied as drug delivery systems for a variety of
pharmaceutical agents. Nanoparticle surface properties are primarily determined by the
emulsifiers used in the synthesis process, which have a significant impact on nanoparticle
physico-chemical and biological properties. Anionic amino acid – based molecular micelles were
used in the emulsification process to prepare monodisperse, small (below 100 nm) PLGA
nanoparticles with a well defined spherical shape. Such molecular micelle – modified
nanoparticles were used as drug carriers for delivery of antioxidants. Thymoquinone is a natural
antioxidant, and an emerging anticancer drug found in Nigella sativa black seed oil.
Thymoquinone – loaded nanoparticles demonstrated improved properties when compared with
the free drug, suggesting that such nanoparticle systems are promising candidates for antioxidant
delivery and tumor growth inhibition. Furthermore, polymeric nanoparticles were used as
sensors for detection of hydroxyl radicals. Ratiometric fluorescent molecular micelle – modified
PLGA nanoparticles were designed using a reporting dye (coumarin – functionalized molecular
micelle) present on their surface as well as a reference dye (neutral red) encapsulated into the
polymeric matrix. The nanoparticles were able to detect hydroxyl radicals in a time and
concentration dependent manner, and presented high selectivity for hydroxyl radicals as
compared with other reactive oxygen species. In addition, the ratiometric fluorescent
nanosensors were able to detect hydroxyl radicals in viable cells exposed to oxidative stress,
allowing their potential use in the study of other living systems.

1
CHAPTER 1
INTRODUCTION
1.1 Nanotechnology and Drug Delivery Systems
If we were to build a scale of things, we would start by thinking about how big a planet is
or how high we have to climb to the peak of a mountain. In contrast, we observe small objects
around us such as the head of a pin (2 mm) or the width of a hair (50-150 µm). However, there is
a smaller scale that we cannot see, the nanometer scale. For example, a double DNA strand is
only a few nanometers in diameter. In addition, nanometer size materials offer unique properties.
For example, quantum dots have size-dependent spectral properties, emitting light from blue to
red and into the near-infrared. In the medical field, drug-loaded nanoparticles can target specific
cells or can migrate through the blood brain barrier while the drug itself cannot.1, 2 Therefore,
science and technology are focused nowadays towards the nanometer scale, specifically to take
advantage of such nanoscale properties.
The fabrication, characterization, and application of structures and devices having tunable
properties determined by their nanometer size (≤100 nm) represent the discipline of
nanotechnology.3, 4 Nanotechnology is constructed on a strong foundation of cumulative efforts
of chemists, biologists, physicists and engineers. Their goals include the discovery and the
development of new and innovative technologies, assessment of social and health risk factors as
well as sustainability for future generations.5-7 Since the lecture of Richard Feynman entitled
“There is plenty of room at the bottom” at CalTech in 1959, the development of nanotechnology
has increased dramatically.8-10 The transition from the macroscopic materials and devices to the
nanoworld has been observed in many areas including material science, energy, agriculture,
communications, environment, health care, and aerospace. Recently, a research group from the
University of Arizona has developed an internet based database, called “nano mapper”

2
(http://www.nanomapper.eller.arizona.edu/), where one can search the number of patents related
to nanotechnology published worldwide.11 For example, using “nano” as keyword, the search
results indicated that the United States Patent and Trademark Office has issued more than 3000
nano-patents. A significant number of patents was also released by the European and Japanese
Patent Offices.
As a result of continuous growth in this field, more than 35 countries have initiated
governmental funding programs related to nanotechnology. For example, the Japanese
government allocated more than $800 million to nanotechnology projects in 2003, followed
closely by the United States with approximately $774 million, representing six times more than
in 1997.12 In a report released by the National Nanotechnology Initiative (NNI), the central
nanotechnology authority in the United States, the proposed NNI budget for 2010 is $1.64
billion. Such financial support was designated to contribute not only to the development of
nanotechnology, but also to its impact on Environment, Health, and Safety (EHS).13 Similarly,
the European Commission Framework Programme proposed a total budget of 50 billion Euro for
2007-2013 that focuses on nanoscience, the production of new nanomaterials, and the
development of nanotechnologies. In addition, multinational programs such as STAGE,
NANOROADMAP, and FRAMINGNANO, have been developed for public engagement,
education and communication throughout the European countries.14
One important area of nanotechnology is nanomedicine. It includes the investigation and
the development of nanoscale surgery, tissue engineering, and drug delivery systems that lead to
improved diagnosis and therapy.1, 15 The efforts of the pharmaceutical industry have been
directed towards new bioactive compounds that interact with biological molecules depending on
local, sustained, or stimuli-triggered delivery.16 Several important aspects of drug delivery
systems are depicted in Figure 1.1. Active pharmaceuticals can be classified into four classes.

3
Class I includes compounds that have the highest permeability through cell membrane and the
highest water solubility. In contrast, class IV drugs have the lowest bioavailability, and hardly
reach the market. However, drugs from classes II and III possessing low bioavailability,
determined by either low solubility or low permeability, are candidates for drug delivery
systems.17
Figure 1.1 Principal characteristics of drug delivery systems.
In addition, biocompatible materials should be used as carriers in order to avoid
inflammatory response and clearance from the body before reaching their site. Therefore, on one
side, drug properties such as bioavailability, biocompatibility, and stability are relevant for the
design of drug delivery systems that improve such properties. On the other side, questions such
as how and where the drug is administered need to be addressed as well. Whether the drug
delivery system is ingested or administered intravenously, targeted delivery becomes possible by
functionalized surfaces that trigger direct responses from specific cells or intracellular
components.18-20
DRUG PROPERTIES
BIOAVAILABILITY
BIOCOMPATIBILITY
STABILITY
ADMINISTRATION
ROUTE
TARGET
RELEASE
DDRRUUGG
DDEELLIIVVEERRYY
SSYYSSTTEEMMSS
4
Numerous pharmaceutical compounds can be delivered via various routes by use of
nanoparticles. Oral drug administration is preferred based on patient convenience. However,
many drugs are not resistant to the acidic environment present in the gastrointestinal tract.
Therefore, intravenous administration is commonly used. In such cases, colloidal aqueous
suspensions should contain submicron nanoparticles in order to avoid deposition and clogging of
blood vessels.
Another important aspect of drug delivery systems is the release mechanism. For
example, the drug can be delivered at a steady concentration over a period of time, or can present
a burst release for a short period of time followed by constant release. In other cases, the drug
can be released under the effect of external stimuli such as pH, temperature, and ionic strength.
In addition, controlled drug delivery systems provide prolonged delivery at an optimum drug
level as compared with a fluctuating free drug administration. Furthermore, drug delivery
systems can be designed to target specific cells and tissues, and to provide drug protection
against degradation. In addition, such systems lead to improved general comfort of the patient
determined by reduced number of doses, and minimized undesirable side effects. 21-23
1.2 Polymeric Nanoparticles as Drug Delivery Systems
There is a multitude of nanomaterials that can reach pharmaceutical performance of drug
delivery systems. They include polymeric nanoparticles, solid lipid nanoparticles, cyclodextrins,
liposomes, quantum dots, carbon nanotubes, and gold nanoparticles.20, 24, 25 However,
biodegradable materials are preferred specifically due to their biodegradability and compatibility
with the human body. For example, poly (lactic acid), poly (glycolic acid), and their copolymer,
poly (lactide-co-glycolide) (PLGA), are FDA approved biodegradable polymers previously used
for scaffolds and tissue engineering. Nanoparticles prepared from such polymers would likely
have less toxic effects than other nanomaterials used for preparation of drug carriers. In addition,

5
several other attractive properties such as degradation of the monomers through normal
metabolic paths, versatility of preparation methods, and the variety of molecules to be delivered
make PLGA nanoparticles the state of the art in drug delivery.26, 27
The market of polymeric nanoparticles used as drug delivery systems has expanded
considerably in the last years. The first FDA approved drug delivery system was developed by
TAP Pharmaceutical Products for prostate cancer treatment with leuprolide acetate using
injectable PLGA microparticle system. Other drug delivery systems such as PLGA nanoparticles
for human growth hormone delivery and albumin-stabilized nanoparticles for paclitaxel delivery
are available on the market or in clinical trials.27-29
There are two types of polymeric nanoparticles: nanosheres and nanocapsules, as shown
in Figure 1.2. A hydrophobic active agent can be entrapped in the polymeric matrix of
nanospheres while a hydrophilic drug can be encapsulated into the nanocapsule core. In both
cases, the drug can be adsorbed or chemically bound to the nanoparticle surface as well.30-32
Using this variety of approaches, polymeric nanoparticles have been extensively investigated as
delivery systems for anticancer drugs,33, 34 gene therapy,35 and protein delivery.36
Figure 1.2 Nanospheres and nanocapsules as drug delivery systems.
Nanospheres
Nanocapsules
Entrapped
drug
Adsorbed
drug
6
1.2.1 Methods of Preparation
Polymeric nanoparticles can be prepared by a multitude of methods. 18, 37-39 Depending on the
type of drug, preparation methods such as emulsion – evaporation and emulsion – diffusion can
be specifically adopted for nanospheres incorporating hydrophobic drugs.40-45 In addition, a
double water-in-oil-in-water emulsion has been used for the encapsulation of water soluble
active agents such as proteins and DNA.46, 47
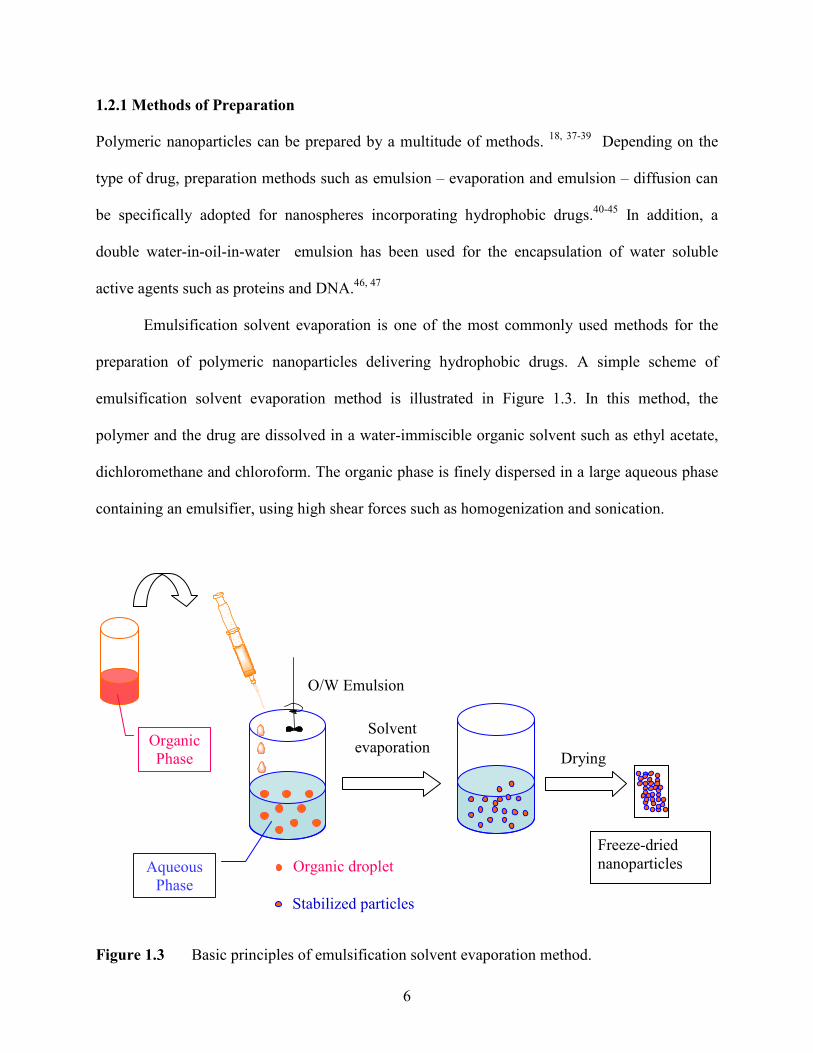
Emulsification solvent evaporation is one of the most commonly used methods for the
preparation of polymeric nanoparticles delivering hydrophobic drugs. A simple scheme of
emulsification solvent evaporation method is illustrated in Figure 1.3. In this method, the
polymer and the drug are dissolved in a water-immiscible organic solvent such as ethyl acetate,
dichloromethane and chloroform. The organic phase is finely dispersed in a large aqueous phase
containing an emulsifier, using high shear forces such as homogenization and sonication.
Figure 1.3 Basic principles of emulsification solvent evaporation method.
Organic droplet
Solvent evaporation
Drying
Freeze-dried nanoparticles
Organic Phase
Aqueous Phase
O/W Emulsion
Stabilized particles
7
The organic solvent is then evaporated, leading to solidification of polymeric spheres.
Parameters such as drug – polymer compatibility, the organic to aqueous phase ratio, evaporation
speed as well as the intensity and time of homogenization play an important role in the synthesis
of nanoparticles. For example, highly hydrophobic drugs can be encapsulated into polymers with
a high content of lactide. In addition, a small organic to aqueous phase ratio often leads to small
size nanoparticles. Removal of excess emulsifier and un-entrapped drug are critical aspects of
nanoparticle synthesis as well. Therefore, purification by various methods such as dialysis and
centrifugation follows the nanoparticle synthesis. For long term storage, nanoparticles are
typically dried to powder form and re-suspended in aqueous media before use.
Other methods such as nanoprecipitation and diffusion can also be used for nanosphere
preparation. The basic principle of these methods is similar to the one presented in Figure 1.3.
However, they involve the use of a water miscible solvent and slow solvent evaporation in a
larger aqueous phase. Particle sizes above 100 nm and poor drug entrapment limit such methods
for their use in the preparation of polymeric nanoparticles.
1.2.2 Characterization of Polymeric Nanoparticles
The benefits of drug delivery systems based on polymeric nanoparticles are mainly
determined by their physico-chemical properties such as particle size, zeta potential, shape and
surface appearance as well as drug content and release. There are numerous methods for
characterization of nanoparticles, as shown in Figure 1.4. For example, important aspects such as
particle size, polydispersity, surface charge, and morphology are investigated by use of dynamic
light scattering and imaging techniques. In contrast, separation techniques and spectroscopy can
be used for the determination of drug content. In addition, toxicity and in vitro performance of
nanoparticle-based drug delivery systems involve cell culture analyses. Several methods used in
this dissertation are described below.

8
Figure 1.4 Methods for nanoparticle characterization. DLS – Dynamic Light Scattering; TEM – Transmission Electron Microscopy; HPLC – High Performance Liquid Chromatography.
1.2.2.1 Size and Polydispersity
Particle size and size distribution (polydispersity) are important characteristics of
polymeric nanoparticles. Small nanoparticles of 100 nm are suitable for oral and parenteral
administration and have better cellular uptake as compared to microparticles.18, 35 Particle size is
typically determined by use of dynamic light scattering, also known as photon correlation
spectroscopy.
Dynamic light scattering (DLS) is based on variations in time of the intensity of scattered
light from a monodisperse colloidal nanoparticle suspension. Such variations are the result of the
nanoparticle translational and rotational Brownian motion in solution. The intensity of scattered
photons is measured in channels that are further correlated. The correlation function, g (1) (τ), is
given by equation 1.1:
( ))(exp)( 2)1(ττ Dqg −= 1.1
where τ is the decay time; q = 4πn/λ0sinΘ/2 is a scattering factor dependent on refractive index
HPLC Spectroscopy
DRUG LOADING
DLS
TEM
zeta potential
PARTICLE SIZE
POLYDISPERSITY
MORPHOLOGY
SURFACE
ANALYSIS
NNAANNOOPPAARRTTIICCLLEESS

9
n, incident light wavelength, λ0, scattering angle ,Θ, and diffusion coefficient, D.48
The hydrodynamic radius of a nanoparticle, Rh (m), is determined based on the Stokes –
Einstein formula (equation 1.2):
D
kTRh
πη6= 1.2
where k is Boltzmann constant (1.380x10⁻²³ J K-1); T is temperature (K); η is viscosity (Pa s-1);
and D is diffusion coefficient (m2 s-1).3, 49
Instrumentation for dynamic light scattering is simple and user-friendly (Figure 1.5). In
principle, the light provided by a laser source passes through a sample containing nanoparticles.
If a particle in solution is in the light path, it scatters light of whose intensity is further detected
by a photomultiplier tube detector placed either at 90º or 173º. The backscatter detector at 173º
represented in Figure 1.5 reduces interferences given by multiple scattering and large dust
particles. The signal from the detector is transferred to a correlator that analyzes the time profile
of the scattered light intensity. A computer processes this information and calculates the particle
size (as diameter, Zave) based on the decay of correlation function in time. Polydispersity (as
polydispersity index, PDI) is calculated as well and gives the size distribution of a nanoparticle
sample. Monodisperse samples (PDI ~ 0.1) are represented by a narrow size distribution,
whereas polydisperse samples (PDI > 0.1) would have broad size distribution including small
nanoparticles as well as large nanoparticles and aggregates.50
1.2.2.2 Zeta Potential
The nanoparticle surface charge is critical for the stability of nanoparticle emulsion. If
two particles would have no charge on the surface, they would likely coalesce. In contrast, highly
positive or negative charged nanoparticles would remain suspended in solution for a longer
period of time, based on their charge repulsion. For example, the positive ions of a solvent

10
attached to the surface of a negatively charged particle in suspension forms an ionic layer called
the Stern layer. If this particle moves, the tightly attached positive charges (Stern layer) will
move along with the particle. However, there is a diffuse layer at a certain distance from the
surface of a particle where charges from the solvent are stationary.
Figure 1.5 Dynamic light scattering instrumentation.
Zeta potential is an indicator of surface charge and is represented by the charge difference
between Stern layer and stationary layer.51 It is measured by laser Doppler anemometry that
considers both scattered light and electrophoretic mobility of charged particles in a constant
external electric field. The instrumentation is similar to the one presented in Figure 1.5. The
difference is that an electric field is applied between two electrodes placed on the sides of a
Laser
Non-scattered
light
Scattered light
173º
Correlator
Z(ave) nm
I n t ens i t
y

11
capillary cell containing charged nanoparticles in suspension. Zeta potential is calculated based
on the Henry equation (equation 1.3):
( )πη
ζµ
6
kaFE = 1.3
where µE is electrophoretic mobility (cm2v-1s-1); ζ is zeta potential (mV); η is viscosity (Pa s-1);
F(ka) is Henry’s function, approximated to 1.5 (Smoluchowski) for aqueous media and 1.0
(Huckel) for organic media.49-51
1.2.2.3 Morphology
Imaging techniques such as transmission electron microscopy, scanning electron
microscopy and atomic force microscopy are typically used for the investigation of nanoparticle
size, shape and uniformity. Transmission electron microscopy (TEM) is a powerful imaging
technique commonly used in nanoparticle research, offering high resolution and great detail
about nanoparticle morphology. It is based on the interactions of electrons generated by an
electron gun with a thin layer of sample (≤ 100 µm) fixed on a small copper grid (3 mm).
There are two types of electrons detected in TEM, those transmitted through the sample
that do not interact with the sample, and those that are scattered by a more dense material. Using
this technique, a contrast TEM micrograph is formed on a phosphorous screen by light areas of
transmitted electrons and dark areas of scattered electrons. A condenser system controls the
intensity of the electron beam, whereas a series of lenses are used for the increase in
magnification up to 200,000 times.3, 52
1.2.2.4 Drug Loading
Drug loading refers to the amount of encapsulated drug into the polymeric nanoparticles
at the end of the synthesis process, after the elimination of excess drug that was not encapsulated.
The drug loading is typically expressed as encapsulation efficiency representing the ratio

12
between the detected drug amount and the drug amount calculated based on the initial quantity
added to the formulation. The expression for encapsulation efficiency is given by equation 1.4:
100(%) ×=ltheoretica
calculated
drug
drugEE 1.4
where EE % is the encapsulation efficiency; drugcalculated is the ratio between the amount of drug
(mg) determined using analytical methods and the amount of nanoparticles (mg) taken for
analysis; and drugtheoretical the ratio between the amount of drug (mg) and the amount of polymer
(mg) added initially to the formulation. The entrapment efficiency can be directly determined by
dissolving a known amount of nanoparticles in appropriate solvents and analyzing the drug
content. Alternatively, one can determine loses of polymer, drug and emulsifier during the
nanoparticle synthesis, and calculate the drug loading by the difference.
The amount of encapsulated drug can be determined by various methods such as
spectroscopy and separation techniques. For example, if the drug absorbs and emits light, then
the drug loading can be easily determined by UV-Vis and fluorescence spectroscopy,
respectively. In general, UV-Vis spectroscopy is a useful simple technique that is easy to use
and widely available in research laboratories. Using this method, UV light passes through a
transparent sample of known path length, and the transmitted or absorbed light is detected. The
concentration of an analyte can be determined using Beer-Lambert’s law as defined by equation
1.5:
bcA ε= 1.5
where A is absorbance (a.u.); b is path length (cm); c is analyte concentration (M); and ε is molar
absorbtivity (cm-1 M-1).
For direct determination of drug loading using UV-Vis spectroscopy, scattering light
from the nanoparticle solution represents an important limitation. In addition, polymers usually

13
absorb light as well. If there is an overlap between the absorbance of the drug and the absorbance
of other nanoparticle components, several sample preparation steps such as precipitation and
filtration can be taken to eliminate such interferences. However, UV-Vis spectroscopy becomes
useful for indirect determination of drug loading. In this case, drug loses in the purification steps
such as centrifugation can be quantified and entrapment efficiency can be calculated by the
difference. Typically, the determination of drug concentrations in the mM range is suitable for
UV-Vis spectroscopy.
Fluorescence spectroscopy is a more sensitive technique in comparison to UV-Vis
spectroscopy. When light comes in contact with a molecule in a ground state, it induces
molecular excitation to an excited state of higher energy (excited state). The processes taking
place in the excited state are represented by Jablonski diagram (Figure 1.6). Fluorescence (FL)
occurs when the molecule is slowly relaxed to ground state emitting a photon that is further
detected.
Ground state
Singlet
excited state
hνννν
IC
Triple
excited state
IC
PHFL
IC
ICX
Ground state
Singlet
excited state
hνννν
IC
Triple
excited state
IC
PHFL
IC
ICX
Figure 1.6 Jablonski Diagram representing the energy levels and processes of molecular excited state. FL – fluorescence; IC – internal conversion; ICX – intersystem crossing; PH – phosphorescence.

14
Processes such as internal conversion (IC) and intersystem crossing (ICX) are non-
radiative energy transitions. In constrast, phosphorescence (PH) is a radiative process occurring
by relaxation from a triple excited state. The components of UV-Vis and fluorescence
spectroscopy instrumentation are schematically represented in Figure 1.7. They include a light
source, gratings, a sample holder and a detector. The two instruments are comparable. However,
fluorescence spectroscopy involves two gratings and a 90º angle configuration. Therefore,
fluorescence spectroscopy is more sensitive, and can detect concentrations in the nanomolar
range as compared to micromolar concentrations detected by UV-Vis spectroscopy.
Figure 1.7 Instrumentation for spectroscopic methods. A) UV-Vis Spectroscopy; B) Fluorescence Spectroscopy.
Fluorescence spectroscopy has been used for determination of encapsulation efficiency of
polymeric nanoparticles containing various fluorescent molecules that have been used for
fluorescence imaging.53 In addition, fluorescent anticancer drugs such as doxorubicin were
encapsulated into polymeric nanoparticles, and the drug loading was determined by fluorescence
spectroscopy.54, 55
Source
Detector
Grating
Grating
Grating
Source
Detector
A)
B)

15
Although spectroscopic techniques are useful in the determination of drug loading,
complex matrices of nanoparticle formulations containing drugs, polymers, surfactants and other
molecules would be difficult to analyze without preliminary sample preparation steps. In
addition, many of the pharmaceutical compounds do not posses spectral properties, and, in some
cases, the interferences from the polymer or other compounds present in formulation become
significant. Instead, chromatographic separation techniques can be applied.
High performance liquid chromatography (HPLC) is commonly used in nanoparticle
research for determination of drug composition. Using this method, each component is separated
based on their partition between a solid stationary phase fixed inside a chromatographic column,
and a liquid mobile phase passing through the column. Furthermore, separated components can
be detected by a variety of detectors including UV-Vis, fluorescence, and electrochemical
detectors. A typical HPLC system is depicted in Figure 1.8.
Figure 1.8 High performance liquid chromatography system.
Pump
Pump
Detector
Solvents
Column
waste
mixer
10
30
50
70
90
110
130
0 5 10
time
Stationary phase

16
The HPLC instrumentation includes the solvent containers, pumps and mixers for mobile
phase preparation, a sample holder and injection system, the chromatographic column, and a
detector. There are two modes that can be used for nanoparticle composition analysis: reversed
phase and normal phase HPLC. The differences between these modes are shown in Table 1.1. In
the reversed phase mode, stationary phase contains silica beads modified with alkyl chains of 4-
18 carbons, whereas in normal phase hydrophilic compounds are simply adsorbed on the surface
of silica packing.
Table 1.1 Differences between HPLC modes
Mode Stationary phase Mobile phase Analytes
Reverse phase Non-polar: Hydrocarbons (C4, C8, C18)
Polar: water, alcohols, acetonitrile
Non-polar (the least non-polar elutes first)
Normal phase Polar: water, tri- ethylene glycol
Non-polar: hexanes, isopropyl ether
Polar (the least polar elutes first)
The polarity of the mobile phase is opposite to the one of the stationary phase, allowing
partitioning of the analytes between these phases. The longer the analyte interacts with the
stationary phase, the longer the retention time would be. Therefore, a chromatogram contains fast
eluting peaks for non-interacting compounds at shorter times as well as interactive compounds at
longer times.56 Determination of a hydrophobic drug loading typically involves a reverse phase
HPLC system. The selection of an appropriate solvent that allows complete nanoparticle
dissolution is important in order to avoid further drug losses that would affect the entrapment
efficiency. In addition, an adequate mobile phase that clearly separates all compounds present in
the nanoparticle formulation and does not create any precipitation in the system should be used.

17
1.3 Molecular Micelles
Many nanoparticle preparation methods are based on the formation of oil-in-water (o/w)
nanoemulsions that require the presence of an anionic, cationic, or non-ionic surfactant
(emulsifier) dissolved in the aqueous phase. The surfactant adsorbs on the surface of organic
droplets based on hydrophobic interactions consequently reducing the surface tension between
the oil and the aqueous phases. For a surface tension near zero, a spontaneous emulsion is
formed. An important aspect is the size of an emulsion droplet that depends on various factors
including surfactant concentration and oil to water phases’ ratio. For example, large droplets
seem to coalesce easily while small droplets remain suspended in water for a longer period of
time. In nanoparticle synthesis, nanoparticle size and size distribution are directly related to
reduction and stability of emulsion droplet. Several emulsifiers such as sodium dodecyl sulfate
(SDS), dodecyl dimethyl ammonium bromide (DMAB), poly (vinyl alcohol) (PVA), poly
(ethylene glycol) (PEG), Pluronic, Tween, and tocopheryl polyethylene glycol succinate (TPGS)
are used for such purposes.57-61
1.3.1 Comparison with Conventional Micelles
In general, surfactants are amphiphilic molecules that have both hydrophobic and
hydrophilic groups. For example, SDS is a common anionic surfactant that has a hydrophobic
alkyl chain (tail) and a negatively charged sulfate group as hydrophilic moiety (head). Other
surfactants can be cationic such as DMAB, or neutral such as Triton X. In aqueous solution,
surfactant molecules self-assemble into spherical micelles, rods and bilayers depending on the
surfactant geometry and concentration.
The critical micellar concentration is defined as the concentration at which a micelle is
formed, often observed by a sudden decrease of solution surface tension.49 Micelles are in a
dynamic equilibrium with the surfactant molecules, and any change in the environment can
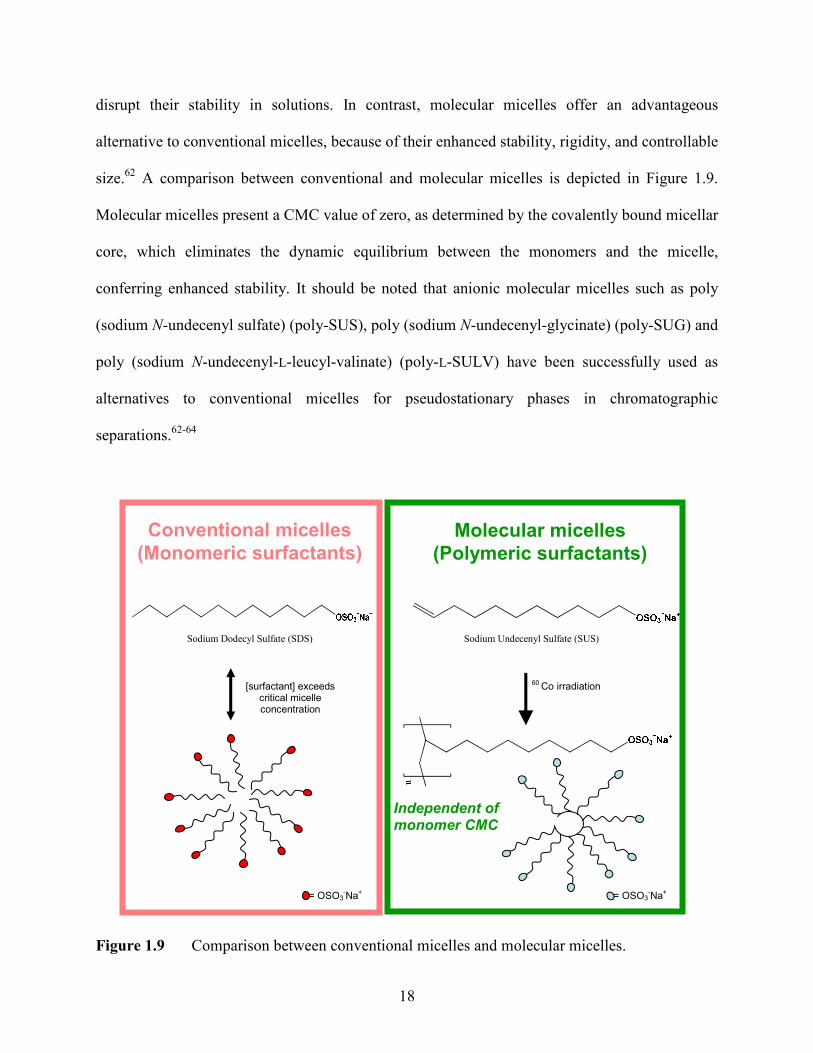
18
disrupt their stability in solutions. In contrast, molecular micelles offer an advantageous
alternative to conventional micelles, because of their enhanced stability, rigidity, and controllable
size.62 A comparison between conventional and molecular micelles is depicted in Figure 1.9.
Molecular micelles present a CMC value of zero, as determined by the covalently bound micellar
core, which eliminates the dynamic equilibrium between the monomers and the micelle,
conferring enhanced stability. It should be noted that anionic molecular micelles such as poly
(sodium N-undecenyl sulfate) (poly-SUS), poly (sodium N-undecenyl-glycinate) (poly-SUG) and
poly (sodium N-undecenyl-L-leucyl-valinate) (poly-L-SULV) have been successfully used as
alternatives to conventional micelles for pseudostationary phases in chromatographic
separations.62-64
Figure 1.9 Comparison between conventional micelles and molecular micelles.
Conventional micelles
(Monomeric surfactants)
Molecular micelles
(Polymeric surfactants)
Sodium Dodecyl Sulfate (SDS)
= OSO3-Na+
[surfactant] exceeds critical micelle concentration
Sodium Undecenyl Sulfate (SUS)
= OSO3-Na+
60 Co irradiation
Independent of monomer CMC

19
1.3.2 Molecular Micelles in Nanoparticle Synthesis
The importance of the emulsifier in the stability of emulsion is well established. However
in case of nanoparticles used as drug delivery systems, the bulk emulsifier is removed, mainly
because of its toxicity. In addition, the remaining emulsifier has to be at a low concentration in
order to avoid toxic effects, but at a high enough concentration in order to allow re-suspension of
nanoparticles in aqueous solution after purification and drying.
Sodium dodecyl sulfate (SDS) has also been used as an emulsifier in nanoparticle
synthesis, and often leads to small particle sizes.41 However, the stability of nanoparticle
suspension is affected after SDS removal, by the formation of aggregates which are not able to
re-suspend in an aqueous solution. In addition, the surfactant is efficient as emulsifier only at
concentrations higher than the CMC, which limits the investigation of a wider range of
concentrations. Poly (vinyl alcohol) (PVA) is one of the commonly used emulsifiers, which leads
to the formation of high stable nanoparticles in solution.40, 47 However, the residual PVA
attached to the nanoparticle surface is difficult to remove and limits the nanoparticle cellular
uptake and drug controlled release properties.65
1.4 Antioxidants
Nanomedicine and drug delivery systems have a direct impact on the improvement of
disease treatment, especially in chemotherapy. In addition, disease prevention is an important
aspect of our lives as we eat healthy and exercise in order to avoid illness. Antioxidants play a
significant role in both disease prevention and treatment. The word “antioxidant” is often seen in
the supermarkets on product labels from milk, soda, shampoo, and anti-wrinkle face cream. The
questions of what an antioxidant is and what it does after it is used often remain unanswered. The
term antioxidant would simply imply a compound that opposes oxidation. Indeed, in the case of
aerobic organisms, oxidation is a normal metabolic process in which energy is produced through

20
a series of reactions that involve oxidants, i.e. free radicals. However, the overproduction of
oxidants becomes deleterious, and therefore, is counterbalanced by the presence of antioxidants
that act either as free radical suppressors or as scavengers.66, 67 The types of free radicals and
their roles are described in Section 1.5.
Antioxidants such as coenzyme Q10, enzymes superoxide dismutase (SOD) and
glutathione peroxidase (GSP) are normally produced by the body. Other antioxidants come from
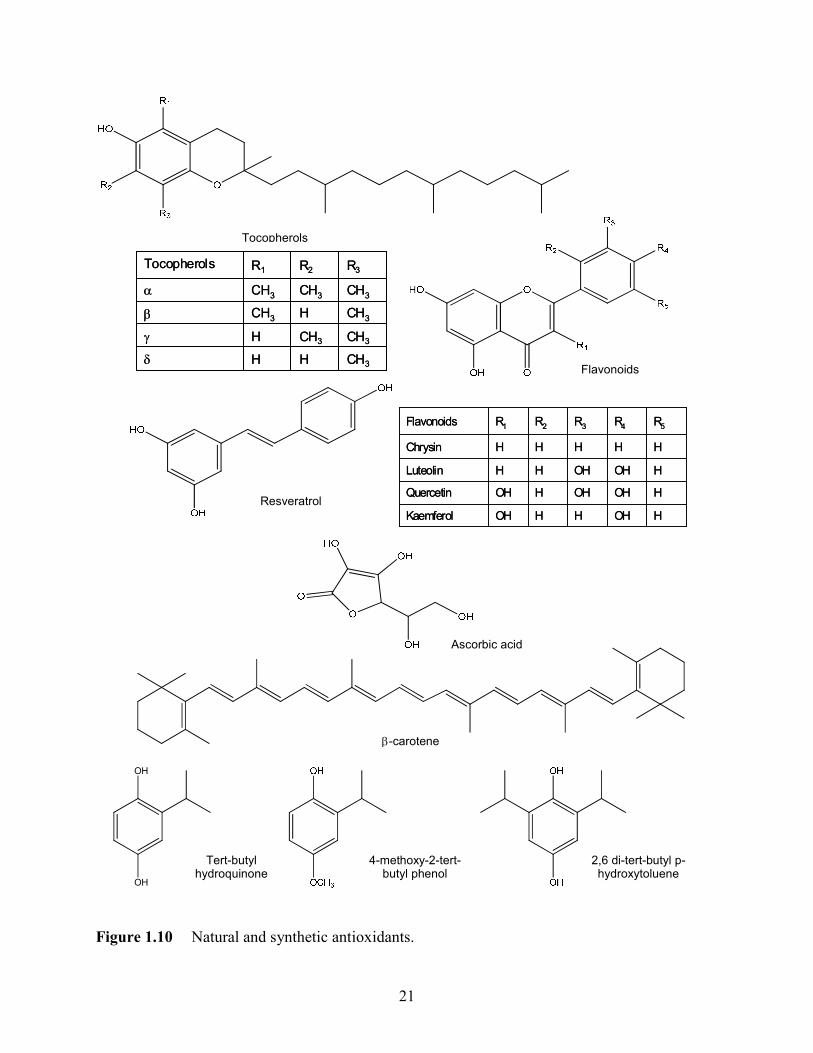
diet and include vitamins, carotenoids, and minerals. Several examples of antioxidants are shown
in Figure 1.10.68 Natural antioxidants can be found in nuts, seed oil, vegetables, fruits spices, teas
and animal products. Vitamin E is a generic name represented by a group of four tocopherols.
liposoluble compounds found in fats and oils with various antioxidant activities, depending on
their ability to donate the hydrogen from the hydroxyl group in lipid peroxidation. Flavonoids
are another group of antioxidants found in most of the plant leaves and flowers. The presence of
multiple hydroxyl groups determines an enhanced free radical scavenging activity. Other natural
antioxidants, such as vitamin C (ascorbic acid) found in citrus, resveratrol found in grapes, and
β-carotene found in carrots are also important antioxidants. Synthetic powerful antioxidants such
as tert-butyl hydroquinone (TBHQ), 4-methoxy-2-tert-butyl phenol (BHA) and 2,6 di-tert-butyl
p-hydroxytoluene (BHT) are hydrophobic and thermally stable, therefore used as antioxidants in
vegetable oils. However, such compounds are strictly regulated because of their toxicity and
more recently have been replaced with natural antioxidants.
1.4.1 Nutrition, Disease Prevention, and Therapy
The majority of antioxidants come from our diet. The term antioxidant is used often on
many consumer products to label specific antioxidant benefits. The Food and Drug
Administration (FDA) defines an antioxidant as a nutrient that possesses antioxidant activity,
acting against free radicals. Such activity has to be supported by scientific evidence.
21
Figure 1.10 Natural and synthetic antioxidants.
Resveratrol
Ascorbic acid
β-carotene
CH3HHδ
CH3CH3Hγ
CH3HCH3β
CH3CH3CH3α
R3R2R1Tocopherols
CH3HHδ
CH3CH3Hγ
CH3HCH3β
CH3CH3CH3α
R3R2R1Tocopherols
OH
OH
Tert-butyl hydroquinone
4-methoxy-2-tert-butyl phenol
2,6 di-tert-butyl p-hydroxytoluene
H
OH
OH
H
R3
OH
OH
OH
H
R4
HHOHKaemferol
HHOHQuercetin
HHHLuteolin
HHHChrysin
R5R2R1Flavonoids
H
OH
OH
H
R3
OH
OH
OH
H
R4
HHOHKaemferol
HHOHQuercetin
HHHLuteolin
HHHChrysin
R5R2R1Flavonoids
Flavonoids
Tocopherols
22
According to FDA, a “good source of antioxidants” is represented by a group of nutrients
including vitamin C, vitamin E and carotenoids that are present in concentrations of 10 – 20
percent of their recommended daily intake value.69 Besides a regular diet rich in fruits and
vegetables that provide a daily antioxidant intake, dietary supplements are a source of
antioxidants as well. In the recent years, a dramatic increase in the use of dietary supplements
has been observed. It is estimated that in the United States there were over 290,000 dietary
supplements on the market in 2005, with over $20 billion in sales, vitamins and minerals
representing 34 percent of it.70
Phytonutrition becomes phytotherapy when a compound with nutritional value is used for
the improvement of physiological functions.71, 72 The use of plants and foods in the treatment of
various conditions has been known for centuries in many regions of the world.73-76 Today many
of them are excellent sources for drug discovery. In addition, the implications of free radicals in
the origin of disease provided an opportunity for the development of antioxidant alternative
therapy for disease prevention and treatment. For example, antioxidants can reduce the incidence
of cancer, help restoring the immune system, decrease the oxidation of low-density lipoprotein,
and in some instances prevent the development of age-related cataract and macular
degeneration.70, 77, 78 In addition, the mechanism against disease depends on antioxidants type
and structure. For example, enzymes such as superoxide dismutase and catalase inhibit the
formation of superoxide anion radicals and hydrogen peroxide, while glutathione peroxidase and
vitamin E participate in the decomposition of lipid peroxides.
1.4.2 Quinones
Quinones refer to a group of antioxidants that typically contain a benzoquinone structure,
although several naphtoquinones and antraquinones have also antioxidant properties.
Ubiquinone, also named coenzyme Q10 (Q10) is a well known endogenous antioxidant present
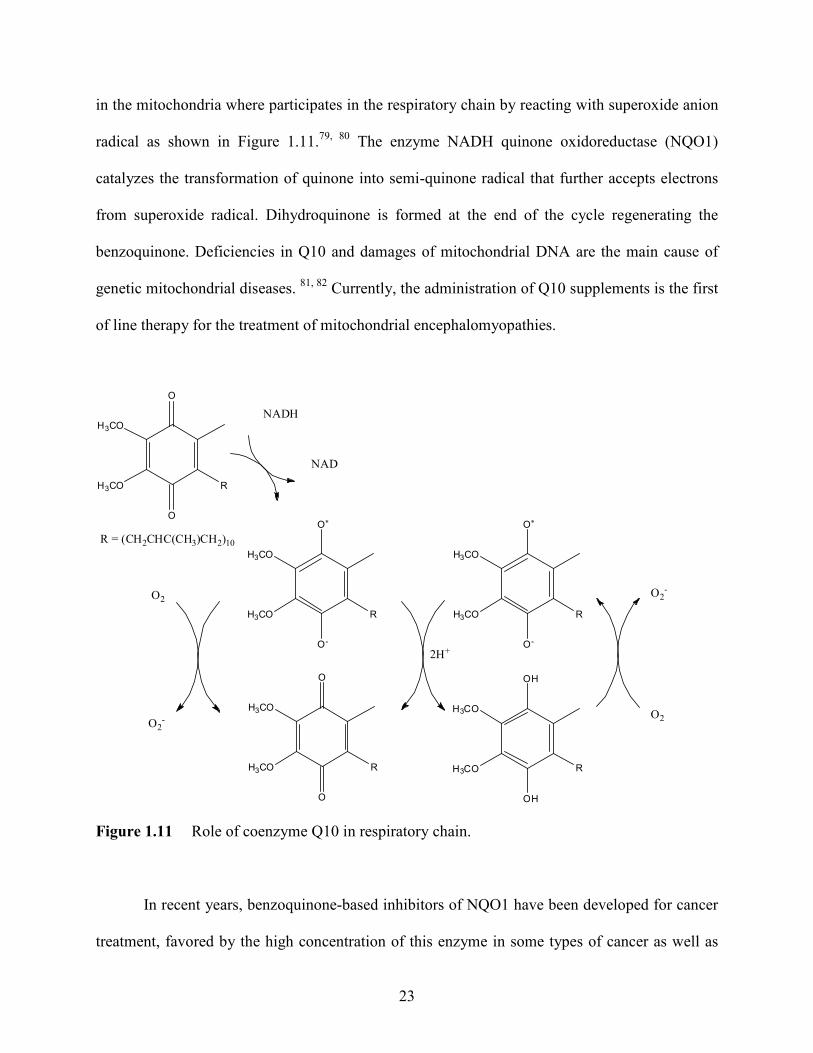
23
in the mitochondria where participates in the respiratory chain by reacting with superoxide anion
radical as shown in Figure 1.11.79, 80 The enzyme NADH quinone oxidoreductase (NQO1)
catalyzes the transformation of quinone into semi-quinone radical that further accepts electrons
from superoxide radical. Dihydroquinone is formed at the end of the cycle regenerating the
benzoquinone. Deficiencies in Q10 and damages of mitochondrial DNA are the main cause of
genetic mitochondrial diseases. 81, 82 Currently, the administration of Q10 supplements is the first
of line therapy for the treatment of mitochondrial encephalomyopathies.
O∗
O-
H3CO
RH3CO
O
O
H3CO
RH3CO
O2-
O2
2H+
O∗
O-
H3CO
RH3CO
OH
OH
H3CO
RH3CO
O
O
H3CO
RH3CO
O2-
O2
NADH
NAD
R = (CH2CHC(CH3)CH2)10
Figure 1.11 Role of coenzyme Q10 in respiratory chain.
In recent years, benzoquinone-based inhibitors of NQO1 have been developed for cancer
treatment, favored by the high concentration of this enzyme in some types of cancer as well as
24
the hypoxic conditions of the solid tumors.80, 83 Mitomycin C (Figure 12.A) is a classical NQO1
inhibitor and has been used as chemotherapeutic agent for a variety of cancers including head,
neck, breast and prostate. However, its lack of specificity for cancer cells accompanied by strong
and uncontrollable side effects limit the benefits of this drug. Alternatively, a better NQO1
substrate with reduced side effects, EOquin (Figure 12.B) is currently used for treatment of
superficial bladder cancer. Another class of benzoquinone anticancer drugs is represented by
benzoquinone ansamycins (Figure 12.C). They are cyclic compounds that bind to heat shock
protein 90, one of the most abundant chaperone proteins that is overexpressed in cancer cells.84
Numerous clinical trials involve therapy with two benzoquinone ansamycins: 17-allylamino-17-
demethoxygeldanamycin (17-AAG) and 17-dimethylaminoethylamino-17-demethoxy-
geldanamycin (17-DAAG). They are used either alone or in combination with other anticancer
drugs for the treatment of advanced solid tumors, metastatic renal carcinoma and chemotherapy
refractory breast cancer.85
Natural alkylated and cyclic benzoquinones found in plant extracts presented cytotoxic
effects against various cancer cell lines.86, 87 Thymoquinone (Figure 12.D) is the major
constituent of Nigella sativa black seed oil, a medicinal plant from the Ranunculaceae family,
which has been used for centuries in Africa, Europe, and Asia for treatment of many diseases
including inflammation, asthma, hypertension, and gastrointestinal conditions. 88 Nigella sativa
black seed oil as well as its major constituent, thymoquinone, display antioxidant properties by
acting as free radical scavengers. 89, 90 Thymoquinone exhibits a protective antioxidant effect
against the severe side effects caused by doxorubicin, an anticancer drug, that can generate
congestive heart failure after chemotherapy.91, 92 Furthermore, thymoquinone is an emerging
anticancer drug, showing cytotoxic activities for a series of cancer cell lines including colorectal,
ovarian, leukemia, and breast cells. 93-95

25
Figure 1.12 Benzoquinone – based anticancer drugs.
1.4.3 Antioxidant Delivery
Despite their great antioxidant and anticancer activities, many antioxidants are not
soluble in aqueous media. Their administration is limited by low dose concentrations, use of
organic solvents, and reduced bioavailability. On the other side, their stability, specificity,
metabolism and clearance are factors to consider after administration. In recent years, controlled
delivery of antioxidants has allowed a new approach for cancer therapy, cardiovascular diseases,

26
neurodegenerative diseases, and ageing. 96-99 Novel antioxidant-loaded drug delivery systems
such as polymeric nanoparticles have been identified as alternatives that should provide long-
term delivery, prevent antioxidant degradation, and increase pharmaceutical activity of such
antioxidants.97, 99
Several studies have reported nanoparticle-based drug delivery systems for controlled
delivery of antioxidants, including nanoparticles for delivery of the flavonoids such as quercetin,
and natural antioxidant ellagic-acid.100-103 Other nanoparticles were designed for the delivery of
coenzyme Q10that improved stability and cellular uptake.104-106 In other studies,
“nanocurcumin” was prepared using polymeric nanoparticles for controlled delivery of natural
curcumin, with improved solubility and anticancer properties of curcumin.107, 108
1.5 Free Radicals
1.5.1 Oxidative Stress and Free Radicals
The production of energy by aerobic organisms takes place by the oxidation of biological
substrates in the presence of oxygen. The complete oxygen reduction occurs in mitochondria and
involves a series of radical intermediates such as superoxide anion radical (•O2-), hydroxyl
radical (HO•), 1O2 (singlet oxygen) and non radical species, such as hydrogen peroxide (H2O2),
as shown in Figure 1.13.66
Figure 1.13 Generation of reactive oxygen species.
O2 •O2
-
e-
e-
H
H
H2O2
e-
H
HO•
H2O
e-
H2O
OXIDASE
A AH
SOD Cu/Fe
R•
RH
1O2
27
These species are collectively named as reactive oxygen species (ROS). Other species
including reactive nitrogen species and chlorous radicals participate in oxidation reactions as
well. Although such reactions are well controlled, sometimes incomplete substrate oxidation and
partial oxygen reduction occur and lead to an excess of free radicals. Such excess is typically
counterbalanced by antioxidants able to react with ROS and inactivate them.
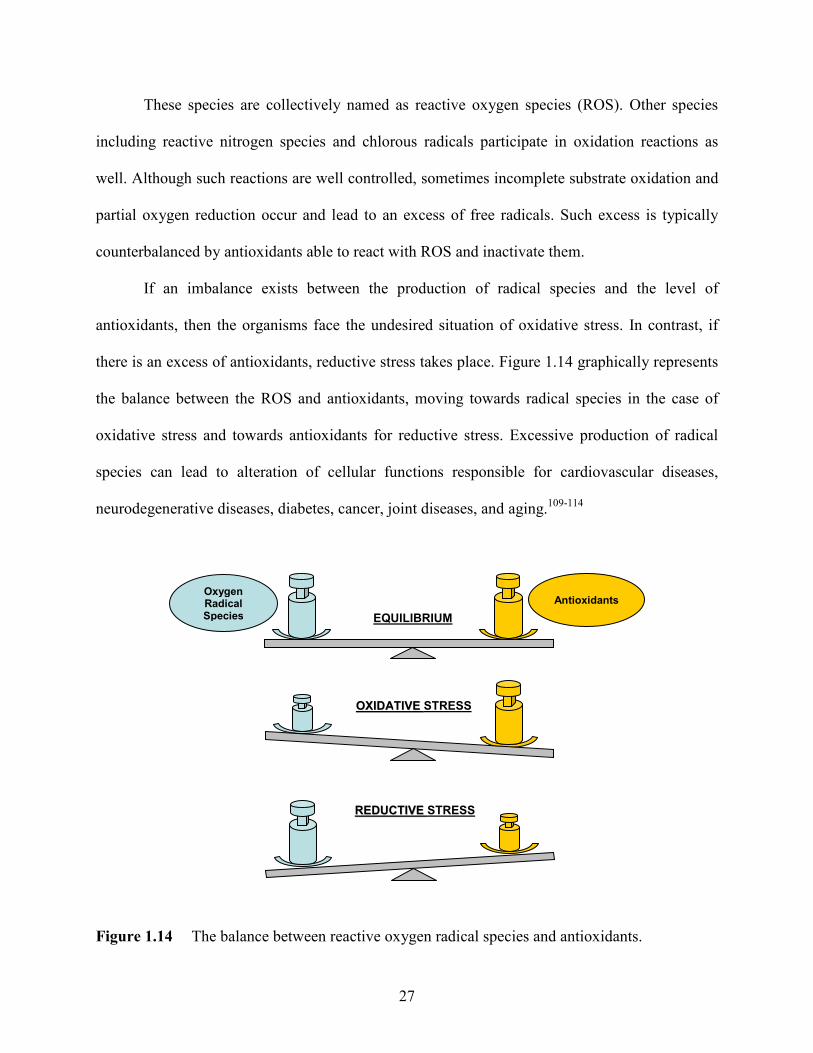
If an imbalance exists between the production of radical species and the level of
antioxidants, then the organisms face the undesired situation of oxidative stress. In contrast, if
there is an excess of antioxidants, reductive stress takes place. Figure 1.14 graphically represents
the balance between the ROS and antioxidants, moving towards radical species in the case of
oxidative stress and towards antioxidants for reductive stress. Excessive production of radical
species can lead to alteration of cellular functions responsible for cardiovascular diseases,
neurodegenerative diseases, diabetes, cancer, joint diseases, and aging.109-114
Figure 1.14 The balance between reactive oxygen radical species and antioxidants.
Oxygen Radical Species
Antioxidants
EQUILIBRIUM
OOXXIIDDAATTIIVVEE STRESS
RREEDDUUCCTTIIVVEE STRESS

28
In comparison with other radicals, hydroxyl radical is particularly dangerous. It can be
produced at cellular levels by Fenton and Habber-Weiss reactions of hydrogen peroxide with
transition metals such as iron and copper (1.10 and 1.11).67, 113
•−++ ++→+ OHHOFeFeOH 3222 1.10
•−++ ++→+ OHHOCuCuOH 222 1.11
The hydroxyl radical has a short half-life, and is considered the most aggressive free
radical, mainly due to its high reactivity. It is able to react with lipids, amino acids, proteins,
DNA, and sugars at extremely high rates, leading to cell damage and even cell death.115 Other
sources such as ozone and ionization radiation lead to hydroxyl radical generation as well.
1.5.2 Methods for Free Radical Detection
Numerous methods have been developed for oxidative stress detection, and are
summarized in Figure 1.15. They are focused on the identification and quantification of the
oxidative stress biomarkers, the determination of antioxidant activity, as well as direct or indirect
detection of radicals.67, 109 Biomarkers are a good indication of oxidative stress, although they are
disease specific. Many of them require long and cumbersome procedures for the exact
assessment of oxidative stress levels, especially in the early stages of a disease. Methods for
antioxidant quantification are based on scavenging ability of an antioxidant and enzymatic
activity of enzymes involved in the respiratory chain, i.e. SOD, catalase, peroxidases.
Reactive oxygen species can be directly detected by Electron Paramagnetic Resonance
(EPR) spectroscopy, based on their electron transfer to nitroso compounds that are stable
paramagnetic adducts. Although highly sensitive, EPR is limited by the stability of adducts and
instrumentation accessibility. Alternatively, fluorescence spectroscopy is a highly sensitive
method used for the detection of reactive oxygen species (ROS). In the literature, fluorescent
dyes have been given extensive attention for ROS indirect detection.116-118

29
Evaluation ofspecific antioxidants
Evaluation ofantioxidant enzymes
Methodologies for
Oxidative Stress Determination
Quantification ofRadicals
Quantification ofBiological Markers
Quantification ofAntioxidants
Direct approach Indirect approach
Electron Paramagnetic Resonance
Spectroscopic
Methods
Genetics Protein interactions
Figure 1.15 Methods of detection for oxidative stress.
1.5.3 Free Radical Fluorescent Sensors
Compared to other methods, fluorescence sensors are promising tools providing several
advantages such as high specificity, localized information at the target site, spectral and
microscopical detection. A list of common fluorescent probes and the radicals they react with is
presented in Table 1.2. Several dihydro-probes, including 2’7’-dichlorodihydro-fluorescein,
dihydro-rhodamine and dihydro-calcein are used for total ROS determination, mainly because
they are not specific for a particular radical.119
Other more specific fluorophores such as hydroethidine were used for the detection of
superoxide anion radical. Hydroxyl radical can be detected by hydroxylation reaction of aromatic
compounds. Specifically, coumarin 3-carboxylic acid (C3C) has been used as fluorescent sensor
for detection of hydroxyl radical. This probe reacts with hydroxyl radical and undergoes
hydroxylation at position C7 of the coumarin structure, producing a highly fluorescent

30
compound, 7-hydroxy coumarin 3-carboxylic acid.120-122 Because C3C has an available
carboxylic group in the C3 position, it can be easily coupled with other groups via peptide bond
synthesis. Therefore, other coumarin derivatives such as the succinimidyl ester of C3C,
phospholipid liked coumarins, and C3C – derivatized amino acids and peptides were used for the
detection of hydroxyl radicals.123-125
Table 1.2 Free radical fluorescent sensors
Fluorophore •O2
-
1O2 OH
• H2O2
Hydroethidine √
1,3-Diphenylisobenzofuran √ √
Homovanillic acid √
2,7-Dichlorodihydrofluorescein diacetate √ √
Dihydrorhodamine 123 √
N-Acetyl-3,7-dihydroxyphenoxazine √
9,10-Dimethylanthracene √
2-[6-(4V-amino)phenoxy-3H-xanthen-3-on-9-yl] benzoic acid √
Coumarin-3-carboxylic acid √
Although fluorescent probes can be used to detect hydroxyl radicals, several limitations
should be taken into consideration. For example, the changes in the fluorescence intensity of a
single fluorophore that reacts with a specific radical can be affected by variations in radical and
probe concentrations, instrumental artifacts and environmental factors such as temperature and
pH. In addition, in vitro imaging becomes challenging if the probe reacts with molecules present
in the cellular media, photobleaches or generates other secondary radicals.126 A novel approach
for detection of hydroxyl radicals is the use of fluorescence ratiometric detection that likely
eliminates such limitations. In this case, the intensity ratio of two probes is directly proportional

31
with analyte concentration independently of aforementioned factors. Such ratiometric fluorescent
sensors were reported for the detection of hydrogen peroxide and hydroxyl radicals using
coumarin-coupled dyes.127, 128 An alternative approach is the use of ratiometric nanoparticles. In
Chapter 4 of this dissertation, ratiometric PLGA nanoparticles were used for the detection of
hydroxyl radicals. The reporting signal is given by a coumarin-functionalized molecular micelle
while the reference signal is given by neutral red loaded nanoparticles.
1.6 Chemometrics and Optimization Design
Chemometrics is a relatively new discipline developed only 30-35 years ago along with
the advances in computing, fast data collection and the increasing importance of analytical data
in industry. Chemometrics simply refers to analysis and interpretation of instrumental data. For
examples, the optimum conditions of a chemical reaction are found by analyzing the effects of
reagent concentrations and environmental reaction conditions on the yield of products. In
chromatographic separation of various pharmaceuticals pattern recognition defines groups of
compounds from the same origin. In addition, chemometric approaches facilitate the
spectroscopic quantification of reagents and products of a chemical reaction or the components
of a complex biological sample.
It is always advantageous to plan and design experiments ahead of time. Using this
approach, four major components of experimental design can be defined as follows:129
1) Screening. A large number of parameters such as concentration of reagents,
temperature, and pH can be investigated in order to identify the most important ones.
2) Optimization. The truly optimum conditions of a chemical process can be found. For
example, the highest yield of a reaction was found 80 % for a temperature of 20 ºC, at
a pH of 7. However, applying an optimization design, the reaction yield was found 95
% at a temperature of 30 ºC and a pH of 6.

32
3) Time saving. As an expansion of small scale screening and optimization, time saving
becomes important on an industrial scale where the relationships between structures
and measured properties must be quantified in real time.
4) Quantitative modeling. Based on collected experimental data and chemometric
analysis, models can be developed and predict future experiments.
In the process of experimental design, one establishes factors – the input controllable
parameters – such as pH, temperature, and concentration, and measures the responses – the
output parameters – such as yield, resolution, efficiency. These factors can be investigated at
different levels denoted negative for the lowest, zero for the middle and positive for the
highest.130 The response can be described in a simple case by equation 1.12 where it strictly
depends on one factor and defined as single linear regression. In case of multiple interactions, the
response can be described by a multi-linear regression given by equation 1.13.
bxby += 0 1.12
nn xbxbxbby ++++= ...22110 1.13
where y is the response; xn are the factors; b0 is the intercept; and bn are the coefficients that
indicate the extent of x-y dependency. the goal of an experimental design being to find the
coefficients b and a matrix D containing all factors and responses. In addition, a model is defined
based on the experimental data and it is able to predict the response as a function of investigated
factors.
There are several optimization experimental designs commonly used by chemists. They
are graphically represented in Figure 1.16. Factorial design is the simplest design and usually
used for screening in order to find the main factors that affect the response. A more
comprehensive optimization design is the central composite design. This design includes a
factorial design and a star design that allows the investigation of both linear and quadratic

33
factors. Another useful design is represented by Box-Behnken design in which the levels of the
investigated factors are central as compared to positive and negative levels used by the other
designs. This allows for a reduced number of experiments, consequently reducing the time, but
maintaining the benefits of an experimental design. Both central composite and Box-Behnken
designs include central samples for reproducibility purposes, where all factors are set at level
zero.
Figure 1.16 Types of optimization designs.
In nanoparticle synthesis, optimization experimental design is an extremely useful
tool.131-135 In many nanoparticle formulations, factors such as polymer concentration, drug
concentration, solvent ratio, emulsifier type and concentration as well as drug properties and
concentration added to the formulation contribute significantly to the properties of nanoparticles.
Factorial Design
Central Composite Design
Box-Behnken Design
34
Therefore, it is important to strictly control such factors in order to obtain the desired particle
size, polydispersity, and drug entrapment efficiency.
1.7 Scope of Dissertation
Polymeric nanoparticles are useful tools in drug delivery and nanomedicine. In particular,
polymeric nanoparticles modified with various molecular micelles offer advantages in terms of
particle size and polydispersity control, as well as properties related to biological and analytical
purposes. A general description of nanoparticle synthesis and characterization methods is
presented in the first chapter of this dissertation. In addition, the roles of antioxidants and free
radicals in nutrition and disease prevention are described. The use of polymeric nanoparticles for
delivery of antioxidants as well as the detection methods for free radicals are introduced in
Chapter 1 as well.
In the second chapter of this dissertation, a chemometric central composite experimental
design (CCD) was used to optimize the synthesis of poly (D,L lactide-co-glycolide) (PLGA)
nanoparticles by emulsification solvent evaporation using anionic molecular micelles, such as
poly (sodium N-undecenyl sulfate) (poly-SUS), poly (sodium N-undecenyl-glycinate) (poly-
SUG) and poly (sodium N-undecenyl-L-leucyl-valinate) (poly-L-SULV) as well as conventional
emulsifiers, such as anionic sodium dodecyl sulfate (SDS) and non-ionic poly (vinyl alcohol)
(PVA). The individual and combined effects of PLGA concentration, emulsifier concentration,
homogenization speed, and sonication time (design variables) on particle size and polydispersity
index (responses) were investigated using multivariate analysis. A quadratic model was used to
predict the properties of molecular micelle - modified PLGA nanoparticles demonstrating the
advantage of using optimization design in the synthesis of polymeric nanoparticles.
Molecular micelle – modified PLGA nanoparticles were used for the delivery of
thymoquinone, an antioxidant and anticancer drug. In the third chapter of this dissertation,

35
anionic amino acid - based molecular micelles were used as emulsifiers in the synthesis of
thymoquinone (TQ) – loaded PLGA nanoparticles by use of an emulsification solvent
evaporation method. The optimum TQ entrapment efficiency was found for poly-SUG –
modified PLGA nanoparticles using a Box-Behnken experimental design. In addition, other
structurally related molecular micelles having various amino acid head groups and different
hydrophobic carbon chain lengths were also examined as emulsifiers. Furthermore, other
properties of TQ-loaded nanoparticles were investigated, including drug release, total antioxidant
activity, and cytotoxicity against breast normal and cancer cells.
Molecular micelle – modified polymeric nanoparticles can be used not only for delivery
of antioxidants, but as analytical nanosensors for detection of free radicals. In Chapter 4 of this
dissertation, neutral red (NeR) loaded PLGA nanoparticles were synthesized by emulsification
solvent evaporation using molecular micelles such as poly (sodium N-undecenyl-Nε-lysinate)
(poly-Nε-SUK) functionalized with coumarin 3-carboxylic acid (C3C) as emulsifier. Such
nanoparticles were able to detect hydroxyl radicals based on a ratiometric fluorescence
detection scheme. The product of the reaction between the coumarin functionalized molecular
micelle and hydroxyl radicals, 7-hydroxy coumarin 3-carboxylic acid (7-OH C3C) represented
the reporting dye, while NeR was the reference dye. C3C-poly-Nε-SUK – modified NeR-loaded
nanoparticles were able to detect hydroxyl radicals in simulated samples as well as biological
samples exposed to oxidative stress.
The research presented in this dissertation demonstrates the utility of molecular micelles
in nanoparticle synthesis, their versatility that conferred tunable properties for drug loaded
nanoparticles, and their ability to offer functional groups for analytical purposes. Molecular
micelle – modified nanoparticles are not only an example of drug delivery systems, but
nanosensors that can be used for detection of various molecules.

36
1.8 References
1 Moghimi, S. M.; Hunter, A. C.; Murray, J. C. Faseb Journal 2005, 19, 311-330.
2 Greenfield, S. A. Trends in Biotechnology 2005, 23, 34-41.
3 Hornyak, G. L.; Dutta, J.; Tibbals, H. F.; Rao, A. K. Introduction to nanoscience 2008, Taylor & Francis Group, Boca Raton, Florida, 3-58.
4 Hornyak, G. L.; Moore, J. J.; Tibbals, H. F.; Dutta, J. Fundamentals of nanotechnology 2008, Taylor & Francis Group, Boca Raton, Florida, 3-52.
5 Roco, M. C. Environmental Science & Technology 2005, A106-A112.
6 Roco, M. C.; Bainbridge, W. S. Journal of Nanoparticle Research 2002, 4, 281-295.
7 Roco, M. C.; Bainbridge, W. S. Journal of Nanoparticle Research 2005, 7, 1-13.
8 Goddard III, W. A.; Brenner, D. W.; Lyshevski, S. E.; Iafrate, G. J. 2003, CRC Press, Boca Raton, Florida, 1-1 - 1-9.
9 Devreese, J. T. MRS Bulletin 2007, 32, 718-724.
10 Madia, W. J.; Pearson, E. W. Metallurgical and Materials Transactions B-Process
Metallurgy and Materials Processing Science 2006, 37, 683-696.
11 Li, X.; Hu, D.; Dang, Y.; Chen, H.; Roco, M. C.; Larson, C. A.; Chan, J. Journal of Nanoparticle Research 2009, 11, 529-552.
12 Roco, M. C. Current Opinion in Biotechnology 2003, 14, 337-346.
13 The National Nanotechnology Initiative Supplement to the President's 2010 Budget 2009, www.nano.gov.
14 Hullman, A. European Comission 2008, http://cordis.europa.eu/nanotechnology.
15 Ebbesen, M.; Jensen, T. G. Journal of Biomedicine and Biotechnology 2006, 1-11.
16 Park, K.; Mrsny, R. J. Controlled drug delivery: present and future 2000, 752, ACS Symposium Series, 2-12.
17 Svenson, S. Carrier-Based Drug Delivery 2002, 879, ACS Symposium Series, 2-23.
18 Hans, M. L.; Lowman, A. M. Current Opinion in Solid State and Materials Science 2002, 6, 319-327.
19 Broz, P.; Hunziker, P. Nanomaterials for Medical Diagnosis and Therapy 2007, Wiley-VCH Verlag GmbH, Germany, 189-254.
20 Khademhosseini, A.; Langer, R. Nanobiotechnology, SBE Special Edition 2006, 38-41.
37
21 Ha, C. S.; Gardella, J. A. Chemical Reviews 2005, 105, 4205-4232.
22 Ju, X. J.; Xie, R.; Yang, L. H.; Chu, L. Y. Expert Opinion on Therapeutic Patents 2009, 19, 683-696.
23 Torchilin, V. P. Advanced Drug Delivery Reviews 2006, 58, 1532-1555.
24 Kayser, O.; Lemke, A.; Hernandez-Trejo, N. Current Pharmaceutical Biotechnology 2005, 6, 3-5.
25 Vogelson, C. T. Modern Drug Discovery 2001, 4, 49-52.
26 Anderson, J. M.; Shive, M. S. Advanced Drug Delivery Reviews 1997, 28, 5-24.
27 Bala, I.; Hariharan, S.; Kumar, M. N. V. R. Critical Reviews in Therapeutic Drug Carrier Systems 2004, 21, 387-422.
28 Riehemann, K.; Schneider, S. W.; Luger, T. A.; Godin, B.; Ferrari, M.; Fuchs, H. Angewandte Chemie-International Edition 2009, 48, 872-897.
29 Haley, B.; Frenkel, E. Urologic Oncology-Seminars and Original Investigations 2008, 26, 57-64.
30 Allemann, E.; Gurny, R.; Doelker, E. European Journal of Pharmaceutics and Biopharmaceutics 1993, 39, 173-191.
31 Kumar, M. N. V. R. Journal of Pharmacy & Pharmaceutical Sciences 2000, 3, 234-258.
32 Shikanov, A.; Kumar, N.; Domb, A. J. Israel Journal of Chemistry 2005, 45, 393-399.
33 Brannon-Pepas, L.; Blanchette, J. O. Advanced Drug Delivery Reviews 2004, 56, 1649-1659.
34 Brigger, I.; Dubernet, C.; Couvreur, P. Advanced Drug Delivery Reviews 2002, 54, 631-651.
35 Panyam, J.; Labhasetwar, V. Advanced Drug Delivery Reviews 2003, 55, 329-347.
36 Delie, F.; Blanco-Prieto, M. J. Molecules 2005, 10, 65-80.
37 Moinard-Checot, D.; Chevalier, Y.; Briancon, S.; Fessi, H.; Guinebretiere, S. Journal of Nanoscience and Nanotechnology 2006, 6, 2664-2681.
38 Quintanar-Guerrero, D.; Alleman, E.; Fessi, H.; Doelker, E. Drug Develoment and Industrial Pharmacy 1998, 24, 1113-1128.
39 Astete, C. E.; Sabliov, C. M. Journal of Biomaterials Science, Polymer Edition 2006, 17, 247-289.

38
40 Song, C. X.; Labhasetwar, V.; Murphy, H.; Qu, X.; Humphrey, W. R.; Shebuski, R. J.; Levy, R. J. Journal of Controlled Release 1997, 43, 197-212.
41 Birnbaum, D. T.; Kosmala, J. D.; Brannon-Pepas, L. Journal of Nanoparticle Research 2000, 2, 173-181.
42 Mu, L.; Feng, S.-S. Pharmaceutical Research 2003, 20, 1864-1872.
43 Kumar, M. N. V. R.; Bakowsky, U.; Lehr, C. M. Biomaterials 2004, 25, 1771-1777.
44 Panyam, J.; Williams, D.; Dash, A.; Leslie-Pelecky, D.; Labhasetwar, V. Journal of Pharmaceutical Sciences 2004, 93, 1804-1814.
45 Win, K. Y.; Feng, S.-S. Biomaterials 2006, 27, 2285-2291.
46 Bilati, U.; Alleman, E.; Doelker, E. Journal of Microencapsulation 2005, 22, 205-214.
47 Jiao, Y. Y.; Ubrich, N.; Marchand-Arvier, M.; Vigneron, C.; Hoffman, M.; Maincent, P. Drug Delivery 2001, 8, 135-141.
48 Santhakumaran, L. M.; Chen, A.; Pillai, T. T.; He, H.; Thomas, T. J. Nanofabrication towards biomedical applications 2005, Wiley-VCH Verlag GmbH, Germany, 253-287.
49 Birdi, K. S. CRC Press, Boca Raton, FL 2009, 3rd edition, 340-350.
50 Malvern-Instruments Mano317 2005, 14-11 - 14-18.
51 Schmitz, K. S. Academic Press, San Diego, CA 1990, 321-327.
52 Goodhew, P. J.; Humphreys, J.; Beanland, R. Electron Microscopy and Analysis 2001, 3rd edition, Taylor & Francis Group, New York, 66-121.
53 Panyam, J.; Sahoo, S. K.; Prabha, S.; Bargar, T.; Labhasetwar, V. International Journal of Pharmaceutics 2003, 262, 1-11.
54 Jeong, Y.-I.; Choi, K.-C.; Song, C.-E. Archives of Pharmaceutical Research 2006, 29, 712-719.
55 Kang, S. I.; Na, K.; Bae, Y. H. Colloids and Surfaces, A: Physicochemical and Engineering Aspects 2003, 231, 103-112.
56 Skoog, D. A.; Holler, F. G.; Nieman, T. A. Principles of instrumental analysis 1998, Thomson Learning, Inc. 5th edition 300-328; 538-543; 725-767.
57 Choi, M. S.; Park, E. S.; Chi, S. C.; Shin, B. C. Journal of Korean Pharmaceutical Sciences 2004, 34, 177-183.
58 Zhang, Z. P.; Feng, S. S. Biomacromolecules 2006, 7, 1139-1146.
59 Mu, L.; Feng, S. S. Pharmaceutical Research 2003, 20, 1864-1872.

39
60 Hariharan, S.; Bhardwaj, V.; Bala, I.; Sitterberg, J.; Bakowsky, U.; Ravi Kumar, M. N. V. Pharmaceutical Research 2006, 23, 184-195.
61 Win, K. Y.; Feng, S.-S. Biomaterials 2005, 26, 2713-2722.
62 Shamsi, S. A.; Palmer C.P.; Warner, I. M. Analytical Chemistry 2001, 73, 140A-149A.
63 Haddadian, F.; Shamsi, S. A.; Warner, I. M. Electrophoresis 1999, 20, 3011-3026.
64 Kapnissi-Christodoulou, C. P.; Zhu, X.; Warner, I. M. Electrophoresis 2003, 24, 3917-3934.
65 Sahoo, S. K.; Panyam, J.; Prabha, S.; Labhasetwar, V. Journal of Controlled Release 2002, 82, 105-114.
66 Sorg, O. Comptes Rendus Biologies 2004, 327, 649-662.
67 Kohen, R.; Nyska, A. Toxicologic Pathology 2002, 30, 620-650.
68 Pokorny, J.; Yanishlieva, N.; Gordon, M. Antioxidants in food 2001, CRC Press LLC, Boca Raton, Forida, 87-249.
69 Food and Drug Administration Federal Register Final Rule - 62 FR 49868 1997, 62, 49868-49881.
70 Milbury, P. E.; Richer, A. C. Understanding the antioxidant controversy: scrutinizing the "fountain of youth" 2008, Praeger Publishers, Westport, Connecticut, 1-14.
71 Bland, J. S. Alternative Therapies 1996, 2, 73-76.
72 Zhou, B.; Liu, Z.-L. Pure Applied Chemistry 2005, 77, 1887-1903.
73 Guarrera, P. M. Fitoterapia 2003, 74, 515-544.
74 Pal, S. K. Current Science 2002, 82, 518-524.
75 Helton, L. R. J Cult Divers 1996, 3, 123-128.
76 Darshan, S.; Doreswamy, R. Phytotherapy Research 2004, 18, 343-357.
77 Borek, C. Integrative cancer therapies 2004, 3, 333-341.
78 Garewal, H. S. Antioxidants and disease prevention 1997, CRC Press LLC, Boca Raton, Florida, 3-177.
79 Trumpower, B. L. Journal of Bioenergetics and Biomembranes 1981, 13, 1-24.
80 Gutierrez, P. L. Frontiers in Bioscience 2000, 5, 629-638.
81 Horvath, R.; Gorman, G.; Chinnery, P. F. Neurotherapeutics 2008, 5, 558-568.

40
82 Quinzii, C. M.; Lopez, L. C.; Naini, A.; DiMauro, S.; Hirano, A. Biofactors 2008, 32, 113-118.
83 Alcain, F. J.; Villalba, J. M. Expert Opinion on Therapeutic Patents 2007, 17, 649-665.
84 Snader, K. M. Anticancer agents from natural products 2005, CRC Press Boca Raton, Florida, 339-356.
85 Neckers, L.; Neckers, K. Expert Opin Emerg Drugs 2005, 10, 137-149.
86 Dettrakul, S.; Surerum, S.; Rajviroongit, S.; Kittakoop, P. Journal of Natural Products 2009, 72, 861-865.
87 Muhammad, I.; Takamatsu, S.; Walker, L. A.; Mossa, J. S.; Fong, H. H. S.; El-Feraly, F. S. Phytotherapy Research 2003, 17, 887-891.
88 Salem, M. L. International Immunopharmacology 2005, 5, 1749-1770.
89 Badary, O. A.; Taha, R. A.; El-Din, A. M. G.; Abdel-Wahab, M. H. Drug and Chemical Toxicology 2003, 26, 87-98.
90 Burits, M.; Bucar, F. Phytotherapy Research 2000, 14, 323-328.
91 Badary, O. A.; Abdel-Naim, A. B.; Adel-Wahab, M. H.; Hamada, F. M. A. Toxicology 2000, 143, 219-226.
92 Nagi, M. N.; Mansour, M. A. Pharmacological Research 2000, 41, 283-289.
93 Gali-Muhtasib, H.; Roessner, A.; Schneider-Stock, R. International Journal of
Biochemistry & Cell Biology 2006, 38, 1249-1253.
94 Shoieb, A. M.; Elgayyar, M.; Dudrick, P. S.; Bell, J. L.; Tithof, P. K. International Journal of Oncology 2003, 22, 107-113.
95 Gali-Muhtasib, H.; Diab-Assaf, M.; Boltze, C.; Al-Hmaira, J.; Hartig, R.; Roessner, A.; Schneider-Stock, R. International Journal of Oncology 2004, 25, 857-866.
96 Sheu, S. S.; Nauduri, D.; Anders, M. W. Biochimica Et Biophysica Acta-Molecular Basis
of Disease 2006, 1762, 256-265.
97 Kaur, I. P.; Kapila, M.; Agrawal, R. Ageing Research Reviews 2007, 6, 271-288.
98 Ratnam, D. V.; Ankola, D. D.; Bhardwaj, V.; Sahana, D. K.; Kumar, M. Journal of Controlled Release 2006, 113, 189-207.
99 Dziubla, T.; Muro, S.; Muzykantov, V. R.; Koval, M. Oxidative Stress, Disease and Cancer 2006, 1023-1043.
100 Wu, T. H.; Yen, F. L.; Lin, L. T.; Tsai, T. R.; Lin, C. C.; Cham, T. M. International Journal of Pharmaceutics 2008, 346, 160-168.

41
101 Zhang, Y.; Yang, Y.; Tang, K.; Hu, X.; Zou, G. Journal of Applied Polymer Science 2008, 107, 891-897.
102 Bala, I.; Bhardwaj, V.; Hariharan, S.; Sitterberg, J.; Bakowsky, U.; Kumar, M. Nanotechnology 2005, 16, 2819-2822.
103 Bala, I.; Bhardwaj, V.; Hariharan, S.; Kharade, S. V.; Roy, N.; Kumar, M. N. V. R. Journal of Drug Targeting 2006, 14, 27-34.
104 Ankola, D. D.; Viswanad, B.; Bhardwaj, V.; Ramarao, P.; Ravi Kumar, M. N. V. European Journal of Pharmaceutics and Biopharmaceutics 2007, 67, 361-369.
105 Hsu, C.-H., Coenzyme Q10 nanoparticles engineered from microemulsion precursors for oral delivery, 2004.
106 Nehilla, B. J.; Bergkvist, M.; Popat, K. C.; Desai, T. A. International Journal of Pharmaceutics 2008, 348, 107-114.
107 Bisht, S.; Feldmann, G.; Soni, S.; Ravi, R.; Karikar, C.; Maitra, A.; Maitra, A. Journal of Nanobiotechnology 2007, 5:3.
108 Kurzrock, R.; Li, L.; Mehta, K.; Aggarwai, B. B.; Liposomal curcumin for treatment of cancer: WO/2004/080396, 2004, pp 66.
109 Dalle-Donne, I.; Rossi, R.; Colombo, R.; Giustarini, D.; Milzani, A. Clinical Chemistry (Washington, DC, United States) 2006, 52, 601-623.
110 Molavi, B.; Mehta Jawahar, L. Current opinion in cardiology 2004, 19, 488-493.
111 Passi, S.; Gianni, G.; Cocchi, M. Progress in Nutrition 2006, 8, 241-256.
112 Manea, A.; Constantinescu, E.; Popov, D.; Raicu, M. Journal of Cellular and Molecular
Medicine 2004, 8, 117-126.
113 Goetz, M. E.; Luch, A. Cancer Letters 2008, 266, 73-83.
114 Afonso, V.; Champy, R.; Mitrovic, D.; Collin, P.; Lomri, A. Joint, Bone, Spine 2007, 74, 324-329.
115 Halliwell, B.; Gutteridge, J. M. C. Free radicals in biology and medicine 1989, Oxford University Press, 2nd edition, 1-81.
116 Gomes, A.; Fernandes, E.; Lima, J. L. F. C. Journal of Biochemical and Biophysical Methods 2005, 65, 45-80.
117 Soh, N.; Imato, T. Current Bioactive Compounds 2006, 2, 409-430.
118 Soh, N. Analytical and Bioanalytical Chemistry 2006, 386, 532-543.
42
119 Keller, A.; Mohamed, A.; Droese, S.; Brandt, U.; Fleming, I.; Brandes, R. P. Free Radical Research 2004, 38, 1257-1267.
120 Manevich, Y.; Held, K. D.; Biaglow, J. E. Radiation Research 1997, 148, 580-591.
121 Martin-Aragon, S.; Benedi, J.; Villar, A. Phytotherapy Research 1996, 10, S75-S78.
122 Newton, G. L.; Milligan, J. R. Radiation Physics and Chemistry 2006, 75, 473-478.
123 Makrigiorgos, G. M.; Baranowska-Kortylewicz, J.; Bump, E.; Sahu, S. K.; Berman, R. M.; Kassis, A. I. International Journal of Radiation Biology 1993, 63, 445-458.
124 Soh, N.; Makihara, K.; Ariyoshi, T.; Seto, D.; Maki, T.; Nakajima, H.; Nakano, K.; Imato, T. Analytical Sciences 2008, 24, 293-296.
125 Ghosh, S. C.; Auzenne, E.; Farquhar, D.; Klostergaard, J. Bioconjugate Chemistry 2007, 731-735.
126 Bartosz, G. Clinica Chimica Acta 2006, 368, 53-76.
127 Albers, A. E.; Okreglak, V. S.; Chang, C. J. Journal of American Society 2006, 9640-9641.
128 Soh, N.; Makihara, K.; Sakoda, E.; Imato, T. Chemical Communications (Cambridge, United Kingdom) 2004, 496-497.
129 Brereton, R. G. Applied chemometrics for scientists 2007, John Wily & Sons, West Sussex, England, 1-62.
130 Otto, M. Chemometrics. Statistics and computer application in analytical chemistry 1999, Wiley-VCH GmbH, Germany, 81-116.
131 Prakobvaitayakit, M.; Nimmannit, U. AAPS PharmSciTech 2003, 4, 1-9.
132 Dillen, K.; Vandervoort, J.; Van den Mooter, G.; Verheyden, L.; Ludwig, A. International Journal of Pharmaceutics 2004, 275, 171-187.
133 Vandervoort, J.; Ludwig, A. International Journal of Pharmaceutics 2002, 238, 77-92.
134 Ganea, G. M.; Sabliov, C. M.; Ishola, A. O.; Fakayode, S. O.; Warner, I. M. Journal of Nanoscience and Nanotechnology 2008, 8, 280-292.
135 Duan, Y.; Sen, X.; Wang, Q.; Liu, J.; Zhang, Z. Journal of Materials Science: Materials
in Medicine 2006, 17, 559-563.

43
CHAPTER 2
EXPERIMENTAL DESIGN AND MULTIVARIATE ANALYSIS FOR OPTIMIZING
POLY (D,L-LACTIDE-CO-GLYCOLIDE) (PLGA) NANOPARTICLE SYNTHESIS
USING MOLECULAR MICELLES*
2.1 Introduction
Significant advances in the application of nanotechnology in the medical field have been
recently witnessed, particularly relevant to the improvements in pharmaceuticals’ bioavailability
and delivery. Controlled drug delivery systems offer an excellent alternative to the free drug
administration, providing a constant drug concentration in the bloodstream within the efficient
therapeutic range, for a prolonged period of time. The benefits of such systems include a reduced
number of doses, minimizing the undesirable side effects and adverse reactions, leading to
improved general comfort of the patient.1-3
Biodegradable polymeric nanoparticles are attractive drug delivery systems because of
their biocompatibility and degradation through normal metabolic pathways, the wide variety of
preparation methods, high encapsulation efficiency, and sustained drug release in time.
Numerous pharmaceutical compounds can be delivered via various routes by use of
nanoparticles. For example, the active agent can be entrapped in the polymeric matrix
(nanospheres), encapsulated into a nanocapsule structure, and adsorbed or chemically bound to
the nanoparticle surface.4-6
Using this variety of approaches, polymeric nanoparticles have been
extensively investigated as delivery systems in cancer therapy,7, 8
gene therapy,9 and protein
delivery.10 Poly (lactic acid), poly (glycolic acid) and their copolymer poly (lactide-co-glycolide)
(PLGA) are the most commonly used biocompatible and biodegradable polymers in the
preparation of nanoparticle drug carriers.11, 12
Various methods are available for polymeric
nanoparticle synthesis, including emulsification solvent diffusion, dialysis, salting-out, and
* Reproduced with permission from Journal of Nanoscience and Nanotechnology (Appendix V)

44
nanoprecipitation.13-15
Emulsification solvent evaporation is commonly used for the preparation
of polymeric nanoparticles, where either a single oil-in-water (O/W) emulsion is prepared for the
entrapment of hydrophobic active agents 16-21
or, a double water-in-oil-in-water (w/o/w)
emulsion is used for the encapsulation of water soluble active agents.22, 23
Nanoparticle synthesis is a challenging process involving many variables which affect the
nanoparticle physico-chemical properties relevant to the performance of polymeric nanoparticles
as drug delivery systems. For example, particle size, polydispersity, and surface charge are
critical characteristics for the biological applications of polymeric drug carriers.24, 25
Chemometric experimental design is an emerging field in nanoparticle synthesis which can be
employed for the evaluation of individual effects as well as combined effects of the preparation
variables on the nanoparticle characteristics. The influence of polymer concentration, emulsifier
type and concentration, phase ratio, and drug concentration is typically studied on particle size,
size distribution, surface properties, entrapment efficiency, and drug release properties.26-30
By
use of chemometric experimental design with a reduced number of experiments one can establish
the optimal conditions which lead to the desired characteristics of polymeric nanoparticles.
Central composite design is an excellent choice for nanoparticle synthesis in comparison to other
experimental design approaches, such as full or fractional factorial designs, because of its ability
to provide the linearity as well as the curvature of the responses as a function of the design
variables.27, 28
Many nanoparticle preparation methods involve the presence of an anionic, cationic, or
non-ionic emulsifier dissolved in the aqueous phase. The role of the emulsifier is typically to
stabilize the emulsion and consequently to reduce the particle size and improve the size
distribution. Poly (vinyl alcohol) (PVA) is one of the commonly used emulsifiers which leads to
the formation of nanoparticles with a small size.16, 23
However, the residual PVA attached to the

45
nanoparticle surface is difficult to remove and limits the nanoparticle cellular uptake and drug
controlled release properties 31. Sodium dodecyl sulfate (SDS) has also been used as an
emulsifier in nanoparticle synthesis, and often leads to small particle sizes. However, the stability
of nanoparticle suspension is affected after SDS removal, by the formation of aggregates which
are not able to re-suspend in an aqueous solution.17 In certain cases, the surfactant emulsifier is
efficient only at concentrations higher than the critical micelle concentration (CMC), which
limits the investigation of a wider range of concentrations.
Molecular micelles offer an advantageous alternative to conventional micelles, such as
SDS, because of their enhanced stability, rigidity, and controllable size32 Furthermore, molecular
micelles present a CMC value of zero, as determined by the covalently bound micellar core,
which eliminates the dynamic equilibrium between the monomers and the micelle. Thus, the
formation of monodispersed polymeric nanoparticles may be achievable at a low emulsifier
concentration, using molecular micelles. It should be noted that anionic molecular micelles such
as poly (sodium N-undecenyl sulfate) (poly-SUS), poly (sodium N-undecenyl-glycinate) (poly-
SUG) and poly (sodium N-undecenyl-L-leucyl-valinate) (poly-L-SULV) have been successfully
used as alternatives to conventional micelles for pseudostationary phases in chromatographic
separations.32-34
In this study, we report the use molecular micelles as potential emulsifiers in the
synthesis of polymeric nanoparticles.35 The first objective of the present study was to synthesize
PLGA nanoparticles using three molecular micelles (poly-SUS, poly-SUG and poly-L-SULV)
and two conventional emulsifiers (SDS and PVA) by use of the emulsification solvent
evaporation method. Secondly, an investigation of the effect of four formulation parameters
(design variables) on particle size and size distribution (responses) was performed using a central
composite experimental design (CCD) and multivariate analysis. The design variables used in
46
this study were PLGA concentration, emulsifier concentration, homogenization speed, and
sonication time. In addition, the experimental values of selected formulations for each emulsifier
were compared with the predicted values given by the model. Finally, the optimal experimental
conditions were selected based on CCD, in order to synthesize PLGA nanoparticles having the
minimum particle sizes and minimum PDI values. The optimal nanoparticle suspensions were
further purified by use of dialysis and then freeze-dried. The changes in their physico-chemical
properties such as particle size, polydispersity index (PDI), and zeta potential were monitored
before dialysis, after dialysis, and after freeze-drying. The morphology of the dried PLGA
nanoparticles prepared with molecular micelles as emulsifiers was investigated using
transmission electron microscopy (TEM).
2.2 Experimental
2.2.1 Materials
Poly (D,L-lactide-co-glycolide) (PLGA, lactide:glycolide 50:50, MW 40,000-75,000),
poly (vinyl alcohol) (PVA, average MW 9,000-10,000, 80 % hydrolyzed), sodium dodecyl
sulfate (SDS), undecylenic acid, ω-undecylenyl alcohol, glycine, ethyl acetate, hydrochloric
acid, chlorosulfonic acid, sodium carbonate, and sucrose were purchased from Sigma-Aldrich
(St. Louis, MO, USA). N-hydroxysuccinimide (NHS), N,N’-dicyclohexylcarbodiimide (DCC),
and pyridine were purchased from Fluka (Milwaukee, WI, USA). Isopropyl alcohol,
tetrahydrofuran, and ethyl ether were purchased from EMD Chemicals Inc. (Gibbstown, NJ,
USA). LL-leucyl-valinate was purchased from Bachem Bioscience Inc. (King of Prussia, PA,
USA). Sodium bicarbonate and sodium hydroxide were purchased from Fisher Scientific
(Pittsburgh, PA, USA). Butyl alcohol was purchased from Mallinckrodt (Hazelwood, MO,
USA). Doubly-distilled deionized water was obtained from an ELGA PURELAB Ultra water
polishing system (US Filter, Lowell, MA, USA).

47
2.2.2 Synthesis of Molecular Micelles
A sulfate based molecular micelle, poly (sodium N- undecenyl sulfate) (poly-SUS), was
prepared according to Bergstrom’s procedure 36, modified by Shamsi et al.
37 A general synthesis
scheme is presented in Appendix I. The micelles poly (sodium N- undecenyl-glycinate) (poly-
SUG) and poly (sodium N- undecenyl-L-leucyl-valinate) (poly-L-SULV) were synthesized
according to the procedure described by Macossay et al.38 The chemical structures of the
molecular micelles are presented in Figure 2.1.
2.2.3 Nanoparticle Synthesis
PLGA nanoparticles were synthesized by use of an emulsification solvent evaporation
method. Briefly, appropriate amounts of PLGA were dissolved in 2.5 mL ethyl acetate to form
an organic phase. The aqueous phase was prepared by dissolving various amounts of emulsifiers,
molecular micelles (poly-SUS, poly-SUG and poly-L-SULV) or conventional surfactants (SDS
and PVA), in 10 mL water. The organic phase was then added dropwise to the aqueous phase
under stirring conditions using a homogenizer (model 398, Biospec Products, Inc., Racine, WI,
USA) at different speeds, resulting in a single o/w emulsion. The emulsion droplets were further
reduced by sonication using a probe ultrasound processor (model VC750, Sonics and Materials
Inc., Newton, CT, USA), operating at an amplitude intensity of 30 %, for periods of time ranging
from 5 minutes to 20 minutes. The solvent was evaporated using a rotary evaporator
(Büchirotovapor R-200, Brinkmann Instruments, Inc., Westbury, NY, USA).
2.2.4 Central Composite Experimental Design and Multivariate Analysis
The effects of four design variables on particle size and size distribution were
simultaneously investigated using a central composite design (CCD). The design variables were
the PLGA concentration, stabilizer concentration, homogenization speed, and sonication time.

48
All other parameters were held constant. The CCD and resultant data analysis were performed
using Unscrambler 9.1.2 software (Camo, Corvallis, OR, USA, version 9.1.2)
HN
O
NH
O
n
CH2CH(CH3)2
O-Na+
O
(H3C)2HC
HN
O
O-Na+
O
n
OSO3-Na+
n
(A) (B) (C)
Figure 2.1 Chemical structure of investigated molecular micelles. (A) poly (sodium N-
undecenyl sulfate) (poly-SUS); (B) poly (sodium N- undecenyl-glycinate) (poly-
SUG); (C) poly (sodium N- undecenyl-leucyl-valinate) (poly-L-SULV).
The optimal experimental conditions necessary to synthesize PLGA nanoparticles having
the minimum particle sizes and minimum PDI values were determined by use of CCD for each
of the investigated emulsifiers. The levels of the investigated design variables are presented in
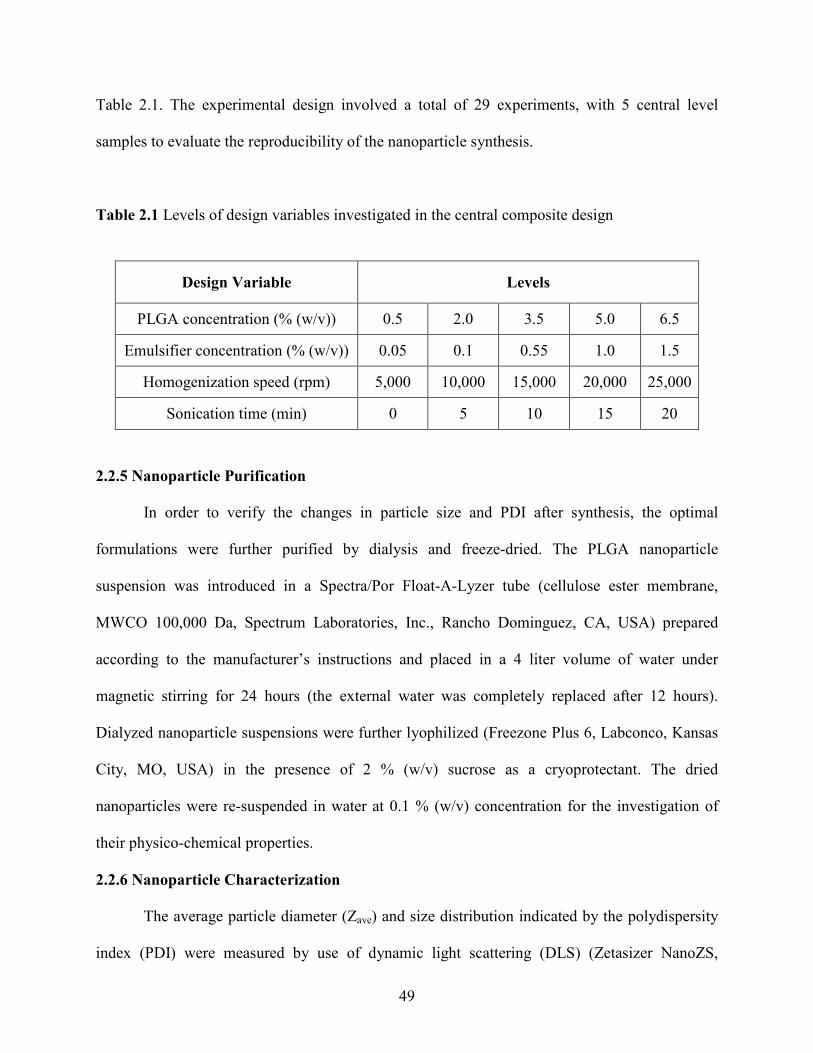
49
Table 2.1. The experimental design involved a total of 29 experiments, with 5 central level
samples to evaluate the reproducibility of the nanoparticle synthesis.
Table 2.1 Levels of design variables investigated in the central composite design
Design Variable Levels
PLGA concentration (% (w/v)) 0.5 2.0 3.5 5.0 6.5
Emulsifier concentration (% (w/v)) 0.05 0.1 0.55 1.0 1.5
Homogenization speed (rpm) 5,000 10,000 15,000 20,000 25,000
Sonication time (min) 0 5 10 15 20
2.2.5 Nanoparticle Purification
In order to verify the changes in particle size and PDI after synthesis, the optimal
formulations were further purified by dialysis and freeze-dried. The PLGA nanoparticle
suspension was introduced in a Spectra/Por Float-A-Lyzer tube (cellulose ester membrane,
MWCO 100,000 Da, Spectrum Laboratories, Inc., Rancho Dominguez, CA, USA) prepared
according to the manufacturer’s instructions and placed in a 4 liter volume of water under
magnetic stirring for 24 hours (the external water was completely replaced after 12 hours).
Dialyzed nanoparticle suspensions were further lyophilized (Freezone Plus 6, Labconco, Kansas
City, MO, USA) in the presence of 2 % (w/v) sucrose as a cryoprotectant. The dried
nanoparticles were re-suspended in water at 0.1 % (w/v) concentration for the investigation of
their physico-chemical properties.
2.2.6 Nanoparticle Characterization
The average particle diameter (Zave) and size distribution indicated by the polydispersity
index (PDI) were measured by use of dynamic light scattering (DLS) (Zetasizer NanoZS,

50
Malvern Instrumets Ltd., Malvern, UK) and reported as intensity distribution. For each
measurement, appropriate volumes of nanoparticle suspension were transferred into a disposable
polystyrene cuvet for particle size and PDI determinations. Nanoparticle surface charge indicated
by zeta potential was measured by use of laser doppler anemometry (Zetasizer NanoZS, Malvern
Instrumets Ltd., Malvern, UK) using a capillary cell. The reported values of particle size, PDI,
and zeta potential represent an average of 3 measurements performed at 25 ºC, for each batch of
nanoparticle suspensions. The nanoparticle morphologies were investigated using transmission
electron microscopy (TEM) (JEOL 100CX, JEOL USA Inc., Peabody, MA, USA) operating at
80kV. A drop of nanoparticle suspension was dried at room temperature on a carbon coated
copper grid and negatively stained with a 2 % uranyl acetate solution, to create a contrast image,
prior to imaging.
2.3 Results and Discussions
2.3.1 Optimization of Nanoparticle Synthesis
In the present study, PLGA nanoparticles were synthesized by use of an emulsification
solvent evaporation method using molecular micelles poly-SUS, poly-SUG and poly-L-SULV as
well as conventional emulsifiers (SDS and PVA). In aqueous solution, micelles self-assemble
into spherical shape structures having a hydrophobic core and a hydrophilic surface formed by
functional head groups. Polymerization of such species produces molecular micelles 32.
The proposed mechanism of nanoparticle synthesis using molecular micelles is
schematically represented in Figure 2.2. The PLGA polymer is first dissolved in an organic
phase. The water soluble molecular micelles contribute to the formation of dispersed organic
droplets containing PLGA, under homogenization and sonication conditions. After formation of
an emulsion, the organic solvent is evaporated and the PLGA nanoparticles are purified and
freeze-dried as previously described in the experimental section.

51
Figure 2.2 Proposed mechanism of PLGA nanoparticle formation by use of emulsification
solvent evaporation using molecular micelles as emulsifiers.
The results of nanoparticle synthesis using SDS, PVA, poly-SUS, poly-SUG and poly-L-
SULV under various experimental conditions are presented in Table 2.2. The experimental
conditions for all experiments used in central composite design are listed in Appendix II. A
multivariate analysis in the form of a multilinear regression (MLR) was used to correlate the
nanoparticle synthetic parameters (design variables) with the nanoparticle size and PDI
(responses). MLR was used for regression modeling since no colinearity was found between the
design variables used in this study. In addition, the number of design variables (4) was smaller
than the experimental runs (29).
PLGA dissolved in
organic solvent
Molecular micelles in
aqueous solution
Homogenization
Sonication
PLGA nanoparticles coated
with molecular micelles
+
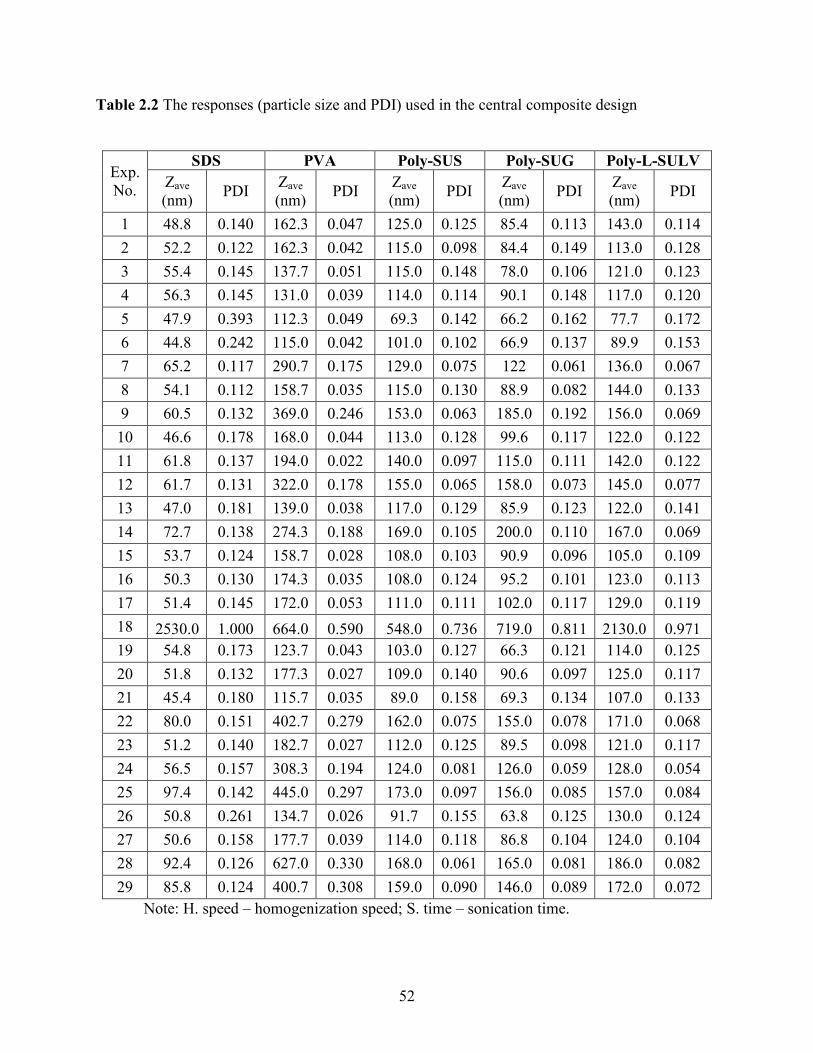
52
Table 2.2 The responses (particle size and PDI) used in the central composite design
SDS PVA Poly-SUS Poly-SUG Poly-L-SULV Exp.
No. Zave
(nm) PDI
Zave
(nm) PDI
Zave
(nm) PDI
Zave
(nm) PDI
Zave
(nm) PDI
1 48.8 0.140 162.3 0.047 125.0 0.125 85.4 0.113 143.0 0.114
2 52.2 0.122 162.3 0.042 115.0 0.098 84.4 0.149 113.0 0.128
3 55.4 0.145 137.7 0.051 115.0 0.148 78.0 0.106 121.0 0.123
4 56.3 0.145 131.0 0.039 114.0 0.114 90.1 0.148 117.0 0.120
5 47.9 0.393 112.3 0.049 69.3 0.142 66.2 0.162 77.7 0.172
6 44.8 0.242 115.0 0.042 101.0 0.102 66.9 0.137 89.9 0.153
7 65.2 0.117 290.7 0.175 129.0 0.075 122 0.061 136.0 0.067
8 54.1 0.112 158.7 0.035 115.0 0.130 88.9 0.082 144.0 0.133
9 60.5 0.132 369.0 0.246 153.0 0.063 185.0 0.192 156.0 0.069
10 46.6 0.178 168.0 0.044 113.0 0.128 99.6 0.117 122.0 0.122
11 61.8 0.137 194.0 0.022 140.0 0.097 115.0 0.111 142.0 0.122
12 61.7 0.131 322.0 0.178 155.0 0.065 158.0 0.073 145.0 0.077
13 47.0 0.181 139.0 0.038 117.0 0.129 85.9 0.123 122.0 0.141
14 72.7 0.138 274.3 0.188 169.0 0.105 200.0 0.110 167.0 0.069
15 53.7 0.124 158.7 0.028 108.0 0.103 90.9 0.096 105.0 0.109
16 50.3 0.130 174.3 0.035 108.0 0.124 95.2 0.101 123.0 0.113
17 51.4 0.145 172.0 0.053 111.0 0.111 102.0 0.117 129.0 0.119
18 2530.0 1.000 664.0 0.590 548.0 0.736 719.0 0.811 2130.0 0.971
19 54.8 0.173 123.7 0.043 103.0 0.127 66.3 0.121 114.0 0.125
20 51.8 0.132 177.3 0.027 109.0 0.140 90.6 0.097 125.0 0.117
21 45.4 0.180 115.7 0.035 89.0 0.158 69.3 0.134 107.0 0.133
22 80.0 0.151 402.7 0.279 162.0 0.075 155.0 0.078 171.0 0.068
23 51.2 0.140 182.7 0.027 112.0 0.125 89.5 0.098 121.0 0.117
24 56.5 0.157 308.3 0.194 124.0 0.081 126.0 0.059 128.0 0.054
25 97.4 0.142 445.0 0.297 173.0 0.097 156.0 0.085 157.0 0.084
26 50.8 0.261 134.7 0.026 91.7 0.155 63.8 0.125 130.0 0.124
27 50.6 0.158 177.7 0.039 114.0 0.118 86.8 0.104 124.0 0.104
28 92.4 0.126 627.0 0.330 168.0 0.061 165.0 0.081 186.0 0.082
29 85.8 0.124 400.7 0.308 159.0 0.090 146.0 0.089 172.0 0.072
Note: H. speed – homogenization speed; S. time – sonication time.

53
Both the linear regression and quadratic regression models were developed for
nanoparticle synthesis. Better regression models were obtained using quadratic regression.
Hence, the quadratic model was used for data analysis. The quadratic regression equation used
for correlation between design variables and responses is described by equation 2.1, i.e.
2
444
2
333
2
222
2
111433442243223
411431132112443322110
XbXbXbXbXXbXXbXXb
XXbXXbXXbXbXbXbXbby
++++++++
+++++++++=
2.1
where y is the measured response, particle size (Zave, nm), or PDI; X1 is the PLGA concentration
(% (w/v)); X2 is the emulsifier concentration (% (w/v)); X3 is the homogenization speed (rpm); X4
is the sonication time (minutes); b0 is the intercept; b1-4 are the regression coefficients for the
linear terms; b12, 13, 14, 23, 24, 34 are the regression coefficients describing the interactions between
two variables; and b11-44 are the regression coefficients for the quadratic terms.
Analysis of variance (ANOVA) was further used to evaluate the levels of significance of
each design variable and their interactions on the responses. The design variables were
considered significant for a p-value ≤ 0.05. The p-values obtained from ANOVA and the
regression coefficients of the design variables were calculated and are listed in Table 2.3 as an
example for particle size in case of molecular micelles. X1 is PLGA concentration (% (w/v)); X2
is emulsifier concentration (% (w/v)); X3 is homogenization speed (rpm); X4 is sonication time
(min). A complete ANOVA analysis is presented in Appendix III. Generally, PLGA
concentration and emulsifier concentration were found to be the most significant variables
influencing the particle size and size distribution. The other two variables, homogenization speed
and sonication time, had comparatively higher p-values, indicating less influence on the
responses (particle size and PDI). However, for a small homogenization speed and a sonication

54
time of zero, the responses were significantly higher than the other formulations used in the
experimental design.
2.3.1.1 Factors Affecting Particle Size
Particle size is an important characteristic of polymeric nanoparticles. Small
nanoparticles are suitable for oral and parenteral administration and have better cellular uptake.9,
13 In this study, the particle size was found to be dependent on the emulsifier type as well as the
investigated formulation parameters.
Table 2.3 Results of analysis of variance for particle size (molecular micelles)
Particle size (Zave)
Poly-SUS Poly-SUG Poly-L-SULV
Design
variables
p
value
regression
coefficients
p
value
regression
coefficients
p
value
regression
coefficients
Intercept 0.00 126.14 0.00 134.69 0.00 139.01
X1 0.00 8.77 0.00 5.47 0.00 9.94
X2 0.00 -52.20 0.00 -76.95 0.00 -49.84
X3 0.83 0.00 0.25 0.00 0.12 0.00
X4 0.01 -1.35 0.00 -1.54 0.00 -1.99
X1X2 0.44 -1.60 0.51 1.34 0.59 -0.54
X1X3 0.70 0.85 0.32 2.24 0.15 -1.76
X1X4 0.29 2.16 0.05 4.32 0.00 4.01
X2X3 0.49 -1.43 0.79 -0.53 0.00 3.77
X2X4 0.26 2.15 0.03 4.55 0.00 -4.40
X3X4 0.32 1.99 0.18 2.79 0.06 2.23
X12
0.49 -1.19 0.63 0.86 0.01 -2.80
X22
0.00 9.70 0.00 10.72 0.00 10.75
X32
0.80 0.44 0.09 3.21 0.37 0.79
X42
0.12 2.98 0.03 4.68 0.45 0.78

55
When SDS was used as the emulsifier, a particle size below 100 nm was obtained. In
contrast, the particle size was always higher than 100 nm in the experiments using PVA.
Comparatively, the nanoparticle synthesis using molecular micelles as emulsifiers, resulted in
nanoparticles with sizes larger than the ones obtained using SDS, but smaller than those obtained
using PVA. Among the three investigated molecular micelles, consistently smaller nanoparticle
sizes were obtained with poly-SUG, followed by poly-SUS and poly-L-SULV. The reduced sizes
obtained using molecular micelles can be explained by the self-assembling structure of molecular
micelles in aqueous solution, having a polar group oriented to the micellar surface and a
hydrocarbon tail within the micelle, similarly to a conventional micelle, such as SDS. However,
the polymerized molecular micelles do not have a CMC and thus create a hydrophobic
environment where the organic droplets can be accommodated during the homogenization and
sonication processes.
The response surface was further used to investigate the influence of design variables on
particle size and size distribution. In general, comparatively smaller nanoparticle sizes were
obtained at low PLGA concentration and at high emulsifier concentration. However, for constant
PLGA concentration and emulsifier concentration, an increase in nanoparticle size was obtained
at low sonication times and low homogenization speeds.
The response surface corresponding to particle size as a function of design variables is
represented in Figure 2.3. When SDS was used as the emulsifier (Figure 2.3.A), the minimum
particle size range (42.4 – 54.8 nm) was obtained for PLGA concentrations below 6 % (w/v) and
SDS concentration between 0.1 and 1.1 % (w/v). However, for an SDS concentration smaller
than 0.1 % (w/v) and larger than 1.1 % (w/v), the particle size increased with the increase of
PLGA concentration. The homogenization speed and sonication time, had a different effect on
the particle size. The smallest particle size range (45.7 – 49.2 nm) was obtained for a

56
homogenization speed higher than 20,000 rpm and a sonication time higher than 10 minutes. In
contrast, the largest particle size was obtained for a homogenization speed of 5,000 rpm and a
sonication time of 20 minutes.
The response surface for PVA (Figure 2.3.B) showed a minimum particle size range
(85.5 – 172.4 nm) for a large PVA concentration range, from 0.3 to 1.5 % (w/v). However, at
PVA concentrations below 0.3 % (w/v), the particle size increased with an increase in PLGA
concentration. Similarly to other emulsifiers, the maximum particle size was obtained for
emulsifier concentration smaller than 0.1 % (w/v) and PLGA concentrations higher than 5 %
(w/v). The particle size surface response for PVA represented for homogenization speed and
sonication time indicated a minimum particle size range (147.4 – 177.6 nm) at sonication times
between 8 and 18 minutes, irrespective of homogenization speed. However, the particle size
increased at low and high extremes of sonication time and homogenization speed ranges. Despite
this flexibility, a particle size below 100 nm could not be achieved using PVA, within the ranges
of investigated design variables.
Similar response surfaces were obtained for the investigated molecular micelles in terms
of PLGA concentration and emulsifier concentration (Figures 2.3.C, 2.3.D, 2.3.E). The minimum
particle size ranges for poly-SUS (72.7 – 94.2 nm), poly-SUG (47.8 – 69.5 nm) and poly-L-
SULV (73.8 – 95.7 nm) were obtained for an emulsifier concentration between 0.5 and 1.5 %
(w/v) and a PLGA concentration below 2 % (w/v) for poly-SUS and poly-L-SULV and below
3.5 % (w/v) for poly-SUG. For concentrations of molecular micelles smaller than 0.5 % (w/v),
the particle size increased and reached a maximum for a PLGA concentration higher than 5 %
(w/v). When the particle size was represented as a function of homogenization speed and
sonication time, the minimum particle size range was highly influenced by the type of molecular
micelle. In the case of poly-SUS, the minimum particle size range (105.6 – 111.7 nm) was

57
present at homogenization speeds lower than 18,000 rpm and sonication times higher than twelve
minutes. Although poly-SUS and SDS have similar chemical structures, the strong forces
induced in the homogenization and sonication processes seemed to disturb the equilibrium of
SDS micelles in solution, thereby increasing the particle size. In contrast, poly-SUS micelles are
stable micelles even at high shear forces, resulting in a minimum size range at high sonication
times.
Figure 2.3 Response surface corresponding to particle size for PLGA nanoparticles prepared
with A) SDS; B) PVA C) poly-SUS; D) poly-SUG; E) poly-L-SULV (right side –
response surface for PLGA concentration and emulsifier concentration; and left
side – response surface for homogenization time and sonication speed).
B)
A)

58
Figure 2.3 Continued.
E)
C)
D)
59
In the case of poly-SUG, the minimum size range (83.6 – 92.3 nm) was achieved in the
center of homogenization speed and sonication time ranges, i.e. 15,000 rpm and 15 minutes
respectively. Extreme values, high or low, led to an increase in particle size. When poly-L-SULV
was used as the emulsifier, the response surface showed a minimum range (104.2 – 112.8 nm)
for long sonication times, between 17 and 20 minutes, and small homogenization speeds, from
5,000 to 15,000 rpm. However, the maximum particle size range similar for all molecular
micelles and was obtained for small homogenization speeds, below 10,000 rpm, and short
sonication times of 5-6 minutes.
2.3.1.2 Factors Affecting Polydispersity
Polydispersity, represented by the polydispersity index (PDI), is an indication of the
particle size distribution. Nanoparticle suspensions are close to monodisperse for small values of
PDI, typically below 0.100, and they become more polydisperse as the PDI value increases over
0.200.28 In the nanoparticle synthesis involving the use of SDS as an emulsifier, the experimental
PDI values ranged from 0.122 to 0.393, while the use of PVA as an emulsifier resulted in
nanoparticles with experimental PDI values ranging from 0.022 to 0.330. Compared to
conventional micelles, consistently smaller PDI values were obtained when molecular micelles
were used as emulsifiers. The smallest experimental PDI values of 0.054, 0.059 and 0.061 were
obtained when poly-L-SULV, poly-SUG and poly-SUS were used as emulsifiers, respectively.
Smaller experimental PDI values obtained for molecular micelles, as compared to conventional
micelles, are probably the result of their stability and uniform size in solution, as we earlier
hypothesized. This leads to monodisperse suspensions in all experimental formulations using
molecular micelles as emulsifiers.
The effect of design variables on the PDI response surface is represented in Figure 2.4.
Although the PDI varied within a wide range, it generally decreased with a decrease of

60
emulsifier concentration and an increase in PLGA concentration. In contrast, PDI values
decreased with a decrease of homogenization speed and an increase in sonication time. In terms
of PLGA concentration and emulsifier concentration, the PDI produced a concave response
surface for SDS, PVA, and the molecular micelles poly-SUG and poly-L-SULV. For the latter
molecular micelles (Figures 2.4.D, 2.4.E), a minimum range was obtained at small emulsifier
concentration, below 0.2 % (w/v), and PLGA concentration from 0.5 to 5.5 % (w/v).
Figure 2.4 Response surface corresponding to polydispersity index for PLGA nanoparticles
prepared with A) SDS; B) PVA; C) poly-SUS; D) poly-SUG; E) poly-L-
SULV(right side – response surface for PLGA concentration and emulsifier
concentration; and left side – response surface for homogenization time and
sonication speed).
A)
B)

61
Figure 2.4 Continued.
C)
E)
D)

62
For SDS (Figure 2.4.A), this range was extended towards high SDS concentrations and
high PLGA concentrations. In the case of PVA (Figure 2.4.B), the minimum PDI range was
obtained for PVA concentrations between 0.5 and 1.5 % (w/v) and PLGA concentrations from
0.5 to 6.5 % (w/v). However, at PVA concentrations below 0.5 % (w/v), the PDI value increased
with an increase of PLGA concentration. The response surface for poly-SUS (Fig. 2.4.C) was
opposite to the ones for the other emulsifiers and seemed to be independent of PLGA
concentration and highly dependent on poly-SUS concentration. In this case, the minimum PDI
range was obtained for a poly-SUS concentration below 0.2 % (w/v), irrespective of PLGA
concentration. However, for emulsifier concentration higher than 0.2 % (w/v), the PDI value
increased with the increase of poly-SUS concentration. When the PDI response surface was
represented as a function of homogenization speed and sonication time, the molecular micelles
presented similar convex surfaces with a minimum situated at high homogenization speeds and
high sonication times. The only exception was poly-L-SULV, where the minimum PDI was
obtained for high homogenization speed (20,000 rpm), irrespective of the sonication time. In
contrast, the PDI surface response was concave for SDS and PVA. However, the minimum range
was located at different values of design variables. In the case of SDS, the smallest PDI values
were obtained for homogenization speeds lower than 15,000 rpm and sonication times longer
than fifteen minutes. For PVA, the minimum PDI range was obtained for homogenization speeds
between 10,000 and 25,000 rpm and sonication times between 8 and 12 minutes.
2.3.1.3 Validation of the Regression Model
The CCD used in this study was designed to have five replicates of central samples in
order to evaluate the reproducibility of the nanoparticle synthesis. In general, one would expect
that the percentage relative standard deviation for particle size would be significantly smaller as
compared to percentage relative standard deviation for PDI, simply because of their different

63
orders of magnitude. In the case of particle size, the percentage relative standard deviation of the
five replicated central samples ranged from 1.5 % for SDS to 4.5 % for poly-SUG, indicating
high reproducibility for the nanoparticle synthesis. In contrast, the percentage relative standard
deviation for PDI had higher values, from 7.4 % for poly-L-SULV to 20.1 % for poly- SUG.
In order to verify the predictive ability of the regression model, the experiments resulting
in nanoparticles having a minimum particle size and a minimum PDI value, respectively, were
selected for each emulsifier and reproduced in triplicate. The average values for particle size and
PDI experimentally obtained from DLS were compared to the particle size and PDI values
predicted by the model. The experimental and predicted values of particle size and PDI and their
percentage relative errors are shown in Table 2.4. In general, the predictive ability of the model
was better when molecular micelles were used as emulsifiers. Their percentage relative errors for
particle size ranged from -7.8 % for poly-SUS to -16.1 % for poly-SUG, indicating a good
predictability of the model for molecular micelles. In the case of the PDI values, the percentage
relative error ranged from -3.8 % for poly-L-SULV to -23.9 % for poly-SUG. However, in the
case of conventional emulsifiers SDS and PVA, the percentage relative errors were smaller than
those for the PDI values of the molecular micelles, but significantly higher for the particle sizes.
2.3.2 Characterization of Optimally Synthesized PLGA Nanoparticles
2.3.2.1 Particle Size and Size Distribution
PLGA nanoparticle synthesis was optimized by use of CCD. The optimal conditions
required to synthesize PLGA nanoparticles having the minimum particle size and minimum PDI
were selected based on the location of the minimum ranges for particle size and PDI given by the
quadratic model. In order to verify the changes in nanoparticle physico-chemical characteristics
after synthesis, the optimal PLGA nanoparticle formulations were further purified by dialysis
and freeze-dried.
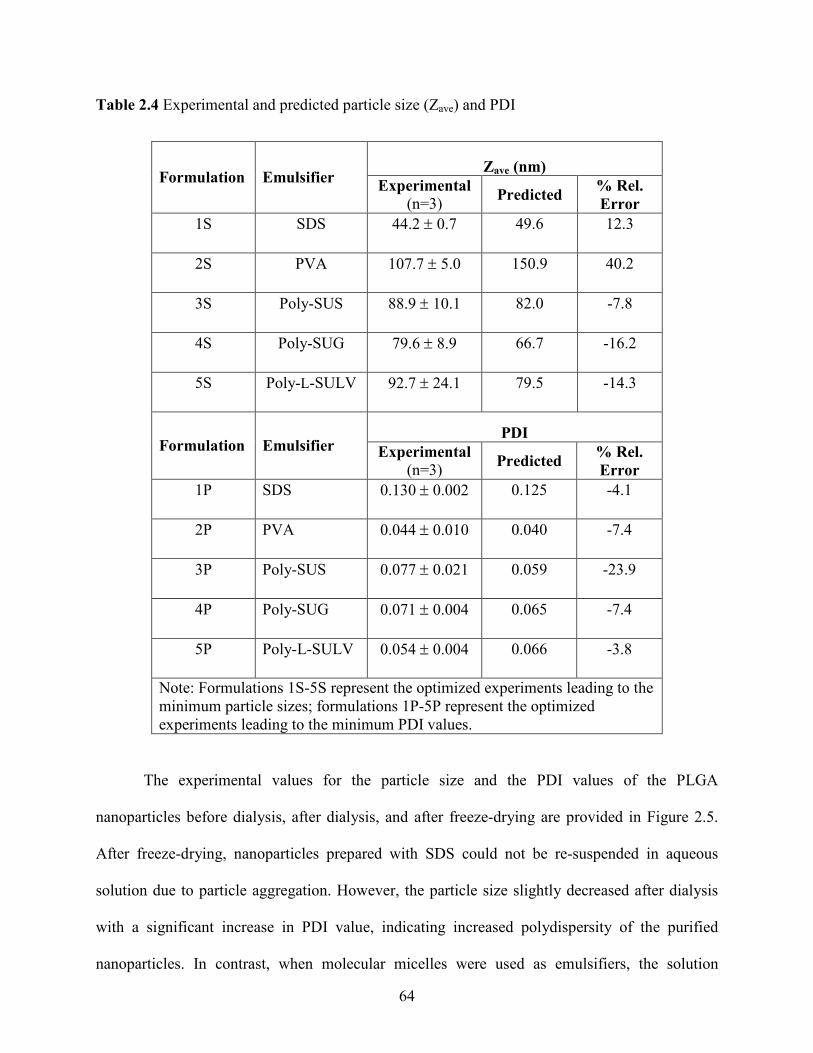
64
Table 2.4 Experimental and predicted particle size (Zave) and PDI
Zave (nm) Formulation Emulsifier
Experimental
(n=3) Predicted
% Rel.
Error
1S SDS 44.2 ± 0.7 49.6 12.3
2S PVA 107.7 ± 5.0 150.9 40.2
3S Poly-SUS 88.9 ± 10.1 82.0 -7.8
4S Poly-SUG 79.6 ± 8.9 66.7 -16.2
5S Poly-L-SULV 92.7 ± 24.1 79.5 -14.3
PDI Formulation Emulsifier Experimental
(n=3) Predicted
% Rel.
Error
1P SDS 0.130 ± 0.002 0.125 -4.1
2P PVA 0.044 ± 0.010 0.040 -7.4
3P Poly-SUS 0.077 ± 0.021 0.059 -23.9
4P Poly-SUG 0.071 ± 0.004 0.065 -7.4
5P Poly-L-SULV 0.054 ± 0.004 0.066 -3.8
Note: Formulations 1S-5S represent the optimized experiments leading to the
minimum particle sizes; formulations 1P-5P represent the optimized
experiments leading to the minimum PDI values.
The experimental values for the particle size and the PDI values of the PLGA
nanoparticles before dialysis, after dialysis, and after freeze-drying are provided in Figure 2.5.
After freeze-drying, nanoparticles prepared with SDS could not be re-suspended in aqueous
solution due to particle aggregation. However, the particle size slightly decreased after dialysis
with a significant increase in PDI value, indicating increased polydispersity of the purified
nanoparticles. In contrast, when molecular micelles were used as emulsifiers, the solution

65
became clearer, as the excess of molecular micelles was removed by dialysis, and the dried
nanoparticles could be readily re-suspended in water after freeze-drying.
Figure 2.5 Experimental particle size (A) and PDI (B) of PLGA nanoparticles before
dialysis, after dialysis and after freeze-drying (n = 3). 1S-5S refer to optimized
experiments leading to the minimum particle sizes; 1P-5P refer to optimized
experiments leading to the minimum PDI values.
In general, the particle size of PLGA nanoparticles prepared with molecular micelles
increased after freeze-drying. However, we were able to obtain a particle size below 100 nm for
freeze-dried PLGA nanoparticles using poly-L-SULV as emulsifier. In addition, the PDI values
remained within the same range during purification for all molecular micelles, indicating a
monodisperse nanoparticle suspension (PDI < 0.100). The nanoparticles prepared with PVA
(A)
0.0
20.0
40.0
60.0
80.0
100.0
120.0
140.0
160.0
SDS (1S) PVA (2S) Poly-SUS (3S) Poly-SUG (4S) Poly-L-SULV (5S)
Emulsifier
Zave (n
m)
before dialysis
after dialysis
after freeze-drying
(B)
0.000
0.100
0.200
0.300
0.400
0.500
SDS (1P) PVA (2P) Poly-SUS (3P) Poly-SUG (4P) Poly-L-SULV (5P)
Emulsifier
PD
I
before dialysis
after dialysis
after freeze-drying
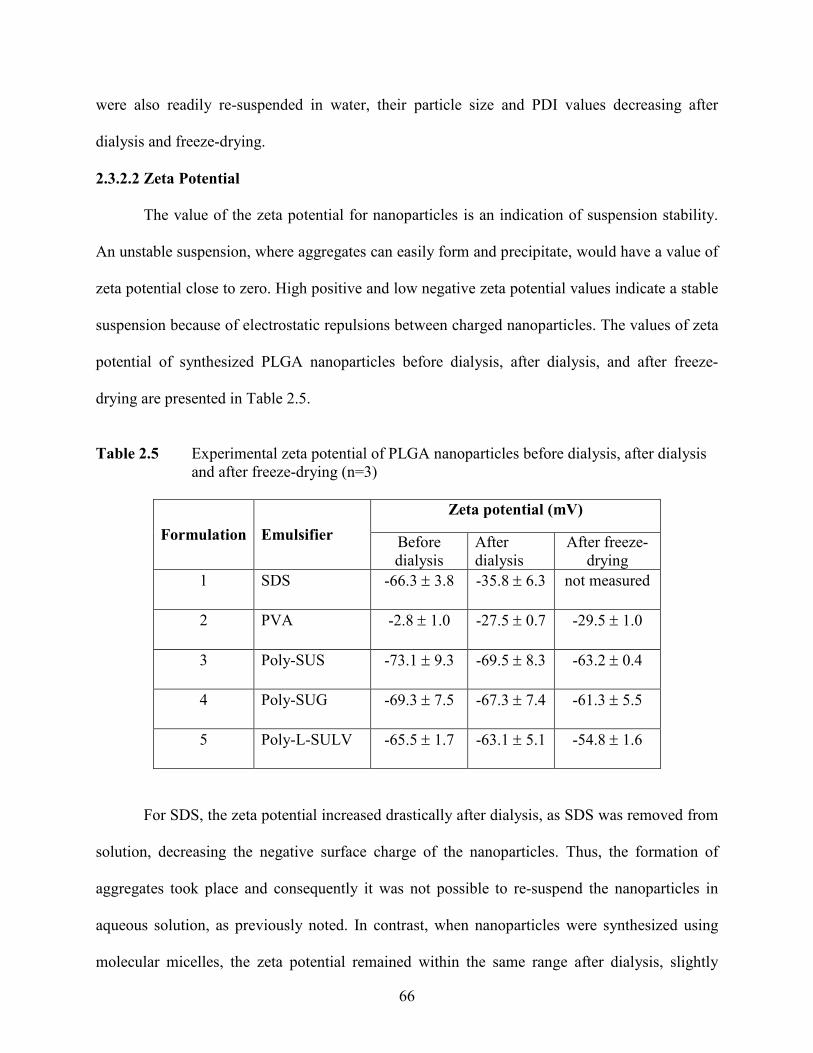
66
were also readily re-suspended in water, their particle size and PDI values decreasing after
dialysis and freeze-drying.
2.3.2.2 Zeta Potential
The value of the zeta potential for nanoparticles is an indication of suspension stability.
An unstable suspension, where aggregates can easily form and precipitate, would have a value of
zeta potential close to zero. High positive and low negative zeta potential values indicate a stable
suspension because of electrostatic repulsions between charged nanoparticles. The values of zeta
potential of synthesized PLGA nanoparticles before dialysis, after dialysis, and after freeze-
drying are presented in Table 2.5.
Table 2.5 Experimental zeta potential of PLGA nanoparticles before dialysis, after dialysis
and after freeze-drying (n=3)
Zeta potential (mV)
Formulation Emulsifier Before
dialysis
After
dialysis
After freeze-
drying
1 SDS -66.3 ± 3.8 -35.8 ± 6.3 not measured
2 PVA -2.8 ± 1.0 -27.5 ± 0.7 -29.5 ± 1.0
3 Poly-SUS -73.1 ± 9.3 -69.5 ± 8.3 -63.2 ± 0.4
4 Poly-SUG -69.3 ± 7.5 -67.3 ± 7.4 -61.3 ± 5.5
5 Poly-L-SULV -65.5 ± 1.7 -63.1 ± 5.1 -54.8 ± 1.6
For SDS, the zeta potential increased drastically after dialysis, as SDS was removed from
solution, decreasing the negative surface charge of the nanoparticles. Thus, the formation of
aggregates took place and consequently it was not possible to re-suspend the nanoparticles in
aqueous solution, as previously noted. In contrast, when nanoparticles were synthesized using
molecular micelles, the zeta potential remained within the same range after dialysis, slightly
67
increasing after freeze-drying to - 54 ± 1.6 mV for poly-L-SULV, - 61.3 ± 5.5 mV for poly-SUG
and - 63.2 ± 0.4 mV for poly-SUS. This may be attributed to strong hydrophobic interactions
between the polymer and the micelle core, the micelle remaining on the surface and intertwined
into the nanoparticle. Therefore, the overall micellar surface charge produced a stable
suspension, minimizing aggregation in solution after dialysis and freeze-drying. Quantitative
methods for the determination of residual molecular micelle concentration in nanoparticle
suspension are under development in our laboratory. Further investigation is required to
determine the effect of the residual molecular micelle layer on the entrapment efficiency and
release rate of active pharmaceutical compounds. When PVA was used as the emulsifier, the zeta
potential decreased to a lower negative value after dialysis, since an excess of PVA was likely
removed from nanoparticle surface and more negatively charged carboxylic groups of PLGA
were uncovered. The zeta potential remained practically the same after freeze-drying, indicating
a stable nanoparticle suspension that readily re-suspended in water.
2.3.3 Nanoparticle Morphology
The morphology of purified PLGA nanoparticles was investigated by transmission
electron microscopy (TEM). The micrographs of typical nanoparticle suspension obtained with
molecular micelles are shown in Figure 2.6. It can be noted that the particle size observed by use
of TEM was slightly smaller than the particle size measured by dynamic light scattering. Such
disagreement is likely determined by the differences in the sample preparation procedures. The
investigated nanoparticles are suspended in aqueous solution for dynamic light scattering
measurements, while for TEM imaging the nanoparticles are drop - casted on a grid and let dry
before taking their image. However, spherical shape and smooth surface of the PLGA
nanoparticles emulsified with molecular micelles were observed. In addition, no aggregates and
precipitates were formed during the imaging process.

68
Figure 2.6 Typical micrographs of freeze-dried PLGA nanoparticles obtained with molecular
micelles A) poly-SUS; B) poly-SUG; C) poly-L-SULV at 33,000x magnification
(right) and 160,000x magnification (left).
A)
B)
C)
69
2.4 Conclusions
In this study, molecular micelles were successfully used as novel emulsifiers to prepare
PLGA nanoparticles. In addition, we were able to control the size and polydispersity of the
PLGA nanoparticle suspension by use of a chemometric central composite design (CCD) and by
accurate selection of optimal formulation conditions according to the CCD. The predictive
ability of the model for particle size and PDI was better for nanoparticles obtained with
molecular micelles in comparison with those obtained with conventional emulsifiers.
Furthermore, after removal of excess emulsifier, the dried PLGA nanoparticles coated with
molecular micelles were readily re-suspended in aqueous solution after purification and freeze-
drying without significant modification of their size, shape and surface charge, revealing
promising properties as drug delivery systems.
2.5 References
1 Kayser, O.; Lemke, A.; Hernandez-Trejo, N. Current Pharmaceutical Biotechnology
2005, 6, 3-5.
2 Vogelson, C. T. Modern Drug Discovery 2001, 4, 49-52.
3 Brannon-Pepas, L. Medical Plastics and Biomaterials 1997, 4, 34-44.
4 Allemann, E.; Gurny, R.; Doelker, E. European Journal of Pharmaceutics and
Biopharmaceutics 1993, 39, 173-191.
5 Kumar, M. N. V. R. Journal of Pharmacy & Pharmaceutical Sciences 2000, 3, 234-258.
6 Shikanov, A.; Kumar, N.; Domb, A. J. Israel Journal of Chemistry 2005, 45, 393-399.
7 Brannon-Pepas, L.; Blanchette, J. O. Advanced Drug Delivery Reviews 2004, 56, 1649-
1659.
8 Brigger, I.; Dubernet, C.; Couvreur, P. Advanced Drug Delivery Reviews 2002, 54, 631-
651.
9 Panyam, J.; Labhasetwar, V. Advanced Drug Delivery Reviews 2003, 55, 329-347.
10 Delie, F.; Blanco-Prieto, M. J. Molecules 2005, 10, 65-80.
11 Anderson, J. M.; Shive, M. S. Advanced Drug Delivery Reviews 1997, 28, 5-24.

70
12 Bala, I.; Haribaran, S.; Ravi Kumar, M. N. V. Critical Review in Therapeutic Drug
Carrier Systems 2004, 21, 387-422.
13 Hans, M. L.; Lowman, A. M. Current Opinion in Solid State and Materials Science 2002,
6, 319-327.
14 Quintanar-Guerrero, D.; Alleman, E.; Fessi, H.; Doelker, E. Drug Develoment and
Industrial Pharmacy 1998, 24, 1113-1128.
15 Astete, C. E.; Sabliov, C. M. Journal of Biomaterials Science, Polymer Edition 2006, 17,
247-289.
16 Song, C. X.; Labhasetwar, V.; Murphy, H.; Qu, X.; Humphrey, W. R.; Shebuski, R. J.;
Levy, R. J. Journal of Controlled Release 1997, 43, 197-212.
17 Birnbaum, D. T.; Kosmala, J. D.; Brannon-Pepas, L. Journal of Nanoparticle Research
2000, 2, 173-181.
18 Mu, L.; Feng, S.-S. Pharmaceutical Research 2003, 20, 1864-1872.
19 Kumar, M. N. V. R.; Bakowsky, U.; Lehr, C. M. Biomaterials 2004, 25, 1771-1777.
20 Panyam, J.; Williams, D.; Dash, A.; Leslie-Pelecky, D.; Labhasetwar, V. Journal of
Pharmaceutical Sciences 2004, 93, 1804-1814.
21 Win, K. Y.; Feng, S.-S. Biomaterials 2006, 27, 2285-2291.
22 Bilati, U.; Alleman, E.; Doelker, E. Journal of Microencapsulation 2005, 22, 205-214.
23 Jiao, Y. Y.; Ubrich, N.; Marchand-Arvier, M.; Vigneron, C.; Hoffman, M.; Maincent, P.
Drug Delivery 2001, 8, 135-141.
24 Panyam, J.; Zhou, W.-Z.; Prabha, S.; Sahoo, S. K.; Labhasetwar, V. FASEB Journal
2002, 16, 1217-1226.
25 Prabha, S.; Zhou, W.-Z.; Panyam, J.; Labhasetwar, V. International Journal of
Pharmaceutics 2002, 244, 105-115.
26 Dillen, K.; Vandervoort, J.; Van den Mooter, G.; Verheyden, L.; Ludwig, A.
International Journal of Pharmaceutics 2004, 275, 171-187.
27 Duan, Y.; Sen, X.; Wang, Q.; Liu, J.; Zhang, Z. Journal of Materials Science: Materials
in Medicine 2006, 17, 559-563.
28 Julienne, M. C.; Alonso, M. J.; Gomez Amoza, J. L.; Benoit, J. P. Drug Develoment and
Industrial Pharmacy 1992, 18, 1063-1077.
29 Prakobvaitayakit, M.; Nimmannit, U. AAPS PharmSciTech 2003, 4, 1-9.
30 Vandervoort, J.; Ludwig, A. International Journal of Pharmaceutics 2002, 238, 77-92.

71
31 Sahoo, S. K.; Panyam, J.; Prabha, S.; Labhasetwar, V. Journal of Controlled Release
2002, 82, 105-114.
32 Shamsi, S. A.; Palmer C.P.; Warner, I. M. Analytical Chemistry 2001, 73, 140A-149A.
33 Haddadian, F.; Shamsi, S. A.; Warner, I. M. Electrophoresis 1999, 20, 3011-3026.
34 Kapnissi-Christodoulou, C. P.; Zhu, X.; Warner, I. M. Electrophoresis 2003, 24, 3917-
3934.
35 Ganea, G. M.; Sabliov, C. M.; Ishola, A. O.; Fakayode, S. O.; Warner, I. M. Journal of
Nanoscience and Nanotechnology 2008, 8, 280-292.
36 Bergstrom, S. Z. Physiol. Chem. 1936, 236, 163-168.
37 Shamsi, S. A.; Akbay, C.; Warner, I. M. Analytical Chemistry 1998, 70, 3078-3083.
38 Macossay, J.; Shamsi, S. A.; Warner, I. M. Tetrahedron Letters 1999, 40, 577-580.
72
CHAPTER 3
THE EFFECT OF MOLECULAR MICELLES ON SYNTHESIS AND PROPERTIES OF
THYMOQUINONE-LOADED POLY(D,L LACTIDE-CO-GLYCOLIDE)
NANOPARTICLES
3.1 Introduction
Excessive production of free radical species through oxidative processes can lead to
alteration of cellular functions responsible for cardiovascular diseases, neurodegenerative
diseases, diabetes, cancer, joint diseases, and aging.1-6 The damaging effect of free radicals is
typically counterbalanced by antioxidants acting as free radical suppressors and scavengers.7, 8
Several examples enzymes such as superoxide dismutase (SOD) and glutathione peroxidase
(GSP) as well as tocopherols, flavonoids, polyphenols and quinones.9 In general, antioxidants
play a significant role in disease prevention and treatment. The mechanism against disease
depends on antioxidants type and structure. For example, SOD and catalase inhibit the formation
of superoxide anion radicals and hydrogen peroxide, while GSP and vitamin E participate in the
decomposition of lipid peroxides. In addition, antioxidants can reduce the incidence of cancer,
improve immune system, and prevent the development of age-related cataract and macular
degeneration. 10-14
Despite their benefits, many antioxidants present poor water solubility, leading to low
absorptivity and bioavailability. In addition, the intended therapeutic role of ingested
antioxidants may be different than their in vivo activity once the food matrix is disrupted.15, 16
Therefore, novel antioxidant-loaded drug delivery systems such as polymeric nanoparticles have
been identified as alternatives that should provide long-term delivery at the therapeutic level,
prevent antioxidant degradation, and increase pharmaceutical activity of such antioxidants.17, 18
In recent years, controlled delivery of antioxidants has allowed a new approach for cancer
therapy, cardiovascular diseases, neurodegenerative diseases, and ageing.17-20
Several studies

73
have reported nanoparticle-based drug delivery systems for controlled delivery of antioxidants.
For example, quercetin-loaded nanoparticles have showed excellent free radical scavenging
activity and bioavailability.21, 22
In addition, biodegradable nanoparticles were prepared for
poorly soluble ellagic acid demonstrating the importance of synthetic parameters in the physico-
chemical and pharmaceutical properties of such drug delivery systems.23, 24
In other studies,
“nanocurcumin” was prepared using polymeric nanoparticles for controlled delivery of natural
curcumin with improved anticancer properties.25, 26
In these studies, as a result of their improved
solubility, antioxidant loaded – nanoparticles were demonstrated to have improved antioxidant
activity as compared with free antioxidants.
Quinones refer to a group of antioxidants that contain typically a p-benzoquinone
structure. Coenzyme Q10, is an lipophilic endogenous p-benzoquinone antioxidant that
participates in the mitochondrial respiratory chain.27, 28
Deficiencies in Q10 and damages of
mitochondrial DNA are the main cause of genetic mitochondrial diseases. 29, 30
Currently, the
administration of Q10 supplements is the first line therapy for the treatment of mitochondrial
encephalomyopathies. Several studies have focused on delivery of coenzyme Q10 using
nanoparticles. Such nanoparticles enhanced drug stability and cellular uptake, providing
promising routes for administration as compared to regular dietary supplements.31-33
In the recent years, benzoquinone-based anticancer drugs have been developed as
inhibitors of NADH quinone oxidoreductase (NQO1) involved in quinone metabolism. This
strategy is favored by the high concentration of this enzyme in some types of cancer as well as
the hypoxic conditions of the solid tumors.28, 34
Mitomycin C is a classical NQO1 inhibitor and
has been used as chemotherapeutic agent for a variety of cancers including head, neck, breast
and prostate. However, its lack of specificity accompanied by strong and uncontrollable side
effects limit the benefits of this drug. Therefore there is continuous effort for the development of
74
benzoquinone drugs with improved water solubility and reduced adverse reactions. For example,
EOquin is currently used for treatment of superficial bladder cancer, benzoquinone ansamycins
such as 17-allylamino-17-demethoxygeldanamycin (17-AAG) and 17-dimethylaminoethylamino
-17-demethoxy-geldanamycin (17-DAAG) alone and in combination with other anticancer drugs
for the treatment of advanced solid tumors, metastatic renal carcinoma and chemotherapy
refractory breast cancer.35 In addition, natural alkylated and cyclic benzoquinones found in plant
extracts presented cytotoxic effects against various cancer cell lines.36-38
Thymoquinone (TQ) is the major constituent of Nigella sativa black seed oil, a medicinal
plant from the Ranunculaceae family, which has been used for centuries in Africa, Europe, and
Asia for treatment of many diseases including inflammation, asthma, hypertension,
gastrointestinal conditions, and skin irritations.39 Thymoquinone display antioxidant properties
by acting as free radical scavengers.40, 41
In addition, TQ exhibits a protective antioxidant effect
against the severe side effects caused by doxorubicin, an anticancer drug, that induces cardiac
and renal toxicities during and after chemotherapy.42, 43
Furthermore, TQ is an emerging
anticancer drug, showing cytotoxic activity for human cancer cell lines including colorectal,
ovarian, and breast cells.44-46
Although thymoquinone is a powerful antioxidant and anticancer drug, its administration
is limited due to poor water solubility.44, 47
In addition, administration of high dosages to rats
have resulted in hypoactivity and difficulty in respiration associated with reduced glutathione in
the liver and kidney.48 Another report has shown that TQ is capable of reducing blood glucose
levels and allergic dermatitis incidences.49 To overcome these disadvantages, biodegradable and
biocompatible polymeric nanoparticles would be attractive alternatives for TQ delivery. Such
nanoparticles would likely provide improved TQ solubility, controlled delivery, and enhanced
therapeutic properties.

75
In the present study, we focused on physico-chemical properties, antioxidant activity, and
cytotoxicity of TQ-loaded nanoparticles. Poly(D,L lactide-co-glycolide) nanoparticles
containing thymoquinone were synthesized by emulsification solvent evaporation method, using
molecular micelle poly (sodium N-undecenyl-glycinate) (poly-SUG) as emulsifier. The synthetic
parameters were investigated using a Box-Behnken experimental design in order to obtain the
maximum entrapment efficiency. The individual and combined effects of factors such as PLGA
amount, TQ amount and emulsifier concentration (design variables) were established on TQ
entrapment efficiency (response).
The surface properties of polymeric nanoparticles are influenced by the emulsifier, which
likely plays an important role in their applications as drug delivery systems.50 Molecular micelles
such as poly-SUG represent a novel class of emulsifiers used in nanoparticle synthesis. They
have a polymerized hydrophobic core and a critical micelle concentration equal to zero that
allow an increased stability and rigidity in comparison with conventional micelles. When used as
emulsifiers, molecular micelles strongly interact with PLGA polymer at the organic – aqueous
interface. Such interactions are of a hydrophobic nature and provide a reduction in the organic
droplet size, resulting in small and monodisperse nanoparticles. Due to their charge, molecular
micelles provide sufficient interparticle repulsions in aqueous solutions, leading to increased
stability over time.51 In order to further understand the role of molecular micelles in polymeric
nanoparticle synthesis, we investigated the properties of TQ-loaded PLGA nanoparticles
prepared using various molecular micelles as emulsifiers. Anionic glycine-based molecular
micelles with shorter carbon chains, poly(sodium N-heptenyl-glycinate) (poly-SHG), and
poly(sodium N-decenyl-glycinate) (poly-SDG) were synthesized and used as emulsifiers. In
addition, molecular micelles having various amino acid hydrophilic head groups, poly(sodium N-
undecenyl-alaninate) (poly-SUA), poly(sodium N-undecenyl-leucinate) (poly-SUL), and

76
poly(sodium N-undecenyl-valinate) (poly-SUV), were also used as emulsifiers. The effect of the
molecular micelles was evaluated by monitoring parameters such as release profile, antioxidant
activity, and, cytotoxicity of TQ-loaded PLGA nanoparticles. Controlled release of entrapped TQ
was performed by use of the dialysis method under physiological conditions (pH 7.4, 37 ºC)
using phosphate buffer as the release medium. A free-radical scavenging assay was used to
evaluate the antioxidant activity of TQ and TQ-loaded nanoparticles prepared with various
emulsifiers. The cytotoxicity of TQ and TQ-loaded PLGA nanoparticles were assessed using a
breast normal cell line (Hs578Bct) and two breast cancer cell lines (hormone-dependent MCF-7
and hormone-independent MDA-MB-231).
3.2 Materials and Methods
3.2.1 Materials
Poly(D,L-lactide-co-glycolide) (PLGA, lactide:glycolide 75:25, MW 66-107 kDa),
thymoquinone, 2,2-diphenyl-1-picrylhydrazyl (DPPH), and sucrose were purchased from Sigma-
Aldrich (St. Louis, MO, USA). Trolox was purchased from Acros Organics (Morris Plains, NJ,
USA). Dibasic sodium phosphate was purchased from Mallinckrodt (Hazelwood, MO, USA).
Dichloromethane and sodium phosphate monobasic were purchased from EMD Chemicals Inc.
(Gibbstown, NJ, USA). All reagents were of analytical grade and used as received.
The monomer forms of sodium N-heptenyl-glycinate (SHG), sodium N-decenyl-glycinate
(SDG), sodium N-undecenyl-glycinate 52, sodium N-undecenyl-alaninate (SUA), sodium N-
undecenyl-leucinate (SUL), and sodium N-undecenyl-valinate (SUV) were synthesized and
characterized according to our previously described procedures 53-57
The corresponding polymers
were obtained via polymerization using a 60Co γ-irradiation source. The complete polymerization
was confirmed by disappearance of the vinyl protons (δ ~ 6ppm) in the 1H NMR of the resulting
polymers. The chemical structures of the molecular micelles used as emulsifiers in the present

77
study are represented in Figure 3.1. Molecular micelles having glycine as a hydrophilic group
and carbon chains ranging from seven (n=3) to eleven (n=7) methylene groups are presented by
poly-SHG, poly-SDG and poly-SUG. ). In addition, molecular micelles having the same
hydrophobic tail and various amino acid hydrophilic head groups are represented by poly-SUA,
poly-SUL, and poly-SUV.
3.2.2 Cell Cultures
Normal Hs578Bct human breast fibroblast cells (HTB-125), hormone-dependent MCF-7
(HTB-22), and hormone-independent MDA-MB-231 (MDA, HTB-26) human mammary tumor
cells were obtained from the American Tissue Culture Collection (ATCC, Manassas, VA) and
grown to 90% confluence according to ATCC’s instructions.
Emulsifier n R
Poly-SHG 3 H
Poly-SDG 6 H
Poly-SUG 7 H
Poly-SUA 7 CH3
Poly-SUL 7 CH2CH(CH3)2
Poly-SUV 7 CH(CH3)2 H2C
HN
O
O-Na+
O
R
* *
x
n
Figure 3.1 Structures of molecular micelles used as emulsifiers in the nanoparticle synthesis
(n is the length of carbon chain; x indicates the polymerization site).
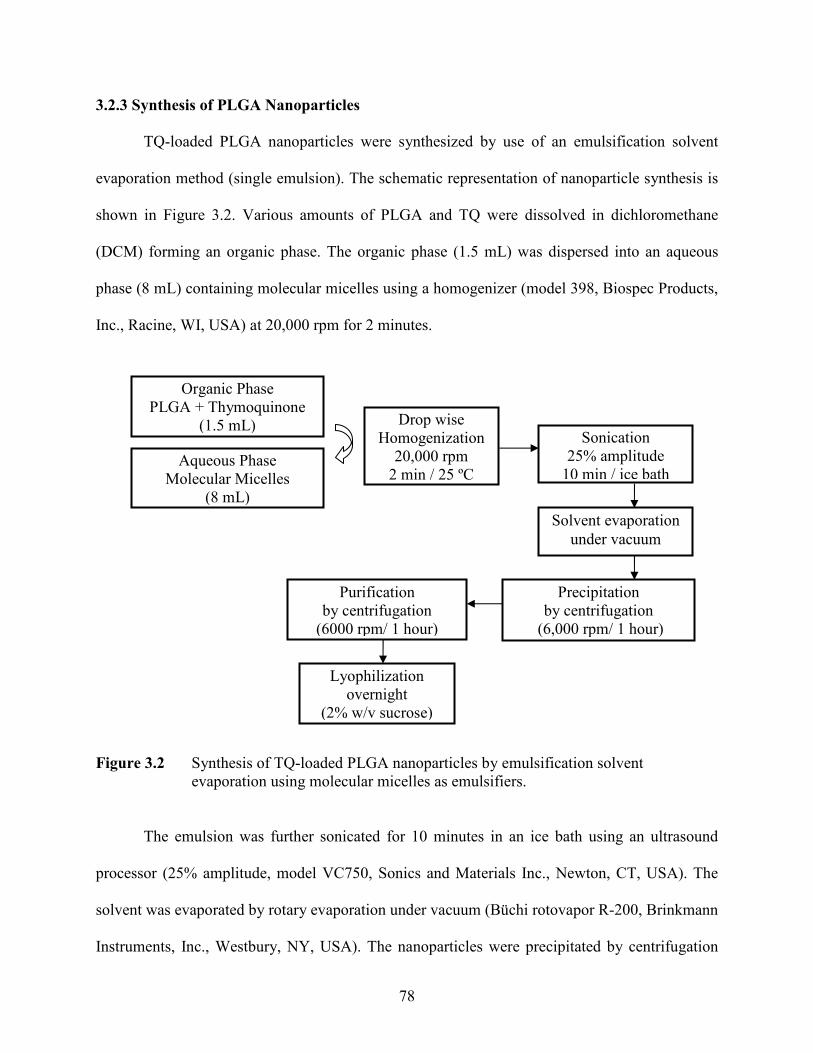
78
3.2.3 Synthesis of PLGA Nanoparticles
TQ-loaded PLGA nanoparticles were synthesized by use of an emulsification solvent
evaporation method (single emulsion). The schematic representation of nanoparticle synthesis is
shown in Figure 3.2. Various amounts of PLGA and TQ were dissolved in dichloromethane
(DCM) forming an organic phase. The organic phase (1.5 mL) was dispersed into an aqueous
phase (8 mL) containing molecular micelles using a homogenizer (model 398, Biospec Products,
Inc., Racine, WI, USA) at 20,000 rpm for 2 minutes.
Figure 3.2 Synthesis of TQ-loaded PLGA nanoparticles by emulsification solvent
evaporation using molecular micelles as emulsifiers.
The emulsion was further sonicated for 10 minutes in an ice bath using an ultrasound
processor (25% amplitude, model VC750, Sonics and Materials Inc., Newton, CT, USA). The
solvent was evaporated by rotary evaporation under vacuum (Büchi rotovapor R-200, Brinkmann
Instruments, Inc., Westbury, NY, USA). The nanoparticles were precipitated by centrifugation
Organic Phase
PLGA + Thymoquinone
(1.5 mL) Drop wise
Homogenization
20,000 rpm
2 min / 25 ºC
Sonication
25% amplitude
10 min / ice bath
Precipitation
by centrifugation
(6,000 rpm/ 1 hour)
Purification
by centrifugation
(6000 rpm/ 1 hour)
Lyophilization
overnight
(2% w/v sucrose)
Aqueous Phase
Molecular Micelles
(8 mL)
Solvent evaporation
under vacuum

79
(6,000 rpm, 1 hour) , and washed using an equal volume of water, in order to eliminate the
excess of emulsifier and unentrapped drug. Further, the nanoparticles were lyophilized overnight
(Freezone Plus 6, Labconco, Kansas City, MO, USA) and stored in a cool and dry environment
until further used. In order to improve the re-suspension of TQ-loaded nanoparticles in aqueous
media, cryoprotectant (2% w/v sucrose) was added before freeze-drying. Empty nanoparticles
without TQ were synthesized according to the same procedure, involving an organic phase
contained only the polymer. All other conditions were held constant.
3.2.4 Nanoparticle Characterization
The nanoparticle size and polydispersity (PDI) were measured using dynamic light
scattering (Zetasizer NanoZS, Malvern Instrumets Ltd., Malvern, UK). Zeta potential was
measured by laser doppler anemometry (Zetasizer NanoZS, Malvern Instrumets Ltd., Malvern,
UK). Nanoparticle morphology was investigated by use of transmission electron microscopy
(TEM, JEOL 100CX, Jeol Ltd., Peabody, MA, USA) using uranyl acetate negative staining.
3.2.5 Thymoquinone Quantification
The entrapment efficiency was determined by use of high performance liquid chromatography
(HPLC, Shimadzu Scientific Instruments, Columbia, MD, USA, mobile phase 80:20
acetonitrile:water, flow rate 0.5 mL/min, injection volume 20 µL). TQ-loaded PLGA
nanoparticles were dissolved in the mobile phase and sonicated in a bath sonicator for sufficient
time to ensure complete TQ solubilization. The samples were then filtered through a 0.2 µm
syringe filter and injected into the HPLC column (Luna C18(2), Phenomenex Inc., Torrance, CA,
USA). The entrapped TQ was quantified using the peak area for each nanoparticle formulation
(linear range of the calibration curve was 0.1 – 0.8 mg/mL; LOD 0.0017 mg/mL). The
entrapment efficiency (EE %) was calculated as 100 times the ratio of the entrapped TQ amount
relative to the known amount of TQ added to each formulation.
80
3.2.6 Optimization of Entrapment Efficiency
The influence of three synthesis parameters (design variables), PLGA amount, TQ
amount, and poly-SUG concentration, on TQ entrapment efficiency (response) was
simultaneously investigated using chemometric Box-Behnken experimental design. The design
variables were investigated at three levels involving a total number of fifteen experiments
including three replicates at the central level. The resultant data analyses were performed using
Unscrambler 9.1.2 software. The synthesis conditions were considered optimum for formulations
where the maximized entrapment efficiency was obtained. In addition, the influence of other
emulsifiers such as poly-SHG, poly-SDG, poly-SUA, poly-SUL and poly-SUV on the TQ
entrapment efficiency was further investigated employing the optimum conditions.
3.2.7 In vitro Controlled Release
In vitro controlled release was performed using a dialysis method. Specifically, a known
amount of solid nanoparticles (6 mg), containing a TQ amount established by the method
described above, were re-suspended in phosphate buffer (2mL of 0.1M Na2HPO4-NaH2PO4, pH
7.4). This suspension was placed in a dialysis bag (Specta/Por, MWCO 1000Da, Spectrum
Laboratories, Rancho-Dominguez, CA, USA) that was further placed in the phosphate buffer
release medium (15 mL) and incubated at 37 ºC in a refrigerated orbital shaker (CO24, Edison,
NJ, USA). Various time intervals were investigated. At each time point, the release medium was
completely replaced with fresh release medium, and placed back in the shaker chamber for
further TQ release. The sink conditions calculated based on TQ solubility, TQ amount contained
in the nanoparticles, and the total volume of release medium, were maintained throughout the
experimental time. The percentage (%) release for every time point was calculated as percentage
of total entrapped drug. Following the same procedure, a control experiment was performed
using TQ suspension in phosphate buffer.

81
3.2.8 Antioxidant Activity of TQ-loaded Nanoparticles
The antioxidant activity of TQ-loaded nanoparticles was determined by use of 2,2-
diphenyl-1-picrylhydrazyl (DPPH) assay. 21, 40
Briefly, in a 96-well plate, 100 µL of 100 µM
DPPH solution in methanol was incubated with 100 µL of aqueous suspensions of TQ-loaded
nanoparticles prepared with different molecular micelles as well as solutions of TQ dissolved in
methanol. Methanol and empty nanoparticles (synthesized without TQ) were also incubated with
DPPH solution, and used as controls. After 30 minutes, the absorbance was read at 517 nm using
a microplate spectrophotometer (Model 680, Bio-Rad Laboratories, Hercules, CA, USA). The
scavenging activity for each sample was calculated as DPPH scavenging (%) = 100 x [(Acontrol-
Asample)/Acontrol], where Asample is the absorbance of DPPH in the presence of TQ-containing
samples, and Acontrol is the absorbance of DPPH for control samples in the absence of TQ. The
concentration of TQ in each nanoparticle sample and in free TQ solution for which 50% DPPH
scavenging is achieved (IC50), was used to compare the scavenging activity. In addition, Trolox,
a powerful water soluble antioxidant, was used as standard in the DPPH assay. Trolox
Equivalents were calculated as the ratio between the IC50 for Trolox and the IC50 for each
sample, and expressed as µmol Trolox/ g TQ. All experiments were performed in triplicate.
3.2.9 Cytotoxicity of TQ-loaded Nanoparticles
The cytotoxic effect of TQ and TQ-loaded nanoparticles on breast normal and cancer cell
lines was determined by use of CellTiter 96® AQueous One Solution Cell Proliferation Assay
(Promega Corporation, Madison, Wisconsin, USA). Normal breast (Hs578Bct) and breast cancer
(hormone-dependent MCF-7 and hormone independent MDA-MB-231) cell cultures (1x10⁴
cells/well, 50 µL) were incubated at 37 ºC, in 5% CO2, with TQ solutions containing less than
1% DMSO, and TQ-loaded nanoparticles (3 mg/mL) suspended in the culture media (50 µL) for
24, 48 and 72 hours. At the end of the incubation period, the cells were treated with 3-(4,5-di-

82
methylthiazol-2-yl)-5-(3-carboxymethoxyphenyl)-2-(4-sulfo-phenyl)-2H-tetrazolium salt (MTS)
(20 µL), according to the manufacturer’s instructions (CellTiter 96® AQueous One Solution Cell
Proliferation Assay, Promega, Madison, WI). After 1 hour, the absorbance was read at 490 nm
using a microplate spectrophotometer (Benchmark Plus, Bio-Rad Laboratories, Hercules, CA,
USA). Blank nanoparticles prepared by emulsification solvent evaporation, without adding TQ
to the formulation, were used as controls. Percentage cell viability was calculated as 100 times
the ratio of absorbance in the presence of TQ and TQ-loaded nanoparticles and absorbance for
TQ-free control samples. All experiments were performed in triplicate.
3.3. Results and Discussion
3.3.1 Nanoparticle Characterization
TQ-loaded PLGA nanoparticles were synthesized by emulsification evaporation using
molecular micelles as emulsifiers. In our previous studies, molecular micelles demonstrated
excellent emulsifying properties offering uniform and nanometer size nanoparticles. In addition,
nanoparticle high surface charge conferred by molecular micelles allowed enhanced stability in
aqueous solution.51 The physico-chemical properties of TQ-loaded nanoparticles prepared with
molecular micelles as emulsifiers are presented in Table 3.1. TQ-loaded PLGA nanoparticle
sizes ranged from 123.5 to 187.4 nm, depending on the micelle structure. The particle sizes for
nanoparticles emulsified with poly-SHG and poly-SUV were significantly higher (p-value =
0.05) than the other nanoparticles. It should be mentioned that micelles with short carbon chain
(C7) such as poly-SHG were likely more flexible and less hydrophobic than micelles containing
longer carbon chains (C11) such as poly-SUG. Therefore, their interactions with PLGA were
likely reduced leading to an increase in particle size. In addition, micelles having larger
hydrophilic head groups such as poly-SUV likely preferred in the aqueous phase as compared to
organic phase. Such interactions likely lead to an increase in particle size as well. For closely

83
related molecular micelles such as poly-SDG, poly-SUG, and poly-SUA, the particle size
remained approximately the same. In contrast, polydispersity indicated by polydispersity index
(PDI) remained constant and below 0.100, indicating monodisperse nanoparticle suspensions for
all micelles. In addition, molecular micelles conferred high negative charge on the nanoparticle
surface as indicated by the values of zeta potential. Statistical analysis revealed that both the PDI
and zeta potential remained unchanged (p-value = 0.05) regardless of the investigated emulsifier.
Table 3.1 Physico-chemical properties of TQ-loaded PLGA nanoparticles (n=4)
Emulsifier Size PDI Zeta potential
(mV)
Poly-SHG 177.7 ± 9.7 0.054 ± 0.010 -60.8 ± 2.6
Poly-SDG 146.5 ± 19.5 0.083 ± 0.024 -59.1 ± 4.8
Poly-SUG 164.1 ± 15.5 0.083 ± 0.003 -60.0 ± 5.2
Poly-SUA 149.3 ± 9.5 0.071 ± 0.012 -60.7 ± 3.1
Poly-SUL 144.8 ± 21.3 0.061 ± 0.011 -62.4 ± 1.9
Poly-SUV 173.1 ± 8.8 0.091 ± 0.070 -60.9 ± 8.0
Note: Other conditions were PLGA (100 mg); TQ (15 mg), and
emulsifier (0.5% w/v).
Furthermore, TQ-loaded PLGA nanoparticles presented uniform well-defined spherical
shape as shown in Figure 3.3. Our results indicated that all molecular micelles used in this study
provided excellent emulsifier properties, leading to small monodisperse particle size, highly
negative surface charge, and uniform spherical shapes.
3.3.2 Optimization of TQ Entrapment Efficiency
The entrapment efficiency of TQ-loaded nanoparticles was investigated using a Box-
Behnken optimization design. Compared with other designs, Box-Behnken design presents

84
several advantages such as pre-established limits of design variables, and a reduced number of
experiments 58. The experimental design involved fifteen experiments including three central
level experiments for reproducibility purposes. The design allowed an investigation of the
simultaneous effects of PLGA amount (mg), TQ amount (mg), and poly-SUG concentration (%
w/v) (design variables) on the entrapment efficiency (response). The limits of design variable
ranges were selected based on preliminary experiments that indicated that TQ is more
compatible with high molecular weight polymers than low molecular weight polymers. In
addition, we found that drug precipitation occurred at a drug loading higher than 25 mg.
therefore, in our further experiments, high molecular weight PLGA polymer (MW 66-107 kDa)
and a drug loading less than 25 mg were used.
Figure 3.3 Transmission electron micrograph of TQ-loaded PLGA nanoparticles
(magnification 33,000x) prepared with poly-SHG.
In addition, poly-SUG was selected as emulsifier for optimization due to its high
availability, and easy synthesis. Detailed experimental conditions are presented in Table 3.2. For
all experiments included in the Box-Behnken optimization design, the particle size of TQ-loaded
PLGA nanoparticles containing various amounts of TQ varied between approximately 123 and
167 nm, likely due to various amounts of poly-SUG used in each formulation. Monodisperse
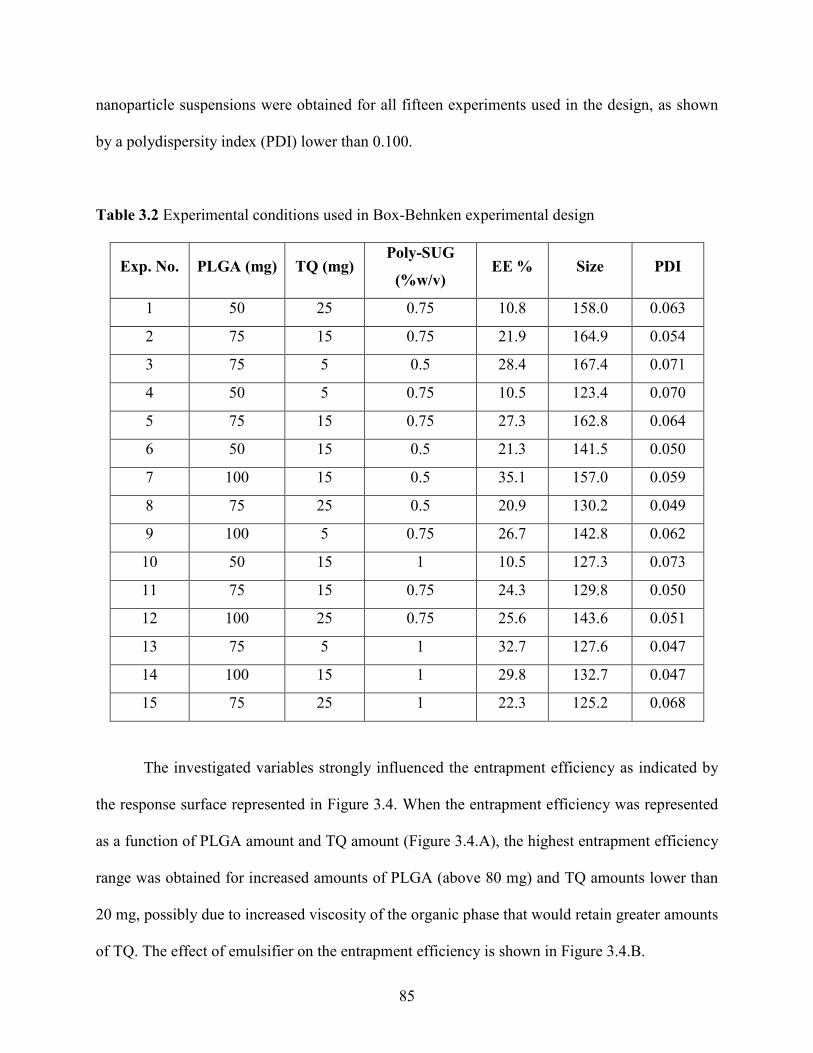
85
nanoparticle suspensions were obtained for all fifteen experiments used in the design, as shown
by a polydispersity index (PDI) lower than 0.100.
Table 3.2 Experimental conditions used in Box-Behnken experimental design
Exp. No. PLGA (mg) TQ (mg) Poly-SUG
(%w/v) EE % Size PDI
1 50 25 0.75 10.8 158.0 0.063
2 75 15 0.75 21.9 164.9 0.054
3 75 5 0.5 28.4 167.4 0.071
4 50 5 0.75 10.5 123.4 0.070
5 75 15 0.75 27.3 162.8 0.064
6 50 15 0.5 21.3 141.5 0.050
7 100 15 0.5 35.1 157.0 0.059
8 75 25 0.5 20.9 130.2 0.049
9 100 5 0.75 26.7 142.8 0.062
10 50 15 1 10.5 127.3 0.073
11 75 15 0.75 24.3 129.8 0.050
12 100 25 0.75 25.6 143.6 0.051
13 75 5 1 32.7 127.6 0.047
14 100 15 1 29.8 132.7 0.047
15 75 25 1 22.3 125.2 0.068
The investigated variables strongly influenced the entrapment efficiency as indicated by
the response surface represented in Figure 3.4. When the entrapment efficiency was represented
as a function of PLGA amount and TQ amount (Figure 3.4.A), the highest entrapment efficiency
range was obtained for increased amounts of PLGA (above 80 mg) and TQ amounts lower than
20 mg, possibly due to increased viscosity of the organic phase that would retain greater amounts
of TQ. The effect of emulsifier on the entrapment efficiency is shown in Figure 3.4.B.
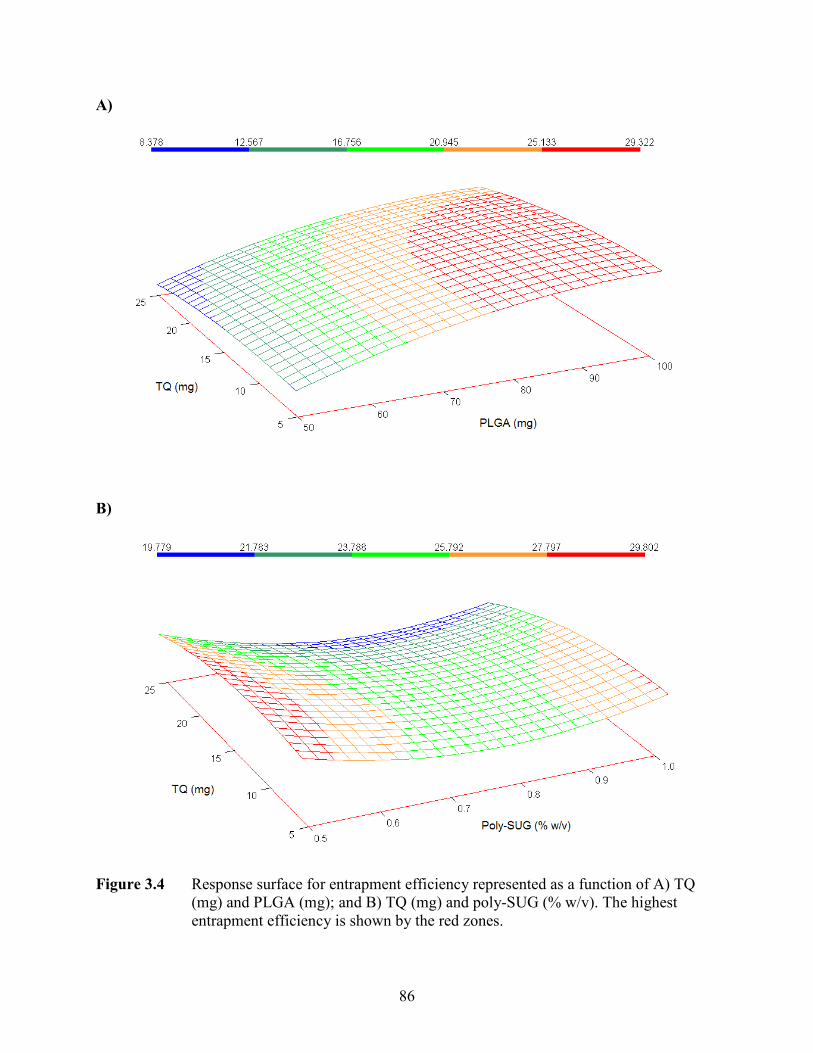
86
A)
B)
Figure 3.4 Response surface for entrapment efficiency represented as a function of A) TQ
(mg) and PLGA (mg); and B) TQ (mg) and poly-SUG (% w/v). The highest
entrapment efficiency is shown by the red zones.

87
The entrapment efficiency increased with the decrease of poly-SUG concentration. The
highest entrapment efficiency was obtained for poly-SUG concentrations lower than 0.55 % w/v.
Larger values of entrapment efficiency were obtained for a poly-SUG concentrations higher than
0.55 % w/v as well. It should be noted that molecular micelles have the ability to incorporate
hydrophobic compounds 56, 59-61
In molecular micelle-assisted nanoparticle synthesis, a biphasic
system containing a micellar aqueous solution and an organic polymeric phase was involved.
Therefore, the partition of the drug between the two phases likely affected the drug entrapment
into the polymeric matrix.
When molecular micelles are present at the aqueous-organic interface in order to stabilize
the emulsion, they would likely incorporate a portion of the TQ. Such TQ portion was eliminated
in the precipitation and purification steps by centrifugation. In addition, the TQ phase partition
can be changed towards organic phase by decreasing the molecular micelle concentration.
However, the decrease is limited by the minimum micelle concentration necessary for synthesis
of stable, and uniform particle sizes. Therefore, we found that the maximum entrapment
efficiency was obtained for 100 mg PLGA, 15 mg TQ and 0.5 % w/v poly-SUG, and these
conditions were considered as optimum for further experiments.
Multivariate regression was used to correlate the investigated design variables with the
entrapment efficiency. A quadratic model was constructed based on experimental data and is
described by equation 3.1:
EE% = b0+b1[PLGA]+b2[TQ]+b3[MM]+b4[PLGA]2+b5[TQ]
2+b6[MM]
2 3.1
where EE% is the entrapment efficiency, described above; [PLGA] is the amount of PLGA (mg);
[TQ] is the amount of TQ (mg); [MM] is the emulsifier concentration (% w/v); b0 is the
intercept; and b1- b6 are the correlation coefficients for each of the equation terms.

88
Analysis of variance (ANOVA) was further used to establish the significance of design
variables and their interactions with the response. The results of analysis of variance of the
regression model are presented in Table 3.3. The design variables were considered significant for
a p-value lower than 0.05. ANOVA results indicated that the most significant variable
influencing the entrapment efficiency is the PLGA amount (p-value 0.0004), followed by TQ
amount and molecular micelle concentration.
Table 3.3 Analysis of variance for Box-Behnken model
Variables p-value b-coefficients
Intercept 0.2653 b0 7.905
[PLGA] 0.0004 b1 0.32
[TQ] 0.1278 b2 -0.234
[MM] 0.3731 b3 -5.203
[PLGA]2 0.0823 b4 -2.303
[TQ]2 0.3335 b5 -1.194
[MM]2 0.1053 b6 2.118
In addition, validation of the regression model was achieved by comparing the predicted
response with the response values of the central samples of the design as well as independent
optimum experiments separated from the experimental design. The predicted and the
experimental entrapment efficiencies as well as the levels of the investigated variables are
presented in Table 3.4. It can be noted that the predicted and measured values were identical for
central samples presenting a percent relative error of 0.00 % and good predictive ability of the

89
model. In case of experiments performed at the optimum conditions, the percent relative error
was 2.39 % suggesting high predictability of the model.
Table 3.4 Predictability of Box-Behnken model
Experiments PLGA
(mg)
TQ
(mg)
Poly-SUG
(%w/v)
Predicted
EE%
Measured
EE% % RE
Central 75 15 0.75 24.49 24.49 0.00
Optimum 100 15 0.5 33.46 34.26 2.39
Note: Percent relative error (% RE) = 100*(Predicted EE – Measured EE)/Predicted EE;
EE = entrapment efficiency
3.3.3 The Effect of Molecular Micelles on the Entrapment Efficiency
In order to evaluate the effect of the molecular micelles on entrapment efficiency of TQ-
loaded PLGA nanoparticles, the short chain molecular micelles poly-SHG and poly-SDG as well
as micelles having various amino acid head group such as poly-SUA, poly-SUL, and poly-SUV
were used as emulsifiers. The nanoparticles were synthesized using optimum conditions as
determined using Box-Behnken design: 100 mg PLGA, 15 mg TQ, and 0.5 % w/v emulsifier,
respectively. The values of TQ entrapment efficiency for TQ-loaded PLGA nanoparticles
prepared with various micelles are presented in Table 3.5. The values of entrapment efficiency
were similar for all molecular micelles, regardless of their structure, indicating that the type of
the micelle was not a significant factor in the Box Behnken optimization design.
3.3.4 Release Profile of Optimized TQ-loaded PLGA Nanoparticles
TQ-loaded PLGA nanoparticles were synthesized at the optimum conditions using
various molecular micelles as emulsifiers. The TQ release from these nanoparticles was
investigated for a period of 72 hours.

90
Table 3.5 Effect of emulsifier on entrapment efficiency of TQ-loaded PLGA nanoparticles
(n=4)
Emulsifier Poly-SHG Poly-SDG Poly-SUG Poly-SUA Poly-SUL Poly-SUV
EE% 32.09 ±
2.85
34.63 ±
2.96
34.26 ±
1.08
33.69 ±
4.72
35.17 ±
4.90
37.20 ±
8.65
The release occurred based on the diffusion of TQ from the TQ-loaded nanoparticles
placed in a dialysis bag to an external aqueous phase. The release profiles for the first 8 hours are
shown in Figure 3.5. It was observed that the TQ release levels were strongly influenced by the
emulsifier used in the nanoparticle synthesis. TQ-loaded nanoparticles had a release of 30-60%
for the first hour depending on the emulsifier while a control sample containing equivalent TQ
showed a release level of 80% within the same period of time. However, all nanoparticle
formulations showed a rapid release in the first 8 hours with similar release rates followed by a
plateau at different release levels. It is possible that TQ was not uniformly distributed in the
nanoparticle matrix, a portion being situated near the surface of the nanoparticles rather than
inside, and therefore leading to a rapid release in the first hours.
The nanoparticles prepared with poly-SHG and poly-SUG showed a similar release of
approximately 75% of the drug for the same period of time (8 hours). Thus, a shorter carbon
chain of the molecular micelles did not change the release profile. The lowest released amount
was given by the nanoparticles prepared with poly-SUA. Varying the amino acid head group of
the micelles from alanine to valine resulted in higher release level for poly-SUV-emulsified
nanoparticles as compared to poly-SUA. In addition, it is possible that molecular micelles with
longer carbon chains adhered stronger to the nanoparticle surface as compared with shorter
carbon chains. Furthermore, the interface micelle layer could be of a different density in case of
poly-SUA as compared with poly-SUG likely determining a slower release.
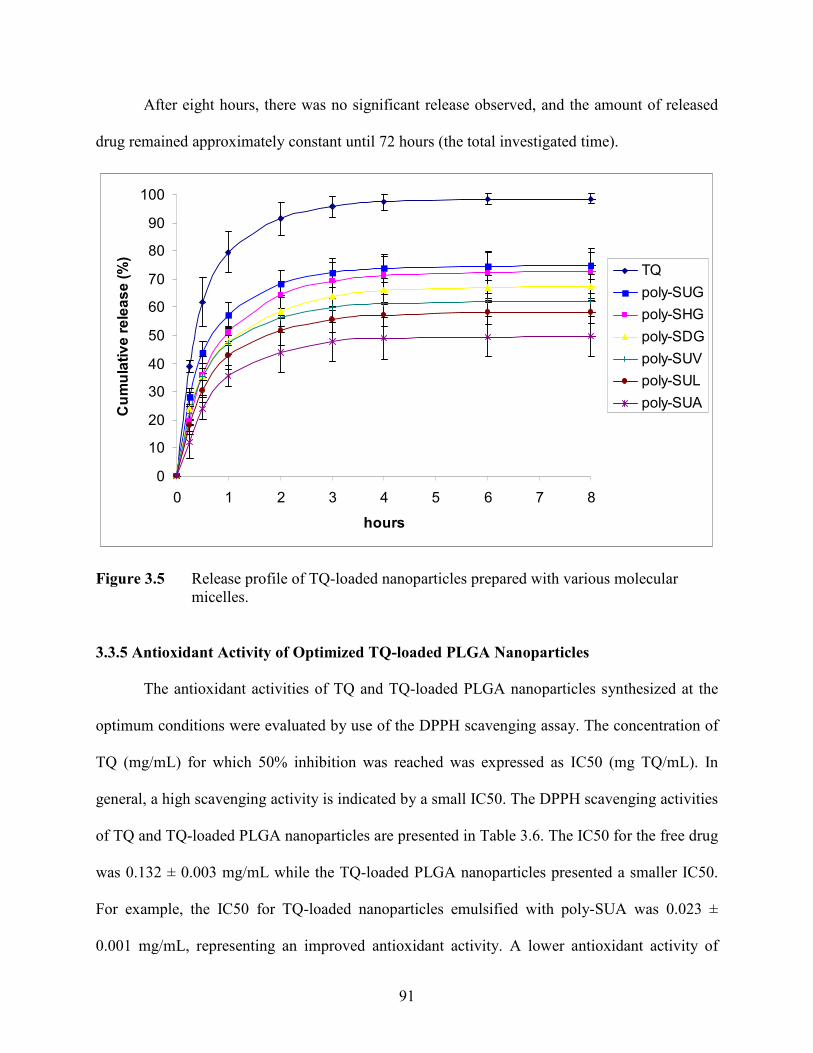
91
After eight hours, there was no significant release observed, and the amount of released
drug remained approximately constant until 72 hours (the total investigated time).
0
10
20
30
40
50
60
70
80
90
100
0 1 2 3 4 5 6 7 8
hours
Cumulative release (%)
TQ
poly-SUG
poly-SHG
poly-SDG
poly-SUV
poly-SUL
poly-SUA
Figure 3.5 Release profile of TQ-loaded nanoparticles prepared with various molecular
micelles.
3.3.5 Antioxidant Activity of Optimized TQ-loaded PLGA Nanoparticles
The antioxidant activities of TQ and TQ-loaded PLGA nanoparticles synthesized at the
optimum conditions were evaluated by use of the DPPH scavenging assay. The concentration of
TQ (mg/mL) for which 50% inhibition was reached was expressed as IC50 (mg TQ/mL). In
general, a high scavenging activity is indicated by a small IC50. The DPPH scavenging activities
of TQ and TQ-loaded PLGA nanoparticles are presented in Table 3.6. The IC50 for the free drug
was 0.132 ± 0.003 mg/mL while the TQ-loaded PLGA nanoparticles presented a smaller IC50.
For example, the IC50 for TQ-loaded nanoparticles emulsified with poly-SUA was 0.023 ±
0.001 mg/mL, representing an improved antioxidant activity. A lower antioxidant activity of

92
nanoparticles was obtained for poly-SHG (IC50 = 0.107 ± 0.020 mg/mL), but comparable with
the one of free TQ.
In addition, Trolox Equivalents were calculated based on the ratio between IC 50 of
Trolox and the IC50 of each sample. A high Trolox Equivalents number indicates a high
antioxidant activity as compared to a powerful antioxidant such as Trolox. Similarly, Trolox
Equivalents were the highest for poly-SUA (753.73 ± 18.39 µmol Trolox/g TQ), closely
followed by poly-SUV–emulsified nanoparticles (597.48 ± 42.96 µmol Trolox/g TQ).
Table 3.6 DPPH scavenging activity of TQ and TQ-loaded PLGA nanoparticles (n=3)
Sample IC50
(mg/mLTQ)
Trolox Equivalents
(µmol Trolox/g TQ)
TQ 0.132 ± 0.003 132.25 ± 4.22
Poly-SHG 0.107 ± 0.020 168.56 ± 29.91
Poly-SDG 0.044 ± 0.004 404.36 ± 32.99
Poly-SUG 0.052 ± 0.002 341.65 ± 14.07
Poly-SUA 0.023 ± 0.001 753.73 ± 18.39
Poly-SUL 0.036 ± 0.005 494.74 ± 69.38
Poly-SUV 0.030 ± 0.002 597.48 ± 42.96
In addition, we observed that the DPPH scavenging activity inversely correlated with the
release profile of TQ-loaded nanoparticles, as the slowest release of poly-SUA–emulsified
nanoparticles had shown the highest antioxidant activity. It should be mentioned that DPPH
radical is not soluble in water, and likely can diffuse into a more hydrophobic environment
offered by nanoparticles. Therefore, assuming that the reaction with DPPH radicals can take
place inside the PLGA nanoparticles, it is possible that the TQ present in the PLGA nanoparticle
93
environment had better solubility in case of poly-SUA as compared to other micelles. However,
all TQ-loaded nanoparticles showed improved DPPH scavenging activity as compared with free
TQ indicating that such nanoparticle systems could be excellent candidates as free radical
scavengers.
3.3.6 Cytotoxicity of TQ and Optimized TQ-loaded PLGA Nanoparticles
In general, cell viability refers to the number of cells that remain viable after the
treatment with a drug or drug delivery system. Cytotoxicity is the property of a drug that induces
cell death, preferably in cancer cells for anticancer drugs. Cytotoxic properties of drugs and drug
delivery systems are typically measured by cell viability assays. In this study, MTS assay was
used to evaluate the cell viabilities of TQ and optimized TQ-loaded PLGA nanoparticles for
normal breast cells (Hs578Bct), and cancer breast cells (MCF-7 and MDA-MB-231) at 24, 48
and 72 hours. In cytotoxicity studies of polymeric nanoparticles, several important aspects
should be taken into consideration. First, the components of nanoparticles, including the
polymer, the drug, and the emulsifier should not present any toxicity against both normal and
cancer cells. Second, the desired effect for cancer cells is typically to obtain low cell viability
within a short period of time, using drug concentrations that should not significantly affect the
viability of normal cells.
Cell viability results for normal breast (Hs578Bct), and cancer breast cells (MCF-7 and
MDA-MB-231) in the presence of TQ are presented in Figure 3.6. It can be noticed that a low
concentration of free TQ (50 µM) did not affect cell viability of both normal and cancer cells
irrespective of incubation time (24, 48 and 72 hours). However, at an increased concentration of
TQ (200 µM), the cell viability critically decreased to 12.03 ± 0.67 % for normal cells in the first
24 hours, and remained fairly constant afterwards (48 and 72 hours). This like suggests that such
high TQ concentration was toxic to the cells.

94
Figure 3.6 Cell viability of A) Hs578Bct normal breast cells; B) MCF-7 breast cancer cells;
and C) MDA-MB-231 breast cancer cells incubated with TQ.
MDA cells - TQ
0
20
40
60
80
100
120
0 24 48 72
hours
cell viability %
TQ50µM
TQ100µM
TQ200µM
MCF-7 cells - TQ
0
20
40
60
80
100
120
0 24 48 72
hours
cell viability %
TQ50µM
TQ100µM
TQ200µM
Normal cells - TQ
0
20
40
60
80
100
120
140
0 24 48 72
hours
cell viability %
TQ50µM
TQ100µM
TQ200µM
B
A
C

95
In the case of cancer cells, low concentrations of TQ (50 and 100 µM) did not have a
significant reduction in the cell viability for both MCF-7 and MDA-MB-231 cancer cells within
the investigated period of time (72 hours). However, when the TQ concentration increased to
200µM, the MCF-7 cell viability decreased to 27.29 ± 6.52 % after 24 hours, and slightly
increased to 37.42 ± 4.83 % after 72 hours. With regard to MDA-MB-231 cancer cells, the
viability decreased progressively in time to 45.5 ± 8.58 % after 72 hours for 200 µM TQ
indicating that such cells are more resistant to TQ treatment than MCF-7 cells. Although a high
dosage of TQ (200 µM) was useful for breast cancer inhibition, it was toxic to normal cells. Such
effects were not desirable because at this concentration the toxicity of TQ was higher for normal
cells than for cancer cells.
Optimized TQ-loaded PLGA nanoparticles as well as blank nanoparticles prepared
without TQ and (containing an average of 279.1 ± 47.7 µM TQ) were also incubated with normal
breast cells (Hs578Bct) and cancer breast cells (MCF-7 and MDA-MB-231). The cell viabilities
of normal cells in the presence of blank and TQ-loaded nanoparticles are presented in Figure 3.7.
The lowest cell viabilities were obtained for poly-SUL - emulsified blank nanoparticles (71.52 ±
2.11 %), followed closely by poly-SUA - emulsified blank nanoparticles (72.14 ± 4.61 %) at 72
hours. It can be noted that cell viability remained above 90 % for all blank nanoparticles
emulsified with the other molecular micelles used in this study, irrespective of emulsifier. This
indicates that the polymer and the emulsifier had no cytotoxic effect on normal cells. In the case
of TQ – loaded nanoparticles incubated with normal cells, the cell viability decreased
progressively in time from ~ 80 – 100 % after 24 hours to ~ 40 – 80% after 48 hours. After 72
hours, the lowest cell viability was obtained for poly-SDG–emulsified nanoparticles (30.95 ±
7.48 %) and poly-SUL–emulsified nanoparticles (37.05 ± 13.29 %). This effect was not observed
for empty nanoparticles emulsified with the same molecular micelles.

96
Figure 3.7 Cell viability of Hs578Bct normal breast cells in the presence of blank and TQ-
loaded nanoparticles.
Normal cells - 24 hours
0
40
80
120
160
poly-SHG poly-SDG poly-SUG poly-SUA poly-SUL poly-SUV
Blank nanoparticles TQ-nanoparticles
Normal cells - 48 hours
0
40
80
120
160
poly-SHG poly-SDG poly-SUG poly-SUA poly-SUL poly-SUV
Blank nanoparticles TQ-nanoparticles
Normal cells - 72 hours
0
40
80
120
160
poly-SHG poly-SDG poly-SUG poly-SUA poly-SUL poly-SUV
Blank nanoparticles TQ-nanoparticles

97
Therefore, the decrease in the cell viability was likely due to nanoparticle cell uptake and
TQ release in the cellular media. In contrast, poly-SUV emulsified TQ-loaded nanoparticles
provided the highest cell viability (85.79 ± 7.04 %) after 72 hours having the desired effect of
low toxicity for normal cells.
The results for cell viability of MCF-7 and MDA-MB-231 cancer cells incubated with
TQ-loaded nanoparticles are presented in Figure 3.8. For these nanoparticles, we did not observe
a significant decrease in the cell viability after 24 and 48 hours for any of the nanoparticles. Such
effect can be determined by insufficient cellular uptake and metabolism of the cells after the
incubation with nanoparticles. We observed an overgrowth of both cancer cell lines incubated
with TQ-loaded poly-SDG–emulsified nanoparticles. Similar effect was observed in case of
blank poly-SDG–emulsified nanoparticles incubated with the cancer cells, indicating that such
effect is likely induced by the emulsifier and not by the entrapped TQ. The MCF-7 cell viability
decreased for all TQ-loaded nanoparticles at 72 hours. The lowest cell viability was obtained for
poly-SUL–emulsified nanoparticles (43.26 ± 9.45 %), which is comparable with that obtained
for equivalent free TQ (37.42 ± 4.83 %). For MDA-MB-231 breast cancer cells incubated with
poly-SUL–emulsified nanoparticles, the cell viability was slightly higher (59.16 ± 4.52 %) than
for MCF-7 cells, likely due to the drug-resistance of such cells. However, it should be noted that
TQ-loaded nanoparticles emulsified with poly-SUV reached a cell viability of 68.47 ± 8.42 % for
MDA-MB-231 cells, while the cell viability was higher for normal cells (85.79 ± 7.04 %) treated
with the same nanoparticles. Although TQ-loaded nanoparticles emulsified with poly-SUV did
not affect the cell viability of MCF-7 cells, their performance was improved for MDA-MB-231
cells. Considering that free TQ generated a low cell viability for both normal and cancer cells,
TQ-loaded nanoparticles emulsified with poly-SUV can be potentially used as drug delivery
systems for breast cancer inhibition.

98
Figure 3.8 Cell viability of MCF-7 cancer cells (left); and MDA-MB-231 cancer cells (right)
incubated with blank PLGA nanoparticles and TQ-loaded PLGA nanoparticles
3.4 Conclusions
TQ-loaded PLGA nanoparticles were successfully synthesized by use of an
emulsification solvent evaporation technique using various molecular micelles as emulsifiers.
The TQ entrapment efficiency was optimized using a Box-Behnken experimental design, and the
MCF-7 cells - 48h
0
40
80
120
160
poly-SHG poly-SDG poly-SUG poly-SUA poly-SUL poly-SUV
Blank nanoparticles TQ nanoparticles
MCF-7 cells - 72h
0
40
80
120
160
poly-SHG poly-SDG poly-SUG poly-SUA poly-SUL poly-SUV
Blank nanoparticles TQ nanoparticles
MDA cells - 24h
0
40
80
120
160
poly-SHG poly-SDG poly-SUG poly-SUA poly-SUL poly-SUV
Blank nanoparticles TQ nanoparticles
MDA cells - 48h
0
40
80
120
160
poly-SHG poly-SDG poly-SUG poly-SUA poly-SUL poly-SUV
Blank nanoparticles TQ nanoparticles
MDA cells - 72h
0
40
80
120
160
poly-SHG poly-SDG poly-SUG poly-SUA poly-SUL poly-SUV
Blank nanoparticles TQ nanoparticles
MCF-7 cells - 24h
0
40
80
120
160
poly-SHG poly-SDG poly-SUG poly-SUA poly-SUL poly-SUV
Blank nanoparticles TQ nanoparticles

99
optimum synthetic conditions such as PLGA amount, TQ amount, and emulsifier concentration
were obtained for maximum entrapment efficiency.
The molecular micelles strongly influenced the TQ release profile, the antioxidant and
cytotoxic properties of TQ-loaded PLGA nanoparticles. Molecular micelles offered high
flexibility to nanoparticle physico-chemical and biological properties and, therefore, can be used
in the synthesis of drug-loaded nanoparticles depending on the desired properties. In addition,
such nanoparticles are promising as free radical scavengers and inhibitors of breast cancer cells.
3.5. References
1 Dalle-Donne, I.; Rossi, R.; Colombo, R.; Giustarini, D.; Milzani, A. Clinical Chemistry
2006, 52, 601-623.
2 Molavi, B.; Mehta Jawahar, L. Current Opinion in Cardiology 2004, 19, 488-493.
3 Passi, S.; Gianni, G.; Cocchi, M. Progress in Nutrition 2006, 8, 241-256.
4 Manea, A.; Constantinescu, E.; Popov, D.; Raicu, M. Journal of Cellular and Molecular
Medicine 2004, 8, 117-126.
5 Goetz, M. E.; Luch, A. Cancer Letters 2008, 266, 73-83.
6 Afonso, V.; Champy, R.; Mitrovic, D.; Collin, P.; Lomri, A. Joint, Bone, Spine 2007, 74,
324-329.
7 Sorg, O. Comptes Rendus Biologies 2004, 327, 649-662.
8 Kohen, R.; Nyska, A. Toxicologic Pathology 2002, 30, 620-650.
9 Pokorny, J.; Yanishlieva, N.; Gordon, M. Antioxidants in food 2001, CRC Press LLC,
Boca Raton, Forida, 87-249.
10 Bland, J. S. Alternative Therapies 1996, 2, 73-76.
11 Zhou, B.; Liu, Z.-L. Pure Applied Chemistry 2005, 77, 1887-1903.
12 Borek, C. Integrative Cancer Therapies 2004, 3, 333-341.
13 Garewal, H. S. Antioxidants and disease prevention 1997, CRC Press LLC, Boca Raton,
Florida, 3-177.
14 Milbury, P. E.; Richer, A. C. Understanding the antioxidant controversy: scrutinizing the
"fountain of youth" 2008, Praeger Publishers, Westport, Connecticut, 1-14.

100
15 Parada, J.; J.M., A. Journal of Food Science 2007, 7, R21-R32.
16 Shoji, Y.; Nakashima, H. Journal of Drug Targeting 2004, 12, 385-391.
17 Kaur, I. P.; Kapila, M.; Agrawal, R. Ageing Research Reviews 2007, 6, 271-288.
18 Dziubla, T.; Muro, S.; Muzykantov, V. R.; Koval, M. Oxidative Stress, Disease and
Cancer 2006, 1023-1043.
19 Sheu, S. S.; Nauduri, D.; Anders, M. W. Biochimica Et Biophysica Acta-Molecular Basis
of Disease 2006, 1762, 256-265.
20 Ratnam, D. V.; Ankola, D. D.; Bhardwaj, V.; Sahana, D. K.; Kumar, M. Journal of
Controlled Release 2006, 113, 189-207.
21 Wu, T. H.; Yen, F. L.; Lin, L. T.; Tsai, T. R.; Lin, C. C.; Cham, T. M. International
Journal of Pharmaceutics 2008, 346, 160-168.
22 Zhang, Y.; Yang, Y.; Tang, K.; Hu, X.; Zou, G. Journal of Applied Polymer Science
2008, 107, 891-897.
23 Bala, I.; Bhardwaj, V.; Hariharan, S.; Sitterberg, J.; Bakowsky, U.; Kumar, M.
Nanotechnology 2005, 16, 2819-2822.
24 Bala, I.; Bhardwaj, V.; Hariharan, S.; Kharade, S. V.; Roy, N.; Kumar, M. N. V. R.
Journal of Drug Targeting 2006, 14, 27-34.
25 Bisht, S.; Feldmann, G.; Soni, S.; Ravi, R.; Karikar, C.; Maitra, A.; Maitra, A. Journal of
Nanobiotechnology 2007, 5:3, 1-18.
26 Kurzrock, R.; Li, L.; Mehta, K.; Aggarwai, B. B.; Liposomal curcumin for treatment of
cancer: WO/2004/080396, 2004, pp 66.
27 Trumpower, B. L. Journal of Bioenergetics and Biomembranes 1981, 13, 1-24.
28 Gutierrez, P. L. Frontiers in Bioscience 2000, 5, 629-638.
29 Horvath, R.; Gorman, G.; Chinnery, P. F. Neurotherapeutics 2008, 5, 558-568.
30 Quinzii, C. M.; Lopez, L. C.; Naini, A.; DiMauro, S.; Hirano, A. Biofactors 2008, 32,
113-118.
31 Ankola, D. D.; Viswanad, B.; Bhardwaj, V.; Ramarao, P.; Ravi Kumar, M. N. V.
European Journal of Pharmaceutics and Biopharmaceutics 2007, 67, 361-369.
32 Hsu, C.-H., Coenzyme Q10 nanoparticles engineered from microemulsion precursors for
oral delivery, 2004.
33 Nehilla, B. J.; Bergkvist, M.; Popat, K. C.; Desai, T. A. International Journal of
Pharmaceutics 2008, 348, 107-114.

101
34 Alcain, F. J.; Villalba, J. M. Expert Opinion on Therapeutic Patents 2007, 17, 649-665.
35 Neckers, L.; Neckers, K. Expert Opin Emerg Drugs 2005, 10, 137-149.
36 Dettrakul, S.; Surerum, S.; Rajviroongit, S.; Kittakoop, P. Journal of Natural Products
2009, 72, 861-865.
37 Muhammad, I.; Takamatsu, S.; Walker, L. A.; Mossa, J. S.; Fong, H. H. S.; El-Feraly, F.
S. Phytotherapy Research 2003, 17, 887-891.
38 Snader, K. M. Anticancer agents from natural products 2005, CRC Press Boca Raton,
Florida, 339-356.
39 Salem, M. L. International Immunopharmacology 2005, 5, 1749-1770.
40 Badary, O. A.; Taha, R. A.; El-Din, A. M. G.; Abdel-Wahab, M. H. Drug and Chemical
Toxicology 2003, 26, 87-98.
41 Burits, M.; Bucar, F. Phytotherapy Research 2000, 14, 323-328.
42 Badary, O. A.; Abdel-Naim, A. B.; Adel-Wahab, M. H.; Hamada, F. M. A. Toxicology
2000, 143, 219-226.
43 Nagi, M. N.; Mansour, M. A. Pharmacological Research 2000, 41, 283-289.
44 Gali-Muhtasib, H.; Roessner, A.; Schneider-Stock, R. International Journal of
Biochemistry & Cell Biology 2006, 38, 1249-1253.
45 Shoieb, A. M.; Elgayyar, M.; Dudrick, P. S.; Bell, J. L.; Tithof, P. K. International
Journal of Oncology 2003, 22, 107-113.
46 Gali-Muhtasib, H.; Diab-Assaf, M.; Boltze, C.; Al-Hmaira, J.; Hartig, R.; Roessner, A.;
Schneider-Stock, R. International Journal of Oncology 2004, 25, 857-866.
47 Scifinder Scifinder Scholar, Advanced Chemistry Development (ACD/Labs) software,
V8.14 for Solaris 2007, accessed September 2007.
48 Badary, O. A.; Al-Shabanah, O. A.; Nagi, M. N.; Al-Bekairi, A. M.; Elmazar, M. M. A.
Drug Development Research 1998, 44, 56-61.
49 Ali, B. H.; Blunden, G. Phytotherapy Research 2003, 17, 299-305.
50 Esmaeili, F.; Ghahremani, M. H.; Esmaeili, B.; Khoshayand, M. R.; Atyabi, F.;
Dinarvand, R. International Journal of Pharmaceutics 2008, 349, 249-255.
51 Ganea, G. M.; Sabliov, C. M.; Ishola, A. O.; Fakayode, S. O.; Warner, I. M. Journal of
Nanoscience and Nanotechnology 2008, 8, 280-292.
52 Zhao, Y. F.; Sugiyama, S.; Miller, T.; Miao, X. G. Expert Review of Medical Devices
2008, 5, 395-405.

102
53 Macossay, J.; Shamsi, S. A.; Warner, I. M. Tetrahedron Letters 1999, 40, 577-580.
54 Akbay, C.; Gill, N. L.; Powe, A.; Warner, I. M. Electrophoresis 2005, 26, 415-425.
55 Billiot, F. H.; Billiot, E. J.; Warner, I. M. Journal of Chromatography A 2001, 922, 329-
338.
56 Thibodeaux, S. J.; Billiot, E.; Warner, I. M. Journal of Chromatography A 2002, 966,
179-186.
57 Akbay, C.; Gill, N. L.; Agbaria, R. A.; Warner, I. M. Electrophoresis 2003, 24, 4209-
4220.
58 Govender, S.; Pillay, V.; Chetty, D. J.; Essack, S. Y.; Dangor, C. M.; Govender, T.
International Journal of Pharmaceutics 2005, 306, 24-40.
59 Akbay, C.; Gill, N. L.; Warner, I. M. Electrophoresis 2007, 28, 1752-1761.
60 Shamsi, S. A.; Palmer, C. P.; Warner, I. M. Analytical Chemistry 2001, 73, 140A-149A.
61 Valle, B. C.; Morris, K. F.; Fletcher, K. A.; Fernand, V.; Sword, D. M.; Eldridge, S.;
Larive, C. K.; Warner, I. M. Langmuir 2007, 23, 425-435.

103
CHAPTER 4
FLUORESCENT RATIOMETRIC MOLECULAR MICELLE - MODIFIED
POLY(D,L LACTIDE-CO-GLYCOLIDE) NANOPARTICLES
FOR DETECTION OF HYDROXYL RADICALS
4.1 Introduction
Aerobic organisms produce the energy necessary for their life by oxidation of biological
substrates in the presence of oxygen. Complete oxygen reduction takes place in mitochondria
involving a series of redox reactions controlled by a complex enzymatic mechanism. Such
reactions generate radical and non-radical reactive oxygen species, i.e. superoxide anion (O2
•-),
hydroxyl radical (OH•), singlet oxygen
(1O2), and hydrogen peroxide (H2O2). The cells are
exposed to oxidative stress when an unbalance exists between the free radical production of their
elimination by various reducing agents, enzymes, and other antioxidants.1-3
Reactive oxygen
species are involved in many metabolic processes, including signal transduction, carcinogenesis,
and inflammatory response. In addition, excessive production of radical species can lead to
alteration of cellular functions responsible for cardiovascular diseases, neurodegenerative
diseases, diabetes, cancer, joint diseases, and aging.4-9
In the cellular oxidation process, hydroxyl radical can be produced by Fenton and
Habber-Weiss reactions of hydrogen peroxide with transition metals such as iron and copper.2, 8
Hydroxyl radical has a short half-life, and is considered the most aggressive free radical, mainly
due to its high reactivity. It is able to react with lipids, amino acids, proteins, DNA, and sugars at
extremely high rates, leading to cell damage and even cell death.10
Other exogenous sources such
as ozone and ionization radiation lead to hydroxyl radical generation as well.
Reactive oxygen species can be detected by a variety of methods, including electron spin
resonance (ESR), UV-Vis, fluorescence, and luminescence spectroscopy.11
Compared to the
other methods, fluorescence sensors provide several advantages such as high specificity,

104
localized information at the target site, versatility of detection scheme, including fluorescence
spectroscopy and fluorescence microscopy for both in vitro and in vivo detection.12-14
In
particular, coumarin 3-carboxylic acid (C3C) has been used as a fluorescent sensor for detection
of hydroxyl radical.15
The non-fluorescent C3C molecule reacts with hydroxyl radical and
undergoes hydroxylation at position C7 of the coumarin structure, producing a highly fluorescent
compound, 7-hydroxy coumarin 3-carboxylic acid (7-OH C3C) with the emission at 450 nm
when excited in the 400-410 nm region.15-17
In the chemical structure of C3C, the carboxylic
group in the C3 position can be easily coupled with other molecules via a peptide bond.
Therefore, other coumarin derivatives such as the succinimidyl ester of C3C (SECCA),
phospholipid - linked coumarins, and C3C – derivatized amino acids and peptides were used for
the detection of hydroxyl radicals.18-20
Although fluorescent probes have been successfully used to detect hydroxyl radicals,
several limitations should be taken into consideration. For example, the changes in the
fluorescence intensity of a single fluorophore that reacts with a specific radical can be affected
by variations in radical and probe concentrations, instrumental artifacts and sensitivity to other
environmental factors such as temperature and pH. In addition, real time in vivo imaging
becomes challenging if the probe reacts with other molecules present in the cellular media,
undergoes photobleaching or generates other secondary radicals.11
A novel approach for
detection of hydroxyl radicals is the use of fluorescence ratiometric detection that likely reduces
such limitations. In this case, the ratio between the fluorescence intensity of a reporting molecule
and the fluorescence intensity of a reference molecule can be used. Such ratiometric fluorescent
sensors were reported for the detection of hydrogen peroxide and hydroxyl radicals using
coumarin-coupled dyes.21, 22
Another interesting approach is the use of ratiometric nanoparticles.
For example, C3C-coupled polyacrylamide nanoparticles incorporating Texas Red as reference
105
dye were used as ratiometric nanoparticles, and hydroxyl radicals were detected based on the
fluorescence intensity ratio between the two dyes.23
Although such ratiometric sensors were used
for the detection of free radicals, their limited solubility in aqueous media required the use of
organic solvents that can act as radical scavengers. In addition, the compatibility of nanoparticle
sensors with biological samples should be addressed in case of in vitro detection of hydroxyl
radicals.
In this study, we adopted a strategy where biocompatible poly-lactide-co-glycolide
(PLGA) nanoparticles were used as ratiometric fluorescent nanosensors for hydroxyl radical
detection. The design of the ratiometric nanosensor is illustrated in Figure 4.1. Novel lysine-
based molecular micelles containing a C3C moiety as the hydrophilic head group were
synthesized and used as emulsifiers in the synthesis of PLGA nanoparticles by emulsification
solvent evaporation. Such micelles have a polymerized highly hydrophobic core that strongly
interacts with polymeric nanoparticles while the hydrophilic head group remains at the interface
with aqueous solutions. The coumarin moiety is covalently bound to the lysine-based hydrophilic
group that is present exclusively on the surface of the nanosensors and in direct contact with
hydroxyl radicals present in the investigated samples. In order to complete the ratiometric
scheme, neutral red dye was encapsulated into the nanoparticle matrix, protected from potential
side reactions with free radicals. Other nanoparticles containing only C3C moiety or only NeR
dye were also synthesized using emulsification solvent evaporation, and used as controls in the
detection of hydroxyl radicals. The fluorescence intensity ratio between coumarin and neutral red
was dependent on reaction time, nanoparticle concentration, and hydroxyl radical concentration.
In addition, the response of C3C-poly-Nε-SUK – modified NeR – loaded PLGA nanoparticles
was investigated in the presence of other reactive oxygen species such as superoxide anion
radical, hydrogen peroxide, hypochlorite and singlet oxygen. Furthermore, the ratiometric

106
nanoparticles were incubated with MCF-7 breast tumor cells that were exposed to H2O2 –
induced oxidative stress, and the detection of hydroxyl radicals was observed using fluorescence
microscopy.
Figure 4.1 Design of the ratiometric nanosensor.
REFERENCE Dye
Neutral Red
REPORTING Dye 7-OH - C3C-poly-Nε-SUK
•OH

107
4.2 Experimental
4.2.1 Materials
Poly (D,L-lactide-co-glycolide) (PLGA, lactide:glycolide 50:50, MW 40,000-75,000),
sodium dodecyl sulfate (SDS), undecylenic acid, ethyl acetate, trifluoroacetic acid (TFA),
sodium carbonate, coumarin 3-carboxylic acid, Nε-Boc lysine, dimethyl sulfoxide (DMSO),
anhydrous dimethyl formamide (DMF), sucrose, hydrogen peroxide, and neutral red (NeR) were
purchased from Sigma-Aldrich (St. Louis, MO, USA). NeR was neutralized with NaOH in
water, resulting into a red precipitate that was freeze-dried and used further in nanoparticle
synthesis. Dibasic sodium phosphate was purchased from Mallinckrodt (Hazelwood, MO, USA).
N-hydroxysuccinimide (NHS), N,N’-dicyclohexylcarbodiimide (DCC), and cuprous sulfate were
purchased from Fluka (Milwaukee, WI, USA). Dichloromethane (DCM), sodium phosphate
monobasic, isopropyl alcohol, tetrahydrofuran, and hexanes were purchased from EMD
Chemicals Inc. (Gibbstown, NJ, USA). Sodium bicarbonate and sodium hydroxide were
purchased from Fisher Scientific (Pittsburgh, PA, USA). Doubly-distilled deionized water was
obtained from an ELGA PURELAB Ultra water polishing system (US Filter, Lowell, MA,
USA). All reagents were of analytical grade and were used as received.
4.2.2 Synthesis of Coumarin Functionalized Molecular Micelles
The amino acid based molecular micelle poly (sodium N-undecenyl-Nε-Boc lysinate)
(poly- Nε-Boc-SUK) was synthesized according to the procedure described by Macossay et al.24
The deprotection of Boc group was achieved in a mixture of DCM and TFA 1:1 v/v for 4 hours
at room temperature. The synthesis scheme of C3C-poly-Nε-SUK is presented in Figure 4.2. The
first step is represented by the activation of carboxylic group of C3C, resulting in the
succinimidyl ester of C3C (SECCA), according to an modified procedure described by Bardajee
et al.25
The unprotected poly-Nε-SUK (100 mg) was dissolved in sodium carbonate 0.1 M (5mL)
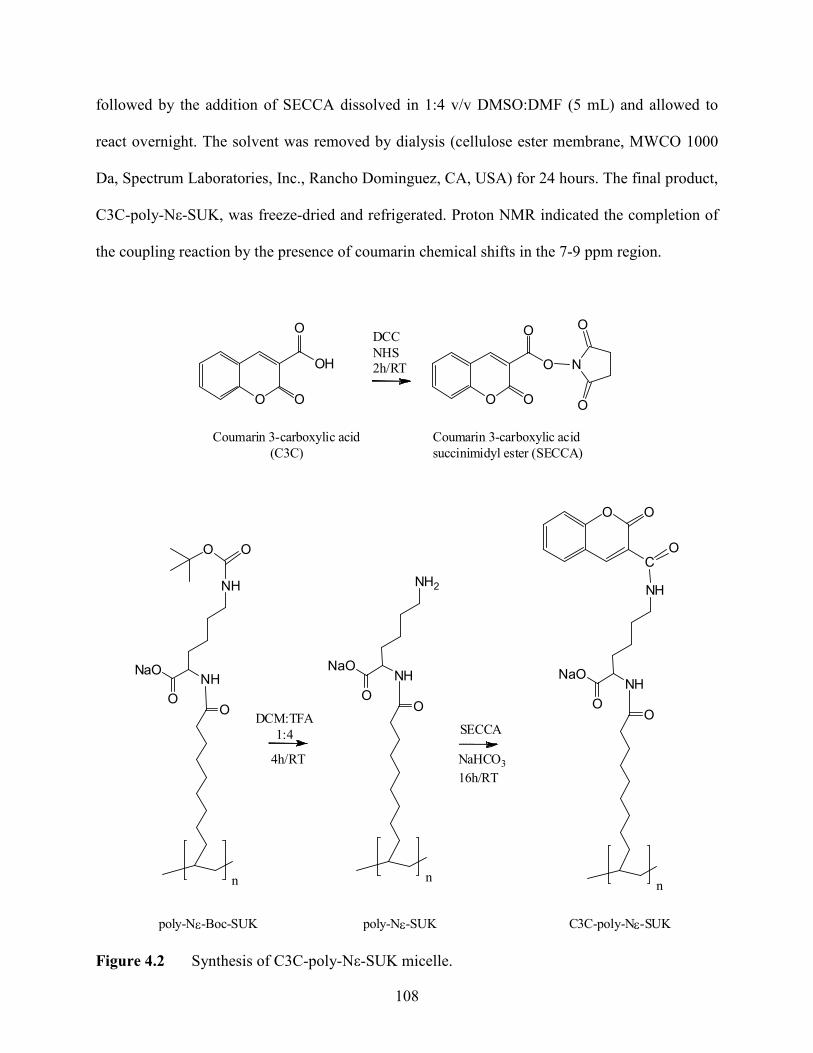
108
followed by the addition of SECCA dissolved in 1:4 v/v DMSO:DMF (5 mL) and allowed to
react overnight. The solvent was removed by dialysis (cellulose ester membrane, MWCO 1000
Da, Spectrum Laboratories, Inc., Rancho Dominguez, CA, USA) for 24 hours. The final product,
C3C-poly-Nε-SUK, was freeze-dried and refrigerated. Proton NMR indicated the completion of
the coupling reaction by the presence of coumarin chemical shifts in the 7-9 ppm region.
O
O
OH
O O
O
O
O
O
O
N
O
C
O
DCC
NHS2h/RT
NaHCO3
16h/RT
Coumarin 3-carboxylic acid
(C3C)
Coumarin 3-carboxylic acid
succinimidyl ester (SECCA)
C3C-poly-Nε-SUK
NHNaO
O
NH
poly-Nε-SUK
O
SECCAO
n
NHNaO
O
NH2
O
n
NHNaO
O
NH
O
n
OO
4h/RT
DCM:TFA
1:4
poly-Nε-Boc-SUK
Figure 4.2 Synthesis of C3C-poly-Nε-SUK micelle.

109
4.2.3 Nanoparticle Synthesis
PLGA nanoparticles were synthesized by use of an emulsification solvent evaporation
method. Briefly 0.5 mL of 1 mg/mL NeR in DCM was added to 0.5 mL DCM solution
containing 50 mg of PLGA. In case of blank nanoparticles, the dye solution was replaced with
DCM. An aqueous phase was prepared by dissolving C3C-poly-Nε-SUK in 5 mL water. For
non-C3C-functionalized neutral red loaded nanoparticles, C3C-poly-Nε-SUK was replaced with
a non-functionalized Boc-protected poly-Nε-Boc-SUK molecular micelle. The organic phase
was added dropwise to the aqueous phase under stirring conditions using a homogenizer (model
398, Biospec Products, Inc., Racine, WI, USA), at 15,000 rpm for 2 minutes, resulting in a single
o/w emulsion. The emulsion droplets were further reduced by sonication using a probe
ultrasound processor (model VC750, Sonics and Materials Inc., Newton, CT, USA), operating at
an amplitude intensity of 35 %, for 10 minutes. The solvent was evaporated using a rotary
evaporator (Büchi rotovapor R-200, Brinkmann Instruments, Inc., Westbury, NY, USA). The
nanoparticles were centrifuged at 10,000 rpm for 30 minutes, followed by washing by
centrifugation in the same conditions. The nanoparticle suspension was stored at 4 ºC until
further use.
4.2.4 Nanoparticle Characterization
Average particle diameter (Zave) and size distribution indicated by the polydispersity
index (PDI) were measured by use of dynamic light scattering (DLS) (Zetasizer NanoZS,
Malvern Instrumets Ltd., Malvern, UK) and reported as intensity distribution. Nanoparticle
surface charge indicated by zeta potential was measured by use of laser doppler anemometry
(Zetasizer NanoZS, Malvern Instrumets Ltd., Malvern, UK) using a capillary cell. The reported
values of particle size, PDI, and zeta potential represent the average of three different
nanoparticle batches. Nanoparticle morphology were investigated using transmission electron
110
microscopy (TEM) (JEOL 100CX, JEOL USA Inc., Peabody, MA, USA) operating at 80kV. A
drop of nanoparticle suspension was dried at room temperature on a carbon coated copper grid
and negatively stained using a 2 % solution of uranyl acetate.
4.2.5 Dye Content
The dye content was determined in the supernatant resulted from the centrifugation steps
using absorbance spectroscopy (UV-3101PC UV-Vis-near-IR scanning spectrometer, Shimadzu,
Columbia, MD) using a reduced volume (1.4 mL) quartz cuvet. A calibration curve was
constructed for C3C by representing the absorbance intensity at 290 nm as a function of C3C
concentration (y = 0.0111x-0.0258, R2 = 0.9927). Similarly, a calibration curve was constructed
for NeR by representing the absorbance intensity at 530 nm as a function of NeR concentration
(y = 1.1178x-0.0019, R2 = 0.9989). The NeR entrapment efficiency was calculated by difference
between found amount in the supernatant and the theoretical amount added to the formulation.
The C3C coverage was calculated based on the C3C content of poly-Nε-SUK attached on the
surface of nanoparticles after purification.
4.2.6 Hydroxyl Radical Generation
Hydroxyl radicals were generated in phosphate buffer (pH=7.4) based on the reaction of
cuprous sulfate and hydrogen peroxide in the presence of ascorbic acid, as described by
equations 4.1 and 4.2. The reduction of Cu2+
takes place in the presence of ascorbic acid
resulting into Cu+ that further reacts with hydrogen peroxide leading to the formation of
hydroxyl radicals. The concentration of OH• was varied by varying the concentration of cuprous
sulfate added to the reaction. For various experiments, the reaction was stopped at various time
intervals using DMSO as OH• scavenger.
++ → CuCu acidascorbic2 4.1
−•++++→+ OHOHCuOHCu 2
22 4.2

111
4.2.7 Fluorescence Spectroscopy
Steady-state fluorescence spectra were recorded using Fluorolog-3 spectrometer (model
FL1073, Horiba Jobin Yvon, Edison, NJ) operated in the front face mode, at 25 ºC as provided
by a temperature control chamber. The samples were prepared in phosphate buffer (pH 7.4), and
a short path (0.4 cm2) cuvette was used. The excitation and emission slit widths were both set at
5 nm, respectively. The samples were excited at 410 nm, and the emission was collected from
420 to 700 nm. The blanks containing all reagents except nanoparticles were subtracted for each
sample. All measurements were performed in triplicate.
4.2.8 In vitro Detection of Hydroxyl Radicals
Human mammary MCF-7 tumor cells (HTB-22, American Tissue Culture Collection,
ATCC, Manassas, VA) were grown to 90% confluence according to ATCC’s instructions and
used for in vitro detection of OH• radicals. Specifically, the cells were incubated with
nanoparticle suspension (0.07 mg/ mL cell suspension) in a 6-well plate at 10,000 cells/ well.
After two hours of incubation, the cells were washed with growth media to eliminate the excess
of nanoparticles. The cells were then exposed to H2O2-induced oxidative stress (400 µM) for 40
minutes, and washed with phosphate buffer. Fluorescence images were taken before and after
exposure, using a Leica DM RXA2 upright microscope (Leica Microsystems Inc., Bannockburn,
IL) equipped with GFP and TRITC filter cubes, and an immersion 40X objective.
4.3 Results and Discussion
4.3.1 Nanoparticle Characterization
In this study, C3C-poly-Nε-SUK – modified NeR loaded PLGA nanoparticles were
prepared by emulsification solvent evaporation using fluorescent molecular micelles as
emulsifiers. Previously, PLGA nanoparticles were successfully synthesized in our laboratory
using molecular micelles as emulsifiers, offering great advantages such as small size,
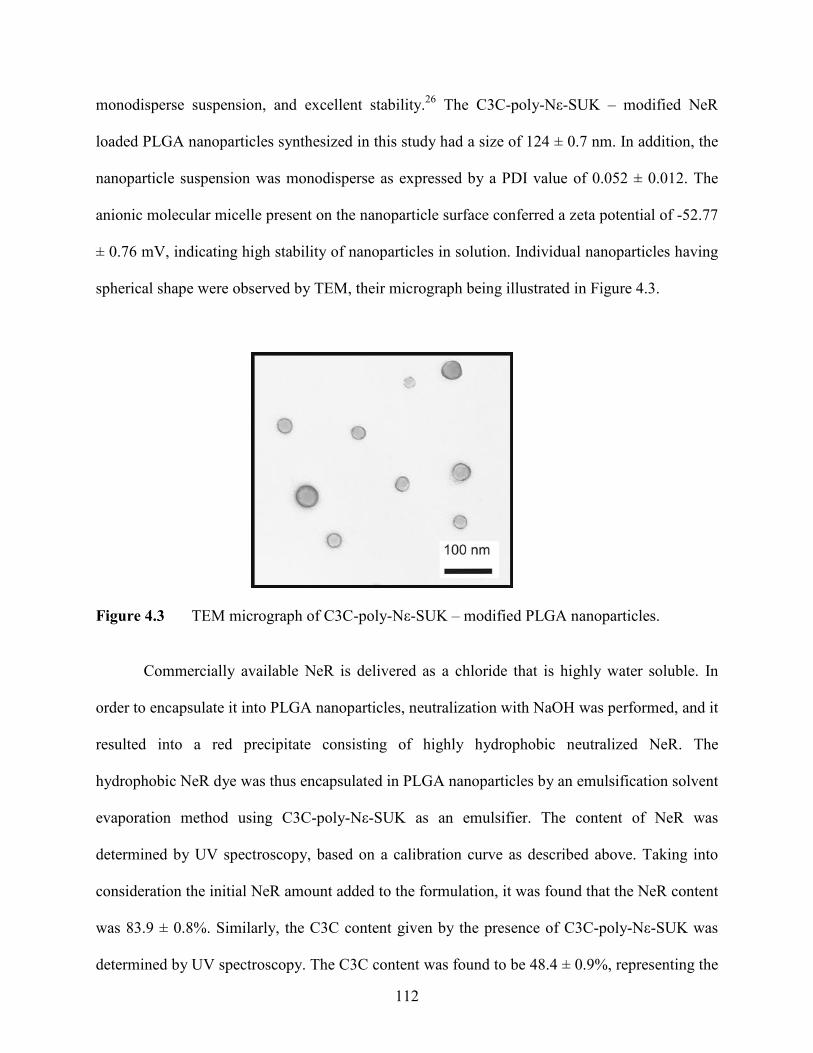
112
monodisperse suspension, and excellent stability.26
The C3C-poly-Nε-SUK – modified NeR
loaded PLGA nanoparticles synthesized in this study had a size of 124 ± 0.7 nm. In addition, the
nanoparticle suspension was monodisperse as expressed by a PDI value of 0.052 ± 0.012. The
anionic molecular micelle present on the nanoparticle surface conferred a zeta potential of -52.77
± 0.76 mV, indicating high stability of nanoparticles in solution. Individual nanoparticles having
spherical shape were observed by TEM, their micrograph being illustrated in Figure 4.3.
Figure 4.3 TEM micrograph of C3C-poly-Nε-SUK – modified PLGA nanoparticles.
Commercially available NeR is delivered as a chloride that is highly water soluble. In
order to encapsulate it into PLGA nanoparticles, neutralization with NaOH was performed, and it
resulted into a red precipitate consisting of highly hydrophobic neutralized NeR. The
hydrophobic NeR dye was thus encapsulated in PLGA nanoparticles by an emulsification solvent
evaporation method using C3C-poly-Nε-SUK as an emulsifier. The content of NeR was
determined by UV spectroscopy, based on a calibration curve as described above. Taking into
consideration the initial NeR amount added to the formulation, it was found that the NeR content
was 83.9 ± 0.8%. Similarly, the C3C content given by the presence of C3C-poly-Nε-SUK was
determined by UV spectroscopy. The C3C content was found to be 48.4 ± 0.9%, representing the

113
fraction of C3C amount present in the initial C3C-poly-Nε-SUK micelle used as emulsifier in the
nanoparticle synthesis.
4.3.2 Nanoparticle Reaction with Hydroxyl Radicals
Hydroxyl radicals were detected using ratiometric fluorescence spectroscopy. Compared
with variations of a single signal, ratiometric detection involves changes in the ratio of two
signals. The first signal is given by a reporting dye that reacts with the molecule of interest,
while the second signal is given by a reference dye that corrects for instrumental artifacts.
Nanoparticles that contain both reference and reporting dyes can be used in the ratiometric
detection scheme. In case of C3C-poly-Nε-SUK – modified NeR – loaded PLGA nanoparticles,
NeR was the reference dye, and was encapsulated into PLGA nanoparticles. In addition, the
reporting dye was 7-OH C3C-poly-Nε-SUK that resulted from the reaction with OH• radicals of
C3C-poly-Nε-SUK molecular micelle present on the nanoparticle surface. The product of such
reaction presented a fluorescent signal at 450 nm when excited at 410 nm. At the same time, the
reference dye, NeR, offered a separate fluorescent signal as shown in Figure 4.4.
In order to demonstrate that the two fluorescent peaks were generated by C3C and NeR
respectively, blank nanoparticles were prepared without NeR. These nanoparticles contained
C3C-poly-Nε-SUK molecular micelle on the surface. In addition, NeR-loaded nanoparticles
were prepared using a non-functionalized Boc-protected poly-Nε-Boc-SUK molecular micelle as
emulsifier. The fluorescence spectrum of C3C-poly-Nε-SUK – modified blank nanoparticles
presented the peak at 450 nm as a result of the reaction of OH• radicals with C3C, while the
fluorescence peak at 540 nm is absent. In contrast, the spectrum of Boc-protected poly-Nε-Boc-
SUK – modified NeR – loaded nanoparticles contained exclusively the fluorescence of reference
dye NeR. Therefore, it was confirmed that the two peaks at 450 nm and 535 nm were generated
by the reference and the reporting dyes, respectively.

114
0.0
0.4
0.8
1.2
1.6
2.0
2.4
430 480 530 580 630 680
nm
Norm
alized Fluorescence
C3C-poly-Nε-SUK NeR-NPs
C3C-poly-Nε-SUK blank-NPs
poly-Nε-Boc-SUK NeR-NPs
Figure 4.4 Normalized fluorescence of nanoparticles after the reaction with OH• (0.07
mg/mL nanoparticles, 200 µM CuSO4, 20 mM H2O2 and 200 µM ascorbic acid; 5
minutes; total volume was 500 mL).
4.3.2.1 Effect of Coumarin Location
The reaction between OH• radicals and C3C likely depends on the availability of the
reagents. In the case of C3C-poly-Nε-SUK – modified NeR – loaded PLGA nanoparticles, C3C
was placed near the surface of the nanoparticle, directly exposed to the environment containing
OH• radicals and readily available for the reaction. The effect of C3C location on the
fluorescence response was observed by changing the position of C3C within the ratiometric
nanosesor. Nanoparticles containing both C3C and NeR in the polymeric matrix were
synthesized using non-fluorescent poly-Nε-Boc-SUK as emulsifier (poly-Nε-Boc-SUK –
modified NeRSec – loaded PLGA nanoparticles). However, the succinimidyl ester of C3C
(SECCA) was used instead of C3C, due to its higher hydrophobicity. It should be mentioned that
SECCA readily reacts with OH• radicals resulting in a fluorescent product having the intensity
maximum at 450 nm.15, 18
The fluorescence spectra of C3C-poly-Nε-SUK – modified NeR –

115
loaded PLGA nanoparticles (red spectrum) and poly-Nε-Boc-SUK – modified NeRSec – loaded
PLGA nanoparticles (blue and green spectra) are shown in Figure 4.5. The nanoparticles
containing an equal molar ratio of SECCA and NeR within the polymer matrix presented a peak
in the fluorescence spectrum at 538 nm likely due to NeR fluorescence, and no evident intensity
of 7-OH C3C at 450 nm, as it can be noted in Figure 4.5 (blue spectrum).
0
60000
120000
180000
240000
430 480 530 580 630 680
nm
Corrected Fluorescence
C3C-poly-Nε-SUK NeR-NPs
poly-Nε-Boc-SUK NeRSec-NPs (1:1)
poly-Nε-Boc-SUK NeRSec-NPs (1:5)
Figure 4.5 Effect of C3C location. Corrected fluorescence of nanoparticles after the reaction
with OH• (0.07 mg/mL nanoparticles, 200 µM CuSO4, 20 mM H2O2 and 200 µM
ascorbic acid; 5 minutes; total volume was 500 mL).
As the amount of SECCA added to the nanoparticles increased to a 1:5 molar ratio, a
portion of the dye was likely situated near the nanoparticle surface. Therefore, the reaction
between SECCA and OH• radicals readily occurred, and the peak at 450 nm appeared in the
fluorescence spectrum. However, the overall fluorescence signal was lower for poly-Nε-Boc-
SUK – modified NeRSec – loaded PLGA nanoparticles than for C3C-poly-Nε-SUK – modified

116
NeR – loaded PLGA nanoparticles. Such results suggested that the presence of coumarin moiety
on the surface of the nanoparticles generated the highest signal, likely due to availability of C3C
for the reaction with OH• radicals.
4.3.2.2 Effect of Reaction Time
In general, hydroxyl radicals have a short life-time in solution and rapidly react with
surrounding molecules. Due to sample preparation and instrumental limitation, the time needed
for nanoparticle reaction with OH• radicals was established by stopping the reaction at various
time intervals using DMSO as OH• scavenger. DMSO rapidly reacts with hydroxyl radicals and
likely eliminates their presence in solution. In Figure 4.6, the I450/I528 ratio between C3C
fluorescence intensity at 450 nm and NeR fluorescence intensity at 528 nm is represented as a
function of time.
0.0
0.2
0.4
0.6
0.8
1.0
1.2
1.4
0 2 4 6 8 10
time (minutes)
Fluorescence (I450/I528)
Figure 4.6 Effect of reaction time on fluorescence ratio after the reaction of nanoparticles
with OH• (0.07 mg/mL nanoparticles, 200 µM CuSO4, 20 mM H2O2 and 200 µM
ascorbic acid; total volume 500 mL).
A linear increase of I450/I528 is observed in the first minute, indicating that the radicals
were rapidly consumed in the reaction with C3C. It is worth mentioning that the reaction of OH•

117
with C3C is irreversible, and limited by the concentration of radicals. After one minute, it is
possible that OH• radical concentration decreased. Therefore, further increase in the fluorescent
ratiometric signal was not observed with increase in the reaction time. For further experiments,
the reaction was stopped at 5 minutes in order to ensure the complete reaction.
4.3.2.3 Effect of Nanoparticle Concentration
Spectroscopic analyses using nanoparticle reactions with various molecules are limited
by their scattering effect. Therefore, a minimum nanoparticle concentration is desirable that
would be sufficient for the reaction and at the same time remains within the instrumental
limitations. Figure 4.7 represents the fluorescence spectra of increasing concentrations of
nanoparticle suspensions reacting with OH• radicals. All other conditions were kept constant. It
can be noted that the intensity of NeR at 528 nm increased with the increase in nanoparticle
concentration.
0
200000
400000
600000
432 482 532 582 632 682
nm
Corrected Fluorescence
0.21 mg/mL
0.14 mg/mL
0.10 mg/mL
0.07 mg/mL
0.03 mg/mL
Figure 4.7 Fluorescence spectra of nanoparticles after the reaction with OH• (0.03, 0.07,
0.10, 0.14, 0.21 mg/mL nanoparticles, 400 µM CuSO4, 20 mM H2O2 and 200 µM
ascorbic acid, incubated for 5 min; total volume 500 mL).

118
However, as more nanoparticles were used in the reaction, the peak corresponding to 7-
OH C3C started to disappear under the NeR peak. Since the concentration of OH• radicals
remained constant, an increase in nanoparticle concentration did not produce an increase of 7-
OH peak, but resulted in an increase of only NeR peak. In addition, a significant cloudiness of
reaction medium was observed at concentrations above 0.1 mg/mL nanoparticle solution. A
minimum concentration of 0.07 mg/mL nanoparticles was considered optimum for ratiometric
experiments, firstly to produce a clear response at 450 and 528 nm, and secondly to minimize the
scattering effect.
4.3.2.4 Effect of Hydroxyl Radical Concentration
Increasing concentrations of OH• radicals were incubated with C3C-poly-Nε-SUK –
modified NeR – loaded PLGA nanoparticles. In case of ratiometric sensors, if the reporting and
reference dyes are in close proximity, and there is an overlap between the fluorescence of the
reporting dye and the absorbance of the reference dye, fluorescence resonance energy transfer
(FRET) occurs. In this case, the signal of the reporting dye decreases and the one of the
reference dye increases. The reporting dye signal strictly depends on the reaction with OH•
radicals, and an increase in radical concentration would likely produce an increase in the
reporting dye signal. The response of C3C-poly-Nε-SUK – modified NeR – loaded PLGA
nanoparticles to different concentrations of OH• radicals is illustrated in Figure 4.8(A).
In this experiment, the concentration of OH• was changed by changing the concentration
of CuSO4, according to equations 4.1 and 4.2. The other conditions were maintained constant. As
the OH• concentration increases, it is expected that C3C present on the surface of nanoparticles
to generate an increase in the fluorescence intensity at 450 nm. However, an increase in NeR
signal was observed while the signal from 7-OH C3C decreased due to a fluorescence energy
transfer between the coumarin and the reference dye.

119
(A)
0.00E+00
5.00E+04
1.00E+05
1.50E+05
2.00E+05
2.50E+05
430 480 530 580 630 680nm
Co
rr
ec
te
d F
luo
re
sc
en
ce
CuSO4 400μM
CuSO4 200μM
CuSO4 100μM
CuSO4 50μM
CuSO4 40μM
CuSO4 30μM
CuSO4 20μM
CuSO4 15μM
CuSO4 10μM
(B)
0
0.05
0.1
0.15
0.2
0.25
0.3
0.35
0.4
0.45
0.5
0 200 400 600 800 1000
CuSO4 (µM)
-log(I450/I528)
Figure 4.8 (A) Fluorescence spectra of nanoparticles after the reaction with OH• (0.07mg/mL
nanoparticles, 20 mM H2O2, 200 µM ascorbic acid, and 10, 20, 30, 40, 50, 100,
200, 400, and 1000 µM CuSO4, incubated for 5 min; total volume 500 mL); (B)
logarithmic I450/I528 ratio as a function of CuSO4 concentration.

120
In addition, the observed FRET phenomenon was favored by the spectral overlap and
short spatial distance between the reporting and reference dyes. The I450/I528 ratio between C3C
fluorescence intensity at 450 nm and NeR fluorescence intensity at 528 nm is represented as a
function of CuSO4 concentration in Figure 4.8(B) on a logarithmic scale. It can be observed that
the fluorescence intensity ratio increases as the concentration OH• radicals increases. In order to
verify that the increase in the NeR signal was determined by FRET, NeR – loaded PLGA
nanoparticles modified with poly-N-Boc-SUK micelles were also incubated with increasing
concentrations of hydroxyl radicals, and compared with C3C-poly-Nε-SUK – modified NeR –
loaded PLGA nanoparticles. We noticed an insignificant increase in the NeR peak as compared
with the increase determined by the presence of C3C (as shown in Appendix IV.A).
4.3.3 Reaction with Other Radicals
The selectivity of nanoparticles for OH• radicals is important in particular for radical
detection in biological samples. NeR-loaded PLGA nanoparticles modified with C3C-poly-Nε-
SUK were exposed to various radical and non-radical reactive species such as superoxide anion
(O2•-), hydrogen peroxide (H2O2), singlet oxygen
(1O2), and hypochlorite anion (OCl
-). The
reactions took place in phosphate buffer using the same nanoparticle concentration, reaction
volume and reaction time. DMSO was used only for the detection of hydroxyl radicals. The ratio
between C3C fluorescence intensity at 450 nm and NeR fluorescence intensity at 528 nm
(I450/I528) is represented in Figure 4.9 for each radical. It can be noted that the I450/I528 ratio was
significantly higher for OH• than for the other radicals, indicating increased nanosensor
selectivity towards hydroxyl radical likely determined by the selectivity of C3C.
4.3.4 In vitro Detection of Hydroxyl Radicals
Aerobic organisms are complicated machines that produce energy based on oxidation
reactions. Such reactions generate reactive oxygen species that are involved in diseases such as

121
cancer, diabetes and ageing. In comparison with other reactive oxygen species, hydroxyl radical
is a short life radical. In addition, it can react with numerous biological molecules including
lipids, proteins and DNA. In order to verify the ability of C3C-poly-Nε-SUK – modified NeR –
loaded PLGA nanoparticles to react with OH• radicals generated in cell cultures, MCF-7 breast
tumor cells were incubated with ratiometric nanoparticles for 2 hours.
Figure 4.9 Fluorescence spectra of nanoparticles after the reaction with various radicals (0.07
mg/mL nanoparticles, and OH• (400 µM CuSO4, 20 mM H2O2 and 200 µM
ascorbic acid), O2-• (200 µM KO2), H2O2 (20 mM), OCl
- (200 µM NaOCl),
1O2
(200 µM H2O2 + 200 µM NaOCl).
After the nanoparticle cell uptake took place, the cells were washed in order to eliminate
the excess of nanoparticles. The cells were further exposed to oxidative stress using hydrogen
peroxide as initiator. In the cellular environment, hydroxyl radicals are mainly generated by the
reaction of hydrogen peroxide with metals, and likely contained the transition metals necessary
for the reaction with hydrogen peroxide. The fluorescent signal was observed by fluorescence

122
microscopy at different incubation times as shown in Figure 4.10. Initially the cells appeared red
likely due to the NeR signal. As the OH• radicals became available in the cell environment at 10,
20 and 40 minutes, the cells started to turn green possibly as a result of 7-OH C3C fluorescence
signal. Therefore, ratiometric C3C-poly-Nε-SUK – modified NeR – loaded PLGA nanoparticles
were able to detect free radicals in stressed cells. It should be mentioned that C3C can react with
OH• radicals that are also produced through natural metabolism of viable cells. However, their
presence did not generate green fluorescence during the nanoparticle cellular uptake. In oxidative
stress conditions, the concentration of OH• radicals is higher as compared with normal
conditions, allowing their rapid detection in viable cells using ratiometric nanoparticles.
The MCF-7 cells were also incubated with NeR-loaded nanoparticles modified with a
non-fluorescent Boc-protected poly-SUK. In this experiment, the cells appeared red before the
exposure to oxidative stress, and remained mainly red after the exposure to oxidative stress, the
weak green color being observed likely due to cell autofluorescence. Similarly, the cells were
incubated with C3C-poly-Nε-SUK – modified blank PLGA nanoparticles. No fluorescence was
observed before the exposure to oxidative stress. However, the cells became green after the
exposure to oxidative stress, likely due to coumarin reaction with hydroxyl radicals (as shown in
Appendix IV.B).
4.4 Conclusions
Detection of reactive oxygen species is critical for the investigation of their role in
biological systems, and a suitable analytical method is desirable for their rapid detection.
Hydroxyl radical is one of the most important radical involved in oxidative stress, mainly due to
its high reactivity. In this study, C3C-poly-Nε-SUK – modified NeR – loaded PLGA
nanoparticles were used to successfully detect hydroxyl radicals by fluorescence ratiometric
detection conferred by 7-OH C3C reporting dye and NeR reference dye. In addition, the

123
ratiometric nanoparticles were sensitive and selective for hydroxyl radicals as compared to other
reactive oxygen species such as superoxide anion (O2
•-), hydrogen peroxide (H2O2), singlet
oxygen (1O2), and hypochlorite (OCl
-). Furthermore, C3C-poly-Nε-SUK – modified NeR –
loaded PLGA nanoparticles were able to detect hydroxyl radicals in viable cells exposed to
oxidative stress allowing their potential use in the study of other living systems.
Figure 4.10 Fluorescence micrographs of nanoparticle response in MCF-7 cells exposed to
H2O2 – induced oxidative stress (400 µM), before the addition of H2O2 (top left
corner), at t = 10, 20, and 40 minutes after the addition of H2O2.
4.5 References
1 Sorg, O. Comptes Rendus Biologies 2004, 327, 649-662.
2 Kohen, R.; Nyska, A. Toxicologic Pathology 2002, 30, 620-650.
t = 10 min
t = 40 min t = 20 min

124
3 Jones, D. P. Antioxidants & Redox Signaling 2006, 8, 1865-1879.
4 Dalle-Donne, I.; Rossi, R.; Colombo, R.; Giustarini, D.; Milzani, A. Clinical Chemistry
2006, 52, 601-623.
5 Molavi, B.; Mehta Jawahar, L. Current Opinion in Cardiology 2004, 19, 488-493.
6 Passi, S.; Gianni, G.; Cocchi, M. Progress in Nutrition 2006, 8, 241-256.
7 Manea, A.; Constantinescu, E.; Popov, D.; Raicu, M. Journal of Cellular and Molecular
Medicine 2004, 8, 117-126.
8 Goetz, M. E.; Luch, A. Cancer Letters 2008, 266, 73-83.
9 Afonso, V.; Champy, R.; Mitrovic, D.; Collin, P.; Lomri, A. Joint, Bone, Spine 2007, 74,
324-329.
10 Halliwell, B.; Gutteridge, J. M. C. Free radicals in biology and medicine 1989, Oxford
University Press, 2nd edition, 1-81.
11 Bartosz, G. Clinica Chimica Acta 2006, 368, 53-76.
12 Gomes, A.; Fernandes, E.; Lima, J. L. F. C. Journal of Biochemical and Biophysical
Methods 2005, 65, 45-80.
13 Soh, N.; Imato, T. Current Bioactive Compounds 2006, 2, 409-430.
14 Soh, N. Analytical and Bioanalytical Chemistry 2006, 386, 532-543.
15 Manevich, Y.; Held, K. D.; Biaglow, J. E. Radiation Research 1997, 148, 580-591.
16 Martin-Aragon, S.; Benedi, J.; Villar, A. Phytotherapy Research 1996, 10, S75-S78.
17 Newton, G. L.; Milligan, J. R. Radiation Physics and Chemistry 2006, 75, 473-478.
18 Makrigiorgos, G. M.; Baranowska-Kortylewicz, J.; Bump, E.; Sahu, S. K.; Berman, R.
M.; Kassis, A. I. International Journal of Radiation Biology 1993, 63, 445-458.
19 Soh, N.; Makihara, K.; Ariyoshi, T.; Seto, D.; Maki, T.; Nakajima, H.; Nakano, K.;
Imato, T. Analytical Sciences 2008, 24, 293-296.
20 Ghosh, S. C.; Auzenne, E.; Farquhar, D.; Klostergaard, J. Bioconjugate Chemistry 2007,
731-735.
21 Albers, A. E.; Okreglak, V. S.; Chang, C. J. Journal of American Society 2006, 9640-
9641.
22 Soh, N.; Makihara, K.; Sakoda, E.; Imato, T. Chemical Communications (Cambridge,
United Kingdom) 2004, 496-497.

125
23 King, M.; Kopelman, R. Sensors and Actuators, B: Chemical 2003, B90, 76-81.
24 Macossay, J.; Shamsi, S. A.; Warner, I. M. Tetrahedron Letters 1999, 40, 577-580.
25 Bardajee, G. R.; Winnik, M. A.; Lough, A. J. Acta Crystallographica Section E-Structure
Reports Online 2007, 63, o1513-o1514.
26 Ganea, G. M.; Sabliov, C. M.; Ishola, A. O.; Fakayode, S. O.; Warner, I. M. Journal of
Nanoscience and Nanotechnology 2008, 8, 280-292.
126
CHAPTER 5
CONCLUSIONS AND FUTURE STUDIES
The major goal of this dissertation was to demonstrate the utility of molecular micelles in
nanoparticle synthesis. Molecular micelle – modified polymeric nanoparticles can be used as
drug delivery systems for delivery of antioxidants. In addition, they can serve as nanoparticle –
based analytical sensors for detection of free radicals. The importance of drug delivery systems
and the use of polymeric nanoparticles as drug delivery systems were emphasized in the first
chapter of this dissertation. In addition, methods of nanoparticle synthesis and nanoparticle
characterization were described in detail. Molecular micelles were compared with conventional
micelles, and their utility in nanoparticle synthesis was revealed. The concepts of antioxidants,
oxidative stress and free radicals were introduced as well. Chemometrics and optimization
designs played an important role in the research included in this dissertation and were described
in the first chapter as well.
In the second chapter, molecular micelles were used as novel emulsifiers in the synthesis
of poly (D,L lactide-co-glycolide) (PLGA) nanoparticles by emulsification solvent evaporation.
Examples of such micelles include poly (sodium N-undecenyl sulfate) (poly-SUS), poly (sodium
N-undecenyl-glycinate) (poly-SUG) and poly (sodium N-undecenyl-L-leucyl-valinate) (poly-L-
SULV). Other emulsifiers, such as anionic sodium dodecyl sulfate (SDS) and non-ionic poly
(vinyl alcohol) (PVA) were used for comparison. The optimization of nanoparticle synthesis was
achieved by the use of a central composite experimental design (CCD). The individual and
combined effects of PLGA concentration, emulsifier concentration, homogenization speed, and
sonication time (design variables) on particle size and polydispersity index (responses) were
investigated using multivariate analysis. The most significant design variables influencing the
nanoparticle size and size distribution were PLGA concentration and emulsifier concentration (p

127
< 0.05) in comparison to the other design variables. The quadratic model demonstrated the
highest predictive ability when the molecular micelles were used as emulsifiers. The PLGA
nanoparticles optimally synthesized according to the CCD were further purified by dialysis and
then freeze-dried. Dried nanoparticles synthesized with molecular micelles and PVA were
readily re-suspended in water, as compared with SDS for which nanoparticle aggregation
occurred. The size of PLGA nanoparticles synthesized using molecular micelles increased after
freeze-drying, but remained below 100 nm when poly-L-SULV was used as emulsifier. The PDI
values indicated monodisperse nanoparticle suspensions after purification and freeze-drying for
all investigated molecular micelles (PDI < 0.100). The nanoparticle suspensions synthesized
using molecular micelles were the most stable after dialysis and freeze-drying, having low
negative zeta potential values ranging from - 54 ± 1.6 mV for poly-L-SULV to - 63.2 ± 0.4 mV
for poly-SUS. Transmission electron microscopy (TEM) micrographs showed spherical shapes
and smooth surfaces for the molecular micelle – modified PLGA nanoparticles.
In the third chapter of this dissertation, anionic amino acid - based molecular micelles
were used as emulsifiers in the synthesis of thymoquinone (TQ)-loaded PLGA nanoparticles by
use of an emulsification solvent evaporation method. The nanoparticle synthesis was optimized
for maximum entrapment efficiency using a Box-Behnken experimental design. Optimum
conditions were found to be 100 mg PLGA, 15 mg TQ and 0.5% w/v emulsifier [poly(sodium N-
undecenyl-glycinate) (poly-SUG)]. In addition, other structurally related molecular micelles
having various amino acid head groups and different hydrophobic carbon chain lengths were also
examined as emulsifiers, and provided excellent emulsifier properties, leading to monodispersed
particle sizes below 200 nm, and maximum entrapment efficiency. In vitro release studies
revealed a rapid TQ release in the first 8 hours, the highest release levels being obtained for poly-
SUG and poly(sodium N-heptenyl-glycinate) (poly-SHG). The antioxidant activity of TQ-

128
loaded nanoparticles, indicated by IC50 (mg/mL TQ for 50% 2,2-diphenyl-1-picrylhydrazyl
(DPPH) scavenging activity), was the highest for poly(sodium N-undecenyl-alaninate) (poly-
SUA)-emulsified nanoparticles (0.023±0.001 mg/mL), representing an improvement factor of
5.7 as compared to free TQ. In addition, TQ-loaded nanoparticles showed lower cytotoxic
effects than the equivalent free TQ for normal (Hs578Bct) breast cells, indicating a protective
effect provided by the nanoparticles. For MCF-7 breast cancer cells, the lowest cell viability was
obtained for poly(sodium N-undecenyl-leucinate) (poly-SUL) – emulsified nanoparticles
(43.26±9.45%), which is comparable to free TQ (37.42±4.83%). In addition, TQ-loaded
nanoparticles emulsified with poly(sodium N-undecenyl-valinate) (poly-SUV) were more
effective for MDA-MB-231 breast cancer cell inhibition (68.47±8.42%) than free TQ. Molecular
micelles offered high flexibility to nanoparticle physico-chemical and biological properties and,
therefore, can be used in the synthesis of drug-loaded nanoparticles depending on the desired
properties. In addition, such nanoparticles are promising as free radical scavengers and
inhibitors of breast cancer cells.
Molecular micelle – modified nanoparticles are not only an example of drug delivery
systems, but nanosensors that can be used for detection of various molecules. In the fourth
chapter of this dissertation, polymeric nanoparticles were synthesized using fluorescent labeled
molecular micelles that served as detectors for hydroxyl radicals. Specifically, poly (sodium N-
undecenyl - Nε - lysinate) (poly-Nε-SUK) functionalized with coumarin 3-carboxylic acid (C3C)
was used as emulsifier in the synthesis of neutral red (NeR) - loaded PLGA nanoparticles by
emulsification – solvent evaporation. Ratiometric fluorescence spectroscopy was applied for the
detection of hydroxyl radicals based on the intensity ratios of a reporting and reference dyes,
respectively. The product of C3C reaction with hydroxyl radical, 7-hydroxy coumarin 3-
carboxylic acid (7-OH C3C) represented the reporting dye, while NeR encapsulated into the

129
nanoparticles was the reference dye. Other fluorescent and non-fluorescent molecular micelles
were used in the synthesis of control nanoparticles. C3C-poly-Nε-SUK – modified NeR-loaded
nanoparticles were able to detect hydroxyl radicals in simulated samples as well as biological
samples exposed to oxidative stress. Furthermore, the ratiometric nanoparticles were selective
for hydroxyl radicals as compared to other reactive oxygen species including superoxide anion
(O2•-), hydrogen peroxide (H2O2), singlet oxygen
(1O2), and hypochlorite (OCl
-). In addition to
nanosensor spectral properties, their low toxicity and fast cellular uptake allow their potential use
in the study of other living systems.
The research presented in this dissertation demonstrated the utility of molecular micelles
in nanoparticle synthesis, their versatility that conferred tunable properties for drug loaded
nanoparticles, and their ability to offer functional groups for analytical purposes. Molecular
micelle – modified nanoparticles are not only an example of drug delivery systems, but
nanosensors that can be used for detection of various molecules. Their biodegradability and
biocompatibility represent great advantages as compared with toxicity of other nanoparticles
used for analytical purposes.
There are multiple possibilities for further use of molecular micelle – modified
nanoparticles. Taking into consideration the fact that many antioxidants exhibit protective effects
in chemotherapy and some of them have anticancer properties, the co-entrapment of multiple
antioxidants and anticancer drugs having both scavenging and anticancer properties can be
studied as potential treatment for various cancers. In addition, there is a large variety of
molecules that can be covalently attached to molecular micelles. Several examples include
fluorescent dyes, near infrared dyes, folate-based conjugates, aptamers, and others. Such
molecules can serve multiple purposes ranging from targeted delivery to detection of small
reactants and disease biomarkers in biological systems.

130
APPENDIX I
GENERAL SYNTHESIS SCHEME OF MOLECULAR MICELLES
Appendix I.A Synthesis of Poly-SUS.

131
O
O
O ON
O
O
HO
DCC
NHS
16h/RT
ethyl acetate
O
HN
R
O
ONa
H2N R
O OH
THF/H2O
NaHCO316h/RT
60Co
polymerization
O
HN
R
O
ONa
n
Appendix I.B Synthesis of amino acid and dipeptide based molecular micelles.

132
APPENDIX II
EXPERIMENTAL CONDITIONS USED IN THE CENTRAL COMPOSITE DESIGN
Experimental conditions Exp.
No. PLGA
(% (w/v))
Emulsifier
(% (w/v))
H. speed
(rpm)
S. time
(min)
1 5.0 1.00 10,000 5
2 3.5 0.55 15,000 10
3 5.0 1.00 20,000 15
4 5.0 1.00 10,000 15
5 0.5 0.55 15,000 10
6 2.0 1.00 20,000 15
7 2.0 0.10 10,000 15
8 5.0 1.00 20,000 5
9 2.0 0.10 10,000 5
10 3.5 0.55 25,000 10
11 6.5 0.55 15,000 10
12 2.0 0.10 20,000 5
13 2.0 1.00 10,000 5
14 3.5 0.05 15,000 10
15 3.5 0.55 15,000 20
16 3.5 0.55 15,000 10
17 3.5 0.55 5,000 10
18 3.5 0.55 5,000 0
19 3.5 1.45 15,000 10
20 3.5 0.55 15,000 10
21 2.0 1.00 10,000 15
22 5.0 0.10 20,000 15
23 3.5 0.55 15,000 10
24 2.0 0.10 20,000 15
25 5.0 0.10 20,000 5
26 2.0 1.00 20,000 5
27 3.5 0.55 15,000 10
28 5.0 0.10 10,000 5
29 5.0 0.10 10,000 15
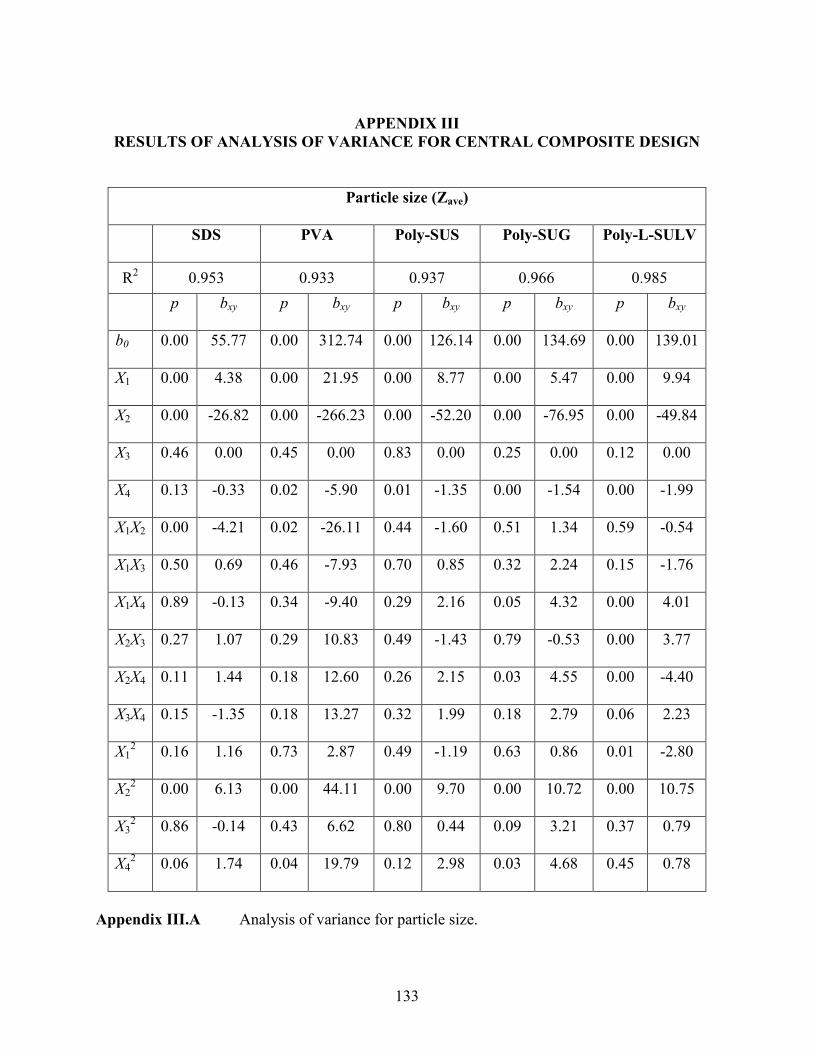
133
APPENDIX III
RESULTS OF ANALYSIS OF VARIANCE FOR CENTRAL COMPOSITE DESIGN
Particle size (Zave)
SDS PVA Poly-SUS Poly-SUG Poly-L-SULV
R2
0.953 0.933 0.937 0.966 0.985
p bxy p bxy p bxy p bxy p bxy
b0 0.00 55.77 0.00 312.74 0.00 126.14 0.00 134.69 0.00 139.01
X1 0.00 4.38 0.00 21.95 0.00 8.77 0.00 5.47 0.00 9.94
X2 0.00 -26.82 0.00 -266.23 0.00 -52.20 0.00 -76.95 0.00 -49.84
X3 0.46 0.00 0.45 0.00 0.83 0.00 0.25 0.00 0.12 0.00
X4 0.13 -0.33 0.02 -5.90 0.01 -1.35 0.00 -1.54 0.00 -1.99
X1X2 0.00 -4.21 0.02 -26.11 0.44 -1.60 0.51 1.34 0.59 -0.54
X1X3 0.50 0.69 0.46 -7.93 0.70 0.85 0.32 2.24 0.15 -1.76
X1X4 0.89 -0.13 0.34 -9.40 0.29 2.16 0.05 4.32 0.00 4.01
X2X3 0.27 1.07 0.29 10.83 0.49 -1.43 0.79 -0.53 0.00 3.77
X2X4 0.11 1.44 0.18 12.60 0.26 2.15 0.03 4.55 0.00 -4.40
X3X4 0.15 -1.35 0.18 13.27 0.32 1.99 0.18 2.79 0.06 2.23
X12
0.16 1.16 0.73 2.87 0.49 -1.19 0.63 0.86 0.01 -2.80
X22
0.00 6.13 0.00 44.11 0.00 9.70 0.00 10.72 0.00 10.75
X32
0.86 -0.14 0.43 6.62 0.80 0.44 0.09 3.21 0.37 0.79
X42
0.06 1.74 0.04 19.79 0.12 2.98 0.03 4.68 0.45 0.78
Appendix III.A Analysis of variance for particle size.

134
Polydispersity Index (PDI)
SDS PVA Poly-SUS Poly-SUG Poly-L-SULV
R2 0.872 0.970 0.773 0.743 0.914
p bxy p bxy p bxy p bxy p bxy
b0 0.00 0.00 0.13 0.00 0.14 0.00 0.09 0.00 0.11 0.00
X1 0.00 0.00 -0.01 0.01 0.01 0.41 0.00 0.31 0.00 0.05
X2 0.00 0.00 0.04 0.00 -0.22 0.00 0.06 0.00 0.04 0.00
X3 0.46 0.02 0.00 0.34 0.00 0.53 0.00 0.37 0.00 0.68
X4 0.13 0.74 0.00 0.53 0.00 0.95 0.00 0.52 0.00 0.66
X1X2 0.00 0.00 -0.02 0.00 -0.02 0.40 0.00 0.14 -0.01 0.06
X1X3 0.50 0.04 -0.01 0.94 0.00 0.30 0.00 0.36 0.00 0.66
X1X4 0.89 0.48 0.00 0.92 0.00 0.90 0.00 0.46 0.00 0.61
X2X3 0.27 0.67 0.00 0.34 0.01 0.80 0.00 0.51 0.00 0.53
X2X4 0.11 1.00 0.00 0.30 0.01 0.51 0.00 0.23 0.01 0.19
X3X4 0.15 0.41 0.00 0.23 0.01 0.21 -0.01 0.77 0.00 0.91
X12
0.16 0.04 0.01 0.84 0.00 0.73 0.00 0.27 0.00 0.02
X22
0.00 0.69 0.00 0.00 0.04 0.05 -0.01 0.12 -0.01 0.00
X32
0.86 0.11 0.01 0.45 0.00 0.73 0.00 0.92 0.00 0.93
X42
0.06 0.49 0.00 0.00 0.03 0.22 0.00 0.10 -0.01 0.23
Appendix III.B Analysis of variance for polydispersity index.

135
APPENDIX IV
FLUORESCENCE OF NEUTRAL RED LOADED PLGA NANOPARTICLES
0.00E+00
5.00E+04
1.00E+05
1.50E+05
2.00E+05
2.50E+05
430 480 530 580 630 680
nm
Corrected Fluorescence
C3C-poly-Nε-SUK NeR-NPs + CuSO4 40µM
C3C-poly-Nε-SUK NeR-NPs + CuSO4 20µM
poly-Nε-Boc-SUK NeR-NPs + CuSO4 40µM
poly-Nε-Boc-SUK NeR-NPs + CuSO4 20µM
Appendix IV.A Fluorescence spectra of nanoparticles after the reaction with OH• (0.07
mg/mL nanoparticles, 20 mM H2O2, 200 µM ascorbic acid, 20 and 40 µM
CuSO4, incubated for 5 min; total volume 500 mL)

136
C3C-poly-Nε-SUK – modified NeR-loaded PLGA nanoparticles
C3C-poly-Nε-SUK – modified blank PLGA nanoparticles
Appendix IV.B Fluorescence micrographs of nanoparticle response in MCF-7 cells before
and after exposure to H2O2 – induced oxidative stress (400 µM).
Before reaction with OH• After reaction with OH•

137
APPENDIX V
COPYRIGHT AGREEMENT LETTER
Re: copyright agreement for doctoral thesis 1 message
[email protected] <[email protected]> Tue, Oct 20, 2009 at 10:11 AMReply-To: [email protected] To: Gabriela Visser <[email protected]>
Hi Gabriela:
American Scientific Publishers grants permission to use text, data, figures and tables into your PhD thesis. from the following article.
Ganea G. M., Sabliov C. M., Ishola A., Fakayode S. O., Warner I. M., Experimental design and
multivariate analysis for optimizing poly(D,L-lactide-co-glycolide) (PLGA) nanoparticle
synthesis using molecular micelles, Journal of Nanoscience and Nanotechnology, volume 8,
number 1, January 2008, pages 280–292 Please make sure to cite the reference.
Best regards,
H. S. Nalwa
-----Original Message----- From: Gabriela Visser Sent: Oct 20, 2009 10:03 AM To: [email protected], [email protected] Subject: copyright agreement for doctoral thesis Dear Sirs, My name is Gabriela M Ganea (married Visser) and I am currently writing my doctoral thesis. I hereby request the permission to reproduce text, data, figures and tables in my thesis from the publication listed below:
Ganea G. M., Sabliov C. M., Ishola A., Fakayode S. O., Warner I. M., Experimental design and
multivariate analysis for optimizing poly(D,L-lactide-co-glycolide) (PLGA) nanoparticle
synthesis using molecular micelles, Journal of Nanoscience and Nanotechnology, volume 8,
number 1, January 2008, pages 280–292 Thank you for your consideration on my request. Sincerely, Gabriela M Visser PhD candidate, Analytical Chemistry Warner Research Group Chemistry Department Louisiana State University Baton Rouge, LA, 70803 225-578-3919 [email protected]
138
VITA
Gabriela was born in Galati, Romania, in the wonderful family of Aurelian and Cristinica Ganea.
Her primary, middle and high school education took place in Galati. Her passion for chemistry
started in the seventh grade when she was the first in her class to get an A on a chemistry test.
Her high school education focused on science subjects such as mathematics, physics and
chemistry. She also participated in local and national competitions such as chemistry and biology
Olympiads. Her college education took place in Bucharest, the capital of Romania, at the
University of Bucharest, College of Chemistry. As an undergraduate student, Gabriela
participated in research programs within the National Dairy Institute, and Microbiology Center
of the University of Bucharest. She also received a summer internship at the Immunology
Cantacuzino Institute in Bucharest. She received a bachelor’s degree in biochemistry, and
throughout her college she was the recipient of an undergraduate scholarship granted by the
Romanian Ministry of Education. After her college, Gabriela returned to Galati to work as a
chemist in the Environmental Protection Department of Ispat Sidex, Galati. The experience
gained in the industry encouraged her to pursue her graduate studies. In 2002, she returned to the
University of Bucharest to earn her master’s degree in bioanalytical chemistry. Her research
involved the development of analytical sensors for the detection of genetically modified
organisms. During her graduate studies, she received a graduate assistantship granted by the
Romanian Ministry of Education. Immediately after that, in 2004, Gabriela went to the United
States to continue her graduate studies at Louisiana State University under the guidance of Dr.
Isiah Warner. As a doctoral candidate, Gabriela was presented with Outstanding Research
Assistant Award in 2009 granted by Chemistry Department, Louisiana State University. Gabriela
graduated with the degree of Doctor of Philosophy in chemistry from Louisiana State University
in December 2009. Publications and conference presentations include:

139
Ganea G. M., Sabliov C. M., Ishola A., Fakayode S. O., Warner I. M., Experimental design
and multivariate analysis for optimizing poly(D,L-lactide-co-glycolide) (PLGA) nanoparticle
synthesis using molecular micelles, Journal of Nanoscience and Nanotechnology, 8, 280–292
(2008)
Gates A. T., Fakayode S. O., Lowry M., Ganea G. M., Murugeshu A., Robinson J.W., Strongin
R. M., Warner I. M. Gold nanoparticle sensor for homocysteine thiolactone-induced protein
modification – Langmuir, 24 (8), 4107 - 4113, (2008)
Ganea G. M., Fakayode S. O., Losso J. N., van Nostrum C. F., Sabliov C. M., Warner I. M. The
effect of molecular micelles on synthesis and properties of thymoquinone-loaded poly(d,l lactide-
co-glycolide) nanoparticles, Pharmaceutical Research, submitted (2009)
Ganea G. M., Kolic P., Losso J. N., Warner I. M. Fluorescent ratiometric molecular micelle -
modified poly(d,l lactide-co-glycolide) nanoparticles for detection of hydroxyl radicals, in
preparation for submission (2009)
2006 - Poster presentation at local CBM2 competition, Baton Rouge, LA
2008 - Poster presentation at Pittcon Analytical Chemistry Conference, New Orleans, LA
2008 - Poster presentation at ACS National Conference, New Orleans, LA
2008 - Poster presentation at ACS National Conference, Philadelphia, PA, 2008