synthesis, characterization, and application of water
TRANSCRIPT

Louisiana State UniversityLSU Digital Commons
LSU Doctoral Dissertations Graduate School
2003
Synthesis, characterization, and application ofwater-soluble chiral calix[4]arene derivatives inspectroscopy and capillary electrokineticchromatographyKim HamiltonLouisiana State University and Agricultural and Mechanical College, [email protected]
Follow this and additional works at: https://digitalcommons.lsu.edu/gradschool_dissertations
Part of the Chemistry Commons
This Dissertation is brought to you for free and open access by the Graduate School at LSU Digital Commons. It has been accepted for inclusion inLSU Doctoral Dissertations by an authorized graduate school editor of LSU Digital Commons. For more information, please [email protected].
Recommended CitationHamilton, Kim, "Synthesis, characterization, and application of water-soluble chiral calix[4]arene derivatives in spectroscopy andcapillary electrokinetic chromatography" (2003). LSU Doctoral Dissertations. 3087.https://digitalcommons.lsu.edu/gradschool_dissertations/3087

SYNTHESIS, CHARACTERIZATION, AND APPLICATION OF WATER-SOLUBLE CHIRAL CALIX[4]ARENE DERIVATIVES IN SPECTROSCOPY AND CAPILLARY
ELECTROKINETIC CHROMATOGRAPHY
A Dissertation
Submitted to the Graduate Faculty of the Louisiana State University and
Agricultural and Mechanical College in partial fulfillment of the
requirements for the degree of Doctor of Philosophy
in
The Department of Chemistry
by Kim Hamilton
B.S., Southern University and A & M College, 1995 August 2003

ii
DEDICATION
To my grandmother
Mrs. Laverne Ridley Monroe
Though you did not have the privilege of completing your formal education, you have shown the
Ph.D. spirit all along...Patience…Humility…Determination. Most importantly, God has
enriched you with gifts of the Spirit whose lessons transcend far beyond the curriculum of any
earthly institution of higher learning. Through your thoughts, words, and deeds, you taught your
children and grandchildren to dream big. In particular, you have taught me that all things are
possible when I dare to dream and be guided by Spirit through even the worst of situations.
Thank you for giving me the gift of your unconditional love. I love you more than words could
ever say.
and
To my mother and father
Delia and Macura Hamilton
Both of you have exemplified the synergism between art, philosophy, and science. Thank you
for your example, your love and your support.
“Never underestimate the impact of your lightest touch on someone’s life”

iii
ACKNOWLEDGMENTS
How can I say thanks
For the things you have done for me?
Things so undeserved,
That you did to prove your love for me.
The voices of a million angels
Cannot express my gratitude
All that I am or ever hope to be
I owe it all to thee.
-by Andrae Crouch
from My Tribute, Keep on Singin’ ©1971
The author gratefully acknowledges the following individuals for their contributions to the completion of this work:
The Creator, for divine grace and guidance on this arduous journey. Moreover, I thank You for placing everyone and everything in the exact position to carry out Your plan for my life.
Dr. Isiah M. Warner, for providing the tools necessary for research and for his encouragement especially during the difficult times. Thank you for giving me a chance to grow.
Dr. Rezik A. Agbaria, for his guidance in the areas of fluorescence spectroscopy and laboratory citizenship.
Dr. Sibrina N. Collins, for being a wonderful inspiration, mentor and friend, and for showing me the value in the valley.
Dr. Joseph “Kip” Rugutt, Dr. W. Dale Treleaven, and Dr. Robert Cook, for their guidance in the proper execution and reporting of NMR experiments.
The National Institutes of Health, for providing me with an NRSA Individual Research Award for several years of funding toward the completion of my degree requirements.

iv
The Howard Hughes Medical Institute Professors Program, for granting me the use of their computer equipment and software.
LSU Department of Chemistry colleagues (Dr. Serigne Thiam, Warner Research Group, Vera Verdree), for exchanging research ideas, trusting my editorial ability, and doing a great job of peer-mentoring.
LSU Department of Chemistry staff members (Robert Carver, Gail Altazan, Sheridan Wilkes, and Regina Toliver), for taking care of the administrative aspects of my research.
My parents, Macura and Delia Monroe Hamilton, for their endless emotional and financial support.
My sister, Felicia, for being there for me.
The Batiste-Evans family (Lisa, Trinity, and Hunter), for their acceptance, love and support. Moreover, I thank Lisa for being my best friend.
The Lee Family (Raymond Sr., Irena, Raymond Jr., Marcus, and Brett), for accepting me into their home as Big Sister, and teaching me how to cook (and eat) real South Louisiana food.
The Wims Family (Alfred Sr., Verlie, Toni, and Amber), for their friendship, prayers, and support.
My sister-friends, Kathryn Bailey, Nicole Carr, LaTeasha Ford, Sonya Griffin, Cassandra Mack, and Ramona Webb, for lending their listening ears, crying shoulders, humor, encouragement, and advice in my times of need.
My reflection, Alfred Bo Wims, for standing by me during the most difficult leg of my journey. Thank you for introducing your Malcolm X spirit to my Dr. Martin Luther King, Jr. reality… JUST IN THE KNICK OF TIME!!! You’re the best!

v
TABLE OF CONTENTS
DEDICATION ................................................................................................................. ii
ACKNOWLEDGMENTS................................................................................................ iii
LIST OF TABLES ......................................................................................................... vii
LIST OF FIGURES........................................................................................................ viii
ABSTRACT...................................................................................................................... xi
CHAPTER 1. INTRODUCTION ..................................................................................... 1 Part I. Calixarenes .............................................................................................. 1 Part II. Introduction to Molecular Spectroscopy ................................................ 20 Part III. Introduction to Capillary Electrophoresis ............................................. 47 References ........................................................................................................... 62
CHAPTER 2. SYNTHESIS AND CHARACTERIZATION OF CALIXARENES ...... 70 Part I. Synthesis and NMR Assignments of Water-Soluble Chiral N-Acylcalix[4]arene L-Amino Acid Derivatives ................................................ 70
Part II. Synthesis and Characterization of Calixarene-Bonded Silica Stationary Phases ...................................................................................... 85 References ........................................................................................................... 90
CHAPTER 3. N-ACYLCALIX[4]ARENE L-AMINO ACID DERIVATIVES AS CHIRAL SELECTORS IN ELECTROKINETIC CHROMATOGRAPHY................... 92 Part I. Introduction ............................................................................................. 92 Part II. Experimental Section ............................................................................. 93 Part III. Results and Discussion ......................................................................... 95 Part IV. Conclusions ........................................................................................ 105 References ......................................................................................................... 106
CHAPTER 4. SPECTROSCOPIC STUDIES OF CALIXARENE COMPLEXATION ....................................................................................................... 108
Part I. Complexation Studies of N-L-Aminoacylcalix[4]arenes: Addressing Inner-Filter Effects in Fluorescence.................................................................. 108
Part II. Spectroscopic Investigation of Sulfonated Calixarenes in the Presence of Metals .................................................................................. 129 References ......................................................................................................... 133
CHAPTER 5. SUMMARY AND FUTURE DIRECTIONS....................................... 136
APPENDIX: ADDITIONAL FIGURES DISCUSSED IN PREVIOUS CHAPTERS.............................................................................................. 140

vi
VITA . ........................................................................................................................... 149

vii
LIST OF TABLES
Table 1.1 pKa Values of Water-soluble Calix[4]arenes ................................................... 9
Table 1.2 Properties of Calixarenes and Cyclodextrins ................................................. 18
Table 1.3 Spin Quantum Numbers of Various Nuclei .................................................... 36
Table 1.4 Significant Aspects of CEC, HPLC, and CE .................................................. 58
Table 2.1 1H and 13C Chemical Shifts (δ) of Calix[4]arene Derivatives ....................... 78
Table 2.2 Elemental analysis of three batches of CVAPS stationary phase ................... 87
Table 2.3 Surface coverage of calixarene-modified silica beads ................................... 88
Table 4.1 Mean concentration of metals in soft and hard plaque (mg/g)..................... 130
viii
LIST OF FIGURES
Figure 1.1 Naming scheme of calixarenes ........................................................................ 2
Figure 1.2 Conformations of substituted calix[4]arenes .................................................. 4
Figure 1.3 Examples of water-soluble calixarenes............................................................ 8
Figure 1.4 Unselective (A) and selective (B) inclusion of TMA by p-sulfonato- calix[4]arenes (H2O fixes cone conformation)............................................................... 14 Figure 1.5 The electromagnetic spectrum...................................................................... 22
Figure 1.6 Jablonski diagram ......................................................................................... 23
Figure 1.7 Mirror Image Rule and Franck-Condon Principle........................................ 28
Figure 1.8 Schematic diagram of a typical fluorometer................................................. 34
Figure 1.9 Generation of α- and β-spin states upon application of magnetic field ....... 36
Figure 1.10 Precession of nucleus in external magnetic field B0.................................... 39
Figure 1.11 Spin coupling of neighboring nuclei in different environments ................. 42
Figure 1.12 Carbon-13 NMR spectra obtained by different methods............................ 45 Figure 1.13 Schematic of NMR spectrometer................................................................ 46
Figure 1.14 Diagram of CE Instrumentation................................................................... 48
Figure 1.15 Generation of EOF...................................................................................... 50
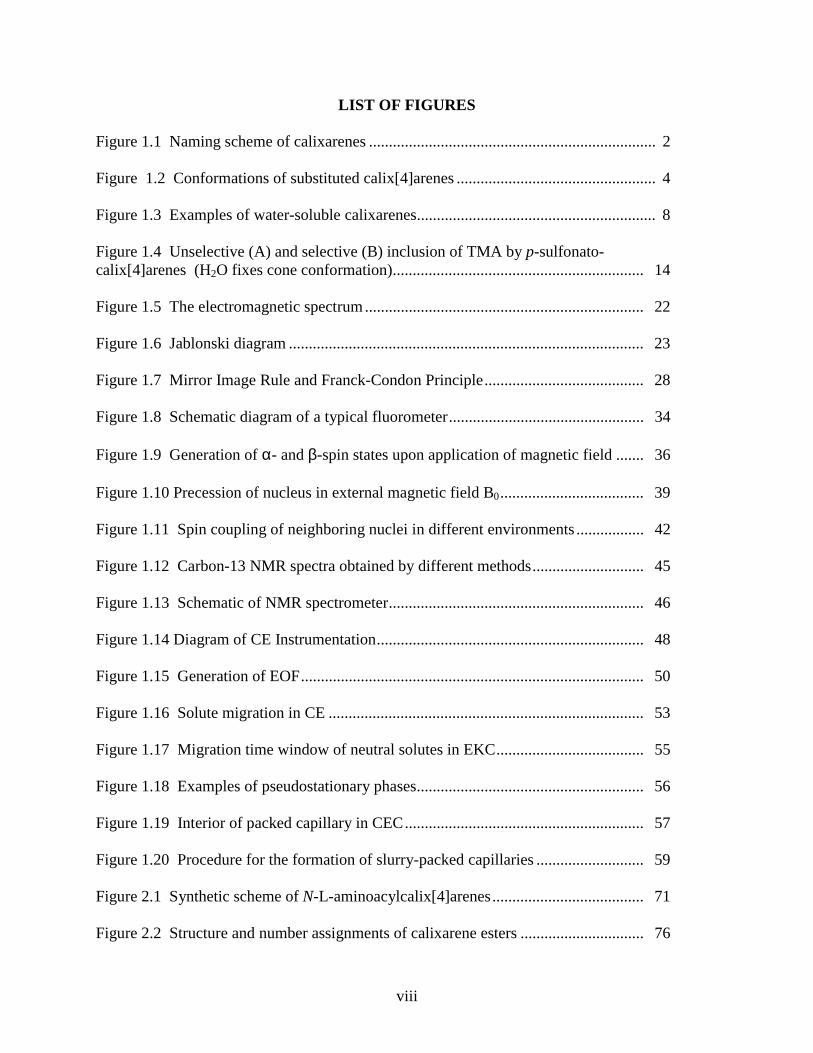
Figure 1.16 Solute migration in CE ............................................................................... 53
Figure 1.17 Migration time window of neutral solutes in EKC..................................... 55
Figure 1.18 Examples of pseudostationary phases......................................................... 56
Figure 1.19 Interior of packed capillary in CEC............................................................ 57
Figure 1.20 Procedure for the formation of slurry-packed capillaries ........................... 59
Figure 2.1 Synthetic scheme of N-L-aminoacylcalix[4]arenes...................................... 71
Figure 2.2 Structure and number assignments of calixarene esters ............................... 76

ix
Figure 2.3 Proton NMR spectrum of tetraacetic acid tetraethyl ester of 4-tert-butylcalix[4]arene (Compound 2, Figure 2.1)....................................................... 77 Figure 2.4 COSY Spectrum of CX4-VAL t-butyl ester................................................. 81
Figure 2.5 HMBC Spectrum of CX4-VAL t-butyl ester................................................ 82
Figure 2.6 TOCSY Spectrum of (N-L-leucinoacyl)calix[4]arene t-butyl ester .............. 84
Figure 2.7 Synthetic scheme of CVAPS stationary phase ............................................. 86
Figure 2.8 Solid State 13C NMR spectra ........................................................................ 89
Figure 3.1 Structure of N-Acylcalix[4]arene L-amino acid derivatives ......................... 94
Figure 3.2 Structures of binaphthyl derivatives and benzodiazepines ........................... 94
Figure 3.3 Separation of BNP (1), BOH (2), and BNA (3) using CX4-L-VAL ............ 96 Figure 3.4 Separation of BNP, BOH, and BNA using 10 mM CX4-L-LEU ................. 97 Figure 3.5 Effect of pH on the resolution of binaphthyl derivatives.............................. 98 Figure 3.6 Effect of urea concentration on resolution of binaphthyl derivatives........... 99 Figure 3.7 Separation of oxazepam enantiomers ......................................................... 101 Figure 3.8 Effect of pH on the chiral interaction (α) ................................................... 102 Figure 3.9 Effect of CX4-ILE concentration on the resolution of benzodiazepines.... 103 Figure 3.10 Separation of lorazepam enantiomers....................................................... 104 Figure 3.11 Separation of oxazepam enantiomers ....................................................... 104 Figure 4.1 Absorption and Fluorescence Spectra of a Two Component Host-Guest System........................................................................................................ 111 Figure 4.2 Structures of host calixarenes and guest (R)-BNA ..................................... 112 Figure 4.3 Calibration plot of CX4-LEU absorbance .................................................. 115 Figure 4.4 Absorbance spectra of 1×10⁻⁵ M R-BNA, 1x10⁻⁵ M CX4-LEU, and 1x10⁻⁴ M CX4-LEU................................................................................................ 115 Figure 4.5 Emission spectrum of 10-5 M R-BNA in 3.5x10⁻⁴ M CX4-LEU................ 116

x
Figure 4.6 Emission spectra of R-BNA in increasing concentrations.......................... 117 Figure 4.7 Emission intensity of R-BNA with and without absorbance correction..... 119 Figure 4.8 Double reciprocal plot of intensity of R-BNA as a function of CX4-LEU concentration ........................................................................................... 120 Figure 4.9 Double reciprocal plot of fluorescence intensity of R-BNA as a function of CX4-LEU concentration............................................................................. 120 Figure 4.10 Orientations of tandem cuvette in conventional fluorimeter .................... 122 Figure 4.11 Effect of CX4-LEU concentration and cuvette position on fluorescence intensity............................................................................................... 123 Figure 4.12 Fluorescence emission spectra of R-BNA ................................................ 125 Figure 4.13 Relationship between R-BNA intensity and CX4-LEU concentration..... 126 Figure 4.14 Double reciprocal plots assuming A) 1:1; and B) 2:1 stoichiometry between CX4-LEU and R-BNA.................................................................................... 127 Figure 4.15 A) Ultraviolet absorbance spectra of 1.47x10⁻⁵ M SCX4......................... 133

xi
ABSTRACT
This dissertation is an account of the synthesis, characterization, and application of novel
water-soluble chiral calixarenes in spectroscopy and capillary electrophoresis. It is divided into
four sections. The first part describes the synthesis and nuclear magnetic resonance (NMR)
characterization of four p-t-butylcalix[4]arenes bearing L-amino acid moieties on their lower
rims (CX4-AA). The structure and conformation of the derivatives have been determined using
one- and two-dimensional NMR techniques. Proton and carbon-13 spectra show that the
derivatives are tetra-substituted and adopt a cone conformation. The preparation and
characterization of silica-bonded calixarene stationary phases for capillary
electrochromatography is also reported in Chapter 2. A novel synthesis has been attempted, in
which one monomer unit of the calixarene is covalently attached to aminopropyl silica (APS) via
the formation of a peptide bond between the carboxylate terminus of the calixarene-amino acid
moiety and the primary amine of APS. Elemental analyses of the calixarene stationary phases
show increases in the percentages of carbon, hydrogen, and nitrogen compared to unmodified
APS. Carbon-13 cross polarization-magic angle spinning NMR (CP-MAS NMR) is used to
confirm successful attachment of the calixarenes to APS.
The third part focuses on the use of these derivatives as pseudostationary phases in
electrokinetic capillary chromatography (EKC). Comparisons have been made pointing out the
structural influence of each derivative on its selectivity toward enantiomeric and atropisomeric
pairs. Electrokinetic parameters such as buffer pH, chiral selector concentration, and organic
modifier concentration are varied to yield the best compromise between analyte resolution and
elution times.

xii
Spectroscopic studies of calixarene inclusion complexes generally focus on the properties
of molecules whose absorption and emission bands do not overlap those of calixarenes. In order
to investigate the complexation behavior of CX4-AA derivatives with binaphthyl atropisomers,
special considerations had to be taken because CX4-AA emission signals overlap those of
binaphthyls. In Chapter 4, a steady-state fluorescence method is proposed which investigates
and corrects for inner-filter effects of calixarenes during complexation studies of guests with
overlapping absorption and emission. Association constants and complex stoichiometries are
then determined from steady state fluorescence measurements and general correlations between
EKC and fluorescence data are established.

1
CHAPTER 1 INTRODUCTION
Part I. Calixarenes
1.1 Evolution of Calixarene Chemistry Calixarenes are macrocyclic compounds composed of phenolic units connected
by methylene bridges to form a hydrophobic cavity that is capable of forming inclusion
complexes with a variety of molecules. These molecules were first synthesized by
Adolph von Baeyer as products of the reaction of phenols with aldehydes in the presence
of strong acids.1 Because he could not isolate pure materials from these reactions, Baeyer
did not have elemental analysis data from which to propose structures of his products.
Realizing the marketable qualities of products of phenol-formaldehyde reactions, Leo
Baekeland patented a process which used a small amount of base to yield resinous
materials he called Bakelite.2 This patent, issued in 1908, constituted the first large-scale
production of a synthetic plastic, but the structural details of the resins were still
nebulous. It was not until 1944 that Alois Zinke, a professor of chemistry at the
University of Graz in Austria, and his coworker Erich Zeigler proposed a cyclic
tetrameric structure of the product of the base-induced condensation of p-tert-butylphenol
and formaldehyde.3 He later provided unequivocal proof of structure of this and other
phenol-formaldehyde products in 1952.4 Shortly thereafter, scientists at the Petrolite
Corporation in Missouri commercialized oxyalkylated alkylphenol-formaldehyde resins
as oil demulsifiers. They patented the “Petrolite Procedure” for making cyclic oligomers
in the 1970s.5
The pioneering work of C. David Gutsche in the late 1970s led to a renewed
interest in the chemistry of phenol-formaldehyde products, and his naming such products

2
calixarenes.6 Derived from the Greek word calix meaning vase, and arene indicating the
presence of aromatic rings, calixarenes have been synthesized in a number of sizes. A
bracketed number positioned between calix and arene indicates the number of phenolic
units linked to each other by methylene bridges to form the cavity of the molecule.
Substitution on the aromatic rings is specified by appropriate prefixes. The naming
scheme is illustrated in Figure 1.1.
Figure 1.1 Naming scheme of calixarenes The motivation behind Gutsche’s experiments was the possibility that the torus
shape of calixarenes could be appropriate for enzyme mimic building. Enzymes are
highly specific both in the reactions they catalyze and in their choice of substrates.
Calixarenes possess a well-defined cavity with simultaneous polar (lower-rim) and
nonpolar (upper-rim) properties. Also, they can be derivatized in terms of cavity size and
functional group to yield analyte-selective compounds capable of forming inclusion
R
OH
R OH RHO
R
OH
)n( If n = 3, and R = t-butyl,
the name of this compound
is p-t-butylcalix[6]arene

3
complexes. Therefore, their applicability to bioorganic chemistry was an important
springboard for other researchers interested in calixarene chemistry.
1.2 Structural Characteristics of Calixarenes
The basic structure of a calixarene consists of repeating phenolic units linked by
methylene groups to form a distinct cylindrical-shaped cavity. The wider side of the
cavity is defined as the upper rim, and the narrower hydroxyl side is the lower rim.7
Because they are easily derivatized, numerous reaction schemes have been reported that
produce these compounds with a myriad of functionalities and chemical properties.
Calixarenes with as few as three and as many as twenty repeating units are known.8 The
majority of studies deal with derivatives of calix[4]arenes, calix[6]arenes, and
calix[8]arenes. A common factor in all the reports is the retention of the calixarene
cavity. Cavity sizes of calix[4]arene, calix[6]arene, and calix[8]arene are 3.0, 7.6, and
11.7 Å, respectively.9
The spatial orientation of each phenolic unit lends to a conformation which is a
function of reaction conditions, the number of phenols linked together, their degree of
substitution, and sometimes the length of the linkage between phenols.10 The
unsubstituted parent compound of calix[4]arene, possesses a chair-like conformation with
two aromatic rings in one plane and the other two at right angles.11 The rotations of the
methylene groups between phenols bring about variable conformations in substituted
calixarenes. For example, p-tert-butylcalix[4]arenes more often assume the cone, partial
cone, 1,2-alternate, or 1,3-alternate conformation.7 Figure 1.2 shows a simplified
representation of each conformation. By convention, when all phenolic rings are pointed
up, this signifies the cone. When one or two are pointed down, this signifies one of the

4
partial cone arrangements. Proton nuclear magnetic resonance (NMR) measurements of
several calixarenes in solution show that they mainly exist in the cone conformation, but
they are conformationally mobile at room temperature.12
R
RR
R
R
R
R
R RR
R
R
R
R
R
R
cone partial cone 1,3-alternate 1,2-alternate
Figure 1.2 Conformations of substituted calix[4]arenes
The flexibility of calixarenes can be controlled by crystallization, which allows a
desired conformation to be fixed in the solid state. Further control of conformation can
be achieved by derivatization of the upper and lower rim functionalities with bulkier
groups which inhibit rotation. For instance, intramolecular bridging of phenols through a
spacer can form bridged13 and capped14 compounds, depending upon the size of the
spacer. Intermolecular bridging results in double calixarenes possessing single15 and
double bridges.16 In one case, two calix[6]arenes linked by six bridges have been
reported.17
1.3 Other Physical Properties
Measurement of a calixarene’s melting point and range allows one to determine
its purity quickly. Most calixarenes have melting points above 250 °C. Even subtle
isomeric differences in substituent groups can yield dramatic differences in the melting
points of calixarene derivatives.18 These same differences can affect solubility.
The most common forms of calixarenes are insoluble in water, due to their
aromatic components. They also possess limited solubility in organic solvents, thereby

5
making their purification and characterization a formidable task. Most forms are
sufficiently soluble to allow spectral analyses in a limited number of common organic
solvents however. Again, derivatization can be employed to induce different solubilities.
It is interesting to note that the organic solvent solubility is increased by those
substituents that tend to lower the melting point.19 The water-solubility of calixarenes
will be discussed separately.
In spite of their low solubilities in organic solvents, the spectral properties of
calixarenes have been investigated using infrared (IR), ultraviolet (UV), nuclear magnetic
resonance (NMR), X-ray crystallography, mass spectrometry (MS), and fluorescence
spectroscopy. Each technique provides valuable insight about the calixarenes’ structure
and other properties using different types of radiation. Some will be discussed in more
detail in a separate section, but the key information they give about calixarenes will be
touched upon briefly at this time.
A distinctive spectral component of the IR spectra of calixarenes is the low
frequency of the OH stretching vibration, ranging from approximately 3150 cm-1 to 3300
cm-1, depending upon the size of the molecule. This is attributed to very strong
intramolecular hydrogen bonding between the lower rim hydroxyl groups. This circular
hydrogen bonding20 is strongest in the tetramer and weakest in the pentamer.21
A pair of absorption maxima near 280 and 288 nm occur in the UV spectra of
calixarenes. The ratio of the intensity at these two wavelengths is a function of
calixarene size, at 1.30, 0.90, and 0.75 for the tert-butyl derivatives of calix[4]arene,
calix[6]arene, and calix[8]arene, respectively. The molar absorptivities (εεεεmax, L mol-1 cm-

6
1) range from 9,800 to 23,100 at 280 nm and 7,700 to 32,000 at 288 nm, increasing as the
size of the calixarene increases.
The NMR spectra of calixarenes are relatively simple, because the molecules are
symmetrical. The 3.5-5.0 ppm region in the 1H NMR spectra provides a very distinct
pattern for conformational analysis, because the methylene bridge protons are affected
most by conformational changes. In the cone conformation, neither proton is positioned
inside the cavity. This results in a splitting pattern in the 1H spectrum of calix[4]arene, a
pair of doublets, one occurring around 3.2 ppm and the other at 4.9 ppm. The patterns for
the other conformers are as follows: partial cone (two pairs of doublets (ratio 1:1) or one
pair of doublets and one singlet (ratio 1:1)); 1,2-alternate (one singlet and two doublets
(ratio 1:1)); and 1,3-alternate (one singlet). A singlet arising from the OH groups varies
in position (8-10 ppm) with the size of the calixarene, but does not correlate with the
strength of circular hydrogen bonding.
X-ray crystallography provides conclusive proof of the calixarene structure. The
first example appeared in 1979 when Andreetti and coworkers at the University of Parma,
Italy, published the single crystal data for calix[4]arene.22 Mass spectrometry has been
successfully used to determine the molecular weights of calixarenes. Though not as
revealing of structural detail as X-ray crystallography or NMR spectroscopy, the host-
guest features of calixarenes can be investigated.23 Fluorescence spectroscopy has also
been a useful tool for gaining insight into the complexation behavior of calixarenes and
into the microenvironments of calixarene complexes.

7
1.4 Synthesis of Calixarenes
The publication of Gutsche’s one-pot synthetic procedures for tert-
butylcalixarenes with four,24 six,25 and eight26 repeating units led to a proliferation of new
calixarene derivatives in the literature. One of the most significant results of his
procedures was the excellent yield of the major products. It was shown that by choosing
the reaction conditions properly, the starting material could be transformed to the cyclic
tetramer, cyclic hexamer, or cyclic octamer, each having the same substituent in all the
para- positions. Coupled with the fact that the starting materials are readily available,
significant strides have been made in the synthesis of calixarenes since the 1980s. A
survey of the literature reveals that over 200 articles have been published which report
the synthesis of novel calixarene derivatives since 1995. Because this dissertation
focuses on water-soluble calixarene derivatives, the subsequent discussion will be limited
to that topic.
Calixarenes are inherently insoluble in water. This makes them unsuitable for
substrate-binding studies in aqueous solution. Consequently, synthesis of water-soluble
derivatives is necessary to extend their utility. The tetracarboxylic acid of p-tert-
butylcalix[4]arene, introduced by Ungaro and coworkers in 1984 was the first example of
a water-soluble calixarene.27 Functionalized with four carboxylic groups on the lower
rim, its inclusion properties could be studied in aqueous solution. In the same year,
Shinkai reported the preparation of p-sulfonato calix[6]arene.28 Following the
preparation of the sulfonated tetramer and octamer,29 other anionic water-soluble
derivatives containing nitro,30 phosphonic acid,31,32 and carboxyl33 moieties emerged.
Shinkai is also noted for reporting the first example of a cationic water-soluble calixarene

8
which both strongly bound anionic guest molecules and exhibited enzyme-mimetic
activity.34 Other cationic calixarenes contain tetraalkylammonium groups and primary
amines. 32,35 In order to avoid unspecific binding36 or repulsion of ionic groups in
complexation experiments, neutral water-soluble calixarenes have been synthesized with
sulfonamides,37 hydroxyl group- containing amides,38 sugars,39 polyoxyethylene40 and
polyalcohol residues.41 Examples of ionic and neutral water-soluble calixarenes are
shown in Figure 1.3.
H2C
OH
)n(
SO3H
OH
)n(
P(OH)2
O
Anionic calixarenes
+NMe3
OH
)n(
Cl- CH2
OH
)n(
+NMe3Cl-
Cationic calixarenes
SO2
OH
)n(
N(C2H4OH)2
Neutral calixarenes
n = 4, 6, 8x = 1, 2, 3, ... , x-1
NO2
OH)n(
O(CH2CH2O)xH
)( 8
H2N
HN( )
4
Figure 1.3 Examples of Water-soluble Calixarenes

9
Acid dissociation constants (pKa) for the OH groups of some water-soluble
calixarenes have been determined by potentiometric and photometric titrations. Because
the pKa of p-nitrophenol in water is about 3 units less than that of alkylphenols, Böhmer
and associates were able to determine the first dissociation constant in a molecule
composed of one p-nitrophenol unit among several alkylphenol units.42 The
spectroscopic properties of the p-nitrophenol made it possible to monitor the UV-Visible
absorbance as a function of the solution pH. By use of this approach, pKa values have
been determined for tetra-substituted p-nitrocalix[4]arenes.43,44 The pKa values obtained
for sulfonated (1) and nitro (2) and neutral sulfonamide (3) calix[4]arenes depicted in
Figure 1.3 are summarized in Table 1.1.
Table 1.1 pKa Values of Water-soluble Calix[4]arenes
pKa values Calixarene Solvent
pKa1 pKa2 pKa3 pKa4
(1) H2O 1 3.0 4.0 >11
(2) H2O:Tetrahydrofuran (70:30 v/v) 0 10.3 13 >14
(3) H2O 1.8 9.7 12.5 >13
The tetra-substituted calix[4]arenes in Table 1 have very low pKa1 values. In the p-
nitrocalix[4]arenes (2) for example, the pKa1 value is lower by seven pKa units than in its
non-cyclic analog. This indicates that strong intramolecular hydrogen bonds bring about
a very acidic OH group, i.e., the hydrogen bonds through the three remaining protons
stabilize the mono-anionic species. The pKa4 values are very high, because the last
proton is trapped in a ring of four oxygen atoms. Shinkai and coworkers believe that the

10
unusually strong hydrogen-bonding in the calixarene cavity is responsible for the large
differences in pKa values and that this hydrogen-bonding stabilizes the cone
conformation.45
1.5 Complexation Properties of Water-soluble Calixarenes
Interest in calixarenes is largely due to their ability to include other entities within
themselves. This inclusion of metal cations (main group, transition metal, actinides and
lanthanides), organic cations and anions, and neutral molecules has driven the
understanding of factors which determine selective molecular recognition, and
consequently the design of molecular systems which perform highly efficient and
selective chemical, physical, and biomimetic duties. The capability of calixarenes for
forming 1:1 inclusion complexes with aromatic guest molecules,46 was first demonstrated
in 1979. However, this was not in water. Since most biological processes take place in
water, researchers have taken various approaches to solubilize calixarenes in aqueous
systems over the years. A full literature review is beyond the scope of this dissertation.
Therefore, only selected results on complexation, solvent extraction and membrane
transport will be discussed.
1.5.1 Complexation of Cationic Guests
The first water-soluble calixarenes, carboxylic acid derivatives of p-tert-
butylcalix[4]arene, were very efficient in the extraction of uranyl (UO22+), lead, and alkaline earth
cations from water to dichloromethane, but not very selective.47 A hexacarboxylated derivative
of p-sulfonated calix[6]arene was synthesized and deemed a “super-uranophile” by Shinkai,48
because of its ability to selectively extract uranium from sea water49,50 over other metal
ions present in a greater excess. They later used a chromatographic column containing
the same calixarenes immobilized in a polymer resin to acquire UO22+ directly from the

11
ocean.51 They spectroscopically evaluated the selectivity of the super-uranophile by
monitoring changes in the absorption band of the UO22+•calixarene complex upon
addition of competing metal cations (Mn+). They obtained the following selectivity
factors (K UO22+/KM2+): >10+17 for Mg2+, 10+15.3 for Ni2+, 10+13.1 for Zn2+, and 10+12 for
Cu2+. This extremely high selectivity was explained by a coordination-geometry concept,
wherein the calixarene provides ligand groups arranged in the appropriate manner for
pseudoplanar hexacoordination of UO22+. The other cations usually require either square
planar or tetrahedral coordination geometry for favorable binding. Another possible
explanation suggesting hole-size selectivity related K UO22+ to the rigidity of the calixarene
and the size of the guest ions. Less emphasis was placed on this explanation because the
cavity sizes of calixarenes are variable due to their conformational flexibility, and the
radii of the competing metal cations are similar to that of UO22+. In any event, authors
alluded to complexation through the carboxylate groups.
Complexation in solution generally occurs through the hydroxyl or the
carboxylate groups, but sulfonated calix[4]arenes have also been reported to form a
complex of two Pb2+ ions coordinated both by sulfonate oxygens and water molecules. 52
Carboxylated derivatives of p-sulfonatocalix[4]arene were shown to form Cu2+
complexes as well.53 However, a 1:1 metal•calixarene stoichiometry could not be
assumed solely, because monoprotonated, diprotonated, and hexaprotonated species were
also detected. Sulfonated and carboxylated calix[4]arenes bearing crown ether moieties
have also been reported to form 1:1 complexes with cesium.54
An environmentally relevant application of calixarenes is the extraction of
radioactive metals from acidic or high salinity media generated from the reprocessing of

12
spent nuclear fuels. Uranium and plutonium are effectively extracted from the fuels by
tri-n-butylphosphate, then purified and reused. Other actinides and fission products with
long half-lives remain in the acidic (1 M HNO3) and high salinity (4 M NaNO3) solutions
arising from this process. Some of the products (93Zr, 107Pd, 129I, 135Cs, and 237Np) have
half-lives on the order of 106 years. Others like 90Sr and 137Cs have half-lives around 30
years, but they account for about 90% of the heat released by high activity wastes. To
this end, researchers are focusing efforts on calixarenes which exhibit high selectivity for
strontium, cesium, and actinides over alkali metals using membrane transport55,56 and
basic extraction and complexation studies.57,58
Calix[4]arene-lanthanide complexes have been synthesized and may find utility as
luminescent probes for imaging and bioassays, thus replacing radioimmunoassays.59
Typical emission of Eu3+ and Tb3+ luminescence occurs at 618 nm and 545 nm,
respectively, which is spectrally distinct from the fluorescence of most biological
systems. The attachment of a sensitizer (preferably with an excitation wavelength above
350 nm) allows the use of standard optics to monitor the emission, shields the ions from
the surrounding water, and maximizes the intensity of emitted light.60 Reports of
calixarene-lanthanide complexation in aqueous systems are geared toward the
optimization of complex solubility and enhancement of long-wavelength absorptivity of
sensitizers to produce complexes suitable for practical applications.61
Complexation of Eu3+ and Tb3+ ions in calix[4]arenes are reported to yield highly
luminescent species with millisecond lifetimes, three orders of magnitude higher than the
background fluorescence. Complexation in a tetraamide derivative of p-t-
butylcalix[4]arene gave a neutral water-soluble system.62 The tricarboxylic acid

13
calix[4]arene derivatives yielded neutral species as well, the lanthanide ions being
effectively shielded from the solvent.63 Calixarene derivatives tetra-substituted with
carboxylic esters and one aromatic sensitizer group formed charged Eu3+ and Tb3+
complexes and enabled excitation of their luminescence up to 350 nm. Other lanthanide
complexes were prepared via complexation of the phenolic oxygen atoms of p-sulfonated
calixarenes, but these complexes were also positively charged.64 To circumvent aspecific
binding, neutral complexes are recommended. Other examples of complexes of
calix[4]arenes with cations in biological systems show clinical promise. Kinetically
stable 81Rb complexes of bridged calix[4]arenes have been synthesized with the ultimate
goal of rubidium immobilization for organ imaging.65,66
After the ability of tetracarboxylic acid calix[4]arenes to extract 225Ac3+ from an
aqueous to an organic phase was demonstrated,67 the development of potential
calix[4]arene-based radiotherapeutic agents in mice was reported.68 This premier study
of bioconjugation of 225Ac3+-chelating calix[4]arenes revealed that conjugation does not
impair immunoreactivity when calixarenes are bound to a mouse monoclonal antibody.
Also, immune response was strongly influenced by the carrier type, the dosage, and the
injection method used.
The crucial role that weak cation-π interactions play in molecular recognition is
exemplified by the complexation of quaternary ammonium cations.69,70 Selective guest
inclusion is determined by host preorganization to an extent. For example,
conformationally mobile p-sulfonatocalix[4]arene includes trimethylanilinium (TMA)
unselectively. In contrast, one molecule of water bridges the two opposite phenolate
oxygens in the lower rim of p-sulfonatocalix[4]arene-1,3-dicarboxylic acid, fixing it in

14
the cone conformation. Consequently, the aromatic portion of TMA is selectively
included in the calixarene cavity (Figure 1.4).71 This induced selectivity is also possible
in the complexation of the neurotransmitters choline and acetylcholine with the
tetrameric and hexameric forms of p-sulfonatocalixarene through electrostatic
interactions and hydrophobic effects.72,73
(A)
(B)
Figure 1.4 Unselective (A) and selective (B) inclusion of TMA by p- sulfonatocalix[4]arenes. (H2O fixes cone conformation)

15
1.5.2 Complexation of Anionic Guests
Anion recognition has not been as widely explored as cation recognition, because
anions possess unique properties that must be considered when synthesizing appropriate
receptors. The negative charge is generally delocalized over a number of atoms, and the
shape can be spherical, linear, planar, tetrahedral, or octahedral. Complexation in water
is a difficult undertaking because anions are strongly hydrated and must be desolvated
before binding can occur. Still, the need exists for systems which could sequester anionic
species such as phosphates, which are environmental contaminants and important
components of biologically significant compounds like ATP.74,75 However, few
examples of anion complexation by water-soluble calixarenes exist.
To gain an understanding of the roles of peptide-carbohydrate and carbohydrate-
carbohydrate interactions in biological processes, a family of calixsugars which are
capable of carbohydrate recognition have been synthesized.40,76 Attachment of
carbohydrate moieties to calix[4]arenes induced water-solubility while retaining the
hydrophobic cavity, and was presumed to enhance binding properties of polar chiral
substrates. The lone water-soluble derivative formed complexes with charged guests D-
glucosamine hydrochloride and anionic dihydrogen phosphate, as evidenced by shifts in
the 1H NMR spectra. Neutral carbohydrate and N-protected amino acids were not
complexed. In another report, researchers used a water-soluble azacalix[4]arene to bind
anionic carbohydrates. Inositol triphosphate and fructose 1,6-phosphate were included
in the cavity, which is larger than a normal calix[4]arene cavity.36
Complexation of naphthalenesulfonate derivatives by charged calixarenes was
investigated spectroscopically by monitoring their fluorescence. Upon comparison of the

16
results with those of their hydrophobic analogs, they were reported to complex by
inclusion of their hydrophobic portions in the calixarene cavity.77,78 Also, a series of π–
metallated calixarenes were synthesized, incorporating positively charged redox active
transition metal centers directly onto the calixarene aromatic rings.79 X-ray crystal
structures confirmed the complexation of tetrafluoroborate, sulfate, and iodide ions.80
1.5.3 Complexation of Neutral Guests
Most investigations of the complexation of neutral molecules by water-soluble
calixarenes were performed during the 1980s.9,46 A correlation between binding
constants and host-guest complementarity was established by studies of the complexation
of aromatic hydrocarbons by water-soluble p-carboxyethyl calix[4]arenes.33,81 As
expected, larger calixarenes were able to include larger aromatic hydrocarbons.
Tetrameric calixarenes were not selective and did not form inclusion complexes with
compounds as small as naphthalene. In contrast, their hexameric and octameric analogs
were found to be selective for and capable of including larger polyaromatic hydrocarbons
such as perylene.
The complexation of p-sulfonated calix[6]arenes with neutral analytes has also
been reported. When the complexation with the neutral species ferrocenylmethanol was
compared to those of cationic ferrocenyl derivatives, the binding constant value measured
with the neutral guest was slightly lower. This indicates that nonelectrostatic interactions
bring about most of the free energy change in the complexation process.82
Comparative studies have been conducted which determined the selectivity for
nitriles, ketones, and alcohols by various water-soluble calixarenes (specifically, upper
rim p-sulfonated, p-sulfonated calix[4]arenes with lower rim carboxylic acids, and p-t-

17
butylcalix[4]arene tetracarboxylic acids). The p-sulfonated derivatives complexed with
all guests, but the tetracarboxylated p-t-butylcalix[4]arene only complexed acetonitrile.
In fact, it complexed acetonitrile more efficiently than the other two hosts molecules.
The authors surmised that negative interactions between the nitrile dipole and the
sulfonate groups caused inefficient complexation with these hosts.83 Also, ketone
selectivity was exhibited by the p-sulfonated derivative, whereas its carboxylated form
was selective for alcohols, indicating that the charges on the sulfonated hosts assisted in
the hydrophobic binding of the guests. More recently, the association constants of n-
alcohols with p-sulfonated calixarenes were determined by headspace gas
chromatography in order to investigate differences between complex formation in
calixarenes and cyclodextrins.84
The coupling of calix[4]arenes to cyclodextrins has brought about the
construction of new receptor molecules for neutral analyte binding and optical sensing.85
Typically, a fluorophore is attached to a cyclodextrin. Sensing is evidenced by the
optical change of the fluorophore when it is in competition with an analyte for
accommodation in the cyclodextrin cavity. In the case of covalently coupled
calix[4]arene-β-cyclodextrin molecules, the fluorophore is attached to the calixarene
instead. The calixarene brings about a favorable orientation for intramolecular inclusion
of the fluorophore within the β-cyclodextrin and an enlargement of the β-cyclodextrin
cavity, thus increasing the hydrophobic surface for analyte binding. Amphiphilic
molecules composed of calix[4]arenes coupled to β-cyclodextrins have been reported to
complex steroids, terpenes and other neutral natural products, with the sensitivity for
steroids being approximately 10 times higher than that for terpenes.86 These covalently

18
coupled molecules possess complexation properties which are different from those of
native β-cyclodextrin.
1.6 Comparison to Cyclodextrins
The structures of the simplest calixarenes bear a likeness to those of
cyclodextrins, which are composed of oligosaccharide units covalent bound together to
form a hydrophobic cavity. Both have been reported to selectively form inclusion
complexes with smaller compounds. Cyclodextrins are natural products whereas
calixarenes are largely synthetic. With an inner diameter of 5.7 Å and possessing six
monomer units, α-cyclodextrin is the smallest. Beta-cyclodextrin is composed of seven
monomer units and has an inner diameter of 7.8 Å. The largest one, γ-cyclodextrin, has a
diameter of 9.5 Å and is composed of eight monomer units. Similarly, the diameters of
calixarenes bearing four, six, and eight units are 3.0, 7.6, and 11.7 A, respectively. Table
1.2 summarizes some similarities and differences between calixarenes and cyclodextrins.
Table 1.2 Properties of Calixarenes and Cyclodextrins
Calixarenes Cyclodextrins
Monomer units Phenolic units oligosaccharides
Cavity inner diameter (Å);
No. of monomer units
3.0 ; four
7.6 ; six
11.7; eight
5.7 ; six
7.8 ; seven
9.5 ; eight
Cavity properties Flexible
heterogeneous
Rigid
homogeneous
Solubility Not water-soluble Water-soluble
Spectroscopic properties Strong UV absorption UV transparent
Derivatization Easy Difficult
Inherent Chirality No Yes

19
1.7 Chiral Calixarenes
Chiral recognition plays an important role in biological systems. For example,
only L-amino acids are constituents of proteins. Hydrogen bonding of the amino acids
within a protein contributes to its three-dimensional structure and subsequent
functionality. Macrocyclic platforms anchoring amino acids and peptides have been
designed to model the organizational, assembly and molecular recognition processes in
biological systems.87,88 Even though they possess a cavity suitable for molecular
recognition, the highly symmetrical structures of simple calixarenes render them achiral.
Therefore, in order for calixarenes to be more useful in biomimetic chemistry, they must
be chiral.
Chirality can be induced in calixarenes by the introduction of chiral substituents
on the rims, by inducing asymmetry by attaching different functional groups on the rims
or phenols, and by conformational isomerism. This was first accomplished by
Muthukrishnan and Gutsche, who reported the synthesis and circular dichroic
characteristics of mono- and di-camphorsulfonyl esters of p-t-butylcalix[8]arene.89 The
complexation properties of water-soluble p-sulfonated calixarenes bearing (S)-2-
methylbutoxy groups as chiral substituents were also studied.90,91 Circular dichroism
investigations revealed that conformational fluctuations of hexamers and octamers were
minimized upon inclusion of guest molecules, whereas tetramers remained fairly rigid
irrespective of guests.92 Further study of the hexamers and Auramine O dye revealed that
the fluorescence of the dye is enhanced as a result of its association with both the chiral
and achiral calixarenes.93 However, the achiral calix[6]arene did not restrict the rotation
of the diphenylaniline groups of Auramine O as completely as the chiral calix[6]arene

20
did. The chiral hexamer was also shown to discriminate between enantiomers of
propranolol.94
Amino acids have also been attached to calixarenes to induce chirality and in
some cases water-solubility. First, L-cysteine residues were attached to the upper rims of
calix[4]arene and calix[6]arene to yield products which are water-soluble at acidic and
basic pH. Fluorescence studies were then conducted which determined that the pH of the
medium affected not only the hydrophobicities of the cavities but also their selectivities
toward guests.95 Calixarenes bearing amino acid functionalities have also shown promise
in biological applications. For instance, calix[4]arenes bridged with D- and L-alanine
units are reported to be biologically active vancomycin antibiotic mimics.96 Other amino
acid-derivatized calixarenes are reported to discriminate between binaphthyl
atropisomers,97 chiral ammonium ions,98 and phenylglycinol enantiomers.99
Part II. Introduction to Molecular Spectroscopy
Electromagnetic radiation (ER) is a form of energy that moves through space at
very high speed. It manifests itself in the forms of gamma-ray, X-ray, ultraviolet, visible,
radiant heat, microwave, and radio-frequency radiation, each form varying in wavelength
and frequency. It possesses both wave properties and those of discrete particles called
photons (packets of energy). The wave model describes ER as electric and magnetic
fields which travel from the source at in-phase, sinusoidal oscillations much like waves of
water across the surface of a body of water. The fields are at right angles to each other
and to the direction of propagation. The electric field is responsible for the majority of
physical processes of interest to spectroscopists (including transmission, reflection,
refraction, and absorption), whereas the magnetic field is specifically responsible for

21
absorption of radio-frequency radiation. In this model, multiplication of the frequency of
ER by the wavelength will give the velocity of propagation. The frequency of incident
ER is independent of the medium through which it passes, but the velocity of ER is not.
Consequently, the wavelength of radiation is also dependent upon its velocity, except
when it is in a vacuum or air. For those conditions its velocity is equivalent to the speed
of light (3.00 x 10⁸ m/s) and is represented by Equation 1.1
λν=c , 1.1
where c is the velocity of light in a vacuum or air, λ is the wavelength of ER in m, and ν
is the frequency of ER in hertz (seconds-1).
The particle model describes the permanent energy transfer of ER to the
absorbing medium or from the emitting object. A consequence of the photoelectric
effect, it depicts ER in a form capable of transferring enough kinetic energy to some
electrons on a surface to the extent that they are almost instantaneously released from the
surface. The number of electrons released is proportional to the intensity of the incident
ER. The relationship of the dual characteristics of ER is expressed by the Einstein-
Planck equation (1.2), which proportions the frequency of ER with the net kinetic energy
of the ejected photoelectron
νhE = , 1.2
where E is the energy of a single photon of ER in Joules, and h is Planck’s constant
(6.626 x 10⁻³⁴ Joule•seconds).
The electromagnetic spectrum qualitatively depicts the position of each major
type of radiation based upon its energy, i.e., wavelength, frequency, and interaction with

22
molecules (Figure 1.5). Although adjacent regions overlap each other, they can be
categorized by the methods of generating and detecting the various kinds of radiation.
Figure 1.5 The electromagnetic spectrum
Spectroscopy is a branch of science which identifies and measures interactions of
ER with matter, whether absorbed, emitted, or scattered. The transition of matter from a
lower energy state to a higher energy state is the basis of absorption spectroscopy. The
matter which is promoted depends upon the frequency of the radiation absorbed. For
instance, X-ray radiation oscillates at a high frequency. Therefore, it is energetic enough
to excite core electrons. Conversely, lower frequency ultraviolet and visible radiation
only excites bonding (valence) electrons. Lowest energy transitions occur in the
vibrational and rotational levels of molecules and nuclei and are induced by infrared and
radio waves. Emission spectroscopy, on the other hand, deals with the descent of an
atom or molecule from a higher energy state to a lower one. This transition is usually

23
accompanied by the emission of radiant energy, which can be measured by a variety of
spectroscopic techniques specific to the frequency of the radiation. Common emission
spectroscopies are X-ray fluorescence, inductively coupled plasma, and phosphorescence.
The various processes associated with the absorption and emission of radiation by
organic molecules containing an even number of electrons can be graphically represented
by the Jablonski diagram (Figure 1.6). The orbital angular momentum of an organic
molecule is either of singlet or triplet multiplicity.
Figure 1.6 Jablonski diagram
Multiplicity is determined by the overall spin quantum number S in Equation 1.3,
12 += SM , 1.3
where S is the sum of the electron spins (+1/2 and -1/2). When all the electrons are
paired, S equals zero (the sum of +1/2 and -1/2). Therefore, the multiplicity is singlet.
When an electron from an occupied orbital is excited to a higher, previously unoccupied

24
orbital, it may flip its spin. Consequently, the absolute value of S is unity and the
multiplicity is triplet. The ground, first, and second singlet electronic states of the
molecule are given by S0, S1, and S2, and the first excited triplet electronic state is given
by T1 in the diagram. Superimposed on each electronic energy level are vibrational
energy levels, denoted by v0, v1, v2, etc.
1.8 Absorption
When a solution absorbs electromagnetic radiation emitted from a given light
source, the quantity of radiation absorbed follows definite physical laws.100 The amount
of radiation absorbed by the solution (A) is the logarithm of the ratio of the intensity of
the incident radiation (I0) and the intensity of radiation which is transmitted through the
solution (I), described mathematically as
IIA 0log= . 1.4
The absorbance is linearly related to the concentration of the solution by the Beer-
Lambert law, which is expressed as
bcA ε= , 1.5
where ε is the molar absorptivity, b the light path length, and c the concentration of the
solution. Absorptivity is the inherent ability of a chemical species to absorb light and is
constant at a given wavelength. The path length is the distance the light travels through
the measured solution.
The absorptive process involves a transfer of energy from a photon to a molecule.
Electrons are then promoted from the lowest energy level So to higher energy levels (S1
and above) called excited states. The energy difference between the two states is equal to
the energy of the incident photon. The electronic transition takes place in approximately

25
10-15 seconds, which is much faster than nuclear reorganization (>10-14 sec). Therefore,
the higher energy state is reached without rearrangement of the nuclei. This hypothesis,
the Franck-Condon principle, also states that a specific transition with the highest
probability in the absorption phenomenon will have the highest probability of the
reciprocal transition in the emission phenomenon. After absorption, a molecule can
return to the ground state by radiative and non-radiative processes. The radiative
processes are fluorescence and phosphorescence, and the non-radiative pathways are
vibrational relaxation, internal conversion, intersystem crossing, fluorescence quenching,
and other deactivation processes.
1.9 Vibrational Relaxation
When a molecule has achieved an electronically excited state, it undergoes
vibrational relaxation in order to return to the lowest vibrational level of the electronic
excited state. Vibrating at the frequency characteristic of the excited state, it relinquishes
its excess vibrational energy in the form of heat through collisions with other molecules
in the excited state and through collisions with solvent molecules. Occurring in the time
frame of 10-14 to 10-12 seconds, it is among the more rapid deactivation processes,
allowing thermal equilibration in the excited state prior to radiative processes. It is
represented by gray wavy arrows in Figure 1.6.
1.10 Internal Conversion
After vibrational relaxation to the lowest energy level in the highest excited state,
energy can only be lost by moving to a lower electronic energy level. When an overlap
exists between the lower vibrational levels of the higher electronic level and the higher
vibrational levels of a lower electronic level, a crossover from the higher to the lower

26
excited singlet state is favorable. Such a transition happens in approximately 10-12
seconds, and is represented in Figure 1.6 by a pink wavy arrow between S2 with S1. A
slower internal conversion (10-8 seconds) can also occur between S1 and vibrational
levels in S0, but this is favored when the molecule has a large number of vibrational
levels in the lower state, thereby lessening the energy difference between the upper and
lower states.
1.11 Intersystem Crossing
Non-radiative transition from the lowest singlet excited state to the triplet state in
a manner similar to internal conversion is called intersystem crossing. Represented in
Figure 1.6 by a red wavy arrow between S1 and the vibrational levels of T1, it involves
the change in spin of the excited electron. Consequently, there is a 106-fold lower
probability of this spin-forbidden electronic transition occurring compared to internal
conversion. Nevertheless, excited electrons in molecules containing transition-metal ions
or heavy atoms such as iodine, almost exclusively deactivate through intersystem
crossing. With a lifetime of 10-8 seconds however, it can compete with fluorescence for
deactivation of S1.
1.12 Phosphorescence
Another radiative process, phosphorescence, occurs from the lowest vibrational
level of T1 to vibrational levels in S0. It is longer-lived than fluorescence, typically
lasting from 10-6 to 10 seconds because it arises from the spin-forbidden process of
intersystem crossing. It is denoted in Figure 1.6 by red downward arrows originating
from T1, and it occurs at wavelengths longer than those resulting from fluorescence.
Because triplet states are so long-lived, solution phosphorescence is often precluded by

27
triplet-to-singlet intersystem crossing, solvent collisional deactivation, quenching,
photochemical reactions, and energy transfer processes.
1.13 Fluorescence
Also possessing a lifetime on the order of 10-8 seconds, fluorescence is a radiative
process which can compete with internal conversion and intersystem crossing. Demotion
of excited electrons from the lowest vibrational level of S1 to the vibrational levels of S0
may come about by the emission of visible or ultraviolet light, i.e., fluorescence. Very
rarely does this process take place between two electronic states other than S0 and S1.
Shown in Figure 1.6 by green downward arrows, the wavelength of the emitted light is
longer than that which is initially absorbed, because of energy dissipation by vibrational
relaxation and other competing processes. The energy of the emitted photon is equivalent
to the difference in energy between S1 and the vibrational level of S0 to which the
transition occurs. Characteristics such as spectral position and shape, and environmental
factors affecting fluorescence appear in subsequent sections of this chapter.
1.13.1 Characteristics of Fluorescence Emission
Emission of a photon after relaxation of an electronically excited molecule from
the lowest singlet excited state to the ground state is called fluorescence. Typically
identical to the absorption spectrum, the fluorescence excitation spectrum is a plot of the
relative efficiency of exciting radiation at various wavelengths to produce emission at a
given wavelength. It can be obtained by fixing the emission wavelength even though its
shape is independent of the monitored emission. The fluorescence emission spectrum is a
plot of the relative intensity of emitted radiation as a function of emission wavelength
(nm). It is dependent upon the chemical structure and the environment of the molecule,

28
but it is typically independent of the excitation (absorption) wavelength. Vibrational
relaxation, solvent effects and excited state reactions cause a loss of energy when the
molecule is in the excited state, thus causing fluorescence to occur at longer wavelengths
than absorption. This is the basis of the Stokes shift phenomenon which is illustrated in
Figure 1.7 and can be estimated by:
−×=
emex
ShiftStokesλλ11107 , 1.6
where λex and λem are the wavelengths (in nm) of maximum excitation and emission,
respectively.101
Figure 1.7 Mirror Image Rule and Franck-Condon Principle
Excitation (S0S1) and emission (S1S0) spectra are generally mirror images of
each other because they represent reciprocal transitions. Recall that the Franck-Condon
principle states that the position of the nuclei does not change during an excitation or
emission event. Furthermore, if the vibrational energy levels are equally separated in

29
both the ground and lowest excited singlet states of the molecule, the same transitions are
involved for both excitation and emission events. For example, the (S0)0 – (S1)2
absorption will most probably result in the (S1)0 – (S0)2 emission. Examples of such
transitions are shown by vertical arrows in the potential energy distance diagram in
Figure 1.7. Polycyclic aromatic hydrocarbons generally obey the mirror image rule, but
deviations occur when nuclear displacements or chemical reactions occur in the excited
state.
1.13.2 Fluorescence Kinetics
Because two other deactivation processes (internal conversion and intersystem
crossing) occur along the same time frame as fluorescence, not all molecules possessing
fluorescent potential will actually do so to return to the ground state. Therefore, two
parameters can be employed to measure fluorescence with respect to the other processes.
The fluorescence quantum yield, ΦF, is the fraction of excited molecules that fluoresce,
and the lifetime, τ, is the average time that an excited molecule will spend in the excited
state. Both parameters are dependent upon changes in the chemical environment around
the molecule, such as solvent, temperature, viscosity, or quencher concentration.
Fluorescence efficiency or quantum yield, ΦF, is the ratio of the number of
photons emitted to the total number of excited molecules. It is determined by the relative
rate constants of the competing processes by the following equation:
[ ]Qkkkkkk
QVRISCICF
FF ++++
=Φ , 1.7
where kF, kIC, kISC, kVR, and kQ are rate constants for fluorescence, internal conversion,
intersystem crossing, vibrational relaxation, and quenching, respectively. The term [Q] is

30
the concentration of quencher, which is a species which reduces the intensity of
fluorescence in a solution. When ΦF approaches zero, nonradiative processes are more
prevalent. Conversely, when ΦF approaches unity, fluorescence is the dominate process.
The mean fluorescence lifetime (τ) is the reciprocal of the sum of the rate
constants of all deactivation processes listed in Equation 1.7. The reciprocal of kF is
called the intrinsic lifetime (τ0), which describes the lifetime of fluorescence in the
absence of the other deactivation processes:
[ ]Qkkkkk QVRISCICF ++++= 1τ , 1.8
Fk1
0 =τ . 1.9
Combining Equations 1.7 and 1.8 produces
τ×=Φ FF k . 1.10
The relationship between quantum efficiency and lifetime is thus established by
combining Equations 1.9 and 1.10
0τ
τ=ΦF , 1.11
which suggests that a decrease in the lifetime results in a decrease in quantum efficiency.
In general, when more processes are competing with fluorescence, the shorter the actual
lifetime.
1.13.3 Fluorescence Intensity and Concentration (Revisiting Beer-Lambert Law)102
The combination of Equations 1.4 and 1.5 give a representation of the Beer-
Lambert law, which establishes the relationship between fluorescence intensity and
solution concentration

31
ebc
II −=100
. 1.12
Since Equation 1.12 represents the fraction of light intensity transmitted after excitation,
then the fraction of light absorbed is given by
bc
II ε−−=− 10110
. 1.13
Multiplying Equation 1.13 by I0 yields
)101(00bcIII ε−−=− . 1.14
Since the fluorescence has a quantum efficiency, the fraction of absorbed light that
appears as fluorescence (F) is
)101()( 00bc
FF IIIF ε−−Φ=−Φ= . 1.15
The exponential term 1-10-εbc can be expanded through the Taylor’s series to give
+−+−=− −
!4)3.2(
!3)3.2(
!2)3.2(3.2101
432 bcbcbcbcbc εεεεε 1.16
If εbc is less than 0.05, then the higher order terms are negligible. Therefore,
fluorescence intensity is related to concentration by
bcIF F ε03.2 Φ= . 1.17
1.13.4 Environmental Influences on Fluorescence
The degree of fluorescence a molecule exhibits is largely influenced by solvent
characteristics such as composition, polarity, temperature, and pH.103 The structure of the
molecule and its concentration are also important factors in the fluorescence
phenomenon. These chemical and physical properties not only make it a powerful
technique for the elucidation of molecular structure, but also for the detection of
impurities within a given sample.

32
The choice of an appropriate solvent is extremely pertinent to the impact which
competing deactivation processes have on fluorescence. The electrostatic properties of
solvents, namely dipole-dipole and hydrogen bonding, determine their mode of solvation
of potentially fluorescent species, thereby influencing their electronic spectra. When the
solute absorbs light, its electronic dipole moment becomes different from that of its
ground state. However, the solvent molecules have yet to reorient themselves to
accommodate the dipolar change, according to the Franck-Condon principle. Upon
solvent reorientation, the energy of the excited electronic state is lowered, creating a
metastable state. When fluorescence occurs, the solute achieves a metastable ground
state. Upon solvent reorientation, the energy of the state falls to its original ground state.
The energy losses due to solvent reorientation are reflected in the magnitude of the
Stokes shift. With increasing solvent polarity and hydrogen-bonding capacity, such
solvent relaxation processes shift fluorescence to longer wavelengths.
The temperature and viscosity of the solvent also influence fluorescence. As the
temperature increases, viscosity decreases. This causes an increase in the number of
molecular collisions which results in more nonradiative deactivation versus fluorescence.
Conversely, decreases in temperature will increase the viscosity of the solvent, thereby
decreasing the number of molecular collisions in the excited state, allowing more
molecules to fluoresce.
The pH of the solution influences the rate of protonation and deprotonation of a
fluorophore with acid/base properties. When the acidity or basicity of a molecule is
changed in the excited state, its electron distribution will be different from that in the
ground state. Consequently, these chemical reactions compete with fluorescence and

33
often result in multiple fluorescence bands originating from a single excited species. The
spectra may also vary with the concentration of proton donors or acceptors, resulting in
quantum yields and lifetimes which vary with pH. A shift in fluorescence to longer
wavelengths (red shift) results from protonation of electron-withdrawing groups of the
fluorophore, indicating an increase in basicity upon excitation. In contrast, a blue shift
results from protonation of electron-donating groups, indicating a decrease in basicity.
The structure of a molecule is most important in determining its fluorescent
character. Chromophores and multiple conjugated arrays endow a molecule with
increased π electron mobility and consequential resonance stability. Such structures
exhibit fluorescence, the degree of which increases with the extent of conjugation and
resonance stability. Whereas aliphatic molecules do not normally fluoresce, rigid
aromatic molecules with planar structures exhibit high fluorescence. Aromatic molecules
that contain heteroatoms produce weak fluorescence, if any, because there is a greater
probability that intersystem crossing will occur. This can be attributed to overlap of
vibrational bands in S1 and T1, attributed to spin-forbidden transitions such as n-π*.
Typically phosphorescence is favored in this case. Electron-donating groups tend to
enhance fluorescence, whereas electron-withdrawing substituents decrease fluorescence.
Heavy atoms such as bromine or iodine tend to cause a mixing of singlet and triplet
states, thereby increasing the rate of intersystem crossing.
Inner-filter effects produce a reduction in the observed fluorescence intensity in
two ways. First, the amount of radiant power available to excite the fluorophore may be
decreased by the presence of an artifact which absorbs in the same wavelength as the
analyte. Secondly, the artifact may absorb at the wavelength at which the analyte

34
fluoresces, thus causing a decrease in emission. It is also interesting to note that even too
high a concentration of the analyte of interest can produce self-absorption. This leads to
a nonlinear negative deviation in the concentration-response plot.
1.14 Fluorescence Instrumentation
The main components of a fluorometer are an excitation source, monochromators
or wavelength selectors, a sample holder, a detector, and a recorder.
Figure 1.8 Schematic diagram of a typical fluorometer
Light from the excitation source passes through an excitation monochromator, which
transmits radiation at a wavelength that will induce fluorescence in the sample. The
photons signifying the fluorescence event are emitted in all directions, but are observed at
right angles to the excitation beam. This right angle configuration eliminates any
interference from the transmitted light from the source. Increased photon scattering from

35
the solution and the walls of the sample holder could result in errors in the measurement
of intensity if fluorescence would be observed at other angles. After passing through the
sample, the emitted light passes through the emission monochromator which selects the
fluorescence peak for measurement. The fluorescence is then detected by a suitable
detector (e.g., photomultiplier tube) and the data recorded on a computer.
1.15 Nuclear Magnetic Resonance Spectroscopy
As previously discussed, radiation of different wavelengths and frequencies can
induce a variety of transitions in molecules. The nuclear magnetic resonance (NMR)
event involves nuclear spin energy transitions occurring in a magnetic field. These
transitions are caused by the absorption of radio-frequency ER, and are governed by the
characteristics of certain nuclei in the sample. These nuclei, along with the influence of
the molecular environment on their absorption, can be correlated with molecular
structure. A brief discussion follows.
Just as the spinning electrons of a given atom have two allowed spin states, +½
and -½, some nuclei have spin with allowed spin states of +½ and -½. As a consequence,
the nuclei have angular momentum which can be described in terms of the spin quantum
number (I). This quantum number determines the number of orientations a nucleus can
have in an applied magnetic field by the formula 2I + 1. The quantum number can be
determined by the atomic mass and the atomic number of a particular atom. Generally
speaking, nuclei with an odd atomic mass number have half-integral spin. Those with an
even mass number and an odd atomic number have integral spin. Those with an even
mass number and atomic number have zero spin. Values of I for several nuclei are
displayed in Table 1.3.

36
Table 1.3 Spin Quantum Numbers of Various Nuclei
I Atomic Number
Atomic Mass Isotopes (I)
Zero Even Even 4He (0), 12C (0), 16O (0), 32S (0)
Half-integer Even or Odd Odd 1H (1/2), 13C (1/2), 17O (5/2)
Integer Odd Even 2H (1), 14N (1)
The circulation of nuclear charge in nuclei possessing spin generates a magnetic
dipole along the nuclear axis. The magnitude of the dipole is expressed in terms of
magnetic moment, µ. In the absence of an external magnetic field, the orientations of
magnetic moments are random. When a magnetic field is applied, however, the magnetic
moments of the nuclei orient themselves either in the same direction as the field or
opposite that of the field. Recalling 2I + 1, there are two possible orientations (or
quantum states) that a nucleus with I equal to ½ can have in a magnetic field. They are
either +½ which is aligned with the field (called the α-spin state) or -½ which is aligned
against the field (β-spin state) (Figure 1.9).
Figure 1.9 Generation of αααα- and ββββ-spin states upon application of magnetic field
The energy of the α-spin state is lower than that of the β-spin state. When a nucleus in
the α-spin state absorbs enough radiation, it will flip its spin and enter the β-spin state.

37
This energy difference between the two states is a function of the magnitude of the
magnetic field (B0). The greater the strength of the applied magnetic field, the greater the
difference in energy is between the states. This energy difference (∆E) is given by
02BhE
πγ=∆ , 1.18
where B0 is the magnitude of the applied magnetic field measured in tesla (T), γ is the
magnetogyric ratio (a proportionality constant between µ and I; units of radian T-1 s-1),
and h is Planck’s constant. The size of γ depends on the magnetic properties of the
nucleus. Recall that ∆E = hν. Therefore,
02B
πγν = , 1.19
which is called the Larmor frequency, establishing the relationship between ∆E and B0.
So, not only can one obtain the frequency of radiation required to bring about the
absorption, but also detect the absorption event in which nuclei flip their spins back and
forth in response to the applied radiation. For example, if a magnet in an NMR
instrument provides a field strength of 4.69 T, the hydrogen nuclei (γ = 2.68x10⁸ rad T-1
s-1) would require an energy source of 200 MHz to flip their spins. Likewise, for carbon
nuclei (γ = 6.73x10⁷ rad T-1 s-1) to flip their spins, a 50 MHz energy source would be
needed. At these given values, the systems are said to be in resonance, i.e., nuclei absorb
energy and are raised to a higher energy state. This flipping manifests itself in the form
of a signal in the NMR spectrum.
As previously stated, the energies of the α- and β-spin states are not identical.
Furthermore, there is a slight excess of nuclei in the α-spin state. To determine the extent
to which those in the α-spin state predominate, the Boltzmann equation can be used

38
−=
kThB
NN o
o
j
πγ
2exp , 1.20
where Nj and No are the number of protons in the β-spin state and α-spin state,
respectively, k is the Boltzmann constant (1.38x10⁻²³ J K-1), and T is the absolute
temperature. For instance, if 106 protons were in the β-spin state of a sample placed in a
4.69 T field at 293 K, there would be a 33 part per million excess of protons in the α-spin
state. Although this is a small difference, it is the basis of NMR spectroscopy. Without
this excess, there would be no net absorption of radiation to observe.
From Equation 1.19 it is established that a proton absorbs energy when ∆E
between the α- and β-spin states equals the energy defined by the frequency of the
spectrometer. If all nuclei were in the same environment, the same B0 would be required
to cause ∆E to match the operating frequency of the NMR spectrometer. This would
result in NMR spectra with only one absorption signal, which would not be sufficient for
structure determination. Instead, nuclei experience only a portion of B0 because their
electron cloud and their position in a molecule in relation to other nuclei defines their
environments. These environments shield them from B0 in varying degrees, thus
allowing the analyst to determine where the nuclei are within a compound. Nuclei that
are less shielded from B0 sense more of it to achieve ∆E. Those nuclei which are more
shielded require a higher B0 to achieve ∆E.
1.15.1 Absorption and Relaxation in NMR
Consider an external stationary magnetic field B0 whose axis is oriented in the
positive z-direction. When this field is applied to a nucleus spinning on its own magnetic

39
axis, the magnetic axis of the nucleus precesses around the z axis of the external field
(Figure 1.10).
Figure 1.10 Precession of nucleus in external magnetic field B0
The frequency of this precession is equal to the magnetic field strength B0 times the
magnetogyric ratio. The potential energy of the precessing nucleus is given by
θµ cosoBE −= , 1.21
where µ is the magnetic dipole of the nucleus and θ is the angle at which µ precesses
from the magnetic dipole of the external magnetic field. So when the nucleus absorbs
radio-frequency radiation, θ changes. For a nucleus possessing spin of ½ or -½, the
absorption causes a flipping of the magnetic moment to the opposite direction. The
nucleus is then allowed to relax back to its original position.
Relaxation of a precessed nucleus is accomplished by two processes. The first
process is called the spin-lattice or longitudinal relaxation process. It is characterized by
a time, T1, which is the average lifetime of the nuclei in the excited state. In this process,

40
energy is transferred from the excited nuclei to surrounding nuclei which are in violent
vibrational and rotational motion, thereby increasing the amplitude of their thermal
vibrations or rotations. This time depends not only upon the magnetogyric ratio, but also
the mobility of the atoms in the sample. The second process is called spin-spin or
transverse relaxation and is designated as T2. It involves a transfer of energy between
neighboring nuclei having identical precession rates but different magnetic quantum
states. Although there is no net change in the spin state population, the average lifetime
of the excited nucleus is shortened. This usually results in line broadening.
1.15.2 Pulsed Fourier Transform NMR
When short pulses of intense radio-frequency radiation are applied to nuclei in a
strong magnetic field, a time-domain, radio-frequency signal is emitted as nuclei return to
their original state. This signal is called the free induction decay (FID). The length of
the pulses is on the order of µs, and the interval between pulses is on the order of
seconds. The FID signal is representative of the difference between the frequency of the
pulse and the frequencies of all the nuclei as they relax. The signal approaches zero by
decreasing exponentially as relaxation progresses. A radio-receiver coil orthogonal to the
stationary magnetic field detects the FID signal, which is then converted to a frequency-
domain signal by Fourier transformation. The resulting NMR spectrum is therefore a plot
of the absorption as a function of frequency.
1.15.3 Chemical Shift
Nuclei experience the effects of small magnetic fields generated by electron
clouds which either oppose or reinforce the external magnetic field. When the electron
cloud opposes the external magnetic field, the nucleus is said to be shielded from the

41
influence of the field. Conversely, the nucleus is deshielded from the magnetic field
when the electron cloud reinforces the external magnetic field. The magnitude of the
electron cloud defines the chemical environment of the nucleus, thereby affecting the
frequency of its absorption. Each type of nucleus may have a slightly different frequency
depending upon what it is bonded to. The difference between the absorptive frequency of
a nucleus in a particular chemical environment and that of a reference standard divided
by the frequency of the spectrometer is the chemical shift. It is usually expressed in parts
per million (ppm) because of the large difference between the frequency of the
spectrometer (MHz) and that of the chemical shift range (Hz). In proton NMR
measurements, tetramethylsilane (TMS) is normally used as the reference standard.
Chemical shifts can be expressed in hertz as long as the applied frequency is specified.
Alternatively, they can be expressed in dimensionless units (δ), by multiplying the
quotient of the resonance frequency (Hz) and the applied frequency (Hz) by 106. The
identification of functional groups and the determination of structural arrangements based
upon chemical shifts has been tabulated previously.104 The nature of the solvent and the
concentration of the nuclei of interest may cause slight shifts in δ, but these tables give a
general idea of their assignments.
1.15.4 Spin-Spin Coupling
When the spin of a neighboring nucleus influences the resonance behavior of
another, a splitting pattern is observed in the NMR spectrum. Basically, nuclear spins are
indirectly coupled to each other by the intervention of bonding electrons. For two nuclei
with spins Ia and Ib, the resonance of spin Ia is split into 2Ib+1 peaks of equal intensity.
Likewise, the resonance of spin Ib is split into 2Ia+1 peaks of equal intensity. The

42
spacing between the split peaks is measured in Hz and is called the coupling constant (J).
In simple NMR experiments, coupling is not observed past three bonds. Coupling
through two bonds is called geminal coupling (2J), and coupling through three bonds is
called vicinal coupling (3J). Figure 1.11 illustrates 3J coupling in the simulated spectrum
of a compound with hydrogens in significantly different environments. One hydrogen
(HA) is bonded to a carbon which is attached to electronegative substituents. Therefore, it
will have resonance at a higher frequency than the other hydrogen (HB). Because they
are neighboring hydrogens, however, each one’s resonance will be affected by the other,
thus creating the doublet pairs whose peaks are separated by the value of the coupling
constant, J. Other nuclear couplings occur through π electrons, long-range (>3 bonds),
and through space and are determined with multidimensional NMR techniques.105
Figure 1.11 Spin coupling of neighboring nuclei in different environments
1.15.5 Two-dimensional NMR Techniques
Two-dimensional NMR can be utilized to enhance the interpretation of the
information in more complex NMR spectra by determining the coupling relationships
among the atoms in a molecule. A second time domain is created by the introduction of a

43
second pulse of radio-frequency radiation. The time delay between pulses is called the
evolution time. Spectra are arranged orthogonally to one another, and correlations are
made in a manner similar to the assignment of Cartesian coordinates. Correlation
spectroscopy (COSY) establishes proton-proton connectivity through up to three bonds.
Long range COSY establishes connectivity through four bonds, and total correlation
spectroscopy (TOCSY) through even longer ranges. Nuclear Overhauser enhancement
spectroscopy (NOESY) establishes through-space interactions between protons within a
distance of ≤ 5 Å from each other. Heteronuclear multiple quantum coherence (HMQC)
identifies 1J-coupling relationships between carbons (or other nuclei) bearing hydrogens.
Heteronuclear multiple bond coherence (HMBC) identifies proton-carbon long range
couplings and is useful in assigning quaternary carbons.
1.15.6 Solid-State NMR
In liquid-state NMR, fast molecular tumblings average out the anisotropies in the
local fields. The result is well-resolved NMR spectra. In contrast, the anisotropies in the
local fields are not averaged out in solid-state NMR. In fact, the spectral lines in early
solid-state studies were broadened to the extent that no spectral resolution was observed
except for isolated spin pairs or methyl groups. Consequently, the measurement of
nuclear relaxation times as a function of the external field or the temperature was the
focus of early solid-state NMR studies. Information such as motions of a part of the
molecule such as the rotations of methyl groups or motions of parts of the molecular
chains in polymers were acquired from these broad, featureless spectra.
The main approaches to achieve line narrowing in solid-state NMR impose
artificial motions on a solid. The technique of magic angle spinning (MAS) was

44
introduced by Andrew et al.106 and Lowe107 as a means to suppress anisotropic
interactions which cause line broadening. In this technique, the sample is rotated about
an axis which is 54.7o with respect to the external magnetic field. Motion at this “magic
angle” reduces dipolar interactions to zero while retaining isotropic chemical shift
information. Artificial motion has also been induced via special radiofrequency pulse
sequences which eliminate the decay due to dipolar interaction and partially eliminate the
decay due to the chemical shift.108,109 Therefore, after Fourier transformation, a spectrum
which contains only chemical shift information is generated. For abundant spin systems
such as protons, the spectra still lack resolution due to the remaining dipolar interactions.
Multiple-pulse programs have thus been combined with MAS to address this issue,
thereby affording spectra with narrow lines determined by the isotropic chemical shift
information only. The CRAMPS (combined rotation and multiple-pulse spectroscopy)
method has even been reported to yield proton spectra which have resolution comparable
to that of liquids.110
All proton signals are not sufficiently resolved by the above techniques due to the
relatively small chemical shift range for many compounds. More detailed information
can be obtained for rare-spin nuclides such as 13C and 29Si because of their large chemical
shift ranges. However, their NMR signals are very weak because they have small
magnetogyric ratios and low natural abundances. Signal averaging is time-consuming
because the relaxation times of these nuclides are very long. Pines et al.111 used cross-
polarization (CP) to obtain 13C spectra in solids in a considerably shorter time. With this
method, the signals are increased and the measuring time necessary to obtain a reasonable
spectrum is reduced considerably, because the waiting time between successive

45
experiments can be decreased. Combining the CP method with MAS removes chemical
shift anisotropies and results in high-resolution spectra only when combined with dipolar
decoupling.112 An example of resolution differences between NMR techniques is shown
in Figure 1.12. No signal would be detected from a solid sample subjected to solution
conditions such as a single-pulse Fourier transform experiment. A signal would be
acquired with a CP experiment, but chemical shift anisotropy patterns may overlap,
resulting in line broadening. The isotropic chemical shifts can be retained and line
broadening could be removed by employing CP-MAS. The solution-state 13C spectrum
of the compound dissolved in an NMR solvent is included for comparison of resolution.
Figure 1.12 Carbon-13 NMR spectra obtained by different methods: A) solid sample under solution-state NMR single pulse experiment; B) cross polarization solid-state NMR; C) cross polarization magic angle spinning solid-state NMR; D) solution state NMR spectrum of compound dissolved in suitable solvent.

46
1.15.7 NMR Instrumentation
The main components of an NMR spectrometer are a magnet, radiofrequency
transmitters, radio-frequency receivers/detectors, and a computer for Fourier
transformation. A schematic diagram of a simple NMR spectrometer is presented in
Figure 1.13.
Figure 1.13 Schematic of NMR spectrometer
The north and south poles of the magnet face each other. Precise scanning of the
magnetic field is facilitated by a pair of coils positioned parallel to the magnet poles. The
radiofrequency transmitter emits a precise radio frequency which can be amplified if
necessary. Two designs exist for the radiofrequency receiver/detector: 1) a coil wrapped
around the sample tube as the transmitter, and a second coil in an orthogonal relationship
to the transmitter coil as the detector; and 2) a single coil wrapped around the sample tube
which acts as the transmitter and the receiver. Once the signal is received, it is Fourier
transformed from a time domain into a frequency domain by the computer.

47
Part III. Introduction to Capillary Electrophoresis
Capillary electrophoresis (CE) is a collective term for the family of separation
techniques which have arisen from the merger of electrophoresis and chromatography
principles. Chromatography is a general term for techniques which separate components
in a mixture on the basis of their differential partitioning between a stationary phase and a
mobile phase. In electrophoresis, the separation of charged molecules is accomplished on
the basis of their mobilities in an electric field. The separation principle of CE is
electrophoretic, based upon the differential mobilities of analytes in an electric field. Its
chromatographic component stems from the use of a miniature column (termed
“capillary”) as the separation platform, and the use of a mechanical pump to introduce
substances onto the column. When a packed column is used, the mechanical pump
facilitates the movement of substances within the column. The uniqueness of CE stems
from its miniature size. The inner diameter of the capillary is 25 to 100 µm, which
allows for efficient heat dissipation and the use of high voltage to drive the separation.
Consequently, only nanoliter and milliliter quantities of reagents are used. Furthermore,
detection is accomplished in the same capillary in real time.
1.16 CE Instrumentation
The instrumentation of CE is relatively simple (Figure 1.14), consisting of a
separation capillary placed between two electrode reservoirs filled with buffer solution.
Platinum electrodes connect the high voltage power supply. The sample is introduced in
the capillary, and upon application of a voltage, buffer and analyte ions migrate toward
the opposite end of the capillary. Analyte zones are analyzed by a detector at the

48
opposite end of the capillary, where a section of the polyimide coating on the capillary
has been removed to make a detector window.
Figure 1.14 Diagram of CE Instrumentation
The high voltage supply has a range of 0 to 30 kV. Samples can be introduced on the
capillary either by hydrodynamic injection (application of external pressure) or by
electrokinetic injection (application of electric field). Detection systems which have been
used in CE are absorption, fluorescence, conductivity, electrochemical reaction,
refractive index, NMR and mass spectrometry.
In CE, the mobility of analytes in solution is based upon their charge-to-size ratio.
In addition, the velocity of these analytes depends upon the strength of the applied
electric field, properties of the solution (viscosity, temperature, pH, and ionic strength),
and properties of the analytes themselves (mass, three-dimensional structure, and charge).
Fundamental parameters in CE are the migration time (tm), electrophoretic mobility (µep,
cm2/V•s), electrophoretic velocity (vep, cm/s), and the field strength (E, V/cm). The

49
migration time is defined as the time an analyte takes to move from the beginning of the
capillary to the point of detection.113 The determination of E, vep, and µep is accomplished
by the following equations:
tL
VE = , 1.22
m
dep t
Lv = , 1.23
E
vepep =µ , 1.24
where V is the applied voltage, Lt is the total capillary length, and Ld is the effective
capillary length (capillary length from injection end to detection window). Equation 1.24
defines the observed (or apparent) mobility of an analyte in the capillary. The actual
mobility is independent of voltage and capillary length and can be determined by
subtracting the mobility of the electroosmotic flow (EOF) from the apparent mobility.
The EOF is the flow of liquid in the capillary resulting from the effect of the
applied electric field on the interior of the capillary wall. The capillary is made of fused
silica whose surface silanol groups are deprotonated at pH values above two. Cations
from the bulk liquid (buffer) build up in two layers (stern and diffuse) near the surface of
the negatively charged capillary in to maintain a charge balance. The stern layer is
comprised of those cations tightly adsorbed to the wall (Figure 1.15), whereas the diffuse
layer contains loosely bound cations. The potential difference created by this double
layer is called the zeta potential (ζ). Upon the application of voltage, the cations in this
layer are attracted to the cathode.

50
Figure 1.15 Generation of EOF
The movement of these solvated cations drags the bulk solution toward the cathode also,
thus creating EOF. The magnitude of the EOF can be expressed mathematically as
follows
EEv EOFEOF ηεζµ == , 1.25
where vEOF is the velocity of the EOF, µEOF is the mobility of the EOF, ε is the solution
dielectric constant, ζ is the zeta potential, η is the solution viscosity, and E is the applied
electric field strength. Because ζ is pH dependent, the magnitude of the EOF is also pH
dependent.
In contrast to the parabolic flow resulting from pressure driven systems, the flow
profile of the EOF is flat because the driving force of the flow is along the capillary

51
walls. This is beneficial because it allows all of the analyte molecules to experience the
same velocity component. Therefore, analytes elute in narrow zones, giving high
efficiency peaks in the electropherogram.
1.17 Efficiency in CE
The flat flow profile of CE makes the achievement of high peak efficiency
relatively simple. The peak efficiency of capillary electrophoresis can be expressed as
the number of theoretical plates, N, given by
2
=σ
dLN , 1.26
where Ld is the effective capillary length and σ is the standard deviation of the peak.
Dispersion, spreading of the solute zone, is a common variable in chromatography and
CE. Because of the small inner diameter of the capillary in CE, dispersive forces such as
molecular diffusion, Joule heating, injection plug length, and solute-wall interactions can
significantly impact the separation if not properly controlled. Assuming molecular
diffusion to be the only contributor of dispersion in CE, the efficiency can be related to
molecular diffusion by
V
LLDDt
ep
dt
µσ 222 == , 1.27
where D is the diffusion coefficient of the solute, and V is the applied voltage. Substition
of Equation 1.27 into Equation 1.26 yields
DEL
DLVL
N dep
t
dep
22µµ
== , 1.28
The number of theoretical plates can also be determined directly from the
electropherogram using

52
2
5.0
54.5
=
wtN , 1.29
where t is the analyte migration time and w0.5 is the peak width at half height. However,
this equation only applies to Gaussian peaks.
1.18 Resolution
How well adjacent peaks are separated from each other is termed resolution (R).
Resolution is mathematically expressed as
21
12 )(2wwttR
+−
= , 1.30
where t1 and t2 are the migration times of the former and latter eluting solutes,
respectively, and w1 and w2 are the peak widths of the former and latter eluting solutes,
respectively. Resolution as it relates to efficiency is given by
avg
NRµ
µ∆∗=4
5.0
, 1.31
where ∆µ is the difference in mobility between two species, and µavg is the average
mobility of the two. Substituting Equation 1.28 into Equation 1.31 yields a resolution
equation that does not require the calculation of N. It also describes the influence of the
EOF on resolution:
5.0
)(24
+∗
∆=EOFavgD
VRµµ
µ . 1.32
1.19 Migration in CE
The EOF velocity affects the movement of all species in the capillary. Regardless
of charge, all species are moved in the same direction as the EOF. If the flow is from
anode to cathode, anions will be moved towards the cathode because their electrophoretic
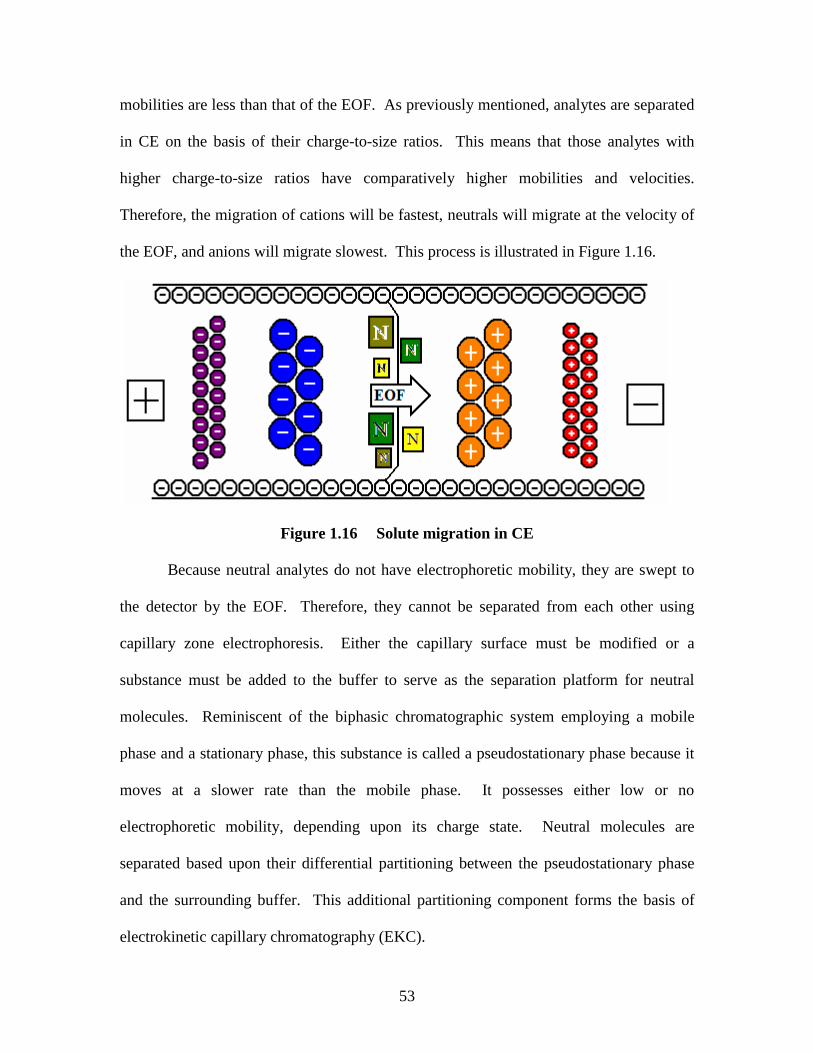
53
mobilities are less than that of the EOF. As previously mentioned, analytes are separated
in CE on the basis of their charge-to-size ratios. This means that those analytes with
higher charge-to-size ratios have comparatively higher mobilities and velocities.
Therefore, the migration of cations will be fastest, neutrals will migrate at the velocity of
the EOF, and anions will migrate slowest. This process is illustrated in Figure 1.16.
Figure 1.16 Solute migration in CE
Because neutral analytes do not have electrophoretic mobility, they are swept to
the detector by the EOF. Therefore, they cannot be separated from each other using
capillary zone electrophoresis. Either the capillary surface must be modified or a
substance must be added to the buffer to serve as the separation platform for neutral
molecules. Reminiscent of the biphasic chromatographic system employing a mobile
phase and a stationary phase, this substance is called a pseudostationary phase because it
moves at a slower rate than the mobile phase. It possesses either low or no
electrophoretic mobility, depending upon its charge state. Neutral molecules are
separated based upon their differential partitioning between the pseudostationary phase
and the surrounding buffer. This additional partitioning component forms the basis of
electrokinetic capillary chromatography (EKC).
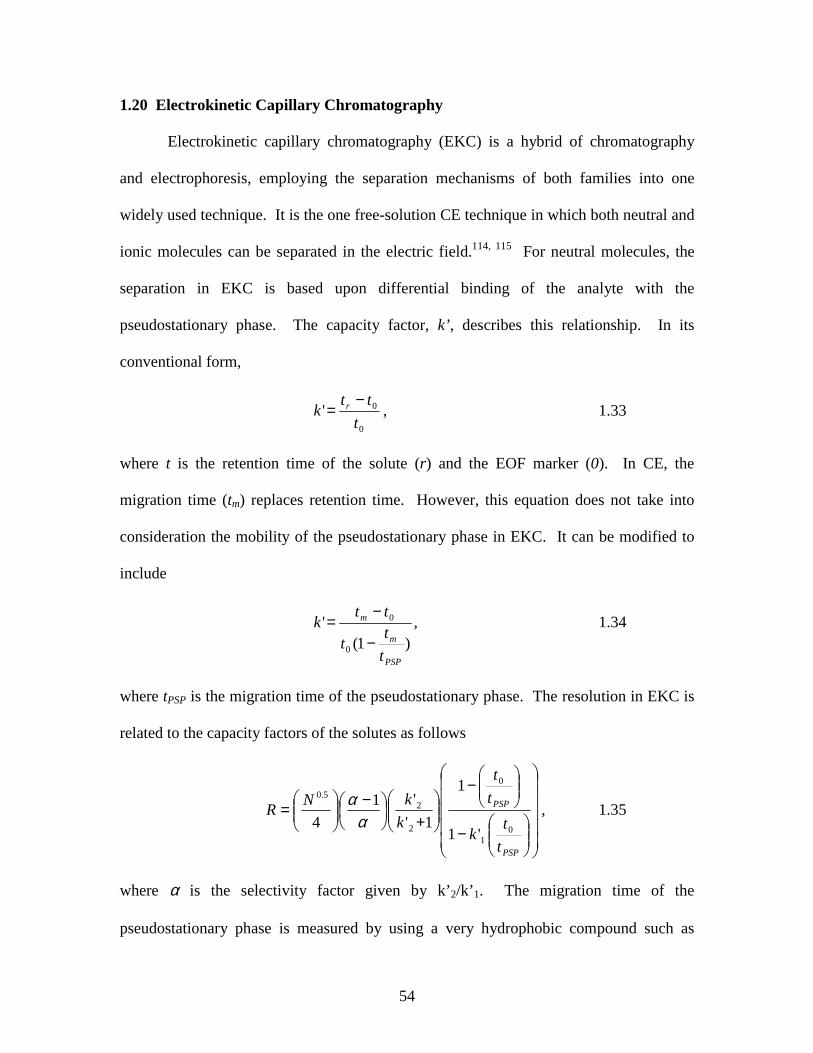
54
1.20 Electrokinetic Capillary Chromatography
Electrokinetic capillary chromatography (EKC) is a hybrid of chromatography
and electrophoresis, employing the separation mechanisms of both families into one
widely used technique. It is the one free-solution CE technique in which both neutral and
ionic molecules can be separated in the electric field.114, 115 For neutral molecules, the
separation in EKC is based upon differential binding of the analyte with the
pseudostationary phase. The capacity factor, k’, describes this relationship. In its
conventional form,
0
0't
ttk r −
= , 1.33
where t is the retention time of the solute (r) and the EOF marker (0). In CE, the
migration time (tm) replaces retention time. However, this equation does not take into
consideration the mobility of the pseudostationary phase in EKC. It can be modified to
include
)1(
'0
0
PSP
m
m
ttt
ttk
−
−= , 1.34
where tPSP is the migration time of the pseudostationary phase. The resolution in EKC is
related to the capacity factors of the solutes as follows
−
−
+
−
=
PSP
PSP
ttk
tt
kkNR
01
0
2
25.0
'1
1
1''1
4 αα , 1.35
where α is the selectivity factor given by k’2/k’1. The migration time of the
pseudostationary phase is measured by using a very hydrophobic compound such as

55
Sudan III or IV which will be strongly retained by the pseudostationary phase. The
elution window for neutral solutes is illustrated in Figure 1.17.
Figure 1.17 Migration time window of neutral solutes in EKC
The pseudostationary phases incorporated into this technique have brought about
the separation of a wide range of hydrophilic and hydrophobic substances. Examples of
these substances are antifungals,116 peptides,117,118 vitamins,119 aromatic hydrocarbons,120
prescription pharmaceuticals,121,122 drugs of abuse,123 enzymes,124 fatty acids,125 warfare
explosives,126 industrial chemicals,127 and environmental pollutants,128,129 A full review
of the applications of pseudostationary phases in EKC is outside the scope of this
dissertation. However, they can be categorized into two general groups, dynamic
aggregates and covalently bonded organized assemblies. Examples of dynamic
aggregates are vesicles, micelles130 and bile salts.131 Covalently bonded organized
assemblies are cyclodextrins,132,133 crown ethers,134 polymeric surfactants,135

56
calixarenes,136 and dendrimers.137 Examples of pseudostationary phases are shown in
Figure 1.18.
O
O
HOH2C
OHHO
O
O
CH2OH
HO
HO
OO
CH2OHHO
HO
O
O
CH2OH
HO OH
O
O
HOH2C
OH
OH
OO
HOH2COH
OH
αααα-cyclodextrin polymeric surfactant
O O
O O
O O
crown ether O
O
HN
O
NH
O
NH2
O
NH2
O
H2NO
H2N
H2N
H2N
OO
O
O
O
NH
O
HN
O
H2N
O
H2N
O
NH2
O
NH2
NH2
NH2
O O
O
dendrimermicelle
Figure 1.18 Examples of pseudostationary phases
1.21 Capillary Electrochromatography
Capillary electrochromatography (CEC) is a separation technique which combines
the high efficiency of CE with the high selectivity of high performance liquid
chromatography (HPLC). In CEC, a stationary phase is created by packing silica
particles in a capillary and keeping them in place by frits on both sides of the packed bed.
Uncharged molecules are separated on the basis of their differential partitioning into the
stationary phase, whereas the separation of charged molecules is both chromatographic
and electrophoretic. The mobile phase is electrically driven as opposed to pressure
driven. The experimental configuration of CEC is similar to that of CE with the
exception of the packed capillary and an external pressure source which minimizes
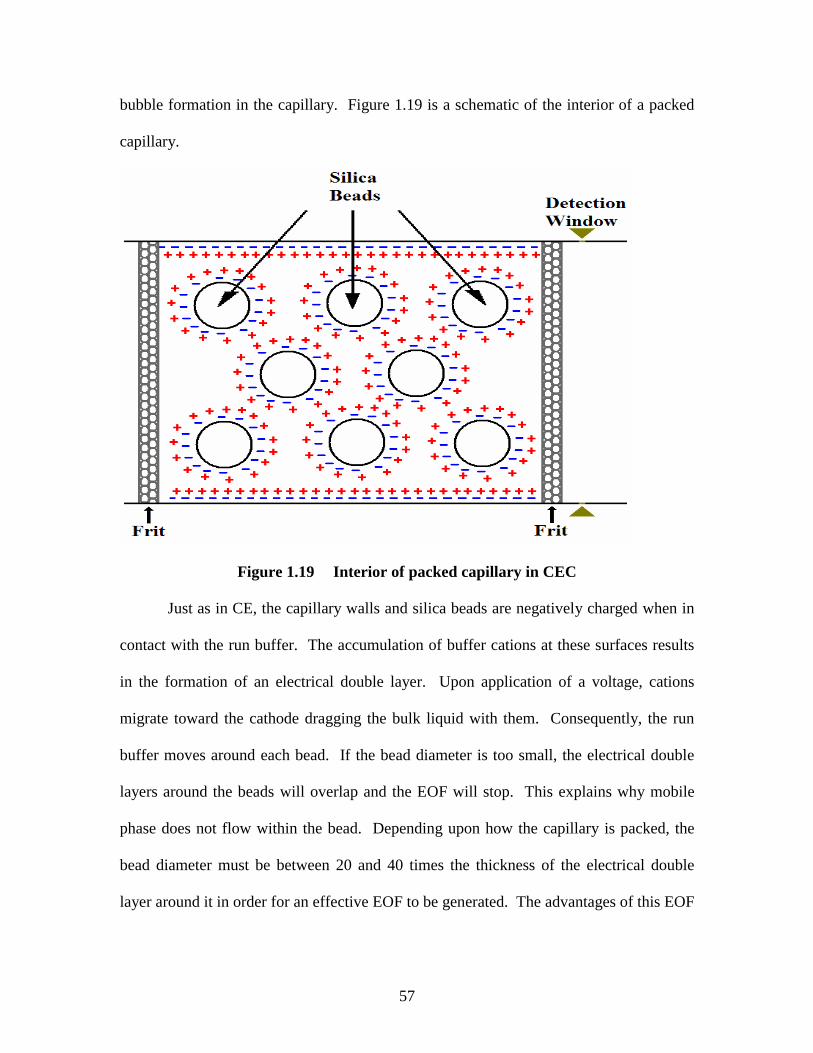
57
bubble formation in the capillary. Figure 1.19 is a schematic of the interior of a packed
capillary.
Figure 1.19 Interior of packed capillary in CEC
Just as in CE, the capillary walls and silica beads are negatively charged when in
contact with the run buffer. The accumulation of buffer cations at these surfaces results
in the formation of an electrical double layer. Upon application of a voltage, cations
migrate toward the cathode dragging the bulk liquid with them. Consequently, the run
buffer moves around each bead. If the bead diameter is too small, the electrical double
layers around the beads will overlap and the EOF will stop. This explains why mobile
phase does not flow within the bead. Depending upon how the capillary is packed, the
bead diameter must be between 20 and 40 times the thickness of the electrical double
layer around it in order for an effective EOF to be generated. The advantages of this EOF

58
are its low flow rates and flat flow profile which result in high peak efficiencies. Other
significant aspects of CEC are compared with HPLC and CE in Table 1.4.
Table 1.4 Significant Aspects of CEC, HPLC, and CE Feature CEC HPLC CE Theoretical plates (N) 100,000-700,000 < 50,000 ~200,000
Peak capacity 100+ ~50 ~100
Solvent consumption nL-µL range mL-L range nL-µL range
pH operating range 3-11 2-9 2-11
Frits Experimental problem Not used Not used
Packed capillaries are produced by three methods: draw packing, electrokinetic
packing, and slurry packing. Slurry-packed capillaries are most common and will be
discussed in a separate paragraph. Drawn packed capillaries are so named because a
glass-drawing machine draws a large-bore capillary filled with dry stationary phase to the
desired inner diameter.138 Electrokinetically packed capillaries are formed by the
migration of charged silica particles into the capillary upon application of a voltage to a
silica slurry.139,140
The formation of slurry-packed columns is generally accomplished in six steps.
First, a slurry of the stationary phase and appropriate packing mobile phase is added to
the capillary. Second, a frit is formed by heating the capillary momentarily. Third,
pressure is applied in order to push excess stationary phase out of the region beyond the
frit and to compress the packed region. In step four, a second frit is formed by heating
the capillary momentarily, thereby establishing the final boundary for the stationary
phase. In step five, pressure is applied to remove stationary phase outside the packed
region. Lastly, a detection window is formed by burning off the polyimide coating of the

59
capillary immediately adjacent to one of the frits. The slurry-packing process is
illustrated in Figure 1.20.
Figure 1.20 Procedure for the formation of slurry-packed capillaries
As previously mentioned, frits keep the stationary phase in place. Reported
methods of frit preparation involve filling the capillary with either wet or dry stationary
phase. Boughtflower et al. heated wet silica stationary phases within the capillary until
the silica melted slightly, but this yielded frits with low porosity.141 Heating for shorter
periods of time at a moderate temperature yielded more uniform and porous frits.
Benhke et al.142 prepared frits by three methods. In the first method, they heated a
solution of formamide and potassium silicate to polymerize it. The second and third
methods involved filling the capillary with silica gel wetted with potassium silicate
solution and bare silica gel, respectively. Amorphous frits with irregular channels were
produced in the first and second methods. A more uniform frit was produced in the third
method, but it was unstable at the pressures necessary to pack the capillary with more
stationary phase.

60
Factors affecting the separation of molecules in CEC include the temperature of
the buffer, mobile phase composition and ionic strength, applied voltage, capillary inner
diameter, and most importantly, the type of stationary phase employed. About two-thirds
of typical stationary phases are silica-based. The most common stationary phase used in
CEC is octadecylsilane (ODS). Use of other stationary phases has resulted in formation
of sol-gel,143 continuous-bed, ion-exchange, and open-tubular columns.
1.22 Scope of this Dissertation
The research presented in this dissertation focuses on the synthesis,
characterization, and application of novel amino acid-derivatized calix[4]arenes in
spectroscopy and EKC. Calixarenes in their basic forms are very hydrophobic molecules
which are capable of forming inclusion complexes. The resurgence of interest in
calixarenes in the latter part of the 20th century was due to their potential as enzyme
mimics. By virtue of their symmetry, they are achiral and thus incapable of chiral
recognition. Therefore, their utility as enzyme mimics cannot be fully realized until they
possess chirality. They can be functionalized to induce chirality and water-solubility.
Such properties would extend their utility in biological applications and other aqueous
environments.
Chapter 2 is divided into two parts. The synthesis of N-L-aminoacylcalix[4]arene
derivatives from p-t-butylcalix[4]arene is described in Part I. Because amino acids have
an essential role in biological systems, L-alanine, L-valine, L-leucine, and L-isoleucine
have been chosen as lower rim functionalities on p-t-butylcalix[4]arene. The goal is to
attach the amino acids to the calix[4]arene via peptide coupling to yield compounds
which are chiral and water-soluble, while maintaining the integrity of the calixarene

61
cavity. One- and two-dimensional NMR techniques are employed to show that
tetrasubstituted calix[4]arenes bearing amino acid moieties have been successfully
synthesized. In Part II, the synthesis and characterization (elemental, IR, and solid-state
13C NMR) of calixarene-bonded silica stationary phases is reported.
In Chapter 3, the application of the four amino acid-derivatized calix[4]arenes in
EKC is described. Drawing from previous separations using calixarene-modified EKC, I
separated atropisomeric binaphthyl derivatives in a single run using urea as an organic
modifier in the run buffer. Even though the hydrophobic nature of aliphatic amino acids
would suggest that their use in aqueous EKC systems would be very limited, these amino
acid-derivatized calixarenes were water-soluble at pH ≥ 7. In addition to the binaphthyl
derivatives, the calixarenes were used as chiral selectors for a group of neutral
benzodiazepines. The effects of pH, organic modifier concentration and chiral selector
concentration on capacity factors, resolution, and chiral selectivity are discussed.
Slight differences in the elution orders of the binaphthyl derivatives in the L-
leucine- (CX4-LEU) and L-isoleucine-derivatized (CX4-ILE) calixarene buffer systems
suggest differential interaction, even though the mobilities of the calixarenes are
equivalent. Therefore, in Chapter 4, the complexation of a binaphthyl atropisomer with
CX4-LEU and CX4-ILE using steady-state fluorescence spectroscopy is investigated. It
was reported previously that sulfonated calix[6]arene would not be suitable as a host
molecule because it produces inner-filter effects. However, a proposed method by which
to obtain spectra of the complexed guests while minimizing inner-filter effects of the
hosts is discussed. The second part of Chapter 4 reports the investigation of

62
spectroscopic properties of sulfonated calixarenes in the presence of metals. Chapter 5
summarizes the previous chapters and gives accounts of future directions to consider.
References
1. Baeyer, A. Berlin, 1872, 5, 25.
2. Baekeland, L. H. U.S. Patent 942,699, 1908.
3. Zinke, A., Ziegler, E. Berlin, 1944, 77, 264.
4. Zinke, A., Kretz, R., Leggewie, E., Hössinger, K. Monatsh. Chem., 1952, 83, 1213.
5. Buriks, R.S., Fauke, A.R., Mange, F.E. U.S. Patent 4,032,514, 1977.
6. Gutsche, C.D., Dhawan, B., No, K. H., Muthukrishnan, R. J. Am. Chem. Soc., 1981, 103, 3782.
7. Gutsche, C.D. Acc. Chem. Res., 1983, 16, 161.
8. Stewart, D.R., Gutsche, C.D. J. Am. Chem. Soc., 1999, 121, 4136.
9. Gutsche, C.D. Calixarenes. The Royal Society of Chemistry (Ed.: J.F. Stoddart), Cambridge, 1989.
10. Yamato, T., Kumamaru, K., and Tsuzuki, H. Can. J. Chem., 2001, 79, 1422.
11. McMurry, J.E., Phelan, J. C. Tetrahedron Lett., 1991, 32, 5655.
12. Gutsche, C.D. Tetrahedron, 1983, 39, 409.
13. Kanamathareddy, S., Gutsche, C.D. J. Am. Chem. Soc. 1993, 115, 6572.
14. Otsuka, H., Suzuki, Y., Ikeda, A., Araki, K., Shinkai, S. Tetrahedron 1998, 54, 423.
15. McKervey, M.A., Owens, M., Schulten, H.R., Vogt, W., Böhmer, V. Angew. Chem. Int. Ed. Engl. 1990, 29, 280.
16. Beer, P.D., Keefe, A.D., Slawin, A.M.Z., Williams, D.J. J. Chem. Soc., Dalton Trans. 1990, 3675.
17. Arimura, T., Matsumoto, S., Teshima, O., Nagasaki, T., Shinkai, S. Tetrahedron Lett. 1991, 32, 5111.
18. Böhmer, V., Marschollek, F., Zetta, L. J. Org. Chem., 1987, 52, 3200.

63
19. Munch, J.H. Makromol. Chem., 1977, 178, 69.
20. Saenger, W., Betzel, C., Hingerty, B., Brown, G.M. Angew. Chem. Int. Ed. Engl. 1983, 22, 883.
21. Keller, S.W., Schuster, G.M., Tobiason, F.L. Polym. Mater. Sci. Eng. 1987, 57, 906.
22. Andreetti, G.D., Ungaro, R., Pochini, A. J. Chem. Soc., Chem. Commun., 1979, 1005.
23. Cram, D.J., Karbach, S., Kim, Y.H., Baczynskyj, L., Marti, K., Sampson, R.M., Kalleymeyn, G.W. J. Am. Chem. Soc., 1988, 110, 2554.
24. Gutsche, C.D., Iqbal, M. Org. Synth., 1990, 68, 234.
25. Gutsche, C.D., Dhawan, B., Leonis, M., Steward, D. Org. Synth., 1990, 68, 238.
26. Munch, J.H., Gutsche, C.D. Org. Synth., 1990, 68, 243.
27. Arduini, A., Pochini, A., Reverberi, S., Ungaro, R. J. Chem. Soc., Chem. Commun., 1984, 981.
28. Shinkai, S., Mori, S., Tsubaki, T., Sone, T., Manabe, O. Tetrahedron Lett. 1984, 25, 5315.
29. Shinkai, S., Araki, K., Tsubaki, T., Arimura, T., Manabe, O. J. Chem. Soc., Perkin Trans. I, 1987, 2297.
30. Shinkai, S., Tsubaki, T., Sone, T., Manabe, O. Tetrahedron Lett. 1985, 26, 3343.
31. Almi, M., Arduini, A., Casnati, A., Pochini, A., Ungaro, R. Tetrahedron 1989, 45, 2177.
32. Arimura, T., Nagasaki, T., Shinkai, S., Matsuda, T. J. Org. Chem., 1989, 54, 3766.
33. Gutsche, C.D., Alam, I. Tetrahedron, 1988, 44, 4689.
34. Shinkai, S., Shirahama, Y., Tsubaki, T., Manabe, O. J. Chem. Soc. Perkin Trans. I, 1989, 1859.
35. Niikura, K., Anslyn, E. J. Chem. Soc., Perkin Trans. 2, 1999, 2769.
36. Steed, J.W., Johnson, C.P., Barnes, C.L., Juneja, R.K., Atwood, J.L., Reilly, S., Hollis, R.L., Smith, P.H., Clark, D.L. J. Am. Chem. Soc. 1995, 117, 11426.
37. Shinkai, S., Kawabata, H., Matsuda, T., Kawaguchi, H., Manage, O. Bull. Chem. Soc. Jpn., 1990, 63, 1272.

64
38. Newkome, G.R., Hu, Y., Saunders, M.J., Fronczek, F.R. Tetrahedron Lett., 1991, 32, 1133.
39. Marra, A., Scherrmann, M.-C., Dondoni, A., Casnati, A., Minari, P., Ungaro, R. Angew. Chem., Intl. Ed. Engl. 1994, 33, 2479.
40. Shi, Y., Zhang, Z. J. Chem. Soc., Chem. Commun., 1994, 375.
41. Grote Gansey, M.H.B., Steemers, F.J., Verboom, W., Reinhoudt, D.N. Synthesis 1997, 643.
42. Böhmer, V., Schade, E., Antes, C., Pachta, J., Vogt, W., Kämmerer, H. Makromol. Chem. 1983, 184, 2361.
43. Böhmer, V., Schade, E., Vogt, W. Makromol. Chem., Rapid Commun. 1984, 5, 221.
44. Shinkai, S., Araki, K., Koreishi, H., Tsubaki, T., Manabe, O. Chem. Lett. 1986, 1351.
45. Shinkai, S. Topics in Inclusion Science, Calixarenes, a Versatile Class of Macrocyclic Compounds, Kluwer Academic Publishers (Eds.: Vicens, J., Böhmer, V.), Dordrecht, 1991, 179.
46. Andreetti, G.D., Ungaro, R., Pochini, A. J. Chem. Soc., Chem. Commun., 1979, 1005.
47. Ungaro, R., Pochini, A., Andreetti, G.D. J. Incl. Phenom., 1984, 2, 199.
48. Shinkai, S. Pure & Appl. Chem., 1986, 58, 1523.
49. Shinkai, S., Koreishi, H., Ueda, K., Manabe, O. J. Chem. Soc., Chem. Commun. 1986, 233.
50. Shinkai, S., Koreishi, H., Ueda, K., Arimura, T., Manabe, O. J. Am. Chem. Soc., 1987, 109, 6371.
51. Shinkai, S., Kawaguchi, H., Manabe, O. J. Polym. Sci. Part C: Polym. Lett. 1988, 26, 391.
52. Yordanov, A.T., Gansow, O.A., Brechbiel, M.W., Rogers, L.M., Rogers, R.D., Polyhedron, 1999, 18, 1055.
53. Arena, G., Bonomo, R.P., Cali, R., Gulino, F.G., Lombardo, G.G., Sciotto, D., Ungaro, R., Casnati, A., Supramol. Chem., 1995, 4, 287.
54. Nicod, L., Pellet-Rostaing, S., Chitry, F., Lemaire, M. Tetrahedron Lett. 1998, 39, 9443.

65
55. Stolwijk, T.B., Sudhölter, E.J.R., Reinhoudt, D.N. J. Am. Chem. Soc., 1987, 109, 7042.
56. Arena, G., Contino, A., Magri, A., Sciotto, D., Spoto, G., Torrisi, A. Ind. Eng. Chem. Res. 2000, 39, 3605.
57. Arnaud-Neu, F., Schwing-Weill, M.-J., Dozol, J.-F., In Calixarenes 2001, Asfari, Z., Böhmer, V., Harrowfield, J., Vicens, J., Saadioui, M., Eds., Kluwer Academic Publishers: Boston, 2001, 642.
58. Ungaro, R., Arduini, A., Casnati, A., Pochini, A., Ugozzoli, F. Pure & Appl. Chem. 1996, 68, 1213.
59. Steemers, F.J., Meuris, H.G., Verboom, W., Reinhoudt, D.N., van der Tol, E.B., Verhoeven, J.W. J. Org. Chem. 1997, 62, 4229.
60. Toner, J.L., In Inclusion Phenomena and Molecular Recognition, Atwood, J., Ed., Plenum Press: New York, 1990, 185.
61. Steemers, F.J., Verboom, W., Reinhoudt, D.N., van der Tol, E.B., Verhoeven, J.W. J. Am. Chem. Soc. 1995, 117, 9408.
62. Sabbatini, N., Guardighi, M., Mecati, A., Balzani, V., Ungaro, R., Ghidini, E., Casnati, A., Pochini, A. J. Chem. Soc. 1990, 878.
63. Rudkevich, D.M., Verboom, W., van der Tol, E.B., van Staveren, C.J., Kasperen, F.M., Verhoeven, J.W., Reinhoudt, D.N. J. Chem. Soc., Perkin Trans. 2 1995, 131.
64. Sato, N., Yoshida, I., Shinkai, S. Chem. Lett. 1993, 1261.
65. Iwema Bakker, W.I., Haas, M., Den Hertog, H.J., Jr., Verboom, W., De Zeeuw, D., Bruins, A.P., Reinhoudt, D.N. J. Org. Chem. 1994, 59, 972.
66. Iwema Bakker, W.I., Haas, M., Khoo-Beattie, C., Ostaszewski, R., Franken, S., den Hertog, H.J., Jr., Verboom, W., de Zeeuw, D., Harkema, S., Reinhoudt, D.N. J. Am. Chem. Soc., 1994, 116, 123.
67. Chen, X., Ji, M., Fisher, D.R., Wai, C.M. Chem. Commun., 1998, 377.
68. Grote Gansey, M.H.B., de Haan, A.S., Bos, E.S., Verboom, W., Reinhoudt, D.N. Bioconjugate Chem., 1999, 10, 613.
69. Schneider, H.-J., Blatter, T., Zimmermann, P. Angew. Chem., Int. Ed. Engl. 1990, 29, 1161.
70. Shinkai, S., Araki, K., Matsuda, T., Nishiyama, N., Ikeda, H., Takasu, I., Iwamoto, M. J. Am. Chem. Soc., 1990, 112, 9053.

66
71. Arena, G., Casnati, A., Mirone, L., Sciotto, D., Ungaro, R. Tetrahedron Lett., 1997, 38, 1999.
72. Lehn, J.M., Meric, R., Vigneron, J.P., Cesario, M., Guilhem, J., Pascard, C., Asfari, Z., Vicens, J. Supramol. Chem. 1995, 5, 97.
73. Nak Koh, K., Araki, K., Ikeda, A., Otsuka, H., Shinkai, S. J. Am. Chem. Soc., 1996, 118, 755.
74. Beer, P.D., Chen, Z., Goulden, A.J., Graydon, A., Stokes, S.E., Wear, T. J. Chem. Soc., Chem. Commun. 1993, 1834.
75. Rudkevich, D.M., Brzozka, Z., Palys, M., Visser, H.C., Verboom, W., Reinhoudt, D.N. Angew. Chem. Int. Ed. Engl. 1994, 33, 467.
76. Dondoni, A., Marra, A., Scherrmann, M.-C., Casnati, A., Sansone, F., Ungaro, R. Chem. Eur. J. 1997, 3, 1774.
77. Van Dienst, E., Snellink, B.H.M., Von Piekartz, I., Engbersen, J.F.J., Reinhoudt, D.N. J. Chem. Soc., Chem. Commun. 1995, 1151.
78. Shi, Y., Zhang, Z., J. Incl. Phenom. 1994, 18, 137.
79. Atwood, J.L., Holman, K.T., Steed, J.W. Chem. Commun. 1996, 1401.
80. Staffilani, M., Hancock, K.S.B., Steed, J.W., Holman, K.T., Atwood, J.L., Juneja, R.K., Burkhalter, R.S. J. Am. Chem. Soc. 1997, 119, 6324.
81. Diederich, F., Dick, K. J. Am. Chem. Soc. 1984, 106, 8024.
82. Zhang, L., Macías, A., Lu, T., Gordon, J.I., Gokel, G.W., Kaifer, A.E. J. Chem. Soc., Chem. Commun. 1993, 1017.
83. Arena, G., Contino, A., Gulino, F.G., Magri, A., Sciotto, D., Ungaro, R. Tetrahedron Lett. 2000, 41, 9327.
84. Zheng, J.-Z., Wu, J.-S., Toda, K., Sanemasa, I. Bull. Chem. Soc. Jpn. 2001, 74, 505.
85. Van Wageningen, A.M.A., Verboom, W., Reinhoudt, D.N. Pure & Appl. Chem., 1996, 68, 1273.
86. Bügler, J., Engbersen, J.F.J., Reinhoudt, D.N. J. Org. Chem. 1998, 63, 5339.
87. Schneider, H.-J., Eblinger, F., Sirish, M. Adv. Supramol. Chem. 2000, 6, 185.
88. Still, W.C. Acc. Chem. Res. 1996, 29, 155.
89. Muthukrishnan, R., Gutsche, C.D. J. Org. Chem. 1979, 44, 3962.

67
90. Shinkai, S., Arimura, T., Satoh, H., Manabe, O. J. Chem. Soc. Chem. Commun. 1987, 1495.
91. Arimura, T., Edamitsu, S., Shinkai, S., Manabe, O., Muramatse, T., Tashiro, M. Chem. Lett. 1987, 2269.
92. Arimura, T., Kawabata, H., Matsuda, T., Muramatsu, T., Satoh, H., Fujio, K., Manabe, O., Shinkai, S. J. Org. Chem. 1991, 56, 301.
93. Zhang, Y., Agbaria, R.A., Warner, I.M. Supramol. Chem. 1997, 8, 309.
94. Zhang, Y., PhD Thesis, Louisiana State University, Baton Rouge, 1997.
95. Nagasaki, T., Tajiri, Y., Shinkai, S. Rec. Trav. Chim. Pays-Bas 1993, 112, 407.
96. Casnati, A., Fabbi, M., Pelizzi, N., Pochini, A., Sansone, F., Ungaro, R., Di Modugno, E., Tarzia, G. Bioorg. Med. Chem. Lett. 1996, 6, 2699.
97. Peña, M.S., Zhang, Y.L., Warner, I.M. Anal. Chem. 1997, 69, 3239.
98. Ito, K., Kida, A., Ohba, Y., Sone, T. Chem. Lett. 1998, 12, 1221.
99. Grady, T., Joyce, T., Smyth, M.R., Harris, S.J., Diamond, D. Anal. Commun. 1998, 35, 123.
100. Skoog, D.A., Leary, J.J. Principles of Instrumental Analysis; Saunders College Publishing: Fort Worth, 1992.
101. Lakowicz, J. Principles of Fluorescence Spectroscopy; Plenum Press: New York, 1983.
102. Harris, D.C. Quantitative Chemical Analysis; W. H. Freeman and Company: New York, 1991.
103. Sharma, A., Schulman, S.G. Introduction to Fluorescence Spectroscopy; John Wiley & Sons, Inc.: New York, 1999.
104. Silverstein, R.M., Webster, F.X. Spectrometric Identification of Organic Compounds, 6th ed., John Wiley & Sons, Inc.: New York, 1998.
105. Harris, R.K. Nuclear Magnetic Resonance Spectroscopy: A Physicochemical View, Pitman Publishing Inc.: Marshfield, 1983.
106. Andrew, E.R., Bradbury, A., Eades, R.G. Nature 1958, 182, 1659.
107. Lowe, I.J. Phys. Rev. Lett. 1959, 2, 285.
108. Ostroff, E.D., Waugh, J.S. Phys. Rev. Lett. 1966, 16, 1097.

68
109. Mansfield, P., Ware, D. Phys. Rev. Lett. 1966, 22, 133.
110. Gerstein, B.C., Pembleton, R.G., Wilson, R.C., Ryan, L.M. J. Chem. Phys., 1977, 66, 361.
111. Pines, A., Gibby, M.G., Waugh, J.S. J. Chem. Phys. 1973, 59, 569.
112. Schaefer, J., Stejskal, E.O. J. Am. Chem. Soc. 1976, 98, 1031.
113. Weinberger, R. Practical Capillary Electrophoresis, Academic Press Inc.: San Diego, 1993.
114. Terabe, S., Otsuka, K., Ichikawa, K., Ando, T. Anal. Chem. 1984, 56, 111.
115. Terabe, S., Shibata, M., Miyashita, Y. J. Chromatogr. A 1989, 480, 403.
116. Furuta, R., Doi, T. J. Chromatogr. A 1994, 676, 431.
117. Yashima, T., Tsuchiya, A., Morita, O. Anal. Chem.. 1992, 64, 2981.
118. Peterrson, M., Walhagen, K., Nilsson, A., Wahlund, K.G., Nilsson, S. J. Chromatogr. A 1997, 769, 301.
119. Profumo, A., Profumo, V., Vidali, G. Electrophoresis 1996, 17, 1617.
120. Ding, W.L., Fritz, J.S. Anal. Chem. 1997, 69, 1593.
121. RenouGonnord, M.F., David, K. J. Chromatogr. A 1996, 735, 249.
122. Bretnall, A.E., Clarke, G.S. J. Chromatogr. A 1996, 745, 145.
123. Naess, O., Rasmussen, K.E. J. Chromatogr. A 1996, 760, 245.
124. Loregian, A., Scremin, C., Schiavon, M., Marcello, A., Palu, G. Anal. Chem. 1994, 66, 2981.
125. Erim, F.B., Xu, X., Kraak, J.C. J. Chromatogr. A 1995, 694, 471.
126. Kennedy, S., Caddy, B., Douse, J.M.F. J. Chromatogr. A 1996, 726, 211.
127. MacLaughlin, G.M., Weston, A., Hauffe, K.D. J. Chromatogr. A 1996, 744, 123.
128. Rossi, M., Rotilio, D. J. High Resolut. Chromatogr. 1997, 20, 265.
129. Brumley, W.C., Jones, W.J. J. Chromatogr. A 1994, 680, 163.
130. Michaelsen, S., Moller, P., Sorensen, H. J. Chromatogr. A 1994, 680, 299.
131. Brumley, W.C., Brownrigg, C.M. J. Chromatogr. Sci. 1994, 32,69.

69
132. Snopek, J., Jelinek, I., Smolkova-Keulemansova, E. J. Chromatogr. 1988, 438, 211.
133. Fanali, S. J. Chromatogr. 1989, 474, 441.
134. Kuhn, R., Riester, D., Fleckenstein, B., Wiesmüller, K.H. J. Chromatogr. A 1995, 716, 371.
135. Wang, J., Warner, I.M. Anal. Chem. 1994, 66, 3773.
136. Mnuk, P., Feltl, L., Schurig, U. J. Chromatogr. A 1996, 732, 63.
137. Kuzdzal, S.A., Monnig, C.A., Newkome, G.R., Moorefield, C.N. J. Chem. Soc., Chem. Commun. 1994, 2139.
138. Kelly, K.A., Khaledi, M.G. in High Performance Capillary Electrophoresis, Khaledi, M.G., Ed. John Wiley & Sons, Inc.: New York, 1998, 280
139. Inagaki, M., Kitagawa, S., Tsuda, T. Chromatography 1993, 55R
140. Yan, C. U.S. Patent 5,453,163 1993.
141. Boughtflower, R.J., Underwood, T., Paterson, C.J. Chromatographia 1995, 40, 329.
142. Behnke, B., Grom, E., Bayer, E. J. Chromatogr. A 1995, 716, 207.
143. Guo, Y., Colón, L. Anal. Chem. 1995, 67, 2511.

70
CHAPTER 2. SYNTHESIS AND CHARACTERIZATION OF CALIXARENES
Part I. Synthesis and NMR Assignments of Water-Soluble Chiral N-Acylcalix[4]arene L-Amino Acid Derivatives
2.1 Introduction
As noted in Chapter 1, calixarenes are cyclic oligomers originating from the base-
catalyzed condensation of p-substituted phenol with formaldehyde. Their characteristic
architecture, phenolic units linked by methylene bridges to form a hydrophobic cavity,
make them capable of host-guest interactions with molecules.1 The earliest examples of
calixarene complex formation appeared in the mid 1980s involving nonaqueous systems
with calix[4]arenes and amines,2 and aqueous systems with water-soluble p-
sulfonatocalixarenes.3,4 Interest in our laboratory is primarily centered on water-soluble
calixarenes and their effectiveness as buffer additives for capillary electrophoresis (CE).
Since most calixarenes are not water-soluble and do not have chiral recognition ability,
functionalization of the upper and lower rims is necessary to fully exploit their utilities.5,6
Recently, the syntheses and utility of water-soluble p-t-butylcalix[4]arenes with L-alanine
and L-valine amino acid groups as CE buffer additives has been demonstrated.7,8 This
chapter reports the synthesis of (N-L-leucinoacyl)calix[4]arene (CX4-L-Leu) and (N-L-
isoleucinoacyl)calix[4]arene (CX4-L-Ile) and the characterization of all four amino acid-
functionalized calix[4]arenes by nuclear magnetic resonance spectroscopy (NMR).
NMR spectroscopy is an important analytical chemistry tool which aids in the
proof of structure of our calixarenes.1 Two-dimensional techniques such as total
correlation spectroscopy (TOCSY), homonuclear (H,H)-correlation (H,H-COSY),
nuclear Overhauser enhancement (NOESY), heteronuclear multiple quantum correlation
(HMQC), and heteronuclear multiple-bond connectivity (HMBC) spectroscopies were
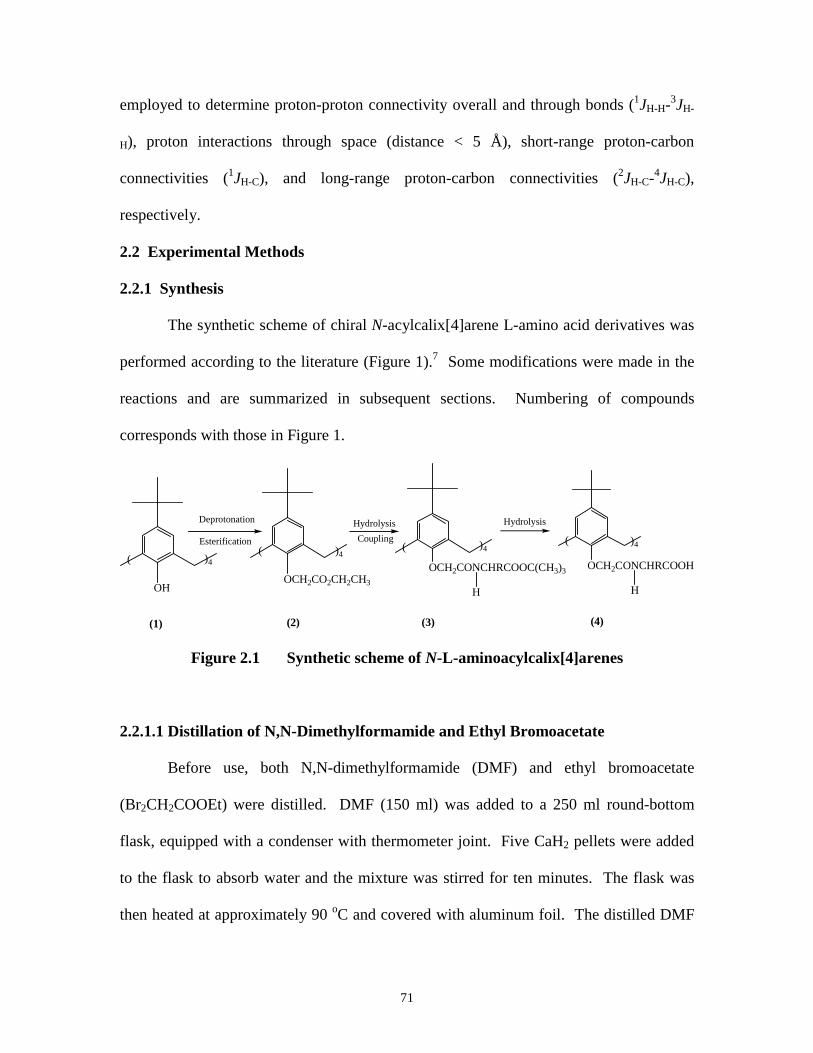
71
employed to determine proton-proton connectivity overall and through bonds (1JH-H-3JH-
H), proton interactions through space (distance < 5 Å), short-range proton-carbon
connectivities (1JH-C), and long-range proton-carbon connectivities (2JH-C-4JH-C),
respectively.
2.2 Experimental Methods
2.2.1 Synthesis
The synthetic scheme of chiral N-acylcalix[4]arene L-amino acid derivatives was
performed according to the literature (Figure 1).7 Some modifications were made in the
reactions and are summarized in subsequent sections. Numbering of compounds
corresponds with those in Figure 1.
OHOCH2CO2CH2CH3
OCH2CONCHRCOOC(CH3)3 OCH2CONCHRCOOH
Hydrolysis
)4()4(
HydrolysisCoupling
Deprotonation
Esterification )4( )4(
(1) (2) (3) (4)
H H
Figure 2.1 Synthetic scheme of N-L-aminoacylcalix[4]arenes
2.2.1.1 Distillation of N,N-Dimethylformamide and Ethyl Bromoacetate
Before use, both N,N-dimethylformamide (DMF) and ethyl bromoacetate
(Br2CH2COOEt) were distilled. DMF (150 ml) was added to a 250 ml round-bottom
flask, equipped with a condenser with thermometer joint. Five CaH2 pellets were added
to the flask to absorb water and the mixture was stirred for ten minutes. The flask was
then heated at approximately 90 oC and covered with aluminum foil. The distilled DMF

72
was collected in a 250 ml Schlenk flask and stoppered with a rubber septum. The
distillation of Br2CH2COOEt was carried out in a similar fashion, except for the amount
of solvent and the temperature. It is a strong lachrymator and therefore must be carried
out at a lower temperature. Because only a small amount is necessary for the synthesis,
only 25 ml is distilled.
2.2.1.2 Synthesis of p-t-Butylcalix[4]arene-O,O’,O”,O’”-Tetraacetic Acid Tetraethyl Ester
All reactions were performed in a fume hood. Four mmoles of Compound 1 were
added to a 2-necked 250 ml Schlenk flask. In an argon glove box, 24 mmoles of NaH
were added to a curved ground glass joint Schlenk tube. This tube was secured to a neck
of the Schlenk flask and the second neck was closed with a septum. All valves were
closed and care was taken to prevent premature introduction of NaH to Compound 1
when the apparatus was removed from the glove box. The reaction flask was placed on a
heating mantle in the fume hood. The valve on the DMF flask was flushed with argon for
30 seconds before the argon hose was connected to it and the valve was opened. After
one minute, the septum of the DMF flask was pierced with the needle of a glass sytringe
of which the plunger had been removed. The plunger was then replaced and 100 ml of
DMF was drawn. The DMF was added to the reaction flask by piercing the septum.
After Compound 1 was completely dissolved in the DMF, the argon hose was attached to
the reaction flask, and a distillation column equipped with a mineral oil bubbler was
attached to it. The NaH was slowly added by gently twisting the curved Schlenk tube
until all NaH had been added to the reaction flask. The mixture was stirred for ten
minutes. The curved tube was then removed and replaced with a glass stopper. The

73
argon valve was closed and the mixture was allowed to react at room temperature for 24
hours.
Before attaching the argon hose to the valve of the Br2CH2COOEt flask, the stem
of the valve was flushed with argon before the valve was opened and the hose attached.
The septum was then removed. A borosilicate graduated pipet was held in the flask
above the level of the liquid so that it too could be flushed with argon. As a precaution,
argon was taken up and expelled through the pipet and bulb before the tip was immersed
in the Br2CH2COOEt to draw approximately 32 mmoles. The glass stopper of the
reaction flask was removed and the Br2CH2COOEt released into the reaction mixture.
The glass stopper was immediately replaced after the reaction flask was flushed with
argon. The transparent yellow reaction mixture was stirred for 24 hours.
To remove DMF, the reaction flask was placed on a heating mantle and the
condenser was replaced with a fused glass distillation apparatus equipped with a vacuum
pump and a super-cooled collection flask. Under reduced pressure, the heat was slowly
adjusted until a gentle reflux occurred. DMF was collected until only ~ 5 ml and a
precipitate remained in the reaction flask. The reaction mixture was transferred to an
Erlenmeyer flask. Distilled water was added to the reaction flask and to the Erlenmeyer
flask, and both were stirred until the precipitate became gummy. The water was poured
off and warm 100% ethanol (EtOH) was added to dissolve impurities. At this point, the
contents of both flasks were consolidated because the precipitate had a powdery
consistency, indicative of the partial dissolution of the impurities. The flask was cooled
in the refrigerator overnight before the precipitate was filtered, washed with 100% EtOH,
and dried in a heated desiccator. The filtrate, which contained pure Compound 2, was

74
returned to the Erlenmeyer flask and cooled in the refrigerator for 3 hours. Water was
then added to the flask and a milky white precipitate formed. This precipitate
(Compound 2) was collected on a filter and dried in a heated vacuum desiccator. The
yield was 70%.
2.2.1.3 Formation of p-t-Butylcalix[4]arene-O,O’,O”,O’”-Tetraacetic Acid
Compound 2 was dissolved in 50 ml of dry THF. Aqueous 10%
tetramethylammonium hydroxide was added and the mixture stirred for 24 hours. The
mixture was then acidified with hydrochloric acid and stirred for 16 hours. The crude
product was isolated from the solvent by rotary evaporation, was thoroughly washed with
distilled water and dried in a vacuum desiccator. The yield is 97%. It is interesting to
note that this compound is water-soluble.
2.2.1.4 Formation of (N-L-Aminoacyl)calix[4]arene t-Butyl Ester
In this highly efficient reaction, 0.5 mmoles of the hydrolysis product, 2 mmoles
of the t-butyl ester•HCl of either L-alanine, L-valine, L-leucine, or L-isoleucine, and 4.4
mmoles of diisopropylethylamine were added to 25 ml of DMF and stirred until
completely dissolved. Next, 2.2 mmoles of the peptide coupling reagent HATU were
added to the reaction mixture and stirred at 0 °C for one hour, and at room temperature
for four hours. The reaction was stopped and water was added. The precipitate
(Compound 4) was filtered, washed thoroughly with water, and dried in a heated vacuum
desiccator. The yield was 86%.
2.2.1.5 Hydrolysis of (N-L-Aminoacyl)calix[4]arene t-Butyl Ester
Compound 4 was dissolved in 5 ml of methylene chloride. The mixture was
cooled in a dry ice/acetone bath while 10 ml of trifluoroacetic acid was added dropwise.

75
The reaction was rapid after removal of the flask from the cooling bath. After 30
minutes, the solvent was removed by reduced pressure distillation, leaving crude product
which was washed with distilled water and dried in a heated vacuum desiccator. The
overall yield was 97%.
2.2.2 NMR experiments
NMR experiments were executed in 5-mm NMR tubes on a Bruker AMX-500
spectrometer without sample spinning. Deuterated chloroform (CDCl3; δH 7.27 ppm, δC
77.0 ppm) was used as the solvent. Chemical shifts are expressed in δ (ppm) scale
downfield from tetramethylsilane (TMS), the internal reference standard. TOCSY
experiments were carried out using the following acquisition parameters: recycling delay
(D1), 2.0 s; dummy scans (DS) = 4; number of scans (ns) = 72; D0 increment, 3 µs;
temperature 303 K. Literature pulse sequences were used for other 1D and 2D
experiments. The 1H-1H NOESY connectivity maps were obtained with the following
parameters: 512x512 data matrix size; time domain (td) = 512 in F1 and 1024 in F2; D1
= 2 s; D0 = 3 ms; NS = 96; mixing time = 800 ms.12 The 1H-1H COSY parameters were
D1 = 1.5 s; DS = 4; NS = 64; D0 increment, 3 µs; spectral width in F2, 2400 Hz, and in
F1, 1200 Hz; temperature 298 K.13 HMQC parameters are 512x512 data matrix size; td
512 in F1 and 1024 in F2; D1 = 2 sec; ns = 48; ds = 4.14 HMBC parameters are 512x512
data matrix size; td 512 in F1 and 1024 in F2; rd = 2 sec; ds = 16; ns = 84; delay for
evolution of long range couplings = 0.06 s.15
2.3 Results and Discussion
Number assignments for Compound 2 and esters of each (N-L-
aminoacyl)calix[4]arene derivative are shown in Figure 2.2.

76
OO
O
)4(
1
2
3
4
5
6
7 8
9
10
11
12 13
14
15
CH3
20
20
21
22
20
21
22 23
2021
22
23
Compound Name Structure and R-groups
4-tert-butylcalix[4]arene-O,O’,O”,O’”-tetraacetic acid tetraethyl ester (Compound 2, Figure 1) N-L-alaninoacylcalix[4]arene t-butyl ester (1) N-L-valinoacylcalix[4]arene t-butyl ester (2) N-L-leucinoacylcalix[4]arene t-butyl ester (3) N-L-isoleucinoacylcalix[4]arene t-butyl ester (4)
Figure 2.2 Structure and number assignments of calixarene esters
A number of interesting points can be raised about the NMR data. First, it is evident in
Figure 2.3 that the derivatives adopt a cone conformation as do most of the esters for
ON
O
R
O O)4(
1
2
3
4
5
6
7 8
9
10
11
12 1314
15
16 17
18
19

77
which X-ray structures have been obtained.9 In this conformation, the methylene bridge
protons (11a, b) are positioned outside the cavity, one axial and the other equatorial with
respect to each benzene ring. This results in a splitting pattern, a pair of doublets in the
methylene region (3.0-5.0 ppm), with each doublet J-coupled at a frequency of
approximately 13 Hz. It is important to note that different conformers of calix[4]arenes
exhibit distinctive patterns in the methylene region of the 1H NMR spectra: (1) cone: one
pair of doublets; (2) partial cone: two pairs of doublets (ratio 1:1) or one pair of doublets
and one singlet (ratio 1:1); (3) 1,2-alternate: one singlet and two doublets (ratio 1:1); and
(4) 1,3-alternate: one singlet.10,11 Calixarenes most often assume the cone or partial cone
conformation. Proton and 13C NMR spectral data are summarized in Table 2.1.
Figure 2.3 Proton NMR spectrum of tetraacetic acid tetraethyl ester of 4-tert-
butylcalix[4]arene (Compound 2, Figure 2.1)
The assignment of each peak was made on the basis of one and two-dimensional
1H and 13C spectra using tetramethylsilane (TMS) as a reference. The TOCSY
experiment displayed overall coupling of protons throughout the molecules, whereas the
COSY experiment identified short range coupling as a result of through-bond interaction
of neighboring protons. The observed geminal coupling of the methylene protons (11a,
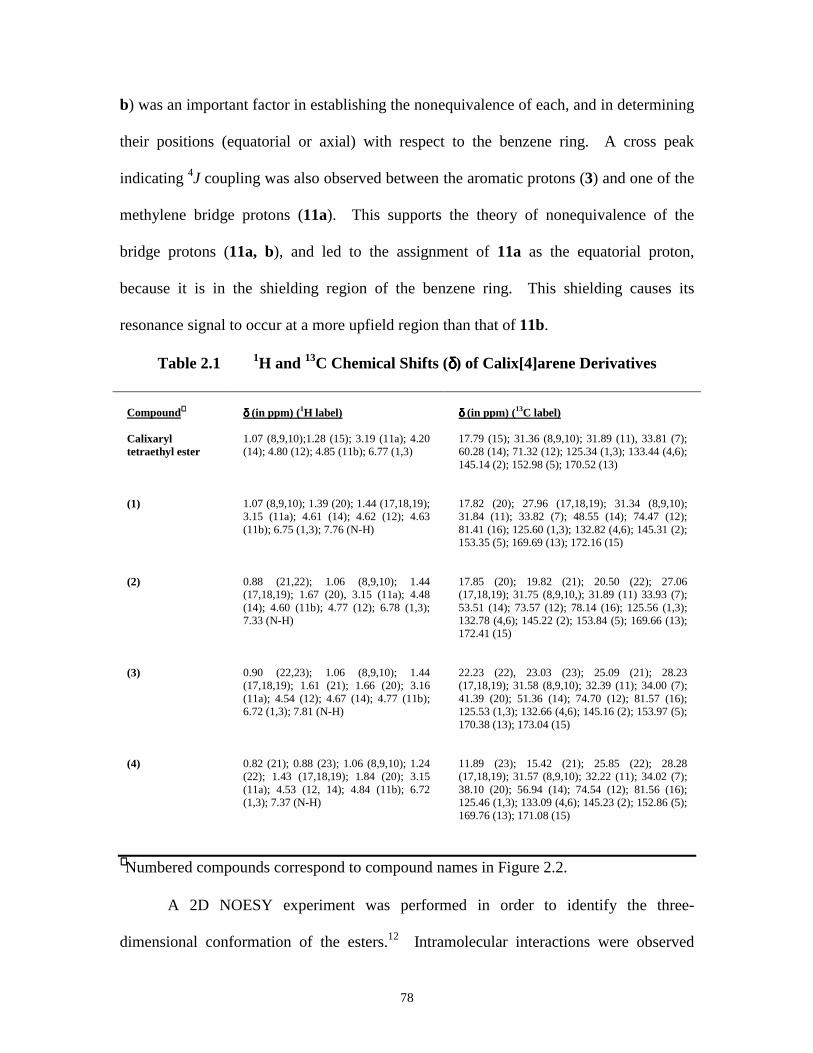
78
b) was an important factor in establishing the nonequivalence of each, and in determining
their positions (equatorial or axial) with respect to the benzene ring. A cross peak
indicating 4J coupling was also observed between the aromatic protons (3) and one of the
methylene bridge protons (11a). This supports the theory of nonequivalence of the
bridge protons (11a, b), and led to the assignment of 11a as the equatorial proton,
because it is in the shielding region of the benzene ring. This shielding causes its
resonance signal to occur at a more upfield region than that of 11b.
Table 2.1 1H and 13C Chemical Shifts (δδδδ) of Calix[4]arene Derivatives
Compound∗∗∗∗ δδδδ (in ppm) (1H label) δδδδ (in ppm) (13C label) Calixaryl tetraethyl ester
1.07 (8,9,10);1.28 (15); 3.19 (11a); 4.20 (14); 4.80 (12); 4.85 (11b); 6.77 (1,3)
17.79 (15); 31.36 (8,9,10); 31.89 (11), 33.81 (7); 60.28 (14); 71.32 (12); 125.34 (1,3); 133.44 (4,6); 145.14 (2); 152.98 (5); 170.52 (13)
(1)
1.07 (8,9,10); 1.39 (20); 1.44 (17,18,19); 3.15 (11a); 4.61 (14); 4.62 (12); 4.63 (11b); 6.75 (1,3); 7.76 (N-H)
17.82 (20); 27.96 (17,18,19); 31.34 (8,9,10); 31.84 (11); 33.82 (7); 48.55 (14); 74.47 (12); 81.41 (16); 125.60 (1,3); 132.82 (4,6); 145.31 (2); 153.35 (5); 169.69 (13); 172.16 (15)
(2)
0.88 (21,22); 1.06 (8,9,10); 1.44 (17,18,19); 1.67 (20), 3.15 (11a); 4.48 (14); 4.60 (11b); 4.77 (12); 6.78 (1,3); 7.33 (N-H)
17.85 (20); 19.82 (21); 20.50 (22); 27.06 (17,18,19); 31.75 (8,9,10,); 31.89 (11) 33.93 (7); 53.51 (14); 73.57 (12); 78.14 (16); 125.56 (1,3); 132.78 (4,6); 145.22 (2); 153.84 (5); 169.66 (13); 172.41 (15)
(3)
0.90 (22,23); 1.06 (8,9,10); 1.44 (17,18,19); 1.61 (21); 1.66 (20); 3.16 (11a); 4.54 (12); 4.67 (14); 4.77 (11b); 6.72 (1,3); 7.81 (N-H)
22.23 (22), 23.03 (23); 25.09 (21); 28.23 (17,18,19); 31.58 (8,9,10); 32.39 (11); 34.00 (7); 41.39 (20); 51.36 (14); 74.70 (12); 81.57 (16); 125.53 (1,3); 132.66 (4,6); 145.16 (2); 153.97 (5); 170.38 (13); 173.04 (15)
(4)
0.82 (21); 0.88 (23); 1.06 (8,9,10); 1.24 (22); 1.43 (17,18,19); 1.84 (20); 3.15 (11a); 4.53 (12, 14); 4.84 (11b); 6.72 (1,3); 7.37 (N-H)
11.89 (23); 15.42 (21); 25.85 (22); 28.28 (17,18,19); 31.57 (8,9,10); 32.22 (11); 34.02 (7); 38.10 (20); 56.94 (14); 74.54 (12); 81.56 (16); 125.46 (1,3); 133.09 (4,6); 145.23 (2); 152.86 (5); 169.76 (13); 171.08 (15)
∗∗∗∗ Numbered compounds correspond to compound names in Figure 2.2.
A 2D NOESY experiment was performed in order to identify the three-
dimensional conformation of the esters.12 Intramolecular interactions were observed

79
between t-butyl (8,9,10) and aromatic protons (1, 3), and between bridging methylene
protons (11a, b) as expected. Interestingly, unequal interaction of 11a and 11b with
nearby protons was observed. Only one bridging methylene proton (11b) showed spatial
interaction with acyl methylene (12) protons, whereas the other (11a) interacted with the
aromatic protons (1, 3). This dramatic difference between the bridging methylene
protons’ interactions is a strong indication that neither proton is positioned inside the
cavity of the calix[4]arene. Also, it further supports the theory that 11a and 11b are not
equivalent.
In order to assign the carbons bearing hydrogens, an HMQC (1JH-C) inverse
experiment was performed. It was observed that carbon 11, though directly attached to
the benzene ring is located upfield, indicating that it is strongly shielded from the applied
magnetic field. The arene carbons (1, 3) are located downfield in the aromatic region as
expected. Carbons 12 and 14 were unambiguously assigned, with carbon 12 being
located more downfield due to its proximity to electronegative substituents.
Structure determination required an extensive long-range 1H-13C correlation
experiment, HMBC, because of the high number of quaternary carbons in the calixarene
derivatives. The sequence employed was able to connect quaternary carbon atoms to any
second, third, or in some cases fourth neighbor. Carbon 13, located most downfield was
found to correlate with protons 12 and 14, exhibiting 2J and 3J coupling respectively.
Carbons 4 and 6 correlated with the aromatic (1, 3) and bridging methylene (11a, 11b)
protons through two bonds, and with acyl protons (12) through four bonds. Their
location in the 13C NMR spectrum (more downfield than carbons 1 and 3) is based upon
their closer proximity to the electronegative oxygen. The disappearance of cross peaks of

80
carbons 14 and 15 between their corresponding protons unequivocally showed that the
hydrolysis of the calixaryl tetraethyl ester (Compound 2, Figure 2.1) had been successful.
The NMR spectral data for t-butyl esters of CX4-L-ALA, CX4-L-VAL, CX4-L-
LEU, and CX4-L-ILE are summarized in Table 2.1 also. Hydrolysis of each ester to its
acid was shown by the disappearance of 1H and 13C peaks associated with the t-butyl
group of the amino acid.
A TOCSY experiment was performed for two main reasons. First, it gave
confirmation that the protected amino acid had been successfully attached to the
calix[4]arene tetracarboxylic acid by formation of an amide bond. Secondly, it enabled a
more definitive assignment of the protons along the amino acid portion of the
calix[4]arene, starting from the amide proton (N-H) (δ ~ 7.7 ppm), whose doublet is J-
coupled at a frequency of approximately 6 Hz. Because the side chain of alanine is a
single methyl group, only two cross peaks are noteworthy in its COSY spectrum: one
occurring between the amide proton (N-H) and the α proton (14); and the other between
14 and the β protons (20), the methyl protons of the side chain.
An HMQC correlation between carbon 20 and its corresponding protons
confirmed that it is located most upfield in the 13C NMR spectrum of CX4-L-ALA t-butyl
ester. Another correlation was observed between the stereogenic carbon 14 and its
corresponding proton. As expected, a correlation between the t-butyl carbons of the
protected amino acid (17, 18, 19) and their corresponding protons was observed. All
other correlations occurred between protons and carbons of the calix[4]arene skeleton.
An HMBC experiment was performed to assign the two quaternary carbons correctly.
Correlations were observed between carbon 15 and protons 14 and 20, indicating 2J and

81
3J coupling, respectively. In addition, a correlation indicating 2J coupling between
carbon 16 and t-butyl protons (17, 18, 19) was observed. The occurrence of cross peaks
signifying 2J coupling between carbon 13 and proton 12 and the amide proton (N-H) was
a valuable indicator of the successful synthesis of (N-L-alaninoacyl)calix[4]arene t-butyl
ester. All other correlations were between carbons and protons of the calix[4]arene
cavity.
A double doublet in the aliphatic region of the 1H NMR spectrum of CX4-L-VAL
t-butyl ester led to its assignment to the geminal methyl protons (21, 22) of the isopropyl
side chain. The COSY spectrum of CX4-L-VAL t-butyl ester (Figure 2.4) revealed one
noteworthy cross peak, occurring between the methine proton (20) and the terminal
methyl protons (21, 22) of the isopropyl side chain.
Figure 2.4 COSY spectrum of CX4-VAL t-butyl ester

82
In the HMQC spectrum of CX4-VAL t-butyl ester, strong cross peaks were observed
between carbons 14, 20, 21, and 22 and their attached protons. The most useful
information was obtained from the HMBC spectrum (Figure 2.5). This spectrum not
only showed the correlations between carbons and protons of the calixarene cavity but
also showed residual HMQC correlations. For example, the correlation of carbon 21 with
proton 14, and carbon 22 with protons 21 and 22 is evident in both the HMQC and
HMBC spectra. Other correlations were carbons 13 and 15 with proton 14, and carbon
16 with t-butyl protons (17, 18, 19), which led to the unambiguous assignment of all
carbons in the molecule.
Figure 2.5 HMBC Spectrum of CX4-VAL t-butyl ester

83
The TOCSY NMR spectral data for CX4-L-LEU t-butyl ester are shown in Figure
2.6. A pair of doublets indicating the geminal methyl protons (22, 23) of the isobutyl
side chain, suggests that the protons are nonequivalent. The COSY spectrum of the acid
form of this derivative shows indistinguishable differences in the interactions of these
protons with nearby protons. Therefore, both of these protons are presumed to be
equivalent. As was the case for CX4-L-VAL, cross peaks were observed between the
amide proton (N-H) and protons 12 and 14. Strong interactions were observed between
proton 14 and protons 20 and 21. This may be attributed to the linearity of the isobutyl
chain, by which proton 14 feels the influence of its neighboring protons more, with less
interaction between it and a bulky methyl branch, as is the case with the sec-butyl side
chain of isoleucine. As expected, there were cross peaks between 20 and 21, between 20
and protons 22 and 23, and between 21 and protons 22 and 23, indicating strong coupling
between these protons. Extraneous cross peaks observed in the 1H NMR spectra may be
due to the existence of other conformers of calixarene derivatives. Studies are underway
to determine their origin and identity.
Peaks representing the terminal methyl protons (21, 23) of the sec-butyl side
chain of isoleucine were resolved as a doublet (21) and a triplet (23) in the 1H NMR
spectrum of CX4-L-ILE t-butyl ester. A cross peak between the amide proton (N-H) and
the α proton (14) was observed. Also, cross peaks indicating 3J coupling of the α proton
(14) to the β proton (20) were observed. Couplings between the β proton (20) and
protons 21, 22, and 23 were indicated by strong cross peaks observed in the aliphatic
region of the spectrum (0.18 - 2.0 ppm).

84
Figure 2.6 TOCSY Spectrum of (N-L-leucinoacyl)calix[4]arene t-butyl ester
2.4 Conclusions
Tert-butyl esters of (N-L-alaninoacyl)calix[4]arene, (N-L-valinoacyl)-
calix[4]arene, (N-L-leucinoacyl)calix[4]arene, (N-L-isoleucinoacyl)calix[4]arene, and
their corresponding acids have been synthesized in good yields. In the spectra, the
disappearance of the second t-butyl singlet (protecting group of amino acid) was
indicative of the successful generation of tetra-substituted final products. The

85
characteristic splitting patterns of methylene bridge protons in the spectra confirmed that
the derivatized calixarenes maintained their cone conformation.
Part II. Synthesis and Characterization of Calixarene-Bonded Silica Stationary Phases
2.5 Introduction
As discussed in Chapter 1, calixarenes are a versatile class of compounds capable
of forming inclusion complexes with a variety of guest molecules. Their simple structure
and ease of derivatization make the exploitation and modification of their chemical and
physical properties an attractive undertaking. It has been demonstrated that calixarenes
can be employed as stationary phases in capillary gas chromatography,17,18 liquid
chromatography,19,20 and more recently capillary electrophoresis.21 The utility of
calixarenes in aqueous capillary electrophoresis is limited by three key factors. First,
complete dissolution of the calixarenes in a suitable run buffer may be problematic.
Buffer solutions may become turbid upon standing, thus discouraging long experimental
sequences. Secondly, their high UV absorption may impair selectivity and efficiency if
UV detection is used. Thirdly, the inability to reuse the derivatives after dissolution in
the run buffer amplifies the overall man-hours devoted to buffer replenishment.
Immobilization of the derivatives onto the walls of the capillary or onto silica beads
within the capillary would offer a reusable capillary which would be stable in a variety of
environments and selective for a variety of molecules (charged, neutral, and chiral) in a
single run.
In this report, I have attempted to tether CX4-L-VAL to aminopropyl silica beads
(APS) for use as stationary phases in capillary electrochromatography. As their name
suggests, APS beads are silica beads which have been chemically modified to possess

86
aminopropyl moieties. The primary amine is very reactive with carboxylic acids,
therefore I aim to deprotonate one of the carboxylic groups of CX4-L-VAL in order to
ultimately form an amide bond.
2.6 Experimental Section
The peptide coupling agent O-(7-azabenzotriazol-1-yl)-1,1,3,3-
tetramethyluronium hexafluorophosphate (HATU) is used to facilitate the bond formation
in the presence of the base N,N-diisopropylethylamine (DIPEA). The synthetic scheme
of the stationary phase (CVAPS) is displayed in Figure 2.7.
Si
O
NH2
Si OH
SilicaBeadSurface
+O
N O
O
OH
R
( )4
HATUDIPEADMF
Si
O
NH
Si OH
SilicaBeadSurface
O
N
OO
R
O
N
OO
R
()3
HO
Figure 2.7 Synthetic scheme of CVAPS stationary phase

87
Approximately 0.15 g of CX4-L-VAL was dissolved in DMF in a round bottom flask.
To this solution, DIPEA was added to deprotonate the carboxylic acid. The peptide
coupling agent HATU was added next, and finally APS beads were slowly added over a
20 minute period. The reaction was stirred for 24 hours. The mixture was filtered and
washed with several aliquots of DMF. The product was dried under vacuum for 24 hours
before being analyzed by infrared spectrometry and elemental analysis. Infrared spectra
of CX4-L-VAL, APS, and CVAPS were obtained, but the presence of a broad peak
indicative of strong silicon-oxygen stretching in CVAPS rendered IR ineffective for
characterization (see appendix). Although IR results were inconclusive, elemental
analysis indicated carbon, hydrogen and nitrogen percentages increased. Results are
summarized in Table 2.2. Most importantly, the %C in the three trials compared to the
%C of APS represent a 9.44, 6.64, and a 7.08% increase, respectively.
Table 2.2 Elemental analysis of three batches of CVAPS stationary phase
Sample %C %H %N
APS 3.14 0.30 0.66
Trial 1 12.58 0.69 0.89
Trial 2 9.78 0.88 1.25
Trial 3 10.22 0.96 1.37
Surface coverage is a parameter which is normally used to characterize bonded
silica beads in HPLC.22 After elemental analysis is used to determine the percentage of
carbon on the beads, Equation 2.1 is used to calculate the surface coverage:

88
( )nA
Cmmolragecovesurface1200
10% 62 ×=−µ , (2.1)
where %C is the carbon percentage (w/w) acquired from elemental analysis, n is the
number of carbon atoms in the molecule, and A is the surface area of the silica gel (in m2
g-1), respectively. Results of the samples in Table 2.2 are summarized in Table 2.3.
Table 2.3 Surface coverage of calixarene-modified silica beads
Sample Surface coverage (µµµµmol m-2)
APS 0.21
Trial 1 0.82
Trial 2 0.64
Trial 3 0.67
It has been reported that the percentage of carbon revealed by elemental analysis
is the average of the entire bulk of the silica gel. Furthermore, it does not allow for
correction of carbon present from organic contaminants or materials which are normally
present on the surface of samples.23 Consequently, elemental analysis introduces
significant error in the calculation of surface coverage by the aforementioned equation.
However, elemental analysis results have still been included in this chapter for
comparative purposes.
Solid-state 13C NMR spectra of APS, CX4-L-VAL, and CVAPS were acquired
with the aim of monitoring carbonyl spectral shifts which would infer the establishment
of a covalent bond between CX4-L-VAL and APS. As expected, three carbon signals
were obtained with APS. The spectra of APS, CX4-L-VAL, and CVAPS are shown in
Figure 2.8.

89
Figure 2.8 Solid State 13C NMR spectra of (A) APS, (B) CX4-L-VAL, and (C) CVAPS
A shift in the carbonyl resonance around 170 ppm would indicate the formation of an
amide bond between CX4-L-VAL and APS.24 However, if only one monomer unit of
CX4-L-VAL bonded with APS through an amide bond, the overall change in internal

90
field strength may be too small to notice. As evidenced by Figure 2.8c, there is no
noticeable shift in the carbonyl resonance, but the downfield shifts of the APS carbons
suggest that they are being subjected to a stronger internal field strength than before.
Such a shift could indicate bond formation as well.
References
1. C.D. Gutsche, Calixarenes. Monographs in Supramolecular Chemistry (Royal Society of Chemistry, Cambridge, 1989).
2. L.J. Bauer and C.D. Gutsche, J. Am.Chem.Soc. 107, 6063-6069 (1985). 3. S. Shinkai, S. Mori, T. Tsubaki, T. Sone, and O. Manabe, Tetrahedron Lett. 25,
5315-5318 (1984). 4. S. Shinkai, S. Mori, H. Koreishi, T. Tsubaki, and O. Manabe, J. Am. Chem. Soc.
108, 2409-2416 (1986). 5. D. Shohat and E. Grushka, Anal. Chem. 66, 747-750 (1994). 6. S.X. Sun, M.M. Sepaniak, J.S. Wang, and C.D. Gutsche, Anal. Chem. 69, 344-
348 (1997). 7. M.S. Peña, Y. Zhang, S. Thibodeaux, M.L. McLaughlin, A. Muñoz de la Peña,
and I.M. Warner, Tetrahedron Lett. 37, 5841-5844 (1996). 8. M.S. Peña, Y. Zhang, and I.M. Warner, Anal. Chem. 69, 3239-3242 (1997). 9. F. Arnaud-Neu, E.M. Collins, M. Deasy, G. Ferguson, S.J. Harris, B. Kaitner, A.
J. Lough, M.A. McKervey, E. Marques, B.L. Ruhl, M.J. Schwing-Weill, and E.M. Seward, J. Am. Chem. Soc. 111, 8681-8691 (1989).
10. V. Bocchi, D. Foina, A. Pochini, R. Ungaro, and G.D. Andreetti, Tetrahedron 38,
373-378 (1982). 11. C.D. Gutsche, B. Dhawan, J.A. Levine, H.N. Kwang, and L.J. Bauer, Tetrahedron
39, 409-426 (1983). 12. A. Bax and D.G. Davis, J. Magn. Reson. 63, 207-213 (1985).

91
13. M. Rance, O.W. Sorensen, G. Bodenhausen, G. Wagner, R.R. Ernst, and K. Whüthrich, Biochem. Biophys. Res. Commun. 117, 479-485 (1983).
14. J.N. Shoolery, J. Nat. Prod. 47, 226-259 (1984). 15. A. Bax, and M.F. Summers, J. Am. Chem. Soc. 108, 2093-2094 (1986). 16. A. Kumar, G. Wagner, R.R. Ernst, and K. Whüthrich, Biochem. Biophys. Res.
Commun. 96, 1156-1163 (1980). 17. Gross, B., Jauch, J., Schurig, V. J. Microcolumn Separations 1999, 11, 313. 18. Zhang, L., Chen, L., Lu, X., Wu, C., Chen, Y. J. Chromatogr. A 1999, 840, 225. 19. Sokolieb, T., Menyes, U., Roth, U., Jira, T. J. Chromatogr. A 2002, 948, 309. 20. Healy, L.O., McEnery, M.M., McCarthy, D.G., Harris, S.J., Glennon, J.D. Anal.
Lett. 1998, 31, 1543. 21. Wang, Z., Chen, Y., Yuan, H., Huang, Z., Liu, G. Electrophoresis 2000, 21, 1620. 22. Barrett, D.A., Brown, V.A., Davies, M.C., Shaw, P.N. Anal. Chem. 1996, 68,
2170. 23. Arena, G., Contino, A., Magri, A., Sciotto, D., Spoto, G., Torrisi, A. Ind. Eng.
Chem. Res. 2000, 39, 3605. 24. Friebolin, H. Basic One- and Two-Dimensional NMR Spectroscopy (VCH
Publishers, New York, 1993)
92
CHAPTER 3. N-ACYLCALIX[4]ARENE L-AMINO ACID DERIVATIVES AS CHIRAL SELECTORS IN ELECTROKINETIC CAPILLARY CHROMATOGRAPHY
Part I. Introduction
Electrokinetic capillary chromatography (EKC) is an attractive analytical technique
because of its wide application range, cost, ease of operation and method development, speed,
extreme sensitivity, and minimal use of solvents and analytes, compared to traditional separation
techniques such as high-performance liquid chromatography (HPLC).1 It is an electrophoretic
technique capable of separating charged and neutral analytes in the presence of an electric field.
The separation of charged analytes comes about by their differential mobilities in the electric
field, whereas neutral compounds are separated on the basis of their variable interactions with a
pseudostationary phase. Typical pseudostationary phases are cyclodextrins,2,3 crown ethers,4,5
dendrimers,6-8 surfactants,9-12 polymerized micelles,13-16 and calixarenes,17-20 all of which can
possess chiral recognition ability inherently or via derivatization.
Interest in calixarenes in analytical chemistry has spawned from the seemingly endless
possibilities of their application.21 They are composed of repeating phenolic units linked by
methylene bridges to form a torus-shaped macrocycle consisting of a hydrophobic cavity, similar
to that of cyclodextrins. Unlike cyclodextrins, the calixarene cavity structure is not rigid, and
may undergo conformational changes and at times collapse altogether depending upon
experimental conditions. The majority of calixarene research focuses upon the exploitation of
their complexation ability. In the solid state, simple substituted benzene-calix[4]arene
complexes have been reported.22,23 Many reports of solution-state calixarene complexation focus
upon complexes formed in nonaqueous solvents24-28 because the most common calixarenes are
not water-soluble. Only after the results of Shinkai and co-workers29,30 were reported did the
study of calixarene complexation in aqueous media gain momentum. Without derivatization

93
however, their simple symmetrical structures render them incapable of discriminating between
chiral enantiomers.
In this investigation, we synthesized calix[4]arene derivatives bearing amino acid
moieties (namely L-alanine, L-valine, L-leucine, and L-isoleucine) on their lower rims in order to
produce water-soluble compounds which are capable of chiral recognition in EKC.
Experimental parameters (pH, calix[4]arene concentration, and organic modifier concentration)
were varied in order to determine their effect on analyte selectivities, capacity factors, and
resolution of binaphthyl and benzodiazepine derivatives.
Part II. Experimental Section
3.1 Chemicals and Reagents
The synthesis of each N-L-aminoacylcalix[4]arene derivative was performed according to
the procedure reported by Sánchez-Peña and co-workers.31 The structure is shown in Figure 3.1
with R representing the components of each amino acid side chain as indicated. The analytes
(±)-1,1’-bi-2-naphthol (BOH), (R)-(+)-1,1’-bi-2-naphthol (R-BOH), (S)-(-)-1,1’-bi-2-naphthol
(S-BOH), (R)-(+)-1,1’-binaphthyl-2,2’-diamine (R-BNA), (S)-(-)-1,1’-binaphthyl-2,2’-diamine
(S-BNA), (±)-1,1’-binaphthyl-2,2’-diyl hydrogen phosphate (BNP), (R)-(+)- 1,1’-binaphthyl-
2,2’-diyl hydrogen phosphate (R-BNP), and (S)-(-)- 1,1’-binaphthyl-2,2’-diyl hydrogen
phosphate (S-BNP) were dissolved in either 50:50 methanol/water 80:20 methanol/water, or
100% methanol to yield an approximate concentration of 0.33 mg/ml. The benzodiazepine
derivatives lorazepam, oxazepam and temazepam were obtained in 1.0-mg/ml methanol
solutions and diluted to a concentration range of 0.3–0.5 mg/ml with 100% methanol before use.
The structures of the analytes are shown in Figure 3.2. A PureLab UV/UF water system was
used to deionize distilled water to 18 MΩ.

94
ONH
OO OH
R
) 4(
R A M I N O A C I DC H 3 A L A N I N EC H ( C H 3 ) 2 V A L I N EC H 2 C H ( C H 3 ) 2 L E U C I N EC H ( C H 3 ) C H 2 C H 3 I S O L E U C I N E
Figure 3.1 Structure of N-Acylcalix[4]arene L-amino acid derivatives
O
O
NH 2
NH 2
PO
OH
Cl
N
N
Cl
H
OH
OH
Cl
N
*
N
H
OH
OCH3
LORAZEPAM
*
TEM AZEPAM
BNP (1)
OXAZEPAM
Cl
N
N
H
OH
OH
OH
OH
BOH (2)
*
BNA (3)
Figure 3.2 Structures of binaphthyl derivatives and benzodiazepines

95
3.2 Capillary Electrophoresis Procedure
Binaphthyl derivative separations were performed using a BioFocus 3000 automated
capillary electrophoresis system employing a multiwavelength UV absorbance detector at 254
nm, 280 nm, and 300 nm. A 50 cm (effective length) bare fused-silica capillary with 50 µm
inner diameter was thermostated at 25 ºC by a 20% methanol solution and used as the separation
platform. Benzodiazepine separations were performed using a Hewlett-Packard 3D capillary
electrophoresis system equipped with a UV-Visible absorbance detector which monitored the
separation at a wavelength of 254 nm. A 56.5 cm (effective length) bare fused-silica capillary
with 50 µm inner diameter was used as the separation column and was air-cooled to 12 ºC to
minimize analyte racemization. In both systems, a constant voltage of +25 kV was used to
induce analyte and electrolyte mobility within the capillary.
3.3 Background Electrolyte Preparation
Dry quantities of each calix[4]arene derivative were dissolved in 100 mM
Tris(hydroxymethyl)-aminomethane (Tris) to produce buffered solutions possessing
calix[4]arene concentrations ranging from 0.1 mM to 15 mM. The pH of each buffer was
adjusted with 1.0 M NaOH or 1.0 M HCl to produce solutions over a pH range of 6.5 to 11. All
solutions were sonicated and filtered through a 0.45 µm nylon filter prior to use.
Part III. Results and Discussion
3.4 Binaphthyl Derivative Separations
Some binaphthyl derivatives are known to be effective chemical shift reagents in nuclear
magnetic resonance spectroscopy.32 Their chirality is a result of an asymmetrical plane as
opposed to a stereogenic carbon; hence these non-superimposable mirror-imaged compounds are
called atropisomers as opposed to enantiomers. Sánchez-Peña and co-workers effectively
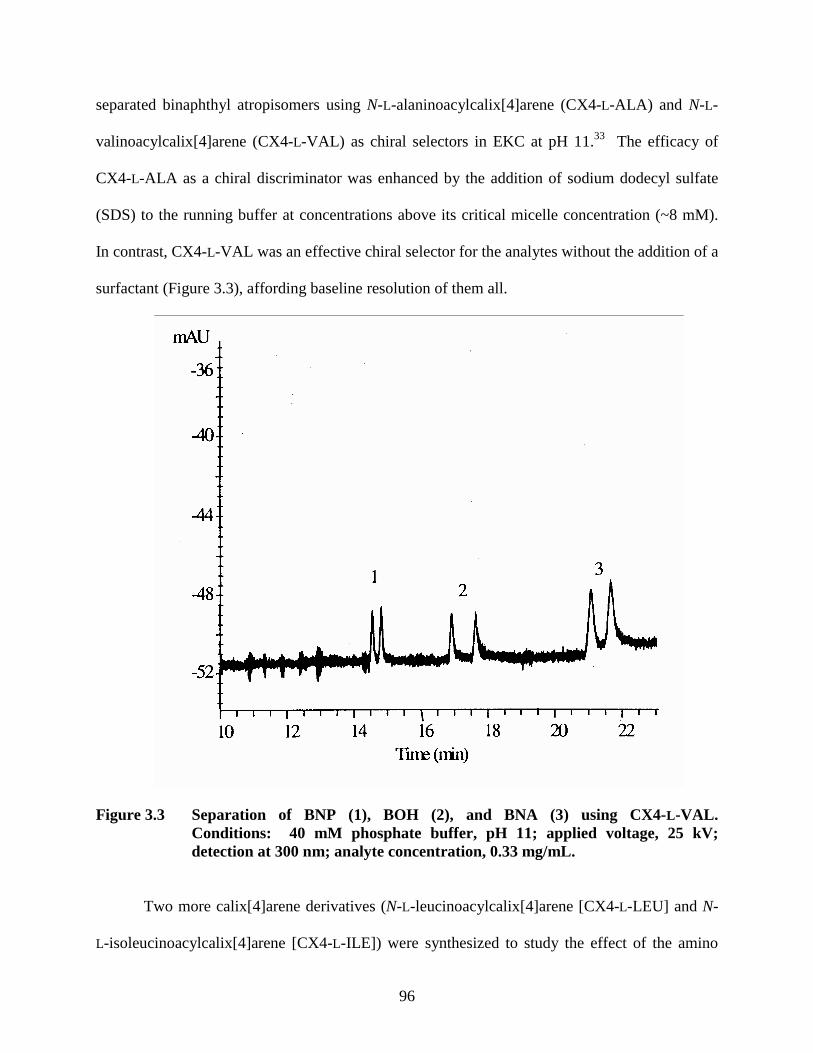
96
separated binaphthyl atropisomers using N-L-alaninoacylcalix[4]arene (CX4-L-ALA) and N-L-
valinoacylcalix[4]arene (CX4-L-VAL) as chiral selectors in EKC at pH 11.33 The efficacy of
CX4-L-ALA as a chiral discriminator was enhanced by the addition of sodium dodecyl sulfate
(SDS) to the running buffer at concentrations above its critical micelle concentration (~8 mM).
In contrast, CX4-L-VAL was an effective chiral selector for the analytes without the addition of a
surfactant (Figure 3.3), affording baseline resolution of them all.
Figure 3.3 Separation of BNP (1), BOH (2), and BNA (3) using CX4-L-VAL. Conditions: 40 mM phosphate buffer, pH 11; applied voltage, 25 kV; detection at 300 nm; analyte concentration, 0.33 mg/mL.
Two more calix[4]arene derivatives (N-L-leucinoacylcalix[4]arene [CX4-L-LEU] and N-
L-isoleucinoacylcalix[4]arene [CX4-L-ILE]) were synthesized to study the effect of the amino

97
acid side chain length on the separation of the binaphthyls. Because the amino acid side chains
of leucine and isoleucine are more hydrophobic than those of alanine and valine, water-solubility
of the calixarene derivatives of these compounds was enhanced by the use of Tris as the running
buffer. It was inferred that the larger size of these calixarenes would cause longer migration
times of the analytes upon complexation. As indicated in Figure 3.4, the new calix[4]arene
derivatives are effective chiral selectors for binaphthyl separations at a much lower pH, therefore
preserving capillary integrity over a longer period of time. As predicted, the new calixarenes
moved slowest in the capillary, forming strong complexes with analytes and causing them to
elute at longer migration times as a consequence.
Figure 3.4. Separation of BNP, BOH, and BNA using 10 mM CX4-L-LEU (A) and 10 mM CX4-L-ILE (B) buffer systems. Conditions: 100 mM Tris buffer, 8 M urea, pH 8.7; applied voltage, 25 kV, detection at 300 nm; analyte concentration 0.33 mg/mL.

98
A study of the effect of pH on the separation of a mixture of the binaphthyl derivatives
was investigated using 100 mM Tris containing 10 mM CX4-L-LEU or CX4-L-ILE. The effect
of pH on atropisomeric resolution indicated that the workable pH range of these calixarenes is
from 7 to 11. At pH values below 7, the calixarenes precipitated out of solution due to a
decrease in the ionization of the carboxylate functionalities. When CX4-L-LEU was used as the
chiral selector, BNP atropisomers eluted first, followed by those of BOH and BNA, respectively,
at each pH. In every case, the R-(+)-atropisomer eluted before its corresponding S-(-) antipode.
A decrease in resolution of BNP was observed at pH values above 7, while increases in
resolution were observed for BOH and BNA. The effect of pH on the observed resolution of the
binaphthyl derivatives is shown in Figure 3.5.
00.5
11.5
22.5
33.5
7 8 9 10
pH
Res
olut
ion BNP
BOHBNA
Figure 3.5 Effect of pH on the resolution of binaphthyl derivatives; Conditions: 10 mM CX4-LEU/6 M Urea/100 mM Tris; others same as Figure 3.4.
The addition of urea was necessary to achieve separation of the binaphthyl derivatives. It
has been shown that achiral modifiers can enhance chiral recognition of chiral pseudostationary
phases.34 In previous studies, the addition of the surfactant sodium dodecyl sulfate (SDS)

99
enhanced resolution of the binaphthyl derivatives.33 In contrast, SDS did not enhance resolution
and urea was employed as an achiral modifier in this study. A high concentration of urea
increases the solutility of hydrophobic compounds into water as well as hinders hydrogen bond
formation. Therefore, a urea concentration range of 0 to 10 M was employed to investigate its
effect on chiral recognition of the binaphthyl derivatives. As the concentration of urea increased,
the viscosity of the buffer, the migration times of the analytes, and baseline noise increased.
Despite these observations, baseline resolution was achieved for each binaphthyl derivative at
some point. At urea concentrations below 6 M, BNP was not resolved with either calixarene.
However, BNP atropisomers were baseline resolved without a significant change in resolution
(Rs ~ 1) between 5.5 and 8.5 M urea. A complete loss of resolution was observed at
concentrations above 8.5 M. In contrast, resolution values higher than one (Rs = 1, baseline
resolution) were achieved at each urea concentration employed (Figure 3.6). In all cases, the R-
atropisomer eluted before the S-atropisomer, suggesting that a stronger complex forms between
the S-atropisomer and each calix[4]arene derivative.
0
2
4
6
8
10
6 7 8 9 10
[Urea], M
Res
olut
ion
BNPBOHBNA
Figure 3.6 Effect of urea concentration on resolution of binaphthyl derivatives

100
It is interesting to note the difference in analyte selectivity of CX4-L-LEU compared to
that of CX4-L-ILE. The analyte elution order was BNP>BOH>BNA when CX4-L-LEU was
used as the chiral selector, in agreement with previous studies using CX4-L-ALA and CX4-L-
VAL. When CX4-L-ILE was employed in the running buffer, the overall elution order was
BNP>BOH>BNA, but the R-atropisomer of BNA eluted before the S-atropisomer of BOH.
Because leucine and isoleucine are constitutional isomers, their mobilities within the capillary
are identical. A significant difference between the structures of the isomers is the presence of an
additional stereogenic carbon in isoleucine. We believe that this additional chiral center
contributes to the difference in observed analyte selectivity.
3.5 Benzodiazepine Separations
The benzodiazepines employed (lorazepam, oxazepam, and temazepam) are a group of
pharmaceutical compounds presently sold to consumers in racemic mixtures to treat anxiety and
insomnia. Under the conditions studied, all three analytes were electrically neutral, while the
calixarenes were anionic. As a result of their negative charge, the calixarenes moved in a
direction opposite that of the analytes, but the bulk electroosmotic flow ultimately caused all
species in the capillary to be moved away from the point of injection towards the detector.
3.5.1 Effect of Amino Acid Chain Length
Because of the difference in aliphatic chain length of the amino acid residues, the
hydrophobicities of the calixarenes vary. Valine, leucine, and isoleucine have hydrocarbon side
chains that are three and four carbons long, whereas alanine possesses a methyl side chain. The
larger side chains are hydrophobic and are most likely to cluster in order to avoid contact with
water. We believe that conformational changes in the side chain influence the complexation
ability of each calixarene with each analyte, therefore producing changes in the migration times

101
of the analytes under investigation. Separations were carried out using a 10 mM concentration of
each calixarene derivative in 100 mM Tris buffer. Electropherograms of the separation of
oxazepam enantiomers using each calixarene derivative as a buffer additive in EKC are shown in
Figure 3.7. When CX4-L-ALA was used as the buffer additive, the enantiomers were only
partially resolved, whereas baseline resolution was achieved when the longer chain amino acid-
derivatized calixarenes were used. Baseline resolution in the shortest time with a minimum
amount of band broadening was achieved with the CX4-L-LEU buffer system. This suggests
that a weaker binding interaction between each enantiomer and CX4-L-LEU took place. Such
were the same observations with oxazepam and temazepam enantiomers in the CX4-L-LEU
buffer system.
min6 8 10 12 14 16
mAU
-50
0
50
(A)
min6 8 10 12 14 16
mAU
-50
0
50
(B)
min6 8 10 12 14 16
mAU
-50
0
50(C)
min6 8 10 12 14 16
mAU
-50
0
50
(D)
Figure 3.7 Separation of oxazepam enantiomers using 5 mM CX4-L-ALA (A), CX4-L-VAL (B), CX4-L-LEU (C), and CX4-L-ILE (D). Conditions: 100 mM Tris (pH 9); applied voltage, 25 kV; temperature, 12 ºC; analyte concentration 1 mg/mL.

102
3.5.2 Effect of pH
The effect of pH on the resolution of the benzodiazepines was investigated using a 100
mM Tris buffer and a 10 mM concentration of each calixarene derivative. Because calixarene
water-solubility could be induced at pH values of 8 and higher with this buffer system, the pH
range studied was between 8 and 11. Buffer systems containing CX4-L-ALA were found to be
unsuitable to achieve resolution values of at least 1.0 throughout the pH range investigated, but
lorazepam and oxazepam enantiomers were separated with a resolution of at least 0.85 at pH 10.
The highest resolution values were realized at pH values of 10 and 11 for buffer systems
containing CX4-L-VAL and CX4-L-LEU (Figure 3.8).
(A)
0.990
1.000
1.010
1.020
8 9 10 11pH
(B)
1.020
1.050
1.080
1.110
8 9 10 11pH
1.01
1.03
1.05
1.07
8 9 10 11pH
(D)
1.001.101.201.301.40
8 9 10 11pH
Figure 3.8 Effect of pH on the chiral interaction (αααα) of lorazepam (-♦-), oxazepam (--), and temazepam (--) with CX4-L-ALA (A), CX4-L-VAL (B), CX4-L-LEU (C), CX4-L-ILE (D). Conditions same as in Figure 3.7.
αα αα
αα αα
αα αα
αα αα
(C)

103
3.5.3 Effect of Chiral Selector Concentration
A concentration range of 0.25 to 15 mM calixarene was used to investigate the effect of
calixarene concentration on the resolution of the benzodiazepines. The electrolyte system
employed was a 100 mM Tris buffer at pH 10. The relationship between CX4-L-ILE
concentration and the resolution of the benzodiazepines is illustrated in Figure 3.9. Among all
calixarenes employed, it was discovered that a 5 mM concentration yielded the best resolution
values. Band broadening, longer migration times, and a decrease in resolution were observed at
concentrations higher than 5 mM.
0
2
4
6
8
0.00 3.00 6.00 9.00 12.00 15.00
CX4-ILE concentration (mM)
Res
olut
ion lorazepam
oxazepamtemazepam
Figure 3.9 Effect of CX4-ILE concentration on the resolution of benzodiazepines
3.5.4 Effect of the Number of Chiral Centers
It was observed that the CX4-L-ILE buffer system most often produced the most
pronounced and unpredictable results in terms of resolution, selectivity, and migration times.
Because L-leucine and L-isoleucine are constitutional isomers, their corresponding calixarene
derivatives are expected to share a similar mobility in the capillary. Also, we expect their chiral
interaction (represented by α) with the analytes to be different, because leucine possesses one
chiral center while isoleucine possesses two. However, it is evident in Figure 3.10 that while
lorazepam enantiomers are experiencing more binding interaction (e.g., higher Rs values) with

104
CX4-L-ILE when compared to CX4-L-LEU, they are experiencing a chiral interaction (α=1.09)
similar to that of CX4-L-LEU (α=1.04).
min16.4 16.6 16.8 17 17.2 17.4 17.6 17.8 18
mAU
-14
-13
-12
-11
-10
-9
-8
-7 (A)
min16.4 16.6 16.8 17 17.2 17.4 17.6 17.8 18
mAU
-14
-13
-12
-11
-10
-9
-8
-7
(B)
Figure 3.10 Separation of lorazepam enantiomers using CX4-L-LEU (A) and CX4-L-ILE (B). Conditions same as in Figure 3.7, pH 10.
This means that neither enantiomer is favored over the other by the calixarene in terms of
chirality. At the optimum calixarene concentration (5 mM), oxazepam enantiomers were more
resolved in the CX4-L-ILE buffer system and at shorter migration times (Figure 3.11).
min12.5 13 13.5 14 14.5
mAU
-40
-20
0
20
40
60
80 (A)
min12.5 13 13.5 14 14.5
mAU
-80
-60
-40
-20
0
20
40
60
80
100 (B)
Figure 3.11 Separation of oxazepam enantiomers using CX4-L-LEU (A) and CX4-L-ILE
(B). Conditions same as in Figure 3.7, pH 10.

105
Also, the second chiral center of the isoleucine side chain in CX4-L-ILE played a greater role in
the separation as evidenced by a corresponding α value of 1.26 in comparison to an α value of
1.09 for CX4-L-LEU. Like lorazepam, the temazepam enantiomers were more resolved in the
CX4-L-ILE buffer system at longer migration times than those achieved in the CX4-L-LEU
system. However, there was more chiral interaction in the CX4-L-ILE system. More detailed
studies are underway to investigate the role of the additional chiral center on the separations we
observed.
Part IV. Conclusions
The study presented in this chapter compared the effectiveness of four L-amino acid-
derivatized calix[4]arenes as chiral selectors in EKC for the separation of binaphthyl and
benzodiazepine derivatives. Parameters optimized for these separations were buffer pH and
chiral selector concentration. The optimum buffer pH for the separations was 10 and the chiral
selector concentration was 5 mM in 100 mM Tris. Under neutral and basic conditions, it was
demonstrated that calix[4]arenes bearing amino acids with longer side chains (CX4-L-VAL,
CX4-L-LEU, and CX4-L-ILE) are strong chiral selectors when compared to CX4-L-ALA.
Because we observed a different elution order of the binaphthyl derivatives when CX4-L-ILE
was employed in the buffer system, it was deduced that CX4-L-ILE exhibited a different analyte
selectivity than CX4-L-ALA, CX4-L-VAL, and CX4-L-LEU. This observation led us to
investigate the role of its second chiral center in the separation of benzodiazepines. In terms of
chiral selectivity, it was shown that CX4-L-ILE provided the most chiral interaction between
itself and the analytes. Based upon resolution and migration times however, it is concluded that
CX4-L-LEU is the best chiral selector to use as a buffer additive for the separation of
benzodiazepines in EKC.

106
References
1. Heiger, D. High Performance Capillary Electrophoresis—An Introduction; Agilent Technologies: United States, 2000.
2. de Boer, T., de Zeeuw, R. A., de Jong, G. J., Ensing, K. Electrophoresis,2000, 21, 3220. 3. Fanali, S. J. Chromatogr. A, 2000, 875, 89. 4. Tanaka, Y., Otsuka, K., Terabe, S. J. Chromatogr. A, 2000, 875, 323. 5. Kuhn, R. Electrophoresis 1999, 20, 2605. 6. Gray, A., Hsu, J. T. J. Chromatogr. A, 1998, 824, 119. 7. Stathakis, C., Arriaga, E. A., Dovichi, N. J. J. Chromatogr. A, 1998, 817, 233. 8. Gao, H., Carlson, J. Stalcup, A. M., Heineman, W. R. J. Chromatogr. Sci., 1998, 36,
146. 9. Bellini, M. S., Manetto, G., Deyl, Z., Tagliaro, F., Miksik, I. J. Chromatogr. B, 2000,
741, 67. 10. Baryla, N. E., Lucy, C. A. Anal. Chem. 2000, 72, 2280. 11. Ding, W., Fritz, J. S. J. Chromatogr. A, 1999, 831, 311. 12. Otsuka, K., Terabe, S. J. Chromatogr. A, 2000, 875, 163. 13. Shamsi, S. A., Palmer, C. P., Warner, I. M. Anal. Chem., 2001, 73, 140A. 14. Yarabe, H. H., Billiot, E., Warner, I.M. J. Chromatogr. A, 2000, 875, 179. 15. Kawaguchi, S. J. Chromatogr. A, 2000, 871, 415. 16. Wan, H., Blomberg, L. G. J. Chromatogr. A, 2000, 875, 43. 17. Yang, W. C., Yu, X. D., Yu, A. M., Chen, H. Y. J. Chromatogr. A, 2001, 910, 311. 18. Arce, L., Segura, Carretero, A., Rios, A., Cruces, C., Fernandez, A., Valcarcel, M. J.
Chromatogr. A, 1998, 816, 243. 19. Sun, S., Sepaniak, M. J., Wang, J., Gutsche, C. D., Anal. Chem., 1997, 69, 344. 20. Shohat, D., Grushka, E. Anal. Chem., 1994, 66, 747.

107
21. Gutsche, C. D. Calixarenes, Monographs in Supramolecular Chemistry; Stoddar, J. F., Ed; The Royal Society of Chemistry: Cambridge, 1989; Vol. 1.
22. Coruzzi, M., Andreetti, G. D., Bocchi, V., Pochini, A., Ungaro, R. J. Chem. Soc., Perkin
Trans 2, 1982, 1133. 23. Andreetti, G. D., Ungaro, R., Pochini, A. J. Chem. Soc., Chem. Commun., 1979, 1005. 24. Goldman, H., Vogt, W., Paulus, E., Bohmer, V. J. Am. Chem. Soc., 1988, 110, 6811. 25. McKervey, M. A., Seward, E. M., Ferguson, G., Ruhl, B., Harris, S. J. J. Chem. Soc.,
Chem. Commun., 1985, 388. 26. Chang, S. K., Kwon, S. K., Cho, I. Chem. Lett., 1987, 947. 27. Gutsche, C. D., Iqbal, M., Alam, I., J. Am. Chem. Soc., 1987, 109, 4314. 28. Bauer, L. J., Gutsche, C. D., J. Am. Chem. Soc., 1985, 107, 6063. 29. Shinkai, S., Koreishi, H., Ueda, K., Manabe, O., J. Chem. Soc., Chem. Commun., 1986,
233. 30. Shinkai, S., Koreishi, H., Ueda, K., Arimura, T., Manabe, O., J. Am. Chem. Soc., 1987,
109, 6371. 31. Sánchez-Peña, M., Zhang, Y., Thibodeaux, S., McLaughlin, M. L., Muñoz de la Peña, A.,
Warner, I. M., Tetrahedron Lett., 1996, 37, 5841. 32. Toda, F., Mori, K., Okada, J., Node, M., Itoh, A., Oomine, K., Fuji, K., Chem. Lett.,
1988, 131. 33. Sánchez-Peña, M., Zhang, Y., Warner, I. M., Anal. Chem., 1997, 69, 3239. 34. Billiot, E., Wang, J., Warner, I.M. J. Chromatogr. A 1997, 773, 321.

108
CHAPTER 4. SPECTROSCOPIC STUDIES OF CALIXARENE COMPLEXATION
Part I. Complexation Studies of N-L-Aminoacylcalix[4]arenes:
Addressing Inner-Filter Effects in Fluorescence 4.1. Introduction Calixarenes are a versatile class of materials, composed of substituted phenolic
units which are linked by methylene bridges to form a hydrophobic cavity. They are
known to form host-guest type inclusion complexes with a variety of molecules and are
employed in areas such as bioorganic chemistry,1 metal-ion complexation,2 and
catalysis.3 Hydrophobic effects are reported to be responsible for the inclusion
phenomenon, and are important in molecular recognition in water. Water-soluble
calixarenes facilitate the study of hydrophobic interactions (cation-π, π−π, and CH-π) by
enhancing the complexation of apolar guests in their cavity. In fact, it was shown that a
water molecule was hydrogen-bonded to the π cloud of the p-sulfonatocalixarenes. Most
biological processes take place in water. A water molecule was even shown to be
included in the cavity of p-sulfonatocalixarenes via hydrogen bonding to the π cloud of
the ring systems.4 This arrangement bears a resemblance to that of the hydrophobic
pocket of proteins. Therefore, water-soluble calixarenes show promise in the mimicry of
natural processes like molecular recognition.
The complexation of water-soluble calixarenes with different guests has been
discussed in Chapter 1. Guest size and hydrophobicity are key determinants in the
selectivity of the calixarene. Complexation properties of calixarenes have been evaluated
by microcalorimetry,5 induced circular dichroism,6 NMR,7 X-ray crystallography,8
109
electronic absorption and fluorescence spectroscopy.9 In this chapter, steady-state
fluorescence spectroscopy is employed to investigate the complexation of calixarenes.
The impetus behind this study stems from results obtained in early EKC
experiments using CX4-LEU and CX4-ILE as pseudostationary phases. The observed
difference in the elution orders of the atropisomers of BNA is suggestive that CX4-LEU
may bind more strongly to R-BNA than does CX4-ILE. A comparison of the association
constants of CX4-LEU:R-BNA and CX4-ILE:R-BNA complexes would be sufficient to
confirm this inference. In addition, determination of the stoichiometry of the complexes
could lead to a better understanding of their formation. In order to adequately correlate
EKC results with spectroscopic results, solution conditions in spectroscopy must closely
reflect those used in EKC.
Solution-state NMR spectroscopy would be best suited for this type of study.
From Chapter 2 of this dissertation, it was reported that the chemical shifts of the geminal
protons of the methylene bridges of the calixarene cavity occur in the region between 4.5
and 5.5 ppm with reference to TMS. These protons are most sensitive to inclusion
complexation. In an aqueous system, the broad resonance peak from water (~4.8 ppm)
masks the doublets of the calixarene, thereby obviating accurate determination of shifts
upon inclusion complexation. X-ray crystallography would also be quite definitive in the
determination of association constants and complex stoichiometry. However,
crystallization of amino acid-derivatized calix[4]arenes has been unsuccessful thus far.
Consequently, steady-state fluorescence will be employed to determine association
constants of CX4-LEU:R-BNA and CX4-ILE:R-BNA.
110
Fluorescence spectroscopy is a powerful analytical technique for the investigation
of complex formation. In a two species host-guest system, the changes in the
fluorescence signal are monitored as a function of host or guest concentration. If only
one of the species fluoresces, its fluorescence is monitored as a function of the other
species’ concentration. The absorption and fluorescence spectra of such a system are
illustrated in Figure 4.1a. If both species fluoresce, the wavelengths of excitation and
emission must be optimized in order to minimize signal overlap (Figure 4.1b). In both
cases, differences between the fluorescence signals of the free fluorophore and the
complexed fluorophore lead to the determination of complex stoichiometry and
association constants. In the most complicated two species host-guest system, both
species fluoresce in the same wavelength range (Figure 4.1c), thereby increasing the
difficulty of complex stoichiometry and association constant determination.
Spectra like those represented in Figure 4.1a are obtained in cyclodextrin
complexation studies because cyclodextrins are UV-transparent. Also, similar spectra
can be obtained in calixarene complexation studies provided the calixarene is the sole
fluorophore. Other fluorescence studies of calixarene complexation focus on guest
molecules that do not absorb and fluoresce in the same wavelength region as the
calixarene. Though powerful in this regard, it is limited to species whose excitation and
emission wavelength regions do not severely overlap. Otherwise, calixarene inner-filter
effects will adulterate the observed fluorescence signals. This brings up the most relevant
question in the current investigation. Can the true fluorescence spectrum of a complexed
guest be extracted from the overlapping spectrum of its host? In other words, what
information can be acquired from spectra similar to those represented in Figure 4.1c?

111
When the fluorescence signal of an analyte is altered due to interferences caused
by other sample constituents, this is called the inner-filter effect. In one form of the
inner-filter effect, the interferent absorbs in the same wavelength range as the analyte.
Figure 4.1. Absorption and Fluorescence Spectra of a Two Component Host-Guest System

112
This decreases the amount of radiation available to excite the analyte, thereby producing
a lower fluorescence quantum efficiency. Also, the quantum efficiency is decreased if
the interferent absorbs at the wavelength at which the analyte fluoresces. In this instance,
the number of emitted photons that reach the detector is decreased. High concentrations
of the fluorophore make self-absorption more likely as well. In this phenomenon, some
molecules of the fluorophore absorb the fluorescence. Another cause of inner-filter
effects is sample turbidity. In this case, molecules at the face of the sample holder
nearest to the incident radiation source absorb more radiation than those which are further
away.
Recall that the naphthyl moieties of R-BNA and the phenolic units of calixarenes
are strongly absorbing species in the UV region of the spectrum. The structures are
shown in Figure 4.2.
NH2NH2
(R)-(+)-1,1'-binaphthyl-2,2'-diamine(R)-BNA
O N
O O OH
O N
O O OH
4 4
N-L-leucinoacylcalix[4]arene N-L-isoleucinoacylcalix[4]arene(CX4-LEU) (CX4-ILE)
Figure 4.2 Structures of host calixarenes and guest (R)-BNA

113
Zhang and coworkers reported that the inner-filter effects caused by sulfonated
calixarenes are seriously disadvantageous for the study of their complexation with certain
fluorescent probes.10 Therefore, the photophysics of calixarenes must be considered in
these luminescence probe studies, as inner-filter effects could lead to errors in
spectroscopic measurements.10,11 In this chapter, I propose a simple model by which the
inner-filter effects of CX4-LEU and CX4-ILE may be studied and minimized in the
determination of association constants and complex stoichiometry.
4.2 Experimental Section
4.2.1 Chemicals
The synthesis of N-L-leucinoacylcalix[4]arene (CX4-LEU) and N-L-
isoleucinoacylcalix[4]arene (CX4-ILE) was performed as reported in Chapter 2. Stock
solutions of each were prepared at 1×10⁻³ M and 5×10⁻³ M in 100 mM
trishydroxyaminomethane (Tris) which was purchased from Aldrich Chemical Company
(Milwaukee, WI). The sample pH of 10 was determined by pH paper and left unadjusted.
Serial dilutions were made to produce duplicate solutions in borosilicate tubes of the
following concentrations (×10-4 M): 1, 1.5, 2.5, 3.5, 4.5, 5.5, 6.5, 7.5, 8.5, 9.5, 10, 15, 25,
35, 45, and 50. The guest compound (R)-(+)-1,1’-binaphthyl-2,2’-diamine (R-BNA)was
purchased from Aldrich Chemical Company (Milwaukee, WI) and used without further
purification. A dry quantity of R-BNA was dissolved in methanol to yield a stock
solution with a concentration of 1×10⁻³ M. Equal aliquots of the R-BNA stock solution
were added to one set of borosilicate tubes such that the final concentration of R-BNA
was 1×10⁻⁵ M in each calixarene solution. The second set of calixarene solutions did not
contain R-BNA and were used as blanks.

114
4.2.2 Apparatus
Steady-state fluorescence measurements were taken with a Jorbin-Yoba Fluorolog
(τ-3) spectrofluorometer equipped with a cell compartment and circulation inlets and
outlets for temperature control. The excitation and emission slit bandwidths were set at 5
nm. Fluorescence emission spectra were obtained at room temperature at an excitation
wavelength of 340 nm. Absorption spectra were acquired with a Shimadzu UV-3101PC
double beam scanning spectrophotometer equipped with a thermostat held at 20 °C.
Because the calixarene solutions contained 100 mM Tris, all absorbance measurements
were obtained using 100 mM Tris as a reference.
4.3 Results and Discussion
4.3.1 Absorption Spectra
The structural isomers CX4-LEU and CX4-ILE differ by an additional chiral
center on the monomer units of CX4-ILE. From the previous chapter, it was shown that
they both can be effective chiral selectors in EKC. However, a slightly different elution
order was obtained when the CX4-ILE buffer was employed. Also, their absorption
spectra differ slightly. Both contain two broad absorption bands at ~227 nm and ~280
nm, which correspond to the transitions from the ground state to the second and the first
excited electronic states, respectively. However, the second band has more fine structure
in CX4-LEU than in CX4-ILE. The molar absorptivities were determined from a
calibration plot in the linear range of absorbance versus calixarene concentration (Figure
4.3). The molar absorptivity at 340 nm is 214 L mol-1 cm-1 according to the plot. The
molar absorptivity of a CX4-ILE solution of equal concentration at 340 nm is 237 L mol-
1cm-1. Additional data are shown in the appendix.

115
y = 222.13x + 0.0076R2 = 0.9988
0.0
0.2
0.4
0.6
0.8
1.0
1.2
0.00E+00 1.00E-03 2.00E-03 3.00E-03 4.00E-03 5.00E-03
CX4-LEU concentration (M)
Abs
orba
nce
Figure 4.3 Calibration plot of CX4-LEU absorbance
Overlaid absorbance spectra of 1x10⁻⁵ M R-BNA, 1x10⁻⁵ M and 1x10⁻⁴ M CX4-LEU are
shown in Figure 4.4. The spectra severely overlap each other in a manner which is
similar to that in Figure 4.1c. Only in the region >330 nm is the intensity of the R-BNA
trace greater than that of CX4-LEU (at concentrations ≤ 6.5x10⁻⁴ M).
0
0.5
1
1.5
2
2.5
200 220 240 260 280 300 320 340 360 380 400
Wavelength (nm)
Abs
orba
nce
(AU
)
1x10⁻⁴ M CX4-LEU
1x10⁻⁵ M R-BNA
1x10⁻⁵ M CX4-LEU
Figure 4.4 Absorbance spectra of 1×10⁻⁵ M R-BNA, 1x10⁻⁵ M CX4-LEU, and 1x10⁻⁴ M CX4-LEU

116
4.3.2 Fluorescence Studies
4.3.2.1 Single Cuvette Experiments
The mole ratio method was applied in the determination of association constants.
The concentration of R-BNA was held constant (1×10⁻⁵ M), while the concentration of
the calixarene was increased from 1×10⁻⁴ M to 5×10⁻³ M. In order to obtain association
constants, corrections must be made for the emission and absorption of the calixarene, the
contributor of inner-filter effects. Because calixarene emits photons in the same
wavelength region as R-BNA, the calixarene emission must be subtracted from the R-
BNA in calixarene (labeled instrument in plots) emission as illustrated in Figure 4.5.
0
20000
40000
60000
80000
100000
120000
350 400 450 500 550 600
Wavelength (nm)
Inte
nsity Instrument
BlankR-BNA
Figure 4.5 Emission spectrum of 10-5 M R-BNA in 3.5x10⁻⁴ M CX4-LEU; correction for CX4-LEU emission achieved by subtraction of blank emission from instrument emission
All the fluorescence emission spectra produced when corresponding blanks were
subtracted from each spectrum to eliminate the influence of the CX4-LEU emission are
shown in Figure 4.6. By subtracting the calixarene (blank) spectra from the instrument

117
(R-BNA in CX4-LEU solutions) spectra, the resulting R-BNA spectra represent
fluorescence of both free and complexed R-BNA. However, association constants cannot
be calculated at this point because a correction for the amount of photons which the
calixarene absorbed during the excitation and emission events of R-BNA has not been
made. For this reason, the intensity of R-BNA must be multiplied by a suitable
correction factor. Recall the following Beer-Lambert relationships from Chapter 1:
CxIIA ε== 0log ; Cx
II ε100 = ; CxII ε−∗= 100 ; (4.1)
where A is absorbance of CX4-LEU at 340 nm; I0 and I are the intensities of R-BNA in
the absence and presence of CX4-LEU, respectively; ε is the molar absorptivity of the
calixarene at 340 nm; and Cx is the concentration of CX4-LEU. The intensity (I) of R-
BNA is constant and is proportional to I0. Therefore, its intensity as a function of CX4-
LEU concentration is constant theoretically, assuming there is no interaction between R-
BNA and CX4-LEU.
0
20000
40000
60000
80000
100000
120000
140000
160000
350 400 450 500 550 600
Wavelength (nm)
Inte
nsity
011.52.53.54.55.56.57.58.59.5101525354550
Figure 4.6 Emission spectra of R-BNA in increasing concentrations (x10-4 M) of CX4-LEU; spectra corrected for background emission of CX4-LEU
118
However, the observed emission intensity sharply increased to a point and
gradually decreased afterwards, indicating either complexation of R-BNA with CX4-LEU
or concomitant absorption and emission of photons by CX4-LEU. In the second case, the
CX4-LEU is sharing the photons with R-BNA, thereby attenuating the incident radiation.
Therefore, a decrease in the emission intensity of R-BNA is observed as the concentration
of CX4-LEU increases. To correct for this absorption, and assuming linear dependence,
the intensity of R-BNA was multiplied by the intensity of the calixarene at 340 nm as
indicated:
CxBNABNA II ε10' ∗= . (4.2)
My interest is to keep the model as simple as possible. Therefore, the corrections
are limited to linear approximation. Fluorescence intensities in the linear concentration
range are shown in Figure 4.7. The impact of the absorption of CX4-LEU during the R-
BNA emission event is indicated by the consistently higher intensities of species with
absorbance correction compared to those without. At concentrations above 1×10⁻³ M
CX4-LEU, the R-BNA fluorescence intensities appear to increase exponentially when
corrected for calixarene absorbance. This is in agreement with raw data, which indicate
that the presence of increasing concentrations of CX4-LEU causes an increase in the
fluorescence measured. Logically, most of this fluorescence is attributed to the greater
excess of CX4-LEU compared to R-BNA. Conversely, without absorbance correction, R-
BNA fluorescence intensities decreased at CX4-LEU concentrations above 3.5x10⁻³ M.
This indicates that CX4-LEU is concentrated to the extent that self-absorption is
attenuating not only the radiation available to R-BNA, but also the R-BNA fluorescence
that is detected. It is interesting to note that R-BNA fluorescence increased linearly over

119
the entire concentration range studied when corrected for CX4-LEU absorption. Without
this absorption correction, R-BNA fluorescence gradually decreased above a CX4-LEU
concentration of 1.5x10⁻³ M. Again this indicates that above this concentration, CX4-
LEU not only absorbs radiation from the source, but also re-absorbs photons emitted as
fluorescence by R-BNA. Consequently, the number of photons reaching the detector as
fluorescence decreases.
y = 2E+08x + 35978R2 = 0.9897
y = 8E+07x + 49997R2 = 0.9924
0
50000
100000
150000
200000
250000
300000
350000
0.00E+00 2.50E-04 5.00E-04 7.50E-04 1.00E-03 1.25E-03 1.50E-03
CX4-LEU Conc. (M)
Inte
nsity
with abs corrwithout abs corr
Figure 4.7 Emission intensity of R-BNA with and without absorbance correction
At this point an association constant can be calculated using Scott’s
modification12 of the Benesi-Hildebrand equation for 1:1 stoichiometry:13
[ ] [ ] ( )[ ] [ ] 110
10
10 ''' −−−− ∗−+−=− CxIIKIIII mBNAamBNABNA (4.3)
where Ka is the association constant and I’mBNA is the fluorescence intensity when all R-
BNA is complexed with CX4-LEU. Because the above equation is a linear relationship,
Ka can be calculated by dividing the y-intercept ( [ ] 10' −−II mBNA ) by the slope

120
( ( )[ ] 10' −−IIK mBNAa ). Also, the fluorescence intensity of completely complexed R-BNA
can be calculated by adding the inverse of the y-intercept to I0. By doing so, Ka
approaches zero. In a simple system, Ka ≤ 0 indicates that there is either extremely weak
or no complexation occurring (Figure 4.8).
y = 1E-08x - 5E-06R2 = 0.9933
00.000010.000020.000030.000040.000050.000060.000070.000080.000090.0001
0.00E+00 2.00E+03 4.00E+03 6.00E+03 8.00E+03 1.00E+04
(CX4-LEU Concentration)-1
(Cor
rect
ed In
tens
ity)-1
Figure 4.8 Double reciprocal plot of intensity of R-BNA as a function of CX4-LEU concentration, assuming 1:1 stoichiometry; association constant is negative.
In order to assume a 2:1 calixarene:BNA stoichiometry, [Cx]-1 was squared plotted
against [I’BNA-I0]-1 (Figure 4.9). The resulting value of Ka was 8.0x10⁶ M-1.
y = 1E-12x + 8E-06R2 = 0.989
00.000010.000020.000030.000040.000050.000060.000070.000080.00009
0.0001
0.00E+00 2.00E+07 4.00E+07 6.00E+07 8.00E+07 1.00E+08
(CX4-LEU Conc.)-2
(Cor
rect
ed In
tens
ity)-1
Figure 4.9 Double reciprocal plot of fluorescence intensity of R-BNA as a function of CX4-LEU concentration assuming 2:1 stoichiometry.

121
The curvature of the plots in Figures 4.8 and 4.9 indicate that the stoichiometry of any
CX4-LEU:R-BNA association is mainly 1:1 even though the intercept of the plot in
Figure 4.8 is negative.
The value of Ka when CX4-ILE was the host compound was determined using the
aforementioned procedures. Similarly, values determined from a double reciprocal plot
assuming 1:1 CX4-ILE:R-BNA stoichiometry over a linear concentration range were
negative. When a 2:1 CX4-ILE:R-BNA stoichiometry was assumed, a line fit was
achieved throughout the entire concentration range. The resulting Ka value was 1.5x10⁶
M-1 which is indicative of strong association. Supplemental data are shown in the
appendix.
4.3.2.2 Tandem Cuvette Experiments
Because the absorption regions of CX4-LEU and CX4-ILE overlap that of R-
BNA, inner-filter effects contributed by the calixarenes must be taken into consideration.
The wavelength of maximum absorbance of a 1x10⁻⁵ M R-BNA solution is 240 nm, and
its corresponding molar absorptivity is 121430 L mol-1 cm-1. However, the molar
absorptivities of 1x10⁻⁴ M solutions of CX4-LEU and CX4-ILE at this wavelength are
12697 and 12121 L mol-1 cm-1, respectively, at pH 10. At 340 nm the highest molar
absorptivities of solutions of CX4-LEU and CX4-ILE are 257 and 289 L mol-1 cm-1,
respectively, compared to a molar absorptivity of 7140 L mol-1 cm-1 for R-BNA.
Inner-filter effects can be produced when fluorophores closer to the front face of
the cuvette (and the excitation source) decrease the number of photons which are
available to excite fluorophores located further away from the source. In some cases,
changing the orientation or shape of the sample holder minimizes inner-filter effects.

122
Because the current study employs two fluorescing species, a simple theoretical model
has been proposed which will establish the extent of absorption and emission of the
individual species.
Measuring fluorescence using a tandem cuvette in a conventional fluorimeter
allows one to monitor the emission of two solutions without mixing them (Figure 4.10).
Information about emitting species as a function of their proximity to the excitation
source could lead to the identification of the sources of photon absorption (and emission)
in a mixture of fluorophores. As indicated below, when two solutions containing
individual fluorophores with overlapping emission spectra are excited, the fluorophore in
the solution nearer to the excitation source will absorb and emit more photons.
Therefore, its relative fluorescence intensity will be higher in the spectrum. This could
help to further explain increases in intensity accompanied by shifts in wavelength as
functions of individual fluorophore concentrations. Ultimately, these measurements
could be used to confirm the legitimacy of single cuvette data.
Figure 4.10 Orientations of tandem cuvette in conventional fluorimeter

123
Solutions of R-BNA, R-BNA in increasing concentrations of CX4-LEU, and
CX4-LEU were analyzed in both orientations. Fluorescence spectra of increasing
concentrations of CX4-LEU on both sides of the cuvette were obtained and used as
blanks. The cuvette held a solution of R-BNA in one side and a solution of R-BNA in
increasing concentrations of CX4-LEU in the other. The concentration of R-BNA was
held at 1x10⁻⁵ M, while that of CX4-LEU increased from 0 to 5x10⁻³ M. When one side
was filled with R-BNA and the other was filled with R-BNA in increasing concentrations
of CX4-LEU, the fluorescence intensity not only changed as a function of CX4-LEU
concentration, but also as a function of solution position (Figure 4.11). Plot B represents
R-BNA in CX4-LEU oriented closer to the excitation source, whereas curve A represents
R-BNA in CX4-LEU further from the excitation source.
0100002000030000400005000060000700008000090000
100000
0 10 20 30 40 50
CX4-LEU concentration (x10-4 M)
Inte
nsity A
B
Figure 4.11 Effect of CX4-LEU concentration and cuvette position on fluorescence intensity. Tandem cuvette contains 1x10⁻⁵ M R-BNA and R-BNA in increasing concentrations of CX4-LEU. Plot A (-♦-): 1x10⁻⁵ M R-BNA closer to the excitation source; and Plot B (--): R-BNA in CX4-LEU closer to the excitation source.

124
The lower intensity of Plot A can be attributed to R-BNA in CX4-LEU re-absorption of
R-BNA fluorescence, because the R-BNA concentration remains constant whether it is
free or mixed in CX4-LEU solutions. In Plot B, the main absorbing and emitting species
(R-BNA in CX4-LEU) are closer to the excitation source. Therefore, re-absorption of R-
BNA in CX4-LEU fluorescence by R-BNA is less pronounced in Plot B. The magnitude
of the increase in Plot B is mainly due to the increase in CX4-LEU concentration and is
reminiscent of the plots obtained in single cuvette experiments. Also, fluorescence from
an R-BNA:CX4-LEU association may contribute to the increase in intensity. In Plot A
the fluorescence intensity is lower because the photons which R-BNA emits are re-
absorbed by the two components of the second solution. In Plot B, the intensity increases
more dramatically because the concentration of absorbing species closer to the excitation
source increases by approximately one order of magnitude. The gradual decrease in
intensity at high concentrations of CX4-LEU is indicative of the inner-filter effect
regardless of complex formation.
When CX4-LEU solutions containing R-BNA are oriented closer to the excitation
source than free R-BNA solutions more intense fluorescence results. This means that the
two species closer to the source are the major participants in the absorption and
fluorescence events. The fluorophores in the solution of free R-BNA are present in a
much lower concentration. Therefore, their relative contribution to the overall
fluorescence is small. If they are re-absorbing the fluorescence of the species nearer to
the excitation source, it is to a smaller extent than if the reverse orientation were used.
The spectra obtained in one orientation are illustrated in Figure 4.12, wherein R-BNA is
closer to the excitation source than the CX4-LEU solutions containing R-BNA. The
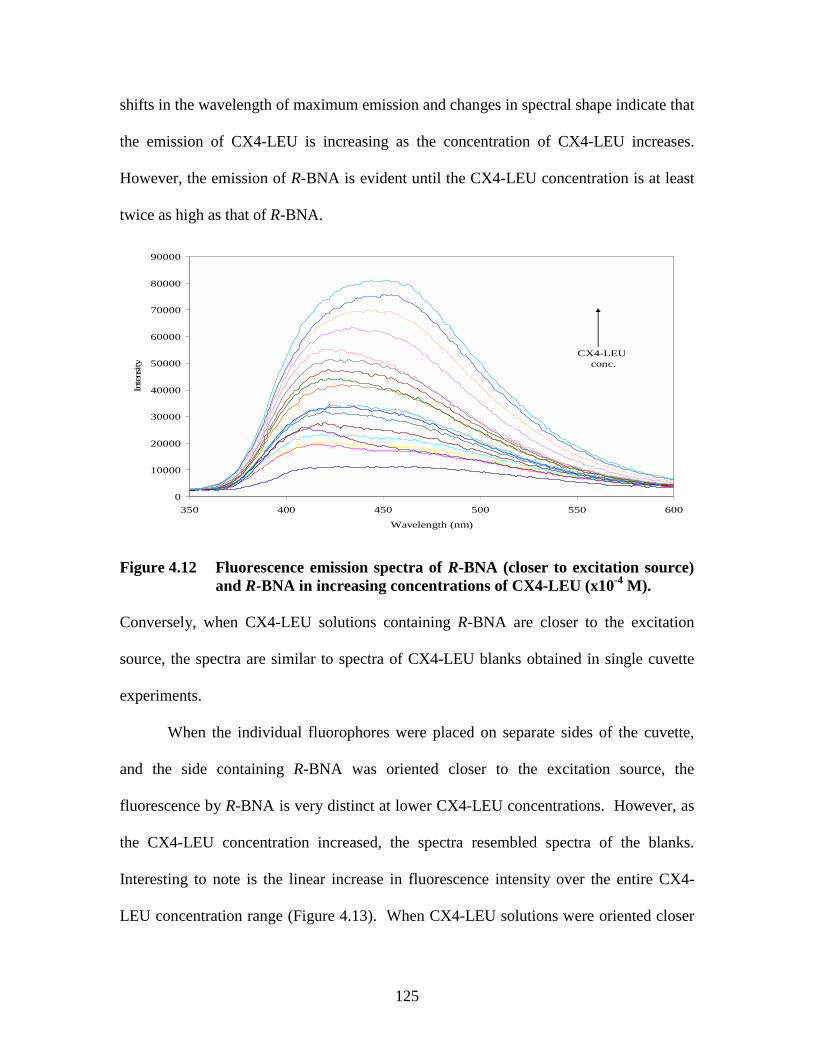
125
shifts in the wavelength of maximum emission and changes in spectral shape indicate that
the emission of CX4-LEU is increasing as the concentration of CX4-LEU increases.
However, the emission of R-BNA is evident until the CX4-LEU concentration is at least
twice as high as that of R-BNA.
0
10000
20000
30000
40000
50000
60000
70000
80000
90000
350 400 450 500 550 600
Wavelength (nm)
Inte
nsity
CX4-LEU conc.
Figure 4.12 Fluorescence emission spectra of R-BNA (closer to excitation source) and R-BNA in increasing concentrations of CX4-LEU (x10-4 M).
Conversely, when CX4-LEU solutions containing R-BNA are closer to the excitation
source, the spectra are similar to spectra of CX4-LEU blanks obtained in single cuvette
experiments.
When the individual fluorophores were placed on separate sides of the cuvette,
and the side containing R-BNA was oriented closer to the excitation source, the
fluorescence by R-BNA is very distinct at lower CX4-LEU concentrations. However, as
the CX4-LEU concentration increased, the spectra resembled spectra of the blanks.
Interesting to note is the linear increase in fluorescence intensity over the entire CX4-
LEU concentration range (Figure 4.13). When CX4-LEU solutions were oriented closer
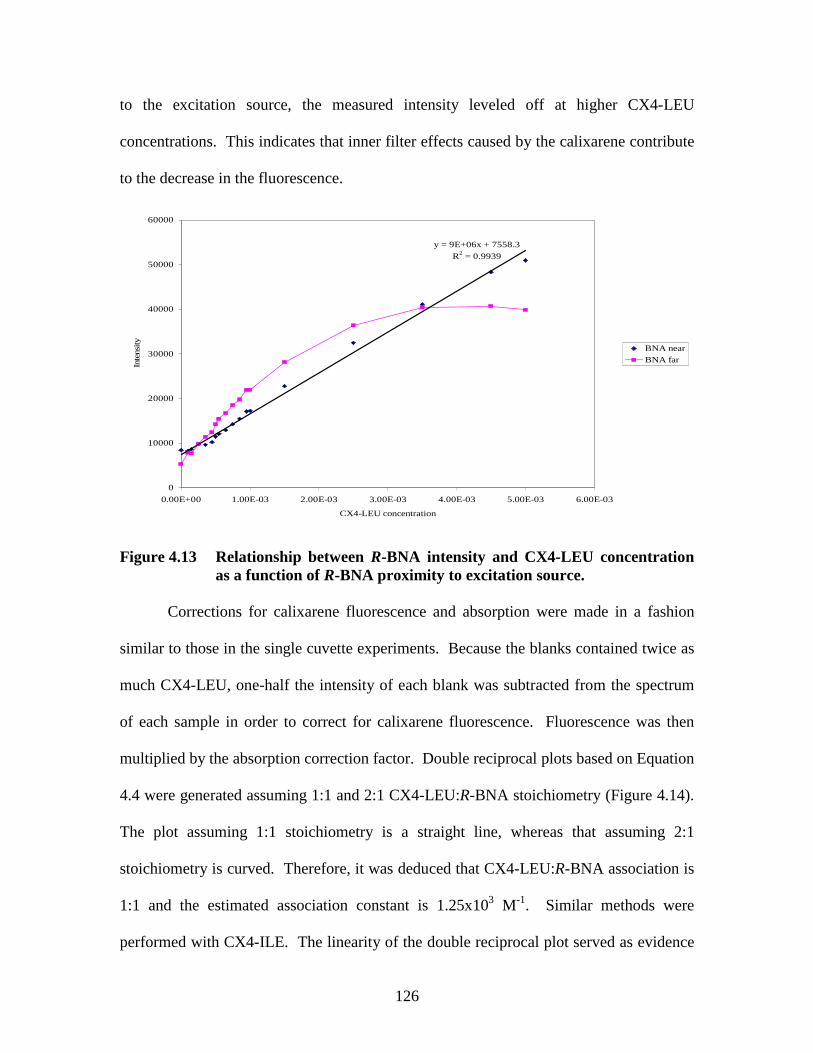
126
to the excitation source, the measured intensity leveled off at higher CX4-LEU
concentrations. This indicates that inner filter effects caused by the calixarene contribute
to the decrease in the fluorescence.
y = 9E+06x + 7558.3R2 = 0.9939
0
10000
20000
30000
40000
50000
60000
0.00E+00 1.00E-03 2.00E-03 3.00E-03 4.00E-03 5.00E-03 6.00E-03
CX4-LEU concentration
Inte
nsity BNA near
BNA far
Figure 4.13 Relationship between R-BNA intensity and CX4-LEU concentration as a function of R-BNA proximity to excitation source.
Corrections for calixarene fluorescence and absorption were made in a fashion
similar to those in the single cuvette experiments. Because the blanks contained twice as
much CX4-LEU, one-half the intensity of each blank was subtracted from the spectrum
of each sample in order to correct for calixarene fluorescence. Fluorescence was then
multiplied by the absorption correction factor. Double reciprocal plots based on Equation
4.4 were generated assuming 1:1 and 2:1 CX4-LEU:R-BNA stoichiometry (Figure 4.14).
The plot assuming 1:1 stoichiometry is a straight line, whereas that assuming 2:1
stoichiometry is curved. Therefore, it was deduced that CX4-LEU:R-BNA association is
1:1 and the estimated association constant is 1.25x10³ M-1. Similar methods were
performed with CX4-ILE. The linearity of the double reciprocal plot served as evidence

127
of a 1:1 CX4-ILE:R-BNA association. Also, the association constant was estimated to be
100 M-1.
0.00E+00
2.00E-03
4.00E-03
6.00E-03
8.00E-03
0.00E+00 2.00E+04 4.00E+04 6.00E+04 8.00E+04 1.00E+05
(CX4-LEU Concentration)-1
(Flu
ores
cenc
e)-1
A.
0.00E+00
2.00E-03
4.00E-03
6.00E-03
8.00E-03
0.00E+00 2.00E+09 4.00E+09 6.00E+09 8.00E+09 1.00E+10
(CX4-LEU Concentration)-2
(Flu
ores
cenc
e)-1
B.
Figure 4.14 Double reciprocal plots assuming A) 1:1; and B) 2:1 stoichiometry between CX4-LEU and R-BNA
Typically, the concentration of the host should be at least twenty times higher than that of
the guest in order for Ka values to be trustworthy. In light of the fact that the system
being studied is more complex, Ka values should be validated by a comparable method

128
such as NMR or X-ray crystallography. However, the data in this chapter qualitatively
support the original hypothesis concerning the interactions of CX4-LEU and CX4-ILE
with R-BNA.
4.4 Summary
Steady-state fluorescence spectroscopy has been employed to determine the
stoichiometries and association constants of the possible complexes of CX4-LEU and
CX4-ILE with R-BNA. The concomitant absorption and emission of the two species
makes direct determination of the aforementioned parameters a formidable task.
Therefore, corrections for calixarene absorption and emission must be made to account
for the impact of inner-filter effects on the observed fluorescence intensity of R-BNA
complexed with CX4-LEU and CX4-ILE. Linearity of Benesi-Hildebrand plots
suggested that there was 1:1 association between CX4-LEU and R-BNA. However,
estimated association constants in single cuvette experiments were indicative of
extremely weak or no association. The convex curvature of Benesi-Hildebrand plots
generated from single cuvette data suggested that there was a 2:1 (or higher) association
between CX4-ILE and R-BNA. Tandem cuvette experiments were carried out to provide
a theoretical model by which to compare results. Linearity of Benesi-Hildebrand plots
not only suggested that there was 1:1 association between CX4-LEU and R-BNA, but
also suggested the estimated association constant to be 1.25x10³ M-1. In addition, the
stoichiometry of the CX4-ILE:R-BNA complex is assumed to be 1:1, with an estimated
association constant of 100 M-1. Although further method validation is needed, the
theoretical model is suitable for qualitative support of EKC data.

129
Part II. Spectroscopic Investigation of Sulfonated Calixarenes in the Presence of Metals
4.5 Introduction
Atherosclerosis is a major cause of death in heart patients. It is a disease in which
the arteries are hardened and narrowed as a result of plaque that has built up along the
inside of the artery walls. The mechanism of formation of plaque is not well understood.
However, it is believed that plaque develops in stages, from soft to hard. The earliest
form of plaque is the fatty streak. This soft plaque mainly consists of cholesterol and
other lipids. Calcified plaque (the hard plaque) forms later and mainly consists of
calcium and phosphorus.14 Other minerals are also contained in plaque, but to a much
lesser extent than calcium.
Minerals play a vital role in the proper function of cardiovascular systems. For
example, sodium, magnesium, potassium, and calcium play an important role in proper
muscle function. However, low levels of certain minerals have been associated with
some forms of heart disease.15 Copper and zinc have been implicated in the degeneration
of arterial smooth muscle, coronary aneurysm formation, and increased blood cholesterol
levels.16,17 Likewise, lead and aluminum have been linked to hypertension. Aluminum
interferes with calcium and magnesium metabolism and strongly binds to phosphate and
oxygenated groups.18,19 Aluminum can also bind to phospholipids thereby altering cell
membrane integrity. Lead is known to have a high affinity for sulfhydryl groups and can
interfere with membrane function. Other minerals may not have a biological function,
but may still be toxic to the body.
There is little information on the relative composition of minerals in different
types of plaque. It is important to determine the mineral composition of different plaque

130
formations to afford better understanding of the possible mechanism of formation of
these plaques. Warner and coworkers determined the metal concentrations in calcified
and soft plaque using inductively coupled plasma spectrometry (ICP) in an effort to
understand the factors that influence metal deposition in plaque, and to understand the
possible role of metals in plaque formation.20 Eleven of the fifteen minerals detected in
the plaques were metals. Concentrations of these metals are shown in Table 4.1. Clearly,
calcium is a major component of hard plaque. Consequently, it is useful to determine the
different forms of calcium present in each sample. To do so would require either an
extraction or a separation technique that would isolate calcium from the other metals that
are present in a plaque sample.
Table 4.1. Mean concentration of metals in soft and hard plaque (mg/g)
Metal Soft Hard
Na 2.72 3.54
Mg 1.01 1.36
Al 0.06 0.004
K 1.50 0.97
Ca 2.49 94.45
Cr 0.002 0.003
Fe 0.25 0.04
Cu 0.004 0.04
Zn 0.41 0.44
Ba 0.007 0.003
Pb 0.03 0.05
As indicated in Chapter 1 of this dissertation, calixarenes with cation-complexing
groups attached are known to complex metals quite well. In fact, extraction studies have

131
shown that esters of calix[4]arenes were selective for sodium compared to other Group
1A and 2A metal ions, whereas calix[6]arene derivatives were selective for cesium and
other radioactive ions.21 Some even proved to be excellent ionophores for sodium in
liquid membrane and polyvinyl chloride membrane electrodes.22 Electrodes based upon
calix[4]arene esters were reported to be capable of measuring sodium in blood,23 and are
now used in commercial blood electrolyte analyzers. By changing the nature of the
cation-complexing groups, the selectivity of the electrode changed from sodium to
silver.24 Other calixarene-based ion-selective electrodes have been fabricated with high
selectivities for potassium, lithium, lead, and mercury.25, 26
The metal ion of primary relevance to this study is calcium. Calixarene
derivatives have also been used in sensors for calcium.27,28 More recently, they have been
used as selectivity modifiers in capillary electrophoresis (CE) separations using indirect
photometric detection.29 The overall goal of this study was to develop a CE method to
selectively separate calcium from the other metals present in aqueous acidic extracts of
plaque. To do so, p-sulfonated calix[4]arene and pentoxyl sulfonated calix[6]arene
would be employed as metal-complexing agents in CE. However, the effect of metals on
the ultraviolet absorbance of calixarenes must be investigated beforehand.
4.6 Experimental
Metal ion solutions (Na+, K+, Ca2+, Mg2+, Fe2+, Cu2+, Zn2+, Mn2+, and Ni2+) were
prepared by dissolution of dry metal chlorides or sulfates in deionized water to yield
stock solutions of 0.01 M. They were then diluted to yield solutions ranging in
concentration from 6.875x10⁻⁷ to 2.8x10⁻³ M. Because of their strong UV absorption, p-
sulfonated calix[4]arene (SCX4) and pentoxyl p-sulfonated calix[6]arene (SCX6) were

132
dissolved in water and diluted to final concentrations of 1.47x10⁻⁵ M and 1.67x10⁻⁵ M.
All samples were sonicated before use. Ultraviolet absorbance spectra were obtained
using a Shimadzu ultraviolet-visible-near infrared double-beam spectrophotometer
controlled by UV3101-PC software. The instrument was equipped with a cooling
chamber which held the sample holder region at 20 °C during the acquisition of spectra.
Two quartz cuvettes (1 cm path length) were soaked in concentrated nitric acid and rinsed
with copious amounts of deionized distilled water before use. The slit widths were set at
2 nm. The acquisition step size was 0.2 nm.
4.7 Results and Discussion
The absorbance spectra of SCX4 in the presence and absence of Ca2+ are shown
in Figure 4.15. The absorbance of SCX4 increased until the concentration of Ca2+
surpassed it, after which a slight decrease was observed. Conversely, when SCX6 was
used in place of SCX4, the maximum absorbance observed at equimolar concentrations
of SCX6 and Ca2+ decreased. In each case, the wavelength of maximum absorbance was
207 nm. Of the Group 1A metals, more significant increases were observed with K+
compared to Na+. There was no significant difference between the absorbance spectra of
SCX4 when the Group 2A metals Ca2+ and Mg2+ were employed. Of the transition
metals, the observed absorbance of SCX4 increased most with Cu2+, while those
observed with Mn2+, Fe2+, Ni2+ and Zn2+ increased only slightly. These spectra are
included in the appendix at the end of this dissertation. Because significant decreases in
the absorbance of SCX4 were not observed at the various concentrations of the metals, it
was decided that SCX4 would not be an appropriate complexing agent for use in CE.

133
0.0
0.5
1.0
1.5
2.0
190 240 290 340
Wavelength (nm)
Abs
orba
nce
SCX4:Ca2+SCX4
0
0.5
1
1.5
2
2.5
1.00E-07 1.00E-06 1.00E-05 1.00E-04 1.00E-03 1.00E-02
Ca2+ concentration (M)
Abs
orba
nce
Figure 4.15 A) Ultraviolet absorbance spectra of 1.47x10⁻⁵ M SCX4 in the presence and absence of 3.33x10⁻³ M Ca2+; B) Change in absorbance of lambda max as a function of Ca2+ concentration.
References
1. Sansone, F., Segura, M., Ungaro, R. In Calixarenes 2001, Asfari, Z., Böhmer, V., Harrowfield, J., Vicens, J. Saadioui, M., Eds., Kluwer Academic Publishers: Boston, 2001, 496.
2. Busch, D.H. Chem. Rev. 1993, 93, 847. 3. Wieser, C., Dieleman, C.B., Matt, D. Coord. Chem. Rev. 1997, 165, 93.

134
4. Atwood, J.L., Hamada, F., Robinson, K.D., Orr, G.W., Vincent, R.L. Nature 1991, 349, 683.
5. Douteau-Guével, N., Coleman, A.W., Morel, J.-P., Morel-Desrosiers, N. J. Chem.
Soc., Perkin Trans. 2, 1999, 629. 6. Nishida, M., Ishii, D., Yoshida, I., Shinkai, S. Bull. Chem. Soc. Jpn., 1997, 70,
2131. 7. Schneider, H.J., Güttes, D., Schneider, U. Angew. Chem., Int. Ed. Engl. 1986, 25,
647. 8. Atwood, J.L., Barbour, L.J., Junk, P.C., Orr, G.W. Supramol. Chem. 1995, 5, 105. 9. Zhang, Y., Agbaria, R.A., Warner, I.M. Supramol. Chem. 1997, 8, 309. 10. Zhang, Y., Agbaria, R.A., Mukundan, N.E., Warner, I.M. J. Incl. Phen. Mol.
Recog. Chem. 1996, 24, 353. 11. Shinkai, S., Mori,S., Koreishi, H., Tsubaki, T., Manabe, O. J. Am. Chem. Soc.
1986, 108, 2409. 12. Scott, R.L. Rec. Trav. Chim. 1956, 75,787 13. Benesi, H.A., Hildebrand, J.H. J. Am. Chem. Soc. 1949, 71, 2703. 14. Iribarren, C., Sidney, S., Sternfeld, B., Browner, S.W., JAMA, 2000; 283(21):
2810-2815. 15. Murungi, J.I.; Robinson, J.W. J. Environ. Sci. Health. 1992; A27(6): 1477-1494. 16. Klevay, L. M. in Clinical Nutrition of Essential Trace Elements and Minerals:
The Guide for Health Professionals, 2000; (Bogden, J.D. and Klevy, L.M, Eds.). The Humana Press Inc., Totwa ,N.J.
17. Klevay, L. M. Adv. Exp. Med. Biol., 1990; (a)258:197-208. 18. Gabriel, W.K., Yip, Pearl, P.Y., Ho, K., Kam ,S.W, and John,E.S., Am. J. Cardio.,
1999; 84:563-567. 19. Kiss, T., Sovago, I., Martin, R.B. Inorg. Chem. 1991, 30, 2130. 20. Murungi, J. I., Thiam, S., Collins, S.N., Kabagambe, E., Robinson, J.W., Warner,
I.M. personal communication. 21. McKervey, M.A., Seward, E.M., Ferguson, G., Ruhl, B., Harris, S.J. J. Chem.
Soc., Chem. Commun. 1985, 388.

135
22. Diamond, D., Svehla, G., Seward, E., McKervey, M.A. Anal. Chim. Acta 1988,
204, 223. 23. Forster, R., Diamond, D. Anal. Chem. 1992, 64, 1721. 24. O’Connor, K., Svehla, G., Harris, S.J., McKervey, M.A. Talanta 1992, 39, 325. 25. Yamamoto, H., Shinkai, S. Chem. Lett. 1994, 6, 1115. 26. Cadogan, F., Kane, P., McKervey, M.A., Diamond, D. Anal. Chem. 1999, 71,
5544. 27. Kubo, Y., Hamguchi, S., Niimi, A., Yoshida, K., Tokita, S. J. Chem. Soc. Chem.
Commun. 1993, 305, 229. 28. McKittrick, T., Diamond, D., Marrs, D.J., O’Hagan, P., McKervey, M.A. Talanta
1996, 43, 1145. 29. Arce, L., Segura Carretero, A., Ríos, A., Cruces, C., Fernández, A., Valcárcel, M.
J. Chromatogr. A 1998, 816, 243.

136
CHAPTER 5. SUMMARY AND FUTURE DIRECTIONS
The synthesis, characterization, and application of novel amino acid-derivatized
calix[4]arenes in spectroscopy and EKC has been presented in this dissertation. The
overall objective of calixarene chemistry is to explore and exercise the full potential of
these molecules in a myriad of applications. Because the common forms of calixarenes
are not chiral or water-soluble, study of their utility in biological systems and aqueous
media is limited. A standing goal in the Warner research laboratory is to develop more
universal chiral selectors for aqueous chromatographic separations. To this end,
cyclodextrins, polymeric surfactants, dendrimers, and calixarenes have been
functionalized to modify their selectivity for analytes.
The synthesis of N-L-aminoacylcalix[4]arenes was described in Chapter 2.
Calix[4]arenes bearing L-alanine, L-valine, L-leucine, and L-isoleucine moieties as lower
rim functionalities have been synthesized via the formation of a peptide bond. One- and
two-dimensional NMR techniques were employed to confirm the synthesis of the
calix[4]arenes and to determine their conformations. The existence of the tetrasubstituted
calix[4]arenes in the cone conformation was evidenced by characteristic splitting patterns
in the NMR spectra. Water-solubility in the calix[4]arenes came about by ionization of
the carboxylic acids of the amino acids, yielding an anionic calix[4]arene. Because the
inherent nature of the aliphatic amino acids is hydrophobic, water-solubility is limited to
pH values ≥ 7. Future studies could focus on extending the pH range of water-solubility.
For instance, replacement of the calixaryl t-butyl groups with more hydrophilic groups
like sulfonates, polyethoxy alcohols, and quaternary amines would extend the pH range
below 7, and would allow for calixarene dissolution in a larger variety of inorganic

137
solvents such as those commonly used in aqueous CE. Another alternative would be to
link an NH2-protected amino acid to the calixarene through the carboxyl terminus of the
amino acid, resulting in a cationic calixarene which would be water-soluble at pH values
less than 7.
The second part of Chapter 2 describes the synthesis and characterization of
calixarene-bonded silica stationary phases for use in capillary electrochromatographic
applications. Techniques such as IR, solid-state 13C NMR and elemental analysis were
employed to characterize modified and unmodified batches of silica. Although the
presence of a strong silicon-oxygen stretch limits the utility of IR for product
characterization, it is effective for the characterization of reactants. Downfield shifts of
the aminopropyl carbons in the solid-state 13C NMR spectra of the samples suggest that
there have been changes in their local environments. This leads me to believe that I have
successfully attached CX4-VAL to APS. However, further characterization is pertinent
in order to adequately explain the lack of a shift in the carbonyl signal. The results of
elemental analysis reveal an increase in the percentages of carbon, hydrogen, and
nitrogen on APS after synthesis. However, bulk averaging by elemental analysis most
likely poses severe limitations on the determination of the actual surface coverage of
APS.
Future studies could focus on incorporating a surface-sensitive technique such as
X-ray photoelectron spectroscopy as a means by which to correct for the presence of
organic contaminants on silica beads while allowing for the calculation of the degree of
coverage as a function of elemental signal intensity. Also, improvements could be made
to the synthetic techniques in order to increase sample loading. In the meantime,

138
investigations of the effectiveness of CVAPS and other chiral stationary phases in
capillary electrochromatography are currently underway. Such ambitious method
development will extend the utility of our chromatographic techniques because they will
better lend themselves to online coupling with other characterization and fractionation
techniques.
In Chapter 3 I described the application of four novel amino acid-derivatized
calixarenes in EKC. Drawing from previous separations using calixarene-modified EKC,
I have separated atropisomeric binaphthyl derivatives in a single run using urea as an
organic modifier in the run buffer. Separation of the binaphthyl derivatives in a single
run produced a slightly different elution order when the buffer containing the isoleucine-
derivatized calixarene was used. In addition to the binaphthyl derivatives, the calixarenes
were effective chiral selectors for a group of neutral benzodiazepines. By varying
experimental parameters such as pH and chiral selector concentration, enantiomers of
lorazepam, oxazepam, and temazepam were baseline resolved. Additional
electropherograms highlighting the separation of Troger’s base and cationic
norlaudanosoline are included in the appendix. Because the calixarenes absorb strongly
in the UV region, their utility is limited when a UV or laser-induced fluorescence
detector is employed. Future EKC work should incorporate another detection method in
order to extend the effectiveness of the chiral selectors. Also, EKC investigations of
“real” samples would be an ambitious undertaking since calixarenes are currently being
used as ionophores in commercial blood analyzers.
In Chapter 4, the complexation of R-BNA with CX4-LEU and CX4-ILE using
steady-state fluorescence spectroscopy was discussed. It was reported previously that

139
sulfonated calix[6]arene would not be suitable as a host molecule because it produces
inner-filter effects. However, the proposed method accounts for inner-filter effects and
allows for the calculation of association constants, the fluorescence intensity when all the
R-BNA is complexed, and complex stoichiometry using a simple theoretical model.
Results qualitatively prove the hypothesis that CX4-LEU binds R-BNA more strongly
than CX4-ILE. Future directions could focus on the investigation of the atropisomeric
pairs as a means by which to establish more correlations between EKC results and
fluorescence results. Also, because it is important to study the mechanism of chiral
recognition for each analyte, this model could also be extended to poorly resolved
analytes as a qualitative starting point for predicting analyte elution order based upon
interaction other than hydrophobic interactions.

140
APPENDIX: ADDITIONAL FIGURES DISCUSSED IN PREVIOUS CHAPTERS
Figure A1. Infrared spectra of A) CX4-L-VAL; B) APS; C) CVAPS. Conditions: Mixed sample with dry KBr (1:100) for KBr pellet.
B
C
A

141
Figure A2. Chiral separations using CX4-LEU as chiral selector in EKC. Analytes: A) Troger’s base; B) norlaudanosoline
HO
HOHN
OH
OH
N
N
CH3
H3C
A
B

142
-0.5
0
0.5
1
1.5
2
2.5
200 250 300 350 400 450 500
Wavelength (nm)
Abs
orba
nce
00.10.511.52.53.54.555.56.57.58.59.5101525354550
Figure A3. Ultraviolet absorbance spectra of increasing concentrations (x10-4 M)
of CX4-LEU in 100 mM Tris
-0.5
0
0.5
1
1.5
2
2.5
200 250 300 350 400 450 500
Wavelength (nm)
Abs
orba
nce
00.10.511.52.53.54.555.56.57.58.59.5101525354550
Figure A4. Ultraviolet absorbance spectra of increasing concentrations (x10-4 M)
of CX4-ILE in 100 mM Tris.

143
-20000
0
20000
40000
60000
80000
100000
120000
140000
160000
350 400 450 500 550 600
Wavelength (nm)
Inte
nsity
BNA-0BNA-1.5BNA-2.5BNA-3.5BNA-4.5BNA-5.5BNA-6.5BNA-7.5BNA-8.5BNA-9.5BNA-10BNA-15BNA-25BNA-35BNA-45BNA-50
Figure A5. Corrected fluorescence emission spectra of 10-5 M R-BNA in
increasing concentrations (x10-4 M) of CX4-ILE
y = 1E+08x + 3905.4R2 = 0.986
y = 2E+08x - 11232R2 = 0.9827
0
50000
100000
150000
200000
250000
0.0E+00 1.0E-04 2.0E-04 3.0E-04 4.0E-04 5.0E-04 6.0E-04 7.0E-04 8.0E-04 9.0E-04 1.0E-03
CX4-ILE concentration (M)
Inte
nsity with abs corr
without abs corr
Figure A6. Emission intensity of R-BNA as a function of CX4-ILE concentration
(with and without CX4-ILE absorbance correction)

144
y = 6E-09x - 1E-06R2 = 0.9854
0.0E+00
2.0E-05
4.0E-05
6.0E-05
8.0E-05
1.0E-04
1.2E-04
1.4E-04
1.6E-04
1.8E-04
0.0E+00 2.0E+03 4.0E+03 6.0E+03 8.0E+03 1.0E+04
(CX4-LEU Conc.)-1
(Cor
rect
ed In
tens
ity)-1
Figure A7. Double reciprocal plot of intensity of R-BNA as a function of CX4-
ILE concentration, assuming 1:1 stoichiometry; association constant and intensity of completely complexed R-BNA are negative.
y = 2E-12x + 3E-06R2 = 0.9966
0.0E+00
4.0E-05
8.0E-05
1.2E-04
1.6E-04
2.0E-04
0.0E+00 2.0E+07 4.0E+07 6.0E+07 8.0E+07 1.0E+08
(CX4-ILE conc)-2
(Cor
rect
ed In
tens
ity)-1
Figure A8. Double reciprocal plot of intensity of R-BNA as a function of CX4-
ILE concentration, assuming 2:1 stoichiometry; association constant and fluorescence intensity of completely complexed R-BNA are 1.5x10⁶ M-1 and 338867, respectively.

145
0.00E+00
1.00E-03
2.00E-03
0.00E+00 2.00E+03 4.00E+03 6.00E+03 8.00E+03 1.00E+04
(CX4-ILE)-1
(flu
ores
cenc
e)-1
0.00E+002.00E-044.00E-046.00E-048.00E-041.00E-031.20E-031.40E-031.60E-031.80E-03
0.00E+00 2.00E+07 4.00E+07 6.00E+07 8.00E+07 1.00E+08
(CX4-ILE)-2
(flu
ores
cenc
e)-1
Figure A9. Double reciprocal plots assuming 1:1 and 2:1 stoichiometry between
CX4-ILE and R-BNA. Straight line means there is 1:1 association. The association constant is 100 M-1.

146
0.00.51.01.52.02.53.03.5
190 240 290 340
Wavelength (nm)
Abs
orba
nce
SCX6:Ca2+SCX6
Figure A10. Ultraviolet absorbance spectrum of p-sulfonated calix[6]arene in the presence and in the absence of Ca2+
Ultraviolet Absorbance Spectra of SCX and SCX4-Alkali Metal Complexes
0.0
0.5
1.0
1.5
2.0
190 240 290 340
Wavelength (nm)
Abs
orba
nce SCX4
K+
Na+
Figure A11. Ultraviolet absorbance spectra of p-sulfonated calix[4]arene in the presence and absence of alkali metal cations

147
Ultraviolet Absorbance Spectra of SCX4 and SCX4-Alkaline Earth Metal Complexes
0.0
0.5
1.0
1.5
2.0
190 240 290 340
Wavelength (nm)
Abs
orba
nce SCX4
Mg2+
Ca2+
Figure A12. Ultraviolet absorbance spectra of p-sulfonated calix[4]arene in the
presence and absence of alkaline earth cations
UV Absorbance Spectra of SCX4 and SCX4-Transition Metal Complexes
0.00.51.01.52.02.5
190 240 290 340
Wavelength (nm)
Abs
orba
nce
SCX4
Mn2+
Fe2+
Ni2+
Figure A13. Ultraviolet absorbance spectra of p-sulfonated calix[4]arene in the presence and absence of transition metals

148
UV Absorbance Spectra of SCX4 and SCX4-Transition Metal Complexes
0.00.51.01.52.02.5
190 240 290 340
Wavelength (nm)
Abs
orba
nce
SCX4Cu2+Zn2+
Figure A14. Ultraviolet spectra of p-sulfonated calix[4]arene in the presence and absence of copper and zinc.

149
VITA
Kimberly Hamilton is the second of two children born to Macura and Delia
Monroe Hamilton. A native of Caddo Parish, Louisiana, she attended Louisiana private
and public schools and graduated as a Louisiana Board of Regents scholar in the top 10%
of her graduating high school class in 1990.
She attended Southern University and A & M College in Baton Rouge, Louisiana.
While at Southern, Kimberly was chosen to be a Minority Undergraduate Training for
Energy-related Careers (MUTEC) scholar. With this honor came the opportunity to
participate in environmental research. Under the direction of Ms. Georgia Brown,
Kimberly investigated the microbial degradation of ethylene glycol monomethyl ether.
She also worked with Moses Omafuaire on the spectroscopic quantitation of heavy
metals in human hair and in drinking water. During her undergraduate tenure, she
received a Department of Chemistry scholarship and the Outstanding Inorganic
Chemistry student award. She also was a member of Delta Sigma Theta Sorority,
Incorporated. Kimberly graduated with a Bachelor of Science degree in chemistry in
1995.
Before entering graduate school at Louisiana State University (LSU), Baton
Rouge, Louisiana, she worked as an environmental and industrial laboratory technician at
Entek Environmental Lab, Ciba Specialty Chemicals, and Allied Signal. While enrolled
at LSU, she received a National Institutes of Health predoctoral fellowship. Her current
research in the laboratory of Dr. Isiah Warner focuses on the synthesis, characterization,
and application of calixarene derivatives in spectroscopy and electrokinetic capillary
chromatography. She also served as public relations chairperson and newsletter editor of

150
the LSU chapter of the National Organization for the Professional Advancement of Black
Chemists and Chemical Engineers for the 2001-2002 term. She also was a member of the
American Chemical Society. In April 2003, she was presented the Charles E. Harrington
Graduate Student Award by the LSU Black Faculty and Staff Caucus. She will receive
the Doctor of Philosophy degree in analytical chemistry in August 2003.