environmental biology masters project
TRANSCRIPT

Regis University Regis University
ePublications at Regis University ePublications at Regis University
All Regis University Theses
Spring 2020
Environmental Biology Masters Project Environmental Biology Masters Project
Marley Borham Regis University
Follow this and additional works at: https://epublications.regis.edu/theses
Recommended Citation Recommended Citation Borham, Marley, "Environmental Biology Masters Project" (2020). All Regis University Theses. 964. https://epublications.regis.edu/theses/964
This Thesis - Open Access is brought to you for free and open access by ePublications at Regis University. It has been accepted for inclusion in All Regis University Theses by an authorized administrator of ePublications at Regis University. For more information, please contact [email protected].

i
MS ENVIRONMENTAL BIOLOGY CAPSTONE PROJECT
by
Marley T. Borham
A Project Presented in Partial Fulfillment of the Requirements for the Degree
Masters of Science in Environmental Biology
REGIS UNIVERSITY May, 2020

ii
Table of Contents
CHAPTER 1. LITERATURE REVIEW......................................................................................1
Introcution...............................................................................................................................1
Bat Species Diversity & Roosting ...........................................................................................2
Logging & Habitat Loss ..........................................................................................................3
Sustainable Logging Methods & Forest Management .............................................................5
Conclusion ..............................................................................................................................7
References ..............................................................................................................................7
CHAPTER 2. GRANT PROPOSAL ......................................................................................... 10
Abstract ................................................................................................................................. 11
Section 2: Objectives, Goals, Literature Review, and Anticipated Value ............................... 11
Section 3: Methods ............................................................................................................... 14
Section 4: Budget .................................................................................................................. 17
Section 5: Qualification of Researcher .................................................................................. 18
Appendix .............................................................................................................................. 20
References ............................................................................................................................ 20
CHAPTER 3. JOURNAL MANUSCRIPT ................................................................................ 23
Abstract ................................................................................................................................. 23
Introduction .......................................................................................................................... 23
Methods ................................................................................................................................ 26

iii
Results .................................................................................................................................. 32
Discussion ............................................................................................................................ 35
References ............................................................................................................................ 38
CHAPTER 4 ............................................................................................................................. 41
Introduction ........................................................................................................................... 41
Stakeholders ......................................................................................................................... 43
Solution ................................................................................................................................ 47
References ............................................................................................................................ 48

iv
CHAPTER 1, LIST OF FIGURES
1. Bat Species Richness ............................................................................................. 2
CHAPTER 2, LIST OF TABLES
1. Project Schedule .................................................................................................... 17
2. Budget ................................................................................................................... 17
CHAPTER 2, LIST OF FIGURES
2. Map of South St. Vrain Creek ................................................................................ 20
CHAPTER 3, LIST OF TABLES
3. Site Descriptions.................................................................................................... 28
CHAPTER 3, LIST OF FIGURES
3. Map of Colorado with Marked Sites ...................................................................... 27
4. Map of Sites .......................................................................................................... 28
5. Table Mountain Transects...................................................................................... 30
6. Hammond Peak Transects...................................................................................... 31
7. Deer Haven Ranch Transects ................................................................................. 31
8. Phantom Canyon Transects .................................................................................... 32
9. Bayesian Model ..................................................................................................... 33
10. Table Mountain Change......................................................................................... 33
11. Hammond Peak Change......................................................................................... 34
12. Deer Haven Ranch Change .................................................................................... 34
13. Phantom Canyon Change ....................................................................................... 35

1
CHAPTER 1. LITERATURE REVIEW
Effects of Logging on Bats in the Pacific Northwest
Introduction
Bats are one of many species that function as indicators of environmental health or
habitat quality. They are used around the world as an indicator because they are specialists and
are impacted greatly by disturbances. Bats have specific temperature requirements, roosting
preferences, and foraging behaviors that are often analyzed to evaluate changes in an ecosystem
because any slight change in these roosting or foraging preferences can have significant impacts
on their survival. Therefore, it is beneficial to utilize bats when analyzing disturbance effects on
an ecosystem's health. The Pacific Northwest, specifically Washington, Oregon and, Northern
California, contains a wide variety of bat species, 9 of which are considered either threatened or
endangered (Hayes & Wiles, 2013). Logging in this area has massively disrupted forests,
destroying habitat and displacing animals, including bats.
Logging is the main driver behind the extinction of cavity-roosting bats in the Pacific
Northwest, indicating a decrease in ecosystem health. Converting to more sustainable forestry
methods will help conserve these cavity-roosting bat populations and the health of the forest
ecosystem. A significant amount of research has been done on the effects of logging in the
tropics. However, the literature is lacking evidence that logging is also affecting bat populations
in non-tropical regions, like the Pacific Northwest. Not enough information exists to determine
the effects of logging in temperate regions, and which methods of sustainable logging will most
effectively sustain these already threatened or endangered species and conserve forest
ecosystems.

2
Bat Species Diversity & Roosting
All bats belong to the order Chiroptera, one of the largest and most widespread orders of
mammals in the world. Bats have adapted the ability to fly and sustain flight naturally with
forelimbs that have been modified into wings, making them unique to all other mammals
(Mlakar & Zupan, 2011). Bats can live in nearly every habitat type, with the majority of all bat
species centered around the tropics (Figure 1). In the Pacific Northwest, there are 15 species of
bats, all of which are insectivores, and many of which are cavity-roosting (Mlakar & Zupan,
2011). Roosts provide safe and secure locations for bats to reproduce, raise young, and hibernate
(Campbell, Hallett, & O'Connell, 1996). Cavity-roosting bats prefer large-diameter trees, with
rotting tree centers, and warm-protected areas (Crampton & Barclay, 1998). Most preferred
roosting trees are found in old-growth forests, which can be used as roosts while alive or as
snags.
Figure 1: Bat Species Richness. Areas shaded with red, orange, or yellow contain somewhat high species richness. Areas shaded in green or blue contain low species richness (Bat Conservation International).
3
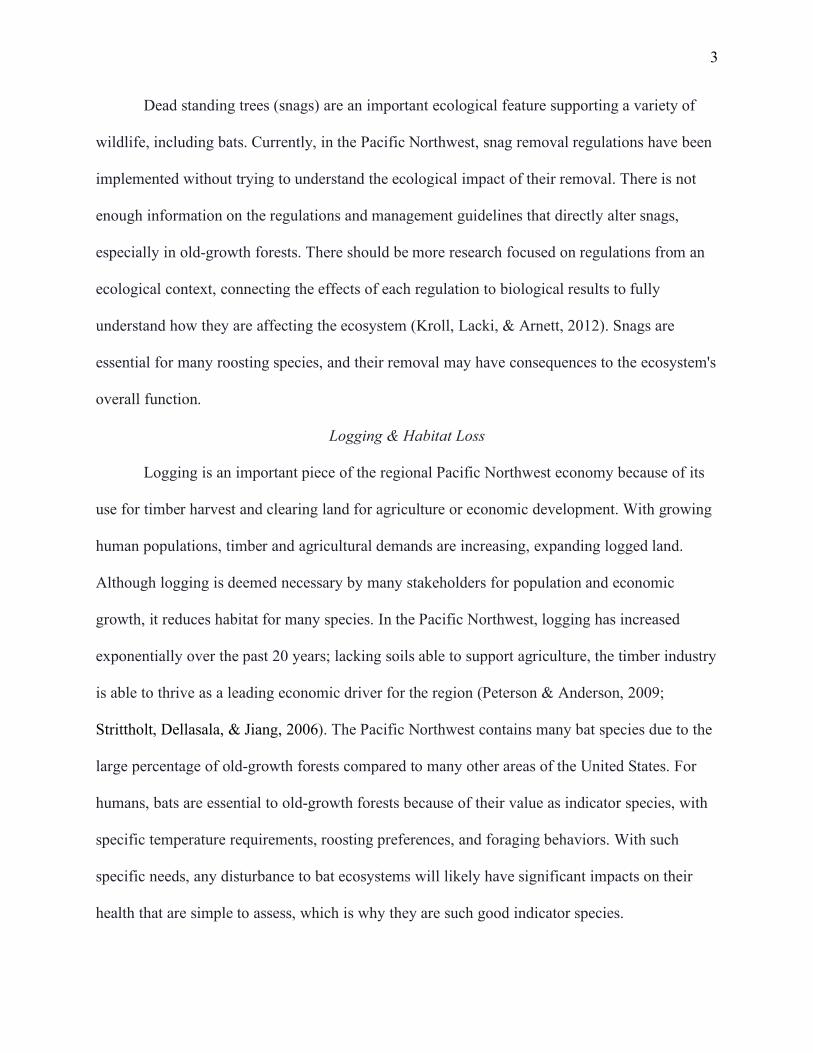
Dead standing trees (snags) are an important ecological feature supporting a variety of
wildlife, including bats. Currently, in the Pacific Northwest, snag removal regulations have been
implemented without trying to understand the ecological impact of their removal. There is not
enough information on the regulations and management guidelines that directly alter snags,
especially in old-growth forests. There should be more research focused on regulations from an
ecological context, connecting the effects of each regulation to biological results to fully
understand how they are affecting the ecosystem (Kroll, Lacki, & Arnett, 2012). Snags are
essential for many roosting species, and their removal may have consequences to the ecosystem's
overall function.
Logging & Habitat Loss
Logging is an important piece of the regional Pacific Northwest economy because of its
use for timber harvest and clearing land for agriculture or economic development. With growing
human populations, timber and agricultural demands are increasing, expanding logged land.
Although logging is deemed necessary by many stakeholders for population and economic
growth, it reduces habitat for many species. In the Pacific Northwest, logging has increased
exponentially over the past 20 years; lacking soils able to support agriculture, the timber industry
is able to thrive as a leading economic driver for the region (Peterson & Anderson, 2009;
Strittholt, Dellasala, & Jiang, 2006). The Pacific Northwest contains many bat species due to the
large percentage of old-growth forests compared to many other areas of the United States. For
humans, bats are essential to old-growth forests because of their value as indicator species, with
specific temperature requirements, roosting preferences, and foraging behaviors. With such
specific needs, any disturbance to bat ecosystems will likely have significant impacts on their
health that are simple to assess, which is why they are such good indicator species.
4
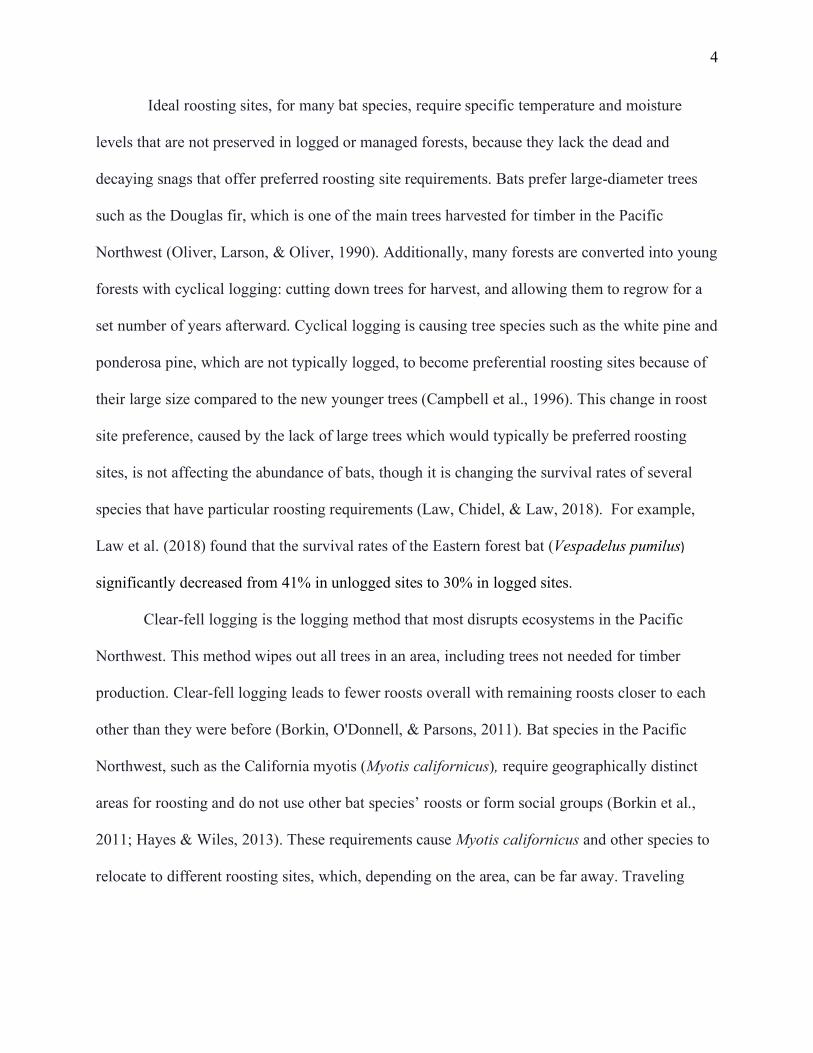
Ideal roosting sites, for many bat species, require specific temperature and moisture
levels that are not preserved in logged or managed forests, because they lack the dead and
decaying snags that offer preferred roosting site requirements. Bats prefer large-diameter trees
such as the Douglas fir, which is one of the main trees harvested for timber in the Pacific
Northwest (Oliver, Larson, & Oliver, 1990). Additionally, many forests are converted into young
forests with cyclical logging: cutting down trees for harvest, and allowing them to regrow for a
set number of years afterward. Cyclical logging is causing tree species such as the white pine and
ponderosa pine, which are not typically logged, to become preferential roosting sites because of
their large size compared to the new younger trees (Campbell et al., 1996). This change in roost
site preference, caused by the lack of large trees which would typically be preferred roosting
sites, is not affecting the abundance of bats, though it is changing the survival rates of several
species that have particular roosting requirements (Law, Chidel, & Law, 2018). For example,
Law et al. (2018) found that the survival rates of the Eastern forest bat (Vespadelus pumilus)
significantly decreased from 41% in unlogged sites to 30% in logged sites.
Clear-fell logging is the logging method that most disrupts ecosystems in the Pacific
Northwest. This method wipes out all trees in an area, including trees not needed for timber
production. Clear-fell logging leads to fewer roosts overall with remaining roosts closer to each
other than they were before (Borkin, O'Donnell, & Parsons, 2011). Bat species in the Pacific
Northwest, such as the California myotis (Myotis californicus), require geographically distinct
areas for roosting and do not use other bat species’ roosts or form social groups (Borkin et al.,
2011; Hayes & Wiles, 2013). These requirements cause Myotis californicus and other species to
relocate to different roosting sites, which, depending on the area, can be far away. Traveling
5
great distances can expel massive amounts of energy, making it a perilous task for bats and can
decrease survival in groups of otherwise healthy bats (Cisneros, Fagan, & Willig, 2015).
Clear-fell logging severely reduces bat habitat, shrinking the pool of roosts available to
each bat or bat social group (Borkin et al., 2011). In New Zealand, on average, 20% of all
roosting sites are destroyed every year, approximately 70% of which are lost to logging
operations while only 30% are lost to natural tree falls (Borkin et al., 2011). This vast majority of
roosting sites lost to logging reveals how devastating logging is to habitats. Non-sustainable
methods of logging, such as clear-fell logging, are destroying bat habitats causing bat species to
become threatened or completely endangered. The loss of these habitats indicates a decline in
ecosystem health that could be better managed with other methods of logging.
Sustainable Logging Methods & Forest Management
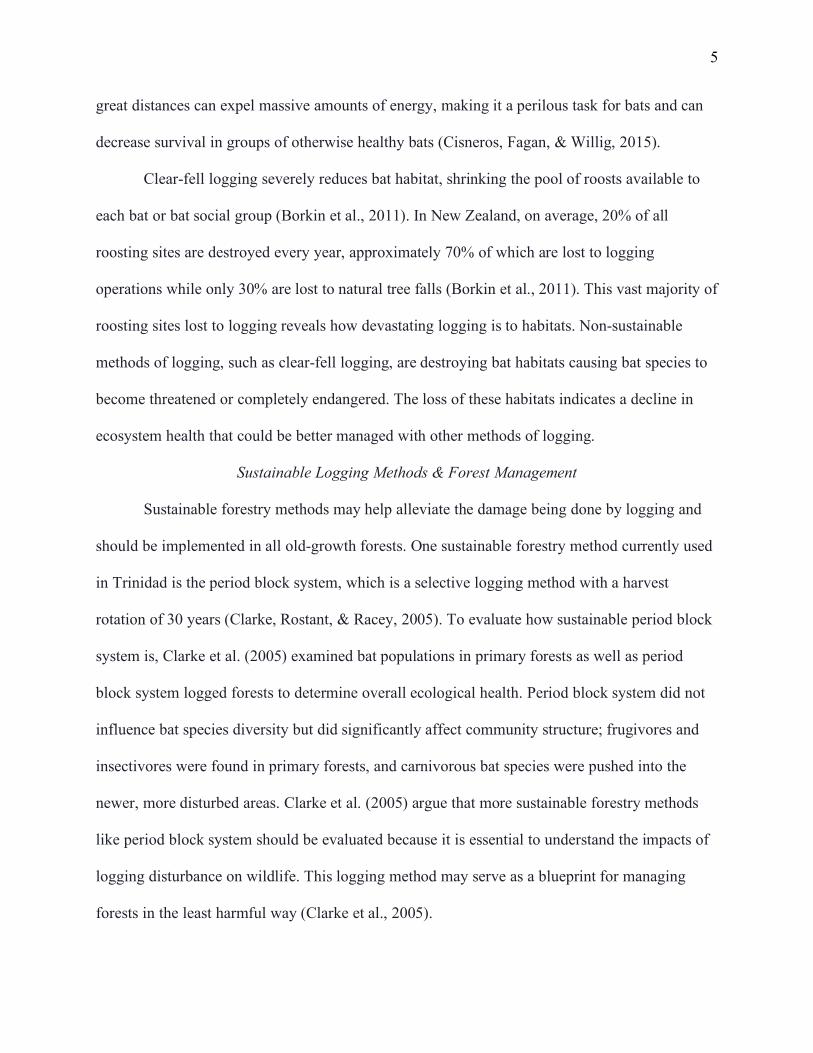
Sustainable forestry methods may help alleviate the damage being done by logging and
should be implemented in all old-growth forests. One sustainable forestry method currently used
in Trinidad is the period block system, which is a selective logging method with a harvest
rotation of 30 years (Clarke, Rostant, & Racey, 2005). To evaluate how sustainable period block
system is, Clarke et al. (2005) examined bat populations in primary forests as well as period
block system logged forests to determine overall ecological health. Period block system did not
influence bat species diversity but did significantly affect community structure; frugivores and
insectivores were found in primary forests, and carnivorous bat species were pushed into the
newer, more disturbed areas. Clarke et al. (2005) argue that more sustainable forestry methods
like period block system should be evaluated because it is essential to understand the impacts of
logging disturbance on wildlife. This logging method may serve as a blueprint for managing
forests in the least harmful way (Clarke et al., 2005).

6
Although period block system and other sustainable methods have higher habitat
conservation rates than non-sustainable methods, they do significantly change forest structure as
well as plant and animal community composition (Clarke et al., 2005). In contrast, the absence of
any logging activity increases bat species heterogeneity and population density over time, and
overall bat community composition remains functional (Gaoue et al., 2015). Other studies have
observed a decrease in bat species richness in logged sites 10 years following the disturbance,
which has led researchers to suggest that forest recovery of logged sites does not offset the losses
from disturbance (Peters, Malcolm, & Zimmerman, 2006). Additionally, short-term tree harvest,
harvesting specific tree species and then allowing them to regrow at high intensity, significantly
impacts the understory plant community composition. This harvesting method has negative
impacts on the quality of available habitat that trees provide in these young stands, causing the
habitat quality of many trees to decrease and no longer be up to the standard of old non-disturbed
forests (Peterson & Anderson, 2009). Without logging, forests can grow successionally with
minimal disturbance and provide preferential habitat for bats and other species.
Another proposed forestry method is to implement policies that may assist logging
companies in embracing sustainable harvesting techniques. Kilgore and Blinn (2004) found that
both technical and educational programs have been implemented around the country to
encourage loggers how to appropriately apply sustainable guidelines and the importance of doing
so (Kilgore & Blinn, 2004). These policies can be implemented in many ways; for example, in
Oklahoma, a few timber companies are beginning to encourage policy implementation by
providing price premiums to loggers who follow policy guidelines (Kilgore & Blinn, 2004).
Considerable research on the effectiveness of these programs, or how logging companies have
7
implemented them, does not exist, but the current literature on these programs may begin to
promote a switch from traditional logging methods to more sustainable methods.
Conclusion
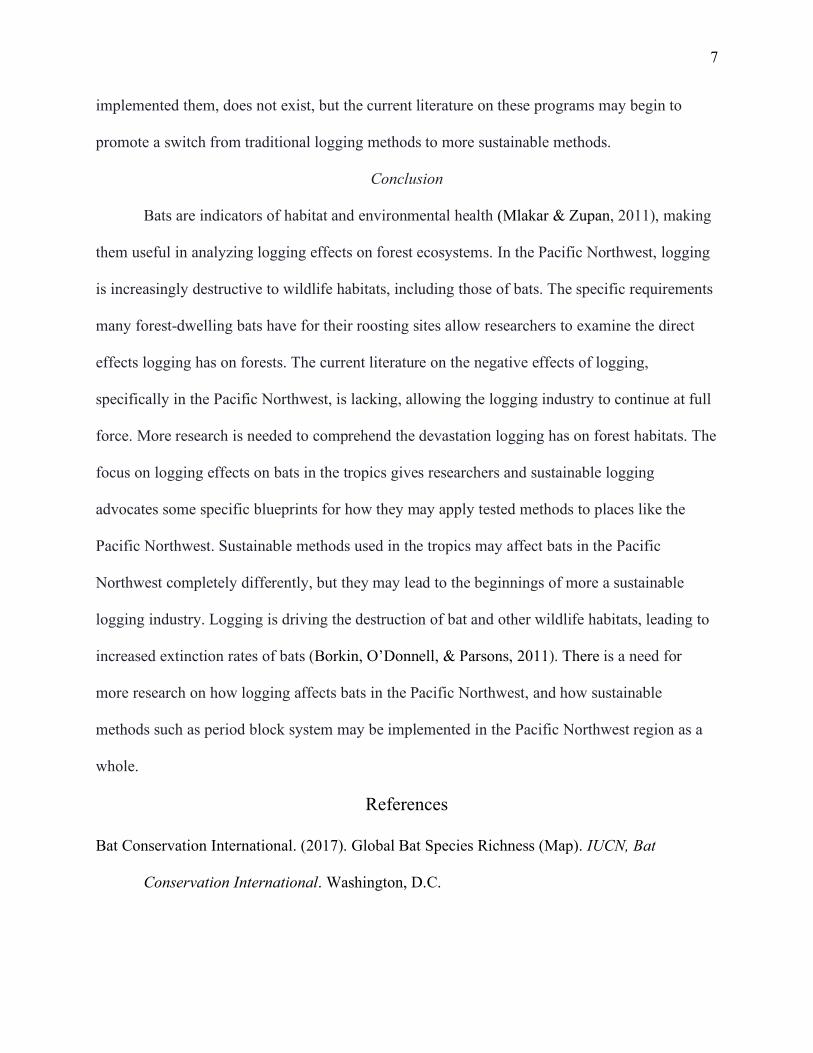
Bats are indicators of habitat and environmental health (Mlakar & Zupan, 2011), making
them useful in analyzing logging effects on forest ecosystems. In the Pacific Northwest, logging
is increasingly destructive to wildlife habitats, including those of bats. The specific requirements
many forest-dwelling bats have for their roosting sites allow researchers to examine the direct
effects logging has on forests. The current literature on the negative effects of logging,
specifically in the Pacific Northwest, is lacking, allowing the logging industry to continue at full
force. More research is needed to comprehend the devastation logging has on forest habitats. The
focus on logging effects on bats in the tropics gives researchers and sustainable logging
advocates some specific blueprints for how they may apply tested methods to places like the
Pacific Northwest. Sustainable methods used in the tropics may affect bats in the Pacific
Northwest completely differently, but they may lead to the beginnings of more a sustainable
logging industry. Logging is driving the destruction of bat and other wildlife habitats, leading to
increased extinction rates of bats (Borkin, O’Donnell, & Parsons, 2011). There is a need for
more research on how logging affects bats in the Pacific Northwest, and how sustainable
methods such as period block system may be implemented in the Pacific Northwest region as a
whole.
References
Bat Conservation International. (2017). Global Bat Species Richness (Map). IUCN, Bat
Conservation International. Washington, D.C.
8
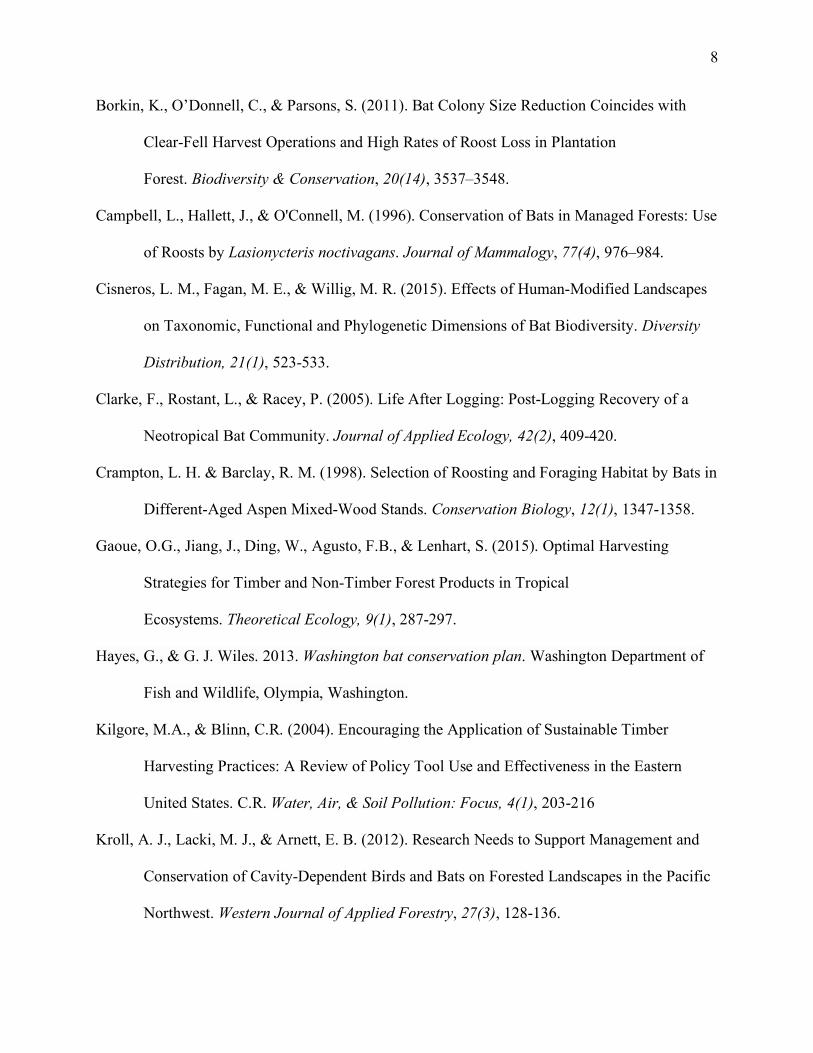
Borkin, K., O’Donnell, C., & Parsons, S. (2011). Bat Colony Size Reduction Coincides with
Clear-Fell Harvest Operations and High Rates of Roost Loss in Plantation
Forest. Biodiversity & Conservation, 20(14), 3537–3548.
Campbell, L., Hallett, J., & O'Connell, M. (1996). Conservation of Bats in Managed Forests: Use
of Roosts by Lasionycteris noctivagans. Journal of Mammalogy, 77(4), 976–984.
Cisneros, L. M., Fagan, M. E., & Willig, M. R. (2015). Effects of Human‐Modified Landscapes
on Taxonomic, Functional and Phylogenetic Dimensions of Bat Biodiversity. Diversity
Distribution, 21(1), 523-533.
Clarke, F., Rostant, L., & Racey, P. (2005). Life After Logging: Post-Logging Recovery of a
Neotropical Bat Community. Journal of Applied Ecology, 42(2), 409-420.
Crampton, L. H. & Barclay, R. M. (1998). Selection of Roosting and Foraging Habitat by Bats in
Different‐Aged Aspen Mixed-Wood Stands. Conservation Biology, 12(1), 1347-1358.
Gaoue, O.G., Jiang, J., Ding, W., Agusto, F.B., & Lenhart, S. (2015). Optimal Harvesting
Strategies for Timber and Non-Timber Forest Products in Tropical
Ecosystems. Theoretical Ecology, 9(1), 287-297.
Hayes, G., & G. J. Wiles. 2013. Washington bat conservation plan. Washington Department of
Fish and Wildlife, Olympia, Washington.
Kilgore, M.A., & Blinn, C.R. (2004). Encouraging the Application of Sustainable Timber
Harvesting Practices: A Review of Policy Tool Use and Effectiveness in the Eastern
United States. C.R. Water, Air, & Soil Pollution: Focus, 4(1), 203-216
Kroll, A. J., Lacki, M. J., & Arnett, E. B. (2012). Research Needs to Support Management and
Conservation of Cavity-Dependent Birds and Bats on Forested Landscapes in the Pacific
Northwest. Western Journal of Applied Forestry, 27(3), 128-136.

9
Law B.S., Chidel M., & Law P.R. (2018). Forest Bat Population Dynamics Over 14 Years at a
Climate Refuge: Effects of Timber Harvesting and Weather Extremes. PLoS ONE, 13(2),
e0191471.
Mlakar, S. L., & Zupan, J. L. (2011). Bats: Biology, Behavior, and Conservation. New York:
Nova Science Publishers, Inc.
Oliver, C. D., Larson, B. C., & Oliver, C. D. (1990). Forest stand dynamics. New York:
McGraw-Hill Pub. Co.
Peters, S., Malcolm, J., & Zimmerman, B. (2006). Effects of Selective Logging on Bat
Communities in the Southeastern Amazon. Conservation Biology, 20(5), 1410-1421.
Peterson, C.E., & Anderson, P.D. (2009). Large-Scale Interdisciplinary Experiments Inform
Current and Future Forestry Management Options in the U.S. Pacific Northwest. Forest
Ecology and Management, 258(1), 409-414.
Strittholt, J.R., Dellasala, D.A., & Jiang, H. (2006). Status of Mature and Old-Growth Forests in
the Pacific Northwest. Conservation Biology, 20(2), 363-374.
Willis, C.K., & Brigham, R.M. (2007). Social Thermoregulation Exerts More Influence Than
Microclimate on Forest Roost Preferences by a Cavity-Dwelling Bat. Behavioral Ecology
and Sociobiology, 62(1), 97-108.

10
CHAPTER 2. GRANT PROPOSAL
Restore waterflow and natural channel characteristics through salt cedar (Tamarix
spp.) control methods around South St. Vrain Creek
Marley Borham
MS Student in Environmental Biology
Regis University Department of Biology

11
Section 1: Abstract
Invasive species have been introduced throughout the United States, negatively impacting many
ecosystems. In Colorado, salt cedar (Tamarix spp.) has begun to invade disturbed riparian zones,
negatively affecting plant communities and surrounding soil compositions. By drawing up salts
from deep down in the soil and secreting them into the topsoil, salt cedar increases the overall
salinity of soils, decreasing the ability of native species to germinate. Currently, Boulder County
Parks and Open Space (BCPOS) is being invaded by salt cedar and is looking for a way to
control its harmful effects. I will determine what areas of BCPOS are at highest risk of salt cedar
invasion by conducting vegetation surveys. I will then evaluate three different invasive species
control methods: mechanical removal, chemical treatments, and biocontrol treatment. The data
collected in this assessment will provide BCPOS managers with information necessary for
managing and preparing for salt cedar invasion.
Section 2: Objectives, Goals, Literature Review, and Anticipated Value
I will establish the highest priority areas for restoration in BCPOS by quantifying the amount of
existing salt cedar (Tamarisk spp.) within a 10-meter region and determining how large the risk of
seed dispersal may be. I will then determine the most effective salt cedar control method and how
each method impacts waterflow and channel characteristics in the riparian areas around South St.
Vrain Creek. This study will examine the effectiveness of mechanical control, chemical control
and biocontrol of invasive salt cedar. Effectiveness will be determined by how much salt cedar is
removed and the amount remaining after regeneration; the most successful method will cost-
effectively remove salt cedar and minimize the amount of regeneration. My results will provide
information to help land managers successfully remove salt cedar and understand the

12
environmental impacts of their removal on factors such as soil erosion, soil salinity, and water
availability of streams or rivers and their surrounding riparian zones.
Specific Goals
Goal #1: Determine which areas of South St. Vrain Creek are high priority for restoration/at
highest risk for salt cedar invasion.
Goal #2: Determine which method of salt cedar control is most effective at restoring function to
South St. Vrain Creek.
Literature Review
In the Southwestern United States including parts of Colorado, salt cedar has begun to
invade quickly, taking over riparian zones by out competing the willows, cat tails and other native,
non-invasive riparian species (Di Tomaso, 1998). Salt cedar is native to the Mediterranean region
but can establish on disturbed land such as agricultural, urbanized, and other altered lands in the
United States (Brock, 1994). As an invasive species, salt cedar is very competitive because it draws
up salts from soil and excretes them from its leaves, increasing the soil salinity and suppressing
germination of other species (Di Tomaso, 1998). Salt cedar not only changes the salinity of the
soils around them, they also affect the salinity and water levels in the surrounding streams or rivers.
Friederici (1995), found that one large salt cedar tree can absorb up to 760 liters of water a day. Its
salt output can run off into waters and increase the salinity of the water and sequentially impact
the biotic factors within the waters (Di Tomaso, 1998). As the salinity of both the water and soils
increases many plant species are unable to grow or reproduce and slowly the function of the
ecosystem is changes altogether.
Management of salt cedar is accomplished by mechanical control, chemical control, or
biocontrol treatments. Mechanical control can take the form of hand cutting, mowing, ploughing,

13
or chainsaw cutting. Chemical control is accomplished through herbicide application, and
biological control agents for salt cedar take form in the tamarisk beetle (Diorhabda carinulata).
There is a lack of information on the relative effectiveness of each method of salt cedar invasion
control (Brock, 1994; Bateman et al., 2010). Mechanical treatments are usually done with the goal
of removing all top growth but in some cases include the removal of root systems as well; the
removal of root systems may disrupt nearby species, negatively impacting the ecosystem (Brock,
1994). Chemical treatments in the form of herbicide application have been used to treat salt cedar
for decades but the best herbicide with the lowest ecological and economic costs has yet to be
found (Douglass, Nissen, & Hart, 2013); with chemical control there is also the risk of water
contamination depending on the chemical used. Chemical treatments often need a bit of
mechanical control before application leading to more time and money being spent on the
treatment than only using one or the other (Brock, 1994; Harms, & Hiebert, 2006). Lastly,
biocontrol treatments are often used when there is a pest known for preying on an invasive species.
Biocontrols can be dangerous because they place another alien species into an environment without
always how they may impact the surrounding environment (Bateman et al., 2010). Tamarisk leaf
beetles (Diorhabda elongate) are pests that forage on the leaves of salt cedar and are thought to
increase salt cedar mortality up to 40% (Hultine et al., 2010). Although they have been used as a
control method in other areas of the United States in the past, they have not been studied enough
to fully understand their potential widespread impacts (Hultine et al., 2010). All invasive species
control methods are feasible and have been done but their effectiveness and efficiency have not
been properly analyzed. More information on each method is needed to create proper management
protocols for salt cedar control.
Anticipated Value

14
Removing salt cedar in zones that have been completely invaded or have the possibility of
destructive invasion will restore or maintain the function of the ecosystem. Boulder County Parks
and Open Space has begun to see the invasion of salt cedar and knowing how to properly deal with
it is important for maintaining the heath of the Boulder County Parks and Open Space riparian
ecosystems. To properly remove or control salt cedar, it is important to fully understand the
benefits and costs of each management technique before applying them. The literature is currently
lacking the information needed to understand how each method of control will impact an
ecosystem. This study will provide land managers and governments with the information to create
an effective protocol for controlling salt cedar.
Section 3: Methods
Study Site: This study will be conducted along South St. Vrain creek in the area managed by
Boulder County Parks and Open Space where salt cedar has been recorded (Fig. 1). The total length
of the study site is 1.5 miles on each side of the creek which is just a small portion of the nearly
33-mile-long creek. This creek drains part of the foothills north of Boulder.
Goal #1: Build a map of South St. Vrain Creek that locates areas of high restoration priority
To identify areas with high salt cedar I will conduct a baseline vegetation survey along
both sides of South St. Vrain Creek across the entire 1.5 miles of Boulder County Parks and Open
Space managed land (Fig 1). Thirty 10mX10m plots will be selected randomly along transects on
both sides of the creek, using ArcGIS. I will navigate to each plot using a GPS device with the
randomly selected plots predownloaded onto it. During this baseline survey I will record total
species richness and percent cover of salt cedar, cottonwood, and willow, which are the main
competitors of salt cedar. Areas with high percent cover (above 20 percent) of salt cedar and low
species richness (fewer than 5 total species) will be considered high-risk areas. Other high-risk

15
areas may have low species richness and low percent cover (below 10 percent) of salt cedar but
are in close proximity (within 10 meters) to areas with high percent cover of salt cedar areas,
making them susceptible to invasion. I will repeat this survey technique twice prior to applying
the control methods to confirm the presence or lack of salt cedar. Following the completion of the
surveys, I will use ArcGIS to create a map of the collected data which indicates which areas are
considered high risk.
Goal #2a: Evaluate different salt cedar control methods
After completion of both baseline vegetation surveys, I will select thirty 10mX10m plots
along both sides of South St. Vrain Creek that fall within areas I determined to be high priority,
15 plots on each side of the creek. I will randomly select the plots using a map of the study site on
ArcGIS. All plots will be at least 10m apart from one another to avoid any overlap of vegetation.
I will then assign ten plots to each of the three salt cedar control methods. Ten plots will be chain
sawed, mowed, and plowed as a mechanical treatment (Bay & Sher, 2008; Belote et al., 2010), ten
plots will be chain sawed and treated with an Arsenal and glyphosate herbicide mix on the cut
stumps as a chemical treatment (McDaniel & Taylor, 2003), and the last ten plots will be treated
with the release of tamarisk leaf beetles as a biocontrol (Nagler et al., 2018). After completion of
each treatment I will survey the entire study site, as in goal #1. I will repeat the same survey
technique again once the growing season has ended to quantify the regeneration of salt cedar.
Goal #2b: Cost-benefit analysis of each salt cedar control method
After the completion of all surveys and treatments of plots, I will perform a cost-benefit
analysis of each treatment method. I will compare the actual monetary costs of supplies used for
each method, costs of labor, and environmental costs discovered in the post-treatment surveys

16
associated with each treatment method to the benefits to the ecosystem that each treatment method
provides.
Data Analysis
I will conduct a before/after, control/impact (BACI) assessment on the effects of each control
method described above. This will compare the results of the pre-management surveys to the
results after applying each control method. The BACI design will compare the sites conditions in
the time before any treatments have been applied and the time after the treatments have been
applied to each plot to estimate the magnitude to effects (Palmer, Zedler & Falk, 2016). To
complete the BACI analysis I will use R Studio to compare models from the survey data collected
either before or after the treatments are applied.
Negative Impacts
The negative effects of completing this study are dependent on the treatment method. Treatment
using mechanical control may have consequences such as trampling of vegetation, increased
erosion along South St. Vrain Creek, or unintended removal of other species. The potential
negative impacts of chemical treatments include contamination of water through herbicide run-off
and unintentional trampling of surrounding vegetation. Both chemical and mechanical methods
have negative impacts that depend on the experience of field technicians whereas the potential
negative impacts of biocontrol as a treatment are dependent on the pest used. Biocontrol treatment
can have negative effects on surrounding vegetation and wildlife depending on the life history of
the pest; in this case it is unknown the exact effects tamarisk beetles may have on the South St.
Vrain Creek ecosystem. While these negative effects are possible, if the treatments are all
completed following the protocol, which will include steps to minimize impacts such as the proper
way to spray herbicide by only applying it to the targeted plants, by trained technicians, the impacts

17
will not be detrimental. If there are considerable negative effects, remediation of the sites may be
considered.
Project Schedule
Dates Activities Deliverables
April 2020 – May
2020
Conduct initial vegetation surveys
Map of high-risk areas
June 2020 – August
2020
Set up plots for study Apply treatment methods to
each plot
Data on each control method
November 2020 Complete survey of treated plots
Map of how high-risk areas have changed
December 2020 Analyze data through cost-benefit analysis
Write up report of all findings
Cost-benefit analysis of each method
Which method is the most effective and efficient
Complete report with the final results
Section 4: Budget
Item Justification Cost Quantity Total
Cost
Chain saw To mechanically remove salt cedar $159
(homedepot.com)
1 $159
Mower To mechanically remove salt cedar $329
(homedepot.com)
1 $329
Herbicide To chemically remove salt cedar $30/ gallon 1 $30
Sprayer To chemically remove salt cedar $125 (ULINE.com) 1 $125

18
Gas For travel to and from the site $0.535/ mile
45mi = $$24.08
10 trips $270.80
GPS For locating the treatment plots $299.99 (garmin) 1 $299.99
Flags To mark treatment plots $7.97/ per 100 pack 1 $7.97
iPad For data collection in the field $138.89 1 $138.89
Student
Field
Tech
To conduct the treatment of the plots $1000 stipend 2 $2,000
Total Request: $3,360.65
Section 5: Qualification of Researcher
Marley T. Borham
Address: 1234 N Washington St. (Apt 408) Denver, CO 80203
Telephone: (708) 822-8065
Email: [email protected]
Education
M.S. in Environmental Biology, May 2020, Regis University (Denver, CO)
B.A in Environmental Studies, December 2018, Marquette University (Milwaukee, WI)
Relevant experience
June 2018 - August 2018 Land Stewardship Intern (Urban Ecology Center) – Milwaukee,
WI

19
• Organized and led the volunteer land stewardship program at Riverside Park multiple times weekly
• Planted a variety of native plant species throughout the parks • Assisted in overseeing and maintaining a plant nursery containing a wide range of native
plant species • Conducted multiple vegetation surveys in all three of the parks (Riverside Park,
Menomonee Valley, Washington Park) • Assisted with seed collection throughout the growing season at surrounding natural
areas
January 2018 – May 2018 Land Stewardship Intern (Riveredge Nature Center) – Saukville,
WI
• Worked in a team to map and remove a variety of invasive species using a Garmin GPS system.
• Assisted in leading Riveredge Nature Center’s volunteer land stewardship program with volunteers of all ages and environmental knowledge
• Organized and maintained an inventory of equipment and supplies
April 2017 – December 2018 Laboratory Assistant – Gamble Lab (Marquette University)
• Upheld the livelihood of an assortment of gecko species with different feeding regimens, sterilizing enclosures, and temperature regulation.
• Performed a variety of safety procedures to certify reliable data collection in the laboratory
August 2017 – January 2018 Biology Teaching Assistant (Marquette University)
• Graded case studies, quizzes, exams and short papers • Administered exams and monitored students as a test proctor • Tutored students on a variety of biological concepts weekly and by appointment
Relevant course work (B.A., Marquette University)
Advanced Ecology, Environmental & Natural Resource Economics, Tropical Ecology in
Panama, Food, Water & Society, Plant Biology, Material Cultures: Environmental Protection
Relevant course work (M.S., Regis University)

20
Forest & Vegetation Ecology, Aquatic Ecology, Advanced Behavioral Ecology, Biostatistics &
Research Design, Conservation & Restoration Seminar, Environmental Biology Colloquium &
Grant Writing, Field Ecology, Environmental Regulation & Impact Assessment (NEPA),
ArcGIS
Appendix:
Figure 2: Map shows South St. Vrain Creek, areas highlighted green are managed by Boulder County Parks and Open Space and orange highlighted areas are managed by EWP (https://www.bouldercounty.org/open-space/management/south-st-vrain-creek-restoration/).
References
Bateman, H. L., Dudley, T. L., Bean, D. W., Ostoja, S. M., Hultine, K. R., & Kuehn, M. J.
(2010). A river system to watch: documenting the effects of saltcedar (Tamarix spp.)
biocontrol in the Virgin River Valley. Ecological Restoration, 28(4), 405-410.
Bay, R. F., & Sher, A. A. (2008). Success of active revegetation after Tamarix removal in
riparian ecosystems of the southwestern United States: a quantitative assessment of past
restoration projects. Restoration Ecology, 16(1), 113-128.

21
Belote, R. T., Makarick, L. J., Kearsley, M. J., & Lauver, C. L. (2010). Tamarisk removal in
Grand Canyon National Park: Changing the native–non-native relationship as a
restoration goal. Ecological Restoration, 28(4), 449-459.
Brock, J. H. (1994). Tamarix spp. (salt cedar), an invasive exotic woody plant in arid and semi-
arid riparian habitats of western USA. Ecology and Management of Invasive Riverside
Plants, 4(1), 28-44.
Di Tomaso, J. M. (1998). Impact, biology, and ecology of saltcedar (Tamarix spp.) in the
southwestern United States. Weed Technology, 12(2), 326-336.
Douglass, C. H., Nissen, S. J., & Hart, C. R. (2013). Tamarisk management. Tamarix: a case
study of ecological change in the American West. Oxford University Press, New York,
333-353.
Friederici, P. (1995). The alien saltcedar. American Forests, 101(1-2), pp. 45-47.
Harms, R. S., & Hiebert, R. D. (2006). Vegetation response following invasive tamarisk
(Tamarix spp.) removal and implications for riparian restoration. Restoration
Ecology, 14(3), 461-472.
Hultine, K. R., Belnap, J., van Riper III, C., Ehleringer, J. R., Dennison, P. E., Lee, M. E., ... &
West, J. B. (2010). Tamarisk biocontrol in the western United States: ecological and
societal implications. Frontiers in Ecology and the Environment, 8(9), 467-474.
McDaniel, K. C., & Taylor, J. P. (2003). Saltcedar recovery after herbicide-burn and mechanical
clearing practices. Rangeland Ecology & Management/Journal of Range Management
Archives, 56(5), 439-445.
Nagler, P. L., Nguyen, U., Bateman, H. L., Jarchow, C. J., Glenn, E. P., Waugh, W. J., & van
Riper III, C. (2018). Northern tamarisk beetle (Diorhabda carinulata) and tamarisk

22
(Tamarix spp.) interactions in the Colorado River basin. Restoration Ecology, 26(2), 348-
359.
Palmer, M. A., Zedler, J. B., & Falk, D. A. (2016). Foundations of Restoration Ecology. Island
Press.
Sutherland, S. (2004). What makes a weed a weed: life history traits of native and exotic plants
in the USA. Oecologia, 141(1), 24-39.

23
CHAPTER 3: JOURNAL MANUSCRIPT
Analysis of population growth rate of Penstemon degeneri in Colorado’s Arkansas
River Valley indicate no significant trends over three years
Abstract
Penstemon degeneri is a rare and endemic species of flowering plant found in Colorado,
USA. As a rare and endemic species, P. degeneri has never before been studied or
monitored in the field. The Bureau of Land Management (BLM) Royal Gorge Field
Office has begun a monitoring study to determine the status of this species, its life history
characteristics, and its growth rate. The study began in 2017 with monitoring of P.
degeneri populations at four sites across south-central Colorado. I examined the
population count data of P. degeneri that has been collected over the past 3 years using
Bayesian statistical methods to determine if there are any changes in growth rate so far. I
hypothesized that growth rates at the four sites will differ due to varying environmental
factors that have not yet been recorded and found that there is not enough data to obtain
significant trends in growth rate at three of the four sites. One site, Table Mountain, did
show a significant positive trend in growth which may be due to this site having little
disturbance history. More population data on P. degeneri needs to be collected to further
investigate the changes in population growth rates, and to determine any additional life
history traits.
Introduction
Currently, the world as we know it is changing physically due to increased anthropogenic
disturbance from growing human populations. These changes have physical impacts on our

24
environment, such as increased habitat loss. Changes like habitat loss are leading to the
extinction of thousands of species worldwide every year (Dirnböck, Essl & Rabitsch, 2011;
Thomson, 2005). Some species are at higher risk of extinction from habitat loss because of their
small geographic ranges and low populations; these species are known as endemic species (Isik,
2011). Endemic species are similar to rare species but have some differing characteristics.
Species may be considered rare and/or endemic when they can be characterized in one or
more of the following ways. The first and best-known characteristic for endemic species is that
they have a narrow geographic range (Isik, 2011). Depending on how narrow the geographic
range, species may be considered locally, regionally, nationally, or continentally endemic (Isik,
2011). Having a relatively small geographic range causes a lot of endemic species to have small
population sizes and low genetic variability. Because of their narrow geographic range and small
population sizes, rare and endemic species may be hard to study and a lack of data on these
species makes them harder to conserve (Thomson, 2005). Along with their narrow range, low
genetic variability decreases a species ability to combat change in climate, habitat, and disease
risk (Isik, 2011). With low genetic variability and low ability to fight off disease, many endemic
species have only a few populations remaining and may display declines in population size
(Dirnböck, Essl & Rabitsch, 2011; Isik, 2011; Thomson, 2005). These species also may have
specialized niche demands that are being impacted by changing climate and anthropogenic
disturbances (Dirnböck, Essl & Rabitsch, 2011; Isik, 2011; Cañadas et al., 2014). Climate
change and varying environmental gradients have been shown to have a significant impact on
endemic species richness and range (Cañadas et al., 2014). These characteristics make endemic
species vulnerable and can help explain the extinction rates from habitat loss we see worldwide.
25
Many species exhibit more than one of the above characteristics, which may lead them to be
listed as a threatened species.
P. degeneri is a rare and endemic perennial herb that is part of the Plantaginaceae family,
and is found at elevations from 1830 to 2896 meters in south-central Colorado (Beatty, Jennings
& Rawlinson, 2004; Meyer, 2008). P. degeneri is distinguished from other Penstemon species by
the size of its anther sacs, its unique yellow petal color, the density of the hairs on its petals, and
its relatively small geographic range (Beatty, Jennings & Rawlinson, 2004). In south-central
Colorado, P. degeneri is found in pinyon-juniper woodlands, ponderosa pine forests, and the
montane meadows of the Arkansas River Valley (O'Kane, 1988). Within these habitats, P.
degeneri inhabits rocky areas, cracks of rock slabs, pine-needle duff, oak brush, grassy meadows,
and the areas between meadow and forests (Beatty, Jennings & Rawlinson, 2004).
The Bureau of Land Management-Royal Gorge Field Office is undertaking the
monitoring of this endemic species to establish both population and landscape-scale trends,
understand the species responses to changing environmental conditions, and to identify its
important life-history traits. Four permanent trend-monitoring plots were established in 2017
where known populations of P. degeneri existed. Sites were selected for sampling based on
surface management, accessibility, and size of population at location of occurrence. Sampling
locations are distributed across the known range of the species. An analysis of population growth
trends at disjunct populations will allow for an understanding of the overall viability of the
species. Monitoring sites are located at Sommerville Table (Table Mountain), Hammond Peak,
Deer Haven Ranch, and Phantom Canyon populations. With natural and anthropogenic
disturbances affecting all four sites, it is expected that there will be differences in population
trends, growth rate, and ability to reproduce between the four P. degeneri populations. I focused
26
on the population growth rate using Bayesian statistic methods which incorporates conditional
probabilities with the existing data that will give the BLM a more rounded estimate of what their
future populations may look like. This statistical method was chosen as a baseline to begin to
understand the changes in population growth as monitoring continues annually. With a flat prior,
I hypothesize that the population growth rate of P. degeneri with differ significantly across the
four sites because of varying environmental factors.
Methods
Study Site
The first site established in 2017 as a site containing a population of P. degeneri is Table
Mountain. Historically, Table Mountain has been relatively undisturbed (Table 1). Located on
the north rim of the Arkansas River Valley, high above Cañon City, it had native grasses but
minimal water availability (Rustand, 2019). Small numbers of cattle grazed the area sporadically,
but the area could never support large numbers of livestock for very long without a water source.
Therefore, unlike many montane grasslands in Colorado, the species composition of parry oat
grass, mountain muhly, junegrass, western wheatgrass, slender wheatgrass, blue grama, and
others at High Mesa has changed little since the late 1800s (Rustand, 2019). The second site is
Hammond Peak, which was established in 2017 as a site containing a population of P. degeneri
(Table 1). Hammond Peak had been intensively logged as the first homesteaders built a mill
along its north slope (Rustand, 2019). P. degeneri occurs along peaks ridgeline as it transitions
from grassland along the south slope to mixed conifer on the north slope. The third site
established in 2017 containing a population of P. degeneri is Deer Haven Ranch (Table 1). This
location has been intensively managed by the forestry and fuel program (Rustand, 2019). Within
the population occurrence area, ponderosa pine thinning and several controlled burns have taken

27
place, creating a stand that contains mature trees with a grassy understory. The fourth and final
site containing a population of P. degeneri is called Phantom Canyon and was again established
in 2017 (Table 1). This last site occurs along historic stagecoach road and railroad line that
connected Florence, Colorado, to Cripple Creek, Colorado which is now a part of the Gold Belt
Scenic Byway (Rustand, 2019). Due to this area’s history and little management action, the site
where the plant occurs today is heavily disturbed (Rustand, 2019).

28
Table 1: Sampling sites with a summary of descriptive features (Google Earth) Sampling Site GPS
Location
Plot (0,0)
Elevation Average
Slope
Aspect
Disturbance
History
Table Mountain 13S
458005
4262173
~8800ft 0.0% Flat Little grazing
Hammond Peak 13S
447301
4285734
~9700ft 7.6% NE Logged

29
Deer Haven
Ranch
13S
467020
4275045
~8000ft 0.0% Flat Burned and
grazed
Phantom Canyon 13S
488244
4273848
~8200 ft 1.6% SW Railway and
road
Data Collection
We established rectangular macro plots at each monitoring site within areas of species
occurrence with plot dimension chosen based on population size and structure. We selected
transect locations within each macroplot using a restricted random method to maximize the
detection of variability within the sampling location (Figures 1-4). We placed permanent stakes
at both ends of each transect to be read yearly. To determine mean plant density, we recorded all
occurrences of P. degeneri within the transect belt, notes were taken on life stage and phenology
documenting if individuals were flowering, fruiting, or damaged as well.
Data Analysis
I used the program WinBUGS alongside the R Studio (version 1.2.5033) package
R2WinBUGS to create a Bayesian state-space model which works well for analyzing population
count data (RStudio Team, 2015). Running the Bayesian state-space model for each of the four
populations over three years gave figures which show the true, observed, and estimated values of
population size. The model estimated true and observed values based on the initial counts of P.
degeneri in 2017, the mean population growth rate across all three years of data collection, and
the temporal variation of the growth rate. The estimated values are the result of running the state-

30
space model with a flat prior. These estimated values come from a Markov chain Monte Carlo
(MCMC) algorithm, which creates a probability distribution. Along with the Bayesian model, I
performed t-tests to compare population counts of P. degeneri between 2017-2019 at each of the
four sites. These t-tests gave a little more insight into the current population trends of P.
degeneri, as the Bayesian model only projects into the future.
Figure 3: Table Mountain plot with 12 transects

31
Figure 4: Hammond Peak plot with 11 transects
Figure 5: Deer Haven Ranch plot with 11 initial transects and 3 added transects
0,20 50,201 2 12 13 3 4 5 14 6 7 8 9 10 11
20 meters (y)
0,0 N 50,0W 50 meters (x)
OutE Out In X
S InY

32
Figure 6: Phantom Canyon plot with 11 transects
Results
The resulting graphs of the state-space model (Fig. 5) for each of the 4 populations show
that the true, observed, and estimated values do not differ significantly as the model has only 3
years of data to work from. The results of running t-tests of population sizes from 2017, 2018,
and 2019 showed slight trends in population size across all four sites but yielded no significant
results for all of the sites but Table Mountain where an upward trend in population growth was
detected (p-value: 0.005) (Fig. 6-9). The results of percent flowering and vegetative growth
mirrored the growth of population represented by the t-tests.

33
Figure 5: This figure shows how the Bayesian model models the estimated and observed population sizes. The true value shows how the population has decreased over the first year and then slowly began to increase in the second year. The true, observed, and estimated values vary across all four sites because of their differing initial population sizes and mean annual growth rates.
Figure 6: Difference in population size of P. degeneri between 2017-2019 at Table Mountain (p-value:0.005; 95% CI: 1.30-2.36).
-8
-6
-4
-2
0
2
4
2017-2018 2018-2019
Mea
n di
ffere
nce
in d
ensit
y
Year
Change in mean P. degeneri density at Table Mountain

34
Figure 7: Difference in population size of P. degeneri between 2017-2019 at Hammond Peak (p-value: 0.924; 95% CI: 1.326-1.906).
Figure 8: Difference in population size of P. degeneri between 2017-2019 at Deer Haven Ranch (p-value: 0.379; 95% CI: 0.773-1.803).
0
0.5
1
1.5
2
2.5
3
3.5
4
4.5
5
2017-2018 2018-2019
Mea
n Di
ffere
nce
in P
lant
Den
sity
Year
Change in mean P. degeneri density at Hammond Peak
-2
-1
0
1
2
3
4
5
2017-2018 2018-2019
Diffe
renc
e in
mea
n de
nsity
Year
Change in mean P. degeneri density at Deer Haven Ranch

35
Figure 9: Difference in population size of P. degeneri between 2017-2019 at Phantom Canyon (p-value:0.140; 95% CI: 0.896-1.041).
Discussion
A model of this kind is designed for data collected over many years which is why the
resulting graphs do not signify any specific trends. It was chosen for this study because it
provides baseline information that can be built up as more data is collected annually. Looking at
the first few years of monitoring data is important to determine how much data needs to be
collected and how often (Phillips-Mao et al., 2016). As the results of this analysis don’t show
any significant results, we can expect that the model needs more data to determine any changes
in population growth rates (Pico et al., 2008). T-tests were used to give a better insight into the
changes in population growth rate at each site over the past 3 years, and it is anticipated that in
the future t-tests will only confirm what is shown in the Bayesian model. As the monitoring of P.
degeneri continues over the years the model will become more accurate and the estimate will be
more informative. The results of this P. degeneri population growth monitoring has not shown
any significant results. Therefore, the results do not support my hypothesis that the growth rates
-3
-2.5
-2
-1.5
-1
-0.5
0
0.5
1
2017-2018 2018-2019
Diffe
renc
e in
mea
n de
nsity
Year
Change in mean P. degeneri density at Phantom Canyon

36
will vary across sites due to possible differing environmental variables at the different locations.
This could be due to a variety of factors, the main being a lack of adequate data as the
monitoring has only taken place once a year for three years. With only three years of data
significant trends are not seen and it is recommended that monitoring data consist of at least 5-7
years to analyze annual population growth rates (Pico et al., 2008). Other factors that may have
had a role in non-significant results could be sampling error and monitoring design. Each of the
four sites currently have between 11-13 transects each, which in this case may not be enough to
properly analyze the populations of P. degeneri. Another factor that could account for the lack of
significant results could be the geographic location of the four sites, all four sites are in south-
central Colorado. The close proximity of the sites with similarity in weather and elevation across
all four sites could lead to populations that grow comparably (Table 1).
Although the results are currently not significant and only show minor changes, tracking the
growth rate of P. degeneri remains important. Due to the endemic nature and lack of literature on
this species it is essential to track the known populations so that it may be protected if it becomes
threatened or endangered. The BLM has the resources and is able to monitor species like P.
degeneri so that if the population reaches a level they consider to be at risk of extinction they can
recommend of petition that it be added to the U.S. Fish and Wildlife service to be listed as
threatened or endangered (Elzinga & Salzer, 1998). Doing so will give the species protection
against things such as habitat destruction or seed collection. Additionally, because of the
endemic nature of P. degeneri it is important for the BLM to monitor its populations as it is only
found in Colorado and if the populations disappear there are no other populations that can be
used to try and save the species (O'Kane, 1988).

37
In order to continue the monitoring of P. degeneri in a way that will ensure that the BLM as
all the knowledge they need to make proper recommendations for this species, there are some
changes that could improve the protocol and overall methodology of the study. The first piece
being that the monitoring should focus on the life history of this species. As the life history traits
are currently unknown for this species it is important that the BLM monitors in a way that will
make these traits known. Life history traits such as its dispersal processes and rates are important
for understanding how the species is able to grow its populations (Pico et al. Elzinga & Salzer,
1998; Hutchings, 1991) Some species may have dispersal methods that are dependent on the
environment where others may disperse their seeds on their own (Elzinga & Salzer, 1998). Other
traits that are useful to know and understand are its reproduction strategies, plant growth rates,
and survivorship techniques (Hutchings, 1991; Elzinga & Salzer, 1998). Each of these life
history traits tells managers and scientists why and how the populations grow in the ways they do
and for the BLM these are important traits that should be examined for the good of the species
(Picó et al., 2008; Usher, 1991). If P. degeneri populations start to decline knowing traits such as
their dispersal methods will be important to try and conserve the species.
We know that plants can either reproduce sexually or asexually which determines whether an
individual plant is reliant on other individuals and environmental conditions or is able to
reproduce on its own (Chasan & Walbot, 1993). Plants that reproduce sexually are at a higher
risk of extinction because of the way they rely on outside conditions to produce seeds (Sosa et
al., 1998; Chasan & Walbot, 1993). Understanding the reproduction strategies of P. degeneri will
help determine the need for conservation which is important because of the endemic nature of
this species (Adsersen, 1989). Plants that reproduce sexually often do better when the population
is large because the opportunity for reproduction is higher which is one reason why knowing the

38
growth rate of plant populations is important. If a particular plant species has a high population
growth rate, the probability of that species going extinct is lower than a sexually reproducing
species with a low population growth rate (Sosa et al., 1998). We know that P. degeneri flowers
and is likely a species that reproduces sexually so determining the growth rate of its known
populations will tell us how likely it is to go extinct.
Creating a monitoring project for a rare and endemic species like P. degeneri where life
history traits are unknown is a hard task to take-on but in doing so the BLM can gain valuable
knowledge on how to conserve species of this kind that can be shared with other management
groups. Refining monitoring protocols and discovering the best methods of statistical analysis
will be crucial to the BLM in continuing to monitor rare and endemic species. With the
information they will gain the BLM can help other land managers best monitor their land for
species like P. degeneri and maintain biodiversity across the state of Colorado.
References
Adsersen, H. (1989). The rare plants of the Galápagos Islands and their conservation.
Biological Conservation, 47(1), 49–77.
Beatty, B. L., Jennings, W. F., & Rawlinson, R. C. (2004). Penstemon degeneri Crosswhite
(Degener’s beardtongue): a technical conservation assessment. [Online]. USDA Forest
Service, Rocky Mountain Region.
Cañadas, E. M., Fenu, G., Peñas, J., Lorite, J., Mattana, E., & Bacchetta, G. (2014). Hotspots
within hotspots: Endemic plant richness, environmental drivers, and implications for
conservation. Biological Conservation, 170, 282-291.
Chasan, R., & Walbot, V. (1993). Mechanisms of Plant Reproduction: Questions and
Approaches. The Plant Cell, 5(10), 1139.

39
Dirnböck, T., Essl, F., & Rabitsch, W. (2011). Disproportional risk for habitat loss of high‐
altitude endemic species under climate change. Global Change Biology, 17(2), 990-996.
Elzinga, C. L., & Salzer, D. W. (1998) Measuring & monitoring plant populations. US
Department of the Interior, Bureau of Land Management.
Google Earth V 6.2.2.66.13. (May 2, 2020). DigitalGlobe 2012. http://www.earth.google.com
Hutchings, M. J. (1991). Monitoring plant populations: census as an aid to conservation.
In Monitoring for conservation and ecology (pp. 61-76). Springer, Dordrecht.
Isik, K. (2011). Rare and endemic species: why are they prone to extinction?. Turkish Journal of
Botany, 35(4), 411-417.
Meyer, S. E. (2008). Penstemon Schmidel: penstemon, beardtongue. In: Bonner, Franklin T.;
Karrfalt, Robert P., eds. The Woody Plant Seed Manual. Agric. Handbook No. 727.
Washington, DC. US Department of Agriculture, Forest Service. p. 774-777., 727, 774-
777.
O'Kane Jr, S. L. (1988). Colorado's rare flora. The Great Basin Naturalist, 434-484.
Phillips-Mao, L., Galatowitsch, S. M., Snyder, S. A., & Haight, R. G. (2016). Model-based
scenario planning to develop climate change adaptation strategies for rare plant
populations in grassland reserves. Biological Conservation, 193, 103-114.
Picó, F. X., Rodrigo, A., & Retana, J. (2008). Population Dynamics. Plant Demography. 2811-
2817.
RStudio Team (2015). RStudio: Integrated Development for R. RStudio, Inc., Boston, MA
URL http://www.rstudio.com/.
Rustand, M., Personal Communication, November, 2019.

40
Sosa, V., Vovides, A. P., & Castillo-Campos, G. (1998). Monitoring endemic plant extinction in
Veracruz, Mexico. Biodiversity & Conservation, 7(11), 1521-1527.
Thomson, D. (2005). Measuring the effects of invasive species on the demography of a rare
endemic plant. Biological Invasions, 7(4), 615-624.
Usher, M. B. (1991). Scientific requirements of a monitoring programme. In Monitoring for
conservation and ecology (pp. 15-32). Springer, Dordrecht.

41
CHAPTER 4
Increased Hunting and Education to Counteract White-Tailed Deer
Overpopulation in Wisconsin
Introduction
In the Midwest, white-tailed deer (Odocoileus virginianus) have consistently expanded their
range and increased in population size. Populations of deer in the Midwest US have increased in
size because of changes in both top-down and bottom-up controls. Anthropogenic control of
rivers by way of damming, channelization, stabilization, and diversion promoted the
establishment of forest cover in riparian zones, prime habitat for white-tailed deer because they
provide cover and vegetation for food (VerCauteren & Hygnstrom, 2011; Jodie et al., 2017). The
stabilization of many rivers and streams throughout the Midwest resulted in more consistent flow
and protection against erosion which promote the growth of vegetation on the banks (Odgaard,
2015). Similarly, the creation of irrigation systems throughout the Midwest permitted an increase
in production of crops such as corn, alfalfa, and soybeans, all of which are prime food sources
for deer as well (VerCauteren & Hygnstrom, 2011). The enhancement of these bottom-up
controls occurred at the same time as the loss of top predators. Eradication of native wolves
throughout the Midwest starting in the late 1800s decreased predation on white-tailed deer
thereby releasing deer populations from top-down control (U.S. Fish and Wildlife Service,
2019). The expanded range of white-tailed deer initiated by the enhancement of bottom-up
controls in conjunction with the loss of top-down control continues to plague the entire Midwest.
Consequently, some states have begun efforts to decrease deer populations in order to prevent
the damage they cause to ecosystems. For instance, the state of Wisconsin has seen many

42
negative impacts brought about by the overwhelming white-tailed deer population and is
beginning to debate the best way to combat the issue.
In Wisconsin, white-tailed deer have been an important part of the culture and ecosystem
for hundreds of years (Lewis, 1998). Along with fishing, camping, and hiking, hunting is one of
the main pastimes of Wisconsinites. Until the late 1990’s, 46% of the state’s households had at
least one hunter (Lewis, 1998). Hunting is a unifying tradition passed down from one generation
to the next within many Wisconsin families. Unfortunately, this passion for hunting is beginning
to crumble because most individuals of younger generations move towards the cities and away
from the hunting country. This decline in hunting interest further intensifies deer population
growth because it further diminishes top-down control on deer populations. Increase in size of
deer population is causing damage to agricultural land, private property, state land, and is even
increasing danger for drivers (Devitt, 2019). The overpopulation of white-tailed deer across the
Midwest and Wisconsin has impacts on many stakeholder groups, many of which disagree on the
best solution to deer overpopulation. In order to effectively manage exploding deer populations, I
argue that Wisconsin’s government needs to expand awareness on the issue of deer
overpopulation by introducing citizens to conservation efforts such as wolf reintroduction and
promoting financial support of the DNR. The government should additionally develop an
education program to promote hunting in younger generations in both cities and rural
communities. The Wisconsin DNR can use some of the profits from hunting to promote
education and awareness on this issue, support local farmers so that they may lease their land for
hunting, and extend hunting season, because they are the stakeholder group who tracks deer
populations and have the financial resources and workforce connections to support outreach
programs.

43
Stakeholders
Farmers
Many farmers in Wisconsin whose farms fall victim to deer herbivory believe that deer
are a nuisance that bring them few, if any, benefits. Although farmers have always dealt with
deer eating their crops, the population of deer has grown so large that farmers are now seeing
damage that is negatively impacting their revenue (VerCauteren & Hygnstrom, 2011). Not only
do deer eat and trample crops, but they also spread disease to livestock. With denser deer
populations around the state, there is a higher probability that diseased or infected deer
encountering livestock farms and subsequently infect livestock with diseases they may not have
otherwise been exposed to (VerCauteren & Hygnstrom, 2011). Farmers, therefore, consider
white-tailed deer a nuisance species because of the revenue lost to crop damage or livestock
illness. Consequently, most farmers would like to see deer populations effectively controlled.
The Wisconsin Department of Natural Resources (WDNR) has aimed to solve this problem by
encouraging farmers to lease their land to hunters. Leasing farmland to hunters gives hunters a
private area to hunt where deer are often found and easy to see and it gives farmers an
opportunity to gain extra income (VerCauteren & Hygnstrom, 2011). Depending on the farmers
needs, leasing their land may make up for the income lost due to destruction from the
overpopulation of deer. Not only would leasing their farmland help farmers make money but it
can also help lower the deer density in their area and decrease the damage to their crops.
Conservationists
There are many conservation groups throughout Wisconsin that, depending on their
location, deal with overpopulation of deer in the forests and prairie lands they are trying to
protect. One of the most prominent conservation groups in Wisconsin is the Aldo Leopold

44
Foundation, this group has a mission to foster the care of land and community (Eco-USA, 2019).
Many of the other groups of conservationists are local to nature centers, schools, and counties
across the state (Eco-USA, 2019). Many of these groups encourage members to be stewards of
the land, like Aldo Leopold. Being a steward for the land is to take in every part of the
ecosystem, understand how it works and promote the lands overall health (Aldo Leopold Nature
Center, 2019). With an overpopulation of deer in Wisconsin, the land that many of these groups
or individual conservationists tend is being negatively impacted.
Although white-tailed deer are important to forest food web and help structure forest
communities, these ecosystems cannot sustain large densities (Jodie et al., 2017; Revkin, 2012).
White-tailed deer destroy the understory of Wisconsin’s forests by eating shrubs and tree
saplings and by breaking young trees when they rub trees to mark them (Jodie et al., 2017).
Physical damage wrought by white-tailed deer also disrupts insect communities, especially those
of pollinators (Jodie et al., 2017). Insects such as butterflies, bees, and moths rely on many
understory plants for habitat, reproduction, and food; these plants in turn rely on insects for
pollination. When large populations of deer roam the forest and destroy vegetation, plant-
pollinator relationships are disrupted because the vegetation that attracts the pollinators is lost
(Sakata & Yamasaki, 2015). Not only do deer destroy forests through physical damage, but they
indirectly influence plant community structure by encouraging the growth of invasive plant
species. Deer can be selective in what they consume and often avoid invasive species such as
garlic mustard which can spread quickly in Wisconsin’s forests (Jodie et al., 2017; Pursell,
2019). These large deer populations also travel much of the day and may carry seeds of these
non-native species to other areas that could have otherwise avoided invasion (Sakata &
Yamasaki, 2015). Denser deer populations means that more deer travelling through the forest

45
resulting in greater spread of invasive plant species. As stated by the naturalist and author Aldo
Leopold, “I now suspect that just as a deer herd lives in mortal fear of its wolves, so does a
mountain live in mortal fear of its deer.” (Jodie et al., 2017; Pursell, 2019; Leopold & Schwartz,
1966).
Recreationalists
In Wisconsin, camping and hiking are pastimes of many Wisconsinites who have
differing views on the effects of deer overpopulation. Many of these recreationalists value the
time they can spend away from cities out in the wilderness. Campers often look at their time
away from home as a way to relax and escape from stress (Houghton, 2018). Wisconsin has
thousands of campsites statewide, both private and public, which make getting away from home
easier since campers can travel shorts distances to find a campsite that fits their needs
(Houghton,2018). Hikers, similar to campers, often take time to enjoy nature away from the
hustle and bustle of city living. Recreationalists typically include individuals who are fond of
nature’s aesthetics and enjoy the biodiversity they see when taking a trip. Overpopulation of deer
increases top-down control on many species which may lead to a decrease in the biodiversity
which many recreationalists seek.
Unfortunately, there are conflicts between this group and the hunters in the state because
the proposed solution of expanding hunting season to combat deer overpopulation (VerCauteren
& Hygnstrom, 2011). A longer hunting season would mean a shorter camping season in some
areas, making finding a peaceful campsite more difficult for some campers. In the areas where
camping and hunting are permitted at the same time of the year hunting can disrupt the
blissfulness many campers seek when going out into the wilderness. Hunting can cause loud

46
sporadic noise which not only disturbs campers and hikers but also, they wildlife they may be
trying to view.
Department of Natural Resources
The WDNR is a statewide agency that tracks and monitors wildlife, plants, and natural
resources, and sells permits for hunting to create revenue that supports wildlife conservation
programs. With the mission of protecting and enhancing our natural lands and the resources they
provide, the WDNR is interested in supporting every level of the ecosystem. To protect the
integrity of Wisconsin’s forest and their natural resources, it is important for the WDNR to
monitor environmental conditions, wildlife, plants and how they all intereact. Because the
WDNR earns revenue from each hunting permit sold, the agency would hope to reverse recent
declines in hunting licenses purchased (Devitt, 2019). The WDNR researches and monitors
species across the state including white-tailed deer (Wisconsin Department of Natural Resources,
2019). By tracking and monitoring deer populations across the state, the WDNR can sell the
number of permits needed to control the deer population without bringing them to dangerously
low levels. With an overpopulation of deer, the WDNR can sell more permits and allow hunters
to take home more deer per permit (Devitt, 2019). WDNR can help control deer overpopulation
by selling additional permits for hunting. By doing so, the WDNR will also, earn more revenue
that can be used for additional wildlife conservation efforts and for creating an education
program that teaches the importance of hunting in Wisconsin.
Hunters
Although hunting activity has declined in recent years, if it experiences a resurgence,
deer populations can be better controlled. Research has shown that when given the opportunity to

47
harvest 2 more antlerless deer than originally allowed, the deer populations in upstate New York
were still considered too high, the problem was with the low number of hunters registered
(Brown et al., 2000). Hunting in Wisconsin has been a form of recreation for hundreds of years;
it is important in many communities and families for meat or outdoor enjoyment. However, deer
hunting has declined in recent decades because hunting isn’t as popular for younger generations
or people living closer to large cities (Devitt, 2019). Due to decreasing popularity, the number of
hunters and permits sold in Wisconsin is steadily dropping (Devitt, 2019). The drop in hunting
has negatively impacted revenue from permit sales, which Governor Walker sought to reverse by
enacting legislation to eliminate the minimum hunting age (Kaeding, 2018). Unfortunately, the
number of young hunters who signed up was not enough to offset the decreased sales of permits
(Kaeding, 2018). Although there have been actions to promote hunting in younger generations,
the outreach that the state government has attempted has not been as wide-spread and inclusive
as it should be. The governor tried to lower the age requirement for hunting to allow more
younger children to partake in hunting but the focus on only younger children was not enough to
significantly increase the number of hunters. If the state government wants to promote hunting
potential hunters need to be incentivized to hunt. A longer hunting season and educational
campaigns that align with conservationists’ goals of promoting healthy forests may incentivize
people such as campers, hikers, and conservationists to buy hunting permits and partake in deer
hunting.
Solution
The best solution when considering the opinions of the stakeholders is to expand education on
white-tailed deer’s significance in Wisconsin and the importance of hunting, to encourage farm
owners to lease their land to hunters, and to relax hunting regulations by expanding hunting
48
season. Creating an education program throughout the state that teaches the importance of white-
tailed deer in Wisconsin’s forests and how controlling populations through hunting will promote
healthier forests will benefit citizens who are uneducated on the issue at hand and the options
they have to help solve the problem. The solution of increasing education on white-tailed deer
and hunting as an option for control could bring hunting numbers up as it would promote hunting
in a way that is beneficial to many groups and doesn’t negatively impact others. Educational
initiatives could extend to states surrounding Wisconsin to bring in out-of-state hunters as a way
to increase the number of hunters and increase WDNR’s revenue, which could then be put
towards conservation of natural resources. Along with promoting education on the issue to
increase top-down control of deer, the state of Wisconsin should also create a program that
works hand-in-hand with farmers to determine how they may go about leasing farmland to
hunters in a way that will adequately and safely control deer populations. Leasing farmland will
promote good relations between hunters and farmers and can decrease deer populations to
numbers that no longer negatively impact farmers but still allows hunters to enjoy their pastime.
In addition, expanding both the time that hunters are may hunt and where they can hunt should
be pursued by the WDNR in a way that doesn’t effectively limit other recreationalists who enjoy
the outdoor spaces WDNR For example, WDNR might explore extending hunting season in
farmlands that do not serve the broader public, but maintain current restrictions in public hiking
and camping areas. The combination of an education program, a farmland leasing program, and a
carefully managed extended hunting season is the best way to combat the overpopulation of
white-tailed deer in Wisconsin that would result in the greatest benefit for stakeholders.
References

49
Aldo Leopold Nature Center. (2019). Land Stewards. Retrieved May 13, 2020, from
https://aldoleopoldnaturecenter.org/get-involved/volunteer-opportunities/volunteer-land-
stewards/
Brown, T. L., Decker, D. J., Riley, S. J., Enck, J. W., Lauber, T. B., Curtis, P. D., & Mattfeld, G.
F. (2000). The future of hunting as a mechanism to control white-tailed deer
populations. Wildlife Society Bulletin, 28(4), 797-807.
Devitt, T. (2019, October 24). Oh, deer! Isthmus. https://isthmus.com/news/news/deer-
overpopulation-is-taking-a-toll-on-wisconsin-forests/.
Eco-USA. (2019). Wisconsin Environmental Organizations. Retrieved May 13, 2020, from
http://www.eco-usa.net/orgs/wi.shtml
Flagel, D. G., Belovsky, G. E., & Beyer, D. E. (2016). Natural and experimental tests of trophic
cascades: gray wolves and white-tailed deer in a Great Lakes forest. Oecologia, 180(4),
1183-1194.
Houghton, M. (2018). Why Camping Is Rising in Popularity, Especially Among Millennials.
Retrieved May 13, 2020, from
https://www.forbes.com/sites/monicahoughton/2018/04/16/why-camping-is-rising-in-
popularity-especially-among-millennials/
Jodie, J., Minnesota Department of Natural Resources Fish & Wildlife, & Forest Habitat Team.
(2017, September 26). Ecological Impact of White-tailed Deer on Our Forests.

50
MyMinnesotaWoods. http://www.myminnesotawoods.umn.edu/2017/09/ecological-
impact-of-white-tailed-deer-on-our-forests/.
Kaeding, D. (2018). Drop In Deer Hunting Licenses Sold In Wisconsin Raises Conservation
Funding Concerns. Wisconsin Public Radio. https://www.wpr.org/drop-deer-hunting-
licenses-sold-wisconsin-raises-conservation-funding-concerns.
Leopold, A., & Schwartz, C. W. (1966). A Sand County almanac: With other essays on
conservation from Round River. New York: Oxford University Press.
Lewis, J. (1998, December). Deer to our culture -- Wisconsin Natural Resources magazine --
December 1998. Retrieved April 30, 2020, from
https://dnr.wi.gov/wnrmag/html/stories/1998/dec98/nelson.htm
Odgaard, A. J. (2015). River channel stabilization with submerged vanes. In Advances in water
resources engineering (pp. 107-136). Springer, Cham.
Pursell, A., Weldy, T., White, M., Cornett, M., Miller, M. L., Copeland, H., … Ballard, L. (2018,
October 3). Too Many Deer: A Bigger Threat to Eastern Forests than Climate Change?
Cool Green Science. https://blog.nature.org/science/2013/08/22/too-many-deer/.
Revkin, A. C. (2002, November 12). Out of Control, Deer Send Ecosystem Into Chaos. The New
York Times. https://www.nytimes.com/2002/11/12/science/out-of-control-deer-send-
ecosystem-into-chaos.html.
Sakata, Y., & Yamasaki, M. (2015). Deer overbrowsing on autumn‐flowering plants causes
bumblebee decline and impairs pollination service. Ecosphere, 6(12), 1-13.

51
U.S. Fish and Wildlife Service (n.d.). Gray Wolf Recovery in Minnesota, Wisconsin, and
Michigan. Retrieved May 11, 2020, from
https://www.fws.gov/midwest/wolf/history/r3wolfrec.html
VerCauteren, K., & Hygnstrom, S. E. (2011). Managing White-tailed Deer: Midwest North
America. Biology and Management of White-Tailed Deer, Ed. David G. Hewitt , 501–531.
Wisconsin Department of Natural Resources. (2019, July 21). Deer management. Deer
Management - Wisconsin DNR.
https://dnr.wi.gov/topic/wildlifehabitat/deermanagement.html.