department of environmental biology
TRANSCRIPT

Department of Environmental Biology
Phenology and Growth of the Grasstree Xanthorrhoea preissii in
Relation to Fire and Season
Dylan Korczynskyj
This thesis is presented as part of the requirements for
the award of Doctor of Philosophy
of Curtin University of Technology
June 2002

i
DECLARATION
This thesis contains no material which has been accepted for the award of any other
degree or diploma in any university. To the best of my knowledge and belief this
thesis contains no material previously published by any other person except where
due acknowledgment has been made.
Dylan Korczynskyj
2 June 2002

ii
Abstract
Australian grasstrees are a long-lived group of arborescent, monocotyledonous
plants that persist in fire-prone landscapes. Renowned for their capacity to survive
fire, and flower soon after, these species have long attracted the attention of
biologists. A southwestern Australian species, Xanthorrhoea preissii, has been the
subject of several recent studies, including use and verification of the “leafbase
banding technique” that prompted my study. This technique, which is used to
determine the age and fire history of grasstrees, correlates alternating brown- and
cream-coloured, transverse bands along the stem of grasstrees with seasonal growth,
and intermittent black bands with the burning of the plant. Combined, this
information provides a chronology for the fire events. Fundamental to this
interpretation is the assumption that grasstrees grow continually, and this growth
varies annually in accordance with changes between the two contrasting seasons of
its mediterranean climate. I studied X. preissii in two habitats (jarrah forest and
banksia woodland) adjacent to the Perth metropolitan area, in southwestern
Australia, focussing on leaf growth and phenology in relation to four factors
important to the species lifecycle; climate, fire, reproduction and herbivory.
Leaf production monitored for grasstrees in both habitats revealed continuous
growth, oscillating between maximum rates (2.5–3.2 leaves/d) from late-spring
(November) to autumn (April/May), to a minimum rate of as low as 0.5 leaf/d
during winter. In additional support of the ”leafbase banding technique”, annual leaf
production was not different from the number of leafbases comprising one cream
and one brown band. Synchronised with leaf production, grasstree water potentials
cycled annually, with predawn readings commonly measured as 0 MPa during
winter–spring and were as low as –1.26 MPa during summer, but they never
exceeded the turgor loss point (–1.85 to –2.18 MPa). The fast summer growth was
characterised by a fluctuating pattern of leaf production, particularly in banksia
woodland, where grasstrees reliably responded to >18 mm of rainfall. Twenty-four
hours after 59 mm of simulated rainfall, grasstrees in banksia woodland showed a
significant increase in water potential and increased leaf production by 7.5 times.
Reflecting this result, rainfall was the best climatic variable for predicting banksia
woodland grasstree leaf production rate during summer, whereas leaf production of
jarrah forest grasstrees was most closely correlated with daylength. Substrate
differences between the two habitats can explain this variation in leaf growth
patterns. While water appears to have played an important role in the evolution of

iii
this species, growth phenology suggests that X. preissii may have retained a
mesotherm growth rhythm from the sub-tropical early Tertiary Period.
To distinguish fire-stimulated growth from the underlying growth patterns imposed
by season, leaf production and starch reserves of X. preissii were compared between
plants from unburnt sites and those burnt in spring and autumn. Immediately
following fire, X. preissii responded with accelerated leaf production, regardless of
season. Rapid leaf accumulation during the initial flush of growth was partly at the
expense of starch reserves in the stem. Although this initial flush was relatively
short-lived (12–32 weeks), the effect of fire on leaf production was sustained for
much longer (up to 19 months). Mean maximum leaf production rate was higher for
spring-burnt grasstrees (up to 6.1 leaves/d) than those burnt in autumn (up to 4.5
leaves/d), due to optimum growing conditions in late spring/early summer.
Similarly, the timing of autumn burns in relation to declining temperatures with the
approach of winter appeared to dictate how rapidly grasstrees resprouted. These
consequences of fire season may have implications for the reproductive success of
X. preissii, reflected in the greater mean spike mass of spring-burnt grasstrees (1.19
kg) than those burnt in autumn (0.78 kg).
Leaf and spike growth, starch reserves and the effect of restricting light to
reproductive plants on spike elongation were assessed. The emergence of the spike
from within the plant's apex triggers a reduction in leaf production of up to 4.6 times
that of a vegetative grasstree that is sustained until seed release 4.5–5 months later.
Jarrah forest grasstrees experienced the largest trade-off in leaf production (7%
lower leaf production than grasstrees in banksia woodland), and produced the
shortest mature inflorescences (50% of banksia woodland grasstree inflorescences),
suggesting a constraint imposed by resource availability in this habitat. During the
period from inflorescence elongation to seed release starch reserves were depleted.
Experimentation in the banksia woodland revealed that, although the developing
spike is itself photosynthetic, it is the daily production of photosynthates by the
surrounding foliage that contributes most significantly to its growth. When light was
prevented from reaching the leaves the starch stored within the stem was not a
sufficient substitute, evidenced by a significant reduction in spike biomass of 41%.
A fire simulation experiment with a factorial design was used to assess three factors
considered important for postfire grasstree leaf growth in banksia woodland: water,
ash and shade. While results identified that ash and reduced shade significantly

iv
affect leaf growth, their effects were small compared with the stimulation derived
solely from leaf removal by fire, simulated in this experiment by clipping. Clipping,
also used to simulate herbivory, was imposed on a series of grasstrees at different
frequencies. X. preissii demonstrated a strong capacity to recover in both jarrah
forest and banksia woodland, even after clipping every month for 16 months. Starch
reserves were depleted as the result of clipping, providing a cause of the eventual
deterioration of grasstree ‘health’ associated with chronic herbivory. The similarity
of growth responses to leaf removal independent of the mechanism (eg. fire or
herbivory), provided reason to question the interpretation that grasstrees are
essentially adapted to fire, rather than the alternative, that they are adapted to
herbivory.

v
AcknowledgmentsWithout the help of many people and organisations the research contained within
this thesis would not have been possible. Therefore, I must thank:
Prof. Byron Lamont, for not only reintroducing me to botany, but for generously
providing an undying source of guidance, expertise, support and good conversation
from start to finish.
The postgraduate student contingent at Environmental Biology for an assortment of
reasons, including their support, friendship and brewing tips. Particular thanks to
Roy Wittkuhn for being a sympathiser to the highs and lows of grasstree research,
for acting as a regular sounding board, and for easing the burden of fieldwork:
keeping busy at least half of the tick and fly population at Yanchep and Mundaring.
This work was funded by the Australian Research Council and the Department of
Conservation and Land Management. Special thanks to Dave Ward (Como) for his
time and effort applying the leafbase banding technique and the holistic perspective
he brought to the grasstree project. Many thanks to Brian Inglis (Wanneroo), Ken
Borland (Wanneroo), Barry Hooper (Mundaring), and the rest of the crew from
CALM Wanneroo who provided a stream of help with vehicle support, equipment
use, burning assistance and carting water. Also, thanks to Matt Williams (Como) for
his expert guidance through the world of statistical modelling.
Members of the ‘Grasstree Project Group’ for their contributions, including, Dr.
Perry Swanborough for his help in clipping, collecting and counting grasstree
leaves, and Wendy Colangelo who also counted more leaves than she probably
would have liked to.
The staff at Environmental Biology for their assistance and good company. Special
thanks to Lydia Kupsky for honing my histology skills, Peter Mioduszewski for help
in the field, and Charles Lacoste for his time and expertise with everything
electrical.
Dr. Ritu Gupta for providing statistical support on many occasions.
Lastly, thanks to my parents Yarra and Luda, and both immediate and extended
family for their encouragement and interest in my work. I specifically thank my wife
Meredith who often experienced first hand the roller-coaster ride associated with
postgraduate research. In addition to rescuing my sanity every so often by dragging
me away to relax, I attribute her unwavering support, patience and assistance both in
and out of the field, and during the slow task of writing, to my accomplishment.

vi
Contents
Declaration..................................................................................................... i
Abstract.......................................................................................................... ii
Acknowledgments.......................................................................................... v
Contents ......................................................................................................... vi
CHAPTER 1
General Introduction .......................................................... 11.1 The mediterranean climate of southern Australia .....................11.1.1 The mediterranean climate and its influence on plant growth ............... 21.1.2 Fire in mediterranean Australia ............................................................ 31.1.2.1 Plant responses to fire.............................................................................................4
1.2 Grasstrees and their evolution, taxonomy anddistribution...............................................................................6
1.2.1 Grasstree growth and response to fire ................................................... 8
1.3 The leafbase banding technique ...............................................9
1.4 Validating the leafbase banding technique .............................10
1.5 Purpose of my thesis ..............................................................11
1.6 Field sites: jarrah forest and banksia woodland ......................13
CHAPTER 2
Vegetative growth phenology of Xanthorrhoeapreissii ..................................................................................18
2.1 Introduction ...........................................................................18
2.2 Materials and methods ...........................................................242.2.1 Study sites .......................................................................................... 242.2.2 Direct measurement of leaf production and elongation ....................... 252.2.3 Indirect measurement of leaf production............................................. 282.2.4 Root growth ....................................................................................... 282.2.5 Grasstree water relations .................................................................... 312.2.5.1 Seasonal water potentials...................................................................................... 312.2.5.2 Response to simulated summer rain...................................................................... 322.2.6 Statistical analyses.............................................................................. 33
2.3 Results ...................................................................................342.3.1 Direct measurement of leaf production, elongation and death............. 342.3.1.1 Seasonal patterns of leaf production ..................................................................... 342.3.1.2 Seasonal patterns of leaf elongation and death ...................................................... 45
vii
2.3.2 Root growth ....................................................................................... 472.3.3 Grasstree water relations .................................................................... 512.3.3.1 Seasonal water potentials...................................................................................... 512.3.3.2 Response to simulated summer rain...................................................................... 522.3.4 Indirect measurement of leaf production............................................. 54
2.4 Discussion .............................................................................552.4.1 The switch in growth phase between two seasonally-distinct
periods of the year .............................................................................. 572.4.2 The role of temperature in the possible origin of grasstree
phenology........................................................................................... 612.4.3 The importance of water availability .................................................. 652.4.4 Verification of the grasstree ageing and fire history technique............ 69
CHAPTER 3
Effect of fire on grasstree growth......................................713.1 Introduction ...........................................................................71
3.2 Materials and methods ...........................................................783.2.1 Study sites .......................................................................................... 783.2.2 Direct measurements of leaf production, elongation and death ........... 793.2.2.1 The relationship between stem circumference and leaf production........................ 793.2.2.2 Direct measurement of leaf production and elongation ......................................... 803.2.3 Root growth ....................................................................................... 813.2.4 Postfire xylem water potentials........................................................... 823.2.5 Stored energy ..................................................................................... 823.2.5.1 Use of stored energy following fire....................................................................... 833.2.6 Statistical analyses.............................................................................. 84
3.3 Results ...................................................................................853.3.1 Direct measurement of leaf production, elongation and death............. 853.3.1.1 Relationship between stem circumference and leaf production:
standardising leaf production to compensate for large stem circumference............ 853.3.1.2 The effect of fire on leaf production ..................................................................... 863.3.1.3 The effect of fire on leaf elongation and death ...................................................... 893.3.2 Root growth ....................................................................................... 923.3.3 Postfire water status............................................................................ 953.3.4 Stored energy and its use following fire.............................................. 96
3.4 Discussion ...........................................................................1003.4.1 Rapid commencement and the extent of postfire leaf growth.............1003.4.2 Commencement of postfire growth: what happens below
ground? .............................................................................................1033.4.3 The dependence of the effect of fire on habitat and season of
burn...................................................................................................1053.4.4 The carbon cost of resprouting following fire ....................................109

viii
CHAPTER 4
Reproduction in X. preissii and its associated costs.......1124.1 Introduction .........................................................................112
4.2 Materials and methods .........................................................1174.2.1 Effect of reproduction on leaf production, leaf mass and water
relations.............................................................................................1174.2.1.1 Leaf production and inflorescence elongation and the phase of reproduction ...... 1184.2.1.2 Leaf mass and water relations............................................................................. 1184.2.1.3 Testing the effect of insecticide on leaf production and growth........................... 1184.2.2 Effect of season of burn on inflorescence and seed biomass ..............1194.2.3 Effect of reproduction on caudex starch reserves ...............................1194.2.4 Experiment 1: The effect of leaf removal following reproduction
on further leaf production ..................................................................1204.2.5 Experiment 2: The relative significance of grasstree energy
sources to inflorescence production ...................................................1214.2.6 Statistical analysis .............................................................................125
4.3 Results .................................................................................1264.3.1 Leaf and Inflorescence growth...........................................................1264.3.2 Water relations ..................................................................................1294.3.3 Testing the effect of insecticide on leaf production and growth .........1304.3.4 Effect of season of burn on inflorescence and seed biomass ..............1334.3.5 Effect of reproduction on caudex starch reserves ...............................1334.3.6 Experiment 1: The effect of leaf removal following reproduction
on further leaf production ..................................................................1344.3.7 Experiment 2: Determining the relative significance of grasstree
energy sources to inflorescence production........................................135
4.4 Discussion ...........................................................................1394.4.1 Experiment 2: the importance of three carbon sources to
reproduction ......................................................................................143
CHAPTER 5
Environmental causes of grasstree recovery afterfire, and the carbon cost of herbivory: investigationthrough two simulation experiments ..............................146
5.1 Introduction .........................................................................146
5.2 Materials and methods .........................................................1535.2.1 Experiment field sites ........................................................................1535.2.1.1 Experiment 1: Simulating three environmental factors considered to
characterise postfire banksia woodland............................................................... 1535.2.1.2 Estimating canopy cover in grasstree habitat....................................................... 1595.2.2 Experiment 2: Effect of simulated herbivory on the resprouting
performance and starch reserves of X. preissii ...................................159

ix
5.2.3 Statistical analyses.............................................................................161
5.3 Results .................................................................................1635.3.1 Experiment 1: Simulating three environmental factors
considered to characterise postfire banksia woodland ........................1635.3.1.1 Confirming treatments effects............................................................................. 1635.3.1.2 The effect of water, ash and shade on grasstree biomass and leaf production ...... 1665.3.2 Estimating canopy cover in grasstree habitat .....................................1685.3.3 Experiment 2: Effect of herbivory frequency on the resprouting
performance and starch reserves of X. preissii ...................................169
5.4 Discussion ...........................................................................1745.4.1 Causes of postfire crown vigour ........................................................1745.4.2 Grasstree resilience to frequent herbivore damage.............................1785.4.3 Is rapid leaf growth response to crown damage of X. preissii an
adaptation to fire or herbivory?..........................................................182
CHAPTER 6
Synthesis............................................................................1856.1 Relevance of the results to the banding technique ................1886.1.1 Seasonality of band colour.................................................................1886.1.2 Fire effects and banding patterns .......................................................190
6.2 Extension of the leafbase banding technique andimplications for further research on grasstrees .....................191
6.2.1 The leafbase banding technique.........................................................1916.2.2 Other areas requiring further research................................................192
REFERENCES ........................................................................................194

Chapter 1 1
CHAPTER 1
General Introduction
1.1 The mediterranean climate of southern Australia
Prior to the separation of Australia from Antarctica the present day mediterranean region
of Australia was located at latitude 60˚ S (Specht & Dettmann 1995), well below the
current location of Tasmania. It is generally accepted that 65 million years before
present (BP) mean temperatures were 5–10 ˚C warmer and the climate was generally
more humid with wetter seasons than the present (Specht 1973, Smith 1986, Flannery
1994, Specht & Dettmann 1995, Friend et al. 2001). The climatic changes resulting from
the separation of these continents, with Australia's northerly drift, no doubt had a major
impact on the Australian flora. Some believe that the major climatic changes that took
place after the breakup of the supercontinent were such that much of the Gondwanan
flora did not survive (Crocker & Wood 1947). Flannery (1994) considers that the
ensuing trend of global cooling was delicately balanced by Australia's gradual drift
towards the tropics, acting as a great stabilising influence on the continent. He suggests
that this synchronism provided a thermally stable environment over millions of years for
the existing flora to diversify, gradually adapting and radiating into the expanding arid
zones. Complementing climate stability, 200 million years of relative physical stability
of much of southwestern Australia, due to the absence of glaciation and major mountain
building and lack of extensive submergence below sea level, is thought to have provided
unparalleled opportunities for the persistence of relic taxa (Hopper et al. 1996). The
current highly sclerophyllous flora of southern Australia most likely arose from the more
xeric species that were able to cope with increasing seasonal water stress (Lamont et al.
2002) experienced on the edge of their former Gondwanan distribution, as periods of
aridity became frequent on the continent. The start of this aridity has been placed in the
late Tertiary (Kemp 1981, Specht & Dettmann 1995, Hopper et al. 1996, Kershaw et al.
2002).
Chapter 1 2
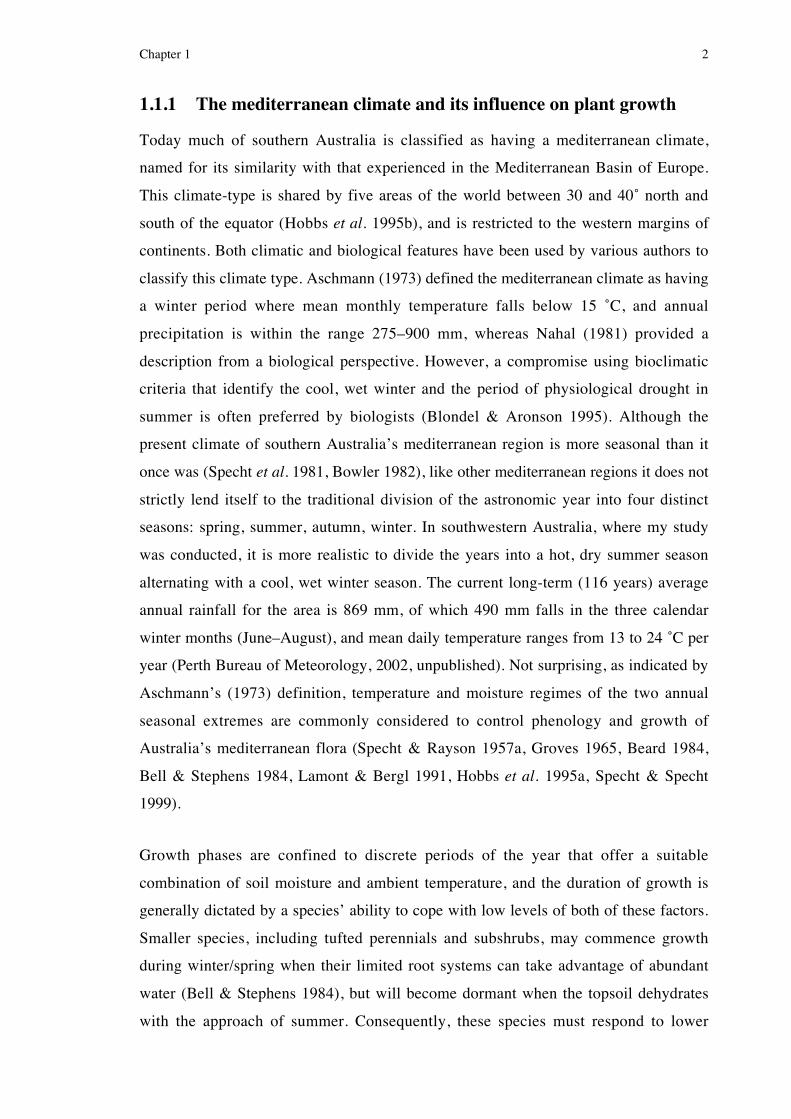
1.1.1 The mediterranean climate and its influence on plant growth
Today much of southern Australia is classified as having a mediterranean climate,
named for its similarity with that experienced in the Mediterranean Basin of Europe.
This climate-type is shared by five areas of the world between 30 and 40˚ north and
south of the equator (Hobbs et al. 1995b), and is restricted to the western margins of
continents. Both climatic and biological features have been used by various authors to
classify this climate type. Aschmann (1973) defined the mediterranean climate as having
a winter period where mean monthly temperature falls below 15 ˚C, and annual
precipitation is within the range 275–900 mm, whereas Nahal (1981) provided a
description from a biological perspective. However, a compromise using bioclimatic
criteria that identify the cool, wet winter and the period of physiological drought in
summer is often preferred by biologists (Blondel & Aronson 1995). Although the
present climate of southern Australia’s mediterranean region is more seasonal than it
once was (Specht et al. 1981, Bowler 1982), like other mediterranean regions it does not
strictly lend itself to the traditional division of the astronomic year into four distinct
seasons: spring, summer, autumn, winter. In southwestern Australia, where my study
was conducted, it is more realistic to divide the years into a hot, dry summer season
alternating with a cool, wet winter season. The current long-term (116 years) average
annual rainfall for the area is 869 mm, of which 490 mm falls in the three calendar
winter months (June–August), and mean daily temperature ranges from 13 to 24 ˚C per
year (Perth Bureau of Meteorology, 2002, unpublished). Not surprising, as indicated by
Aschmann’s (1973) definition, temperature and moisture regimes of the two annual
seasonal extremes are commonly considered to control phenology and growth of
Australia’s mediterranean flora (Specht & Rayson 1957a, Groves 1965, Beard 1984,
Bell & Stephens 1984, Lamont & Bergl 1991, Hobbs et al. 1995a, Specht & Specht
1999).
Growth phases are confined to discrete periods of the year that offer a suitable
combination of soil moisture and ambient temperature, and the duration of growth is
generally dictated by a species’ ability to cope with low levels of both of these factors.
Smaller species, including tufted perennials and subshrubs, may commence growth
during winter/spring when their limited root systems can take advantage of abundant
water (Bell & Stephens 1984), but will become dormant when the topsoil dehydrates
with the approach of summer. Consequently, these species must respond to lower

Chapter 1 3
temperatures at the beginning of their growing season compared with the larger,
spring/summer growing shrubs and trees that favour higher temperatures for growth and
can attain sufficient water from lower soil horizons (Specht et al. 1981, Bell & Stephens
1984, Lamont & Bergl 1991, Pate et al. 1998). While water is widely accepted as of
primary importance to plant growth in Mediterranean-type ecosystems (Miller 1983,
Orshan 1983, Beard 1984, Lamont & Bergl 1991, Larcher 2000), in Australia some
debate surrounds the evolutionary significance of plant temperature minima and maxima
in determining growth phenology (Groves 1978, Specht et al. 1981, Bell & Stephens
1984, Specht & Dettmann 1995).
1.1.2 Fire in mediterranean Australia
Australia’s shift to aridity and greater climatic variability was accompanied by an
increase in fire frequency (Kemp 1981, Martin 1990, Kershaw et al. 2002). The
culmination of climatic changes has equated to most of Australia being susceptible to
fire, aside from the north-eastern pockets of tropical rainforest, where high relative
humidity is the primary suppressant (Francis 1981) and the temperate rainforest in the
south-east that is strongly influenced by the Antarctic climate pattern (Gill 1975). In
mediterranean Australia, the combination of flammable, dry sclerophyllous vegetation,
rapid fuel accumulation, annual summer drought, high temperatures and periods of hot
dry winds encourage the frequent occurrence of fire (see Christensen et al. 1981 for
detail). Palaeoecological studies have indicated that fire has been an important feature of
mediterranean regions of Australia since at least 5,000 years BP (Dodson 2000, Dodson
2001a, Thomas et al. 2001). In south-eastern Australia, palynological evidence shows an
increase in the diversity of fire ephemerals and a decrease in fire-sensitive species, in
conjunction with increases in the frequency of carbonised particles around 4,000 years
ago, suggesting rising pressure from fire (Thomas et al. 2001). However, abundant fine
charcoal from sediment samples has indicated that fire was a feature of the Australian
landscape prior to this time, during the upper Tertiary, and therefore was obviously the
result of natural ignitions (predominantly lightning strikes) and not humans (Dodson
2001b), who entered Australia up to 60,000 years ago (Roberts et al. 1990, Flannery
1994, Hopper et al. 1996).

Chapter 1 4
Australian Aboriginal use of fire is a topic of much controversy (Flannery 1994; Horton
2000), and to a lesser extent, the effect of European settlement on fire frequency. Several
authors have alluded to an increase in fire frequency since European settlement of
Australia (Gill & Groves 1981, Shea et al. 1981, Curtis 1998), yet a new method for
reconstructing fire history points to the reverse (Ward et al. 2001): a trend consistent
with conjecture by Burrows et al. (1995) of frequent, low-intensity, fires dominating the
fire regime of pre-European jarrah forest in southwestern Australia.
1.1.2.1 Plant responses to fire
Fire is responsible for one of the most rapid and dramatic, physical and chemical
changes that an environment can experience (see Jeffrey 1987 for a list of changes). It
has the capacity to impact every level of an ecosystem, from microscopic to landscape
scales (Christensen & Muller 1975, Gill 1993, Whelan 1995, Phillips et al. 2000). This
translates into a broad array of interwoven factors potentially contributing to an equally
diverse number of fire effects observed among the biotic components that persist within
these environments. Intimate relationships exist between the life histories of the
Australian biota and the passage of fire, reflecting the relatively long association
between them.
A fundamental distinction between plant species on the basis of their response to fire is
represented by their classification as either (re)sprouters or nonsprouters (seeders). This
has been criticised by Humphrey (1974) as too crude, and improvements have been
suggested by Gill (1981a). However, this simple scheme still holds considerable value
among ecologists when discussing the flora of fire-prone environments, as evidenced by
its continued use. Within the field of forestry the term ‘sprouting’ has been used
exclusively to describe the process whereby a tree develops secondary replacement
trunks (del Tredici 2001), but I prefer the broader definition that includes the means by
which individuals of any resprouting species re-establishes after fire (Bell 2001).
The distinction between these two groups is likely to reflect a difference in evolutionary
history. A long period free from fire is thought to have been important in the evolution
of the nonsprouting, obligate seeding species (Keeley & Zedler 1978) during the
Quaternary (Verdu 2000). In contrast, sprouting is considered an adaptive strategy to

Chapter 1 5
recurring fire (Biswell 1974), and evolved sometime earlier during the Tertiary (Verdu
2000). The disparate fire frequencies to which these two plant groups have evolved
poses a problem for management authorities designing prescribed burning programs for
areas where both groups are represented. Other components of the fire regime, such as
fire intensity and timing, can add further variability to plant-fire responses, complicating
management programs and research in this area, where this variability is commonly
ignored (Keeley & Bond 2001). Under a particular fire regime a species may respond in
one direction; however, change just one element of that regime and the response can be
quite different (Bradstock et al. 1998, Mcloughlin 1998, Vlok & Yeaton 2000). For
example, Bell et al. (1987) demonstrated how two obligatory reseeding species (Hakea
obliqua and Beaufortia elegans) growing 170 km north of Perth, Western Australia re-
established successfully following autumn fire, yet were considerably less efficient in re-
establishing after spring fire, possibly to the detriment of the species’ future distribution
in that area.
The variation in plant response to differing fire regimes emphasises the potential power
of fire as a management tool, further supported by its long-lasting effect on a variety of
natural landscapes, including heathland, woodland, forest and grassland (Gill & Groves
1981, Batek et al. 1999, Bowman et al. 2001). Suitable fire regimes can rejuvenate
natural environments by maintaining long-term age structure and vegetation mosaics,
promoting both species and habitat diversity (Catling & Newsome 1981, Yibarbuk et al.
2001). But caution must be applied, as an inappropriate fire regime may deleteriously
alter an environment, preventing management objectives for wildlife and productivity
(Tiedemann et al. 2000). Without specific, extensive research into the effect of fire, the
prospect of identifying and implementing a suitable fire regime for a particular
environment is remote.
An alternative approach is to guide management using information about past fire
history (Cissel et al. 1999). The chronological length of recorded fire histories provided
by early immigrants and settlers is often short or sketchy, possibly offering misleading
observations (Tiedemann et al. 2000). And limitations of methods such as tree-ring
counting and fire-scar evidence can prevent an accurate and definitive reconstruction of
fire history (Burrows et al. 1995, Baker & Ehle 2001). However, recently Ward et al.
(2001) described a novel method of aging grasstrees and determining their fire history,

Chapter 1 6
inspired by the earlier work of Lamont and Downes (1979). As many new techniques are
open to question, Ward et al. (2001) offer a brief validation of this technique (see below
for more details) and demonstrate its application. The widespread application of the
technique holds great promise for revealing the fire history that has shaped the
Australian vegetation prior to European settlement, and may offer important insights to
assist in decision-making regarding its future.
1.2 Grasstrees and their evolution, taxonomy anddistribution
Balga, beluc, pol (pron. borl), blackboy, yacca, kangaroo tail and grasstree are
synonymous with the conspicuous, often tree-like, monocotyledon species in the genus
Xanthorrhoea, family Xanthorrhoeaceae (Herbert 1920, Nature Advisory Service 1974,
Beard 1976, Gill & Ingwersen 1976, Missingham 1978, Clifford 1983, Staff 1989). The
derivation of these names stem from aboriginal (nyoongar), colloquial and contemporary
origins, but it is the abundance of alternative names that collectively demonstrate the
long-standing awareness that the Australian human population has of this genus. This is
by no means surprising given the unique and distinctive appearance of these endemic
plants, and their typical close association with the more habitable regions of southern
and eastern Australian bushland (excluding X. thorntonii from the dry interior).
Fossil evidence holds little value for revealing the evolutionary pathways of the
monocotyledons, and similarities between different extant groups have been more
successfully used for this purpose (Dahlgren et al. 1985). Although opposing views exist
(eg. Burger 1981), it is widely considered that the monocotyledons derive from an early
dicotyledonous ancestor. Deciding upon the origin or primitiveness of the grasstrees
specific to the genus Xanthorrhoea is a problem far greater in magnitude. The order
Asparagales, to which this genus belongs, is diverse in habit, that authors such as
Dahlgren et al. (1985) attribute to a period of pronounced differentiation near the
beginning of the Tertiary. In the other direction, convergent evolution has aided in
confused our understanding of the relationships of descent between the members of this
order. The thick trunk and rosette growth habit of many Xanthorrhoea species appear to
have evolved independently in several different lines, including Dracaenaceae
(Dracaena spp.) and Agavaceae (several genera). Even within the family

Chapter 1 7
Xanthorrhoeaceae relatedness between Xanthorrhoea spp., Dasypogon spp. and Kingia
australis has been debated (Bedford et al. 1986). More recently, in the light of
significant new anatomical and molecular data, Rudall and Chase (1996) showed that the
original family, Xanthorrhoeaceae, consisted of a polyphyletic assemblage, and
proposed that the 10 genera be redistributed into three families, with Xanthorrhoea
isolated in the monotypic family Xanthorrhoeaceae. Lowe (1961) places the family
Xanthorrhoeaceae slightly below the world average advancement index for
monocotyledons, but above that of the Liliaceae. The overall impression is that this is an
‘old’ family of flowering plants but actual evidence is lacking.
In Western Australia, Xanthorrhoea preissii is the most common species, although it can
be mistaken for a number of other species in the genus. Adding to this potential
confusion is the contentious issue of grasstree classification, both the placement of the
genus at family level (Staff & Waterhouse 1981, Bedford et al. 1986, Rudall & Chase
1996) and the definition of species (Lee 1966). Novel approaches to resolve this issue
have been tried, including the examination of the chemical constituents of resins from
different grasstree species (Birch & Dahl 1974). An intensive collecting program aimed
at refining the differences between a number of species variants in eastern Australia
revealed that the amount of variation within recognised groups of Xanthorrhoea tended
to blur the accepted boundaries that were used to separate them (Lee 1966). Conclusions
drawn suggested that the intergradation between species of Xanthorrhoea partly
reflected the variation associated with distribution, and hybridisation in areas where
species were cohabiting. In southwestern Australia, X. reflexa, originally considered a
separate species (Herbert 1920), is now considered synonymous with X. preissii
(Bedford et al. 1986). The distribution of this species is restricted to the more mesic
southwestern corner of Western Australia, which covers an area of 309,840 km2,
bounded by a line extending from Shark Bay on the north-western coastline to Point
Culver in the southeast (Beard 1990). Specifically, X. pressii is a common component of
various vegetation types including forests, woodlands and shrublands, existing on a
variety of soil types from Jurien Bay to the Albany region (Corrick & Fuhrer 1996).
Within this range, solitary individuals rarely occur and more often exist in groves.

Chapter 1 8
1.2.1 Grasstree growth and response to fire
Much of what is currently known about grasstrees describes their response to fire, as it is
during the postfire period that these plants experience their most dynamic and
‘intriguing’ vegetative and reproductive growth. Like other grasstrees, Xanthorrhoea
preissii is a classic example of a species that resprouts following fire; the blackened
stem is testament to its fire-resistance. Immediate survival of fire can be attributed to the
insulation of all vulnerable portions of the plant, consistent with the strategy used by
many palm species (McPherson & Williams 1998). A continuous, 5–9 cm thick layer of
dead leafbases cemented together by resin (Birch & Dahl 1974) shields the inner living
stem, and the shoot meristem is afforded protection by the densely packed, moist, young
leaves at the apex. The effectiveness of this foliar insulation is not only exemplified by
the survival of the meristem, but by the survival of many invertebrates that burrow deep
into the crown (Whelan et al. 1980). After the smoke has cleared grasstrees are one of
the first plants to commence recovery, resprouting rapidly from the apical meristem
(Specht & Rayson 1957a, Baird 1977, Bülow-Olsen et al. 1982, Gill 1993).
The great success of grasstrees in surviving fire is reflected in the ages that these plants
can achieve (Gill & Ingwersen 1976, Lamont & Downes 1979, Staff & Waterhouse
1981) and their success throughout their fire-prone distribution. An early estimation of
age by Lewis (1955) placed a young individual of X. australis at +6,000 years old,
which can only be considered as fanciful. A more realistic estimate of 375 years was
made using radiocarbon-dating of the oldest leafbases on a single specimen of X.
preissii, collected near Perth, Western Australia (Meagher 1974). Several plants of X.
australis suggested a range of ages between 50 and 350 years, based on a calculated
growth rate of 9 mm y–1 (Gill & Ingwersen 1976). The latter two results are certainly
more consistent with the annual vertical growth rate of 10–20 mm estimated for X.
preissii by Lamont and Downes (1979), using a technique that is supported by recent
research (Ward et al. 2001).
In addition to vegetative growth, grasstrees readily flower soon after fire. Disturbance
can sometimes induce flowering in plants. Unusual bursts of gregarious flowering have
been attributed to cyclone damage in a number of tropical rainforest species (Hopkins &
Graham 1987, Attiwill 1994). In more temperate environments the passage of fire can
stimulate similar flowering events in numerous plant species (Gill 1981a, van der

Chapter 1 9
Moezel et al. 1987). Of these, several are considered to be almost completely reliant on
fire for reproduction: various orchid species (Erickson 1951, Willis 1970), Xanthorrhoea
(Specht et al. 1958, Staff 1976, Baird 1977), and South African fire-lilies (Levyns 1966,
Martin 1966). However, while the majority flowers profusely after fire, they also flower
to a lesser extent during interfire periods (Gardner 1957, Black 1963, Martin 1966,
Howell et al. 1972, Baird 1977, van der Moezel et al. 1987). The long magnificent
grasstree inflorescence is similar among many of the species in this genus (X. australis,
Specht et al. 1958, X. johnsonii, Bülow-Olsen et al. 1982, X. fulva, Taylor et al. 1998).
In X. preissii, this consists of a smooth green peduncle, up to 1 m long, called the scape,
that supports the flower-bearing rachis (spike), 1–2 m long.
Not surprisingly, the spectacular flowering display initiated by a fire appears to have
attracted the most attention from biologists studying grasstrees (see references above in
addition to Lewis 1955, Gill & Ingwersen 1976, Staff 1976, Lamont & Downes 1979,
Gill 1993, Curtis 1998, Ward & Lamont 2000), yet no information exists on the impact
of this substantial reproductive effort on the individual. Similarly, while postfire growth
has been repeatedly observed and documented as rapid, for a number of grasstree
species, little detail is available about this response, leaving many questions unanswered:
how does this response compare with growth of unburnt plants? What is the duration of
the enhanced growth? How is postfire vegetative growth affected by subsequent
reproduction?
1.3 The leafbase banding technique
The leafbase banding technique, as it is known, derives its name from the patterning on
the grasstree stem, visible after the removal of surface charring caused by fire (Ward
1996, Ward & Sneeuwjagt 1999, Ward et al. 2001. Fig. 1.1). Comprised of persistent
dead leafbases, the surface of the grasstree stem shows a series of alternating, cream and
brown, parallel bands that traverse the longitudinal axis of the grasstree stem. Pairs of
the cream and brown bands have been equated with annual growth increments and offer
a chronological sequence from the base to the crown of the plant, in much the same way
as provided by the concentric growth rings of some trees. In addition to the cream and
brown bands, intermittent black bands are located along the stem, marking when the
oldest living leaves on the plant were burnt during fire (Ward et al. 2001). These two

Chapter 1 10
pieces of information combined can provide a fire history of grasstrees that may be
extrapolated to the surrounding environment.
Fig. 1.1 In this photograph of a section of grasstree stem (Xanthorrhoea preissii), the
colour patterning of leafbases is quite pronounced, after grinding has removed the 3–5
mm layer of charcoal. The seasonal bands are visible as the ‘tiger-like’ cream and
brown stripes perpendicular to the length of the stem, interrupted by two distinct black
fire bands (photograph courtesy of B. Lamont).
1.4 Validating the leafbase banding technique
The most recent work on grasstrees concerns X. preissii, and has focused on the
validation of the leafbase banding technique. The distinction of the bands on the basis of
colour has been confirmed (Burrows 1998), and the width of each pair of bands has been
shown to coincide with undulations in the grasstree stem beneath the protective covering
of leafbases, previously used by Lamont and Downes (1979) to age grasstrees (Ward et
al. 2001). Of importance, cream bands corresponded with the peaks, or the widest
sections of the stem, and the brown bands corresponded with the troughs, or the
narrowest sections of the stem, suggesting a possible seasonal basis for their colour
difference. In keeping with this, Tomlinson and Zimmermann (1969) note the
dependency of ‘cambium’ vigour, which contributes to anomalous secondary thickening
in Xanthorrhoea (Staff & Waterhouse 1981), on shoot vigour. Regular fluctuations in
the concentrations of nutrients in the cream and brown bands were also consistent with
Chapter 1 11
expected seasonal depositional patterns (ie. high in the fast-growing season and low in
the slow-growing season. Burrows 1998, Ward et al. 2001). Also, histological
investigations attributed differences in the concentrations of tannin cells, particularly in
the inner cortex, to the colour difference between the leafbases of the seasonal bands and
black fire bands (Colangelo et al. 2002).
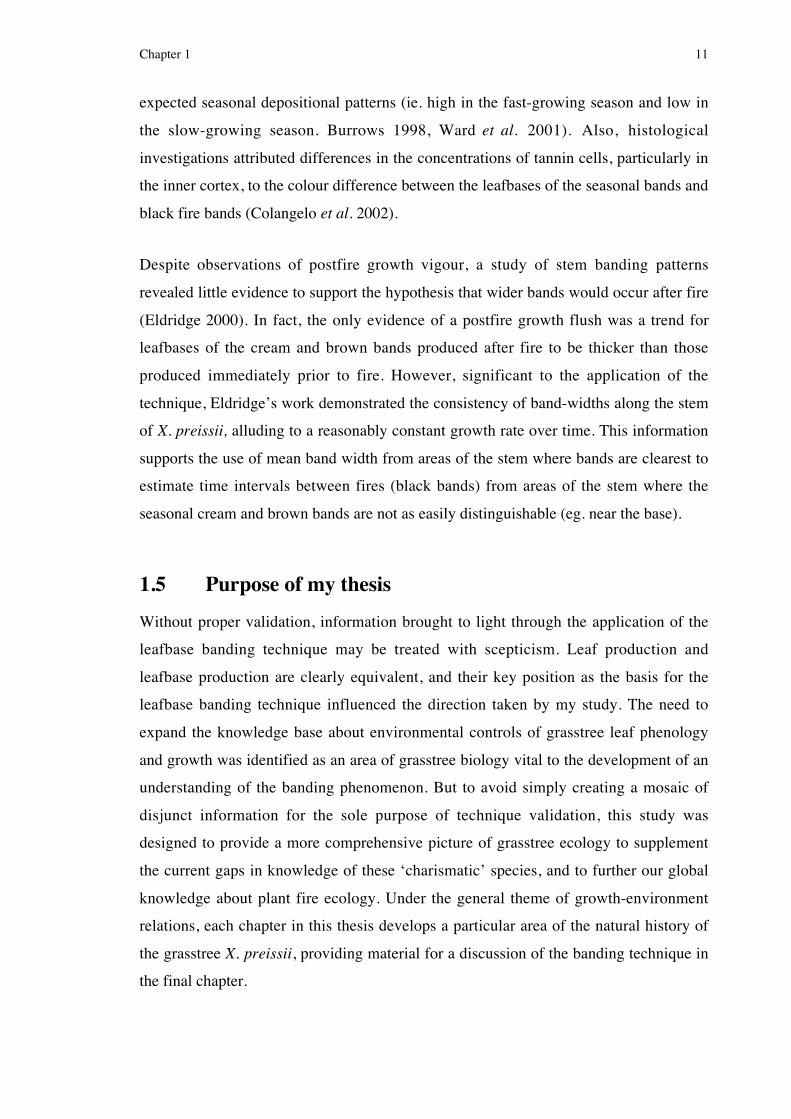
Despite observations of postfire growth vigour, a study of stem banding patterns
revealed little evidence to support the hypothesis that wider bands would occur after fire
(Eldridge 2000). In fact, the only evidence of a postfire growth flush was a trend for
leafbases of the cream and brown bands produced after fire to be thicker than those
produced immediately prior to fire. However, significant to the application of the
technique, Eldridge’s work demonstrated the consistency of band-widths along the stem
of X. preissii, alluding to a reasonably constant growth rate over time. This information
supports the use of mean band width from areas of the stem where bands are clearest to
estimate time intervals between fires (black bands) from areas of the stem where the
seasonal cream and brown bands are not as easily distinguishable (eg. near the base).
1.5 Purpose of my thesis
Without proper validation, information brought to light through the application of the
leafbase banding technique may be treated with scepticism. Leaf production and
leafbase production are clearly equivalent, and their key position as the basis for the
leafbase banding technique influenced the direction taken by my study. The need to
expand the knowledge base about environmental controls of grasstree leaf phenology
and growth was identified as an area of grasstree biology vital to the development of an
understanding of the banding phenomenon. But to avoid simply creating a mosaic of
disjunct information for the sole purpose of technique validation, this study was
designed to provide a more comprehensive picture of grasstree ecology to supplement
the current gaps in knowledge of these ‘charismatic’ species, and to further our global
knowledge about plant fire ecology. Under the general theme of growth-environment
relations, each chapter in this thesis develops a particular area of the natural history of
the grasstree X. preissii, providing material for a discussion of the banding technique in
the final chapter.

Chapter 1 12
Grasstrees persist under an array of factors dictated by their habitat and the regular
cycling of a seasonal climate, which in turn influences growth, both above and below
ground. Chapter 2 follows this line of investigation by examining the way climate
influences grasstrees in two contrasting habitats. Inevitably, the naturally fire-prone
habitats of X. preissii are eventually exposed to fire, the source of ignition by either
lightning or humans, triggering the well-documented recovery response. Using data
from unburnt grasstrees as controls, Chapter 3 examines the effect of prescribed burning
on grasstree growth, comparing season of burn and habitat as factors contributing to
crown regeneration. Also, in this chapter the role of reserved starch within the stem is
introduced as part of an investigation into how grasstrees manage resource costs
associated with growth. Chronologically, reproduction typically follows burning of
grasstrees, and is likely to represent an energetically costly period for these plants.
Chapter 4 considers these costs and discusses the results in relation to the timing of fire
and the significance of reproductive timing. Until Chapter 5 the discussion of grasstree
growth predominately focuses on the effect of abiotic elements like fire, not considering
the biotic component of its environment. Specifically, X. preissii forms an integral part
of the life history of many animals. While grasstrees play host to a wide array of
invertebrates and small vertebrates, offering shelter, protection against predators and fire
(Whelan et al. 1980), another suite of animals relies on these plants for sustenance
(McNee 1997, Shepherd et al. 1997). This chapter has two distinct parts; (a) factors
contributing to the ‘fire effect’ in X. preissii, and as alluded to, (b) the impact of
herbivory on X. preissii. The management of these seemingly disparate topics within the
same chapter was a deliberate tactic to contrast two possible environmental pressures
with their evolutionary significance to X. preissii during post-Gondwanan times. Finally,
after the implications of season, fire, reproduction and herbivory on grasstree growth are
thoroughly discussed, the concluding Chapter 6 concentrates on the topic that instigated
this study: validation of the leafbase banding technique. Information and interpretations
developed under each chapter are drawn upon to explore the relationship between
leafbase production and the formation of the distinct colour bands.

Chapter 1 13
1.6 Field sites: jarrah forest and banksia woodland
X. preissii is common throughout bushland adjacent to the Perth metropolitan area of
Western Australia. Because of this species’ ubiquity, it was possible to replicate much of
my work in two distinctly different environments, jarrah forest (Fig. 1.2a) and banksia
woodland (Fig. 1.2b), broadening the application of my results. Although the two
adjacent habitats share the same Mediterranean-type climate, their geology and
vegetation composition differ markedly. Jarrah forest is restricted to the Darling Range,
east of Perth, separated from the Swan Coastal Plain (location of banksia woodland) by
the steep Darling Scarp. The Darling Range undulates with crests reaching 280–320 m
and swampy valley floors some 50–100 m below (Churchward & Dimmock 1989). The
sandy and gravelly, ferruginous, jarrah forest soils are formed on a lateritic mantle, that
originated from deep and intensive weathering of the granite and granitic gneiss parent
rock (Churchward & Dimmock 1989). Banksia woodland sites studied fall on the
westerly boundary of the Bassendean Dune System on the Swan Coastal Plain (Bettenay
1984). In stark contrast to the Darling Range, this area was formed almost entirely of
depositional material originating from fluviatile or aeolian activity (McArthur &
Bettenay 1974), and characterised by low hills comprised of heavily leached, deep
siliceous sand. Globally the soils of both of these habitats are nutritionally impoverished,
due to a long history of weathering and leaching.
Although called jarrah forest (Eucalyptus marginata), the upper-storey canopy to a
height of 30 m (Marshall 1986) often contains a considerable number of marri trees,
Corymbia calophylla (syn. E. calophylla). Beneath this canopy is usually a well-defined
mid-storey often including Banksia grandis, Allocasuarina fraseriana and Persoonia
longifolia, and a dense ground cover of mainly leguminous and proteaceous woody
perennial shrubs (McArthur & Bettenay 1974, Bell & Heddle 1989). Generally lacking
the larger canopy tree species, banksia woodland has a more ‘scrubby’ appearance. B.
menziesii, B. attenuata, B. ilicifolia and Allocasuarina fraseriana commonly co-
dominate to a height of 10 m (Marshall 1986, Corrick & Fuhrer 1996), with a dense
understorey of sclerophyllous perennials (McArthur & Bettenay 1974), dominated by
Hakea, Dryandra and other Proteaceae species.
Chapter 1 14
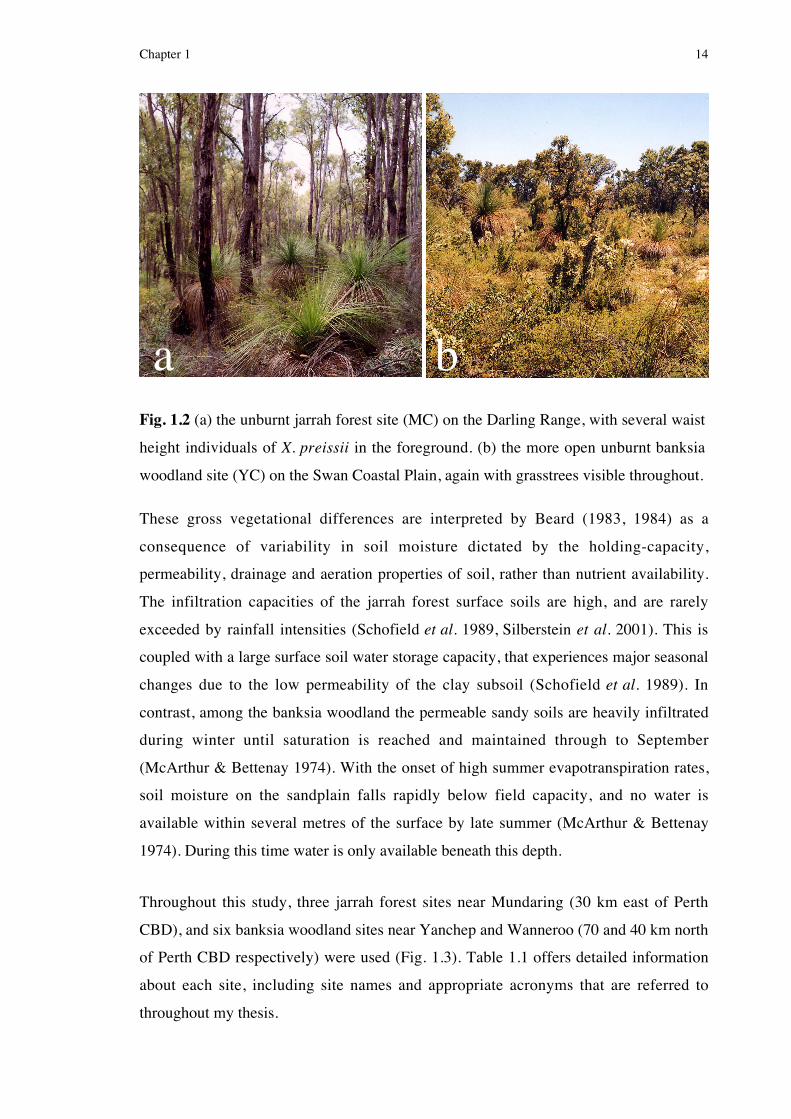
Fig. 1.2 (a) the unburnt jarrah forest site (MC) on the Darling Range, with several waist
height individuals of X. preissii in the foreground. (b) the more open unburnt banksia
woodland site (YC) on the Swan Coastal Plain, again with grasstrees visible throughout.
These gross vegetational differences are interpreted by Beard (1983, 1984) as a
consequence of variability in soil moisture dictated by the holding-capacity,
permeability, drainage and aeration properties of soil, rather than nutrient availability.
The infiltration capacities of the jarrah forest surface soils are high, and are rarely
exceeded by rainfall intensities (Schofield et al. 1989, Silberstein et al. 2001). This is
coupled with a large surface soil water storage capacity, that experiences major seasonal
changes due to the low permeability of the clay subsoil (Schofield et al. 1989). In
contrast, among the banksia woodland the permeable sandy soils are heavily infiltrated
during winter until saturation is reached and maintained through to September
(McArthur & Bettenay 1974). With the onset of high summer evapotranspiration rates,
soil moisture on the sandplain falls rapidly below field capacity, and no water is
available within several metres of the surface by late summer (McArthur & Bettenay
1974). During this time water is only available beneath this depth.
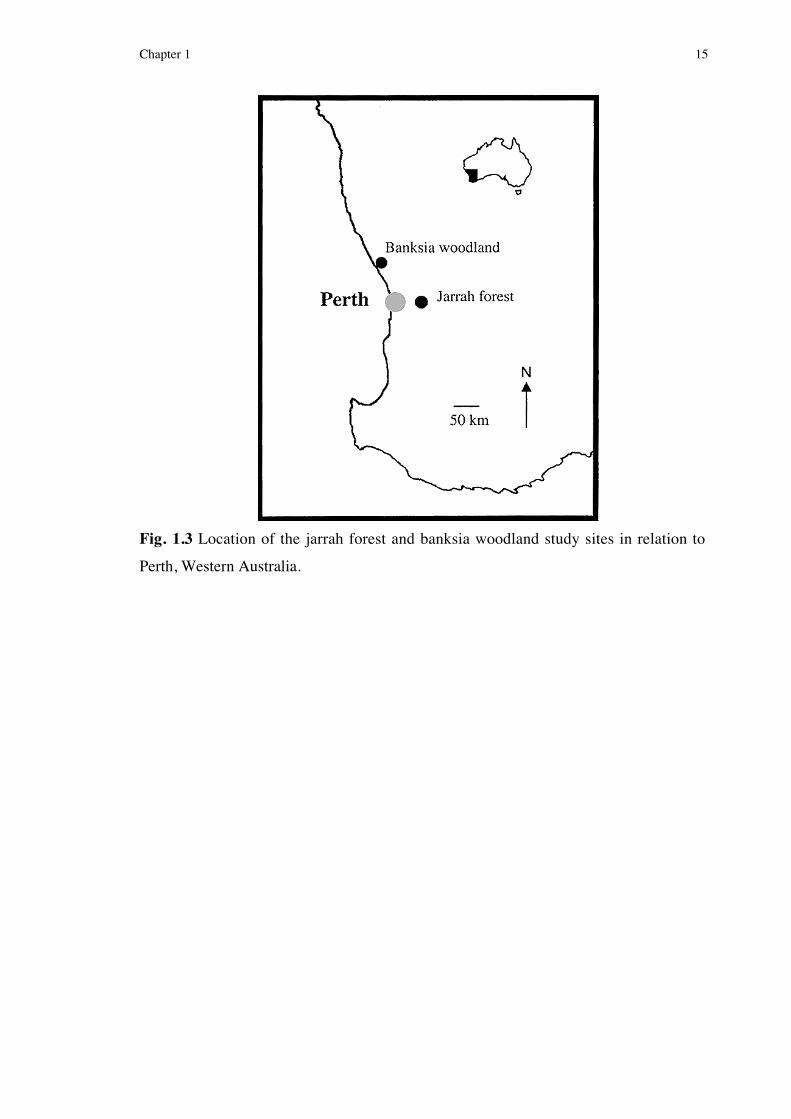
Throughout this study, three jarrah forest sites near Mundaring (30 km east of Perth
CBD), and six banksia woodland sites near Yanchep and Wanneroo (70 and 40 km north
of Perth CBD respectively) were used (Fig. 1.3). Table 1.1 offers detailed information
about each site, including site names and appropriate acronyms that are referred to
throughout my thesis.
a b
Chapter 1 15
Fig. 1.3 Location of the jarrah forest and banksia woodland study sites in relation to
Perth, Western Australia.

Table 1.1 List of all sites used during this study, indicating site name and acronym used in text, location, dominant vegetation
type, soil type and recent fire history. Mundaring sites (jarrah forest) are located on the Darling Range and all others (banksia
woodland) on the Swan Coastal Plain. Identifications were made using Marchant et al. (1987) and nomenclature follow
Paczkowska and Chapman (2000).
Dominant flora (in order of abundance)Site name(acronym used
in text)
Latitudelongitude
To Perth:bearing,distance Overstorey Understorey
Soiltype
Lastburnt
Mundaringcontrol (MC)
32˚ 00' 14.6" S116˚ 11' 10" E
102˚,31.4 km
Eucalyptus marginataCorymbia calophylla
Banksia grandis
Bossiaea aquifoliumMacrozamia riedlei
lateritic 1988
Mundaringspring burn(MSB98)
31˚ 59' 44.2" S116˚ 8' 17" E
102˚,26.8 km
Eucalyptus marginataCorymbia calophylla
Banksia grandis
Bossiaea aquifoliumXanthorrhoea gracilisHakea amplexicaulis
lateritic15 Oct1998
Mundaringautumn burn(MAB00)
32˚ 4' 29.8" S116˚ 5' 43" E
123˚,25.8 km
Eucalyptus marginataCorymbia calophylla
Banksia grandis
Bossiaea aquifoliumHakea amplexicaulis
Acacia pulchellalateritic
29 May2000
Yanchepcontrol (YC)
31˚ 26' 19.4" S115˚ 38' 7.3" E
343˚,61.5 km
Banksia attenuataBanksia menziesiiBanksia ilicifolia
Eremaea fimbriataScholtzia involucrata
Hakea ruscifolia
leachedsand
1994
Yanchepspring burn(YSB98) �
31˚ 23' 9.2" S115˚ 35' 54" E
342˚,68.2 km
Banksia attenuataHakea prostrata
Conospermum triplinerviumDryandra lindleyana
leachedsand
28 Oct1998
Table 1.1 Continued over page.

Table 1.1 Continued from over page.
Dominant flora (in order of abundance)Site name(acronym used
in text)
Latitudelongitude
To Perth:bearing,distance Overstorey Understorey
Soiltype
Lastburnt
Wanneroospring burn(WSB99)
31˚ 35' 56.1" S115˚ 45' 42" E
350˚,41.0 km
Banksia attenuataBanksia menziesii
Allocasuarina fraseriana
Hibbertia hypericoidesHakea prostrata
Jacksonia sericea
leachedsand
4 Oct1999
Yanchepautumn burn(YAB99)
31˚ 26' 22.9" S115˚ 40' 57" E
347˚,60.0 km
Banksia attenuataBanksia menziesiiBanksia grandis
Hibbertia hypericoidesStirlingia latifolia
Petrophile macrostachya
leachedsand
22 April1999
Yanchepautumn burn 2(YAB00)
31˚ 25' 54.7" S115˚ 40' 23" E
346˚,61.1 km
Banksia attenuataBanksia menziesii
Conospermum triplinerviumPetrophile macrostachya
Eremaea pauciflora
leachedsand
24 May2000
Yanchep firesimulationexperiment(YFSE) �
31˚ 23' 9.2" S115˚ 35' 54" E
342˚,68.2 km
As for YSB98 As for YSB98leached
sandc.10–15
years ago
� these sites were adjacent to each other, separated by a 6 m wide sand track.
Note: All sites had abundant Xanthorrhoea preissii, and therefore this species is not included in the vegetation descriptions. For
sites burnt prior to this study (October 1998) fire history information was retrieved from CALM (The Department of
Conservation and Land Management) records.

Chapter 2 18
CHAPTER 2
Vegetative growth phenology of Xanthorrhoea preissii
2.1 Introduction
Organisms invariably exhibit a natural growth rhythm reflecting their interaction with
both abiotic and biotic elements of their environment. Phenology refers to the timing of
recurring biological events (eg. growth phases and flowering). The challenge is to both
identify and explain factors that control the events, which characterise this rhythm.
Seasonality can be considered as a specific, and most common, determinant of
phenological timing, where groups of biotic and abiotic events are correlated with
definite periods of the calendar, or solar year (see Lieth 1974). Higher plants are well
represented among the available phenological studies, with particular emphasis on
agriculturally important species. Few studies have been conducted on natural vegetation
(Lieth 1974), and even less have considered both the above- and below-ground
components of vegetation.
In the mediterranean environments of southern Australia, vegetative growth phenology
varies considerably among the different growth forms (Specht et al. 1981, Bell &
Stephens 1984). Collectively, growth is usually restricted to a discrete portion of the
year by seasonal fluctuations of essential resources, such as light, water, nutrients and
temperature (Specht 1973, Specht & Brouwer 1975, Kummerow et al. 1981, Lamont &
Bergl 1991, Hobbs et al. 1995a). In my study, investigation was limited to the effect of
climatic variables to explain the annual growth pattern of Xanthorrhoea preissii. Broad
yet consistent patterns of annual growth phenology have been demonstrated for the flora
of Australia's Mediterranean-type regions (Specht & Rayson 1957a, Lamont 1976, Bell
& Stephens 1984, Lamont & Bergl 1991). The correlation between plant size and
phenology identified by Bell and Stephens (1984) during a study of kwongan (scrub-
heath) vegetation in southwestern Australia is a convenient generalisation of these
patterns. Winter/spring growing species are predominately tufted perennials and
subshrubs, spring growing species are low shrubs, and spring/summer growers consist of
the taller shrubs and small trees. These three patterns of growth conveniently correspond
with the three distinct divisions of the year under a mediterranean climate: winter, spring
and summer (Miller 1983). From the study by Bell and Stephens (1984) and others like

Chapter 2 19
it (eg. Specht et al. 1981) examples are available of mediterranean Australian plant
species growing in all months of the year. However, comparatively few studies exist for
the period of late summer/autumn when soil moisture deficits are high (Specht &
Rayson 1957a, Lamont 1981, Specht et al. 1981). One such study (Specht and Rayson
1957a) showed that for the large sclerophyllous species Banksia ornate in mediterranean
southeastern Australia the main growth flush occurred during summer, with a pattern of
continuous annual growth. Summer soil moisture under this community was concluded
to be just sufficient to maintain the vegetation in a dormant state, let alone support
vigorous growth (Specht 1957b). Since soil moisture was only measured to 2 m, within
which most roots were found (Specht & Rayson 1957b), Bettenay's (1984) suggestion
that summer growth is likely to be related to the amount of water stored in the
underlying substrate can not be ruled out.
Although the definition of the Mediterranean-type climate can vary depending on the
author (see Orshan 1983) it is accepted that growth is primarily limited by water (Miller
1983, Orshan 1983, Beard 1984, Lamont & Bergl 1991, Hobbs et al. 1995a, Larcher
2000). For the dominant sclerophyllous species, drought-tolerating adaptations permit
shoot growth during the typical spring/summer-growing season. These include extensive
medium to deep root systems, often involving a tap root and well developed laterals
(Dodd et al. 1984, Hobbs et al. 1995a). A wide range of shoot and leaf forms have been
adopted to cope with water stress, including structures promoting rainfall interception
and channelling (Specht 1957a, Nulsen et al. 1986), and unusual displays of leaf
dimorphism (Groom et al. 1994b). Similar physiological mechanisms abound.
Decreased stomatal conductance (Crombie et al. 1988) or complete stomatal closure
(Dunn 1975, Tenhunen et al. 1981) may regulate water loss, and osmotic adjustment
provides a means of maintaining turgor under drought conditions (Bowman & Roberts
1985, Richards & Lamont 1996). If periods of prolonged drought occur, water stress
exacerbated by excess heat loads will often force plants to cease growth and assume a
state of dormancy that conserves water and enhances survival until relief by sufficient
rainfall in late autumn.
Beard (1983) recognised three mediterranean regimes within the South West Botanical
Province of Western Australia, representing a progressive drying trend in a north-
easterly direction. However, unlike some mediterranean regions of the world where
Chapter 2 20
water is limiting nearly all year round, even in the Extra-dry Mediterranean regime
sufficient rainfall to relieve drought stress (300�500 mm annual rainfall, Beard 1983) is
usually experienced during a period of 4 or 5 months. When water is not restrictive,
growth can still only proceed as fast as permitted by the next most limiting factor. Of the
various climatic components, temperature is regularly cited as an important variable
limiting growth during either thermal extremes of the year, inhibiting growth in winter
and contributing to water stress in summer (Groves 1965, Orshan 1983, Specht & Specht
1999). The role of temperature in inducing and releasing species from forced winter
dormancy between these climatically-contrasting periods has also been identified (Perry
1971, Flint 1974, Kummerow et al. 1981). Growth requires higher temperatures than
photosynthesis, which has a very low temperature threshold (when CO2 uptake ceases)
coincident with ice formation in the mesophyll (Larcher 2000). In southern Californian
chaparral vegetation, growth of the dominant species is restricted when daily mean
temperatures fall below 10 ûC (Miller 1983), and similar low temperatures during the
winter months inhibit growth of the dominant species in the maquis-garrigue vegetation
in southern France (Specht 1969). Several studies of Australian mediterranean
environments have indicated that growth of the dominant tree and shrub species is
initiated when mean air temperature exceeds 16�18 ûC (Specht & Rayson 1957a, Groves
1965, Specht 1973, Specht et al. 1981). This minimum threshold is less (13 ûC and even
11 ûC) for subdominant and understorey heath species (Specht et al. 1981), which
generally have an earlier growing season.
Specht and colleagues have compiled evidence (Specht & Dettmann 1995, Specht &
Specht 1995, Specht & Specht 1999) suggesting that the overstorey species in
mediterranean Australia have undergone little change since the more humid and warmer
climate during the early Tertiary. As a consequence these species have retained a
subtropical (mesotherm) growth rhythm, exhibiting peak growth in late spring/summer.
However, the growth response of the understorey stratum has evolved more recently
becoming closely synchronised with the cool, humid winter-spring season of the
mediterranean climate (mircotherm) (Specht & Dettmann 1995). Specht and Dettmann
(1995) explain that the understorey species have compensated for a decrease in
environmental temperature by the evolution of a more intricate leaf distribution
structure. A reduction in leaf and internode size increases the stem-air boundary layer,
impeding heat dissipation and effectively raising the temperature of the growing apices

Chapter 2 21
by more than 5 ûC. Physiologically, understorey species respond to the same temperature
range as the overstorey. However, the increase in the boundary layer prematurely warms
the understorey species resulting in their earlier response to rising spring temperatures.
This interpretation lacks an explanation of the environmental pressures responsible for
the bias in the evolutionary reduction of leaf size towards understorey species. Dry
environments throughout the world experiencing high radiation and temperature loads,
such as Mediterranean-type ecosystems, have been repeatedly correlated with flora
exhibiting small leaf dimensions (Parkhurst & Loucks 1972, Grime 1979, Fahn 1990).
The processes of natural selection driving this reduction in leaf size has been attributed
to greater efficiency in convective heat loss by smaller leaves, preventing the disruption
of cell metabolism and general tissue damage due to excessive leaf temperatures
(Crawley 1986). Transpirational water loss can also increase with increasing leaf size
(Taylor 1975), as will usually be the case under a mediterranean climate (Miller 1983)
with its high summer-autumn temperatures. The greater boundary layer of leaves with
larger size dimensions contributes significantly to these relationships (Taylor 1975),
which contradicts Specht's reasoning. However, this counter argument does not consider
crown structure that is a crucial part of Specht's explanation.
Because of the marked resprouting response of grasstrees to fire most prior work has
concentrated on this aspect, with little literature on seasonal growth phenology in the
absence of fire. However, a few studies are available that offer clues to the likely growth
phenology of X. preissii. Continuous annual leaf growth of the Western Australian
grasstree Kingia australis (family Dasypogonaceae) has been documented (Lamont
1981). Annual fluctuations in stem diameter in X. preissii suggest seasonal changes in
growth, with most leaf development occurring during winter-spring (Lamont & Downes
1979). But, this information is not specific enough and lacks the essential detail to
thoroughly meet my aims. The main aim of my study was to determine the growth
rhythm of X. preissii independent of any recent disturbance by fire, and to do this in two
contrasting habitats so that the results may have wider application. For some time it has
been widely known that grasstrees exhibit slow stem elongation (Herbert 1920, Lewis
1955, Gill & Ingwersen 1976, Lamont & Downes 1979, Ward et al. 2001). Therefore,
the likely futility of completing a detailed assessment of X. preissii growth phenology
from stem elongation determined my study�s focus on leaf growth and production. To

Chapter 2 22
complement this work, root growth patterns were also investigated, thus providing a
complete picture of vegetative grasstree growth. Older grasstree roots existing
horizontally in the upper soil layers typically consist of a loose black sheath, remnant of
the originally fleshy cortex, encompassing the wiry stele, complete with intact and open
conducting vessels. The term stele used here has been described in greater detail, as
consisting of the actual stele surrounded by endodermis and then tightly bound by a
strong sheath of lignified fibres (Pate and Canny 1999). Young roots with an intact
fleshy cortex can elongate and are usually unbranched, and in older plants new rings of
roots are initiated progressively higher on the stem (Staff & Waterhouse 1981).
Previously, root growth rates and phenology in grasstrees has only been reported for the
species Kingia australis, which, unlike X. preissii, initiates roots from the stem apex
(Lamont 1981).
My aim was twofold: 1) to assist in verifying the grasstree ageing and fire history
technique (Ward et al. 2001), and 2) to identify the annual pattern of grasstree growth,
from which to later distinguish any effect of fire (Chapter 3). The ageing part of the
technique described by Ward et al. (2001) assumes that the alternating cream and brown
bands comprising the exposed ends of the leafbases represent seasonal changes in
growth. This implies X. preissii experiences two distinctive alternating phases of growth
during each year that control leafbase colour. Traditionally trees growing in extreme
conditions have been used for conventional dendroecological studies, as they respond
strongly to climatic variation (Fritts 1976), suggesting that the contrasting seasons of the
mediterranean climate may help interpret the banding pattern.
For the second part of my aim it was considered important to understand the underlying
phenophases that occur regularly with the changing seasons, which, would allow me to
make interpretations regarding the effect of fire on grasstree growth (see Chapter 3).
Only after the effects of everything except fire can be accounted for is it possible to
reasonably assess fire effects. Flint (1974) provides a comprehensive review of the
environmental factors that control phenological events including dormancy. His work
emphasises the controlling effect of temperature on the process of growth initiation
following winter, and photoperiod on the cessation of growth and induction of
dormancy. Although X. preissii was considered unlikely to experience a true period of
dormancy during summer drought or winter, a strong seasonal pattern of growth

Chapter 2 23
(Lamont & Downes 1979) could be viewed as an analogous phenomenon. On this basis,
strongly seasonal climatic variables such as temperature, rainfall and daylength were
considered as possible controls of grasstree growth. The extension of this study to
include an interpretation of the climatic variables that govern vegetative growth was
aimed at enhancing our level of understanding of grasstree phenology. The effect of
habitat type on these interpretations is also discussed.
Encompassing the two levels of my main aim, the following hypotheses were
investigated during this study:
1 ) The distinct summer and winter seasons of the mediterranean climate of
southwestern Australia dictate the strong bimodal pattern of annual growth in X.
preissii.
2 ) Seasonal changes in temperature and rainfall have the greatest control of
grasstree growth.
3) The number of leaves produced in one year equals the number of leafbases
contained in two adjacent cream and brown bands.

Chapter 2 24
2.2 Materials and methods
2.2.1 Study sites
Unburnt sites located in jarrah (Eucalyptus marginata) forest on the Darling Range
(MC; Fig. 1.2a) and banksia woodland on the Swan Coastal Plain (YC; Fig. 1.2b) were
studied. These two sites (Fig. 1.3) are described in Table 1.1. Temperature and rainfall
data were obtained from the Perth Bureau of Meteorology for Bickley, the closest
meteorological station to the jarrah forest sites. For the banksia woodland sites,
temperature data were obtained for Lancelin and rainfall data from Yanchep National
Park (Department of Conservation and Land Management, CALM) records. These data
are given in Figure 2.1. Additionally, daylength (the number of hours per day for
potential photosynthesis) and proportion cloud cover were obtained for the Bickley and
Lancelin weather stations and incident radiation was provided for the specific site
Fig. 2.1 Mean daily temperature and daily rainfall for the two habitats studied. Data
were obtained for the closest recording sites to the study area from the Bureau of
Meteorology and the Department of Conservation and Land Management (1998�2001.
See text for details).
b) banksia woodland
0
10
20
30
Oct Jan Apr Jul Oct Jan Apr Jul Oct Jan
Tem
pera
ture
(ûC
)
0
20
40
60
80
Rai
nfal
l (m
m)
1999 2000 2001
a) jarrah forest
0
10
20
30
Tem
pera
ture
(ûC
)
0
20
40
60
80
Rai
nfal
l (m
m)
Chapter 2 25
coordinates to assist in the interpretation of leaf growth. Global daily exposure to solar
radiation is an estimate based on satellite data, and is derived from physical modelling of
radiation transfer within the atmosphere (considering parameters such as cloud cover),
and offers 5�8% accuracy (Weymouth & Le Marshall 1999).
2.2.2 Direct measurement of leaf production and elongation
Monitoring of leaf production and elongation for Xanthorrhoea preissii commenced on
30 October 1998 in the jarrah forest and 5 November 1998 in the banksia woodland. At
each site, six specimens of X. preissii within the height range 0.8 to 1.25 m (a
convenient working height measured from the ground to the terminal apex) were
randomly selected from 100 grasstrees previously marked.
The leaves of X. preissii can be divided into four categories relative to their maturity: 1)
creamy white, recently emerged young leaves, 2) light green intermediate leaves not of
full length, 3) full length, dark green matured leaves, and 4) dry, brown dead leaves. For
each plant the three live leaf categories were tagged with a different coloured electrical
cable marker (Critchley Pty Ltd., Castle Hill, Australia) for identification (young = 1 of
11 colours indicating season of initiation, intermediate = orange, and mature = white;
Fig. 2.2). All juvenile leaves were tagged, counted and recorded as they became visible.
A representative sample of 60 intermediate leaves was tagged in two strips of 30 leaves
radiating out from the boundary of the previous leaf category to the boundary of the next
category. The mature leaves had two similar strips of 25 leaves tagged. In both cases the
two strips faced north and south and represented the range of leaf ages present in the
category.

Chapter 2 26
Fig. 2.2 A grasstree crown spread
open to reveal the coloured markers (2
mm long) used to tag newly initiated
leaves for monitoring leaf production.
Note the innermost red tags were
applied at the time of the photograph
and represent leaves initiated during
winter 1999, while the yellow tags in
the upper portion were used prior to
these to mark those leaves initiated in
the previous season, autumn 1999.
All sites were visited every 13�58 days, determined by the rate of leaf production. On
each visit all newly emerged young leaves at the apex of each grasstree were tagged with
the appropriate coloured cable marker and the total number recorded. The rate of leaf
progression from one category to the next was also recorded as a measure of rate of leaf
elongation, since leaf length is a primary characteristic used to distinguish the three live
leaf categories. Progression of young leaves into the intermediate category was
calculated by subtracting the number of young leaves remaining in that class from the
total number of young leaves tagged since time zero, taking into account the number of
young leaves progressing from the period before. Leaf maturation was determined on a
relative basis by counting the proportion of the original 60 orange-tagged intermediate
leaves progressing to the mature category, and adding a white tag to denote its progress.
For each leaf tagged white, one of the smallest new intermediate leaves was tagged
orange to retain the original number of 60. Age at maturity was calculated from the time
of initiation (identified by the colour of the young leaf marker present) of each
intermediate leaf that matured. Leaf mortality was measured in a similar way, by
counting the number of white-tagged mature leaves that died during each inter-visit

Chapter 2 27
period. As for the maturing leaves, the season of initiation was recorded for the dead
leaves (for the calculation of age at death) and an extra white tag applied to indicate that
it had been counted. In addition, total leaf death and total leaf production was compared
at each site (MC and YC). An additional four grasstrees at each site had their smallest
young leaves tagged so that all new leaves produced after one year (July 1999 to July
2000) could be counted. For the same plants a small amount of the youngest thatch was
removed in July 1999 so that after one-year, in July 2000, all leaves that had died could
be counted.
Rates of leaf production and leaf progression (≅ elongation) were calculated. Three
complementary approaches incorporating statistical and descriptive methods were used
to explain the relationship between seasonal patterns of leaf production and climatic
variables: 1) simple correlation and detailed description, 2) modelling and 3) a novel
approach introduced by Specht (1995) to define plant growth rhythms within Australia
as a function of temperature. All assumptions of the statistical tests used below were
met, including testing for autocorrelation using the Durbin-Watson test (Fry 1993), and
examination of residuals to ensure that the assumptions regarding homoscedasticity,
normality, linearity and outliers (univariate and multivariate) were adhered to. Statistical
analyses were performed using both Statistical Analysis System (SAS/STAT software,
SAS Institute, North Carolina, USA) and SPSS 10.0 (SPSS Inc., Chicago, U.S.A.)
software programs. Leaf production was systematically correlated with a number of
climatic variables (temperature, rainfall, incident radiation, daylength and proportion
cloud cover), revealing to which variables leaf production was most sensitive.
From these findings the two best-fit, biologically-meaningful, leaf production models
were determined for each habitat using multiple linear regression techniques. The first
predicted a full year of leaf production based on a single regression equation, while the
second incorporated two separate season-based regression equations to explain data of
the full year. The decision to build the second model was based on an attempt to
improve the coefficient of determination (r2) from the first model, by separately
modelling the distinct characteristics of the summer fast-growing season and the winter
slow-growing season, and combining the results. Where the interaction term "mean daily
temperature × total rainfall" was included in the regression model, the response surface
of temperature plotted against predicted leaf production for different rainfall amounts

Chapter 2 28
was used to interpret this effect. The relationship was tested for linearity using the Box-
Tidwell transformation (Hosmer & Lemeshow 1989) on each variable, to ensure it was
suitable to include in a linear regression. For annual leaf production predicted from the
two seasonal regression equations an overall r2 was calculated from the predicted and
actual leaf production data. Semi-partial correlations were calculated for the two single
regression models to determine the individual contribution made by each variable to
explain leaf production. The model's predictive power was estimated using the r2 PRESS
(predicted error sum of squares) statistic. This statistic is a more accurate estimate of the
predictive power of a model than r2 (which is specific to the data from which it was
created). As a final test of the predictive power of the jarrah forest regression models a
comparison was made between actual leaf production data collected over 273 days (not
used in creating either model), and leaf production values predicted from environmental
data using the two regressions.
2.2.3 Indirect measurement of leaf production
Another six randomly-selected grasstrees from the unburnt jarrah forest and banksia
woodland sites were used for the indirect assessment of annual leaf production. This
method involved the removal of all leaves, both dead and alive, and the identification of
the annual growth bands on the stem (Ward et al. 2001). Leaves were removed and
ground back to their bases using a 100 mm angle grinder powered from a four-stroke
petrol generator. Similarly, the charring on the leafbases left by past fires was removed
to reveal the colour of the leaf bases underneath, using the method described by Ward et
al. (2001). A count was then made (for the entire circumference) of the number of
leafbases contained in each of the two most recent, clearly identifiable, brown plus
cream growth bands. The mean of each pair of bands was used as an indirect measure of
annual leaf production for each grasstree selected. This count was compared with those
results from the direct approach and a two-way ANOVA was conducted to determine the
level of significance.
2.2.4 Root growth
To complement the above ground growth measurements, an effort was made to monitor
seasonal root growth activity. Due to the difficulty in penetrating the lateritic soils on the
Darling Range, the investigation of grasstree roots was conducted exclusively on the

Chapter 2 29
Swan Coastal Plain, where the sandy substrate was conducive to root excavation. From
June 1999 to January 2000 considerable problems using a method of repeated
excavation of the same roots over time were met, so a new strategy for measuring root
growth was implemented during 2000. Because the root system of X. preissii is quite
extensive (Crombie et al. 1988), the second method used sampling of random grasstrees
to collect data on the production of new roots, providing a general indicator of root
growth activity. Grasstree roots were sampled at the unburnt banksia woodland site
(YC), and on each occasion no fewer than five grasstrees were excavated, in an attempt
to sample a reasonable number of plants with new roots. Soil surrounding the stem of X.
preissii was removed to a depth of 20�30 cm, uncovering the shallowest roots. New
roots were consistently produced adjacent to the shallowest existing roots, and were
distinguished from these older roots by scratching the outer surface of all roots
encountered with a scalpel to examine the cortex. The cortex of older roots (dead, brown
and corky, or may have totally disintegrated leaving only the wiry stele) was quite
different from the cortex of young new roots (bright green, soft and fully hydrated).
Using this method of classification a count of the total number of new roots was made,
and at least half of these roots were completely excavated and excised close to the stem,
storing them in a cool bag during transportation. The length of each root was measured
and the condition of the growing tip was recorded for each root as one of three
categories of health: growing, dormant or rotten (Fig. 2.3). Roots were then washed in
water to remove sand particles, bagged and dried at 70 ûC for 60 hours or constant
weight to determine dry mass. This process was repeated once in each season of the year
spanning 2000 to 2001 (August, November, February and May). Small sample size did
not permit the use of chi-squared analysis to detect the effect of season on the
occurrence of new roots. For this reason the binomial test was used to determine if the
probability of X. preissii having new roots was enhanced or decreased in any particular
season from the overall expectation of 0.5. In addition, the percentage of grasstrees with
new roots and the proportion of new roots in each condition category were determined.
For the grasstrees that had new roots, mean estimated total root biomass (mean new root
dry mass ✕ number of new roots), mean number of roots per grasstree and mean root
size (g/cm) were calculated, and significance of differences between seasons was
determined using one-way ANOVA. The non-parametric Kruskal-Wallis test was used
to analyse the new root biomass data, as transformation did not allow the data to meet
the assumptions of ANOVA.

Chapter 2 30
Fig. 2.3 Condition of new root tips (from left to right): healthy, actively growing; slow
growing; dormant; and rotten with scale insects (seen as pink/white oval structures)
present. Fine graduations on the scale are millimetres.
From observations made at a recently excavated new housing estate (Ocean Keys),
within the northern suburbs of the Perth metropolitan area, it was possible to estimate
rooting depth of X. preissii on the Swan Coastal Plain. Following excavations at the
estate a group of grasstrees was left on the edge of the cleared land, and immediately
within the cleared area it was possible to locate grasstree roots (Fig. 2.4). From the
height difference between the original ground level where the living grasstrees existed
and the modified ground level where the roots were found it was possible to estimate the
depth grasstree roots could penetrate. To aid this estimation topographic maps and aerial
photographs of the area prior to ground works were consulted, courtesy of the
developer�s landscape architects (Hames Sharley, Subiaco).

Chapter 2 31
Fig. 2.4 a) X. preissii growing adjacent to earth excavations at a new housing
development site, with associated roots indicated in the foreground, 6.4 m vertically
below the surface. b) Close-up view reveals growth of these old decorticated roots down
through a hole in the limestone substrate (lens cap is 5 cm in diameter).
2.2.5 Grasstree water relations
2.2.5.1 Seasonal water potentials
Water potential (Ψ) was initially measured on each category of leaf (young, intermediate
and mature) on grasstrees on the Darling Range and Swan Coastal Plain, to determine if
leaf age significantly correlated with water potential. This preliminary work indicated a
difference between young leaf Ψ and intermediate and mature leaf Ψ, which was
attributed to the vertical aspect, self-shading and immaturity of the young leaves. From
this work, the intermediate leaf category was chosen for continued Ψ measurements, as
these leaves were neither young nor old, and constituted the majority of leaves on the
plant.
Xylem water potential (ΨX) was measured predawn (ΨPDX; just prior to sunrise) and
midday (ΨMDX; following 12 noon) for grasstrees at the same two sites used for leaf
growth monitoring. Measurements were made from 20 November 1998 to 5 June 2001
in the jarrah forest and from 24 November 1998 to 30 March 2000 in the banksia
a b

Chapter 2 32
woodland. The last 15 cm of one intermediate leaf (length restricted by the pressure
chamber dimensions) was collected from six grasstrees selected randomly from the
available plants, for measurement of ΨX using a pressure chamber (PMS Instrument
Company, Oregon, USA) as described by Scholander et al. (1965).
In order to assess the extent of summer water stress on X. preissii, water potential at
turgor loss point (ΨTLP) was determined for a sample of grasstrees at each site using the
method described by Tyree and Hammel (1972). One leaf tip (15 cm) was collected
from six randomly selected grasstrees predawn during mid-autumn (3 April 2000 for the
jarrah forest, and 30 March for the banksia woodland). The leaf was excised underwater
and then transferred to a sealed container, allowing the leaf to stand vertically in florist's
foam immersed in water in a darkened environment. The leaves were retained in this
state for 3 hours before an initial weighing (turgid weight) then subjected to gradual
drying under laboratory conditions. During the drying process, leaves were weighed
before and after the measurement of balancing pressure, using a pressure chamber. This
series of operations was repeated with short periods in between (< 3 minutes). The data
collected were used to calculate the mean water potential at turgor loss point, by plotting
relative water content (leaf weight / turgid weight) against the inverse of the balancing
pressure.
2.2.5.2 Response to simulated summer rain
Leaf production and ΨX was measured for six unburnt randomly-selected grasstrees
from the banksia woodland (YC) before and after a single watering treatment, equivalent
to 59.2 mm of rain within a 2.5 m radius of the stem. This amount of water represents
about 3/4 of the highest single rainfall event recorded for Lancelin (78.6 mm) during
April, and almost twice as much as the mean size of a single April rainfall event (32.1
mm; Bureau of Meteorology). On 20 April 2001 ground water collected and stored (by
CALM, for fire fighting) at a site within 5 km of YC was transported to YC using a
CALM water truck, with a 2700 L capacity. Three truckloads of water were sprayed
over the plants and surrounding ground using a coarse spray nozzle, at a rate of 0.9 L/s
(Fig. 2.5). Leaf production was monitored from 18 January 2001 (as described in
Section 2.2.2), until 26 days after the watering treatment. Prior to watering, ΨX was
measured for the grasstrees on 3 occasions (29 January, 19 February and 20 April), and
once the morning after the watering treatment. Soil water potential (ΨS) at depths of 13,

Chapter 2 33
23, 33 and 43 cm was measured concurrent to ΨX at four locations within the study site.
At each location a straight-sided 30 cm diameter hole was dug and a psychrometer
sensor inserted into the side of the hole at each depth, before filling the hole
(maintaining original stratification of the soil) followed by gentle tamping. Psychrometer
locations were also watered with the equivalent of 59.2 mm of water, and ΨS was
measured concurrent to ΨPDX using a HR-33T dew-point microvoltmeter (Wescor Inc.,
Utah, USA). Rainfall at the site was measured using a single rain gauge.
Fig. 2.5 Water being applied to a grasstree and the surrounding ground within a 2.5 m
radius (marked by red flagging tap), as a simulation of rainfall. The time taken to fill the
46 L bin in the foreground was used to estimate the rate of water flow, so that the correct
volume of water could be applied to the area.
2.2.6 Statistical analyses
Special data analysis techniques are outlined in the relevant methods sections. However,
where routine statistical tests were performed (ie. t-test and ANOVA) and were not
described, the analyses were conducted using SPSS 10.0 software program (SPSS Inc.,
Chicago, USA). Analysis type used is indicated with the reported results, and α < 0.05
was used to determine significance. Normality was tested by examining stem-and-leaf
plots of the residuals, as well as calculating the Shapiro-Wilks statistic (Coakes & Steed
1999). Levene's test was employed to test for homogeneity of variances for all data.
Based on the outcome of this data screening, data were either square root or log
transformed as required and then re-analysed. All transformed data are presented as
untransformed means, and all error terms provided are standard error (s/√n).

Chapter 2 34
2.3 Results
2.3.1 Direct measurement of leaf production, elongation and death
2.3.1.1 Seasonal patterns of leaf production
The Durban-Watson test indicated that both leaf production data sets were not
autocorrelated. This was sufficient evidence to support the assumption that the data were
independent, despite their repeated-measures nature (Matt Williams, biometrician,
CALM, pers. comm.). In the following, it was considered reasonable to perform
regression analysis between climatic variables and leaf production as a method of
determining their relationship.
X. preissii shows clear oscillations in leaf production for both habitats (Fig. 2.6a,b). Leaf
production was at a maximum from late spring (November) to autumn (April/May),
persisting a little longer in the banksia woodland. During this period highest leaf
production (2.5 leaves/d in jarrah forest and 3.2 leaves/d in banksia woodland) occurred
at a mean daily temperature of 25.5 ûC in jarrah forest and 23.3 ûC in banksia woodland.
Through the winter months and early spring leaf production was at a minimum,
maintained close to one leaf per day. At no point during the year did leaf production fall
to zero; the lowest growth recorded was 0.17 ± 0.07 leaves/d in the jarrah forest and 0.21
± 0.08 leaves/d in the banksia woodland, both during March 1999. Over time it became
clear that the jarrah forest grasstree seasonal pattern of leaf production was more
pronounced than that of the banksia woodland plants (Fig. 2.7). Because of this pattern
of leaf production, daylength, the most seasonal of the available variables, was
investigated as a possible control of leaf production. Daylength significantly contributed
to explaining leaf production, and although weak, on a relative basis, the relationship
between leaf production and daylength for the jarrah forest grasstrees (P < 0.0001;
ANOVA. Fig. 2.8a) was considerably stronger than that of the banksia woodland
grasstrees (P = 0.0312; ANOVA. Fig. 2.8b).
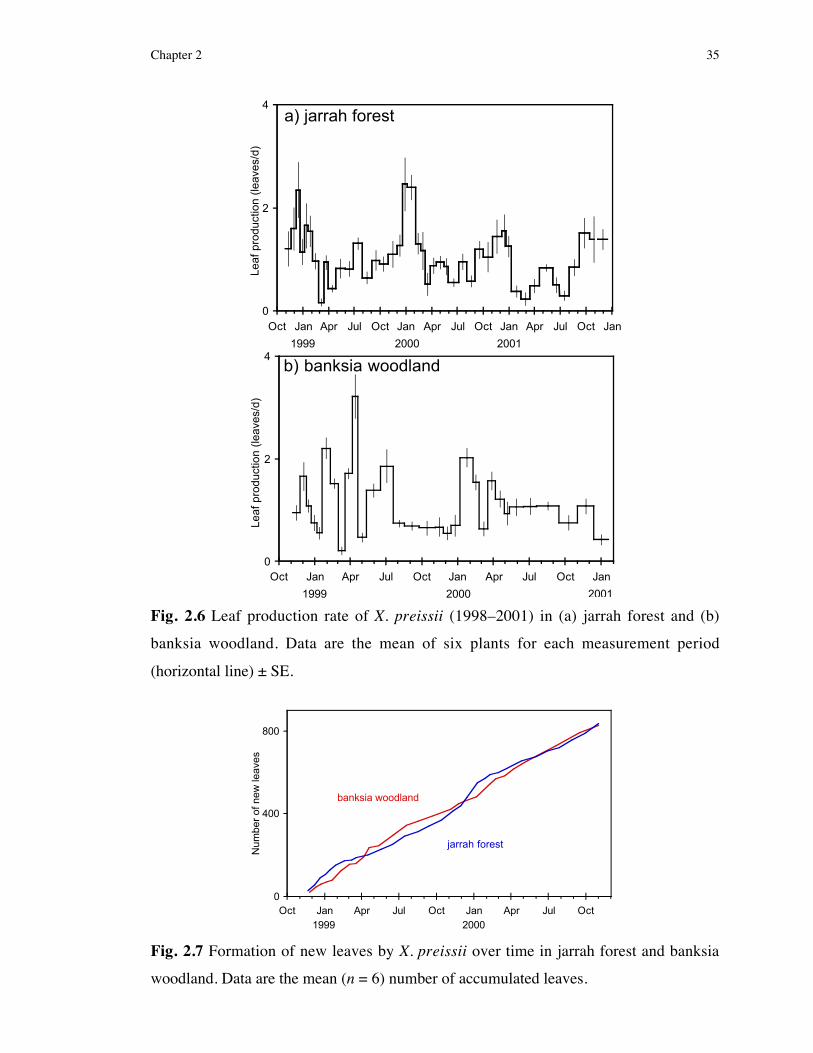
Chapter 2 35
0
2
4
Oct Jan Apr Jul Oct Jan Apr Jul Oct Jan Apr Jul Oct Jan
Leaf
pro
duct
ion
(leav
es/d
)
a) jarrah forest
1999 2000 2001
Fig. 2.6 Leaf production rate of X. preissii (1998�2001) in (a) jarrah forest and (b)
banksia woodland. Data are the mean of six plants for each measurement period
(horizontal line) ± SE.
Fig. 2.7 Formation of new leaves by X. preissii over time in jarrah forest and banksia
woodland. Data are the mean (n = 6) number of accumulated leaves.
0
2
4
Oct Jan Apr Jul Oct Jan Apr Jul Oct Jan
Leaf
pro
duct
ion
(leav
es/d
)
1999 2000 2001
b) banksia woodland
0
400
800
Oct Jan Apr Jul Oct Jan Apr Jul Oct
Num
ber
of n
ew le
aves
1999 2000
banksia woodland
jarrah forest

Chapter 2 36
Fig. 2.8 Relationship between daylength and leaf production by X. preissii in (a) jarrah
forest and (b) banksia woodland. Leaf production data are the mean of six plants for
each measurement period, and daylength is given as the mean for the measurement
period. For both relationships the line of best fit is plotted and the corresponding
regression equation and r2 value (derived from all data) are given.
The summer fast-growth phase was characterised by a fluctuating pattern of leaf
production, particularly in the banksia woodland. This erratic growth was coincident
with sporadic single summer rainfall events (Fig. 2.1) derived typically from a
combination of moist air and instability in the mid-level troughs that can form along the
west coast (Glen Cook, meteorologist, Perth Bureau of Meteorology, pers. comm.).
From observing grasstree leaf production in the banksia woodland, these plants appear to
be particularly sensitive to single rainfall events of about 18 mm or more (Fig. 2.1 and
2.6b, also see Section 2.3.3.2 on this topic), but this relationship is not clear in Fig. 2.9a.
This phenomenon is obvious during the driest period, from about mid-January to May,
but a similar response also occurred once after the first winter rains in 1999 when mean
daily temperature was below 16 ûC (seen as a 'slow growth' point at 34.2 mm in Fig.
2.9a). The positive relationship between leaf production and rainfall during the fast-
growing season (P < 0.0001; ANOVA) did not exist during winter, where the slope of
the regression equation was not significantly different from zero (P = 0.2531; ANOVA).
This seasonal difference is clearly shown in Fig. 2.9a. As a consequence of the
seemingly shorter growing season for the jarrah forest grasstrees the number of
incidences where an increase in leaf production was observed to follow summer rainfall
was low (only 3 definite occurrences over three years). On these few occasions, the
stimulation of grasstree leaf production by summer rainfall was evident (Fig. 2.6a),
although overall, a consistent relationship was not apparent (Fig. 2.9b. P = 0.3202;
ANOVA). Similarly, the correlation between the size of winter rainfall events and leaf
production was weak (Fig. 2.9b).
r2 = 0.145y = 0.2303x - 1.7324
0
1
2
3
4
10 11 12 13 14
Daylength (h)
Le
af
pro
du
ctio
n (
lea
ves/
d)
a) jarrah forest
r 2 = 0.024y = -0.0466x + 1.7424
10 11 12 13 14
Daylength (h)
b) banksia woodland

Chapter 2 37
Fig. 2.9 Relationship between the single largest rainfall event during each measurement
period and leaf production of X. preissii in (a) banksia woodland and (b) jarrah forest.
Data for each habitat have been separated into slow-growth (mid-May to mid-
November; !) and fast-growth (mid-November to mid-May; " ) periods. Leaf
production data are the mean of six plants for each measurement period, and rainfall is
the greatest rainfall amount to fall within each measurement period. For each
relationship the line of best fit is plotted (broken if not significant) and the
corresponding regression equation and r2 value (derived from all data) are given.
In both habitats the commencement of the summer growing season was prominently
marked by a sudden rise in leaf production (Fig. 2.6), but accurately predicting this point
was difficult because of the variability of its timing. Generally, the start of this growth
phase was correlated, in both habitats, with a mean daily temperature exceeding 20 ûC
(eg. 1998/99 growing season), but this relationship was unreliable when there was poor
rainfall from mid-October in the lead-up to the season (eg. 1999/00 growing season).
This temperature threshold was consistently reached during mid- to late-November,
which was characterised as having the greatest increase in ambient temperature during
the year. After the fast-growing season, with the transition from autumn into winter, the
boundary between the faster leaf production period and the start of the slower winter
Fastr 2 = 0.532
y = 0.0395x + 0.6842
0
1
2
3
Leaf
pro
duct
ion
(leav
es/d
)
a) banksia woodland
Slowr 2 = 0.025
r 2 = 0.025y = -0.007x + 1.1374
0
1
2
3
0 20 40 60
Largest single rainfall event (mm)
Leaf
pro
duct
ion
(leav
es/d
)
b) jarrah forest
Fastr 2 = 0.007
Slow

Chapter 2 38
growth was far more difficult to distinguish. Generally, by the end of May, leaf
production had attained the slow growth associated with winter. In contrast to
November, it is in May that the greatest decrease in ambient temperature was recorded
for the year.
The first attempt to model annual leaf production used a single regression equation. To
attain the highest r2 values a different set of climatic variables was used to model leaf
production in each habitat. In the jarrah forest, leaf production was positively correlated
with total rainfall received in each monitoring period and the mean daylength of the
period (see regression equation below). Independent of daylength, temperature was
correlated with leaf production. However, it was not used in the model as significant
overlap existed in the portion of leaf production variance explained by both variables.
Banksia woodland grasstree leaf production was negatively correlated with total rainfall,
but positively correlated with mean daily temperature and the interaction of temperature
and rainfall. Biologically, this interaction describes a positive effect of temperature on
growth that increases when water is not limiting (Fig. 2.10). Linear regression equations
for both habitats are given below:
Leaf production (Jarrah forest) = (0.002 × Rain) + (0.271 × Daylength) − 2.389
Leaf production (banksia woodland) = (0.051 × Temperature) − (0.042 × Rain) + (0.003
× Temperature × Rain) − 0.347
Fig. 2.10 The surface responses for the first leaf production model of banksia woodland
grasstrees, showing the relationship between rainfall and temperature throughout the
year. Leaf production data for this figure were calculated from the linear regression
equation given in the text.
0
1
2
3
4
15 17 19 21 23 25
Temperature (ûC)
Leaf
pro
duct
ion
(leav
es/d
)
Rainfall (mm): 100
80
60
40
20
0

Chapter 2 39
As these equations yielded the highest r2 values it is not surprising that each variable,
including the interaction term, significantly contributed to the prediction of leaf
production (t-test, Table 2.1). In the jarrah forest, daylength was most closely correlated
with leaf production, accounting for over 85% of the variation in leaf production
predicted by this model, according to the squared semi-partial correlations (Table 2.1).
For banksia woodland grasstrees, the combination of total rainfall and the interaction of
rainfall and temperature explained the majority of variation in leaf production. r2 values
indicate that leaf production by the banksia woodland grasstrees was more precisely
described by the climatic variables considered than leaf production by the jarrah forest
grasstrees (Table 2.1). However, the proportion of variation in leaf production explained
by these two models is quite low for both habitats. The difference in r2 values for the
two habitats is apparent when predicted leaf production was plotted with actual leaf
production (Fig. 2.11a,b). The predicted values adequately fitted the actual leaf
production profile for the banksia woodland grasstrees, whereas the fit was poor for the
jarrah forest grasstrees, although correctly predicting a general seasonal trend.
Consistent with this is the suggested predictive power of the respective models indicated
by their r2 PRESS statistics (Table 2.1). The jarrah forest regression was capable of
predicting leaf production data (separate to those used to create the model) with a level
of accuracy that highlighted the main seasonal trends (Fig. 2.11a).
Table 2.1 Results of multiple linear regression analysis, indicating P-values for the
effect of daylength, rainfall, mean daily temperature, and the interaction of the last two
variables on leaf production from November 1998 to February 2001, in two habitats.
The squared semi-partial correlations are indicated in parentheses beside the P-values.
The coefficient of determination (r2) is given for each model created from these climatic
variables. An estimate of the predictive power of each regression model is given (r2
PRESS statistic).
Analysis Jarrah forest Banksia woodland
t-testDaylength 0.0001 (0.144)Rainfall 0.0267 (0.020) 0.0001 (0.134)Temperature � 0.0239 (0.016)Temperature × rainfall � 0.0001 (0.196)
r2 0.166 0.402r2 PRESS statistic 0.144 0.372
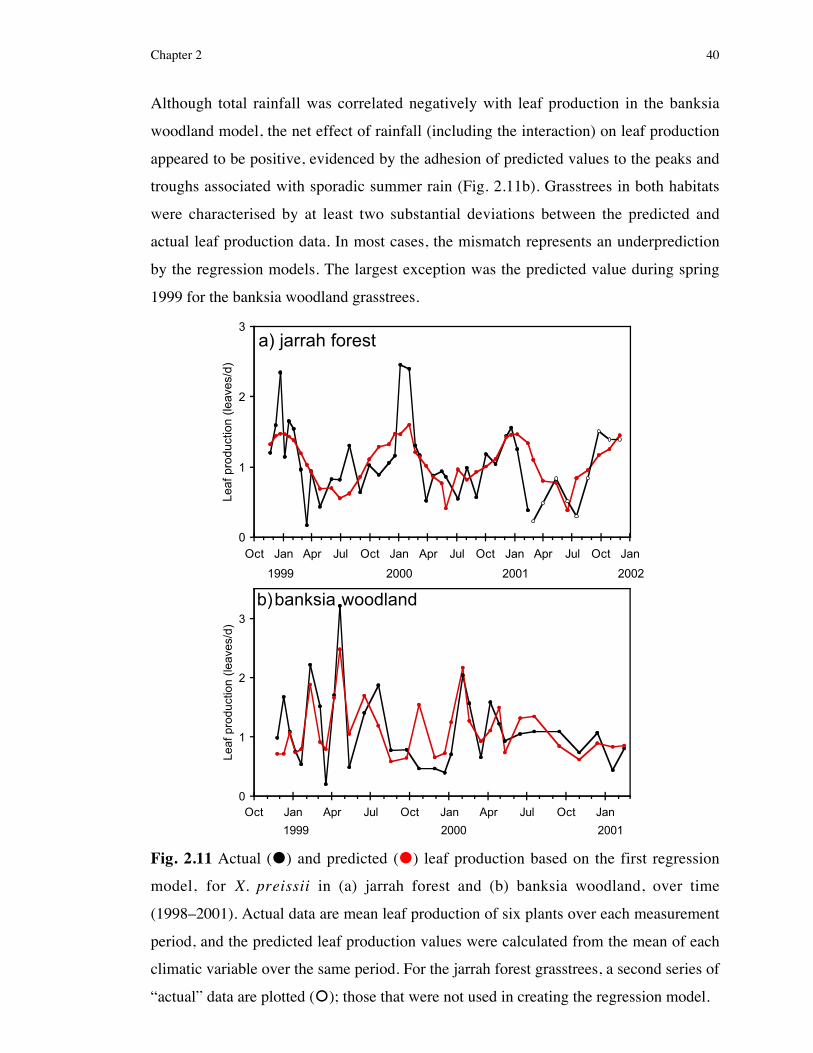
Chapter 2 40
Although total rainfall was correlated negatively with leaf production in the banksia
woodland model, the net effect of rainfall (including the interaction) on leaf production
appeared to be positive, evidenced by the adhesion of predicted values to the peaks and
troughs associated with sporadic summer rain (Fig. 2.11b). Grasstrees in both habitats
were characterised by at least two substantial deviations between the predicted and
actual leaf production data. In most cases, the mismatch represents an underprediction
by the regression models. The largest exception was the predicted value during spring
1999 for the banksia woodland grasstrees.
Fig. 2.11 Actual (!) and predicted (!) leaf production based on the first regression
model, for X. preissii in (a) jarrah forest and (b) banksia woodland, over time
(1998�2001). Actual data are mean leaf production of six plants over each measurement
period, and the predicted leaf production values were calculated from the mean of each
climatic variable over the same period. For the jarrah forest grasstrees, a second series of
�actual� data are plotted (#); those that were not used in creating the regression model.
0
1
2
3
Oct Jan Apr Jul Oct Jan Apr Jul Oct Jan Apr Jul Oct Jan
Leaf
pro
duct
ion
(leav
es/d
)
1999 2000 2001 2002
a) jarrah forest
0
1
2
3
Oct Jan Apr Jul Oct Jan Apr Jul Oct Jan
Leaf
pro
duct
ion
(leav
es/d
)
1999 2000 2001
b) banksia woodland

Chapter 2 41
In trying to improve the two models described above, the year was divided into a
summer growing-season and a winter non-, or more accurately, slow-growing-season,
that were modelled separately. The choice of boundaries for the summer growing-season
was based on the seemingly important minimum threshold temperatures discussed
above. Mid-November and mid-May coincided with the chosen start and finish of the
fast-growing-season respectively. Of the available variables, mean daylength and
maximum single rainfall event for each monitoring period were most closely correlated
with jarrah forest grasstree leaf production during the summer growing season (P <
0.0005 for both, t-test. r2 = 0.235). Summer leaf production in the banksia woodland was
most closely correlated with a solitary variable, maximum single rainfall event for each
monitoring period (P < 0.0005, t-test. r2 = 0.530).
Leaf production during the slow-growing-season for both habitats was poorly correlated
with all variables, so the appropriateness of using a constant was investigated. The rate
of jarrah forest grasstree leaf production was not significantly different between the
winters of 1999 and 2000, but the rate of leaf production varied significantly between
the six monitoring periods of each winter (Table 2.2). Examination of pairwise
comparisons indicated that the two most contrasting periods of leaf production rate for
the jarrah forest grasstrees were, at the very best, only marginally significantly different
(P = 0.052, pairwise multiple comparison with Bonferroni correction).
Table 2.2 P-values from two-way repeated-measures ANOVA of winter (slow-growing)
leaf production rates in two vegetation types. Leaf production rates recorded during 4 or
6 monitoring periods (six monitoring periods during each winter for jarrah forest, and
four monitoring periods during each winter for banksia woodland) during two
consecutive years (1999 and 2000) were compared.
Jarrah forest Banksia woodlandMonitoring period 0.001 0.001Year 0.308 0.162Monitoring period × year 0.439" 0.022
" P-value adjusted to correct for violating the assumption of sphericity (Coakes & Steed 1999).
Similarly, for the banksia woodland no difference in leaf production rate existed
between years, but a difference was apparent between the rates recorded during the four
monitoring periods of each winter (Table 2.2). This difference was attributed to a
significant difference between leaf production during July and October (P = 0.002,
pairwise multiple comparison with Bonferroni correction). However, as the significant

Chapter 2 42
interaction effect suggests, this was due mainly to an unusually high July 1999 leaf
production rate (Fig. 2.6b). Prompted by these analyses, mean leaf production rate
during the slow-growing season (inclusive of all years) was accepted as the predicted
leaf production (constant) for that season, for both habitats. The r2 between the new
predicted leaf production data (derived from the two combined seasonal models) and the
actual data was 0.261 for jarrah forest grasstrees, and 0.459 for banksia woodland
grasstrees. These coefficients represented a clear improvement on the first modelling
approach, particularly for the jarrah forest (Fig. 2.12a,b). Despite the improved r2 for the
second jarrah forest regression, it did not seem to predict the nine months of leaf
production data (independent of those used to create the model) as well as the first
model (Fig. 2.12a).
Fig. 2.12 Actual (!) and predicted (!) leaf production based on the second regression
model, for X. preissii from the (a) jarrah forest and (b) banksia woodland, over time
(1998�2001). Predicted values for summer and winter season are calculated from
separate methods (see text). Actual data are mean leaf production of six plants over each
measurement period, and the predicted leaf production values were calculated from the
mean of each climatic variable over the same period (summer), or designated as a
constant (winter). For the jarrah forest grasstrees, a second series of �actual� data are
plotted (#); those that were not used to create the regression model.
0
1
2
3
Oct Jan Apr Jul Oct Jan Apr Jul Oct Jan
Leaf
pro
duct
ion
(leav
es/d
)
1999 2000 2001
b) banksia woodland
0
1
2
3
Oct Jan Apr Jul Oct Jan Apr Jul Oct Jan Apr Jul Oct Jan
Leaf
pro
duct
ion
(leav
es/d
)
1999 2000 2001 2002
a) jarrah forest
Chapter 2 43
Figures 2.13a�d (after Specht & Dettmann 1995, p. 208, Specht & Specht 1999, p. 185)
define the relationship between mean daily temperature and the seasonal growth rhythm
of X. preissii, distinguishing water-not-limited (Fig. 2.13a,b) and water-limited
conditions for the leaf production data collected from November 1998 to February 2001
(Fig. 2.13c,d). The identification of these two conditions was based on whether the
amount of rainfall received during each leaf production monitoring period was greater
than or less than 18 mm, reflecting water-not-limited and water-limited respectively.
Where water is not limiting, grasstree growth is positively correlated with temperatures
of ≥ 17.5 ûC in the jarrah forest and ≥ 16.5 ûC in the banksia woodland. Below these
minimum threshold temperatures leaf production was relatively constant; despite a 7 ûC
range of temperature change in the jarrah forest. Mean daily temperature remained
above the minimum threshold for 5�6 months of the year in the jarrah forest (November
to April), and for 7�8 months in the banksia woodland (November to June). The upper
threshold temperature for grasstrees in the jarrah forest could not be determined, as
mean daily temperatures > 21 ûC were not observed concurrent with periods not limited
by water. Even in the banksia woodland where the mean daily temperature reached > 24
ûC an upper threshold was not apparent. In the absence of sufficient summer rain, leaf
production was limited and fell below the one leaf per day baseline rate observed during
the cooler months of the year (Fig. 2.13c,d).
The arrows in Figures 2.13a�d depict the natural hysteresis temperature-leaf production
response curves for X. preissii during the year. Considering Figures 2.13a,b, where water
is not limiting, the directions of these arrows for the jarrah forest and banksia woodland
data are opposing. Jarrah forest grasstrees are characterised by a clockwise pattern,
where leaf production during spring is marginally higher than leaf production during
autumn over the same temperature range. Grasstrees in the banksia woodland exhibit an
anti-clockwise pattern. In this habitat leaf production is higher during the months of
autumn over the same temperature range during spring. Total incident solar radiation is
higher during spring than in autumn (Fig. 2.14a,b), and so is positively correlated with
grasstree leaf production in the jarrah forest, but is negatively correlated with leaf
production in the banksia woodland.

Chapter 2 44
Fig. 2.13 Mean daily temperature-response curves for X. preissii leaf production
throughout the year. Curves represent periods when water in the (a) jarrah forest and (b)
banksia woodland is not limiting, and when water in the (c) jarrah forest and (d) banksia
woodland is limiting. Data have been pooled for 2.3 years (1998�2001), and leaf
production is given as the mean of six grasstrees from each measurement period.
Fig. 2.14 Relationship between incident solar radiation (mJ m-2 d-1) and mean daily
temperature during the year, for the (a) jarrah forest and (b) banksia woodland. Data are
the mean for the measurement periods used in Fig. 2.13.
b) banksia woodlandApr
Feb
NovAug
Jul
Sept
Jun
0
1
2
3
Leaf
pro
duct
ion
(leav
es/d
)
a) jarrah forest
Feb
Apr
Jul
Sept
Nov
May
OctAug
0
1
2
3
10 15 20 25Temperature (ûC)
Leaf
pro
duct
ion
(leav
es/d
)
Aug Nov Jan
MarJun
c) jarrah forest
JulSept
OctDec
FebApr
10 15 20 25Temperature (ûC)
Feb
Aug
Jul
1 Nov Dec
d) banksia woodland
Jun
24 NovJan
Mar
0
10
20
30
Rad
iatio
n
Jul
Aug
Nov
Jan
Mar
May
Feb
a) jarrah forest
0
10
20
30
10 15 20 25Temperature (ûC)
Rad
iatio
n
Aug
Oct
Nov Feb
Mar
MayJun
b) banksia woodland

Chapter 2 45
2.3.1.2 Seasonal patterns of leaf elongation and death
Rates of leaf elongation (progression from one size category to the next) and leaf death
for X. preissii from both the jarrah forest and banksia woodland are given in Fig.
2.15a,b. Leaf elongation follows a seasonal pattern. In jarrah forest the rate at which
young leaves progressed to the intermediate category was highest during the growing
season starting in late winter (August-September), when mean daily temperature is about
12 ûC, and ceasing during the hottest summer period, January/February. Young leaf
elongation of the banksia woodland grasstrees did not have the somewhat undulating
annual pattern as those in the jarrah forest. The woodland plants appeared to have a
shorter growing season, peaking then subsiding earlier than for leaf production. In April
(autumn) 1999 these grasstrees showed a surge of young leaf progression (Fig. 2.15b)
coincident with a single heavy rainfall event of 50.2 mm, resembling the summer leaf
production/rainfall response described above in Section 2.3.1.1. Young leaf elongation
for both habitats during the particularly dry 2000/01 growing season (Fig. 2.1) was not
substantial.
The intermediate leaf category contained a range of leaf sizes, from very short to almost
mature, representing the largest increase in leaf size. Intermediate leaves progressed
most rapidly during mid-summer, 1998/99 and 1999/00, in the jarrah forest.
Intermediate leaf elongation during the 2000/01 growing season was slightly out of
phase with the previous years, reaching a marginal peak in spring. Aside from the
2000/01 growing season and a noticeable increase in intermediate leaf elongation
outside of the growing season (late autumn/winter) during 1999, intermediate leaf
growth tended to follow the earlier young leaf growth for the jarrah forest grasstrees.
Similarly, banksia woodland grasstree intermediate leaf growth also tended to most
closely reflect young leaf growth patterns, with the exception of the dry 2000/01
growing season where all growth was low.
Leaf age at maturity was not significantly different for unburnt grasstrees in both habitat
types (P = 0.729, repeated-measures two-way ANOVA): ranging from 1.3 to 1.6 years
(Fig. 2.16). However, the season in which grasstree leaves were initiated affected leaf
age at maturity (P = 0.015, repeated-measures two-way ANOVA), independent of
habitat (habitat × season, P = 0.430): leaves produced in summer appeared to reach
maturity at a younger age than those produced in the other seasons (Fig. 2.16).

Chapter 2 46
Fig. 2.15 Leaf elongation and death of X. preissii growing in (a) the jarrah forest and (b)
banksia woodland, from 1998 to 2001. Leaf elongation is expressed as two phases of
leaf development: 1) the percentage of young leaves that shifted to the intermediate leaf
category per day (), and 2) the percentage of the intermediate leaves that shifted to the
mature leaf category per day (). Similarly, leaf death is the percentage of mature
leaves that died per day (). Data are the means of six plants for each measurement
period (horizontal line) ± SE (SE is only indicated in one direction for leaf death to
reduce interference).
Figures 2.15a,b demonstrate the regularity in the timing of annual leaf death for
grasstrees from both habitats. Leaf death only occurred during summer, overlapping
with the annual peak in leaf production and elongation. During the summer of 1999/00
leaf death was lower than for the other two years monitored; maximum rate of leaf death
was three times lower for the jarrah forest and nine times lower for the banksia
0.0
0.5
1.0
1.5
Oct Jan Apr Jul Oct Jan Apr Jul Oct Jan Apr Jul Oct
Leaf
pro
gres
sion
(%
leav
es/d
)
a) jarrah forest
1999 2000 2001
0.0
0.5
1.0
1.5
2.0
2.5
Oct Jan Apr Jul Oct Jan Apr Jul Oct Jan
Leaf
pro
gres
sion
(%
leav
es/d
)
1999 2000 2001
b) banksia woodland

Chapter 2 47
woodland grasstrees than other years. Total rainfall over that summer period and for the
preceding spring was greater than for the other years. Leaf age at time of death was
similar for both habitats: jarrah forest grasstree leaves died after a mean period of 2.25 ±
0.05 years (n = 2) and banksia woodland grasstree leaves died after a mean period of
2.18 ± 0.02 years (n = 6). The mean total number of leaves that died per grasstree (n = 4)
during the 1999/00 summer was 582 ± 125 in jarrah forest and 463 ± 84 in banksia
woodland. In comparison, the mean total number of leaves produced per grasstree (n =
4) during the year July 1999 to July 2000 was 589 ±82 for jarrah forest and 434 ± 67 for
banksia woodland. Leaf production was not significantly different from leaf death in the
jarrah forest and banksia woodland (P = 0.9051 and P = 0.3946 respectively, paired t-
test).
Fig. 2.16 The age of X. preissii leaves at maturity in jarrah forest ($) and banksia
woodland ($), and identifying the season in which they were produced. Data are the
means of six plants ± SE.
2.3.2 Root growth
Three characteristics of new roots (number per grasstree, total biomass per grasstree, and
root size) were quantified to interpret and explain X. preissii root growth phenology.
Seasonal changes in these characteristics reflect changes in the vigour of root production
and growth. Simultaneously, the process of new root maturation or desiccation resulting
in the decay of the cortex and attainment of the 'old root' structure, influenced the
number of new roots identifiable, and subsequently the data collected. Separating the
processes of new root growth and new root decortication, so that root growth might be
200
400
600
spring '98 summer '99 autumn '99 winter '99
Season of leaf initiation
Leaf
age
(d)
Chapter 2 48
measured independently, was not possible. However, as root cortex deterioration
generally occurred during dry summer conditions, which were negatively correlated with
root growth (see further discussion of results), the net effect of this process on the data
presented here would not alter root growth seasonality.
New roots commonly emerged in clumps forming an intermittent ring around the
caudex, at a depth marked by the shallowest pre-existing roots (20�30 cm). Growing
root tips were encased in a heterogeneous sheath, consisting of secreted mucilage and
sand grains, the evidence of which was still apparent on the older proximal portions of
the roots. New root production appeared to commence in winter, evident by a 73%
increase in the number of grasstrees with new roots from autumn to winter (Table 2.3).
However, from the results of the binomial test, the proportion of grasstrees excavated in
winter that had new roots was not different from 50% (no seasonal effect). This result
seems surprising after examining the raw data, and small sample size is likely to have
prevented support for the alternate hypothesis (ie. probability of grasstrees bearing new
roots > 0.5). Statistically, it is in spring that new roots were most likely to be present
(Table 2.3). All root characteristics were significantly different across the four seasons
from winter to autumn (Kruskal-Wallis test, Table 2.4). Also, all root characteristics
were greatest during late-spring pointing to an annual peak in root growth, supported by
a significant difference in root size between winter and spring (two-tailed Mann-
Whitney with sequential Bonferroni correction, Table 2.4). Concurrent with new root
recruitment during November 2000, older roots of X. preissii were observed to continue
growing from their tips, often branching at this point (Fig. 2.17). The significant
decrease in the number of new roots per grasstree and the total new root biomass, from
spring into summer (one-tailed Mann-Whitney with sequential Bonferroni correction,
Table 2.4), appeared to mark the end of the root-growing season. The results of the
binomial test were unable to support this. However, these results do demonstrate that the
probability of finding new roots in the following season (autumn) is less than 50%
(Table 2.3). While spring supported peak root growth, root characteristics (Table 2.4)
generally pointed to an annual low in autumn (May), where only 10% of grasstrees
exhibited new roots. Despite this, in all seasons, severing the wiry stele of most old roots
could reveal moist, living, porous tissue.

Chapter 2 49
Table 2.3 The number of grasstrees growing in the banksia woodland with new roots
during each season. The number of grasstrees with new roots (n2) is expressed as a
percentage of the total number of grasstrees excavated in each season (n1). For each
season, the probability (p) that a grasstree will bear new roots was analysed using a one-
tailed binomial test. To obtain an overall p for the distribution, it was assumed that there
is no root growth in summer-autumn and all plants have new roots in winter-spring from
which the average p is 0.5. Thus, HO: p = 0.5 was used for all tests, while HA: p > 0.5
was used for winter and spring, and HA: p < 0.5 was used for summer and autumn. An
outcome statement indicating the probability of finding new roots (p) is given in
parentheses, based on the results of each test.
Site Season n1 n2% grasstrees with new
rootsBinomial test
(P-value)
winter 6 5 83 0.109 (p = 0.5)YC spring 5 5 100 0.031 (p > 0.5)
summer 5 4 80 0.188 (p = 0.5)autumn 10 1 10 0.011 (p < 0.5)
Table 2.4 A summary of X. preissii new root characteristics during each season (August
2000, November 2000, February 2001 & May 2001). Estimated total new root mass,
number of new roots per grasstree and size of new roots, are means ± SE of the number
of plants with new roots (n). Lower case letters indicate the significant differences
between results of adjacent seasons for Mann-Whitney test (with sequential Bonferroni
correction) for new root characteristics obtained from Kruskal-Wallis test (P-values
shown). Similarly, upper case letters indicate the significant differences between autumn
and winter.
Site Season nTotal root mass/grasstree (g)
No. of newroots/grasstree
Root size(g/cm)
winter 5 11.7 ± 1.4 a A 14 ± 2 a A 0.05 ± 0.01 a Aspring 5 42.3 ± 9.7 a 24 ± 8 a 0.13 ± 0.04 b
YCsummer 4 1.6 ± 0.5 b 4 ± 1 b 0.07 ± 0.00 bautumn 1 0.4 b A 2 b A 0.07 b A
P-value 0.009 0.021 0.013

Chapter 2 50
Fig. 2.17 Two mature X. preissii roots in late spring 2000. Branching from behind a
rotten apical meristem (left), and multiple branching behind the terminal meristem
which itself has bifurcated forming new apical meristems (right). Scale in cm.
Of the new roots excavated in each season, not all were in a state of active growth (Fig.
2.18). The long, tapered, yellow/green tipped new roots (Fig. 2.3) suggested active
elongation, and were present predominantly during winter and spring. 50% of roots
growing in autumn have growing tips. However, this is based on one grasstree that bore
Fig. 2.18 Seasonal variation in the proportion of grasstree new roots allocated to each of
three categories of root tip condition. The three categories were: 1) growing ($), 2)
dormant ($), and 3) rotten ($) (see Fig. 2.2 for detail of these conditions). Roots were
excavated during each season from 2000 to 2001 (August, November, February and
May). Proportions are the mean of 4�5 plants (see n2 in Table 2.3), except for autumn,
which was based on root sampling from a single grasstree.
0.0
0.5
1.0
winter spring summer autumn
Pro
port
ion
of n
ew r
oots
Chapter 2 51
only two new roots. New roots in summer were predominately dormant, characterised
by a stunted black tip (Fig 2.3), and further supports the notion that summer marks the
end of the growing season. The mean number of new roots per grasstree during spring
was counter-balanced by an annual high proportion of these roots having rotten tips
(36%). As a result, the number of actively growing new roots present during spring was
reduced to 8 per grasstree, the same as during winter, when tip rot was less prevalent.
Tip rot appeared to be associated with the presence of a parasitic scale insect in the
family Margarodidae (Melinda Moir; Environmental Biology, Curtin University of
Technology), distinguished in Figure 2.3 as pale pink oval structures on the root surface.
Grasstree roots were estimated to extend vertically to a depth of at least 6.4 m, growing
on leached sand over limestone on the Swan Coastal Plain. These roots were constricted
into gaps in the limestone as a pathway through the hard substrate (Fig. 2.4).
2.3.3 Grasstree water relations
2.3.3.1 Seasonal water potentials
Predawn xylem water potential (ΨPDX) for jarrah forest grasstrees reached an annual low
of about −1.0 MPa during mid-autumn (Fig. 2.19a), but rarely fell below this level. The
annual low for the banksia woodland grasstrees was during summer (Fig. 2.19a), and the
lowest recorded ΨPDX for an individual plant was −1.26 MPa. At no point did ΨPDX for
grasstrees from either habitat reach their respective mean ΨTLP (mid-autumn): −1.85 ±
0.47 MPa for jarrah forest and −2.18 ± 0.17 MPa for banksia woodland. ΨPDX was
highest (less negative) during mid-spring to early summer for the jarrah forest grasstrees,
while ΨPDX for the banksia woodland grasstrees peaked in late winter/early spring.
During this period it was not unusual to record potentials of 0 MPa.
Between years, maximum annual ΨPDX recorded during spring was consistent, whereas
minimum ΨPDX showed more variability, with higher ΨPDX for the summer/autumn of
2000 in both habitats, relative to other years. An unseasonal rise in ΨPDX during the
autumn of 1999 for grasstrees in jarrah forest and banksia woodland was correlated with
a significant single rain event (Fig. 2.1), the same event that triggered an increase in leaf
production and leaf elongation. Midday xylem water potential (ΨMDX) had a similar
seasonal pattern to ΨPDX. However, in the jarrah forest the curves were out of phase with

Chapter 2 52
maximum and minimum potentials recorded earlier (late winter and mid-summer
respectively, Fig. 2.19b).
Fig. 2.19 Predawn (a) and midday (b) xylem water potential for X. preissii in jarrah
forest (!) and banksia woodland (!) between 1998 and 2001. Data are means of six
plants ± SE.
2.3.3.2 Response to simulated summer rain
Prior to the application of water to simulate summer rain, grasstree ΨX reflected the
annual low values described above (Section 2.3.3.1), typical of summer/autumn.
Measurement of predawn soil water potential (ΨPDS) was hampered by irregularities in
the performance of the buried sensors, which required that the accuracy of all
measurements be closely scrutinised. ΨPDS for all soil depths during the pre-watering
period was considerably lower (more negative) than grasstree ΨPDX and ΨMDX (Table
2.5). Immediately following watering, both ΨPDX and ΨPDS increased (Table 2.4). The
-1.2
-0.8
-0.4
0.0
Wat
er p
oten
tial (
MP
a)
a) predawn
-2.5
-2.0
-1.5
-1.0
-0.5
Oct Jan Apr Jul Oct Jan Apr Jul Oct Jan Apr Jul
Wat
er p
oten
tial (
MP
a)
1999 2000 2001
b) midday
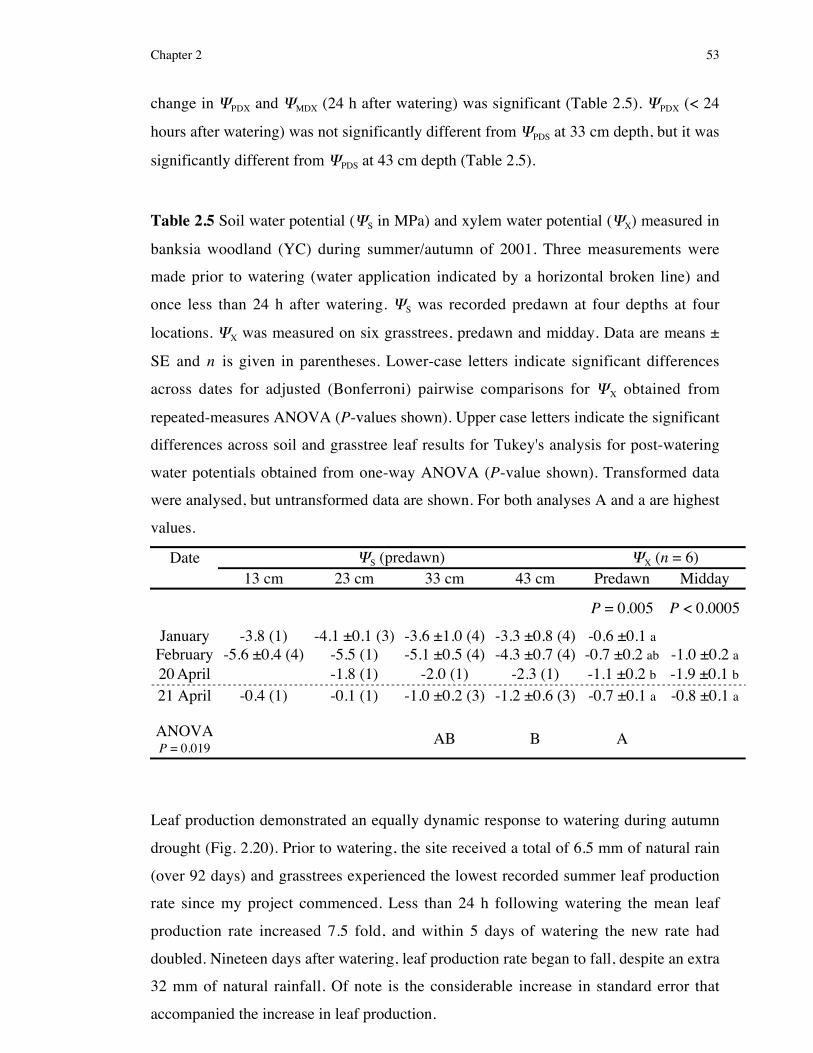
Chapter 2 53
change in ΨPDX and ΨMDX (24 h after watering) was significant (Table 2.5). ΨPDX (< 24
hours after watering) was not significantly different from ΨPDS at 33 cm depth, but it was
significantly different from ΨPDS at 43 cm depth (Table 2.5).
Table 2.5 Soil water potential (ΨS in MPa) and xylem water potential (ΨX) measured in
banksia woodland (YC) during summer/autumn of 2001. Three measurements were
made prior to watering (water application indicated by a horizontal broken line) and
once less than 24 h after watering. ΨS was recorded predawn at four depths at four
locations. ΨX was measured on six grasstrees, predawn and midday. Data are means ±
SE and n is given in parentheses. Lower-case letters indicate significant differences
across dates for adjusted (Bonferroni) pairwise comparisons for ΨX obtained from
repeated-measures ANOVA (P-values shown). Upper case letters indicate the significant
differences across soil and grasstree leaf results for Tukey's analysis for post-watering
water potentials obtained from one-way ANOVA (P-value shown). Transformed data
were analysed, but untransformed data are shown. For both analyses A and a are highest
values.
Date ΨS (predawn) ΨX (n = 6)13 cm 23 cm 33 cm 43 cm Predawn Midday
P = 0.005 P < 0.0005
January -3.8 (1) -4.1 ±0.1 (3) -3.6 ±1.0 (4) -3.3 ±0.8 (4) -0.6 ±0.1 aFebruary -5.6 ±0.4 (4) -5.5 (1) -5.1 ±0.5 (4) -4.3 ±0.7 (4) -0.7 ±0.2 ab -1.0 ±0.2 a20 April -1.8 (1) -2.0 (1) -2.3 (1) -1.1 ±0.2 b -1.9 ±0.1 b21 April -0.4 (1) -0.1 (1) -1.0 ±0.2 (3) -1.2 ±0.6 (3) -0.7 ±0.1 a -0.8 ±0.1 a
ANOVAP = 0.019
AB B A
Leaf production demonstrated an equally dynamic response to watering during autumn
drought (Fig. 2.20). Prior to watering, the site received a total of 6.5 mm of natural rain
(over 92 days) and grasstrees experienced the lowest recorded summer leaf production
rate since my project commenced. Less than 24 h following watering the mean leaf
production rate increased 7.5 fold, and within 5 days of watering the new rate had
doubled. Nineteen days after watering, leaf production rate began to fall, despite an extra
32 mm of natural rainfall. Of note is the considerable increase in standard error that
accompanied the increase in leaf production.

Chapter 2 54
Fig. 2.20 Effect of artificial watering, simulating 59.2 mm of rainfall, on leaf production
by X. preissii in the banksia woodland. Data are means of six plants ± SE.
2.3.4 Indirect measurement of leaf production
Some difficulty was encountered in distinguishing the boundary between annual bands
on the stem of grasstrees in both habitats. In jarrah forest, rot and termite damage to the
thatch of some grasstrees had caused the associated dead leaf bases to decay and
crumble, resulting in the loss of the unique colours of the seasonal bands that highlight
annual growth bands. X. preissii in the banksia woodland, although unaffected by rot,
displayed poor colour distinction between seasonal bands. The mean number of
leafbases counted per annual band on jarrah forest grasstrees was less than the mean
number of leaves produced in one year by the same plants, and the reverse was true for
grasstrees in the banksia woodland. A two-way ANOVA revealed that the counts
obtained using the two methods were not significantly different, and no difference
existed between the results from the two habitats (Table 2.6).
Table 2.6 Comparison of results from two methods of determining mean annual leaf
production of X. preissii in two contrasting habitats: direct count of the number of leaves
produced in two years, and a count of the number of leafbases contained in two annual
growth bands. Data are means for six plants ± SE.
Jarrah forest Banksia woodland
Direct leaf count 506 ± 75 476 ± 23Leafbases per annual band 455 ± 31 519 ± 47
Two-way ANOVA (P-values)Habitat 0.720Method 0.937Habitat × method 0.330
0
1
2
3
-80 -60 -40 -20 0 20 40
Days since watering
Leaf
pro
duct
ion
(leav
es/d
)pre-watering post-watering

Chapter 2 55
2.4 Discussion
Conventional methods used to measure vegetative growth in dicotyledenous trees and
shrubs, eg. height, girth, shoot extension, are impractical for use on grasstrees. The
technique for quantifying leaf production used here was devised as a surrogate for these
traditional methods. The easy accessibility of the foliage and growing apex, the
responsiveness of leaf initiation to the environment, and the accuracy, unobtrusiveness
and simplicity of the method made it suitable for monitoring the subtleties of grasstree
growth. The ability to apply this method immediately following fire-removal of the
foliage was another advantage (see Chapter 3 for details).
Unlike most plant species outside the Tropics (Lieth 1974, Fritts 1976), X. preissii does
not have a discrete growing season, undergoing leaf initiation and elongation throughout
the year, despite the natural climatic extremes experienced within its distribution. Like
X. preissii, the grasstree Kingia australis (family Dasypogonaceae, Rudall & Chase
1996) on the Darling Scarp produces leaves throughout the year (Lamont 1981).
Lamont's data indicate a spring flush of leaf elongation followed by a summer minimum,
which is in general keeping with X. preissii. Similarly, X. reflexa (synonymous with X.
preissii) in Tutanning Nature Reserve (120 km ESE of Perth) displays continuous foliar
growth throughout the year, but with the greatest increments from June to August and
October to December (Specht et al. 1981). A study of 23 common species often co-
occurring with X. preissii on the Swan Coastal Plain noted that shoot growth occurred in
one or more of the species in all seasons except summer-early autumn (Bell & Stephens
1984). Species with a spring-summer growth rhythm continued vegetative growth until
the watertable level fell below the clay horizon, after which dormancy followed. In
another study, the same Banksia spp., dominant at my banksia woodland sites (Table
1.1), grew rapidly during early summer, but showed no growth during mid- to late-
autumn (Lamont & Bergl 1991). Lamont and Bergl (1991) did, however, show that
drought was avoided by prolonged access to water stored at depth and control over its
use. Similarly, a study of the water relations of jarrah forest overstorey and understorey
(including X. preissii) demonstrated that plants within this habitat remain
physiologically active during the summer (Crombie 1992). In light of these observations,
what appears to make X. preissii special is its ability to continue growing throughout the
year, albeit at a reduced rate during the driest period.

Chapter 2 56
As shown in my study, growth of roots is considerably more difficult to measure than
that of the foliage (Böhm 1979, Rorison 1981), and accounts for the comparative lack of
studies considering both aerial and subterranean vegetative growth phenology.
Kummerow et al. (1981) concluded from a review of root studies in summer dry areas,
that root systems in mediterranean climate regions are plastic in their response to
environmental conditions. Hence, although my study provides an insight into root
growth by X. preissii in banksia woodland, the results may vary somewhat from the
same species growing in the jarrah forest, providing the opportunity for a physically
challenging, comparative study. Unlike leaf growth, X. preissii exhibits a well-defined
season of root growth on the coastal plain, commencing in winter and finishing during
summer. The related grasstree Kingia australis generally initiates root primordia in
winter. However, unique to this species, these roots originate from the stem apex
(Lamont 1981), and not from a deeply-seated rootstock or caudex as with the
Xanthorrhoea. This difference in the environment immediately surrounding the roots
may explain the continued root elongation through summer by Kingia australis (Lamont
1981), long after X. preissii has terminated root growth.
Regressing climatic data against leaf production rates was one method employed to
interpret the leaf production results. However, the final relationships developed only
accounted for 25�45% of total variance. Nevertheless, the results did give an insight into
the likely relationship between growth of X. preissii and climate. The inclusion of
microsite climatic data, in an attempt to match the plant specific scale used in measuring
leaf production, would be unlikely to alter the relationships, as for jarrah forest
grasstrees both modelling attempts indicated the possible importance of daylength in
predicting leaf production. However, it is also likely that the strongly seasonal pattern of
leaf growth may be correlated with a number of other seasonally-predictable variables
providing equivalently low r2 values. The specific use of daylength for modelling jarrah
forest grasstree leaf production instead of temperature was based on a marginal
difference in r2 values. In my case, daylength offered a means of predicting leaf
production, but should be treated as only one possible climatic variable that directly
controls leaf production. In banksia woodland, rainfall appears to be an environmental
factor that has value in predicting summer growth, but is unlikely to be a factor
controlling the timing of major seasonal growth phases. It became evident that, while
these modelled relationships have much to offer, caution must be applied in their

Chapter 2 57
interpretation, and for this reason considerable 'weight' has been given to trend analysis
and supportive literature in deciphering grasstree phenology.
2.4.1 The switch in growth phase between two seasonally-distinctperiods of the year
The alternating pattern of fast then slow leaf growth of X. preissii can be described as
sinusoidal, reflecting the hot/dry summer season and then cool/wet winter season that
dominates the bimodal mediterranean climate. During the transition between the annual
climatic extremes X. preissii switches from one state of leaf growth to the other,
comparable to the change from active growth to dormancy (and vice versa) that some
species experience under harsh climatic conditions (Ackerman & Bamberg 1974, Mohr
& Schopfer 1995).
The relatively sudden switch from slow winter leaf production to the fast summer flush
in X. preissii suggests that an environmental trigger or threshold may be involved. From
predominantly northern-hemisphere examples, it is accepted that a period of low
temperature is required by winter-dormant plants to initiate active growth (Flint 1974),
and often, prolonged exposure to a subsequent higher temperature threshold is also
needed (Perry 1971). More applicable to X. preissii, research has identified lower
temperature thresholds for growth of the vegetation of southern Australia, below which
growth is inhibited or ceases altogether (Specht & Rayson 1957a, Groves 1965, Specht
1973, Specht et al. 1981). For dominant shrub and tree species, these temperature
minimums fall in the range of 16�18 ûC. From the relationship between mean daily
temperature and leaf production (Fig. 2.13a,b), X. preissii was observed to exhibit a
positive response once the temperature exceeded 16.5�17.5 ûC. However, there were no
records for the crucial period around late November/early December when the fast-
growing-season starts (data were restricted to those where water was not limiting). As a
consequence, this minimum may be an underestimate and a value closer to 20 ûC,
suggested by trends in leaf production (Fig. 2.6), may be more accurate. Strictly
speaking, because X. preissii grows continuously, the minimum temperature of 20 ûC
marks the change from slow to fast growth, not a transition from an inactive state to one
of active growth, that the minimum threshold of 16�18 ûC represents for other
Australian species. Therefore, comparison of these minima must be treated cautiously.

Chapter 2 58
While 20 ûC, as the threshold minimum for fast leaf production seems high, the rate of
leaf elongation, although not as seasonally consistent, generally increased in late
winter/early spring, coincident with temperatures around 12 ûC. The location of the
apical meristem could offer an explanation for this substantial difference between
minimum temperatures for leaf production and elongation. Unlike tree and shrub
components of the mediterranean flora, X. preissii produces leaves from a single well
insulated apical meristem. As a consequence, it is likely that while temperatures rise
during spring the meristem remains cooler than the surrounding elongating leaves,
delaying its growth. Alternatively, with the start of the fast-growing-season nutrients and
photosynthates may initially be directed to the large number of pre-existing immature
leaves. Therefore, despite the minimum temperature for leaf production being reached,
negligible growth was observed.
Specht & Specht (1999) view upper and lower temperature thresholds as important
controls of plant seasonal phenophases, and considered them to fall 5 ûC either side of
the optimum. Optimum temperatures for vegetative and reproductive growth generally
lie between 20�30 ûC (Bell & Stephens 1984). Peak leaf production occurred at 25.5 ûC
for jarrah forest grasstrees and 23.3 ûC for banksia woodland grasstrees, this equates to a
maximum range of suitable leaf production temperatures from 18.3�30.5 ûC. While this
maximum threshold seems reasonable, my data clearly show that this minimum
threshold is inaccurate, as X. preissii can grow at temperatures substantially less than
18.3 ûC.
The inability of the first regression model for the banksia woodland to predict the start of
the 1998/99 growing season (Fig. 2.11b) supports the idea that growth is initiated by a
more complex trigger than a simple positive relationship with temperature, as assumed
in the model. Furthermore, the same model over-predicts the leaf production response
during October 1999, where conditions (water and temperature) were not sufficient to
stimulate X. preissii. Experimental testing of these two ideas under controlled conditions
would be physically impossible using mature plants, and the value of generalising from
seedling trials is questionable given the subterranean existence of the seedling apical
meristem (Koch & Bell 1980, Staff & Waterhouse 1981, Gill 1993). It should be noted
that reproductive growth (inflorescence production) of X. preissii occurs from winter to
spring (July�November, Marshall 1986), prior to the flush in leaf production in late
Chapter 2 59
spring. This suggests that the mechanism controlling the start of fast summer leaf
production is not due to a physiological restriction to growth generally at lower
temperatures.
Root growth in mediterranean Australia often precedes foliage growth (Lamont 1976,
Specht et al. 1981, Lamont & Bergl 1991, Specht & Specht 1999), commencing in
winter or spring. Similar findings for more temperate species (Kozlowski 1971,
Hoffman 1972) have been explained as a consequence of roots having lower temperature
minima (Hoffman 1972). Root production in X. preissii was first measured during mid-
winter (August), but it is likely that growth would have begun sometime earlier, after
soil moisture recharge from the initial winter rains. Although this change in soil
moisture could be a direct trigger for the commencement of elongation of existing roots,
the production of new roots from the caudex would require an internal stimulus. Such a
stimulus may involve an increase in water potential, or the effect of net movement of
nutrients and photosynthates towards the now active mature root tips, via the base of the
caudex. The peak of new root production in X. preissii occurred in spring, indicating that
root growth vigour is partly dependent upon temperature. The combination of adequate
soil moisture and rising temperatures during spring was not only conducive to root
growth but also seemed to encourage the infestation of growing root tips with parasitic
scale insects. By the end of summer, new root growth had succumbed to high water
deficits, and the majority of new roots displayed the characteristic dark suberised tip
resulting from metacutisation (Wilcox 1954).
For a number of Hakea species growing under the mediterranean climate of south-
western Australia, drought-induced root dormancy can be broken by the application of
water (Lamont 1976). Considering the timing of new root production in X. preissii, it
seems that the late start to the foliar growing season may reflect a timing that avoids
competition between the roots and shoots for photosynthates and other essential
resources required for growth. Experimental pruning of apple and plum trees,
stimulating intense shoot growth, revealed a negative effect on new root production,
suggesting competition between roots and shoots for nutrients when reserves were not
adequate at times of rapid utilisation (Head 1967).

Chapter 2 60
After the break of summer drought by the winter rains, X. preissii undergoes the
equivalent reverse of what has been discussed up to now: a seasonal reduction in growth
rate. The cessation of summer growth and subsequent induction of a dormant state noted
in other species provides a fairly loose analogy with the observed slowing of grasstree
growth during the transition from summer to winter. Dormancy induction is a process
controlled by many environmental factors (Perry 1971, Flint 1974). Although
photoperiod is regularly cited as a key agent controlling dormancy induction, this does
not appear to be the case with most components of the Australian flora (Specht &
Brouwer 1975, Paton 1978). Additionally, its effect can be overridden by temperature,
soil moisture, substrate nutrient concentrations and photoperiod light intensity (Perry
1971). Consistent with this conclusion is the greater difficulty in explaining the timing
of grasstree growth response to seasonal changes during autumn. X. preissii tends to
switch from rapid to slow leaf production near the end of May. The predictability of this
timing suggests that equally predictable climatic factors are responsible, such as
daylength or air temperature. Jarrah forest daily mean temperatures in May are similar
(15.0 ûC) to Groves' (1965) temperature threshold of 15.6 ûC, above which heath
vegetation at Wilson's Promontory in Victoria actively grew. Milder temperatures in
banksia woodland (compare Fig. 2.1a,b; mean daily temperature for May was 17.2 ûC,
and 15.9 ûC in June) may account for a slightly extended growing season in this habitat.
Leaf growth characteristics during autumn 1999 provide an exception to this
generalisation. The onset of early rains in autumn has the potential to release X. preissii
from a growth pattern tightly restrained by water availability, before the plant is forced
into a winter mode of growth. As a consequence of significant rain in late autumn, leaf
growth escalated for banksia woodland grasstrees (and to a lesser extent grasstrees in
jarrah forest), resulting in an extended growing season. Growth was apparently
prolonged prior to dormancy by ensuring good moisture and nutrient supplies (Zahner et
al. 1964). The inability of the temperature/rainfall regression model to predict the
elevated growth of banksia woodland grasstrees during July may be explained by the
complex interaction of controlling factors. Predicting leaf production during the
summer/winter transition period discussed here exposes a definite deficiency in the
second banksia woodland model (best r2 = 0.459). It is obvious that the use of a constant
may not always be appropriate to account for the potential variability in leaf production
that can occur during this period. This point is justified by the poor performance of the
Chapter 2 61
second jarrah forest grasstree regression in predicting nine months of data, independent
of those used to derive the model.
The change in grasstree growth characterising the period leading up to summer seems
primarily controlled by temperature, not unlike the phenomenon of vernalisation. Yet the
transition from autumn into winter is somewhat more complex, undoubtedly reflecting
the adaptation of X. preissii to a climatically unpredictable time of the year associated
with its distribution.
2.4.2 The role of temperature in the possible origin of grasstreephenology
By substituting leaf production for relative shoot growth, the leaf production response of
X. preissii to temperature (Fig. 2.13a,b) can be directly compared with overstorey
mesotherms (≅ subtropical; Eucalyptus and Banksia spp.), and understorey microtherms
(≅ warm temperate; Allocasuarina pusilla, Leptospermum myrsinoides) in the
mediterranean region of Australia (Fig. 2.21a,b from Specht & Dettmann 1995). When
water is not limiting, X. preissii responds to a range of temperatures most similar to that
of the mesotherm overstorey species. In the growing season, from late spring through to
autumn, leaf production increased with rising temperature (Fig. 2.13a,b), but as the full
temperature range for growth did not occur during my study, the observed leaf
production pattern resembled the truncated bell-shaped curve of mesotherm overstorey
species (Fig. 2.21a). Continuous growth of X. preissii during the cool winter tends to
contradict the classification of X. preissii as a mesotherm according to Specht and
Specht (1999), who classify mesotherms as those plants exhibiting a growth response
between 15�25 ûC. Although its growth characteristics at higher temperatures are
consistent with a subtropical rhythm, growth performance at lower temperatures indicate
that X. preissii can function under an unusually broad range of temperatures. The
thermal definition of a mesotherm by Nix (lower threshold 5 ûC and upper threshold 33
ûC, 1982) is more appropriate; adequately explaining why X. preissii as a mesotherm can
grow constantly over the annual range of temperature recorded during this study (10�26
ûC). In the banksia woodland where the canopy is naturally sparse (15% canopy cover at
YC, unpublished), it is not surprising that X. preissii behaves more like an overstorey
species than an understorey species. However, X. preissii also exhibits similar leaf
growth patterns in the jarrah forest, where the overstorey is considerably denser (73% at

Chapter 2 62
0
1
2
Sho
ot g
row
th (
cm) a) overstorey
0
1
0 10 20 30
Mean air temperature (ûC)
Sho
ot g
row
th (
cm) b) understorey
MC, Chapter 5). Following Specht's argument that it is the upper-stratum species that
have retained a subtropical (mesotherm) growth rhythm, this suggests that X. preissii
(likely to be a relatively old species) would have originated from an open habitat during
the subtropical early Tertiary and more recently radiated to habitats with more complete
canopies such as the jarrah forest.
Fig. 2.21 Relative growth increment of tagged shoots of upper-stratum species in the
mediterranean region of Australia (Keith, South Australia). (a) Overstorey mesotherm
Eucalyptus and Banksia spp. on nutrient-poor to average nutrient soils, and (b)
understorey microtherms Allocasuarina pusilla and Leptospermum myrsinoides on
nutrient-poor soil (from Specht & Dettmann 1995).
For a palm-like species, the crowded leaf arrangement and leaf size of X. preissii could
be viewed as a moderately intricate crown structure, that Specht and Dettman (1995)
associate with the microtherm growth rhythm of understorey species (see Introduction),
not the mesotherm rhythm retained by this grasstree. Despite the leaves approaching the
size of mesophylls (as described for the closely related species X. australis. Specht &
Rayson 1957a), in comparison with other related genera from more temperate climates
that have broad strap-like leaves, such as the cabbage trees (genus Cordyline) in New
Zealand, grasstrees in the genus Xanthorrhoea have comparatively fine, narrow leaves.
Adding to this, the presence of sunken stomata, thick cuticle and mesophyll, and much

Chapter 2 63
fibrous tissue (Staff & Waterhouse 1981, Fahn 1990, Shivas et al. 1998) suggest an
evolutionary response to water stress (Lamont et al. 2002). The most likely appearance
of these xeromorphic features in the genus would have occurred while exposed to
increasing water deficits on the outer boundaries of the distribution of subtropical
vegetation contracting with increased aridity during the late Tertiary-Pleistocene
(Hopper et al. 1996). In light of this understanding, leaf properties and crown structure
of grasstrees may have undergone considerable evolutionary modifications in combating
water stress, but, evidenced by the retention of a subtropical growth rhythm, do not
reflect selective pressures to increase the boundary layer hypothesised for understorey
species (Specht & Dettmann 1995).
With the increasing aridity of the Australian continent during the Pleistocene (starting
1.7 million years ago. Lamont et al. 1984, Hopper et al. 1996) it seems reasonable that
water availability would have played the greatest role in shaping the mediterranean
vegetation. From this perspective, the gradient from ground stratum species yielding
many small, densely packed leaves through to the upper stratum yielding fewer large
leaves (Specht & Specht 1999, South Australian heathland) may reflect a parallel
gradient of relative water stress (eg. Donovan & Ehleringer 1994). Perennial flora in the
ground stratum with shallow root systems are under the greatest selective pressures
imposed by water availability, while the overstorey species with large roots penetrating
to deep stored water are less affected. The intricate structure of the understorey would
therefore represent an adapted mechanism for water conservation, compensating for a
very limited root system. The fact that leaf morphology and crown structure does not
appear to have evolved to this extent in X. preissii indicates that its medium root system
(Crombie et al. 1988) is adequate to support summer growth. Bell and Stephens (1984)
working on Western Australian mediterranean flora concluded that the adaptive
significance of the different timing of shoot growth and flowering among this vegetation
was related to root depth and availability of soil moisture, complementing the theory of
leaf size reduction given here. This discussion has offered a likely explanation for the
bias in the evolutionary reduction of leaf size towards understorey species (Specht &
Dettmann 1995, Specht & Specht 1999), while offering an alternative theory for the
segregation of the timing in shoot growth of overstorey and understorey species.
Whether seasonal growth is temperature or water-limited will remain impossible to

Chapter 2 64
unravel among large plants that cannot be manipulated experimentally under controlled
conditions.
The truncated hysteresis temperature-response curve for grasstrees in jarrah forest (Fig.
2.13a) can be divided into two six month periods that experience the same range of daily
mean temperatures, September to February and March to August. Leaf production is
almost identical over the same temperature range for both periods. No seasonally-biased
environmental factors appear to be influencing leaf production. Specht and Specht
(1999) noted that over the same temperature range foliar growth of Corymbia
(Eucalyptus) intermedia during spring was greater than during autumn. Greater solar
radiation occurs during spring than autumn due to lower cloud cover and to a lesser
extent water vapour concentration, aerosols and ozone (Bruce W. Forgan, meteorologist,
Australian Regional Instrument Centre, Bureau of Meteorology, pers. comm.). This
difference may explain greater spring growth. Marginally greater leaf production
occurred during November than for the thermally equivalent period in April for jarrah
forest grasstrees, and is consistent with this explanation. Although scant data during
summer only permits speculation of the patterns of leaf production over this period,
there does not appear to be a seasonal effect of radiation on leaf production at any point
during the year.
The reverse trend is apparent for the banksia woodland grasstrees with autumn
supporting greater growth, but again this pattern is supported by few data. Slower
growth during spring may reflect partitioning of resources away from the foliage during
this period, and towards other active meristematic tissues, such as growing roots. The
dependency of the temperature-response curve of X. preissii on water availability
(compare Fig. 2.13a,b with Fig. 2.13c,d) poses a possible flaw in this approach for
explaining subtle effects of radiation on grasstree leaf production during thermally-
equivalent periods of the year. A simple version of the biological principle of limiting
factors states: a biological process, such as growth, cannot proceed faster than is allowed
by the most limiting factor (Fritts 1976). The criterion for selecting leaf production data
during conditions assumed to be unrestricted by water (vigorous growth observed in
conjunction with > 20 mm of rainfall) may still have been inadequate to ensure complete
independence from water availability. Therefore the pattern of leaf production described
in Figure 2.13b (and for that matter Fig 2.13a) may still reflect water availability. A
Chapter 2 65
review of this criterion to include soil moisture and/or plant water potential
measurements may resolve this dilemma.
2.4.3 The importance of water availability
Somewhat neglected to this point in the discussion is the importance water has on the
growth patterns of X. preissii. Due to a high water deficit during summer/autumn leaf
production may be reduced to levels below the winter baseline regardless of daily
temperature, and will only recover after sufficient rainfall either from the start of winter
rains or unpredictable, episodic summer rainfall. The growth patterns depicted in Figure
2.13a,b represent those data collected during periods not limited by water availability. If
all data were included, the relationship between leaf production and daily temperature
would easily be lost due to water availability effects. Clearly, water is the ultimate
limiting resource for growth during summer/autumn, to which the effect of temperature
is secondary.
As daily temperature fluctuates seasonally in a fairly predictable pattern, the extent of
growth within the summer growing season and to a lesser degree the length of the season
(mentioned earlier) is largely limited by availability of water. Although the use of
precipitation to predict phenology has often been regarded as misleading (Kummerow
1983), Fritts (1976) believes that in areas where extreme drought forms a part of the
annual seasonal cycle it is a highly useful predictor of growth variation. The latter holds
true for the growth of X. preissii where a rainfall variable was included in each
regression model, and for the banksia woodland grasstrees rainfall was by far the
strongest variable correlated with leaf production. Water sources present during summer
include saturated and non-saturated soil storage and unpredictable summer rainfall.
However, not all are available to X. preissii over this period. Grasstrees growing in both
habitats rely on winter/spring rainfall to replenish soil water stores prior to summer
drought. Poor leaf production following the unseasonally dry spring of 2000 implies that
recharge of soil moisture by winter precipitation was insufficient to guarantee a normal
flush of growth during early summer. X. preissii is a medium-rooted species, with its
roots reaching to the clay subsoil (1�5 m) in the jarrah forest habitat (Crombie et al.
1988), and to a depth of at least 6 m on the Swan Coastal Plain. The related species X.
australis also has an extensive root system reaching 3 m in heath vegetation, providing

Chapter 2 66
this species with a competitive advantage over smaller monocotyledons during periods
of drought (Specht 1981).
In the absence of rain during summer, X. preissii still exhibits some leaf elongation and
low rates of leaf production. Although this implies root contact with soil moisture, it also
testifies to a rooting depth unable to access permanent groundwater resources. At least
on the Swan Coastal Plain, the great depth to groundwater in banksia woodland near the
YC site (minimum depth = 12 m and maximum depth = 50 m; Water and Rivers
Commission) precludes X. preissii from using this resource. Grasstrees are extremely
responsive to summer precipitation, a trait observed for a number of other species in
mediterranean Australia (Specht 1957b, Lamont 1976, Crombie 1992). But as seen in
this study the effect of this source of water varies on the habitat. Differences in the
seasonal pattern of water availability and utilisation are a consequence of the broadly
contrasting substrates with different moisture relations on which they grow, that in turn
reflects the two distinctly different vegetation types dominating their habitats (Beard
1983).
Annual patterns of predawn and midday water potential were consistent with data
collected for X. preissii from the jarrah forest by other authors (Crombie et al. 1988,
Crombie 1992), yet values during summer drought were comparatively less negative
than other medium-rooted species (Dodd et al. 1984). With the progressive drying of
surface soil during summer, ΨPDX for X. preissii from both habitats reaches a seasonal
low in mid-autumn, following minimum ΨMDX associated with mid-summer and the high
diurnal maximum temperatures. However, at no point were the grasstrees water-stressed,
evidenced by ΨPDX maintained well above the ΨTLP. More specifically, this result
indicates that sufficient water was available for cell expansion and hence growth
(Meidner & Sheriff 1976), as leaf growth measurements show. Consistent with these
findings, Crombie et al. (1988) showed that X. preissii ΨPDX was maintained higher than
for deep-rooted jarrah trees during summer, and explained that very low stomatal
conductance and low rates of transpiration for X. preissii were responsible (Crombie et
al. 1988, Crombie 1992). In light of this explanation, continuous summer-autumn
growth and the maintenance of high ΨPDX must be met with a fine balance between
water loss and CO2 uptake. During periods of drought, plants manage stomatal
conductance to optimise the relationship between water loss and CO2 uptake, which

Chapter 2 67
describes water use efficiency (Mooney 1986). While midday stomatal conductance for
X. preissii is low during mid summer (0.05 cm s-1, Crombie 1992), possibly restricting
growth, it is likely that late afternoon and especially morning rates would be
significantly greater. In mediterranean habits radiation levels after dawn are sufficiently
high and evaporative demand sufficiently low to improve plant water use efficiency, and
consequently stimulate growth (Savé et al. 2000).
The greater responsiveness of X. preissii to summer rainfall on the coastal plain most
clearly illustrates the dichotomy of the soil properties between habitats. Water is
available to plants growing on the coastal sands at low tension because of the low
colloid content (Benecke & van der Ploeg 1981, Bettenay 1984). Effectively, plants
growing on sandy soils have an advantage over those growing on the heavier soils of the
Darling Range, as the sandy soils require less moisture to bring the soil back from an air-
dry condition into the available moisture range (Bettenay 1984). A minimum of
approximately 18 mm of rain is sufficient to rehydrate the soil in the banksia woodland
to a level available to X. preissii and penetrates deeply enough to reach active roots. In
contrast jarrah forest soils would require more than 18 mm of rainfall to achieve an
equivalent moisture level, before X. preissii could take up water to support new growth.
This obvious difference between grasstrees from the two habitats rules out the
possibility of water uptake via the leaves following rain (Rundel 1982), which was
suggested by the adhesive nature of wet grasstree leaves, retaining a film of water in
close contact with much of the crown. Water-repellency of the surface sand during
summer, caused by the accumulation of hydrophobic substances (eg. plant waxes),
would influence this minimum rainfall quantity necessary for growth (McArthur 1991,
Roper 1999).
The results from the simulated rainfall experiment (59.2 mm) indicate that water uptake
by grasstree roots occurred in the upper 33 cm of soil, suggesting that water absorption
following 18 mm of rain would also be within a third of a meter of the surface.
However, it is likely that rain interception by the foliage (Specht 1957a), or the natural
umbrella effect of a large skirt of air-dry thatch, may contribute to determining the
effective penetration of rainfall immediately below a grasstree. By the end of summer
the proximal end of the primary roots within this zone (upper 33 cm) are predominately
of a decorticated nature. The dying of the cortex is considered to occur in the roots�

Chapter 2 68
second year (Pate & Canny 1999), yet observations from the current study indicate that
this process may begin earlier, during the first summer drought period. Irreversible
structural adjustments of roots in response to decreasing soil water availability were
demonstrated for an evergreen sclerophyllous tree species growing in the Mediterranean
basin (Psaras and Rhizopoulou, unpublished, in Rhizopoulou & Davies 1991). Although
the structural changes reported in this study involved the development of periderm
(cork), the resulting low water permeability of these roots would be similar for the
decorticated roots of X. preissii, which are tightly bound by a strong sheath of lignified
fibres (Pate & Canny 1999). During the wet-season these decorticated roots produce fine
(< 1.5 mm), short-lived feeding roots (Pate & Canny 1999), which are unlikely to
survive to provide water uptake following sporadic summer rainfall. Therefore, it may
be speculated that the distal end of at least the new seasons� lateral roots must persist in
an intact form through summer and autumn, providing X. preissii with sufficient
permeable root surface to take advantage of water available during temporary soil
rehydration, following unseasonal rain. Because of the severe dryness characteristic of
the upper soil layer by late summer (McArthur & Bettenay 1974), it is likely that these
shallow, laterally orientated roots would rely on the redistribution (hydraulic lift) of
water from deeper profiles via vertical roots to sustain them in a condition capable of
water uptake immediately following rain. Hydraulic lift has been demonstrated to
recharge the lateral roots of Banksia prionotes from the Swan Coastal Plain with ground
water from the tap root during the night when demand by the shoot for water would be at
a minimum (Pate et al. 1998, Burgess et al. 2000). Also, the sandy root-sheath observed
to encrust grasstree roots probably offers protection of these roots against desiccation
and heat stress during the summer (Dodd et al. 1984). The information gathered from
studying the rapid water status and subsequent leaf production response of X. preissii
growing on the Swan Coastal Plain to artificial watering in autumn, clearly demonstrates
that this species remains in an active state throughout seasonal drought.
Leaf shedding can occur under extreme prolonged water deficit. However, with the
exception of Phyllanthus calycinus (Bell & Stephens 1984), regular summer
deciduousness cannot be supported by the relatively infertile Australian soils (Monks
1966). Instead, physiological control of leaf water relations is a more commonly adopted
strategy employed by Australian flora for surviving drought. Annual leaf production by
X. preissii was balanced by leaf death (dead leaves are retained) during 1999/2000, so

Chapter 2 69
that no substantial net increase or decrease in leaf area would have occurred. A similar
trend has been shown for heath vegetation in mediterranean South Australia (Specht
1957b). X. preissii leaf death occurred with great certainty during mid-summer each
year, corresponding with the period of fastest leaf production. Both the timing of leaf
death and the age of leaves at death were consistent with X. reflexa (Specht et al. 1981)
and consistent with observations made of other Australian species (Specht & Rayson
1957a, Gill 1964 from Specht & Brouwer 1975, Bell & Stephens 1984). The period
during which leaf death occurs remains relatively constant from year to year, yet the rate
of leaf death for X. preissii increased in response to drier summer conditions. As leaf
production in X. preissii responds negatively to dry summer conditions the annual ratio
of leaf death to leaf production, and therefore crown size, has the potential to change
annually dependent on summer growing conditions. It is then reasonable to assume that
the effect of either a poor or favourable summer may carry a legacy, in relation to crown
size (photosynthetic capacity), into the following year. In equatorial latitudes palms
show no season of active leaf fall or replacement, thus the crown is maintained
continuously (Staff & Waterhouse 1981). Unlike tropical palms, grasstrees experience a
season of drought, where bulk death of living foliage occurs. This drought induced leaf
death is consistent with results shown for a drought tolerant species of coastal sage (up
to 2 m) in California (Kolb & Davis 1994). However, leaf drop in the sage species was
closely coupled with extreme water potentials and embolism of xylem tissue (Kolb &
Davis 1994), which is definitely not the case in X. preissii. In this grasstree leaf death
appears to be triggered by reduced water availability and represents a phenological event
that acts to reduce water stress imposed by high transpiration rates from a crown of
maximum annual size.
2.4.4 Verification of the grasstree ageing and fire history technique
One of the primary objectives of the work described in this chapter was to identify
seasonality of grasstree growth and to correlate annual leaf production with the number
of leafbases within each pair of seasonal bands, in an attempt to validate the ageing
technique described by Ward et al. (2001). Here, verification of the technique has been
limited to these specific objectives, and a more comprehensive discussion can be found
in Chapter 6. The indistinguishable difference between the number of leaves produced
annually by X. preissii and the number of leafbases contained in one pair of seasonal
growth bands (one annual growth increment) confirms this technique. The findings
Chapter 2 70
presented here also support the assumption that the alternating cream and brown bands
on the stem reflect seasonal changes in growth (Ward et al. 2001). The ageing
component of the technique relies on a pattern of continuous annual growth
characterised by two distinct seasonal phases, established by my study.
If X. preissii had not revealed these growth characteristics it should not have been
possible to differentiate between adjacent annual growth increments as required by the
ageing technique. This interpretation is further supported by a comparison of grasstree
growth responses from the two habitats studied. The weaker seasonal pattern of leaf
production by grasstrees in the banksia woodland explains the difficulty experienced in
identifying annual growth increments compared with the jarrah forest grasstrees that
exhibit a more distinct seasonal growth rhythm.


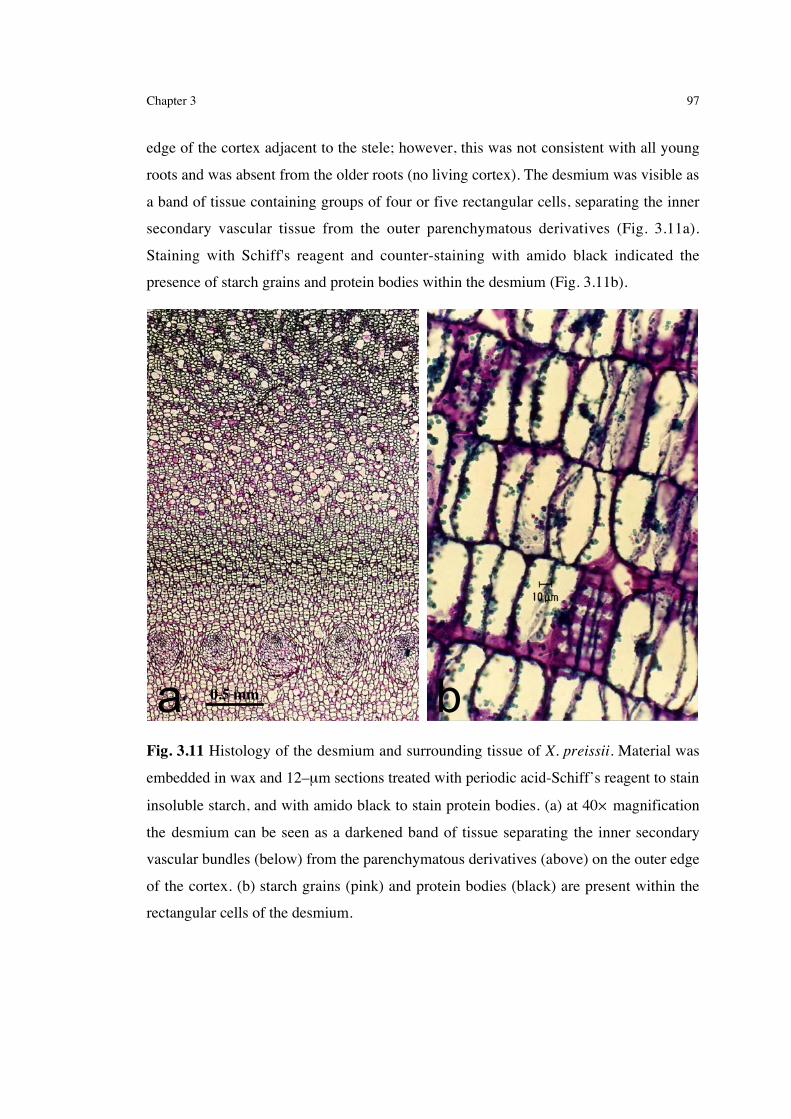
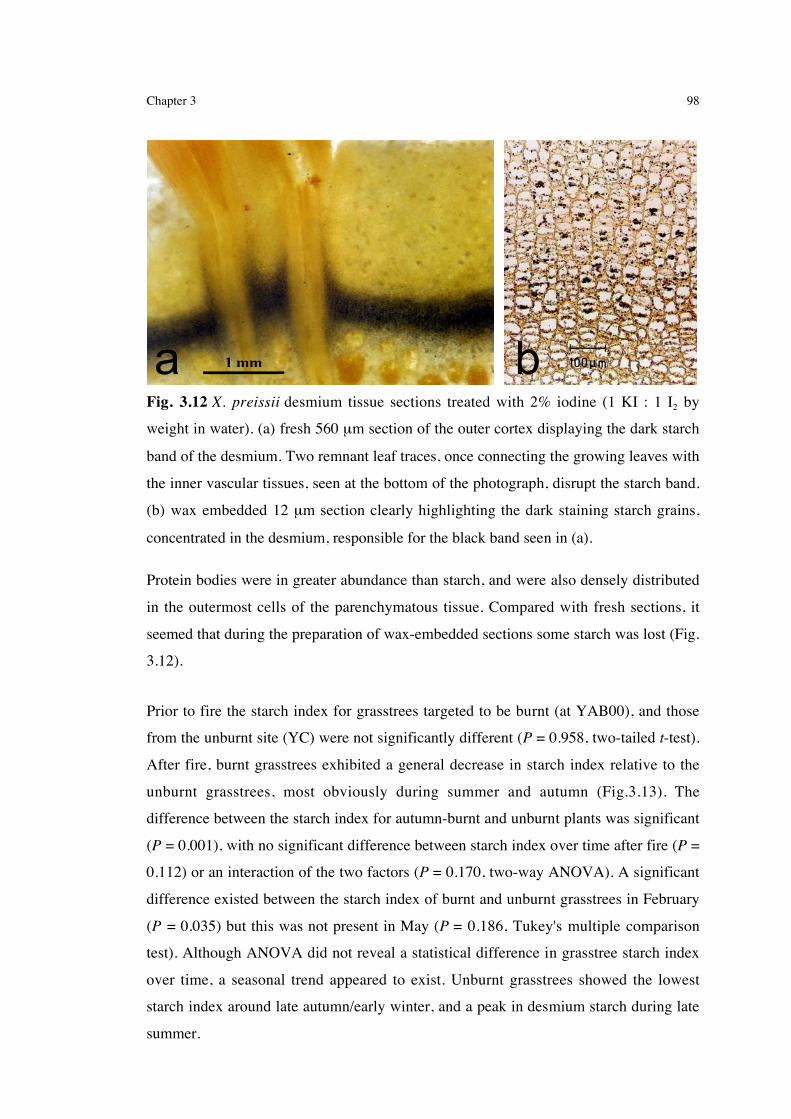


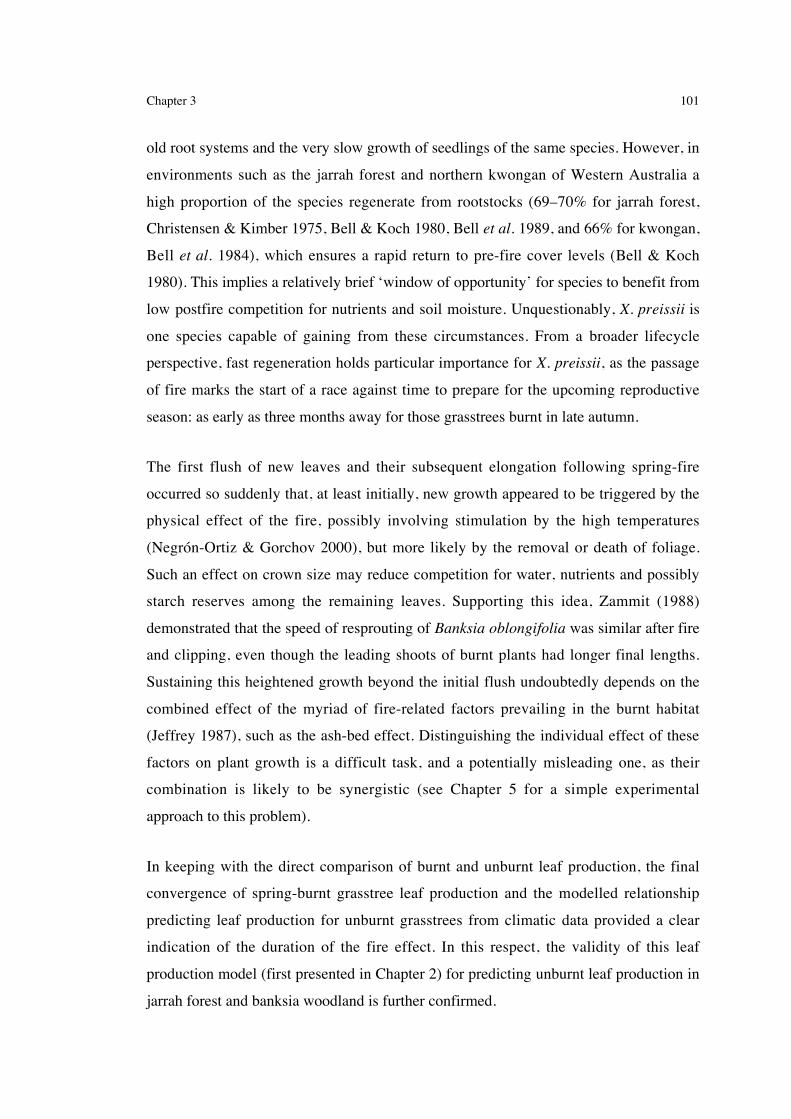


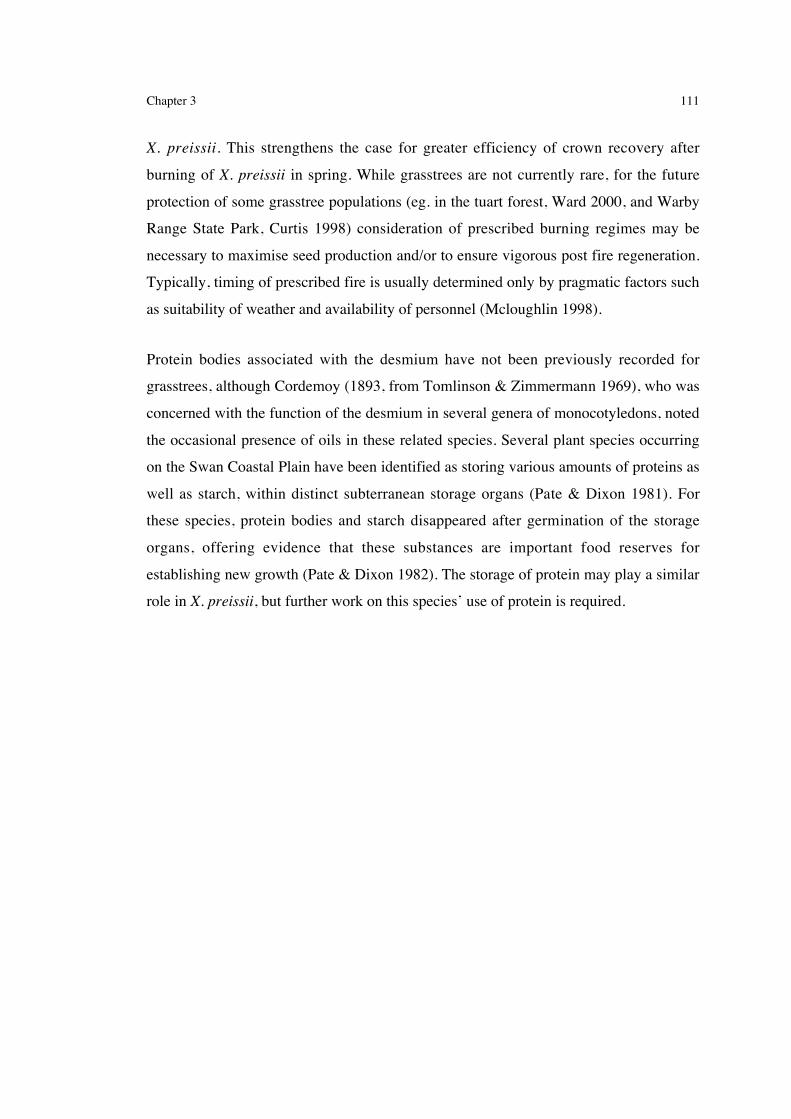

Chapter 4 112
CHAPTER 4
Reproduction in X. preissii and its associated costs
4.1 Introduction
The majority of Australia is susceptible to fire, with minor exceptions at the extremes of
the continent (Gill 1975, Francis 1981). The literature on flowering responses to fire in
Australian plants is not extensive (Staff 1989). However, Gill (1981a) lists the species
known to exhibit this phenomenon, and more have been identified since (eg. van der
Moezel et al. 1987). Of interest is the dominance of monocotyledons on this list,
including several species in the genus Xanthorrhoea. Grasstrees known to flower
following fire include X. australis (Specht et al. 1958), X. johnsonii (Bülow-Olsen et al.
1982), X. fulva (Taylor et al. 1998), and X. preissii (Meagher 1974, Lamont & Downes
1979, Ward & Lamont 2000), all of which flower far less frequently in the absence of
fire (Gill & Ingwersen 1976, Baird 1977).
While attempting to identify the individual components of the fire effect responsible for
triggering reproduction in grasstrees (Fig. 4.1a,b), no single factor has been
demonstrated to provoke a level of stimulation equal to fire (Gill & Ingwersen 1976,
Taylor et al. 1998). The initiation of flowering in other species, through the application
of smoke (Imanishi et al. 1986, Keeley 1993) has received considerable attention,
instigating experimental work involving exposure to ethylene (Gill & Ingwersen 1976,
Keeley 1993), a constituent of smoke (Jacobsen and Gill, unpublished, in Gill 1981a)
and often formed as a consequence of stress or injury (Mohr & Schopfer 1995, Hongo &
Oinuma 1998, Barker 1999). However, because some species respond positively to
smoke, but not to ethylene (Keeley 1993), and dependence of the response on exposure
time (Imanishi et al. 1986), isolation of the exact combination of factors involved has
not been achieved.
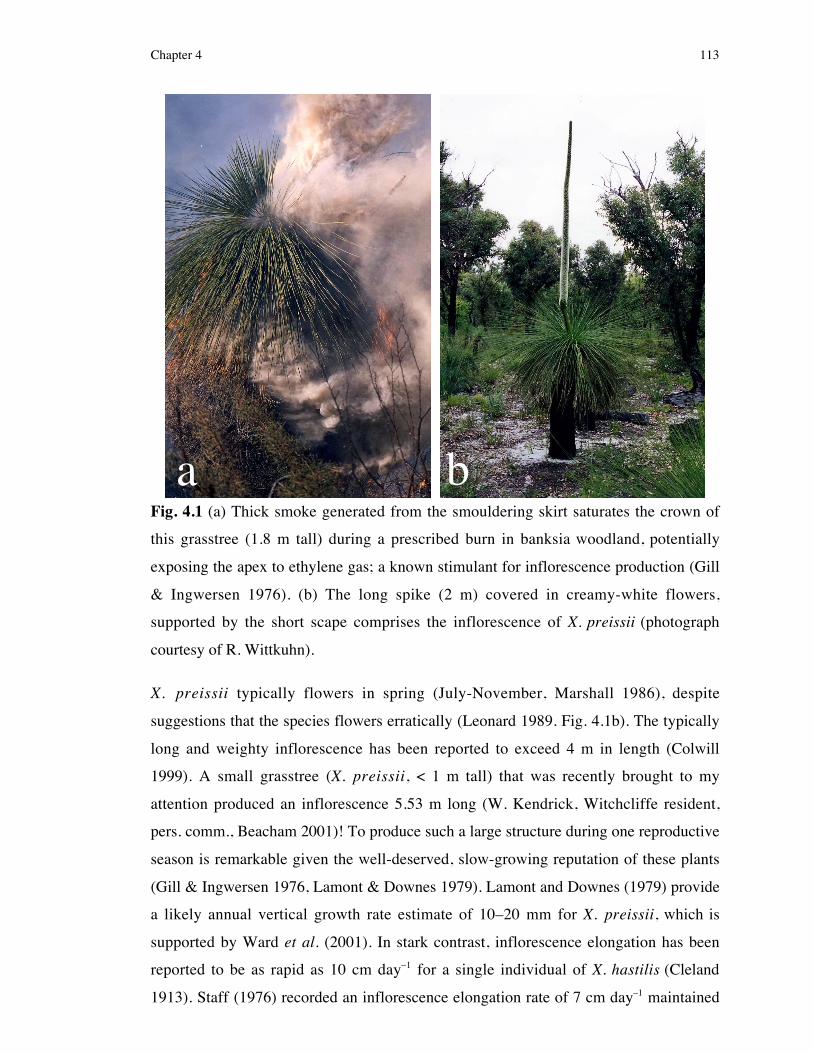
Chapter 4 113
Fig. 4.1 (a) Thick smoke generated from the smouldering skirt saturates the crown of
this grasstree (1.8 m tall) during a prescribed burn in banksia woodland, potentially
exposing the apex to ethylene gas; a known stimulant for inflorescence production (Gill
& Ingwersen 1976). (b) The long spike (2 m) covered in creamy-white flowers,
supported by the short scape comprises the inflorescence of X. preissii (photograph
courtesy of R. Wittkuhn).
X. preissii typically flowers in spring (July-November, Marshall 1986), despite
suggestions that the species flowers erratically (Leonard 1989. Fig. 4.1b). The typically
long and weighty inflorescence has been reported to exceed 4 m in length (Colwill
1999). A small grasstree (X. preissii, < 1 m tall) that was recently brought to my
attention produced an inflorescence 5.53 m long (W. Kendrick, Witchcliffe resident,
pers. comm., Beacham 2001)! To produce such a large structure during one reproductive
season is remarkable given the well-deserved, slow-growing reputation of these plants
(Gill & Ingwersen 1976, Lamont & Downes 1979). Lamont and Downes (1979) provide
a likely annual vertical growth rate estimate of 10�20 mm for X. preissii, which is
supported by Ward et al. (2001). In stark contrast, inflorescence elongation has been
reported to be as rapid as 10 cm day�1 for a single individual of X. hastilis (Cleland
1913). Staff (1976) recorded an inflorescence elongation rate of 7 cm day�1 maintained
a b

Chapter 4 114
over one week for X. australis, attaining maximum inflorescence length (up to 3 m) after
about 75 days.
The advantage of producing a tall conspicuous inflorescence to improve pollinator
attraction and resulting pollination success (Lortie & Aarssen 1999) is tempered by the
associated costs involved (Stephenson 1981, El-Kassaby & Barclay 1992, Karlsson et al.
1996, Obeso 1997). Understandably, costs are relative to the size of the floral display
and subsequent seed crop (Gross 1972), and therefore would be exacerbated for
grasstrees with more than one head, each producing an inflorescence (Fig. 4.2). Among
other things, forced trade-offs between fecundity (seeds), and survival and growth
(seedlings) are considered to be costs carried by reproduction (Silvertown & Dodd
1999). For grasstrees reproducing after fire, the costs of reproduction might be
compounded with those associated with survival and recovery of prefire plants in the
postfire environment. Often mechanisms exist which reduce the impact of these costs.
For example, carbon fixation by photosynthetic floral components can balance
respiration and contribute to the carbon investment associated with setting seeds
(Heilmeier & Whale 1987, Laporte & Delph 1996). Also, Ashman (1994) demonstrated
how significant amounts of nitrogen and phosphorus are reabsorbed from senescing
floral structures of the perennial plant species Sidalecea oregana ssp. spicata, mitigating
the cost of reproduction.
Fig. 4.2 A 1.6�m tall, 14�headed grasstree (Xanthorrhoea platyphylla) on the summit of
Bluff Knoll in Western Australia, with 12 heads supporting an inflorescence. In this
particularly energetically expensive case, a trade-off between inflorescence number and
size is likely.

Chapter 4 115
During the production of large inflorescences, as in X. preissii, carbon expenditure is
likely to be the most significant reproductive cost. Carbon demand is met from two
sources: carbohydrates produced daily through photosynthesis and resources assimilated
in previous years and stored in perennial tissues. Like X. australis (Staff 1989), X.
preissii exhibits sympodial growth, as the vegetative apex becomes the site of
inflorescence development during reproduction. Carbohydrates derived from carbon
fixation, used to support foliage growth in the vegetative state, probably become the
main energy source for the young elongating inflorescence. In the Mediterranean-
climate zone of Western Australia, many resprouting species rely on starch reserved in
specialised storage organs to support reproduction and regeneration following fire (Pate
& Dixon 1981, Pate et al. 1990, Bowen & Pate 1993, and Chapter 3). Starch is the most
important storage carbohydrate in higher plants, and is deposited as insoluble, compact,
semi-crystalline particles (starch grains) (Mohr & Schopfer 1995). The presence of
starch has been noted in a number of monocotyledons distinguished by having
secondary vascular tissue (Tomlinson & Zimmermann 1969), including the genus
Xanthorrhoea. Staff and Waterhouse (1981) indicated the presence of starch grains in
the secondary thickening meristem of X. australis, but did not attribute a function to
their presence. Even if one was to establish the role of this starch during reproduction,
the relative importance of the starch versus foliage-derived assimilates is a further
question not commonly addressed in studies of reproductive energetics.
Research addressing reproductive costs often neglect to consider the cost associated with
increased water demands created by the growth and maintenance of large inflorescences
and flowers. Water loss from floral structures can be substantial, leading to greater water
stress and potentially limiting reproductive performance (Whiley et al. 1988). Under dry
conditions, reduced photosynthetic capacity of plants displaying large flowers, which
may negatively affect growth, has been linked with stomatal closure to maintain turgor
by preventing water loss (Galen et al. 1999).
Inflorescence growth and the later setting of fruits by X. preissii is a seemingly energy-
expensive process, usually occurring within a short time of fire. The energy and water
demands of these plants while reproducing during this critical postfire period must
impact their growth, interrupting resprouting progress. Following reproduction,
grasstrees are left in a potentially vulnerable state: possibly depleted of stored resources

Chapter 4 116
and returning to a vegetative existence in late-summer when water availability is at a
yearly low (Wallace 1965, Beard 1984). I predicted that following further disturbance,
such as herbivore damage (McNee 1997) or even after the unlikely event of a second
patchy fire (Martin 1966, Lamont & Downes 1979, Jeffrey 1987, Abbott 2002), X.
preissii would suffer a reduction in leaf growth, reflecting the depletion of stored energy.
This chapter explores these possibilities through an investigation of vegetative and
reproductive growth, water status, and the energy resources available to X. preissii
during reproduction. Specifically, the contribution made by three sources of energy to
the production of the inflorescence and fruits following fire were studied. Firstly, it was
hypothesised that carbohydrates synthesised by the foliage on a daily basis are redirected
from production and development of new leaves to inflorescence elongation. Secondly,
starch stored in the desmium of X. preissii is consumed as an essential energy source
during reproduction. Lastly, as the inflorescence grows beyond the surrounding young
leaves it becomes green, suggesting a capacity for photosynthesis. Given the sheer size
of this organ it was predicted that it significantly contributes to its own growth and
maintenance, through the provision of its own assimilated carbon.
In Chapter 3, the implications of season of burn to the reproductive success of X. preissii
were outlined. In this chapter, this topic is addressed more fully. X. preissii can be burnt
as late as early winter and still flower in the following spring. However, the percentage
of grasstrees that do this is very low compared with the percentage that flower in
response to spring or autumn fires (Lamont et al. 2000). For the winter burnt plants that
do reproduce in the first postfire spring, little time exists in which to resprout a new
crown, possibly jeopardising inflorescence growth and seed development. This
interpretation was investigated.

Chapter 4 117
4.2 Materials and methods
4.2.1 Effect of reproduction on leaf production, leaf mass and waterrelations
A jarrah forest site in the Darling Range (MSB98, refer to Table 1.1) and a banksia
woodland site on the Swan Coastal Plain (YSB98, refer to Table 1.1) were chosen for
this work. Both sites were burnt in the spring of 1998 and all work was replicated at
each site. The study was conducted from 1 September 1999 to 18 April 2000 timed to
include the reproductive phenology of X. preissii. Distinguishing reproductive grasstrees
from vegetative ones before the emergence of the young inflorescence proved to be
impossible, a problem also encountered by Staff (1976). For this reason six grasstrees
from the jarrah forest site and seven from the banksia woodland site, with small
inflorescences (under 85 cm tall), were selected to monitor leaf production,
inflorescence elongation and phase of reproduction. A further six grasstrees, assumed to
be vegetative (in time this was confirmed by the lack of an inflorescence), were selected
from both sites for comparison. All plants were similar in size. Including the
inflorescence, each grasstree was sprayed until saturation (the plant was dripping with
the solution) every 10 days with a 1.3% solution (v/v in water) of a commercial, non-
systemic, broad-spectrum, synthetic, pyrethroid insecticide (Mavrik ®, Sandoz Ltd.,
Basle, Switzerland and distributed by Arthur Yates and Co. Ltd, NSW, Australia). This
treatment was intended to protect developing inflorescences from the boring larvae of
the moth, Meyriccia latro (Common 1990), previously cited and synonymous with
Hyaletis latro (Edmonds & Specht 1981) and Hylaletris latro (Staff & Waterhouse
1981). Several larval specimens of this species were housed in a rearing chamber at
room temperature, to permit the collection and identification of the adult moth (Brian
Heterick, entomologist, Curtin University, pers. comm.). Previous studies on unrelated
native plants have used both systemic (Krupnick & Weis 1999) and non-systemic
insecticides (Zammit & Hood 1986, Wallace & O'Dowd 1989, Vaughton 1990).
However, the majority has argued for use of the latter. Non-systemic insecticides are
more effective against Lepidoptera and effectiveness is not reduced by plant size or
woodiness (Zammit & Hood 1986). Although non-systemic insecticides are less likely to
influence plant performance (Louda 1984), the effect of Mavrik on leaf production and
growth was tested (refer to Section 4.2.1.3 below) to confirm absence of confounding
factors.

Chapter 4 118
4.2.1.1 Leaf production and inflorescence elongation and the phase ofreproduction
At the start of the monitoring period the innermost leaves of each selected grasstree were
tagged with electrical cable markers (Critchley Pty Ltd, Castle Hill, Australia), the
length of the young spike measured and the health of the inflorescence described. Both
sites were visited every 15�38 days. On each repeat visit the number of new leaves
produced (number of leaves smaller than those tagged previously), length of spike,
health of the inflorescence and reproductive phase was recorded for each plant.
Grasstrees damaged by grubs were omitted from the study, and when available, a nearby
grasstree exhibiting a similar phase of reproduction was substituted into the sample.
4.2.1.2 Leaf mass and water relations
On three occasions over the reproductive season in both habitats, September (16 for
jarrah forest and 10 for banksia woodland), December (17 and 23 respectively) and
March (4 and 6 respectively), xylem water potential (ΨX) was measured predawn and
midday for six reproductive and six vegetative, randomly selected grasstrees. ΨX was
measured on one intermediate leaf (refer to Section 2.2.5.1 for method) from each plant
using a pressure chamber (custom-built for Curtin University of Technology).
At both sites, predawn inflorescence water content (WC) was measured on 6�10
randomly selected grasstrees and leaf dry weight was determined for three leaves
collected from six reproductive and six vegetative grasstrees. A 10 cm sample was sawn
from the middle of each spike and immediately sealed in an airtight plastic bag. Fresh
weight was determined by subtracting the air-dried bag weight from the weight of the
sealed bag containing plant material. Dry weight was measured after plant material was
dried at 70 ûC for 48 h or constant weight. WC was calculated as a percentage of fresh
weight:
WC (%) = (fresh weight � dry weight)/fresh weight × 100
4.2.1.3 Testing the effect of insecticide on leaf production and growth
Mavrik is designed to control a variety of chewing and sucking insects by contact (active
constituent 7.5 g/L Fluvalinate). Eight grasstrees from the two unburnt control sites on
the Darling Range and on the Swan Coastal Plain (MC and YC; refer to Table 1.1) were

Chapter 4 119
used to test the effects of Mavrik. Over a period of 110 days coinciding with the growing
season (1 September to 20 December) four of the plants were sprayed until saturation
every 10 days with a 1.3% solution (13 ml Mavrik in 1 L of water) and the remaining
four were sprayed with the same quantity of deionised water. Leaf production, young
leaf elongation, intermediate leaf elongation and mature leaf death were recorded (refer
to Section 2.2.2 for details of method).
4.2.2 Effect of season of burn on inflorescence and seed biomass
At two sites on the Swan Coastal Plain (YAB00, burnt in autumn 2000 and WSB99,
burnt in spring 1999; Table 1.1) 15 inflorescences produced in spring 2000 were
harvested (on 15 February 2001 and 19 February 2001 respectively). Inflorescences
were selected on a random walk through the study site by the observer, omitting any that
appeared to have suffered grub damage. Each inflorescence was cut into short sections
and placed in a labelled paper bag. All bags were dried at 65 ûC for one week or until
constant weight. Dry mass of the scape and spike was determined separately after
remaining seeds had been shaken loose. A sample of 1�20 oven dried seeds was
weighed for each spike holding seeds (10 spikes from YAB00 and 13 spikes from
WSB99) to determine mean seed mass.
4.2.3 Effect of reproduction on caudex starch reserves
This work was developed from a preliminary investigation that revealed a visual
reduction of desmium starch in grasstrees that had flowered compared with their
vegetative counterparts (Fig. 4.3a,b). Burnt in spring 1999, the site chosen for this work
(WSB99; Table 1.1) was typical of banksia woodland on the Swan Coastal Plain. On
four occasions samples of desmium tissue were collected from the caudex of four
vegetative and four reproductive grasstrees, by drilling through the layer of leafbases on
the stem and using a cork corer to remove desmium (refer to Section 3.2.5.1 for detail).
Grasstrees were sampled between 11 September 2000 and 16 February 2001, during
critical stages of reproduction: inflorescence < 0.5 m, inflorescence > 2 m, inflorescence
with swollen fruits, and seeds released. Desmium samples were hand-sectioned, stained
with 2% iodine solution (1 KI : 1 I2 by weight in water) and then mounted in a
water/glycerol medium for examination under a dissecting scope in order to determine

Chapter 4 120
the starch index (a relative measure of the status of the starch reserves). A detailed
description of the preparation and analysis technique is given in Section 3.2.5.1.
Fig. 4.3 A transverse section through the stem of a (a) vegetative and a (b) reproductive
grasstree. Staining with iodine highlights the location of starch (the fine, dark line at the
16 cm mark) in the desmium tissue, which separates the leafbases from the inner fibrous
core. Note the difference in the width of the line of starch between the two sections.
4.2.4 Experiment 1: The effect of leaf removal followingreproduction on further leaf production
The jarrah forest spring-burnt site (MSB98; Table 1.1) was chosen for the purpose of
this field-based experiment. The study commenced on 3 February 2000 at the time of
seed release from the plants. A further six plants, at a similar stage of reproduction, were
added to the grasstrees used for leaf production and inflorescence monitoring (refer to
Section 4.2.1.1), increasing the sample to 12. Three of the new and three of the original
grasstrees were randomly allocated to a leaf clipping treatment while the remaining
plants were monitored as controls. The six control plants were left intact with the
smallest innermost leaves tagged (as described in Section 4.2.1.1) and the remaining six
had the existing green foliage removed using secateurs, leaving only the old, dry
flowering spike. During the experiment cylindrical wire cages were placed over each
plant crown to prevent kangaroo grazing. Light interception by the cages was assessed
by measuring photosynthetically active radiation (PAR) above the crown of all
a b

Chapter 4 121
grasstrees, with and without the cage protection, using a quantum sensor (model LI-
185B, Li-Cor Inc., Lambda Instruments Corporation, Nebraska, USA). These
measurements were made within a 45�min period over midday. The site was visited
every 14 to 38 days, when the number of new leaves produced by all grasstrees was
recorded. At the end of the experiment, on 26 July 2000, the desmium tissue of each
grasstree was sampled for starch reserve analysis (starch index determination; Section
3.2.5.1).
4.2.5 Experiment 2: The relative significance of grasstree energysources to inflorescence production
Locating a site with sufficient individuals of X. preissii that were in the early stages of
inflorescence elongation was critical to the success of this experiment. The banksia
woodland site burnt in spring 1999 (WSB99; Table 1.1) met this requirement. By
walking through the site examining all single-stemmed plants encountered, 28 grasstrees
with emerging young inflorescences were located, marked with flagging tape and
mapped. For each grasstree, inflorescence dimensions (length and circumference) and
health (score 1�5; where 5 was light green, fresh in appearance with no grub damage,
and 1 was brown markings, dry tip or grub damage) were recorded, as well as plant
height and stem circumference 0.4 m from the ground. Twenty plants with the shortest
(youngest) inflorescence and highest health score were selected from the sample. This
allowed a complete study of treatment effects, independent of grub or other damage.
Each plant was allocated to one of four �covering� treatments (4 September 2000):
foliage only covered, inflorescence only covered, both foliage and inflorescence covered
and no cover (Fig. 4.4a�c). Foliage was covered using two layers of 90%, woven green
shade cloth (Coolooroo®, Melbourne, Australia) loosely draped over the grasstree and
secured at the base of the stem with rope. Inflorescence cover consisted of a custom-
made pale green polyester-cotton sock, which slid down over the spike and pushed
tightly into the surrounding foliage where the scape arose. Both cover types met the
requirements of a sufficiently loose weave to allow some air circulation while reducing
photosynthetically active radiation (PAR) to less than 5 % (Table 4.1). Fitzpatrick and
Nix (1970) estimated that the relative dry matter production under this light regime was
< 12%. PAR was measured for open sun and under the two cover types using a quantum
sensor (model as above). Mavrik was applied to all inflorescences before covering and
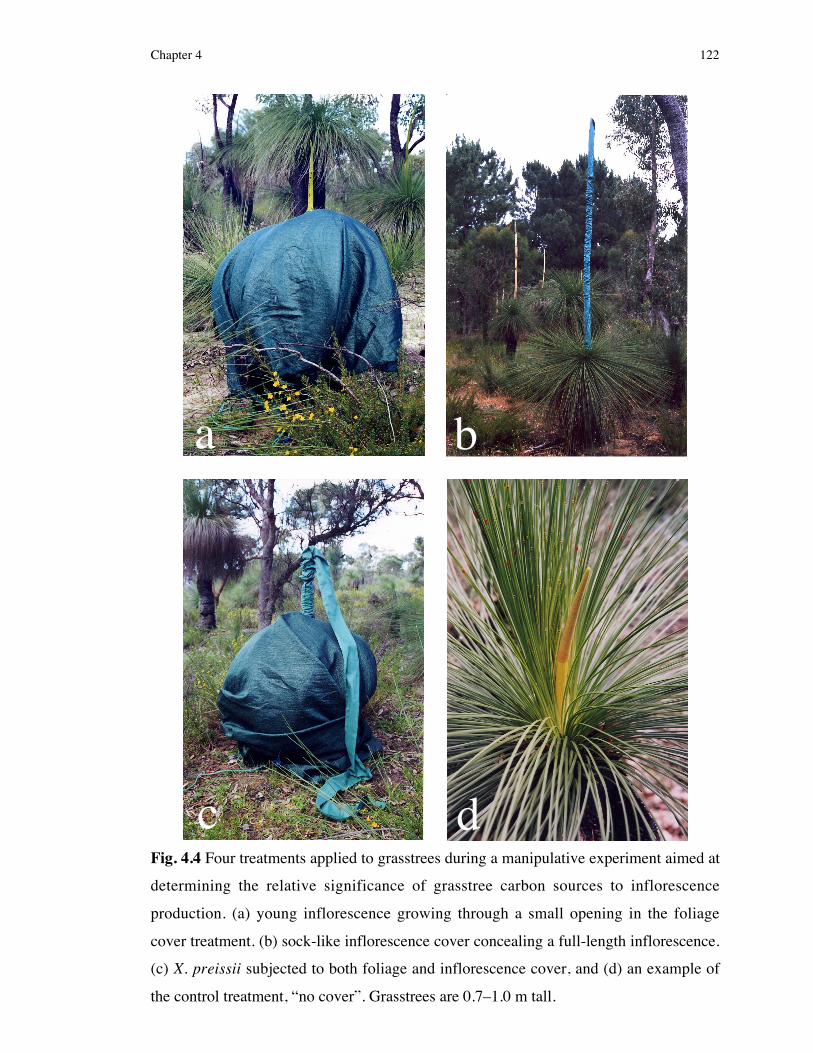
Chapter 4 122
Fig. 4.4 Four treatments applied to grasstrees during a manipulative experiment aimed at
determining the relative significance of grasstree carbon sources to inflorescence
production. (a) young inflorescence growing through a small opening in the foliage
cover treatment. (b) sock-like inflorescence cover concealing a full-length inflorescence.
(c) X. preissii subjected to both foliage and inflorescence cover, and (d) an example of
the control treatment, �no cover�. Grasstrees are 0.7�1.0 m tall.
a b
dc

Chapter 4 123
repeatedly applied to all plants in accordance with the manufacturer's instructions
(solution of 13 mL Mavrik in 1 L water, every 10 days). The site was visited every 5 to
13 days during which inflorescence length was measured and inflorescence health
recorded. Two plants were replaced within a short time of commencing the experiment
due to severe grub damage, despite insecticide treatment. Once elongation had ceased
and the plant was in flower (14 November 2000), all inflorescences were harvested, cut
into small lengths and stored in labelled paper bags. Due to the high moisture content
and density of the material each bag was dried for one week at 65 ûC or until constant
weight before biomass could be determined. Samples of desmium tissue were also
collected from each grasstree and analysed for relative starch content (starch index;
method described in Section 3.2.5.1).
Table 4.1 Photosynthetically active radiation (PAR) measured in the open and under
both treatment cover types. PAR is given as the mean ± SE with n in parentheses, and is
also expressed as a percentage of full sunlight.
Cover type PAR (µmol m�2 s�1) PAR in full sunlight %
None (full sunlight) 1089.0 ± 184.4 (10) 100.0 ± 0.0Foliage cover 4.6 ± 0.8 (5) 0.7 ± 0.2Inflorescence cover 25.6 ± 7.2 (5) 2.3 ± 0.6
Using the following procedure, an estimate was made of the mass of total carbon, in the
form of starch, available to the developing X. preissii inflorescence. The inflorescence
mass and starch index of the reproductive grasstrees subjected to both cover types, and
also the starch index of four similar-sized vegetative plants, sampled one week later, was
used. The starch index for each reproductive grasstree (SIREPROD) was divided by the
mean starch index for the vegetative grasstrees (SIVEG) to give the fraction of starch
remaining (SpREMAIN) after inflorescence production.
SpREMAIN = SIREPROD/SIVEG
The proportion of starch used (SpUSED) to produce the inflorescence was (1 � SpREMAIN). It
was assumed that the final inflorescence mass of those grasstrees with both foliage and
inflorescence covered was derived from carbon stored as starch in the desmium, and a
relatively small fraction from protein and mineral nutrients. Witkowski and Lamont
(1996) calculated that mineral nutrients comprised less than 2% of the dry mass of the

Chapter 4 124
flower heads and canopy leaves of Banksia hookeriana. Assuming a similar relationship
for X. preissii, it follows that the mass equivalent of SpUSED is equal to the inflorescence
mass (MINFL) minus 2% (mineral nutrients), but added to this is the mass of starch
required for the energetic costs of starch hydrolysis and the subsequent synthesis of
tissues. To estimate this allowance, data from Villar and Merino (2001) was used. In
their study, a calorimetric method was employed to calculate the leaf construction cost
for several chaparral and mediterranean forest woody species from Spain and California
as 1.5 g glucose/g tissue mass (ie 50% cost). As the pathway to convert stored starch to
tissue requires only 12.5% of the total ATP equivalence of energy used to produce tissue
via the fixation of CO2 (collated from Salisbury & Ross 1992), 13% of the portion of the
construction cost allocated to synthesis of tissue by Villar and Merino was considered
reasonable to account for the respiratory costs of grasstree inflorescence production (ie
6%). Therefore, to estimate the total mass of starch available (MAVAIL) to X. preissii
before reproduction the mass equivalent of SpREMAIN was added to MINFL, in addition to
the further 6% for respiratory costs, minus 2% to account for the mineral nutrient
contribution (ie 100% + 6% � 2% = 104%).
MAVAIL = ((SpREMAIN/SpUSED × MINFL) + MINFL) × 1.04
Leaf and inflorescence surface temperatures were measured for each plant on a typical
fine, sunny day for the time of year (22 September 2000). Temperatures were recorded
hourly from 11:00 to 14:00 (hottest part of the day) using an infrared field thermometer
(model PRT-10L, Barnes Engineering Company, Connecticut, USA). For comparison,
to assess the likelihood of grasstrees overheating under covering treatments, mean
maximum daily temperature was obtained for the period of highest leaf production (see
Fig. 2.6b in Section 2.3.1.1 for details regarding leaf production) for grasstrees from the
YSB98 site one year after fire: the same timing since fire as for the site WSB99, used in
this experiment.
Comparing relative fluorescence values with those for the foliage was used as a novel
approach to detect the ability of the inflorescence to photosynthesize. Fluorescence was
measured for each leaf category (see Section 2.2.2 for a description of leaf categories)
and inflorescence (scape and spike separately), after a 20�min dark adaption period,

Chapter 4 125
using a fluorescence meter (Plant Stress Meter Mark II, Biomonitor AB SCI, Umea,
Sweden). Measurement of relative fluorescence (Fv/Fm) was made, which is given by:
(Fm � Fo)/Fm = Fv/Fm,
Where Fm = maximum fluorescence, Fo = base level fluorescence, and Fv = maximum
variable fluorescence.
4.2.6 Statistical analysis
All statistical data analysis was performed using SPSS 10.0 software program (SPSS
Inc., Chicago, USA). Examination of residual stem-and-leaf plots, as well as the
calculation of the Shapiro-Wilks statistic, was used to test for normality. Levene's test
was employed to test for homogeneity of variances. Based on the outcome of this data
screening some data were square root or log transformed to meet the assumptions of
each statistical test. All transformed data are presented as untransformed means. In the
case where data transformation did not improve variance homogeneity a non-parametric
test was used.

Chapter 4 126
4.3 Results
4.3.1 Leaf and Inflorescence growth
As early as March, inflorescence primordia were noted buried among the leaves
surrounding the apex during the dissection of grasstrees burnt the previous spring. At
both sites inflorescence elongation was first identified in late August/September
reaching a maximum growth rate during October, before ceasing in late November (Fig.
4.5). Despite grasstrees from the two habitats having a similar phenology, spike
elongation rates in banksia woodland were consistently greater, resulting in a taller
Fig. 4.5 Inflorescence elongation rate of grasstrees growing in jarrah forest and banksia
woodland measured during 1999. Data are the mean of 5�6 plants for each measurement
period (horizontal line) ± SE.
mature spike (2.7 ± 0.4 m (mean ± SD), contrasted with 1.3 ± 0.3 m for jarrah forest
inflorescences). During spike production and maturation, leaf production was greatly
reduced at both sites (Fig. 4.6a,b). Initially, the rates of leaf accumulation (expressed as
the slope of the lines in Fig. 4.6a,b) for vegetative and reproductive grasstrees slowly
diverged, but increased markedly following maximum spike elongation. Leaf
accumulation by the reproductive plants in both habitats demonstrated little sign of
recovery until after seed release in late January/early February. Over the period of
reproduction, the vegetative leaf accumulation rate was 4.6 times greater in jarrah forest
and 3.0 times greater in banksia woodland than the corresponding rates for reproductive
plants. This difference in leaf production rate accounted for an average production of
216 and 239 extra leaves by the vegetative grasstrees in the jarrah forest and banksia
0
20
40
60
Aug Sep Oct Nov Dec
Inflo
resc
ence
elo
ngat
ion
(mm
/d)
banksia woodland
jarrah forest
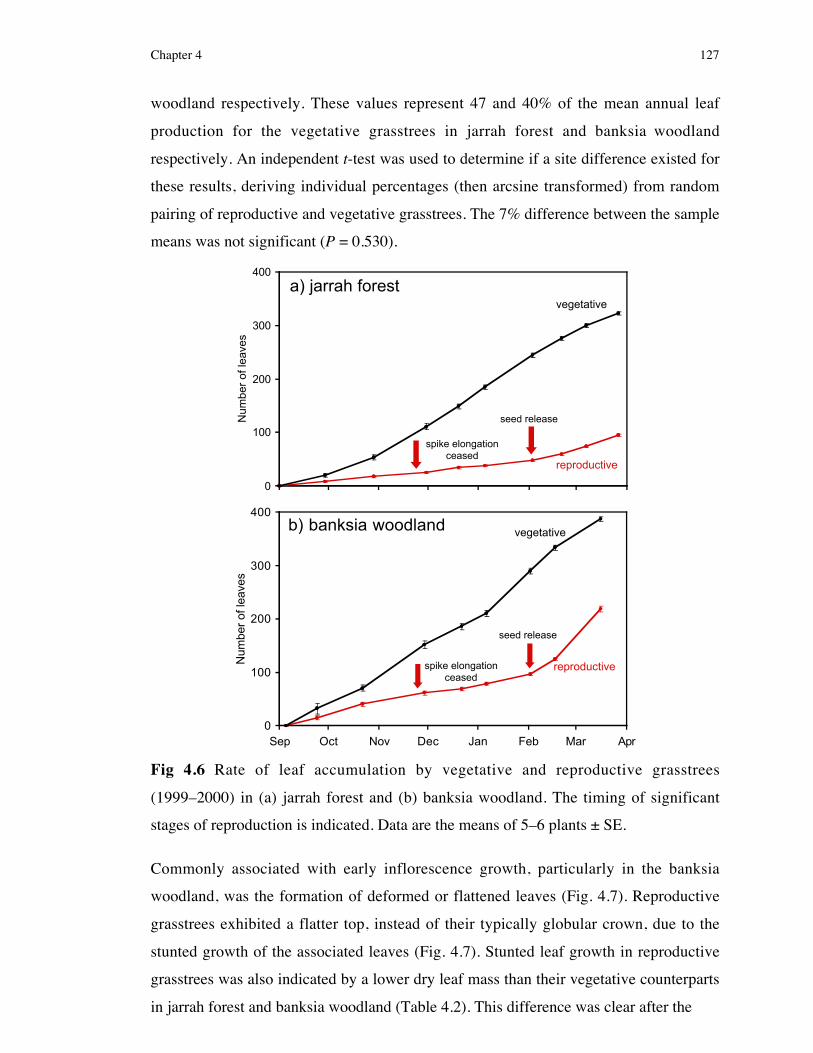
Chapter 4 127
woodland respectively. These values represent 47 and 40% of the mean annual leaf
production for the vegetative grasstrees in jarrah forest and banksia woodland
respectively. An independent t-test was used to determine if a site difference existed for
these results, deriving individual percentages (then arcsine transformed) from random
pairing of reproductive and vegetative grasstrees. The 7% difference between the sample
means was not significant (P = 0.530).
Fig 4.6 Rate of leaf accumulation by vegetative and reproductive grasstrees
(1999�2000) in (a) jarrah forest and (b) banksia woodland. The timing of significant
stages of reproduction is indicated. Data are the means of 5�6 plants ± SE.
Commonly associated with early inflorescence growth, particularly in the banksia
woodland, was the formation of deformed or flattened leaves (Fig. 4.7). Reproductive
grasstrees exhibited a flatter top, instead of their typically globular crown, due to the
stunted growth of the associated leaves (Fig. 4.7). Stunted leaf growth in reproductive
grasstrees was also indicated by a lower dry leaf mass than their vegetative counterparts
in jarrah forest and banksia woodland (Table 4.2). This difference was clear after the
0
100
200
300
400
Num
ber
of le
aves
seed release
spike elongationceased
a) jarrah forestvegetative
reproductive
0
100
200
300
400
Sep Oct Nov Dec Jan Feb Mar Apr
Num
ber
of le
aves
spike elongationceased
seed release
vegetative
reproductive
b) banksia woodland

Chapter 4 128
Fig. 4.7 (Left) deformed leaves (3 on left) collected from near the apex of a grasstree
with a young inflorescence, and equivalent aged normal leaves (3 on right) from a
vegetative grasstree. Scale in cm. (Right) a grasstree apex ground down to the leafbases
to reveal an old inflorescence scape (about 2.5 cm diameter) adjacent to the new apical
meristem (photograph courtesy of B. Lamont). Note the reduced size of the leafbases
that would have been coincident with the timing of the flowering event, contrasted
against the normal size of the new leaves around the new apex.
Table 4.2 Intermediate leaf dry mass (g/leaf) for vegetative and reproductive grasstrees
in jarrah forest and banksia woodland, over the period spring 1999 to autumn 2000. Data
are means of six plants. The non-parametric Friedman test indicates significance
between vegetative and reproductive grasstrees in jarrah forest, and two-way ANOVA
compares the two plant categories over time in the banksia woodland.
Jarrah forest Banksia woodland
Time Vegetative Reproductive Vegetative Reproductive
September 0.486 0.347 0.890 0.936
December 0.508 0.376 1.087 0.956
March 0.430 0.273 0.979 0.674
Two-way ANOVALifecycle phase (L) P < 0.0001Time (T) P < 0.0001L × T P < 0.0001Friedman test P = 0.029
New growtharound new
apex
Scape
Leaves grown at thetime of reproduction

Chapter 4 129
first measurement in September in jarrah forest, and after the December measurement in
banksia woodland. Leaf mass for the banksia woodland grasstrees varied over time and
there was an interaction effect between lifecycle phase and time. The latter was a
consequence of both vegetative and reproductive grasstrees having equivalent leaf mass
during September, if not marginally lower for the vegetative plants.
4.3.2 Water relations
Mean inflorescence water content (WC) measured at predawn was consistent for X.
preissii in jarrah forest and banksia woodland (Fig. 4.8). Initially starting at 81�83 %
during early September, inflorescence WC dropped to 70�71 % three weeks after the
peak of flowering. Predawn and midday ΨX was not significantly different over time.
However, a significant difference existed between sites (Table 4.3), with jarrah forest
Fig. 4.8 Inflorescence water content, expressed as a percentage of fresh weight, for X.
preissii in jarrah forest and banksia woodland during the 1999/2000 reproductive season.
Data are means of 6�10 plants ± SE.
Table 4.3 Three-way ANOVA summary of xylem water potential for X. preissii during
vegetative and reproductive phases, at three times (September 1999, December 1999 and
March 2000) over the reproductive season, and in jarrah forest (MSB98) and banksia
woodland (YSB98).
P Predawn P MiddayLifecycle phase (L) 0.431 0.002Time (T) 0.621 0.834Site (S) 0.001 0.008L × T 0.686 0.862L × S 0.594 0.965T × S < 0.0001 0.016L × T × S 0.590 0.736
0
20
40
60
80
100
Sep Oct Nov Dec Jan Feb Mar Apr May
Wat
er c
onte
nt (
%)
3 weekspost-flowering
jarrah forest
banksia woodland

Chapter 4 130
grasstree ΨX marginally lower (Fig. 4.9a,b). The lowest (most negative) predawn ΨX
was �0.94 MPa and the lowest midday was �2.25 MPa, although most measurements
were considerably higher (Figure 4.9a,b). Predawn, no significant difference existed
between vegetative and reproductive ΨX, but the reproductive and vegetative midday
ΨX, illustrated in Figure 4.9b, were significantly different (Table 4.3).
Fig. 4.9 Xylem water potentials measured (a) predawn and (b) midday on vegetative
(solid) and reproductive (open) grasstrees in jarrah forest (✝) and banksia woodland
(✝) over the 1999�2000 reproductive season. Data are means of six plants ± SE.
4.3.3 Testing the effect of insecticide on leaf production and growth
All measures of leaf production, elongation and death indicated no significant difference
between the performance of grasstrees sprayed with Mavrik and those sprayed with
deionised water (Tables 4.4 and 4.5). Furthermore, the only significant results
demonstrated that both sprayed and unsprayed grasstrees experienced a consistent
change in leaf progression over time (Table 4.5).
-2
-1
0
Wat
er p
oten
tial (
MP
a)
a) predawn
-2
-1
0
Sep Oct Nov Dec Jan Feb Mar Apr
Wat
er p
oten
tial (
MP
a)
2000
b) midday

Table 4.4 Leaf production rates (mean ± SE leaves/d, and n = 4) of grasstrees during the growing season (spring/summer) either sprayed
with Mavrik or not sprayed, and growing in either jarrah forest or banksia woodland. P-values indicate the results of a two-way ANOVA
conducted for each habitat.
Jarrah forest Banksia woodland
Time September October November December September October November December
Leaf production
Sprayed 0.93 ± 0.13 0.73 ± 0.04 1.11 ± 0.29 1.21 ± 0.24 0.63 ± 0.15 0.68 ± 0.18 0.46 ± 0.10 0.61 ± 0.24
Not sprayed 1.04 ± 0.33 1.10 ± 0.21 1.10 ± 0.37 1.33 ± 0.25 0.75 ± 0.08 0.64 ± 0.24 0.88 ± 0.33 0.50 ± 0.14
Two-way ANOVA
Spraying (S) 0.643 0.623
Time (T) 0.165 0.856
S × T 0.675 0.425

Chapter 4 132
Table 4.5 Elongation rates (% leaves progressing to the next leaf category per day) of
young and intermediate leaves, and leaf death rate (% mature leaves dying per day, see
Section 2.2.2 for further clarification) on X. preissii either sprayed with Mavrik or not
sprayed. Grasstrees were monitored in both jarrah forest and banksia woodland, during
the growing season (spring/summer). Data are mean ± SE, with n = 4. P-values indicate
the results of two-way ANOVA for each habitat.
Jarrah forest Banksia woodland
Time October December October December
Young → Intermediate
Sprayed 0.43 ± 0.10 0.75 ± 0.03 0.36 ± 0.12 0.74 ± 0.10
Not sprayed 0.67 ± 0.16 0.67 ± 0.20 0.36 ± 0.10 0.84 ± 0.01
Two-way ANOVA
Spraying (S) 0.465 0.806
Time (T) 0.378 0.010
S × T 0.379 0.695
Intermediate → Mature
Sprayed 0.04 ± 0.01 0.29 ± 0.02 0.15 ± 0.03 0.16 ± 0.04
Not sprayed 0.06 ± 0.01 0.28 ± 0.02 0.12 ± 0.01 0.13 ± 0.03
Two-way ANOVA
Spraying (S) 0.111 0.304
Time (T) < 0.0001 0.759
S × T 0.855 0.978
Mature → Dead
Sprayed 0.00 ± 0.00 0.04 ± 0.02 0.00 ± 0.00 0.06 ± 0.02
Not sprayed 0.00 ± 0.00 0.00 0.00 ± 0.00 0.04 ± 0.01
Two-way ANOVA
Spraying (S) 0.355 0.175
Time (T) 0.067 0.004
S × T 0.119 0.314

Chapter 4 133
4.3.4 Effect of season of burn on inflorescence and seed biomass
Mean inflorescence dry mass was considerably larger for spring-burnt grasstrees than for
autumn burnt grasstrees (1.42 ± 0.68 kg (mean ± SD) and 0.95 ± 0.46 kg respectively).
This difference could be attributed to the spring burnt plants having a heavier spike, but
not scape (Table 4.6). Season of burn did not affect individual seed mass (Table 4.6).
Table 4.6 Mean (± SE) inflorescence spike and scape dry mass (kg) and single dry seed
mass (mg) for 15 inflorescences collected from spring (WSB99) and autumn (YAB00)
burnt sites. Mean individual seed mass was determined for each infructescence from the
seeds collected (sub-samples of 1�20 seeds).
Inflorescence component Spring Autumn P (t-test)
Scape mass (kg) 0.23 ± 0.03 0.18 ± 0.02 0.171Spike mass (kg) 1.19 ± 0.62 0.78 ± 0.11 0.039Single seed mass (mg) 15.12 ± 1.06 12.35 ± 6.67 0.262
4.3.5 Effect of reproduction on caudex starch reserves
During the early stages of inflorescence elongation the starch index (SI) was somewhat
lower than that of vegetative grasstrees (Fig. 4.10). By the time inflorescence length
exceeded 2 m and anthesis had started, mean SI had risen to values similar to those of
vegetative plants. Two sequential decreases in the reproductive grasstree SI coincided
with swelling of the capsules, and maturation of the seeds and their subsequent release.
Overall, significant differences in SI occurred over time (P = 0.037, two-way ANOVA),
due primarily to changes associated with the reproductive grasstrees (Fig. 4.10).
Additionally, SI for the two plant categories differed significantly (P < 0.0001), and
vegetative grasstrees appeared to have a higher SI than equivalent reproductive
grasstrees.

Chapter 4 134
Fig. 4.10 Starch index for (hatched, veg) vegetative and (stippled, reprod) reproductive
grasstrees during the 2000/2001 reproductive season. Labels indicate the consecutive
phases of reproduction: inflorescence length, SC = presence of swollen capsules, and SR
= seeds undergoing release. Data are means of four plants ± SE.
4.3.6 Experiment 1: The effect of leaf removal followingreproduction on further leaf production
Photosynthetically active radiation (PAR) was reduced by less than 4.5% when a cage
was applied to a grasstree for protection of leaves against grazing (mean PAR (± SE)
without cage was 307.7 ± 84.2, and with cage was 298.3 ± 85.0 µmol m�2 s�1). Prior to
imposing the leaf-removal treatment leaf production rate was identical for both control
and treated grasstrees (Fig. 4.11). Clipped plants responded with a large increase in leaf
production immediately after the treatment. Initial leaf production rates were elevated to
5.6 times those of intact grasstrees, followed by a gradual decrease to control levels
within 3�4 months. Over this period, control leaf production levels were maintained
relatively constant, at less then one leaf/d. Clipped plants had a SI of 12.2 ± 4.0 (mean ±
SE) compared with 20.1 ± 7.7 for the unclipped plants after 5 months. This apparent
difference in SI values was not significant (P = 0.192, t-test).
< 0.5 m
> 2.0 m
SC
SR
0
50
100
150
Relative time
Sta
rch
inde
x
Reprod Veg

Chapter 4 135
Fig. 4.11 Leaf production rate of grasstrees that had completed reproduction and were
then subjected to one of two treatments: entire leaf removal and no leaves removed
(control). Measurements were made during 2000 at a jarrah forest site (MSB98). Data
are means of six plants ± SE.
4.3.7 Experiment 2: Determining the relative significance ofgrasstree energy sources to inflorescence production
Relative fluorescence of the three leaf categories and inflorescence scape and spike were
significantly different (P = 0.001, one-way ANOVA). Bonferroni multiple comparisons
test indicated that this difference was primarily due to the low relative fluorescence of
the young leaves (young leaf comparisons with scape, P = 0.002; spike, P = 0.010;
mature leaf, P = 0.055; and intermediate leaf, P = 0.001. Fig. 4.12). Also, relative
fluorescence of the scape and spike was not significantly different from that of the
intermediate leaf category (P = 1.000 for both comparisons; Bonferroni multiple
comparison test), which recorded the highest mean relative fluorescence (0.769).
Fig. 4.12 Relative fluorescence of the scape, spike, and the three leaf categories of X.
preissii, prior to anthesis (see Section 2.2.2 for descriptions of leaf categories), growing
in banksia woodland. Lowercase letters indicate significant differences across plant
0
2
4
6
Jan Feb Mar Apr May Jun JulLe
af p
rodu
ctio
n (le
aves
/d)
leaves removed
control
treatmentapplied
b
a
aba
a
0
0.2
0.4
0.6
0.8
Scape Spike Mature Intermediate Young
Inflorescence part or leaf category
Rel
ativ
e flu
ores
cenc
e (F
v/F
m)

Chapter 4 136
Leaf and inflorescence temperatures were recorded on a clear day with a maximum air
temperature of 22.5 ûC (Fig. 4.13a,b). Only measurements made when the subject
grasstree was in full sun were accepted into the data set, representing maximum possible
Fig. 4.13 (a) leaf and (b) inflorescence temperatures for banksia woodland grasstrees,
over midday, subjected to four combinations of foliage cover, inflorescence cover and
no cover. Measurements were made during a fine spring day with maximum temperature
of 22.5 ûC. Data are means ± SE, when grasstrees were exposed to full sun conditions (n
= 2�5 plants).
15
25
35
Leaf
tem
pera
ture
(ûC
)
foliage cover
fol. & inflor. cover
no cover
inflorescence cover
a)
22
26
30
11:00 12:00 13:00 14:00
Time of day
Inflo
resc
ence
tem
pera
ture
(ûC
)
foliage cover
fol. & inflor. cover
no cover
inflorescence cover
b)

Chapter 4 137
temperatures. Leaf temperature of grasstrees subjected to the treatments involving
foliage cover was consistently the highest. A three-way ANOVA indicated that leaf
temperatures were significantly different over time (P = 0.004), and that foliage cover
had a significant effect on leaf temperature (P < 0.0001). Similarly, inflorescence
temperature was significantly higher for grasstrees with foliage covered than those
without (P = 0.004), but this treatment effect was not significantly different over time (P
= 0.424). For comparison, maximum air temperature at the equivalent spring-burnt site
(YSB98) was 31.9 ± 0.9 ûC (mean ± SE) during the period of highest grasstree leaf
production (from Chapter 3), which was 2 ûC lower than the highest mean leaf
temperature recorded at WSB99 during this experiment.
The slope of each line in Fig. 4.14a depicts the mean inflorescence elongation rate for
each treatment. Initial inflorescence elongation rates were similar for all grasstrees, and
it was not until after day 21 that a treatment effect became apparent. By day 74,
treatment effects were more prominent, with a significant effect of foliage (P = 0.027,
two-way ANOVA) and inflorescence cover (P = 0.025) on inflorescence length by
harvest time. Covering foliage had a significant effect on final inflorescence dry mass (P
= 0.001, two-way ANOVA. Fig. 4.14b), but the effect of inflorescence cover was not
significant (P = 0.170). The presence or absence of foliage cover also had a significant
effect on starch reserves (P = 0.009, two-way ANOVA), but again the effect of
inflorescence cover was not significant (P = 0.128). A reduction in starch reserves
occurred when either form of cover was applied during inflorescence production (Fig.
4.14c), but this was most apparent for covered foliage.
Extrapolating from the data collected during this experiment, X. preissii had 0.493 ±
0.200 kg of dry mass available as stored starch prior to reproduction. As desmium
volume, and therefore potential starch storage, is dependent on grasstree size, this value
is representative of grasstrees within the size range studied: circumference 73�100 cm
and height 67�101 cm.

Chapter 4 138
Fig. 4.14 (a) inflorescence length, (b) inflorescence dry mass and (c) starch index of X.
preissii over time after the application of treatments comprising the four combinations of
foliage cover, inflorescence cover, and no cover. Data were collected during the 2000
0
1
2
3
0 20 40 60 80Days since treatment application
inflo
resc
ence
leng
th (
m)
no cover
inflorescence cover
foliage cover
fol. & inflor. cover
a)
0.0
0.4
0.8
1.2
Inflo
resc
ence
mas
s (k
g)
b)
0
40
80
120
None Inflorescence Foliage Fol. & inflor.
Type of cover
Sta
rch
ind
ex
C)

Chapter 4 139
4.4 Discussion
After fire, most grasstrees underwent what can be considered the most dynamic phase of
their lifecycle: accelerated leaf growth (Chapter 3) accompanied by the rapid production
of a large inflorescence. On these responses alone it would be fair to say that fire is the
most significant single factor to influence the lifecycle of grasstrees. Rapid resprouting
by X. preissii following fire exceeds that of all other co-occurring species (Baird 1977).
Inflorescence production by X. preissii is another example of growth beyond the plant's
normal output, measured in my study at a mean maximum elongation rate of 5.6 cm d�1;
higher maximum growth rates have been reported by other authors for different grasstree
species (Cleland 1913, Staff 1976). Variation between maximum inflorescence
elongation rates was most likely a reflection of site effects and methodological
discrepancies, rather than species differences. For example, Cleland�s (1913) highest
measurement of 10 cm d�1 was made on a single specimen of X. hastilis growing in his
garden, a highly modified environment, possibly richer in nutrients and subject to
greater water availability compared to either jarrah forest or banksia woodland. Also,
Staff�s (1976) highest measurement of 7 cm d�1 was only recorded for one of the 20
grasstrees (X. australis) he monitored on a weekly basis, which is comparable to the
fastest elongating individual I recorded (6.8 cm d�1) over a four week period.
Not until late August were the foliage-derived carbohydrates redirected away from leaf
production towards the young inflorescence primordia replacing the terminal vegetative
apex (Staff & Waterhouse 1981) that becomes the new sink for this energy. Leaf
production is drastically reduced from the moment the inflorescence starts to elongate in
early September, and is maintained until seed is released about five months later. The
detrimental effect of reproduction on normal vegetative growth is common in many
species (El-Kassaby & Barclay 1992, Obeso 1997, Silvertown & Dodd 1999), and is
further exacerbated by abnormally large seed production (Gross 1972). For a grasstree
regenerating its crown previously lost to fire, this sacrifice of leaf production is a major
trade-off. Since the reproductive and growing seasons overlap, the significance of this
cost is further magnified, as the grasstree has also forfeited the opportunity for
maximum leaf growth during late spring/early summer when growing conditions are
optimal.
Chapter 4 140
Stunted growth in young expanding leaves also indicates the temporary diversion of
energy towards the inflorescence (Karlsson et al. 1996, Obeso 1997). In jarrah forest,
reproductive grasstrees maintained the lowest leaf mass, monitored from the early stages
of reproduction when the mean inflorescence height for the sampled plants was < 0.5 m.
This suggests that the foliage had been deprived of energy for some time and the
redirection of photosynthate pathways occurs very early. In contrast, leaf mass of
banksia woodland grasstrees did not show the same sensitivity to early inflorescence
growth, evidenced by the similarity of vegetative and reproductive grasstree leaf mass at
the time of first measurement (mean inflorescence length was 0.66 m). The larger size of
grasstrees at this site in banksia woodland (compare MSB98 grasstrees with YSB98 in
Table 3.1) may hold the key to understanding this difference. Size-dependent effects of
reproduction have been described previously (Shipley & Dion 1992, Greene & Johnson
1994, Saulnier & Reekie 1995). Saulnier and Reekie (1995) recorded negative effects of
reproduction on growth of young plants of Oenothera biennis, while larger plants with
greater nutrient reserves were unaffected.
Size is often a consequence of resource availability. The proportion of carbon required
to support early inflorescence growth relative to the size of the available starch stores
may account for a negligible effect on early leaf mass in the large grasstrees in banksia
woodland. Supporting my interpretation, the results from this study indicate that,
compared with the banksia woodland grasstrees, a larger proportion of leaf growth was
sacrificed by the jarrah forest grasstrees (7% more, although not significantly different)
to produce a shorter final inflorescence (about 50% shorter). In keeping with these
observations, X. preissii inflorescence size and fruit number on the Swan Coastal Plain
are considered largely proportional to the size of the plant (Meagher 1974). It is likely
that X. preissii inflorescence size is a balance between the advantages associated with
pollinator attraction and the increased cost of reproduction. Assuming this relationship,
the two-fold difference in mean mature inflorescence length between jarrah forest and
banksia woodland might reflect constraints imposed by differences in resource
availability between the two habitats. For example, light availability is greater in banksia
woodland (Chapter 5), and larger grasstree stem circumferences (Chapter 3) also imply
greater general resource availability to X. preissii in the same habitat.

Chapter 4 141
Almost exclusively triggered by the passage of fire, the start of the reproductive season
for X. preissii is still strongly governed by seasonal changes from winter to spring.
While late spring temperatures are more likely to promote rapid inflorescence growth, an
early start in August/September is necessary to ensure that seeds can be set before winter
soil moisture reserves are depleted during early-summer. Given this interpretation, the
urgency to commence reproduction is likely to be an adaptive response to water
availability. The water content of the inflorescence during its development and
maintenance, up until pollination, was 80%, which is 10% higher than leaf water content
(D. Korczynskyj, unpublished). During anthesis, sticky nectar was exuded from the
spike attracting an abundance of invertebrates, and the removal of desmium tissue cores
while sampling for starch from reproductive grasstrees induced a trickle of syrupy
solution laden with sugar, while samples from vegetative plants remained dry. Despite
these characteristics, predawn ΨX measured in both jarrah forest and banksia woodland
did not indicate any extreme or even additional water stress on reproductive grasstrees,
as a consequence of increased water demand by the inflorescence. In fact, less negative
midday ΨX suggested that the foliage and inflorescence, comprising the crown of the
reproductive grasstrees, transpired less water than the vegetative grasstrees with foliage
only. This somewhat puzzling result may be attributed to a reduction in foliage surface
area of the reproductive grasstrees resulting from less leaf production, and so
compensating for the relatively high water demand of the inflorescence compared with
the leaves.
Trends in the water status of reproductive and vegetative grasstrees over time showed
consistency between the jarrah forest and banksia woodland sites, although predawn and
midday ΨX were generally lower in the jarrah forest. Such divergence between
grasstrees of the two sites points towards differences in habitat water availability, and is
an example of a possible resource difference that would contribute to the disparity in
inflorescence size described earlier.
Some of the carbohydrates synthesised by the foliage of X. preissii are converted into
insoluble starch grains in the desmium. Despite the narrowness of this tissue layer (< 5
mm; Fig. 4.3), for a waist height grasstree, total starch reserves are estimated to
approach 0.5 kg, approximately half the weight of a mature inflorescence at anthesis
(Fig 4 14) During reproduction this starch is remobilised in the form of soluble
Chapter 4 142
carbohydrates and redistributed to the developing inflorescence. There it is used for
early inflorescence growth, and fruit and seed production, evidenced by the reduction of
desmium starch during these critical periods (Fig. 4.10). Fastest inflorescence elongation
occurred during early inflorescence growth (see Fig. 4.5 and Fig. 4.14 (�no cover�
treatment)), which is in keeping with other grasstree species (Cleland 1913, Staff 1976).
This correlation supports the interpretation that desmium starch is consumed during
times of peak growth, whether vegetative (Chapter 3) or reproductive. By the time seeds
were released, 60 % of the desmium starch reserve had been consumed (about 0.296 kg),
adding to the cost associated with reproduction. In some species such use of stored
resources is likely to reduce or completely negate any visible signs of reproductive cost
(Horvitz & Schemske 1988). By drawing on reserved energy to support reproduction, X.
preissii must later suffer the trade-off of reduced growth while restoring the depleted
reserve.
Leaf production after seed release continues from the lateral apices (axillary buds) that
exist close to the base of the scape during reproduction (Staff 1968, Gill 1993). At this
time, leaf production by jarrah forest grasstrees was typical for autumn (0.6�1.0
leaves/d), which superficially implied that no negative effect of reproduction was
sustained. Contrary to my prediction that leaf removal following reproduction would
totally deplete an already scant starch reserve and result in reduced growth, the observed
response suggested that X. preissii was adequately equipped to endure the treatment. The
only cost of this treatment was visible as a further depletion of the remaining desmium
starch reserves. Herbivory of grasstrees by parrots (McNee 1997) and kangaroos (Fig.
5.1) is more likely when the crown is damaged or recovering after fire, offering easier
access to the more tender inner leaves through the needle-like leaves. Also, given the
high occurrence of parrot-damaged grasstrees during March in southwestern Australia
(McNee 1997), the retention of adequate carbon reserves by X. preissii following
reproduction could represent an important adaptation to cope with post-flowering
environmental stress. The same logic applies to the less likely, yet possible (Lamont &
Downes 1979), occurrence of a second fire during this dry period.
A brief methodological note is worthy of mention. Spike and seed predation by the
larvae of the broadly distributed moth species, Meyriccia latro, has been described
previously for X. australis (Edmonds & Specht 1981, Staff & Waterhouse 1981). The
Chapter 4 143
voracious and gregarious feeding habit of this species on X. preissii led to the
destruction of entire inflorescences on several occasions. Protection against such an
attack by the application of a non-systemic insecticide was only partially successful, as
larvae damage required some grasstrees to be replaced. This result suggests that the
larvae may have already been present prior to the first spraying. More detailed
knowledge of the timing of this species� life history in relation to the reproductive
development of its grasstree hosts may help determine a more effective spraying regime.
4.4.1 Experiment 2: the importance of three carbon sources toreproduction
The initial concern that covering treatments used in the second field experiment may
result in high leaf and inflorescence temperatures, negatively impacting inflorescence
growth and complicating treatment affects, was warranted. Leaf temperature was greater
for covered plants, but the maximum mean value only reached about 34 ûC, just 2 ûC
higher than air temperature corresponding to maximum leaf production. Generally, leaf
and inflorescence temperatures were not excessive, consistent with upper photosynthesis
optima for a range of species (Devlin & Barker 1971, Mohr & Schopfer 1995, Fukui
2000), and considerably lower than maximum thermal thresholds given for
sclerophyllous mediterranean flora (Larcher 2000).
Leaf fluorescence rose then fell across the range of leaves, from the pale young leaves to
intermediate to mature leaves � photosynthetic activity increases as chloroplasts
enlarge and mature, and then declines, as leaves grow older (Devlin & Barker 1971).
Prior to anthesis, the green inflorescence (spike and scape) was capable of the highest
level of light absorption (measured as relative fluorescence) recorded for X. preissii,
demonstrating its capacity for carbon fixation.
From the statistical analysis of the field experiment data it could be concluded that the
inflorescence does not significantly support its own growth. However, all three sets of
data suggested that in fact the inflorescence does contribute some energy to its own
growth. Heilmeier and Whale (1987) demonstrated that for two closely related biennial
species the contribution to the total carbon requirement of their flowerheads, by the
same structures, was double for Arctium lappa, which bore large green bracts. The mean
starch index for those grasstrees subjected to the inflorescence covering treatment was

Chapter 4 144
35% lower than for those grasstrees with no covering imposed, indicating that starch
was consumed to compensate for the lack of input by the inflorescence. Unfortunately,
low replication due to time limits, and lack of suitable grasstree specimens, resulted in
high standard errors and subsequent lack of significance.
This surprisingly small contribution of energy from the inflorescence places primary
importance on the foliage as the source of most energy during reproduction, followed
closely by the desmium starch reserve. It is the combination of these two energy sources
and the timing of the reproductive phenophase, enabling the exploitation of optimum
water availability and temperature, that allows rapid inflorescence elongation in X.
preissii and its high reproductive success.
Understanding the relative importance of these three carbon sources to reproduction, it
seems likely that grasstrees burnt in autumn which then flower in the following spring
would be at a greater disadvantage than those burnt in spring. For grasstrees burnt in
autumn, the carbohydrates mobilised from the desmium are used to support resprouting
in the spring-summer growing season (Chapter 3). In the event that these plants flower
in the first spring following the autumn-burn, the inflorescence becomes an alternative
sink to the resprouting foliage for desmium-derived carbon. Bowen and Pate (1993)
described a similar use of stored starch by the woody shrub, Stirlingia latifolia, in
banksia woodland on the Swan Coastal Plain. Particularly for grasstrees burnt in late
autumn (May), little time exists to resprout before reproduction commences and
immediate daily air temperatures are far from optimal for growth. Therefore, while the
incomplete crown remains small, and starch reserves already partially depleted (Fig.
3.13), reproduction commences, postponing further leaf production and continuing
starch consumption. This sequence of events, within the relatively short time frame, not
only describes a very energy demanding set of circumstances for X. preissii, but also
possibly represents the plants least-optimum capacity to support inflorescence growth
and then developing fruits.
As a consequence to reproductive success of the above scenario, inflorescence mass was
33% lower for the late autumn-burnt grasstrees, primarily from reduced spike mass. As
water and nutrients would have been at their peak in their respective cycles (ie. annual
and inter-fire) this undoubtedly suggests that carbon was limiting for these plants. But

Chapter 4 145
whether an equivalent reduction in seed number, and therefore reproductive success, was
experienced is mere conjecture. However, Lamont et al. (2000) showed, for X. preissii,
that fruit density per spike in autumn-burnt plants was 80% of that of spring-summer-
burnt plants, supporting my interpretation. For the conservation of X. preissii,
management considerations should include the reproductive costs imposed by the timing
of fire, and prescribed burning during spring or early autumn should be selected
preferentially.

146

Chapter 5 146
CHAPTER 5
Environmental causes of grasstree recovery after fire,and the carbon cost of herbivory: investigation through
two simulation experiments
5.1 Introduction
Many authors have speculated about the cause of the rejuvenating effect that fire can
have on subsequent adult growth (Naveh 1967, Christensen et al. 1981, Rogers &
Westman 1981, Zammit 1988. Also see my Discussion in Chapter 3). The causes that
have been investigated vary substantially. The factors most frequently shown to affect
postfire vegetative vigour include: nutrient enrichment of the soil (Simms 1985, Hulbert
1988, Zammit 1988, Witkowski et al. 1990, Grogan et al. 2000, Kennard & Gholz
2001); changes in water availability (Specht 1957b, Fleck et al. 1995); decreased level
of shading (Vila 1997, Holmgren et al. 2000); increased soil temperature (de Groot &
Wein 1999); or a combination of these elements (Daubenmire 1968, Stoneman et al.
1995, Gentle & Duggin 1997b). Additionally, the destruction of phytotoxic and
antibiotic agents in litter and soil (Naveh 1974, Christensen & Muller 1975, Gentle &
Duggin 1997a), changes to bacterial and mycorrhizal fungal populations (Christensen &
Muller 1975, Dhillion et al. 1988, Bellgard et al. 1994, Wilson et al. 2001), and the
idiosyncratic effects of residual charcoal (Wardle et al. 1998), have all been associated
with changes in growth after fire.
The predominant finding that improvements in water, nutrients and light availability are
probable causes of extraordinary postfire growth is not surprising, considering that these
elements represent fundamental requirements for production of organic compounds for
growth (Neales 1994). While the importance of water, and to a lesser extent light
(daylength), have been explored in previous chapters in relation to leaf production in X.
preissii, the role of nutrients in limiting grasstree growth has not received the same
attention.
Ash produced from burning natural vegetation is nutrient-enriched, with high
concentrations of essential elements, including phosphorus, magnesium, potassium and

Chapter 5 147
calcium (Hatch 1960, Raison et al. 1985a). Concentrations in ash of these elements can
vary according to fire intensity (Stark 1979, Kennard & Gholz 2001), especially
phosphorus (Romanyà et al. 1994), which can be particularly high in fine, grey or white
(mineral) ash (Raison et al. 1985a, Raison et al. 1985b). Nitrogen, the most important
element for plant growth, is readily volatilised during fire and lost in relatively large
quantities (Raison et al. 1985a, Raison et al. 1985b). However, work has shown that fire
can commonly cause an increase in soil ammonium levels, resulting in high rates of
primary production in re-establishing plant communities (Grogan et al. 2000). While a
portion of all nutrients is lost during fire through their volatilisation or as particulate
matter in the smoke column (Raison et al. 1985a), the redistribution of surface ash by
wind and water is considered an important factor in the dynamics of the ecosystem
(Grogan et al. 2000). Not surprisingly, the most significant effect of ash and partially-
burnt material on soil nutrient concentrations is detectable in the surface soil horizons
(Grove et al. 1986, Adams et al. 1994, Romanyà et al. 1994) and decreases rapidly with
depth (Hatch 1960).
The gradual leaching of nutrients from ash over time means that ash acts as a slow-
release plant fertiliser under natural conditions (Stark 1979). After one-year postfire, soil
nutrients levels return to those similar to prefire concentrations (Grove et al. 1986). For
a plant community recovering after fire, this suggests that resprouting components are
likely to benefit the most from this limited period of enhanced nutrient availability,
absorbing nutrients immediately via their mature root systems, in contrast to those
species regenerating from seeds later on (Biswell 1974, Keeley & Zedler 1978, Grove et
al. 1986). However, other evidence suggests that the nutrients released by fire are
inaccessible to new growth of resprouting plants because of the superficial penetration
of these nutrients into the soil (Wisheu et al. 2000). Changes in postfire leafbase
concentrations of nitrogen, calcium, potassium, and zinc in X. preissii indicate an
increased availability of nutrients to this species following fire (Burrows 1998, Ward et
al. 2001), and may explain the rapid postfire recovery of the crown (Chapter 3).
Increases in plant nutrient concentrations and leaf/shoot growth after fire are consistent
with the response of various species to nutrient additions in the form of fertiliser
(Christensen & Muller 1975, Hulbert 1988, Witkowski et al. 1990). Results from
observation of plant and soil water status following fire vary considerably, representing
both positive (Specht 1957b, Stoneman & Schofield 1989, Stoneman et al. 1995),

Chapter 5 148
negative (Christensen & Muller 1975, Sakalaukas et al. 2001) and less commonly
neutral (see Daubenmire 1968 for review) consequences to plant growth. Most of this
research focuses on the effect of the removal of vegetation cover by fire, suggesting
either a reduction in transpirational water loss, or an increase in incident radiation and
subsequent evaporational loss. Further subtleties have been suggested in regards to
changes in surface albedo (Christensen & Muller 1975). Consistent with the effect of
burning on the water status of X. preissii (see Section 3.3.3) are the results presented by
Fleck et al. (1995), who suggest that reduced leaf area of two Spanish shrubs following
wildfire resulted in improved midday water status. Also, given the tightly controlled, yet
continuous, water cycling over summer and fast response to summer rainfall of X.
preissii (Crombie 1992, and Section 2.3.3.2), it seems likely that this species would
readily respond to any improvement in water status following fire.
Additional to the direct effect of flame contact, heat transferred from a fire via
convection and radiation can act to significantly reduce overstorey foliage density,
effectively opening the canopy. A low intensity fire (300 kW m�1) in jarrah litter on a
cool spring day can generate sufficient convected heat to scorch the crown up to 8�10 m
above the ground, and possibly up to 20 m during warm, dry conditions in summer or
early autumn (Bell et al. 1989). As fire-scorched branches are usually killed (Gill 1978),
such an event would cause the loss of all scorched leaves and general thinning of the
canopy, allowing greater light penetration. Given that jarrah (Eucalyptus marginata) can
grow to 60 m, the lower overstorey height of banksia woodland, dominated by Banksia
spp., would be more susceptible to total canopy defoliation, at similar fire intensities.
Studies using artificial shading of resprouting vegetation to simulate shoot competition
for light after fire between neighbouring species have unambiguously revealed a
negative effect of shade on growth (Hulbert 1988, Gentle & Duggin 1997b, Vila 1997).
It therefore seems likely that, regardless of habitat, the defoliation of the overtopping
canopy by fire may result in a positive effect on subsequent grasstree growth.
Many studies evaluating possible causes of rapid postfire plant growth could be
criticised for seeking single causes rather than the likely combination of factors (Hulbert
1988). Even though grasstrees represent a group of plants that are far from subtle in their
response to fire, identifying the key postfire elements likely to promote their

Chapter 5 149
characteristically vigorous regeneration poses a difficult problem. In this chapter the
following hypothesis was investigated through a fire simulation study.
� Increased water and ash-derived nutrients, and decreased canopy shade promote
vigorous leaf growth of X. preissii after fire.
Until now, discussion of grasstree growth in my thesis has concentrated on the abiotic
factors (particularly fire) that stimulate the most marked responses from X. preissii.
Herbivory is a biotic interaction identified as important to the survival of X. preissii
(McNee 1997), and to an extent can induce similar responses in grasstrees as those
caused by fire. X. preissii has a considerable capacity to regenerate its crown following
pruning by Port Lincoln Ringneck parrots (Barnardius zonarius semitorquatus) (McNee
1997) similar to vigorous regrowth after fire. In other species, morphological responses
(eg. increase branching frequency, increased shoot dry weight and reduction of long-
shoots) (Bergström & Danell 1987), changes in nutrient allocation (Danell & Bergström
1989) and stem death are common results of defoliation by herbivores and pruning by
fire (Bergström et al. 2000). Undoubtedly, fire is a dominant environmental factor
currently impacting X. preissii. However, some lines of speculation suggest that the
importance of the roles of fire and herbivory on Australia�s vegetation have only
relatively recently swapped (Flannery 1994).
Grazing can occur far more frequently than fire, which raises the question of grasstree
resilience to such pressure. The foliage represents the most accessible, palatable portion
of a grasstree, and is readily eaten by domestic sheep and cattle, cockatoos, parrots,
kangaroos and possibly brush wallaby and rabbits (Halford et al. 1984, Long 1984,
McNee 1997, Richardson et al. 2000). Access to the crown by large animals is impeded
by the orientation of the needle-like leaves projecting from the centre towards sensitive
areas around the muzzle and eyes. For birds, the crown structure does not offer suitable
perching sites and as a consequence damaged grasstrees are targeted for ease of
penetration to the more palatable centrally-located young leaves (McNee 1997). Fire
markedly increases crown exposure to grazing by herbivores (Fig. 5.1), reducing leaf
length and removing the sharp protective tips. Once a damaged grasstree is located it
commonly receives more frequent visits than other grasstrees in the area (McNee 1997),
establishing a routine of ongoing damage. The combination of fire and grazing often has

Chapter 5 150
a greater impact on a species than the sum of their individual effects (see Whelan 1995
for a brief review). On Rottnest Island, off the coast of south-western Australia, the
combination of frequent fires and herbivory by a small macropod, the quokka (Setonix
brachyurus), was suggested to have caused the demise of the fire-resistant yet highly
palatable species Acacia rostellifera. The intense grazing pressure applied to resprouting
Acacia rostellifera after fire forced the gradual dominance of the less palatable
Acanthocarpus-Stipa low dense heath (Pen & Green 1983).
Fig. 5.1 A short (< 60 cm) grasstree subjected to repeated kangaroo grazing of its apex
since being burnt in spring 1998. An equivalent-sized, ungrazed grasstree can be seen in
the background.
Grazing can induce changes in plant nutrient acquisition, the redistribution of
photosynthates, mobilisation of stored reserves, increase in photosynthetic capacity,
reduction of tissue senescence, and can even increase growth vigour stimulated by
thiamine from herbivore saliva (see McNaughton 1983 and Lindroth 1989 for reviews,
and Kosola et al. 2001). These changes can directly affect the performance of recovering
plants, causing undercompensation, exact compensation or overcompensation of
regrowth, relative to the growth rate of unaffected plants (Crawley 1983). The few
studies that have revealed overcompensation in shoot biomass (Edenius et al. 1993), due

Chapter 5 151
to enhanced plant performance after herbivory, have most often been short-term, and the
responses of these plants may differ after successive years of defoliation (Lindroth
1989). Some authors have generalised that this response is more likely among those
species growing on nutrient-rich soil, whereas in nutritionally-poor environments more
energy is expended in chemical defence (Lindroth 1989).
When a substantial area of green leaf remains after grazing, starch reserves are relatively
unimportant for regrowth (Crawley 1983), as newly synthesised photosynthates and
existing soluble carbohydrates are sufficient to meet the respiratory needs of the
surviving tissues and support compensatory growth (Kigel 1980, Kosola et al. 2001).
However, when herbivore damage significantly reduces photosynthetic surface-area,
reserve starch can be crucial to plant survival (Donart & Cook 1970, Bowen & Pate
1993), and is remobilised to fill the role of the rapidly consumed residual soluble
carbohydrates. The dependence on carbon reserves holds important implications for the
survival of plant populations vulnerable to chronic herbivory. Repeated shoot removal
has been shown to exhaust starch reserves and retard regrowth or even cause death in a
range of tree and shrub species (Bamber & Humphreys 1965, Miyanishi & Kellman
1986, Bowen & Pate 1993). Slow growing species that are able to withstand chronic
herbivory may still suffer from other detrimental effects, such as reduced fitness. Slow
growth of Scots pine (Pinus sylvestris) saplings in Spain disposes these plants to
browsing of their leader terminal shoots by livestock and wild ungulates for many years,
retarding their development to maturity (Zamora et al. 2001). Although X. preissii is
never able to escape bird herbivory, its slow vertical growth disposes it to grazing from
domestic stock and kangaroos for potentially over 100 years (see Lamont & Downes
1979 for vertical growth rate), after which they may attain a height out of reach of these
animals.
Specific to the herbivory of X. preissii by parrots is the detrimental effect of the residual
pieces of leaf left behind, suggested to rot the apical meristem (McNee 1997) and
potentially reduce early initiation of active export of photosynthate from young leaves
(Mattheis et al. 1976). The combination of three years of parrot browsing (5�6 months
per year) and the smothering effect of the rotting chaff left by the foraging parrots may
result in the death of the crown (McNee 1997). From these observations it can only be
speculated why these grasstrees ultimately die. Did the frequency of herbivory exhaust

Chapter 5 152
dwindling starch reserves preventing the grasstrees from continued regeneration, or was
apical rotting wholly responsible? From these questions and my accumulated knowledge
of grasstree response to disturbance the following two hypotheses were generated, which
were the focus of the simulated herbivory study described in this chapter (see earlier for
the hypothesis pertaining to the fire simulation experiment).
1 ) Grasstrees leaf and biomass production is stimulated by low frequency
herbivory, but is reduced by frequent herbivory.
2) The depletion of grasstree desmium stores is positively correlated with the
frequency of herbivory pressure.
Lastly, I comment on the decision to undertake field-based experiments. For
manipulative experimentation, the use of seedlings in glasshouse pot trials or in pseudo-
natural field trials are a popular means of simplifying a complex system in order to
observe the effect of a manageable number of variables. However, the simpler the
simulation and the more complex the simulated system, the less representative the
results are of the natural circumstances under investigation. For this reason,
generalisations from such research can be criticised (Roger Cousens, plant ecologist,
University of Melbourne, pers. comm.). Size and morphological differences between
mature plants and seedlings of X. preissii, suggests that there would be little value in
drawing conclusions of established populations from seedling trials. Additionally, the
subterranean existence of the seedling apical meristem (Koch & Bell 1980, Staff &
Waterhouse 1981, Gill 1993) acts to widen the gap between the likely response of
seedlings and mature grasstrees to fire and herbivory. Therefore, as the logistics of
performing fire and herbivory simulation experiments under controlled conditions using
mature plants are physically unachievable, the decision to undertake field-based studies
using naturally occurring mature grasstrees was made. Although this experimental
strategy undoubtedly introduced a higher level of inherent variability to the results, it
also more closely approximated the natural situation.

Chapter 5 153
5.2 Materials and methods
5.2.1 Experiment field sites
The manipulative field experiments described in this section were undertaken at long
unburnt sites in jarrah forest or banksia woodland. The fire simulation experiment was
carried out at the single field site YFSE (Table 1.1), directly opposite the spring-burnt
YSB98 banksia woodland sites, yet separated by a 6 m wide, sand track (used as a fire
break during the 1998 fire). This site has a northerly aspect with a gentle slope, typical
of the dune system to which the area belongs. The simulated herbivory experiment was
replicated at both jarrah forest (MC; Table 1.1) and banksia woodland (YC) sites.
5.2.1.1 Experiment 1: Simulating three environmental factors considered tocharacterise postfire banksia woodland
This experiment involved the manipulation of water availability, ash derived nutrients
and shading, which were considered important to the growth of resprouting vegetation
following fire. A factorial combination of the three factors at two levels (presence and
absence) allowed eight possible treatments to be randomly applied to 48 grasstrees
between the heights of 0.8 and 1.3 m (Table 5.1), giving six replicates per treatment.
Twelve additional grasstrees were allocated to one of two extra intermediate shading
treatments (50% and 70% shade), complementing the two extreme levels of shading
used in the main experiment (0% and 90% shade). Shading was the only treatment
imposed on these grasstrees, to enhance the analysis of the effect of shading on X.
preissii. In addition to height, circumference was recorded for all grasstrees (0.4 m from
the ground), and consistency of plant girth between treatments was checked using a one-
way ANOVA to control this possible source of variability (see Section 3.2.2.1).
The commencement of the experiment on 10 June 1999, although potentially 1�2 weeks
late, was representative of the likely timing of a late-autumn prescribed burn. However,
shade was the only treatment imposed at this point. Watering commenced prior to
summer on the 26 November 1999, coincident with the start of the growing season (see
Chapter 2). Nutrients (i.e. ash) were applied between 1 July and 20 July 1999,
synchronised with the first substantial winter rainfall for 1999, preventing premature

Chapter 5 154
loss of ash by wind. Figure 5.2 shows the fire simulation site at the commencement of
the experiment.
Table 5.1 Description of the 10 treatments applied to grasstrees during the fire
simulation experiment. The first eight treatments comprise a combination of the three
factors, water, ash and shade, and the last two treatments were added to provide extra
detail of the effect of shading. Six grasstrees were assigned to each treatment.
Treatment Description
Control No shade, water or ash applied+water (�ash, �shade) Water provided only+ash (�water, �shade) Ash provided only+shade (�water, �ash) 90% shade provided only+water, +ash (�shade) Water and ash provided+water, +shade (�ash) Water and 90% shade provided+ash, +shade (�water) Ash and 90% shade provided+water, +ash, +shade All three factors applied
Additional shading treatments:
50% shade 50% shade provided only70% shade 70% shade provided only
Fig. 5.2 This overview of the YFSE (Yanchep fire simulation experiment) site was taken
from a nearby south-facing hill in the YSB98 site. The two pale green water tanks (side
by side) can be seen in the centre and dark green tents can be seen scattered through the
landscape from east to west.

Chapter 5 155
Pre-experiment preparation
Prior to the application of treatments each grasstree was totally defoliated (living and
dead leaves removed) using two-stroke hedge-cutters to simulate the �pruning�
experienced during a fire (Fig. 5.3a,b). Also, at this time (18 to 25 May) all vegetation
Fig. 5.3 (a) the author using a motorised hedge-cutter to remove all dead (skirt) and
living leaves, simulating the loss of foliage associated with fire. (b) the same grasstree
after the commencement of the experiment (regrowth visible at the apex) can be
compared with an intact grasstree of similar height in the background. Also, note the ash
distributed around the base of the grasstree as part of the treatment +ash, �water, �shade.
within a 4 m radius was cut to ground level using two-stroke brush-cutters, or defoliated
in the case of large plants using hand-saws and secateurs. This process was used to
reduce the variation in competition for water and nutrients imposed by other species on
each grasstree. Defoliation was repeated on three other occasions (24 September 1999, 1
March 2000 and 17 March 2000). All cut foliage during defoliation and clearing was
raked beyond the 4 m radius (Fig. 5.4a,b).
Fig. 5.4 (a) adjacent grasstrees after being pruned, but still surrounded by clipped foliage
and ground cover. (b) a group of grasstrees one week after the commencement of the
experiment with all clippings and ground cover removed (shading treatments applied).
a b
a b
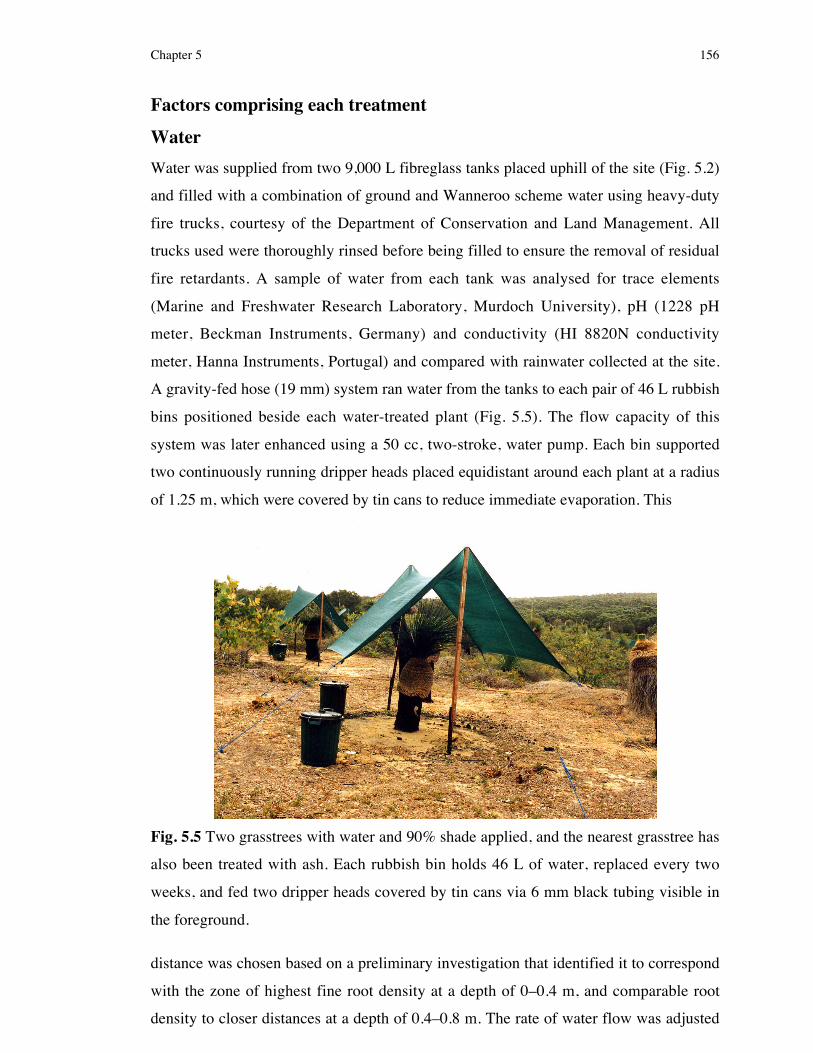
Chapter 5 156
Factors comprising each treatment
Water
Water was supplied from two 9,000 L fibreglass tanks placed uphill of the site (Fig. 5.2)
and filled with a combination of ground and Wanneroo scheme water using heavy-duty
fire trucks, courtesy of the Department of Conservation and Land Management. All
trucks used were thoroughly rinsed before being filled to ensure the removal of residual
fire retardants. A sample of water from each tank was analysed for trace elements
(Marine and Freshwater Research Laboratory, Murdoch University), pH (1228 pH
meter, Beckman Instruments, Germany) and conductivity (HI 8820N conductivity
meter, Hanna Instruments, Portugal) and compared with rainwater collected at the site.
A gravity-fed hose (19 mm) system ran water from the tanks to each pair of 46 L rubbish
bins positioned beside each water-treated plant (Fig. 5.5). The flow capacity of this
system was later enhanced using a 50 cc, two-stroke, water pump. Each bin supported
two continuously running dripper heads placed equidistant around each plant at a radius
of 1.25 m, which were covered by tin cans to reduce immediate evaporation. This
Fig. 5.5 Two grasstrees with water and 90% shade applied, and the nearest grasstree has
also been treated with ash. Each rubbish bin holds 46 L of water, replaced every two
weeks, and fed two dripper heads covered by tin cans via 6 mm black tubing visible in
the foreground.
distance was chosen based on a preliminary investigation that identified it to correspond
with the zone of highest fine root density at a depth of 0�0.4 m, and comparable root
density to closer distances at a depth of 0.4�0.8 m. The rate of water flow was adjusted

Chapter 5 157
to empty both bins within 24�30 h (3.1�3.8 L/h). This flow rate ensured that debris, ants
etc. did not block the drippers and prevent watering. A fortnightly watering regime was
maintained until 18 May 2000 (autumn), when soil moisture content near watered and
unwatered grasstrees did not differ, due to the start of reliable autumn/winter rains.
Soil moisture was measured to demonstrate an effect of the watering treatment, and also
as a guide to when the watering treatment should start and finish. Every 1�6 weeks
during the watering period (midway between waterings), starting on the 29 October
1999, a hand-operated soil corer was used to extract soil from a depth of 30�40 cm from
adjacent to watered and unwatered grasstrees. Samples were placed in labelled, heat-
resistant, oven bags, and weighed before drying at 100 ûC for 48 h. After recording each
sample�s dry weight, the weight of the soil moisture was calculated as a percentage of
wet soil.
Predawn and midday xylem water potential (Ψx) was measured for plants subjected to
watering treatments during spring (5 September 1999), summer (10 December 1999)
and autumn (4 April 2000). A single leaf was collected from each plant and a pressure
chamber was used to determine Ψx (as described in Section 2.2.5.1). Results were
compared to unclipped intact grasstrees from the banksia woodland control site (YC).
Ash
Some of the cut foliage created during defoliation and clearing (including much dead
and fresh X. preissii leaf) was transferred to the adjacent site (YSB98) and burnt in a
controlled fire for the purpose of creating ash. A once off 30 L (0.03 m3) quantity of
fresh ash was spread by hand within a 1 m radius of each stem (visible in Fig. 5.3b and
5.5).
Shade
Shade was provided by an A-frame style tent (Fig. 5.5) built over 24 of the 48 grasstrees
using 90% woven green shade cloth (Coolooroo ®, Melbourne, Australia). The tents
were positioned with their shading-surface facing north to maximise the period of shade
offered to each plant, and were sufficiently large to avoid significant contact between the
plant and the cloth. Only during early morning and late afternoon during summer were
the lower leaves exposed to sunlight. All tents were maintained during the year, with
storm damage repaired within one week.
To quantify the effect of the three shade cloth densities, photosynthetically active
radiation (PAR) was measured on 24 February 2000, for open sun and under each

Chapter 5 158
different shade cloth tent, using a quantum sensor (model LI-185B, Li-cor, Lambda
Instruments Corporation, Nebraska, USA). Measurements were made over midday
within 40 min, during which the weather was fine, with cloudless sky and temperature of
28 ûC.
Collection of data
In an attempt to reveal an effect of the watering treatment on grasstree leaf production,
specific to the dry season, leaf production was monitored for all plants towards the end
of the growing season. Each grasstree was monitored for leaf production from 31 March
to 27 April 2000 (see Section 2.2.2 for detail of method), during the driest time of the
year.
After one year, all leaves on each plant were harvested (19 to 23 June 2000, Fig. 5.6).
Leaves existing prior to defoliation at the start of the experiment (identified by blunt
incomplete tips) and that had subsequently elongated were bagged separately from the
remaining intact leaves initiated during the experiment. Of the new leaves, the leaf tips
were removed and also bagged separately so that the number of new leaves produced
during the experiment could be counted. All leaf material was oven dried at 70 oC over 6
days, then weighed. In the two instances when a grasstree had produced an
inflorescence, its dry mass was included as part of its total leaf biomass. In addition, a
thin wedge was cut from near the apex of each grasstree, for the purpose of collecting
leaf bases for nutrient analysis by a colleague.
Fig. 5.6 Harvesting grasstrees after one year involved removing all foliage that was
collected on large pieces of shade cloth laid beneath each plant and packaged in labelled
brown paper bags.
Chapter 5 159
5.2.1.2 Estimating canopy cover in grasstree habitat
Canopy density was estimated once for an unburnt site in the jarrah forest (MC) and
once before and 10 times after fire for a banksia woodland site burnt in autumn, on 22
April 1999 (YAB99) 6 weeks earlier than the start of the fire simulation experiment.
Canopy density was measured using a spherical forest densiometer (Ben Meadows Co.,
Atlanta, USA. Lemmon 1956, Lemmon 1957). Estimates were derived from a series of
random measurements: six at the jarrah forest site, and 8�10 at the autumn-burnt site.
Each measurement was the mean of four repeat measurements made facing in the
direction of the four compass points. Due to the patchy nature of Banksia spp. that
dominate the canopy of the woodland, measurements in this habitat were only made
within those areas where the overstory species existed. At the burnt site, canopy density
was estimated once prior to the autumn-burn, then every 6�24 weeks, with the last
measurement made two years after the fire.
5.2.2 Experiment 2: Effect of simulated herbivory on theresprouting performance and starch reserves of X. preissii
This experiment assessed the effect of five frequencies of simulated leaf herbivory on
the ability of X. preissii to resprout, and a sixth treatment introducing the effect of
residual leaf clippings, often left by parrots after feeding on grasstrees (McNee 1997.
Fig. 5.7a,b). At both sites 24 grasstrees were randomly allocated to one of the six
treatments listed below:
Control � no herbivory,
Once off clipping (herbivore attack),
Clipping every four months,
Clipping every two months,
Clipping every month, and
Clipping every month, plus clippings applied (Fig. 5.7b).
Because of the potential effect of grasstree size on growth, grasstrees of similar
circumference were selected. The removal of all living foliage using secateurs and a
hand saw simulated an herbivory event, and small 1�3 cm length pieces of grasstree leaf
collected from other grasstrees (not used in the experiment) were placed over the apex to
simulate the clippings discarded by parrots (Fig. 5.7b). No living leaves were clipped

Chapter 5 160
from the four control grasstrees, but the inner 20 young leaves were initially tagged with
coloured markers (Section 2.2.2) to indicate the youngest leaves present at the start of
the experiment. To estimate the initial living crown biomass of the control plants, the
leaf material excised from each grasstree was weighed after drying at 70 ûC for 72 h,
then used to determined the mean grasstree crown dry weight (n = 20). All plants had a
10 cm wide band of dead thatch immediately adjacent to the living foliage removed to
help identify those leaves that died during the experiment. Treatments were first
imposed on 1 July 1999 for the jarrah forest grasstrees and on 15 July 1999 for the
banksia woodland grasstrees.
Fig. 5.7 (a) accumulated small pieces of leaf (10 mm long) left behind by parrots and
cockatoos after browsing on the crown of X. preissii. (b) X. preissii studied in the
herbivory experiment after defoliation. Pieces of broken grasstree leaf were applied to
simulate the effect described for (a). Note the growth of the young leaves up through the
residual leaf pieces.
Wire cages were placed over the crown of all clipped grasstrees to prevent natural
kangaroo and parrot damage. The wire cages were identical to those described in Section
4.2.4, and their attenuation of photosynthetically active radiation (PAR) striking the
foliage was evaluated in Section 4.3.6.
On each repeat visit, determined by the frequency of each treatment, resprouting foliage
was removed, collected in paper bags, oven dried at 70 ûC, weighed, and then all leaves
a b

Chapter 5 161
with unclipped tips (i.e. new leaves produced since the last clipping) counted. Also, a
count of the number of new leaves produced on the control plants was made, and an
additional 10�coloured markers applied. After 16 months (November 2000) all
grasstrees including the controls were harvested for the final time. Dry biomass was
determined using the method described earlier for all living foliage and also for foliage
that had died during the experiment on the control plants. Mean total crown biomass
calculated at the start of the experiment was subtracted from the biomass results for the
control plants, to estimate the biomass accumulated over the 16�month period. The
number of new leaves was also counted.
On completion of the experiment the impact of the different clipping (herbivory)
regimes on grasstree starch reserves was assessed. Desmium tissue was sampled from
each grasstree (9 November for jarrah forest and 11 November for banksia woodland),
from which the starch index was determined (a relative measure of the status of the
starch reserves), using the method described in Section 3.2.5.1.
5.2.3 Statistical analyses
All statistical tests were performed using SPSS 10.0 software program (SPSS Inc.,
Chicago, U.S.A.), and each analysis conducted is indicated with the corresponding
results. Levene's test was employed to test for homogeneity of variances for all data,
which were either square root or log10 transformed as required and then re-analysed if
necessary. Where transformation did not improve sample variance an equivalent non-
parametric test was employed. Variability about the mean is quantified as standard error
throughout this chapter.
The 0.05 alpha (95% confidence) level is broadly accepted by biologists when looking
to detect true departures from a null hypothesis. However, this conventional, yet
arbitrary, probability of Type I error (the rejection of a null hypothesis when it is in fact
true) should not be considered to be written in stone (Underwood 1997). The power of
an experiment (determined by sample size and population variability) needs to be
considered, and recognition of the desirability to avoid Type II errors (accepting a null
hypothesis when it is in fact false) is important. For biological work, the consequences
of applying findings based on an incorrect conclusion, as the result of focussing on

Chapter 5 162
avoiding Type I errors, could be serious (Lamont 1995b, Underwood 1997). For the
purposes of the two relatively coarse field experiments described in this chapter, the use
of the conventional α = 0.05 was reviewed. From my knowledge of the intrinsic
variation associated with X. preissii leaf growth, the level of replication used in these
studies (imposed by restrictions on time and resource allocation) was relatively low.
From this, the term coarse, as used here, relates to the likely low power of each
experiment, and the associated high probability of Type II error. As a result, considering
the likelihood of both Type I and II errors, α = 0.1 was considered reasonable from
which to draw statistical conclusions regarding the two experiments. This was further
justified by that fact that my working hypotheses for the main effects were directional,
making one-tailed tests appropriate, whereas ANOVA is a two-tailed test.
For experiment 2, one-way ANOVA was used to initially analyse the effect of herbivory
treatments on leaf production, biomass production and stored-starch use (starch index)
by X. preissii. As the experimental strategy involved the quantification of grasstree
responses to a series of levels of herbivory, it was decided not to use a conventional
multiple comparison test, which tends to force data into distinct categories. Rather,
normal order plots (Perry 1986, Eccles et al. 2001), which use a continuous scale, were
employed to search for patterns among mean grasstree responses to each treatment,
avoiding concealing useful detail. The appropriate use of normal mean plots as an
alternative to multiple comparison tests has been demonstrated previously (Perry 1986,
Cousens 1988). Levene�s test for homogeneity of variance was applied to all data and
transformed values were plotted where necessary. All values cited in the text were
untransformed where necessary.

Chapter 5 163
5.3 Results
5.3.1 Experiment 1: Simulating three environmental factorsconsidered to characterise postfire banksia woodland
5.3.1.1 Confirming treatments effects
Plant size
To prevent a biased effect of plant size on biomass or leaf production, the circumference
of grasstrees from each treatment was compared. No significant difference in
circumference size was noted between grasstrees from each treatment (P = 0.4452; one-
way ANOVA).
Water
The largest difference between rainwater and tank water was the higher concentration of
ammonia in the rainwater (Table 5.2). Phosphate was also higher in rainwater compared
with tank water used to irrigate the grasstrees, but other differences in the chemical
constituents were considerably less.
Table 5.2 Results of a physical and chemical analysis of water, comparing rain collected
at the fire simulation (YFSE) field site, and water stored in two fibreglass tanks used to
irrigate grasstrees during the 1999/2000 summer. Data are for a single sample from each
source.
Rainwater Tank 1 (west) Tank 2 (east)
Conductivity (µs�1 cm�1) 34 126 110pH 6.3 6.6 6.4NO3 + NO2 (µg N L-1) 228 656 104Ammonia (µg N L-1) 2065 21 29Phosphate (µg P L-1) 367 18 6Potassium (mg L-1) 2 5 3Calcium (mg L-1) 46 44 55

Chapter 5 164
On the three sample dates prior to watering, soil moisture for watered and unwatered
treatments showed a similar pattern of decline (Fig.5.8), with the last pre-watering
measurements indicating that there was a significant difference between soil moisture of
the two contrasting treatments (P = 0.042; two-tailed t-test with sequential Bonferroni
correction). One week after the first watering, a treatment effect was demonstrated with
a > 2% rise in soil moisture for those plants receiving water that was significant (P =
0.0004). No difference in soil moisture between the watered and unwatered treatments
was evident by early April (P = 0.126), and this result was consistent with the last two
measurements.
Fig. 5.8 Percent soil moisture of soil collected from beneath those grasstrees irrigated
(adjacent to drippers) and those grasstrees without water added, over the 1999/2000
spring-autumn period. The timing of the start of watering is indicated and data are mean
of six plants ± standard error.
Seasonal midday and predawn Ψx were not very different between watering treatments
(Fig. 5.9a,b). Mean summer predawn Ψx of watered grasstrees was higher than those
unwatered, but the difference was less than 0.3 MPa. Unwatered grasstrees from the fire
simulation experiment had consistently lower predawn Ψx than the unclipped grasstrees
from the control site (YC). While midday Ψx of these grasstrees was considerably
different during spring, the difference was less pronounced during summer and autumn.
0
2
4
6
Oct Nov Dec Jan Feb Mar Apr May Jun
Soi
l moi
stur
e (%
)
watering started
+water
-water
1999 2000

Chapter 5 165
Fig. 5.9 Water potentials measured on watered and unwatered grasstrees during the fire
simulation experiment and concurrently on grasstrees from the unburnt, banksia
woodland, control site (YC). Measurements were made (a) predawn and (b) midday,
once during spring, summer and autumn. Data are mean of six plants ± standard error.
Shade
PAR decreased linearly with increasing shade cloth density (Fig. 5.10).
Fig. 5.10 Photosynthetically active radiation (µmol m�2 s�1) measured beneath four
densities of shade cloth, representing 0%, 50%, 70% and 90% shading. Data are mean of
six measurements ± standard error.
-2
-1
0
Sep Nov Jan Mar May
Wat
er p
oten
tial (
MP
a)
2000
-water
+water
a) Predawn
YC
1999Sep Nov Jan Mar May
2000
-water
+water
b) Midday
YC
1999
0
500
1000
1500
2000
2500
0 20 40 60 80 100
Shade cloth density (%)
Pho
tosy
nthe
tical
ly a
ctiv
e ra
diat
ion

Chapter 5 166
5.3.1.2 The effect of water, ash and shade on grasstree biomass and leafproduction
Of the three factors (water, ash or shade), ash and shade affected leaf growth (Table 5.3).
The addition of ash was associated with greater new leaf biomass (P = 0.065, three-way
ANOVA), yet played no role in new biomass production by leaves existing at the time
of treatment application. 90% shading resulted in a decrease of biomass in both leaf
categories as well as in the number of leaves produced. Mean total biomass was 25%
greater for grasstrees in full sun and they produced on average 15% more leaves than
those under shade cloth. The only significant interaction was between water and shade
for pre-existing leaf biomass (P = 0.090, three-way ANOVA): when grasstrees were
shaded, the addition of water increased biomass, but when in full sun, the reverse
occurred.
Table 5.3 Summary of the effect of water, ash and shade on leaf biomass and the
number of leaves produced by X. preissii during a three-way factorial experiment
conducted from 10 June 1999 to 23 June 2000. Data are means of 5�6 plants with SE in
parentheses. P-values for each of three separate ANOVA analyses are provided.
Biomass (kg)Pre-existing leaves New leaves
Number ofnew leaves
Shade Shade ShadeTreatment factorsand level + � + � + �
+1.145
(0.148)1.100
(0.198)2.486
(0.284)2.483
(0.421)1215(73)
1489(143)
+
Ash
�0.945
(0.125)0.985
(0.175)1.920
(0.131)2.351
(0.427)1259(148)
1230(83)
+0.966
(0.106)1.231
(0.118)2.195
(0.188)2.954
(0.329)1254(59)
1427(65)
Wat
er
�
Ash
�0.807
(0.140)1.281
(0.174)1.870
(0.281)2.248
(0.382)1174(130)
1384(145)
Three-way ANOVA (P-values)
Water (W) 0.797 0.976 0.986Ash (A) 0.328 0.065 0.352Shade (S) 0.094 0.094 0.070
W × A 0.634 0.717 0.673W × S 0.090 0.441 0.762A × S 0.497 0.955 0.479
W × A × S 0.772 0.376 0.231
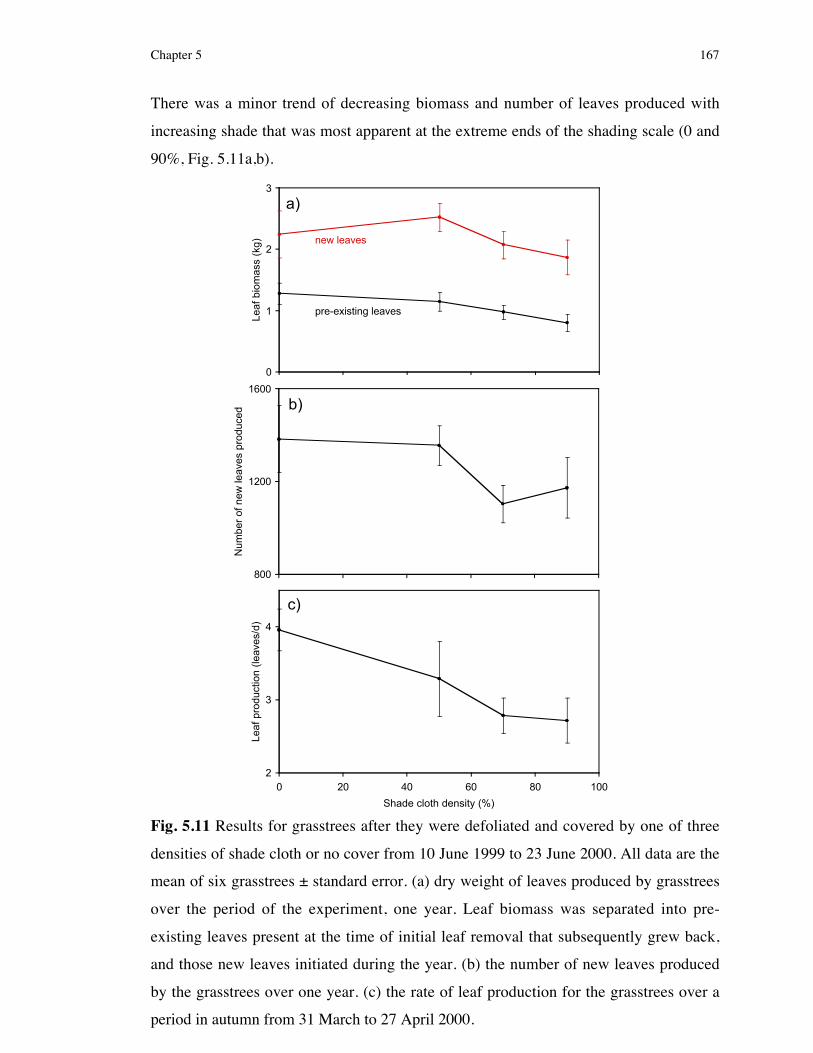
Chapter 5 167
There was a minor trend of decreasing biomass and number of leaves produced with
increasing shade that was most apparent at the extreme ends of the shading scale (0 and
90%, Fig. 5.11a,b).
Fig. 5.11 Results for grasstrees after they were defoliated and covered by one of three
densities of shade cloth or no cover from 10 June 1999 to 23 June 2000. All data are the
mean of six grasstrees ± standard error. (a) dry weight of leaves produced by grasstrees
over the period of the experiment, one year. Leaf biomass was separated into pre-
existing leaves present at the time of initial leaf removal that subsequently grew back,
and those new leaves initiated during the year. (b) the number of new leaves produced
by the grasstrees over one year. (c) the rate of leaf production for the grasstrees over a
period in autumn from 31 March to 27 April 2000.
0
1
2
3
Leaf
bio
mas
s (k
g) new leaves
pre-existing leaves
a)
800
1200
1600
Num
ber
of n
ew le
aves
pro
duce
d b)
2
3
4
0 20 40 60 80 100
Shade cloth density (%)
Leaf
pro
duct
ion
(leav
es/d
)
c)
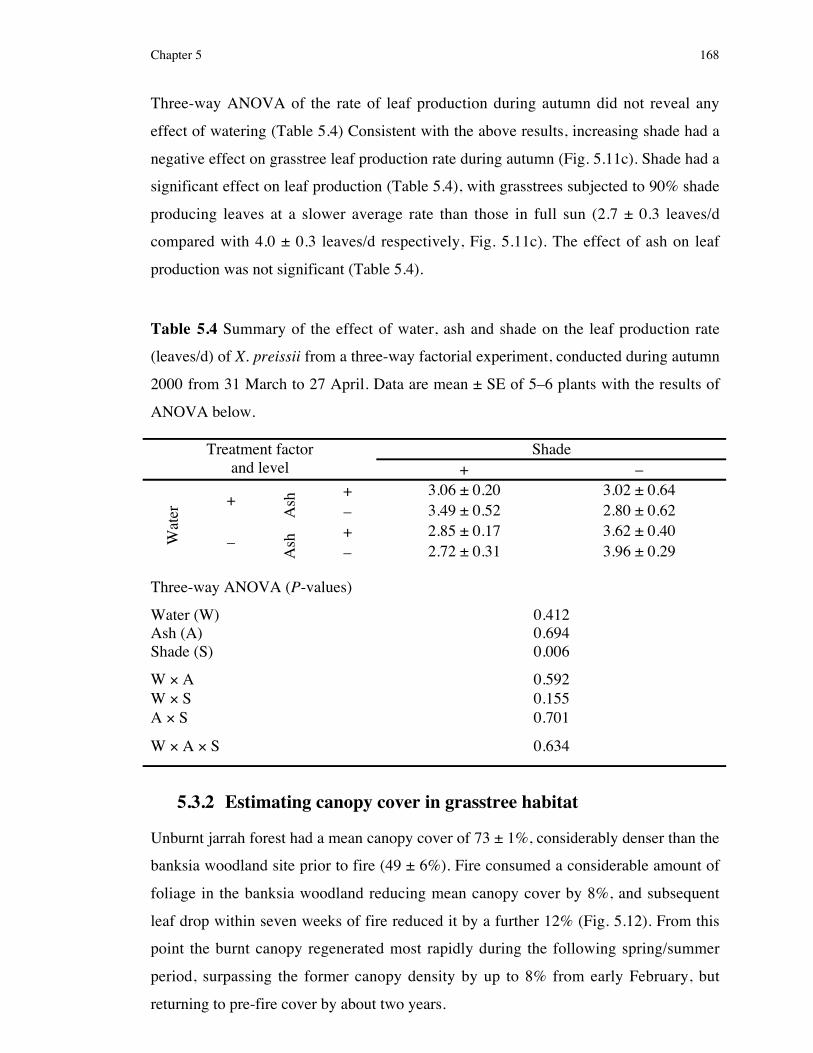
Chapter 5 168
Three-way ANOVA of the rate of leaf production during autumn did not reveal any
effect of watering (Table 5.4) Consistent with the above results, increasing shade had a
negative effect on grasstree leaf production rate during autumn (Fig. 5.11c). Shade had a
significant effect on leaf production (Table 5.4), with grasstrees subjected to 90% shade
producing leaves at a slower average rate than those in full sun (2.7 ± 0.3 leaves/d
compared with 4.0 ± 0.3 leaves/d respectively, Fig. 5.11c). The effect of ash on leaf
production was not significant (Table 5.4).
Table 5.4 Summary of the effect of water, ash and shade on the leaf production rate
(leaves/d) of X. preissii from a three-way factorial experiment, conducted during autumn
2000 from 31 March to 27 April. Data are mean ± SE of 5�6 plants with the results of
ANOVA below.
ShadeTreatment factorand level + �
+ 3.06 ± 0.20 3.02 ± 0.64+
Ash
� 3.49 ± 0.52 2.80 ± 0.62+ 2.85 ± 0.17 3.62 ± 0.40
Wat
er
�
Ash
� 2.72 ± 0.31 3.96 ± 0.29
Three-way ANOVA (P-values)
Water (W) 0.412Ash (A) 0.694Shade (S) 0.006
W × A 0.592W × S 0.155A × S 0.701
W × A × S 0.634
5.3.2 Estimating canopy cover in grasstree habitat
Unburnt jarrah forest had a mean canopy cover of 73 ± 1%, considerably denser than the
banksia woodland site prior to fire (49 ± 6%). Fire consumed a considerable amount of
foliage in the banksia woodland reducing mean canopy cover by 8%, and subsequent
leaf drop within seven weeks of fire reduced it by a further 12% (Fig. 5.12). From this
point the burnt canopy regenerated most rapidly during the following spring/summer
period, surpassing the former canopy density by up to 8% from early February, but
returning to pre-fire cover by about two years.

Chapter 5 169
Fig. 5.12 Changes in the percentage canopy density prior to and following an autumn
prescribed burn (22 April 1999) in banksia woodland, demonstrating the effect of fire
and foliage regrowth. Data are the mean (± standard error) of 8�10 random
measurements made using a forest densiometer within an area of canopy cover.
5.3.3 Experiment 2: Effect of herbivory frequency on theresprouting performance and starch reserves of X. preissii
Grasstree stem circumference was not different across treatments at either site (P =
0.946, two-way ANOVA), but the larger mean stem circumference of grasstrees used at
the banksia woodland site (84.8 ± 1.6 cm) was significantly different from those at the
jarrah forest site (70.8 ± 1.3 cm. P < 0.0001). There was no interaction between site and
treatment circumference (P = 0.911).
Grasstrees from both habitats exposed to simulated herbivory every four months
produced the greatest mean number of leaves of any treatment (Fig. 5.13a,b). Control
grasstrees at each site contrasted in their mean leaf production performance relative to
the other treatments. While those from the jarrah forest showed a relatively large amount
of leaf production, the control plants in banksia woodland produced the least number of
leaves. Grasstrees for which foliage was removed every two months, every month, as
well as being covered in broken leaf, or defoliated only once over 16 months,
experienced a similar level of leaf production in both habitats.
15
30
45
60
Jan Apr Jul Oct Jan Apr Jul Oct Jan Apr
Can
opy
cove
r (%
)
1999 2000 2001
fire
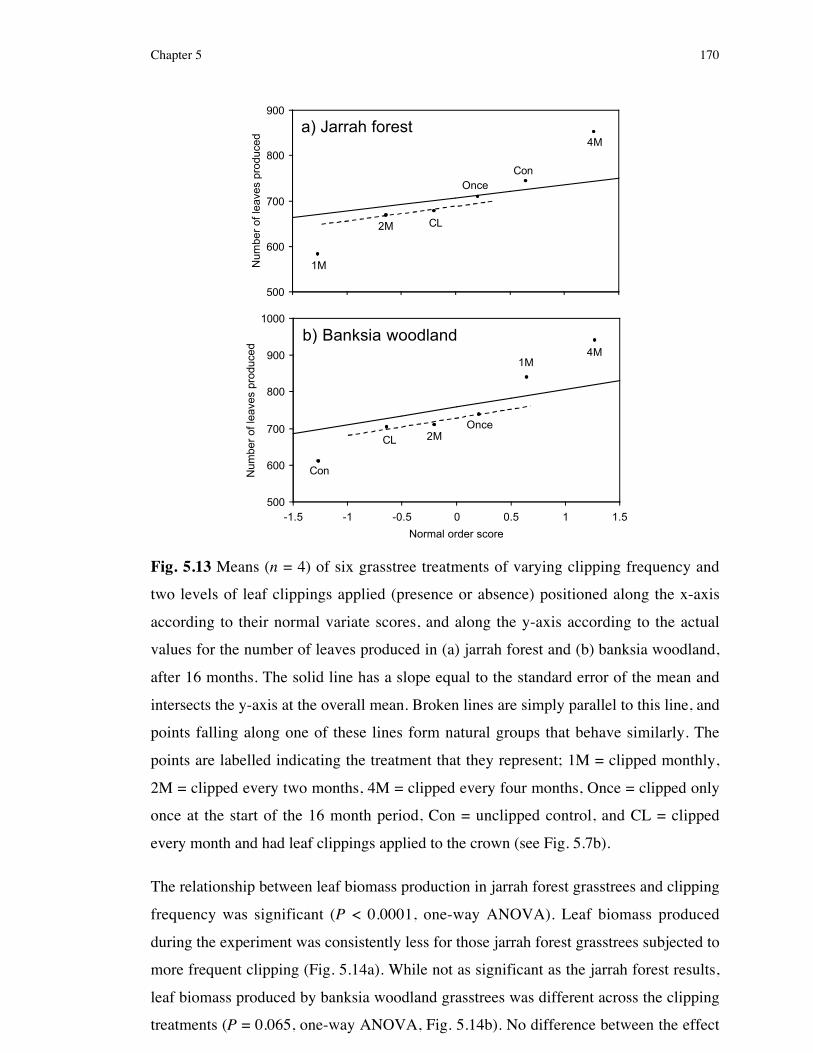
Chapter 5 170
Fig. 5.13 Means (n = 4) of six grasstree treatments of varying clipping frequency and
two levels of leaf clippings applied (presence or absence) positioned along the x-axis
according to their normal variate scores, and along the y-axis according to the actual
values for the number of leaves produced in (a) jarrah forest and (b) banksia woodland,
after 16 months. The solid line has a slope equal to the standard error of the mean and
intersects the y-axis at the overall mean. Broken lines are simply parallel to this line, and
points falling along one of these lines form natural groups that behave similarly. The
points are labelled indicating the treatment that they represent; 1M = clipped monthly,
2M = clipped every two months, 4M = clipped every four months, Once = clipped only
once at the start of the 16 month period, Con = unclipped control, and CL = clipped
every month and had leaf clippings applied to the crown (see Fig. 5.7b).
The relationship between leaf biomass production in jarrah forest grasstrees and clipping
frequency was significant (P < 0.0001, one-way ANOVA). Leaf biomass produced
during the experiment was consistently less for those jarrah forest grasstrees subjected to
more frequent clipping (Fig. 5.14a). While not as significant as the jarrah forest results,
leaf biomass produced by banksia woodland grasstrees was different across the clipping
treatments (P = 0.065, one-way ANOVA, Fig. 5.14b). No difference between the effect
500
600
700
800
900
Num
ber
of le
aves
pro
duce
d1M
2M
4M
CL
OnceCon
a) Jarrah forest
500
600
700
800
900
1000
-1.5 -1 -0.5 0 0.5 1 1.5
Normal order score
Num
ber
of le
aves
pro
duce
d
1M
2M
4M
CL
Once
Con
b) Banksia woodland

Chapter 5 171
of the three highest clipping frequencies (including the treatment where leaf clippings
were applied) on leaf biomass production could be distinguished for grasstrees from
either habitat (Fig. 5.14a,b). These three treatments caused the lowest level of grasstree
biomass production for both habitats, yet the lowest leaf biomass produced by banksia
woodland grasstrees (0.805 kg) was over twice that produced by the jarrah forest
grasstrees (0.340 kg). The highest mean biomass was produced by the control grasstrees
in the jarrah forest (1.423 kg); in contrast, banksia woodland grasstrees responded with
leaf biomass production greater than that of the controls (1.081 kg) after a single
simulated herbivory event (1.420 kg) and, higher again, after herbivory every four
months (1.934 kg, Fig. 5.14b). This effect of the four-monthly clipping treatment on
banksia woodland grasstree biomass relative to the other treatments was consistent with
the leaf production data.
Fig. 5.14 Normal order plots, as described in Figure 5.13 for leaf biomass production
response of grasstrees subjected to the same six treatments in (a) jarrah forest and (b)
banksia woodland, over 16 months. Each point is the mean of four grasstrees and is
labelled as in Figure 5.13. A log10 transformation was used for the jarrah forest data to
ensure homogeneity of variances.
2
3
4
Lo
g(b
iom
ass
)
1M 2M
4M
CL
Once
Con
a) Jarrah forest
0.5
1
1.5
2
-1.5 -1 -0.5 0 0.5 1 1.5
Normal order score
Bio
mas
s (k
g)
1M 2M
4M
Cl
Once
Con
b) Banksia woodland

Chapter 5 172
The pattern of starch use over 16 months of simulated herbivory, suggested by the
relative amount of stored starch present in the desmium (starch index) of each grasstree,
was consistent between the two habitats (Fig. 5.15a,b). The starch index was
significantly affected by clipping treatments (P = 0.003 for jarrah forest grasstrees, P =
0.011 for banksia woodland grasstrees, one-way ANOVA), with the four highest
clipping frequency treatments resulting in equivalent, low starch indices for those
grasstrees. A slight difference between the starch indices of these four treatments was
observed for banksia woodland grasstrees (Fig. 5.15b) but this was minor relative to the
starch available to control and once-clipped grasstrees (compare the range of mean
grasstree starch indices of the four highest frequency treatments = 8.8�11.8, with the
mean for the controls = 98.3). In jarrah forest the single clipping treatment was sufficient
to reduce grasstree starch reserves below that of the intact control plants, but not in
banksia woodland.
Fig. 5.15 Normal order plots, as described in Figure 5.13, for the relative availability of
starch (starch index) in grasstrees subjected to the same six treatments in (a) jarrah forest
and (b) banksia woodland, over 16 months. Points are the mean of four grasstrees and
are labelled as in Figure 5.13. A squareroot transformation was used for the banksia
woodland data to ensure homogeneity of variances.
0
20
40
60
80
100
Sta
rch
inde
x
1M2M
4MCL
Once
Cona) Jarrah forest
0
2
4
6
8
10
12
-1.5 -1 -0.5 0 0.5 1 1.5
Normal order score
Squ
arer
oot
(sta
rch
inde
x)
1M2M
4MCL
Once
Con
b) Banksia woodland

Chapter 5 173
Finally, the effect of adding leaf clippings to the apex of grasstrees subjected to monthly
herbivory was examined. No significant effect of the added leaf material was
demonstrated for leaf production (P = 0.390 for jarrah forest, P = 0.334 for banksia
woodland, t-test), leaf biomass (P = 0.523 for jarrah forest, P = 0.793 for banksia
woodland) and starch index (P = 0.597 for jarrah forest, P = 0.774 for banksia
woodland).

Chapter 5 174
5.4 Discussion
5.4.1 Causes of postfire crown vigour
Foliage growth responded differently to each of ash, water and shade, hypothesised as
important to grasstree postfire leaf growth. Results indicated that while the presence of
ash and reduced interception of PAR after fire can significantly increase biomass and
leaf production of X. preissii, the characteristically vigorous rate of crown regrowth is
unlikely to be supported by an improvement in soil water status. Although the positive
effect of reducing shade and adding ash have importance, it is likely that the clipping of
grasstree foliage, simulating leaf combustion during fire, was the primary cause of
increased grasstree leaf production. Over the year-long experiment, grasstrees subjected
to all treatment combinations produced at least twice as many leaves as the number
produced by intact grasstrees from the unburnt control site (YC, after making a suitable
correction for plant size: see Section 3.3.1.1).
Generally, the mean number of leaves produced by grasstrees in each treatment more
closely parallelled the mean number of leaves produced by banksia woodland grasstrees
burnt during autumn 1999 (compare 733�989 leaves (range of results across treatments
with mean of 854) to 905 leaves). To quantify the effect of clipping, leaf production of
grasstrees subjected to the treatment �ash, �water and 50% shade, was compared with
leaf production of intact control plants from YC. This selection, and not of the treatment
�ash, �water and 0% shade, was based on the assumption that unclipped grasstrees are
self-shading, possibly reducing apex temperature and light penetration to the inner
leaves, which is compensated for by the 50% shade cloth treatment. The effect of
clipping alone can therefore be considered to increase normal grasstree leaf production
by 126%, significantly greater than the individual response to any of the three variables
explored (compare the range of 1174�1427 leaves produced in response to additions of
ash, shade and water with 1356 leaves produced from clipping alone (�ash, �water and
50% shade)).
Chapter 5 175
Ash
The positive affect of ash addition can be attributed to the nutrient enrichment of the
soil, universally demonstrated by numerous authors working in floristically disparate
environments (Hatch 1960, Stark 1979, Adams et al. 1994, Grogan et al. 2000). Ash-
derived nutrients supported grasstree biomass production, suggesting that grasstree
crown development in banksia woodland is limited by nutrient supply in the absence of
fire. This is not surprising considering the general acceptance that the shrublands of
southwestern Australia, as well as other heath and woodlands throughout Australia, are
extremely nutrient impoverished (Specht 1969, Specht 1973, Lamont 1984, Lamont
1995a).
Increased photosynthetic rates, encouraging faster growth of resprouting shrubs in
mediterranean Californian and Spain, have been attributed to increased nutrient
availability, specifically nitrogen (Radosevich & Conard 1980, Oechel & Hastings 1983,
Fleck et al. 1995). However, Keith et al. (1997) demonstrated how increased phosphorus
availability increased wood biomass in a mature snowgum (Eucalyptus pauciflora)
forest, but also decreased root biomass, resulting in little change in net productivity.
Therefore, although ash deposited during fire may partially account for the increase in
leaf biomass of X. preissii, it is possible that this effect may reflect a change in carbon
allocation and not necessarily a net increase in plant productivity.
Despite enhancing biomass production, no evidence was obtained to indicate any role of
ash in stimulating the production of new leaves. Stored carbon remobilised for growth
following fire (see Chapter 3) contributes to leaf production at the apical meristem.
While the apex is receiving carbohydrate from this endogenous source, any effect of an
increase in photosynthates exported by maturing leaves under the influence of nutritient
enrichment may be diminished.
The effect of ash addition showed greater bias than any distinction between its effect on
biomass production versus leaf production. Specifically, ash addition only encouraged
new leaf biomass production, implying that after fire nutrients are preferentially directed
from the roots to the youngest leaves surrounding the apical meristem, where they act to
increase growth. Alternatively, it is possible that nutrient enhanced growth of the pre-
existing leaves may have been masked by time and an inherited maximum leaf size.

Chapter 5 176
Within the timeframe of the experiment all pre-existing leaves, regardless of treatment,
may have been capable of expanding to a genetically determined size limit, masking any
differences in growth rate between pre-existing leaves of grasstrees that received ash and
those grasstrees that did not. In contrast, the potential for new leaf biomass accumulation
over the same period was limited only by the capacity of photosynthesis and growth rate
imposed by treatments.
The positive response of X. preissii to ash addition meant that nutrients, most likely
released after rainfall, penetrated the soil sufficiently to reach active grasstree roots.
Increases in leafblade and leafbase nutrient concentrations in X. preissii after fire
(Burrows 1998, Wittkuhn 2000, Ward et al. 2001) are in keeping with this conclusion.
The evidence of nutrient uptake by grasstree roots contradicts the theory that the root
systems of resprouting species are too deep to access ash-derived nutrients (Wisheu et
al. 2000), and favours the idea that resprouters are likely to benefit more from the
nutrient-rich postfire soils than their ecological counterparts regenerating from seeds
(Biswell 1974, Keeley & Zedler 1978, Grove et al. 1986). However, to fully explore
these two conflicting hypotheses it would be useful to identify how soon after ash
application did the grasstrees show a positive growth response. For such work I would
suggest a more powerful experiment (e.g. increased replication) capable of identifying
the first, potentially small effects of ash addition.
Shade
Grasstree leaf growth can be reduced by applying shade, consistent with results
presented by other researchers for a variety of plants (Hulbert 1988, Gentle & Duggin
1997b, Vila 1997, de Groot & Wein 1999). The response of X. preissii suggested a
resilience of this species to shade, indicated by relatively weak negative correlations
between percentage shade and leaf biomass and leaf number (Fig. 5.11a�c). If
considered in relation to an increase in incident radiation following a reduction in
overstorey cover due to fire, an increase of PAR by 87% (246 ± 8 µmol m�2 s�1 incident
PAR increased to 1940 ± 6 µmol m�2 s�1) induced an increase in leaf biomass of 25%
and an increase in the number of new leaves produced by 15%, over the year. This was
the largest effect of shade on grasstree leaf grow recorded, and was comparatively quite
low compared with findings by Stoneman et al. (1995) who measured an eight fold

Chapter 5 177
increase in shoot dry weight for jarrah seedlings at a site where the overstorey had been
removed (increasing PAR by only 53%). However, this enhanced growth was the net
result of the combined effects of increased PAR, warmer soil temperatures, which were
considered to have caused a relatively small component of the growth response
(Stoneman & Dell 1993), and improved plant water status, to which growth and
photosynthesis rates were most sensitive (Stoneman et al. 1994).
Realistically, within its distribution, X. preissii is unlikely to experience an 87% increase
in PAR as the result of fire removing the overstorey foliage, primarily because the
undamaged natural canopy density is never likely to be sufficiently dense. Banksia
woodland canopy density at YAB99 was reduced from 49 ± 6% to 30 ± 6% as the result
of leaf combustion and subsequent leaf drop due to scorch from the autumn-prescribed
burn. While the relationships between percentage shading and leaf biomass and leaf
production suggest a possible advantage to grasstrees resprouting in this modified light
environment, the associated increase in PAR with this level of canopy opening is likely
to account for very little of the typical postfire vigour of X. preissii. An autumn wildfire
or a crown fire in jarrah forest causing total defoliation (Bell et al. 1989) would be likely
to induce a stronger light dependent postfire growth response in X. preissii, because of
the initial canopy cover (73 ± 1%) being significantly greater than in banksia woodland.
In either habitat any positive effect of improved light conditions would be short-lived,
ensured by the rapid recovery of the overstorey, as demonstrated for the banksia
woodland in my study (Fig. 5.12).
Water
During winter, rainfall did not have any value for predicting grasstree growth (Section
2.3.1.1). Consequently the lack of a response to watering over this period may have
acted to dilute any positive effect this treatment had during spring and summer.
However, not even during autumn when X. preissii has been shown to react positively to
significant rainfall (see Section 2.3.3.2) was an effect of the watering treatment
recorded. Two possible conclusions can be drawn: firstly, that the volume of water
applied was less than the equivalent of 18 mm of rainfall that has been observed to
induce a leaf production response during summer/autumn, or secondly, that the
distribution and application rate of the water, despite considerable efforts, was not

Chapter 5 178
consistent with grasstree rooting patterns. Although an effect of watering was apparent
from predawn summer water potentials, it was not large enough to disregard the second
conclusion.
Soil water availability around grasstree roots was not enhanced by the watering
treatment, evident by the similarity of predawn water potentials between grasstrees not
receiving water and those watered (Fig. 5.9a,b). This is consistent with evidence
presented in Chapter 3, which also discounts speculation that improved water status
supports grasstree growth after fire. Further consistency was revealed by the midday
water potential results. Reduced crown size was suggested to be the cause of higher (less
negative) midday water potentials in recently burnt grasstrees relative to those unburnt
(Chapter 3). This interpretation is supported by the substantial difference in spring
midday water potentials between clipped (unwatered) grasstrees from the fire-simulation
experiment and unclipped control grasstrees (Fig. 5.9b). This difference was marginal
during summer and possibly obscured by site differences indicated by varying predawn
water potentials. By autumn, crown regrowth was sufficient to neutralise any effect.
5.4.2 Grasstree resilience to frequent herbivore damage
X. preissii was particularly resilient to the sort of damage inflicted by herbivores that
exist within its distribution. Even after total defoliation of the crown, imposed at
monthly intervals for 16 months, X. preissii demonstrated a strong capacity to recover in
both jarrah forest and banksia woodland. The toll of this regenerative effort could be
measured as a large reduction in desmium starch reserves: 85% for jarrah forest
grasstrees and 88% for banksia woodland grasstrees. This dependence of vegetative
regrowth on starch reserves has been identified repeatedly (Donart & Cook 1970, Kosola
et al. 2001), and starch has been demonstrated to be the most critical resource
(Miyanishi & Kellman 1986) to the survival of resprouter species susceptible to
defoliation by herbivory and fire (Bamber & Humphreys 1965).
A conspicuous result of this experiment was the stimulation of regrowth due to four-
monthly herbivory on grasstree regrowth in both habitats. Particularly for jarrah forest
grasstrees, this treatment response demonstrates the level of crown damage sustainable
by X. preissii during a 16�month period without a negative impact on leaf production,

Chapter 5 179
and arguably the species� general regenerative performance. More specifically, this
treatment induced a degree of growth overcompensation (stimulation of growth above
that of the controls), most evident in the leaf production response. This result suggested
no unfavourable impact of this simulated herbivory regime, yet the costs are subtly
disguised as a substantial depletion (89%) in available starch. Therefore, while
grasstrees can respond to this frequency of clipping with vigorous regrowth for up to 16
months, further damage at this rate, completing the depletion of reserve starch, could
retard further growth of these grasstrees or even jeopardise their survival. This likely
scenario reflects the conclusions by Lindroth (1989) regarding plants that show
overcompensatory growth following herbivory. However, his generalisation that growth
overcompensation is characteristic of plants growing on nutrient-rich sites does not hold
true for X. preissii, which grows on infertile soils throughout its distribution (Hobbs et
al. 1995a). It is easy to see that without the consideration of reserves, the cost of
herbivory on X. preissii may be inaccurately estimated or go totally unnoticed. Similarly,
Silvertown and Dodd (1999) discussed the importance of assessing reserves to avoid the
underestimation of costs associated with reproduction in perennial plants.
Despite the response just described, herbivory frequency was generally negatively
correlated with grasstree growth performance in jarrah forest, which in turn was
ultimately a function of reserve starch availability: the more frequently a plant was
damaged the more starch it demanded. Starch reserves did not appear to limit grasstree
leaf production in banksia woodland under any of the herbivory frequencies, as foliage
clipping consistently produced a stimulatory effect beyond that of normal growth. In the
same habitat the two lowest frequency treatments stimulated grasstree biomass
production, as described for leaf production, but the highest herbivory frequencies
(every one and two months) failed to induce a similar response in leaf biomass
production. The disparity between these results implies that even when starch reserves
are dwindling they are still used indiscriminately within the crown. It may be predicted
that if starch reserves were rapidly running out they would be best spent in developing
current young leaves to a condition where they may contribute to carbon demands.
However, in a depleted state reality showed that remobilised carbohydrates continued to
support the production of new leaves, despite the negative impact of low starch reserves
on the elongation and expansion (biomass production) of leaves reaching photosynthetic
maturity. An investigation of the partitioning of carbon between the roots and shoots

Chapter 5 180
during a period of herbivory would be of interest. While a study of three annual species
demonstrated that when nutrient availability changed no adjustment to the root/shoot
partitioning of biomass occurred (McConnaughtay & Coleman 1998), Eucalyptus
pauciflora responded to similar changes with a considerable shift in carbon allocation
(Keith et al. 1997). These studies could be considered to parallel the changes in growth
and resource availability in X. preissii during herbivory, but clearly the stimuli are quite
different. I predict that as a survival mechanism for X. preissii, root growth would
decrease or cease altogether, even during light herbivory, as nutrients and more
importantly carbon are preferentially translocated to the rapid leaf growth above ground.
The greater resprouting performance of banksia woodland grasstrees than those in jarrah
forest points towards a likely difference in resource availability that favours growth on
the Swan Coastal Plain relative to the Darling Range. However, comparisons of the size
of grasstrees at the two sites have not revealed consistent differences (contrast results
presented in Section 3.2.2.1 with those from this experiment), therefore failing to offer
support for this argument. The 19% greater mean starch index (relative starch
availability) in unclipped control grasstrees from banksia woodland was convincing
evidence of the availability of larger carbon reserves in those plants. This may reflect the
marginally larger average stem circumference of banksia woodland grasstrees (84.8 ±
1.6 cm) than for the jarrah forest plants (70.8 ± 1.3 cm). Such a difference in starch
reserve size may account for the variability of responses between grasstrees from each
habitat, and would help to postpone the symptoms of chronic herbivory in the banksia
woodland plants.
Port Lincoln Ringneck parrots cause severe damage to remnant stands of X. preissii in
Western Australia�s intensively farmed wheatbelt region, particularly when agricultural
crops (the preferred food source) have died off in early summer and green feed is limited
(McNee 1997). As in this case, pressure from herbivores can often be exacerbated by
dry conditions (Zamora et al. 2001). Parrots are capable of totally defoliating a grasstree
crown, and from anecdotal evidence McNee (1997) suggests that grasstrees may persist
for 4�7 years before death results. Because of distinct differences between this scenario
and the regime of foliage damage described during this study (e.g. seasonal herbivory
versus continuous herbivory), it is hard to speculate on the likely frequency of parrot
visits to wheatbelt grasstrees and the role that carbohydrate reserve depletion plays in the

Chapter 5 181
death of these plants. However, from the information at hand the likely sequence of
events that leads to the demise of X. preissii as the result of parrot herbivory, or similar
chronic herbivory can be inferred. It is clear that X. preissii starch reserves are sufficient
to support new crown growth after an initial season of browsing imposed by parrots
during summer/autumn, despite its coincidence with minimum annual starch reserves in
late autumn (Section 3.3.4). It has been demonstrated that the impact of grazing is
greater when starch reserves are at an annual low in grass and shrub species in montane
Utah, compared with when they are at an annual high (Donart & Cook 1970). If this
pattern of impact is consistent for grasstrees, the effect of regrowth costs may be
compounded.
No effect of applied clippings was apparent during this study, possibly as strong
resprouting by X. preissii acted to rapidly push developing leaves up through the
clippings, preventing shading and smothering effects. Similarly, leaf growth rates
between periods of intense parrot browsing may be initially high, and new leaf
elongation may aid in the dissipation of leaf remnants and circulation of air around the
apex. While the winter months offer a period for recovery of damaged grasstrees (lowest
annual browsing pressure (McNee 1997)), the minimum temperatures are not conducive
for leaf growth (Chapter 2), but may allow photosynthate production (Larcher 2000) that
contributes to the replenishment of desmium starch. If the same grasstrees are repeatedly
damaged over successive summers, the net effect is likely to be a gradual depletion of
starch reserves. Following shoot destruction after burning, starch reserves of a
mediterranean shrub (Bowen & Pate 1993) and two neotropical savanna shrubs
(Miyanishi & Kellman 1986) took up to 1.5�2 years to return to pre-burn levels:
considerably longer than the 6�7 month reprieve of X. preissii from parrot browsing.
After several years crown recovery would become negligible, and residual leaf would
begin to persist about the apex, creating an environment conducive to rot, encouraging
death.

Chapter 5 182
5.4.3 Is rapid leaf growth response to crown damage of X. preissiian adaptation to fire or herbivory?
Repeatedly, data presented in my thesis has revealed a significant stimulatory effect of
foliage removal on the subsequent growth of X. preissii, particularly evident in this
chapter.
1) Grasstrees demonstrated a rapid flush of leaf production after spring or autumn
fire consumed much of the existing crown.
2) Removal of all foliage following flowering, a nutritionally and energetically
stressful period, stimulated a rapid and temporarily sustained flush of leaves.
3) Clipping of the entire crown to simulate the damage caused by fire was shown to
increase leaf production, and
4) Complete removal of all foliage in unburnt jarrah forest, at varying frequencies,
again confirmed this species� plastic responses to crown damage.
Without prior knowledge of Australia�s pre-history, and in the context of the present
vulnerability of the Australian bush to fire, the obvious conclusion to draw from an
examination of grasstrees morphology, flammability and early seedling establishment is
one of adaptation to its fire-prone environment (for detail see the Introduction of Chapter
3). Logically, it follows that the postfire growth response is simply another example of
such adaptation. Yet, increasingly, data collected during my study suggest that this may
not necessarily be the case.
The natural occurrence of fire is a relatively new factor influencing Australia�s flora, as
its frequency has only recently increased with the continent�s gradual shift to aridity
during the late Tertiary (Hopper et al. 1996), and possibly within the last three million
years (Specht 1973, Specht & Specht 1999). Flannery (1994) suggested that the
importance of the role of fire in today�s landscape reflects its replacement of the long
extinct herbivore megafauna that roamed much of Australia: the standing biomass once
recycled as faecal pellets, now more commonly is returned to the soil as ash. While the
exact interchangeable nature of the megafauna and fire in this particular role may be
questionable, the chronology of the relative importance of herbivory predating fire
seems quite certain.

Chapter 5 183
Evidence is more often presented for the timing of the disappearance of Australia�s
megafauna from the fossil record (Archer 1984, Dawson & Augee 1997) than their
appearance, but it is generally agreed that faunal gigantism prevailed from the Pliocene
(starting 5�7 million yrs BP) to the Pleistocene epochs (Hopper et al. 1996, Augee &
Fox 2000). However, Australia�s populations of herbivores were well established by this
stage, with the diprotodonts (one of the two orders of extant marsupials, the majority of
which are herbivorous) emerging as early as 63 million years ago (Woodburne 1996),
and no later than the Eocene (from Hopper et al. 1996). Specific to the current plight of
remnant X. preissii populations in the wheatbelt region of Western Australia, the global
fossil record of parrots is generally scant, let alone specific to Australia, as their bones
are not predisposed to fossilisation, which is also hindered by the lack of water in their
habitat (Forshaw 1978, Rich & Van Tets 1984). While the oldest fossil parrot
(Archaeopsittacus verreauxi) was unearthed in France and dated at about 30 million
years (Forshaw 1978), predictions of the appearance of parrots in the Australian
landscape have suggested the mid to late-Cainozoic (from 5�20 million years ago. Rich
& Van Tets 1984). Although, this is a very broad estimate it does suggest that parrots
may have been feeding on grasstrees for some time.
Native fauna, such as the kangaroo and wallaby, are considered to exert minimum
grazing pressure on the plant communities of Australia (Specht 1973). But the array of
mechanical and chemical herbivore deterrents that are exhibited by the present
Australian flora imply that this may not have always been the case. The high incidence
of spininess of southwestern Australian heath species has been suggested to be a defence
mechanism against browsing megafauna with the ability to survive on plant material of
very low nutritive value (Grubb 1992, Hobbs et al. 1995a). Other mechanisms with
contemporary relevance to plant survival imply more than a minimum impact of modern
herbivores. For example, �self-crypsis� shown by Hakea trifurcata, where fruits mimick
the unrewarding broad leaves reducing herbivory by white-tailed black cockatoos
(Calyptorhynchus funereus latirostris. Groom et al. 1994a).
From this perspective it is hard not to wonder whether the growth response of X. preissii
to fire could in fact represent an adaptation to sustained grazing pressure over millions
of years, and the responses observed during this study reflect the similarity between the
action of fire and herbivory on this species: a level of stress accompanied by substantial
Chapter 5 184
crown damage. Artificial removal of leaves more closely approximates the damage
caused by browsing animals than the effect of fire yet causes a similar response.
Flowering of X. australis has been shown to be stimulated by simply clipping the foliage
(Gill & Ingwersen 1976), and although the probability of plants flowering may be
improved by burning, perhaps the application of a Diprotodon-sized dropping beneath a
grasstree would help to achieve a comparative response!
To take this line of reasoning a step further, the grasstree characteristics attributed to fire
resistance can be viewed as being derived from selective pressures driven by herbivory.
In the absence of a protective layer of bark to deter browsing and boring herbivores from
harvesting the nutrient-rich inner stem, Xanthorrhoea spp. have compensated by
retaining their dead leaves and impregnating them with a hard, indigestible resin. With
large enough herbivore populations the gradual accumulation of dead skirt would be
regularly trimmed, preventing the rot, termite damage and stem breakage (due to
excessive thatch weight) seen today in long unburnt stands (Ward 2000). The
significance of the flammable skirt may represent mere coincidence, a conclusion
difficult to accept under contemporary natural fire frequency, but more likely in a
damper, subtropical Australia of 65 million years ago. The dense packing of green
foliage around the apex seems like a common solution to an organisational problem of
many leaves growing from a single meristem, a feature shared by related plants from
other habitats, including palms, cycads, Dracaena spp. and Yucca spp. For grasstrees,
this arrangement affords maximum protection of the most palatable foliage by the
radially orientated spear like leaves. Also, perhaps the contractile roots of grasstree
seedlings (Staff & Waterhouse 1981) were selected to draw the defenceless young plant
belowground, avoiding irreparable damage caused by browsing vertebrates. How
quickly would we have correlated the biology of X. preissii with fire adaptations if this
species only currently existed under more mesic subtropical circumstances regularly
grazed by populations of large herbivores and where fires were rare?
Chapter 6 185
CHAPTER 6
Synthesis
Testament to the broad range of climatic conditions experienced during one annual cycle
within mediterranean Australia is the partitioning of most plant species into groups with
well-defined growing seasons, often sharing similar growth form (Specht et al. 1981,
Bell & Stephens 1984, Lamont & Bergl 1991, Hobbs et al. 1995a). X. preissii is an
exception, growing continuously, but with a fluctuating pattern reflecting seasonal
changes in temperature and rainfall (Chapter 2, and see Fig. 6.1 for a summary). As it is
able to function under a wide range of temperatures and respond rapidly to bouts of rain,
X. preissii is able to achieve uninterrupted growth. While the capacity to grow during the
heat of summer categorises X. preissii as a mesotherm (having a subtropical growth
rhythm), its ability to sustain growth at winter temperatures as low as 10 ûC contradicts
limits of the term (Specht & Specht 1999) and overlaps with the expected thermal range
of microtherms (warm-temperate). The range of field temperatures recorded during leaf
production monitoring was too narrow to reach the thermal optimum of X. preissii,
emphasising the apparent mismatch between its physiological temperature range and its
current environmental temperature range.
Positive responses to high temperatures are considered a relic of the warmer Gondwanan
period (Specht & Dettmann 1995, Specht & Specht 1995, Specht & Specht 1999).
Despite retention of such ancestral features, grasstrees have also evolved with their
changing environment, especially lower temperatures and water availability. In
southwestern Australia, low temperatures in winter (despite some adaptation to these)
and drought in summer generally restricts growth. Consequently, with increasing aridity
in the late Tertiary (Kemp 1981, Specht & Dettmann 1995, Hopper et al. 1996, Kershaw
et al. 2002) the distribution of grasstrees would have receded into the damper, peripheral
parts of the continent, under selective pressure to adapt towards greater drought
resistance. Synchronisation of leaf death with summer drought, and the ability to harvest
temporary surface water from episodic summer rainfall (Chapter 2) are two attributes
that contribute to this ability. It is likely that grasstree leaf growth, unrestricted by soil
moisture and low temperatures under the climate of Tertiary Australia, would have

Chapter 6 186
exceeded current rates, and the next most limiting factor (nutrient availability?) would
have dictated the maximum growth rate.
Fire marks the start of a dynamic phase of grasstree biology, commencing with rapid
sprouting (Chapter 3, and Fig. 6.1), primarily due to the �clipping� effect of fire. The
simplicity of this mechanism contrasts with the potential complexity of its vast array of
exogenous and endogenous implications. Possible physiological effects include exposure
of the inner crown to increased light (photosynthesis) and temperature (respiration),
reduced diurnal ψx, and hydrolysis of reserve starch into soluble sugars. Secondary to
this effect, increased ash (nutrient) availability, reduced overtopping by larger species,
and subsequent weather conducive for growth, might contribute to the quick restoration
of the fire-damaged crown (Chapters 2 and 5). Leaf removal, simulating the action of
browsing herbivores, was capable of inducing a similar response, which questions the
evolutionary significance of such rapid growth (Chapter 5). Are grasstrees specifically
adapted to recovering after fire, or is a long history of herbivory pressure responsible for
pre-adapting grasstrees to respond to leaf removal?
Compensating for reduced photosynthetic potential after the loss of foliage, starch stored
in the stem is remobilised and consumed during the resprouting process. Minor annual
fluctuations in the starch reserve reinforced the conclusion that the starch is reserved for
periods of particularly rapid growth, whether vegetative (Chapter 3) or reproductive
(Chapter 4). Peak starch stores in summer may suggest a strategy to coincide with the
time of greatest fire risk, but this period also represents a time when tender foliage is
scarce and X. preissii is most prone to herbivore damage (McNee 1997).
While still undergoing a fire-induced, vegetative growth response (Chapter 3), X.
preissii commences reproduction, producing a flowering spike within three months that
commonly reaches over 3 m long and weighs several kilograms. Not surprisingly trade-
offs occur to accomplish this feat. Carbohydrate requirements are primarily met by the
redirection of photosynthates to the growing inflorescence, sacrificing leaf production as
a consequence. Secondary to this source, starch reserves are substantially depleted and
the photosynthetic inflorescence also ameliorates the cost of its own construction
(Chapter 4, and see Fig. 6.1 for a summary).

Leaf production (no fire) Leaf production (postfire) Leaf and inflorescence production (postfire)
Winter
Spring
Summer
Autumn
Winter
Spring
Summer
Autumn
Winter
Fig. 6.1 Summary of the effect of fire and season on grasstree growth in jarrah forest and banksia woodland, and the contribution of carbon from three sourcesto both vegetative and reproductive growth during each stage of reproduction. Red arrows represent the relative rate of leaf production or inflorescenceelongation (! = rapid increase, " = rapid decrease, # = gradual increase, and $ = gradual decrease). The relative amount of carbon each source contributes to
growth during each stage of reproduction is indicated by the size of the respective arrows (% = high, & = medium, ' = low).
Banksia woodlandRain:
< 20 mm ≤
Banksia woodlandRain:
< 20 mm ≤
Jarrah forest
Jarrah forest
Fire
Fire
Fire
Seed filling
Seed release
Leafproduction
Elongation
Elongation
Inflorescenceprimordium
PhotosynthatesMobilised starch
Inflorescence
Photosynthates
PhotosynthatesMobilised starch
Inflorescence
PhotosynthatesMobilised starch
Inflorescence
Carbonsource
Postfire
Postfire

Chapter 6 188
6.1 Relevance of the results to the banding technique
Plants are subjected to an ever-changing set of environmental variables to which they
react. Some physiological responses occur within minutes of the event (Fritts 1976).
While such responses may be scarcely detectable, the integration of a continuous stream
of stimuli-responses is expressed in a complex way as measurable growth. Growth of
tree rings has been recognised as a source of environmental information since as early as
the 15th century, when Leonardo da Vinci first noted the relationship between tree-rings
and precipitation (Stallings 1937, from Schweingruber 1988). The application of
dendrochronological techniques is often met with considerable limitations; factors such
as species, location, elevation, topography, light, conservation issues and interpretation
all play a role in the accuracy and value of results, and the cost of their collection on the
environment (Schweingruber 1988, Burrows et al. 1995, DesRochers & Gagnon 1997,
February & Stock 1998a, February & Stock 1998b). Such techniques have also
incorporated the reconstruction of fire history using fire scar analysis, but again, success
can vary and can be particularly limited for identifying low intensity fires (Burrows et
al. 1995, Niklasson & Drakenberg 2001).
The leafbase banding technique (Ward et al. 2001) is a unique form of
dendrochronology, with specific importance for reconstructing fire history. Its
distinctiveness relates to its use of the regular banding pattern on the stem of arborescent
monocotyledons (grasstrees), rather than the traditional concentric growth rings
measured in conventional dendrochronological studies of dicotyledonous trees and
conifers. As demonstrated in Chapter 2, one year of leaf production by X. preissii
equalled one pair of adjacent cream and brown bands, representing the manifestation of
continual growth responses to an annual climatic cycle characterised by two distinct
seasons. The following sections discuss the further significance of my research in
respect to the banding technique.
6.1.1 Seasonality of band colour
The colour difference between the alternating seasonal bands is difficult to explain. The
bimodal pattern of grasstree growth conveniently suggests the timing of this dichotomy
(Chapter 2), although the mechanism that controls leafbase colour is unclear. Colangelo

Chapter 6 189
the colour difference between the cream and brown leafbases, but could only speculate
on a possible reason for the disparity. Leaf initiation and elongation respond similarly to
favourable growing conditions, both peaking between late spring and early autumn when
water is not limiting. In contrast, from the end of autumn and through winter,
unfavourable growing conditions restrict this kind of rapid leaf initiation and vigorous
leaf expansion.
Tannins commonly accumulate in plant leaf tissue in response to adversities in their
environment, protecting the plant against rotting as a result of bacterial or fungal action,
dehydration or damage by animals (Fahn 1990). The poor growing conditions starting in
late autumn may be responsible for the higher level of tannins in the associated leaf
growth, or tannin accumulation may be a response to an increase in the frequency of
detrimental events linked with winter. For example, X. preissii is susceptible to a
number of pathogens, including Phytophthora cinnamomi (Shearer & Dillon 1995) and
the leaf spot, Colletotrichum xanthorrhoeae (Shivas et al. 1998), that are more abundant
in wet conditions. The noticeably more common occurrence of C. xanthorrhoeae on the
wetter coastal plain than further inland emphasises this pathogen�s infectious behaviour
under highly humid conditions characteristic of winter, where dispersal is by rain-splash
(Shivas et al. 1998).
The higher bulk density of slow growing leaves (D. Korczynskyj, unpublished) and
thinner bases (Eldridge 2000) may concentrate the available tannins in the winter formed
leaves, effectively darkening leafbase colour. Accumulation of any substance including
tannins implies a function of time. Leaf age at maturity is dependent on the season of
initiation. Leaves produced during summer mature earlier than leaves produced in other
seasons, suggesting a shorter lifespan. Since leaf death occurs exclusively in summer
and leaf age at death is about two years, the lifespan of a leaf formed in June during
winter would be about 2.5 years compared with a leaf formed in November or December
that would die after the minimum two years. Leaf longevity could therefore also explain
differences in leaf tannin abundance. An histological investigation of living leaves may
reinforce the evidence for the tannin-based origin of leafbase colour differences. By
examining a series of different aged leaves it may be possible to correlate time with
tannin concentration.

Chapter 6 190
6.1.2 Fire effects and banding patterns
Except for the grasstrees burnt in late autumn, all other grasstrees in my study exhibited
rapid leaf production and elongation almost immediately following fire. From what is
understood of the pattern of seasonal leafbase banding (cream and brown bands) it
would be expected that this fast growth would be recorded as a wider band containing
considerably more leafbases than subsequent seasonal bands and possibly thicker
leafbases, particularly if the lower bulk density of fast growing leaves (D. Korczynskyj,
unpublished) reflects larger leaf dimensions. Surprisingly, in a study of stem banding
patterns, little evidence of wider postfire bands was obtained (Eldridge 2000). The only
evidence of a postfire growth flush was a trend for leafbases of the seasonal bands
produced after fire to be thicker than those produced immediately prior to fire.
The absence of an increase in band-width and leafbase number following fire is difficult
to explain given the dramatic effect of fire on leaf production and elongation. A possible
reason may be the reduction in leaf production as a consequence of inflorescence
elongation (see Chapter 4) that would act to reduce band-width and leafbase numbers.
This may account for why the only evidence of a positive effect of fire was from
leafbase thickness. The probability that the grasstrees used in the study by Eldridge
(2000) flowered routinely after fire is increased by virtue of their height (mean height =
173 cm), as tall grasstrees are more likely to flower than shorter ones (Ward & Lamont
2000). Furthermore, it is likely that these plants would have been burnt more often
during the hot/dry summer and autumn months when fire is more prevalent, which has
also been shown to increase the chances of this species flowering (Lamont et al. 2000).
It therefore seems reasonable to assume that following fire, the grasstree specimens used
by Eldridge (2000) may have flowered more often than not, severely reducing the
chances of demonstrating an effect of fire on the banding pattern.
To resolve this confusion it would be useful to apply the leafbase banding technique to
the grasstrees studied during the work described in Chapter 3. I made such an attempt.
However, as many of the tagged leaves were still living or partially green, the record of
banding was not distinguishable. A second attempt should be made once the tagged
leaves have completely senesced. The information gathered would not only provide a
direct correlation between leaves of known growth history and stem banding patterns,
Chapter 6 191
band. This work would be particularly valuable because of the spatial and temporal
replication incorporated into the original design of the study.
6.2 Extension of the leafbase banding technique andimplications for further research on grasstrees
6.2.1 The leafbase banding technique
The follow-up work described above represents only one opportunity for further
research into developing the leafbase banding technique. As a new tool for gathering
historical data about grasstree age and fire frequency the technique may still be
considered in its infancy, especially on a national scale where its potential is
under�explored. With further application and critical analysis of the data, using the
understanding of grasstree growth developed during my study, the technique could
potentially recognise other environmental pressures such as herbivory and canopy
opening (in jarrah forest or banksia woodland for example, Chapter 5) caused by the
pathogenic fungus, Phytophthora cinnamomi (dieback. Dell & Malajczuk 1989),
therefore broadening its use. Changes in seasonal band-thickness, or number and/or size
of leafbases per band, may offer clues to the past growing conditions imposed by the
environment. Warmer/wetter conditions, particularly during summer, would support
greater leafbase production than cooler/drier conditions. A seasonal band containing
significantly more leafbases, followed by successive bands with progressively less
leafbases, may identify a period of chronic herbivory. The application of the banding
technique to the grasstrees used for the herbivory study in Chapter 5 (after clipped
leaves have senesced) would provide a starting point for this line of investigation.
Identifying and interpreting the chronology of dieback infection may prove more
challenging, as although overstorey crown death allows greater light penetration and
stimulating grasstree leaf growth, grasstrees themselves are susceptible to the pathogen
(Dawson et al. 1985, Shearer & Dillon 1995). Specific details of the effect of dieback on
grasstree leaf growth could benefit the possible use of the leafbase banding technique for
this purpose.
In addition to deciphering information from inter-fire periods, preliminary observations
indicate that the thickness and uniformity of black fire bands around the stem

Chapter 6 192
fire (D. Ward, CALM research, pers. comm.). Such information regarding fire
conditions are commonly recorded during current prescribed burning practices and
would provide a sound basis for a correlative study.
6.2.2 Other areas requiring further research
A typical consequence of investigation is the emergence of new questions, and my
research was no exception. Some directions for further study were suggested during the
previous four chapters and need little explanation. For example, protein in and adjacent
to the desmium tissue may play a similar role in X. preissii to that of starch, and is worth
pursuing. Below, I have clarified some of the previously mentioned areas of future
research, in addition to providing others.
In banksia woodland, grasstrees resisted water stress and responded rapidly to single
large rainfall events during summer/autumn drought, consistent with having live,
functioning roots in the deep and shallow soil horizons. Hydraulic conductance was
suggested as a means of maintaining root/soil contact during summer while avoiding
desiccation, as described for Banksia prionotes in the Swan Coastal Plain (Pate et al.
1998), and is an area that needs further investigation. Research demonstrating summer
water status of grasstrees (Crombie et al. 1988, Crombie 1992, this thesis) has been
based on relatively large representative plants (grasstrees about 0.8�1.2 m high,
potentially 50�100 years old). It would be of interest to conduct a comparative study on
small acaulescent grasstrees that have not established a root system of mature depth.
This work may give some insight into the relative importance of rooting depth to
continuous leaf growth through summer, and if conducted in banksia woodland, could
also indicate whether the size of the root system is important for the exploitation of
episodic summer rainfall. Specifically, is the root system large enough to gather
sufficient water, and do vertical roots penetrate deep enough to attain water for hydraulic
conductance to sustain shallow lateral roots?
The timeframe within which X. preissii re-establishes a crown, flowers and releases
seeds following fire is relatively short, and coincides with the duration of the fire effect
on this species (Chapters 3 and 4). The timing of these events appears to be important
for reproductive fitness. However, assessing fitness of slow growing species is
impractical and indicators of fitness (reproductive effort, seedling establishment, growth

Chapter 6 193
and survivorship) could be explored relative to increasing time since fire. If
�reproductive fitness� was improved by shortening the period between fire and
reproduction, autumn-burnt grasstrees (flowering in the following spring) would have an
advantage over spring-burnt grasstrees. However, the time available for crown recovery
is reduced following autumn burning, with possible implications for reproductive fitness
(a smaller inflorescence was produced, Chapter 4). Therefore, a working hypothesis
should state that summer burns (a compromise between the timing of fire seasons) are
more beneficial to grasstree reproductive fitness than autumn or spring burns.
Tentatively, this hypothesis is supported by greater fruit production by summer-burnt
grasstrees (Lamont et al. 2000).
Grasstrees provide a habitat, food and refuge from fire for many invertebrates and
vertebrates (Whelan 1995), which raises many question regarding plant-animal
interactions. During this study, the voracious feeding habit of moth larvae (Meyriccia
latro) proved to be a significant threat to the success of my fieldwork on grasstree
reproduction. Their ability to consume and kill the developing inflorescence questions
the sustainability of this relationship: can grasstree populations recruit sufficient
seedlings despite these parasites to compensate for grasstree death rates? Furthermore,
as inflorescences are often killed early in their development, and larvae were not noticed
on vegetative grasstrees, does this moth target reproductive grasstrees only? And if so,
what cues does the moth use to identify these individuals? Visual inspection prior to
obvious spike emergence was unsuccessful in recognising reproductive grasstrees during
my work and that of others (Staff 1976).
Finally, the work documented in this thesis, as part of a collaborative effort by the Curtin
University Grasstree Project Group, represents the most comprehensive study of any of
the Australian grasstree species. This strong background of information provides the
opportunity for other comparative studies on grasstrees in other climate regions of
Australia. For example, it would be of interest to investigate the water relations of the
only arid zone grasstree species, X. thorntonii, that grows as far inland as the Great
Victoria Desert, north of the Nullarbor Plain (Kealley 1993). Furthermore, how does this
species distribution affect its growth phenology, and does water availability play a role
in the ability of these grasstrees to reproduce in response to fire? Temperature and soil
moisture responses of this species may be useful in furthering our understanding of

References 194
References
Abbott, I. (2002) Aboriginal fire regimes in south-west Western Australia: evidence
from historical documents. Symposium on fire in south-western Australian
ecosystems: impacts and management, p. 44, Ascot, Western Australia.
Abbott, I. & Loneragan, O. (1983) Influence of fire on growth rate, mortality and butt
damage in Mediterranean forest of Western Australia. Forest Ecology and
Management 6, 139-154.
Ackerman, T. L. & Bamberg, S. A. (1974) Phenological studies in the Mojave Desert at
Rock Valley (Nevada test Site). In: Phenology and seasonality modeling. H.
Lieth (ed.), pp. 215-226, Springer-Verlag, Berlin.
Adams, M. A., Iser, J., Keleher, A. D. & Cheal, D. C. (1994) Nitrogen and phosphorus
availability and the role of fire in heathlands at Wilsons Promontory. Australian
Journal of Botany 42, 269-281.
Archer, M. (1984) Effects of humans on the Australian vertebrate fauna. In: Vertebrate
zoogeography and evolution in Australasia. M. Archer & G. Clayton (eds), pp.
151-161, Hesperian Press, Carlisle.
Aschmann, H. (1973) Distribution and peculiarity of mediterranean ecosystems. In:
Mediterranean type ecosystems. Origin and structure. F. Di Castri & H. A.
Mooney (eds), pp. 11-19, Springer-Verlag, Berlin.
Ashman, T. L. (1994) A dynamic perspective on the physiological cost of reproduction
in plants. The American Naturalist 144, 300-316.
Attiwill, P. M. (1994) Ecological disturbance and the conservative management of
eucalypt forests in Australia. Forest Ecology and Management 63, 301-346.
Augee, M. & Fox, M. (2000) Biology of Australia and New Zealand. Pearson Education,
French's Forest.

References 195
Baird, A. M. (1977) Regeneration after fire in King's Park, Perth, Western Australia.
Journal of the Royal Society of Western Australia 60, 1-22.
Baird, A. M. (1984) Observations on regeneration after fire in the Yule Brook Reserve
near Perth, Western Australia. Journal of the Royal Society of Western Australia
66, 147-162.
Baker, W. l. & Ehle, D. (2001) Uncertainty in surface-fire history: the case of ponderosa
pine forests in the western United States. Canadian Journal of Forest Research
31, 1205-1226.
Bamber, R. K. & Humphreys, F. R. (1965) Variations in sapwood starch levels in some
Australian forest species. Australian Forestry 29, 15-23.
Barker, A. V. (1999) Ammonium accumulation and ethylene evolution by tomato
infected root-knot nematode and grown under different regimes of plant
nutrition. Communications in Soil Science and Plant Analysis 30, 175-182.
Batek, M. J., Rebertus, A. J., Schroeder, W. A., Haithcoat, T. L., Compas, E. & Guyette,
R. P. (1999) Reconstruction of early nineteenth-century vegetation and fire
regimes in the Missouri Ozarks. Journal of Biogeography 26, 397-412.
Beacham, J. (2001) Witchy grass tree hits the heights. In: Augusta-Margaret River Mail,
25 April, p. 7, Margaret River.
Beard, J. S. (1976) An indigenous term for the Western Australian sandplain and its
vegetation. Journal of the Royal Society of Western Australia 59, 55-57.
Beard, J. S. (1983) Ecological control of the vegetation of southwestern Australia:
moisture versus nutrients. In: Mediterranean-type ecosystems: the role of
nutrients. F. J. Kruger, D. T. Mitchell & J. U. M. Jarvis (eds), pp. 66-73,
Springer-Verlag, Berlin.

References 196
Beard, J. S. (1984) Biogeography of the Kwongan. In: Kwongan plant life of the
sandplain. J. S. Pate & J. S. Beard (eds), pp. 1-26, University of Western
Australia Press, Nedlands.
Beard, J. S. (1990) Plant life of Western Australia. Kangaroo Press, Kenthurst.
Bedford, D. J., Lee, A. T., Macfarlane, T. D., Henderson, R. J. F. & George, A. S.
(1986) Xanthorrhoeaceae. In: Flora of Australia, vol 46, pp. 88-171, Australian
Government Publishing Service, Canberra.
Bell, D. T. (2001) Ecological response syndromes in the flora of southwestern Western
Australia: fire resprouters versus reseeders. The Botanical Review 67, 417-440.
Bell, D. T. & Heddle, E. M. (1989) Floristic, morphologic and vegetational diversity. In:
The jarrah forest. A complex mediterranean ecosystem. B. Dell, J. J. Havel & N.
Malajczuk (eds), pp. 53-66, Kluwer Academic Publishers, Dordrecht.
Bell, D. T., Hopkins, A. J. M. & Pate, J. S. (1984) Fire in the Kwongan. In: Kwongan
plant life of the sandplain. J. S. Pate & J. S. Beard (eds), pp. 178-204, University
of Western Australia Press, Nedlands.
Bell, D. T. & Koch, J. M. (1980) Post-fire succession in the northern jarrah forest of
Western Australia. Australian Journal of Ecology 5, 9-14.
Bell, D. T., McCaw, W. L. & Burrows, N. D. (1989) Influence of fire on jarrah forest
vegetation. In: The jarrah forest. B. Dell, J. J. Havel & N. Malajczuk (eds), pp.
203-215, Kluwer Academic Publishers, Dordrecht.
Bell, D. T. & Stephens, L. J. (1984) Seasonality and phenology of kwongan species. In:
Kwongan plant life of the sandplain. J. S. Pate & J. S. Beard (eds), pp. 205-226,
University of Western Australia Press, Nedlands.
Bell, D. T., van der Moezel, P. G., Delfs, J. C. & Loneragan, W. A. (1987) Northern
sandplain Kwongan: effect of fire on Hakea obliqua and Beaufortia elegans

References 197
population structure. Journal of the Royal Society of Western Australia 69, 139-
143.
Bellgard, S. E., Whelan, R. J. & Muston, R. M. (1994) The impact of wildfire on
vesicular-arbuscular mycorrhizal fungi and their potential to influence the re-
establishment of post-fire plant communities. Mycorrhiza 4, 139-146.
Benecke, P. & van der Ploeg, R. R. (1981) The soil environment. In: Physiological plant
ecology I: responses to the physical environment. O. L. Lange, P. S. Nobel, C. B.
Osmond & H. Ziegler (eds), pp. 539-559, Springer-Verlag, Berlin.
Bergström, R. & Danell, K. (1987) Effects of simulated browsing by moose on
morphology and biomass of two birch species. Journal of Ecology 75, 533-544.
Bergström, R., Skarpe, C. & Danell, K. (2000) Plant responses and herbivory following
simulated browsing and stem cutting of Combretum apiculatum. Journal of
Vegetation Science 11, 409-414.
Bettenay, E. (1984) Origin and nature of the sandplains. In: Kwongan plant life of the
sandplain. J. S. Pate & J. S. Beard (eds), pp. 51-68, University of Western
Australia Press, Nedlands.
Birch, A. J. & Dahl, C. J. (1974) Some constituents of the resins of Xanthorrhoea
preissii, australis and hastile. Australian Journal of Chemistry 27, 331-344.
Biswell, H. H. (1974) Effects of fire on chaparral. In: Fire and ecosystems. T. T.
Kozlowski & C. E. Ahlgren (eds), pp. 321-360, Academic Press, New York.
Black, W. N. (1963) The effect of frequency of rotational burning on blueberry
production. Canadian Journal of Plant Science 43, 161-165.
Blondel, J. & Aronson, J. (1995) Biodiversity and ecosystem function in the
Mediterranean Basin: human and non-human determinants. In: Mediterranean-
References 198
type ecosystems. The function of biodiversity. G. W. Davis & D. M. Richardson
(eds), pp. 43-119, Springer-Verlag, Berlin.
Böhm, W. (1979) Methods of studying root systems. Springer-Verlag, Berlin.
Bonicel, A., Haddad, G. & Gagnaire, J. (1987) Seasonal variations of starch and major
soluble sugars in the different organs of young poplars. Plant Physiology and
Biochemistry 25, 451-459.
Bowen, B. J. & Pate, J. S. (1991) Adaptations of S.W. Australian members of the
Proteaceae; allocation of resources during early growth. International Protea
Association: sixth biennial conference, pp. 289-301. Promaco Conventions Pty
Ltd, Perth, Western Australia.
Bowen, B. J. & Pate, J. S. (1993) The significance of root starch in post-fire shoot
recovery of the resprouter Stirlingia latifolia R. Br. (Proteaceae). Annals of
Botany 72, 7-16.
Bowler, J. M. (1982) Aridity in the late Tertiary and Quarternary of Australia. In:
Evolution of the flora and fauna of arid Australia. W. R. Barker & P. J. M.
Greenslade (eds), pp. 35-46, Peacock Publications, Adelaide.
Bowman, D. M. J. S., Walsh, A. & Milne, D. J. (2001) Forest expansion and grassland
contraction within a Eucalyptus savanna matrix between 1941 and 1994 at
Litchfield National Park in the Australian monsoon tropics. Global Ecology and
Biogeography 10, 535-548.
Bowman, W. D. & Roberts, S. W. (1985) Seasonal and diurnal water relations
adjustments in three evergreen chaparral shrubs. Ecology 66, 738-742.
Bradstock, R. A., Bedward, M., Kenny, B. J. & Scott, J. (1998) Spatially-explicit
simulation of the effects of prescribed burning on fire regimes and plant
extinctions in shrublands typical of south-eastern Australia. Biological
Conservation 86, 83-95.
References 199
Bradstock, R. A. & Myerscough, P. J. (1988) The survival and population response to
frequent fires of two woody resprouters Banksia serrata and Isopogon
anemonifolius. Australian Journal of Botany 36, 415-431.
Bülow-Olsen, A., Just, A. & Liddle, M. J. (1982) Growth and flowering history of
Xanthorrhoea johnsonii Lee (Liliaceae) in Toohey Forest, Queensland. Botanical
Journal of the Linnean Society 84, 195-207.
Burger, W. C. (1981) Heresy revived: the monocot theory of angiosperm origin.
Evolution Theory 5, 189-225.
Burgess, S. S. O., Pate, J. S., Adams, M. A. & Dawson, T. E. (2000) Seasonal water
acquisition and redistribution in the Australian woody phreatophyte, Banksia
prionotes. Annals of Botany 85, 215-224.
Burrows, C. L. (1998) Grasstrees as bioindicators of the present and historical chemical
environment. Hon. Thesis. Environmental Biology, Curtin University of
Technology.
Burrows, G. E. (2002) Epicormic strand structure in Angophora, Eucalyptus and
Lophostemon (Myrtaceae) - implications for fire resistance and recovery. New
Phytologist 153, 111-131.
Burrows, N. D., Ward, B. & Robinson, A. D. (1995) Jarrah forest fire history from stem
analysis and anthropological evidence. Australian Forestry 58, 7-16.
Catling, P. C. & Newsome, A. E. (1981) Responses of the Australian vertebrate fauna to
fire: an evolutionary approach. In: Fire and the Australian biota. A. M. Gill, R.
H. Groves & I. R. Noble (eds), pp. 273-310, Australian Academy of Science,
Canberra.
Christensen, N. L. & Muller, C. H. (1975) Effects of fire on factors controlling plant
growth in Adenostoma chaparral. Ecological Monographs 45, 29-55.

References 200
Christensen, P. E. & Kimber, P. (1975) Effect of prescribed burning on the flora and
fauna of south-west Australian forests. Procedings of the Ecological Society of
Australia 9, 85-107.
Christensen, P. E., Recher, H. F. & Hoare, J. (1981) Responses of open forests (dry
sclerophyll forests) to fire regimes. In: Fire and the Australian biota. A. M. Gill,
R. H. Groves & I. R. Noble (eds), pp. 367-393, Australian Academy of Science,
Canberra.
Churchward, H. M. & Dimmock, G. M. (1989) The soils and landforms of the northern
jarrah forest. In: The jarrah forest. A complex mediterranean ecosystem. B. Dell,
J. J. Havel & N. Malajczuk (eds), pp. 13-21, Kluwer Academic Publishers,
Dordrecht.
Cissel, J. H., Swanson, F. J. & Weisberg, P. J. (1999) Landscape management using
historical fire regimes: Blue River, Oregon. Ecological Applications 9, 1217-
1231.
Cleland, J. B. (1913) Note on the growth of the flowering stem of Xanthorrhoea hastilis
R. Br. Journal and Proceedings of the Royal Society of New South Wales 47, 72-
74.
Clendenin, M. & Ross, W. G. (2001) Effects of cool season prescribed fire on
understorey vegetation in a mixed pine hardwood forest of east Texas. Texas
Journal of Science 53, 65-78.
Clifford, H. T. (1983) Xanthorrhoeaceae. In: Flowering plants in Australia. B. D.
Morley & H. R. Toelken (eds), pp. 329-331, Rigby, Adelaide.
Coakes, S. J. & Steed, L. G. (1999) SPSS analysis without anguish. John Wiley and
Sons Australia, Milton, Queensland.
Colangelo, W., Lamont, B. B., Jones, A. S., Ward, D. J. & Bombardieri, S. (2002) The
anatomy and chemistry of the colour bands of grasstree stems (Xanthorrhoea

References 201
preissii) used for plant age and fire history determination. Annals of Botany 89,
605-612.
Colwill, J. (1999) Balga: a tall story. In: West Australian (Habitat), 10 December, p. 11,
Perth.
Common, I. F. B. (1990) Moths of Australia. Melbourne University Press, Melbourne.
Corrick, M. G. & Fuhrer, B. A. (1996) Wildflowers of southern Western Australia. The
Five Mile Press Pty Ltd, Noble Park, Victoria.
Cousens, R. (1988) Misinterpretations of results in weed research through inappropriate
use of statistics. Weed Research 28, 281-289.
Crawley, M. J. (1983) Herbivory: the dynamics of animal-plant interactions. Blackwell
Scientific, Oxford.
Crawley, M. J. (1986) Life history and environment. In: Plant Ecology. M. J. Crawley
(ed.), pp. 253-290, Blackwell Scientific Publications, Oxford.
Cremer, K. W. (1973) Ability of Eucalyptus regnans and associate evergreen hardwoods
to recover from cutting or complete defoliation in different seasons. Australian
Forestry Research 6, 9-22.
Crocker, R. L. & Wood, J. G. (1947) Some historical influences on the development of
the South Australian vegetation communities and their bearing on concepts and
classification in ecology. Transcript of the Royal Society of South Australia 71,
91-136.
Crombie, D. S. (1992) Root depth, leaf area and daytime water relations of jarrah
(Eucalyptus marginata) forest overstorey and understorey during summer
drought. Australian Journal of Botany 40, 113-122.

References 202
Crombie, D. S., Tippet, J. T. & Hill, T. C. (1988) Dawn water potential and root depth of
trees and understorey species in south-western Australia. Australian Journal of
Botany 36, 621-631.
Cruz, A. & Moreno, J. M. (2001) Seasonal course of total non-structural carbohydrates
in the lignotuberous Mediterranean-type shrub Erica australis. Oecologia 128,
343-350.
Curtis, P. N. (1998) A post-fire ecological study of Xanthorrhoea australis following
prescribed burning in the Warby Range State Park north-eastern Victoria
Austrlia. Australian Journal of Botany 46, 253-272.
Dahlgren, R. M. T., Clifford, H. T. & Yeo, P. F. (1985) The families of the
monocotyledons. Springer-Verlag, Berlin.
Danell, K. & Bergström, R. (1989) Winter browsing by moose on two birch species:
impact on food resources. Oikos 54, 11-18.
Daubenmire, R. (1968) Ecology of fire in grasslands. Advances in Ecological Research
5, 209-266.
Dawson, L. & Augee, M. (1997) The late Quaternary sediments and fossil vertebrate
fauna from Cathedral Cave, Wellington Caves, New South Wales. Proceedings
of the Linnean Society of New South Wales 117, 51-78.
Dawson, P., Weste, G. & Ashton, D. (1985) Regeneration of vegetation in the Brisbane
Ranges after fire and infestation by Phytophthora cinnamomi. Australian Journal
of Botany 33, 15-26.
de Groot, W. J. & Wein, R. W. (1999) Betula glandulosa Michx. response to burning
and postfire growth temperature and implications of climate change.
International Journal of Wildland Fire 9, 51-64.

References 203
del Tredici, P. (2001) Sprouting in temperate trees: a morphological and ecological
review. The Botanical Review 67, 121-140.
Dell, B. & Malajczuk, N. (1989) Jarrah dieback - a disease caused by Phytophthora
cinnamomi. In: The jarrah forest. A complex mediterranean ecosystem. B. Dell,
J. J. Havel & N. Malajczuk (eds), pp. 67-87, Kluwer Academic Publishers, The
Netherlands.
DesRochers, A. & Gagnon, R. (1997) Is ring count at ground level a good estimation of
black spruce age? Canadian Journal of Forest Research 27, 1263-1267.
Devlin, R. M. & Barker, A. V. (1971) Photosynthesis. Van Nostrand Reinhold
Company, New York.
Dhillion, S. S., Anderson, R. C. & Liberta, A. E. (1988) Effect of fire on the mycorrhizal
ecology of little bluestem Schizachyrium scoparium. Canadian Journal of
Botany 66, 706-713.
Dodd, J., Heddle, E. M., Pate, J. S. & Dixon, K. W. (1984) Rooting patterns of sandplain
plants and their functional significance. In: Kwongan plant life of the sandplain.
J. S. Pate & J. S. Beard (eds), pp. 146-177, University of Western Australia
Press, Nedlands.
Dodson, J. R. (2000) A late Holocene vegetation and environment record from Byenup
Lagoon, south-western Australia. Australian Geographer 31, 41-54.
Dodson, J. R. (2001a) Holocene vegetation change in the mediterranean-type climate
region of Australia. The Holocene 11, 673-680.
Dodson, J. R. (2001b) An upper Pliocene lacustrine environmental record from south-
western Australia - preliminary results. Palaeogeography, Palaeoclimatology,
Palaeoecology 167, 309-320.

References 204
Dolva, J. M. & Scott, J. K. (1982) The association between the mealybug, Pseudococcus
macrozamiae , ants and the cycad Macrozamia riedlei in a fire-prone
environment. Journal of the Royal Society of Western Australia 65, 33-36.
Donart, G. B. & Cook, C. W. (1970) Carbohydrate reserve content of mountain range
plants following defoliation and regrowth. Journal of Range Management 23,
15-19.
Donovan, L. A. & Ehleringer, J. R. (1994) Water stress and use of summer precipitation
in a Great Basin shrub community. Functional Ecology 8, 289-297.
Dunn, E. L. (1975) Environmental stresses and inherent limitation affecting CO2
exchange in evergreen sclerophylls in mediterranean climates. In: Perspectives of
biophysical ecology. D. M. Gates & R. B. Schmerl (eds), pp. 259-281, Springer-
Verlag, Berlin.
Eccles, N., Lamont, B. B., Esler, K. & Lamont, H. (2001) Relative performance of
clumped vs. experimentally isolated plants in a South African winter-rainfall
desert community. Plant Ecology 155, 219-227.
Edenius, L., Danell, K. & Bergström, R. (1993) Impact of herbivory and competition on
compensatory growth in woody plants: winter browsing by moose on Scots pine.
Oikos 66, 286-292.
Edmonds, S. J. & Specht, M. M. (1981) Dark Island heathland, South Australia: faunal
rhythms. In: Heathlands and Related Shrublands. R. L. Specht (ed.), pp. 15-27,
Elsevier Scientific Publishing Company, Amsterdam.
Ehrenreich, J. H. (1959) Effect of burning and clipping on growth of native prairie in
Iowa. Journal of Range Management 12, 133-137.
El-Kassaby, Y. A. & Barclay, H. J. (1992) Cost of reproduction in Douglas-fir.
Canadian Journal of Botany 70, 1429-1432.
References 205
Eldridge, J. (2000), Leaf base density and banding patterns in Xanthorrhoea preissii for
use in dendrochronology. Hon. Thesis. Environmental Biology, Curtin
University of Technology.
Erickson, R. (1951) Orchids of the west. Paterson Brokensha, Perth.
Fahn, A. (1990) Plant anatomy. Pergamon Press, Oxford.
February, E. C. & Stock, W. D. (1998a) An assessment of the dendro-chronological
potential of two Podocarpus species. The Holocene 8, 747-750.
February, E. C. & Stock, W. D. (1998b) The relationship between ring width measures
and precipitation for Widdringtonia cedarbergensis. South African Journal of
Botany 64(3), 213-216.
Fitzpatrick, E. A. & Nix, H. A. (1970) The climatic factor in Australian grassland
ecology. In: Australian grasslands. R. M. Moore (ed.), pp. 3-26, Australian
National University Press, Canberra.
Flannery, T. F. (1994) The future eaters - An ecological history of the Australasian lands
and people. Reed Books, Chaswood, NSW.
Fleck, I., Diaz, C., Pascual, M. & Iñiguez, F. J. (1995) Ecophysiological differences
between first-year resprouts after wildfire and unburned vegetation of Arbutus
unedo and Coriaria myrtifolia. Acta �cologica 16, 55-69.
Flint, H. L. (1974) Phenology and genecology of woody plants. In: Phenology and
seasonality modeling. H. Lieth (ed.), pp. 83-97, Springer-Verlag, New York.
Forshaw, J. M. (1978) Parrots of the world. Lansdowne Press, Melbourne.
Francis, W. D. (1981) Australian rain-forest trees. Australian Government Publishing
Service, Canberra.

References 206
Friend, T., Anthony, C. & Thomas, N. (2001) Geology and landforms of the south-west.
Landscope 17, 10-16.
Fritts, H. C. (1976) Tree rings and climate. Academic Press, London.
Fry, J. C. (1993) Biological data analysis - a practical approach. Oxford University
Press, New York.
Fukui, K. (2000) Effects of temperature on growth and dry matter accumulation in
mulberry saplings. Plant Production Science 3, 404-409.
Galen, C., Sherry, R. A. & Carroll, A. B. (1999) Are flowers physiological sinks or
faucets? Costs and correlates of water use by flowers of Polemonium viscosum.
Oecologia 118, 461-470.
Gardner, C. A. (1957) The fire factor in relation to the vegetation of Western Australia.
Western Australian Naturalist 5, 166-173.
Gentle, C. B. & Duggin, J. A. (1997a) Allelopathy as a competitive strategy in persistent
thickets of Lantana camara L. in three Australian forest communities. Plant
Ecology 132, 85-95.
Gentle, C. B. & Duggin, J. A. (1997b) Lantana camara L. invasions in dry rainforest -
open forest ecotones: The role of disturbances associated with fire and cattle
grazing. Australian Journal of Ecology 22, 298-306.
Gill, A. M. (1964) Soil-vegetation relationships near Kinglake West, Victoria. M.Sc.
Thesis. University of Melbourne.
Gill, A. M. (1975) Fire and the Australian flora: a review. Australian Forestry 38, 4-25.
Gill, A. M. (1978) Crown recovery of Eucalyptus dives following wildfire. Australian
Forestry 41, 207-214.

References 207
Gill, A. M. (1981a) Adaptive responses of Australian vascular plant species to fires. In:
Fire and the Australian biota. A. M. Gill, R. H. Groves & I. R. Noble (eds), pp.
243-272, Australian Academy of Science, Canberra.
Gill, A. M. (1981b) Coping with fire. In: The biology of Australian plants. J. S. Pate &
A. J. McComb (eds), pp. 65-85, University of Western Australia Press,
Nedlands.
Gill, A. M. (1993) Interplay of Victoria's flora with fire. In: Flora of Victoria.
Introduction. D. B. Foreman & N. G. Walsh (eds), pp. 212-226, Inkata Press,
Melbourne.
Gill, A. M. & Groves, R. H. (1981) Fire regimes in heathlands and their plant-ecological
effects. In: Heathlands and related shrublands. R. L. Specht (ed.), pp. 61-84,
Elsevier Scientific Publishing Company, Amsterdam, The Netherlands.
Gill, A. M. & Ingwersen, F. (1976) Growth of Xanthorrhoea australis R. Br. in relation
to fire. Journal of Applied Ecology 13, 195-203.
Greene, D. F. & Johnson, E. A. (1994) Estimating the mean annual seed production of
trees. Ecology 75, 642-647.
Grime, J. P. (1979) Plant strategies and vegetation processes. John Wiley and Sons,
Chichester.
Grogan, P., Bruns, T. D. & Chapin, F. S. (2000) Fire effects on ecosystem nitrogen
cycling in a Californian bishop pine forest. Oecologia 122, 537-544.
Groom, P. K., Lamont, B. B. & Duff, H. C. (1994a) Self-crypsis in Hakea trifurcata as
an avian granivore deterrent. Functional Ecology 8, 110-117.
Groom, P. K., Lamont, B. B. & Kupsky, L. (1994b) Contrasting morphology and
ecophysiology of co-occurring broad and terete leaves in Hakea trifurcata
(Proteaceae). Australian Journal of Botany 42, 307-320.

References 208
Gross, H. L. (1972) Crown deterioration and reduced growth associated with excessive
seed production by birch. Canadian Journal of Botany 50, 2431-2437.
Grove, T. S., O'Connell, A. M. & Dimmock, G. M. (1986) Nutrient changes in surface
soils after an intense fire in jarrah (Eucalyptus marginata Donn ex Sm.) forest.
Australian Journal of Ecology 11, 303-317.
Groves, R. H. (1965) Growth of heath vegetation. II. The seasonal growth of a heath on
groundwater podzol at Wilson's Promontory, Victoria. Australian Journal of
Botany 13, 281-289.
Groves, R. H. (1978) Growth of heath vegetation. IV. Effects of temperature on growth
of Banksia ornata, B. serrata and B. serratifolia. Australian Journal of Botany
26, 45-51.
Grubb, P. G. (1992) A positive distrust in simplicity - lessons from plant defences and
from competition among plants and among animals. Journal of Ecology 80, 586-
610.
Halford, D. A., Bell, D. T. & Loneragan, W. A. (1984) Diet of the western grey
kangaroo (Macropus fuliginosus Desm.) in a mixed pasture-woodland habitat of
Western Australia. Journal of the Royal Society of Western Australia 66, 119-
128.
Hatch, A. B. (1960) Ash bed effects in Western Australian forest soils. Report, Forests
Department of Western Australia, Perth.
Head, G. C. (1967) Effects of seasonal changes in shoot growth on the amount of
unsuberized root on apple and plum trees. Journal of Horticultural Science 42,
169-180.
Heilmeier, H. & Whale, D. M. (1987) Carbon dioxide assimilation in the flowerhead of
Arctium. Oecologia 73, 109-115.

References 209
Herbert, D. A. (1920) The genus Xanthorrhoea in Western Australia. Journal and
Proceedings of the Royal Society of Western Australia 7, 79-84.
Hobbs, R. J., Groves, R. H., Hopper, S. D., Lambeck, R. J., Lamont, B. B., Lavorel, S.,
Main, A. R., Majer, J. D. & Saunders, D. A. (1995a) Function of biodiversity in
the mediterranean-type ecosystems of southwestern Australia. In:
Mediterranean-type ecosystems, the function of biodiversity. G. W. Davis & D.
M. Richardson (eds), pp. 233-284, Springer-Verlag, New York.
Hobbs, R. J., Richardson, D. M. & Davis, G. W. (1995b) Mediterranean-type
ecosystems: opportunities and constraints for studying the function of
biodiversity. In: Mediterranean-type ecosystems, the function of biodiversity. G.
W. Davis & D. M. Richardson (eds), pp. 1-42, Springer-Verlag, New York.
Hoffman, G. (1972) Growth rhythms of root and shoot axes in forest trees. Flora 161,
303-319.
Holmgren, M., Segura, A. M. & Fuentes, E. R. (2000) Limiting mechanisms in the
regeneration of the Chilean matorral: experiments on seedling establishment in
burned and cleared mesic sites. Plant Ecology 147, 49-57.
Hongo, A. & Oinuma, H. (1998) Effect of artificial treading on morphology and
ethylene production in four herbage grasses. Research bulletin of Obihiro
Natural Science 21, 1-8.
Hopkins, M. S. & Graham, A. W. (1987) Gregarious flowering in a lowland tropical
rainforest: a possible response to disturbance by Cyclone Winifred. Australian
Journal of Ecology 12, 25-29.
Hopper, S. D., Harvey, M. S., Chappill, J. A., Main, A. R. & Main, B. Y. (1996) The
Western Australian biota as Gondwanan heritage - a review. In: Gondwanan
Heritage: past, present and future of the Western Australian biota. S. D. Hopper,
J. A. Chappill, M. S. Harvey & A. S. George (eds), pp. 1-46, Surrey Beatty &
Sons, Chipping Norton.

References 210
Horton, D. (2000) The pure state of nature - Sacred cows, destructive myths and the
environment. Allen and Unwin, St Leonards.
Horvitz, C. C. & Schemske, D. W. (1988) Demographic cost of reproduction in a
neotropical herb: an experimental field study. Ecology 69, 1741-1745.
Hosmer, D. W. & Lemeshow, S. (1989) Applied logistic regression. Wiley-Interscience
Publications, New York.
Howell, G. S., Hansen, C. M., Bittenbender, H. C. & Stackhouse, S. S. (1972)
Rejuvenating highbush blueberries. Journal of the American Society of
Horticultural Science 100, 455-457.
Huddle, J. A. & Pallardy, S. G. (1999) Effect of fire on survival and growth of Acer
rubrum and Quercus seedlings. Forest Ecology and Management 118, 49-56.
Hulbert, L., C (1988) Causes of fire effects in tallgrass prairie. Ecology 69, 46-58.
Humphrey, R. R. (1974) Fire in the deserts and desert grassland of North America. In:
Fire and ecosystems. T. T. Kozlowski & C. E. Ahlgren (eds), pp. 365-400,
Academic Press, New York.
Imanishi, H., Oku, Y. & Uyemura, S. (1986) Effects of various methods of smoke
treatment on sprouting of freesia and flowering of Dutch iris and tazetta
narcissus. Journal of the Japanese Society for Horticultural Science 55, 75-81.
James, S. (1984) Lignotubers and burls-their structure, function and ecological
significance in Mediterranean ecosystems. The Botanical Review 50, 225-266.
Jeffrey, D. W. (1987) Soil-plant relationships an ecological approach. Croom Helm,
London.
Jones, M. B. & Laude, H. M. (1960) Relationships between sprouting in chamise and the
physiological condition of the plant. Journal of Range Management 13, 210-214.

References 211
Karlsson, P. S., Olsson, L. & Hellstrom, K. (1996) Trade-offs among investments in
different ling-shoot functions- variation among mountain birch individuals.
Journal of Ecology 84, 915-921.
Kealley, I. (1993) Banksias and blackboys in the Great Victoria Desert. Landscope 8,
22-27.
Keeley, J. E. (1993) Smoke-induced flowering in the fire-lily Cyrtanthus ventricosus.
South African Journal of Botany 59, 638.
Keeley, J. E. & Bond, W. J. (2001) On incorporating fire into our thinking about natural
ecosystems: a response to Saha and Howe. The American Naturalist 158, 664-
670.
Keeley, J. E. & Zedler, P. H. (1978) Reproduction of chaparral shrubs after fire: a
comparison of sprouting and seeding strategies. The American Midland
Naturalist 99, 142-161.
Keith, H., Raison, R. J. & Jacobsen, K. L. (1997) Allocation of carbon in a mature
eucalypt forest and some effects of soil phosphorus availability. Plant and Soil
196, 81-99.
Kemp, E. M. (1981) Pre-quaternary fire in Australia. In: Fire and the Australian biota.
A. M. Gill, R. H. Groves & I. R. Noble (eds), pp. 582, Australian Academy of
Science, Canberra.
Kennard, D. K. & Gholz, H. L. (2001) Effects of high- and low-intensity fires on soil
properties and plant growth in a Bolivian dry forest. Plant and Soil 234, 119-129.
Kershaw, A. P., Clarke, J. S., Gill, A. M. & D'costa, D. M. (2002) A history of fire in
Australia. In: Flammable Australia. The fire regimes and biodiversity of a
continent. R. A. Bradstock, J. E. Williams & A. M. Gill (eds), pp. 3-25,
Cambridge University Press, Cambridge.

References 212
Kigel, J. (1980) Analysis of regrowth patterns and carbohydrate levels in Lolium
multiflorum Lam. Annals of Botany 45, 91-101.
Koch, J. M. & Bell, D. T. (1980) Leaf scorch in Xanthorrhoea gracilis as an index of
fire intensity. Journal of Australian Forest Research 10, 113-119.
Kolb, K. J. & Davis, S. D. (1994) Drought tolerance and xylem embolism in co-
occurring species of coastal sage and chaparral. Ecology 75, 648-659.
Kosola, K. R., Dickmann, D. I., Paul, E. A. & Parry, D. (2001) Repeated insect
defoliation effects on growth, nitrogen acquisition, carbohydrates, and root
demography of poplars. Oecologia 129, 65-74.
Kozlowski, T. T. (1971) Growth and development of trees. Cambial growth, root
growth, and reproductive growth. Academic Press, New York.
Kozlowski, T. T. & Pallardy, S. G. (1997) Physiology of woody plants. Academic Press,
San Diego.
Krupnick, G. A. & Weis, A. E. (1999) The effect of floral herbivory on male and female
reproductive success in Isomeris arborea. Ecology 80, 135-149.
Kummerow, J. (1983) Comparative phenology of mediterranean-type plant
communities. In: Mediterranena-type ecosystems; the role of nutrients. F. J.
Kruger, D. T. Mitchell & J. U. M. Jarvis (eds), pp. 300-317, Springer-Verlag,
Berlin.
Kummerow, J., Montenegro, G. & Krause, D. (1981) Biomass, phenology, and growth.
In: Resource use by Chaparral and Matorral. P. C. Miller (ed.), pp. 69-96,
Springer-Verlag, New York.
Lacey, C. J. (1983) Development of large plate-like lignotubers in Eucalyptus botryoides
Sm. in relation to environmental factors. Australian Journal of Botany 31, 105-
118.
References 213
Lamont, B. B. (1976) The effects of seasonality and waterlogging on the root systems of
a number of Hakea species. Australian Journal of Botany 24, 691-702.
Lamont, B. B. (1981) Morphometrics of the aerial roots of Kingia australis (Liliales).
Australian Journal of Botany 29, 81-96.
Lamont, B. B. (1984) Specialised modes of nutrition. In: Kwongan plant life of the
sandplain. J. S. Pate & J. S. Beard (eds), pp. 126-145, University of Western
Australia Press, Nedlands.
Lamont, B. B. (1995a) Mineral nutrient relations in Mediterranean regions of California,
Chile and Australia. In: Ecology and biogeography of Mediterranean ecosystems
in Chile, California and Australia. M. T. Kalin Arroyo, P. H. Zedler & M. Fox
(eds), pp. 211-235, Springer-Verlag, New York.
Lamont, B. B. (1995b) Testing the effect of ecosystem composition/structure on its
functioning. Oikos 74, 283-295.
Lamont, B. B. & Bergl, S. M. (1991) Water relations, shoot and root architecture, and
phenology of three co-occuring Banksia species: no evidence for niche
differentiation in the pattern of water use. Oikos 60, 291-298.
Lamont, B. B. & Downes, S. (1979) The longevity, flowering and fire history of the
grasstrees, Xanthorrhoea preissii and Kingia australis. Journal of Applied
Ecology 16, 893-899.
Lamont, B. B., Groom, P. K. & Cowling, R. M. (2002) High leaf mass per area of
related species assemblages may reflect low rainfall and carbon isotope
discrimination rather than low phosphorus and nitrogen concentrations.
Functional Ecology 16, (in press).
Lamont, B. B., Hopkins, A. J. M. & Hnatiuk, R. J. (1984) The flora - composition,
diversity and origins. In: Kwongan plant life of the sandplain. J. S. Pate & J. S.

References 214
Beard (eds), pp. 27-50, University of Western Australia Press, Nedlands,
Western Australia.
Lamont, B. B., Swanborough, P. W. & Ward, D. (2000) Plant size and season of burn
affect flowering and fruiting of the grasstree Xanthorrhoea preissii. Austral
Ecology 25, 268-272.
Laporte, M. M. & Delph, L. F. (1996) Sex-specific physiology and source-sink relations
in the dioecious plant Silene latifolia. Oecologia 106, 63-72.
Larcher, W. (2000) Temperature stress and survival ability of Mediterranean
sclerophyllous plants. Plant Biosystems 134, 279-295.
Lee, A. T. (1966) Notes on Xanthorrhoea in Eastern Australia. Contributions from the
New South Wales National Herbarium 4, 35-54.
Lemmon, P. E. (1956) A spherical densiometer for estimating forest overstory density.
Forestry Science 2, 314-320.
Lemmon, P. E. (1957) A new instrument for measuring forest overstory density. Journal
of Forestry 55, 667-668.
Leonard, C. (1989) Australian flora. Reed Books, Victoria.
Levyns, M. R. (1966) Haemanthus canaliculatus, a new fire-lily from the Western Cape
Province. Journal of the South African Botany 32, 73-75.
Lewis, C. F. (1955) Observations on the age of the Australian grass tree, Xanthorrhoea
australis. The Victorian Naturalist 72, 124-125.
Lieth, H. (1974) Purposes of a phenology book. In: Phenology and Seasonality
Modeling. H. Leith (ed.), pp. 3-19, Springer-Verlag, New York.

References 215
Lindroth, R. L. (1989) Mammalian herbivore- plant interactions. In: Plant-animal
interactions. W. G. Abrahamson (ed.), pp. 163-204, McGraw-Hill, New York.
Long, J. L. (1984) The diets of three species of parrots in the South of Western
Australia. Australian Wildlife Research 11, 357-371.
Lortie, C. J. & Aarssen, L. W. (1999) The advantage of being tall: higher flowers receive
more pollen in Verbascum thapsus L. (Scrophulariaceae). Ecoscience 6, 68-71.
Louda, S. M. (1984) Herbivore effect on stature, fruiting and leaf dynamics of a native
crucifer. Ecology 65, 1379-1386.
Lowe, J. (1961) The phylogeny of monocotyledons. New Phytologist 60, 355-387.
Malanson, G. P. & Trabaud, L. (1988) Vigour of post-fire resprouting by Quercus
coccifera L. Journal of Ecology 76, 351-365.
Marchant, N. G., Wheeler, J. R., Rye, B. L., Bennet, E. M., Lander, N. S. & Macfarlane,
T. D. (1987) Flora of the Perth region. Western Australian Herbarium,
Kensington.
Marshall, J. (1986) Wildflowers of the west coast hills region. Quality publishing
Australia,
Martin, A. R. H. (1966) The plant ecology of the Grahamstown Nature Reserve: II.
Some effects of burning. Journal of South African Botany 32, 1-39.
Martin, H. A. (1990) Tertiary climate and phytogeography in southeastern Australia.
Paleobotany, Palynology 65, 47-55.
Mattheis, P. J., Tieszen, L. L. & Lewis, M. C. (1976) Response of Dupontia fisheri to
lemming grazing in an Alaskan arctic tundra. Annals of Botany 40, 179-197.

References 216
McArthur, W. M. (1991) Reference soils of south-western Australia. Department of
Agriculture, Perth.
McArthur, W. M. & Bettenay, E. (1974) The development of the soils of the Swan
Coastal Plain, Western Australia. Soil publication, 16, CSIRO, Melbourne.
McConnaughtay, K. D. M. & Coleman, J. S. (1998) Can plants track changes in nutrient
availability via changes in biomass partitioning? Plant and Soil 202, 201-209.
Mcloughlin, L. C. (1998) Season of burning in the Sydney region: The historical records
compared with recent prescribed burning. Australian Journal of Ecology 23,
393-404.
McNaughton, S. J. (1983) Physiology and ecological implications of herbivory. In:
Physiological plant ecology III. Responses to the chemical and biological
environment. O. L. Lange, P. S. Nobel, C. B. Osmond & H. Ziegler (eds), pp.
657-677, Springer-Verlag, Berlin.
McNee, S. A. (1997) Damage to Xanthorrhoea preissii (blackboy) by the Port Lincoln
Ringneck in the south-west of Western Australia, Land Conservation District
Committee, Boyup Brook.
McPherson, K. & Williams, K. (1998) Fire resistance of cabbage palms (Sabal palmetto)
in the southeastern USA. Forest Ecology and Management 109, 197-207.
Meagher, T. (1974) Kings Park Board annual report. Annual report, Western Australia
Department of Lands and Surveys, Perth.
Meidner, H. & Sheriff, D. W. (1976) Water and Plants. Blackie, London.
Miller, P. C. (1983) Canopy structure of mediterranean-type shrubs in relation to heat
and moisture. In: Mediterranena-type ecosystems; the role of nutrients. F. J.
Kruger, D. T. Mitchell & J. U. M. Jarvis (eds), pp. 133-166, Springer-Verlag,
Berlin.

References 217
Missingham, H. (1978) Grass trees of Western Australia. Fremantle Arts Centre Press,
Fremantle.
Miyanishi, K. & Kellman, M. (1986) The role of root nutrient reserves in regrowth of
two savanna shrubs. Canadian Journal of Botany 64, 1244-1248.
Mohr, H. & Schopfer, P. (1995) Plant physiology. Springer-Verlag, Berlin.
Monks, C. D. (1966) On the ecological significance of evergreenness. Ecology 47, 504-
505.
Mooney, H. A. (1983) Carbon-gaining capacity and allocation patterns of
Mediterranean-climate plants. In: Mediterranean-type ecosystems. The role of
nutrients. F. J. Kruger, D. T. Mitchell & J. U. M. Jarvis (eds), pp. 103-119,
Springer-Verlag, Berlin.
Mooney, H. A. (1986) Photosynthesis. In: Plant Ecology. M. J. Crawley (ed.), pp. 345-
373, Blackwell Scientific Publications, Oxford.
Mooney, H. A. & Gulmon, S. L. (1982) Constraints on leaf structure and function.
BioScience 32, 198-206.
Mutch, R. W. (1970) Wildland fires and ecosystems - a hypothesis. Ecology 51, 1046-
1051.
Nahal, I. (1981) The Mediterranean climate from a biological viewpoint. In:
Mediterranean-type shrublands. Ecosystems of the world. F. Di Castri, D. W.
Goodall & R. L. Specht (eds), pp. 63-86, Elsevier, Amsterdam.
Nature Advisory Service (1974) Xanthorrhoeaceae, Blackboys. Gould Leaguer 24, 2-19.
Naveh, Z. (1967) Mediterranean ecosystems and vegetation types in California and
Israel. Ecology 48, 445-459.

References 218
Naveh, Z. (1974) Effects of fire in the Mediterranean region. In: Fire and ecosystems. T.
T. Kozlowski & C. E. Ahlgren (eds), pp. 401-434, Academic Press, New York.
Naveh, Z. (1975) The evolutionary significance of fire in the Mediterranean region.
Vegetatio 29, 199-208.
Neales, T. (1994) Plant nutrition, transport and water use. In: Biology. B. Knox, P.
Ladiges & B. Evans (eds), pp. 1067, McGraw-Hill, Sydney.
Negrón-Ortiz, V. & Gorchov, D. L. (2000) Effects of fire season and postfire herbivory
on the Cycad Zamia pumila (Zamiaceae) in slash pine savanna, Everglades
National Park, Florida. International Journal of Plant Science 161, 659-669.
Niklasson, M. & Drakenberg, B. (2001) A 600-year tree-ring fire history from Norra
Kvills National Park, southern Sweden: implications for conservation strategies
in the hemiboreal zone. Biological Conservation 101, 63-71.
Nix, H. (1982) Environmental determinants of biogeography and evolution in Terra
Australis. In: Evolution of the flora and fauna of arid Australia. W. R. Barker &
P. J. M. Greenslade (eds), pp. 47-66, Peacock Publications, Adelaide.
Nulsen, R. A., Bligh, K. J., Baxter, I. N., Solin, E. J. & Imrie, D. H. (1986) The fate of
rainfall in a mallee- and heath vegetated catchment in southern Western
Australia. Australian Journal of Ecology 11, 361-371.
O'Brien, T. P. & McCully, M. E. (1981) The study of plant structure principles and
selected methods. Termarcarphi Pty Ltd, Melbourne.
Obeso, J. R. (1997) Costs of reproduction in Ilex aquifolium: effects at tree, branch and
leaf levels. Journal of Ecology 85, 159-166.
Oechel, W. C. & Hastings, S. J. (1983) The effects of fire on photosynthesis in chaparral
shrubs. In: Mediterranean type ecosystems - the role of nutrients. F. J. Kruger, D.
T. Mitchell & J. U. M. Jarvis (eds), pp. 274-285, Springer Verlag, New York.
References 219
Omar, M. B., Bolland, L. & Heather, W. A. (1978) A permanent mounting medium for
fungi. Stain Technology 53, 293-294.
Orshan, G. (1983) Approaches to the definition of mediterranean growth forms. In:
Mediterranena-type ecosystems; the role of nutrients. F. J. Kruger, D. T.
Mitchell & J. U. M. Jarvis (eds), pp. 86-102, Springer-Verlag, Berlin.
Paczkowska, G. & Chapman, A. R. (2000) The Western Australian flora: a descriptive
catelogue. Wildflower Society of Western Australia, Nedlands.
Parkhurst, D. F. & Loucks, O. L. (1972) Optimal leaf size in relation to environment.
Journal of Ecology 60, 505-537.
Pate, J. S. & Canny, M. J. (1999) Quantification of vessel embolisms by direct
observation: a comparison of two methods. New Phytologist 141, 33-44.
Pate, J. S. & Dell, B. (1984) Economy of mineral nutrients in sandplain species. In:
Kwongan plant life of the sandplain. J. S. Pate & J. S. Beard (eds), pp. 227-252,
University of Western Australia Press, Nedlands.
Pate, J. S. & Dixon, K. W. (1981) Plants with fleshy underground storage organs - A
Western Australian survey. In: The Biology of Australian Plants. J. S. Pate & A.
J. McComb (eds), pp. 181-215, University of Western Australia Press, Nedlands.
Pate, J. S. & Dixon, K. W. (1982) Tuberous, cormous and bulbous plants. Biology of an
adaptive strategy in Western Australia. University of Western Australia Press,
Nedlands.
Pate, J. S., Froend, R. H., Bowen, B. J., Hansen, A. & Kuo, J. (1990) Seedling growth
and storage characteristics of seeder and resprouter species of mediterranean-
type ecosystems of S.W. Australia. Annals of Botany 65, 585-601.
References 220
Pate, J. S., Jeschke, W. D., Dawson, T. E., Raphael, C., Hartung, W. & Bowen, J. B.
(1998) Growth and seasonal utilisation of water and nutrients by Banksia
prionotes. Australian Journal of Botany 46, 511-532.
Paton, D. M. (1978) Eucalyptus physiology. I. Photoperiodic responses. Australian
Journal of Botany 26, 633-642.
Pen, L. J. & Green, J. W. (1983) Botanical exploration and vegetational changes on
Rottnest Island. Journal of the Royal Society of Western Australia 66, 20-24.
Perry, J. N. (1986) Multiple-comparison procedures: a dissenting view. Journal of
Economic Entomology 79, 1149-1155.
Perry, O. T. (1971) Dormancy of trees in winter. Science 171, 29-36.
Phillips, D. H., Foss, J. E., Buckner, E. R., Evans, R. M. & Fitzpatrick, E. A. (2000)
Response of surface horizons in an oak forest to prescribed burning. Soil Science
Society of America Journal 64, 754-760.
Phillips, R. L. & Schneider, H. (1981) Plant anatomy and general botany. In: Staining
Procedures. G. Clark (ed.), pp. 512, Williams and Wilkins, Baltimore.
Radford, S. P. & Lamont, B. B. (1992) An instruction manual for 'Template': a rapid,
accurate program for calculating and plotting water relations data obtained from
pressure-volume studies. School of Environmental Biology, Curtin University of
Technology, Perth.
Radosevich, S. R. & Conard, S. G. (1980) Physiological control of chamise shoot
growth after fire. American Journal of Botany 67, 1442-1447.
Raison, R. J. (1980) A review of the role of fire in nutrient cycling in Australian native
forests, and of methodology for studying the fire-nutrient interaction. Australian
Journal of Ecology 5, 15-21.

References 221
Raison, R. J., Khanna, P. K. & Woods, P. V. (1985a) Mechanisms of element transfer to
the atmosphere during vegetation fires. Canadian Journal of Forest Research 15,
132-140.
Raison, R. J., Khanna, P. K. & Woods, P. V. (1985b) Transfer of elements to the
atmosphere during low-intensity prescribed fires in three Australian subalpine
eucalypt forests. Canadian Journal of Forest Research 15, 657-664.
Recher, H. F. & Christensen, P. E. (1981) Fire and the evolution of the Australian biota.
In: Ecological biogeography of Australia. A. Keast (ed.), pp. 135-162, Dr. W.
Junk Publishers, The Hague.
Rhizopoulou, S. & Davies, W. J. (1991) Influence of soil drying on root development,
water relations and leaf growth of Ceratonia siliqua L. Oecologia 88, 41-47.
Rich, P. & Van Tets, G. (1984) What fossil birds contribute towards an understanding of
origin and development of the Australian avifauna. In: Vertebrate zoogeography
and evolution in Australasia. M. Archer & G. Clayton (eds), pp. 421-446,
Hesperian Press, Carlisle.
Richards, M. B. & Lamont, B. B. (1996) Post-fire mortality and water relations of three
congeneric shrub species under extreme water stress - a trade-off with fecundity?
Oecologia 107, 53-60.
Richardson, J., Koch, J. M. & Lamont, B. B. (2000) Establishment, survival and growth
of Xanthorrhoea preissii and X. gracilis in rehabilitated bauxite mines in south-
western Australia. Report to Alcoa Australia, Curtin University of Technology,
Perth.
Roberts, R. G., Jones, R. & Smith, M. A. (1990) Thermoluminescence dating of a
50,000-year old human occupation site in northern Australia. Nature 345, 153-
156.

References 222
Rogers, R. W. & Westman, W. E. (1981) Growth rhythms and productivity of a coastal
subtropical eucalypt forest. Australian Journal of Ecology 6, 85-98.
Romanyà, J., Khanna, P. K. & Raison, R. J. (1994) Effects of slash burning on soil
phosphorus fractions and sorption and desorption of phosphorus. Forest Ecology
and Management 65, 89-103.
Roper, M. (1999) Water-repellent sands. In: Plants in action: adaptation in nature,
performance in cultivation. B. J. Atwell, P. E. Kriedemann & C. G. N. Turnbull
(eds), pp. 462-463, MacMillan Education Australia, South Yarra, Victoria.
Rorison, I. H. (1981) Plant growth in response to variations in temperature. In: Plants
and their atmospheric environment : the 21st Symposium of the British
Ecological Society. J. Grace, E. D. Ford & P. G. Jarvis (eds), pp. 313-332,
Blackwell Scientific Publications, Oxford.
Rudall, P. & Chase, M. W. (1996) Systematics of Xanthorrhoeaceae sensu lato:
evidence of polyphyly. Telopea 6, 629-647.
Rundel, P. W. (1981) Fire as an ecological factor. In: Physiological Plant Ecology I.
Responses to the physical environment. O. L. Lange, P. S. Nobel, C. B. Olson &
H. Ziegler (eds), pp. 501-538, Springer-Verlag, Berlin.
Rundel, P. W. (1982) Water uptake by organs other than roots. In: Physiological plant
ecology II: water relations and carbon assimilation. O. L. Lange, P. S. Nobel, C.
B. Osmond & H. Ziegler (eds), pp. 111-134, Springer-Verlag, Berlin.
Sakalaukas, K. M., Costa, J. L., Laterra, P., Hidalgo, L. & Aguirrezabal, L. A. N. (2001)
Effects of burning on soil-water content and water use in a Paspalum
quadrifarium grassland. Agricultural Water Management 50, 97-108.
Salisbury, F. B. & Ross, C. W. (1992) Plant Physiology. Wadsworth Publishing
Company, Belmont, California.
References 223
Saulnier, T. P. & Reekie, E. G. (1995) Effect of reproduction on nitrogen allocation and
carbon gain in Oenothera biennis. Journal of Ecology 83, 23-29.
Savé, R., Biel, C. & de Herralde, F. (2000) Leaf pubescence, water relations and
chlorophyll fluorescence in two subspecies of Lotus creticus L. Biologia
Plantarum 43, 239-244.
Schofield, N. J., Stoneman, G. L. & Loh, I. C. (1989) Hydrology of the jarrah forest. In:
The jarrah forest: a complex mediterranean ecosystem. B. Dell, J. J. Havel & N.
Malajczuk (eds), pp. 179-201, Kulwer Academic Publishers, Dorderecht.
Scholander, P. F., Hammel, H. T., Edda, D. B. & Hemmingsen, E. A. (1965) Sap
pressure in vascular plants: negative hydrostatic pressure can be measured in
plants. Science 148, 339-345.
Schweingruber, F. H. (1988) Tree rings: basics and applications of Dendrochronology.
Kluwer Academic Publishers, Dordrecht.
Shea, S. R., Peet, G. B. & Cheney, N. P. (1981) The role of fire in forest management.
In: Fire and the Australian biota. A. M. Gill, R. H. Groves & I. R. Noble (eds),
pp. 443-470, Australian Academy of Science, Canberra.
Shearer, B. L. & Dillon, M. (1995) Susceptibility of plant species in Eucalyptus
marginata forest to infection by Phytophthora cinnamomi. Australian Journal of
Botany 43, 113-134.
Shepherd, K. A., Wardell-Johnson, G. W., Loneragan, W. A. & Bell, D. T. (1997) Diet
of herbivorous marsupials in a Eucalyptus marginata forest and their impact on
the understorey vegetation. Journal of the Royal Society of Western Australia 80,
47-54.
Shipley, D. & Dion, J. (1992) The allometry of seed productionim herbaceous
angiosperms. American Naturalist 139, 467-483.

References 224
Shivas, R. G., Bathgate, J. & Podger, F. D. (1998) Colletotrichum xanthorrhoeae sp.
nov. on Xanthorrhoea in Western Australia. Mycology Research 102, 280-282.
Silberstein, R., Held, A., Hatton, T., Viney, N. & Sivapalan, M. (2001) Energy balance
of a natural jarrah (Eucalyptus marginata) forest in Western Australia:
measurements during the spring and summer. Agricultural and Forest
Meteorology 109, 79-104.
Silvertown, J. & Dodd, M. (1999) The demographic cost of reproduction and its
consequences in Balsam Fir (Abies balsamea). American Naturalist 29, 321-332.
Simms, E. L. (1985) Growth response to clipping and nutrient addition in Lyonia lucida
and Zenobia pulverulenta. American Midland Naturalist 114, 44-50.
Smith, J. M. B. (1986) Biogeography of Australian flora and fauna. In: A natural legacy:
ecology in Australia. H. F. Recher, D. Lunney & I. Dunn (eds), pp. 14-30,
Perganmon Press, Sydney.
Specht, R. L. (1957a) Dark Island heath (Ninety-Mile Plain, South Australia). IV. Soil
moisture patterns produced by rainfall interception and stem-flow. Australain
Journal of Botany 5, 137-150.
Specht, R. L. (1957b) Dark Island heath (Ninety-Mile Plain, South Australia). V. The
water relationships in heath vegetation and pastures on the Makin sand.
Australain Journal of Botany 5, 151-172.
Specht, R. L. (1969) A comparison of the sclerophyllous vegetation characteristics of
mediterranean type climates of France, California and southern Australia. II. Dry
matter, energy and nutrient accumulation. Australian Journal of Botany 17, 293-
308.
Specht, R. L. (1973) Structure and functional response of eco-systems in the
mediterranean ecosystems. In: Mediterranean type ecosystems. Origin and

References 225
structure. F. Di Castri & H. A. Mooney (eds), pp. 113-120, Springer-Verlag,
New York.
Specht, R. L. (1981) The water relations of heathlands: morphological adaptations to
drought. In: Heathlands and Related Shrublands. R. L. Specht (ed.), pp. 123-129,
Elsevier Scientific Publishing Company, Amsterdam.
Specht, R. L. & Brouwer, Y. M. (1975) Seasonal shoot growth of Eucalyptus spp. in the
Brisbane area of Queensland (with notes on shoot growth and litter fall in other
areas of Australia). Australian Journal of Botany 23, 459-474.
Specht, R. L. & Dettmann, M. E. (1995) Palaeo-ecology of Australia and current
physiological functioning of plant communities. In: Time scales of biological
responses to water constraints. J. Roy, J. Aronson & F. di Castri (eds), pp. 201-
214, SPB Academic Publishing, Amsterdam.
Specht, R. L. & Rayson, P. (1957a) Dark Island heath (Ninety-Mile Plain, South
Australia). I. Definition of the Ecosystem. Australian Journal of Botany 5, 52-75.
Specht, R. L. & Rayson, P. (1957b) Dark Island heath (Ninety-Mile Plain, South
Australia). III. The root systems. Australain Journal of Botany 5, 103-114.
Specht, R. L., Rayson, P. & Jackman, M. E. (1958) Dark Island heath (Ninety-Mile
Plain, South Australia). VI. Pyric succession: changes in composition, coverage,
dry weight, and mineral nutrient status. Australain Journal of Botany 6, 59-88.
Specht, R. L., Rogers, R. W. & Hopkins, A. J. M. (1981) Seasonal growth and flowering
rhythms: Australian heathlands. In: Heathlands and Related Shrublands. R. L.
Specht (ed.), pp. 5-13, Elsevier Scientific Publishing Company, Amsterdam.
Specht, R. L. & Specht, A. (1995) Global warming: predicted effects on structure and
species richness of mediterranean ecosystems in southern Australia. In: Time
scales of biological responses to water constraints. J. Roy, J. Aronson & F. di
Castri (eds), pp. 215-237, SPB Academic Publishing, Amsterdam.

References 226
Specht, R. L. & Specht, A. (1999) Australian plant communities: dynamics of structure,
growth and biodiversity. Oxford University Press, South Melbourne.
Staff, I. A. (1968) A study of the apex and growth patterns in the shoot of Xanthorrhoea
media R. Br. Phytomorphology 18, 153-165.
Staff, I. A. (1970) Regeneration in shoots of Xanthorrhoea australis after injury.
Phytomorphology 20, 6-8.
Staff, I. A. (1976) Rapid growth rates in inflorescences of Xanthorrhoea australis R. Br.
Proceedings of the Royal Society of Victoria 88, 109-114.
Staff, I. A. (1989) Xanthorrhoea. In: CRC handbook of flowering. A. H. Halevy (ed.),
pp. 681-695, CRC Press, Boca Raton, Florida.
Staff, I. A. & Waterhouse, J. T. (1981) The biology of arborescent monocotyledons,
with special reference to Australian species. In: The Biology of Australian Plants.
J. S. Pate & A. J. McComb (eds), pp. 216-257, University of Western Australia
Press, Nedlands.
Stallings, W. S. (1937) Some early papers on tree-rings. Tree-ring Bulletin 3, 27-28.
Stark, N. (1979) Plant ash as a natural fertilizer. Environmental and experimental Botany
19, 39-68.
Stephenson, A. G. (1981) Flower and fruit abortion:proximate causes and ultimate
functions. Annual Review of Ecological Systems 12, 253-279.
Stoneman, G. L. & Dell, B. (1993) Growth of Eucalyptus marginata (jarrah) seedlings
in a greenhouse in response to shade and soil temperature. Tree Physiology 13,
239-252.
Stoneman, G. L., Dell, B. & Turner, N. C. (1995) Growth of Eucalyptus marginata
(jarrah) seedlings in mediterranean-climate forest in south-west Australia in

References 227
response to overstorey, site and fertiliser application. Forest Ecology and
Management 79, 173-184.
Stoneman, G. L. & Schofield, N. J. (1989) Silviculture for water production in jarrah
forest of Western Australia: an evaluation. Forest Ecology and Management 27,
273-293.
Stoneman, G. L., Turner, N. C. & Dell, B. (1994) Leaf growth, photosynthesis and tissue
water relations of greenhouse-grown Eucalyptus marginata seedlings in response
to water deficits. Tree Physiology 14, 633-646.
Taylor, J. E., Monamy, V. & Fox, B. J. (1998) Flowering of Xanthorrhoea fulva: the
effect of fire and clipping. Australian Journal of Botany 46, 241-251.
Taylor, S. E. (1975) Optimal leaf form. In: Perspectives of biophysical ecology. D. M.
Gates & R. B. Schmerl (eds), pp. 73-86, Springer-Verlag, Berlin.
Tenhunen, J. D., Lange, O. L., Pereira, J. S., Lösch, R. & Catarino, F. (1981) Midday
stomatal closure in Arbutus unedo leaves: measurements with a steady-state
porometer in the Portuguese evergreen scrub. In: Components of productivity of
mediterranean-climate regions basic and applied aspects. N. S. Margaris & H.
A. Mooney (eds), pp. 61-69, Dr W. Junk Publishers, Hague.
Thomas, I., Enright, N. J. & Kenyon, C. E. (2001) The Holocene history of
mediterranean-type plant communities, Little Desert National Park, Victoria,
Australia. The Holocene 11, 691-697.
Tiedemann, A. R., Klemmedson, J. O. & Bull, E. L. (2000) Solution of forest health
problems with prescribed fire: are forest productivity and wildlife at risk. Forest
Ecology and Management 127, 1-18.
Tomlinson, P. B. & Zimmermann, M. H. (1969) Vascular anatomy of monocotyledons
with secondary growth - an introduction. Journal of the Arnold Arboretum 50,
159-179.
References 228
Trabaud, L. & De Chanterac, B. (1985) The influence of fire on the phenological
behaviour of Mediterranean plant species in Bas-Languedoc (southern France).
Vegetatio 60, 119-130.
Tyree, M. T. & Hammel, H. T. (1972) The measurement of the turgor pressure and the
water relations of plants by the pressure-bomb technique. Journal of
Experimental Botany 23, 267-282.
Underwood, A. J. (1997) Experiments in ecology. Cambridge University Press,
Cambridge.
van der Heyden, F. & Stock, W. D. (1995) Nonstructural carbohydrate allocation
following different frequencies of simulated browsing in three semiarid shrubs.
Oecologia 102, 238-245.
van der Moezel, P. G., Loneragan, W. A. & Bell, D. T. (1987) Northern sandplain
Kwongan: regeneration following fire, juvenile period and flowering phenology.
Journal of the Royal Society of Western Australia 69, 123-132.
Vaughton, G. (1990) Predation by insects limits seed production in Banksia spinulosa
var. neoanglica (Proteaceae). Australian Journal of Botany 38, 335-340.
Verdu, M. (2000) Ecological and evolutionary differences between Mediterranean
seeders and resprouters. Journal of Vegetation Science 11, 265-268.
Vila, M. (1997) Effect of root competition and shading on resprouting dynamics of
Erica multiflora L. Journal of Vegetation Science 8, 71-80.
Villar, R. & Merino, J. (2001) Comparison of leaf construction costs in woody species
with differing leaf life-spans in contrasting ecosystems. New Phytologist 151,
213-226.

References 229
Vlok, J. H. J. & Yeaton, R. I. (2000) The effect of short fire cycles on the cover and
density of understorey sprouting species in South African mountain fynbos.
Diversity and Distributions 6, 233-242.
Walker, J. (1981) Fuel dynamics in Australian vegetation. In: Fire and the Australian
biota. A. M. Gill, R. H. Groves & I. R. Noble (eds), pp. 101-127, Australian
Academy of Science, Canberra.
Wallace, D. D. & O'Dowd, D. J. (1989) The effect of nutrients and inflorescence
damage by insects on fruit-set by Banksia spinulosa. Oecologia 79, 482-488.
Wallace, W. R. (1965) Fire in the jarrah forest environment. Journal of the Royal
Society of Western Australia 49, 33-44.
Ward, D. (1996) Reconstruction of pre-European fire history in south-west Australian
forests. 13th Conference on fire & forest meteorology, Lorne, Victoria.
Ward, D. (2000) Trouble in the tuart: a brief fire history. Final report to Department of
Conservation and Land Management, Perth.
Ward, D. & Lamont, B. B. (2000) Probability of grasstrees (Xanthorrhoea preissii)
flowering after fire. Journal of the Royal Society of Western Australia 83, 13-16.
Ward, D. & Sneeuwjagt, R. (1999) Believing the balga. Landscope 14, 11-16.
Ward, D. J., Lamont, B. B. & Burrows, C. L. (2001) Grasstrees reveal contrasting fire
regimes in eucalypt forest before and after European settlement of southwestern
Australia. Forest Ecology and Management 150, 323-329.
Wardle, D. A., Zackrisson, O. & Nilsson, M.-C. (1998) The charcoal effect in boreal
forests: Mechanism and ecological consequences. Oecologia 115, 419-426.

References 230
Weymouth, G. & Le Marshall, J. (1999) An operational system to estimate global
exposure over the Australian region from satellite observations. I. Method and
initial climatology. Australian Meteorological Magazine 48, 181-195.
Whelan, R. J. (1995) The ecology of fire. Cambridge University Press, Cambridge.
Whelan, R. J., Langedyk, W. & Pashby, A. S. (1980) The effects of wildfire on
arthropod populations in jarrah-Banksia woodland. Western Australian
Naturalist 14, 214-220.
Whiley, A. W., Chapman, K. R. & Saranah, J. B. (1988) Water loss by floral structures
of avocado (Persea americana cv. fuerte) during flowering. Australian Journal
of Agricultural Research 39, 457-467.
Wilcox, H. (1954) Primary organization of active and dormant roots in noble fir, Abies
procera. American Journal of Botany 41, 818-821.
Willis, J. H. (1970) A handbook to plants in Victoria. Ferns, Conifers and
monocotyledons. Melbourne University Press, Victoria.
Wilson, G. W. T., Hartnett, D. C., Smith, M. D. & Kobbeman, K. (2001) Effects of
mycorrhizae on growth and demography of tallgrass prairie forbs. American
Journal of Botany 88, 1452-1457.
Wisheu, I. C., Rosenzweig, M. L., Olsvig-Whittaker, l. & Shmida, A. (2000) What
makes nutrient-poor mediterranean heathlands so rich in plant diversity?
Evolutionary Ecology Research 2, 935-955.
Witkowski, E. T. F. & Lamont, B. B. (1996) Nutrient losses from commercial picking
and cockatoo removal of Banksia hookeriana blooms at the organ, plant and site
levels. Journal of Applied Ecology 33, 131-140.
Witkowski, E. T. F., Mitchell, D. T. & Stock, W. D. (1990) Response of Cape Province
South Africa fynbos ecosystem to nutrient additions: shoot growth and nutrient

References 231
contents of a proteoid (Leucospermum parile) and an ericoid (Phylica
cephalantha) evergreen shrub. Acta �cologica 11, 311-326.
Wittkuhn, R. S. (2000) Mineral nutrient cycling in relation to fire. Report to Department
of Conservation and Land Management, Environmental Biology, Curtin
University of Technology, Perth.
Woodburne, M. O. (1996) Dispersal, vicariance, and the Late Cretaceous to early
Tertiary land mammal biogeography from South America to Australia. Journal
of Mammalian Evolution 3, 121-161.
Woods, F. W., Harris, H. C. & Caldwell, R. E. (1959) Monthly variations of
carbohydrates and nitrogen in roots of sandhill oaks and wiregrass. Ecology 40,
292-295.
Yibarbuk, D., Whitehead, P. J., Russell-Smith, J., Jackson, D., Godjuwa, C., Fisher, A.,
Cooke, P., Choquenot, D. & Bowman, D. M. J. S. (2001) Fire ecology and
aboriginal land management in central Arnhem Land, northern Australia: a
tradition of ecosystem management. Journal of Biogeography 28, 325-343.
Zahner, R., Lotan, J. E. & Baughman, W. D. (1964) Early-latewood features of red pine
grown under simulated drought and irrigation. Forest Science 10, 361-370.
Zammit, C. (1988) Dynamics of resprouting in the lignotuberous shrub Banksia
oblongifolia. Australian Journal of Ecology 13, 311-320.
Zammit, C. & Hood, C. W. (1986) Impact of flower and seed predators on seed-set in
two Banksia shrubs. Australian Journal of Ecology 11, 187-193.
Zamora, R., Gomez, J. M., Hodar, J. A., Castro, J. & García, D. (2001) Effect of
browsing by ungulates on sapling growth of Scots pine in a Mediterranean
environment: consequences for forest regeneration. Forest Ecology and
Management 144, 33-42.