energy deregulation: status of natural gas · pdf filedecember 1998 energy deregulation status...
TRANSCRIPT
United States General Accounting Office
GAO Report to Congressional Requesters
December 1998 ENERGYDEREGULATION
Status of Natural GasCustomer ChoicePrograms
GAO/RCED-99-30

GAO United States
General Accounting Office
Washington, D.C. 20548
Resources, Community, and
Economic Development Division
B-281423
December 15, 1998
The Honorable Jeff BingamanUnited States Senate
The Honorable Dale L. BumpersUnited States Senate
In 1996, U.S. residential and commercial natural gas users spent $45 billionon the fuel to heat and cool homes and offices, cook food, and providepower to other household and business appliances. Prior to 1978, gasproducers sold gas to interstate pipeline companies, which, in turn, sold itto local gas utilities,1 which then sold the gas to end users such asresidential customers and small businesses. The price at which producerscould sell their gas to interstate pipelines and the price at which interstatepipelines could sell their gas to local gas utilities were regulated by thefederal government. State authorities regulated the price that gas utilitiescharged to their end users. Gas utilities held long-term contracts withinterstate pipeline companies, while the latter held long-term contractswith producers. Both types of contracts were typically for 20 years orlonger and were based on regulated prices.
Under the Natural Gas Policy Act of 1978, the Congress began a processthat ended federal control over the price of gas at the wellhead.2 Thisprocess also set in motion a series of public policy changes by the FederalEnergy Regulatory Commission (FERC) and state regulators that hasculminated in “customer choice” programs3 for residential and smallcommercial natural gas users.4 Under these programs, homes and smallbusinesses can choose their supplier of natural gas, much as they nowchoose their long-distance telephone provider. Under a customer choiceprogram, nonutility gas suppliers, called gas marketers, purchase gas and
1Natural gas utilities are referred to as local distribution companies in industry publications.
2For a more complete discussion of the federal laws and regulatory orders since 1978 that haverestructured the natural gas industry, see Natural Gas: Costs, Benefits, and Concerns Related toFERC’s Order 636 (GAO/RCED-94-11, Nov. 8, 1993).
3Customer choice programs are also referred to as unbundling programs. Gas service consists ofseveral separate services—contracting for gas supplies and for interstate transportation and storageand providing for local gas distribution to homes and businesses—that were traditionally bundled intoone service provided by local gas utilities. Under customer choice programs, customers contract fortheir own gas supply, thereby “unbundling” a part of the gas service historically provided by local gasutilities.
4Large industrial customers and electric utilities were given access to competitively priced natural gasfrom nonutility gas suppliers, or gas marketers, by state regulators beginning in the early 1980s. Theyare not a topic of this report.
GAO/RCED-99-30 Customer Choice ProgramsPage 1
B-281423
arrange for its transportation to the local gas utility. Local gas utilities,while no longer purchasing gas directly for their customers, continue todeliver it to homes and businesses. Proponents of customer choiceprograms believe that allowing choice will mean competition, thus leadingto lower gas prices and greater service options for consumers. Others areconcerned about the reliability of service and the possible market powerof gas suppliers if regulated gas utilities are no longer responsible forpurchasing gas on behalf of their customers.
As requested, we are providing you with information on (1) initialparticipation in customer choice programs and (2) the effect of theserecent customer choice initiatives on residential and small commercialconsumers.5 In order to respond to these requests, we conducted a surveyof gas utilities that had customer choice programs under way as of July 31,1998. In addition, we interviewed and gathered information from stateregulators, gas utility representatives, and gas marketers.
Results in Brief Forty-three gas utilities in 16 states currently have customer choiceprograms for either, or both, residential and small commercial natural gascustomers.6 In addition, gas utilities in 11 other states and the District ofColumbia are beginning or considering customer choice programs.According to the results of our survey of gas utilities with residentialcustomer choice programs under way as of July 31, 1998, roughly 553,000residential gas users were participating in customer choice programs inthe United States. This total represents only about 4 percent of theresidential customers eligible to participate in these programs. Nationalfigures for participation in the small commercial programs could not bedetermined because data were unavailable. While overall participation inresidential customer choice programs is generally low, participation ratesvary dramatically among programs. For example, in Nebraska, the localgas utility sponsoring the state’s single program estimated that 70 percentof eligible residential customers had selected a gas marketer, while in NewYork, a local gas utility sponsoring one program reported that noresidential customers had selected a gas marketer in its program.Customer participation rates are determined by a variety of factors, suchas the customers’ potential to save money by purchasing gas from a gas
5Residential and small commercial customers are also referred to as small-volume customers. Whenthey choose to buy their gas from a marketer (either a marketer affiliated with the gas utility or anindependent third-party marketer), they are recorded as having participated in a customer choiceprogram.
6The states are California, Colorado, Illinois, Indiana, Maryland, Massachusetts, Michigan, Nebraska,New Jersey, New Mexico, New York, Ohio, Pennsylvania, Virginia, West Virginia, and Wisconsin.
GAO/RCED-99-30 Customer Choice ProgramsPage 2
B-281423
marketer rather than a gas utility. Other factors reported to us by gasutilities, gas marketers, and state regulators include efforts to makecustomers aware of programs, and program rules, such as limits onparticipation. Gas marketers told us their participation in customer choiceprograms is influenced by their potential to earn a profit on their gas sales.The potential for gas marketers to earn profits can be affected by programrules, such as whether gas marketers can contract for their owntransportation services to transport gas to a gas utility for localdistribution or whether they must use transportation services previouslycontracted for by a gas utility.
Customer choice programs for residential and small commercialcustomers are relatively new, with most being less than 3 years old andseveral less than 1 year old. As a result, information on these programs’impacts on customers is limited. Several gas utilities that responded to oursurvey provided information on how these programs are affecting costsavings, service reliability, and service options. These gas utilities reportedthat customers achieved savings and greater service options with noapparent reduction in reliability. While gas utilities reported few problemswith the reliability of gas marketers’ deliveries, some noted that sincecustomer choice programs are less than 3 years old, the reliability of gasmarketers’ deliveries has yet to be tested. Most gas utilities in our surveydid not provide an estimate of customer savings, in part because theirprograms were in their initial stages of operation and information onsavings was unavailable from gas marketers. Savings estimates we didreceive ranged from 1 to 15 percent on total gas bills and were said tocome from lower transportation and storage costs, lower gas costs, andsavings on state and local taxes. Most gas utilities in our survey have setup independent gas marketers, called marketing affiliates, to sell gas as aseparate service to residential and small commercial gas users. In severalcustomer choice programs we surveyed, these marketing affiliates havelarge market shares, raising concerns among some state regulators abouthow competitive these programs can be and, thus, their potential toreduce prices.
Background The costs of natural gas, its transportation and storage, and subsequentlocal delivery are incorporated into monthly gas bills. According to theDepartment of Energy (DOE), residential customers in 1997 were billed$34.6 billion for natural gas deliveries, or $617 per customer. Figure 1shows the separate components of the natural gas delivery system from
GAO/RCED-99-30 Customer Choice ProgramsPage 3

B-281423
the wellhead, where natural gas is extracted, to the burner tip, where thefuel is used in a home or business.
GAO/RCED-99-30 Customer Choice ProgramsPage 4
B-281423
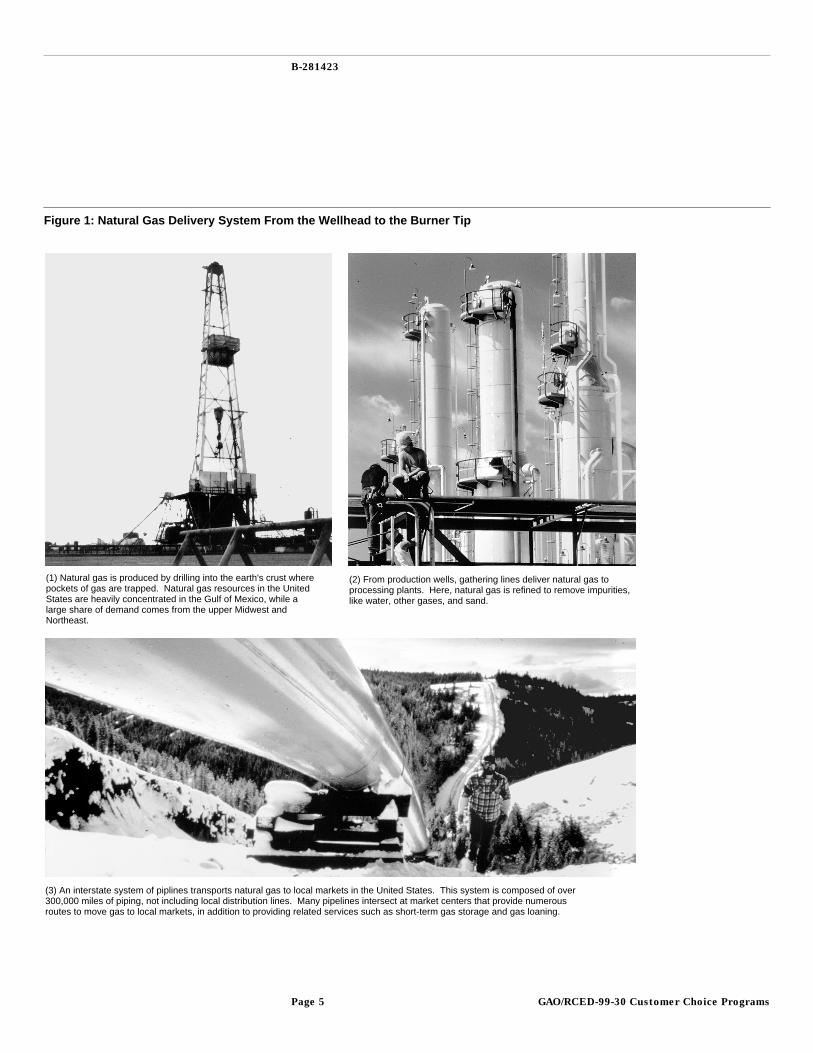
Figure 1: Natural Gas Delivery System From the Wellhead to the Burner Tip
(1) Natural gas is produced by drilling into the earth's crust wherepockets of gas are trapped. Natural gas resources in the United States are heavily concentrated in the Gulf of Mexico, while a large share of demand comes from the upper Midwest and Northeast.
(3) An interstate system of piplines transports natural gas to local markets in the United States. This system is composed of over300,000 miles of piping, not including local distribution lines. Many pipelines intersect at market centers that provide numerous routes to move gas to local markets, in addition to providing related services such as short-term gas storage and gas loaning.
(2) From production wells, gathering lines deliver natural gas to processing plants. Here, natural gas is refined to remove impurities,like water, other gases, and sand.
GAO/RCED-99-30 Customer Choice ProgramsPage 5
B-281423
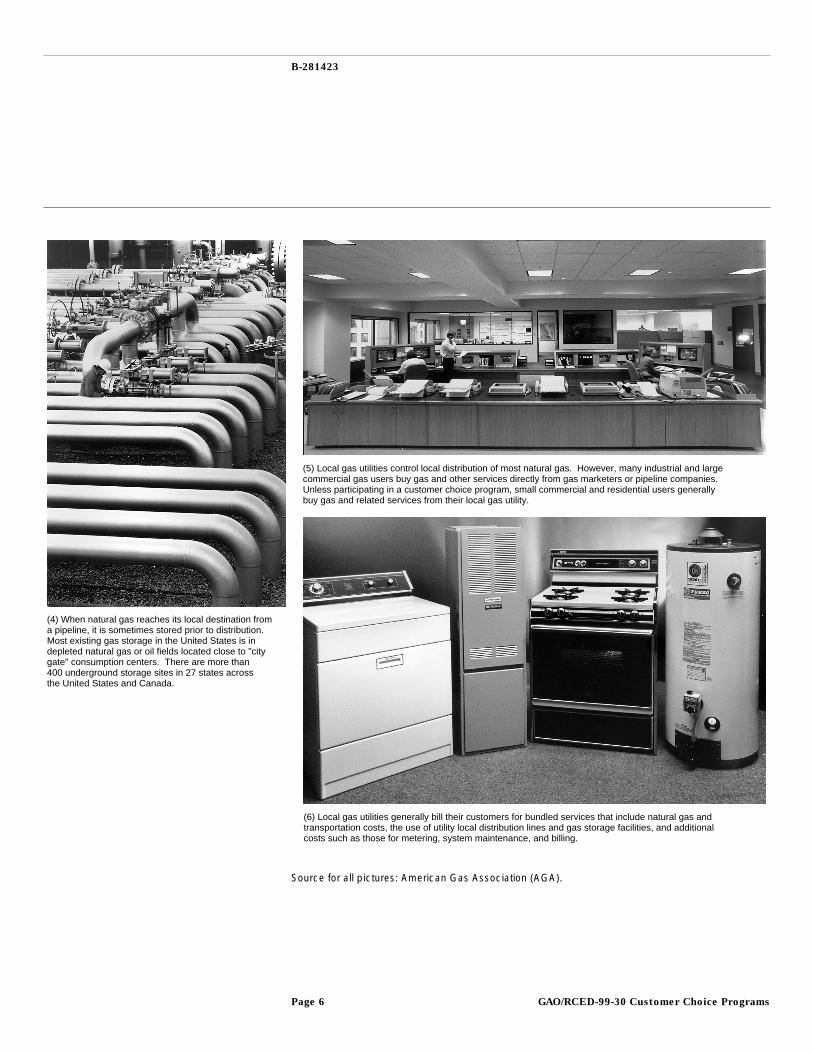
(4) When natural gas reaches its local destination from a pipeline, it is sometimes stored prior to distribution.Most existing gas storage in the United States is indepleted natural gas or oil fields located close to "citygate" consumption centers. There are more than400 underground storage sites in 27 states acrossthe United States and Canada.
(5) Local gas utilities control local distribution of most natural gas. However, many industrial and largecommercial gas users buy gas and other services directly from gas marketers or pipeline companies. Unless participating in a customer choice program, small commercial and residential users generallybuy gas and related services from their local gas utility.
(6) Local gas utilities generally bill their customers for bundled services that include natural gas andtransportation costs, the use of utility local distribution lines and gas storage facilities, and additionalcosts such as those for metering, system maintenance, and billing.
Source for all pictures: American Gas Association (AGA).
GAO/RCED-99-30 Customer Choice ProgramsPage 6
B-281423
Before customer choice programs, the services shown in figure 1 werearranged for or directly provided by local gas utilities.7 Historically, gasutilities contracted with interstate and/or intrastate pipeline companies forthe natural gas and transportation services (called upstream capacity)necessary to transport gas from the producer’s field to the start of the gasutilities’ local distribution system, called the city gate.8 To guarantee theavailability of upstream pipeline and storage space, gas utilities contractedwith pipeline companies for priority upstream capacity, called firmcapacity, to meet the peak day requirements of their customers.9 Thepurchasing of firm capacity by gas utilities was often done at the behest ofstate regulators, who wanted to ensure that gas flowed to homes, schools,and businesses on the coldest days of the year, regardless of additionaldemands placed on the gas delivery system.
Once gas reached the city gate, gas utilities provided for the localdistribution of gas through their network of local pipelines. Local gasutilities also provided other gas-related services, such as billing andmetering.
Customer choice programs allow residential and small commercialcustomers to choose their own provider of gas within this delivery system.Under a customer choice program, nonutility gas suppliers, called gasmarketers, purchase gas and arrange for its transportation to the local gasutility. Customers then purchase, from a gas marketer, gas that is shippedalong the local gas utility’s network of distribution pipes to their home orbusiness. The gas utility still charges customers regulated rates for thecosts of local gas distribution and the related services it provides, such asbilling and metering.
Until recently, customer choice opportunities were limited to largeindustrial and large commercial customers, such as factories and electricutilities that use gas for power generation. These opportunities allow thesegas users to contract competitively for gas, either directly with gas
7Natural gas utilities are regulated entities franchised by state regulators to serve customers in aspecific service area.
8Transportation services include transportation and storage space on interstate and/or intrastatepipeline systems. These transportation services are termed upstream capacity because they occurbetween the source of gas supply and the beginning of a gas utility’s local distribution system. Inindustry terminology, the gas utility is often used as a reference point that is between the source of gassupply and end users such as homes and businesses. Activities occurring between supply sources andthe gas utility are considered upstream activities, while activities occurring between the gas utility andend users are considered downstream activities.
9Gas utilities maintain portfolios of the gas supply and transportation contracts necessary to bring gasto customers.
GAO/RCED-99-30 Customer Choice ProgramsPage 7
B-281423
producers or with gas marketers, as well as with interstate pipelines forupstream capacity. According to DOE, average gas prices paid by electricutilities and industrial gas customers have fallen 36 and 24 percent,respectively, between 1990 and 1995, adjusted for inflation.10 DOE notedthat these customers may have the option of multiple servers as well asthe capability of using fuels other than natural gas, which allows them tobe more aggressive in negotiating contracts and services.
While natural gas deregulation has resulted in lower prices for natural gas,it has also at times been associated with greater price uncertainty.According to DOE analysts, prior to deregulation, many gas utilities’ supplycontracts were long-term—often for 20 years or more—with littlevariability in price.11 With deregulation, gas utilities began to purchase gason the spot market, which can sometimes be highly volatile. For example,in our report on natural gas price volatility during the winter of 1996-97,we found that residential gas prices in New Mexico were 68 percent higherin January 1997 than in December 1996.12 For some gas utilities we spokewith, price spikes have sometimes resulted in discontented customers anddrawn the attention of state regulatory authorities. While state regulatorsallow gas utilities to recover their upstream costs, including those forinterstate transportation and storage and the cost of gas, without profit orloss, regulators in some states can disallow the recovery of costs whenthey believe gas utilities have made imprudent gas-purchasing decisions.
For some gas utilities, extending customer choice programs to theirresidential and small commercial customers has given them anopportunity to reduce their regulatory risk and improve their public imagewith their customer base. Other gas utilities view gas marketers’participation in customer choice programs as a way to increase thedemand for gas and therefore help expand their distribution system. Stillother gas utilities view customer choice programs as part of a process ofchange that will result in the increasing importance of nonutility energycompanies that market natural gas, electricity, and even oil-basedproducts in an increasingly competitive environment. Some observersbelieve that mergers, acquisitions, and alliances are bringing diverseenergy companies together across energy markets. Several gas utilitieshave established marketing affiliates that are already active in both gasand electricity markets.
10Natural Gas 1996 Issues and Trends, Energy Information Agency (DOE/EIA-0560(96), Dec. 1996).
11Mary E. Carlson, Joan Heinkel, and John H. Herbert, “Contracting for Natural Gas Supplies,” EnergyInformation Agency, Natural Gas Monthly (Feb. 1994).
12Natural Gas Prices During the Winter of 1996-97 (GAO/RCED-98-105R, Mar. 11, 1998).
GAO/RCED-99-30 Customer Choice ProgramsPage 8
B-281423
Overall ParticipationRemains Low forSmall-VolumeCustomer ChoicePrograms
As of July 31, 1998, 43 gas utilities in 16 states had customer choiceprograms under way for residential and/or small commercial natural gasusers.13 In addition, gas utilities in 11 other states and the District ofColumbia were beginning or considering customer choice programs forresidential or small commercial gas users. In general, the customer choiceprograms under way are relatively new, as most of these programs are lessthan 3 years old and several are less than 1 year old. Despite the likelihoodof future growth, participation in current programs is generally low.According to our survey of gas utilities, roughly 553,000 residential gasusers, about 4 percent of the customers eligible to participate in customerchoice programs, are participating in them. The figures for nationalparticipation in small commercial programs could not be determinedbecause data were unavailable. Participation rates in customer choiceprograms vary dramatically; in some programs, over half of all eligiblecustomers participated, while other programs are still awaiting their firstparticipant.
Customer participation rates are determined by a variety of factors, suchas the potential to save money through the purchase of gas from a gasmarketer rather than through a gas utility. Other factors reported to us bygas utilities, gas marketers, and state regulators as influencing customers’participation include efforts by these parties to make customers aware ofthe program, and program rules, such as caps on participation, that canlimit overall customer participation. Gas marketers told us theirparticipation in customer choice programs is influenced by the potentialfor them to earn a profit on their gas sales. Their potential to earn profitscan be affected by program rules, such as whether gas marketers cancontract for their own transportation services to transport gas to a localgas utility.
Sixteen States HaveSmall-Volume CustomerChoice Programs UnderWay, and More Will StartSoon
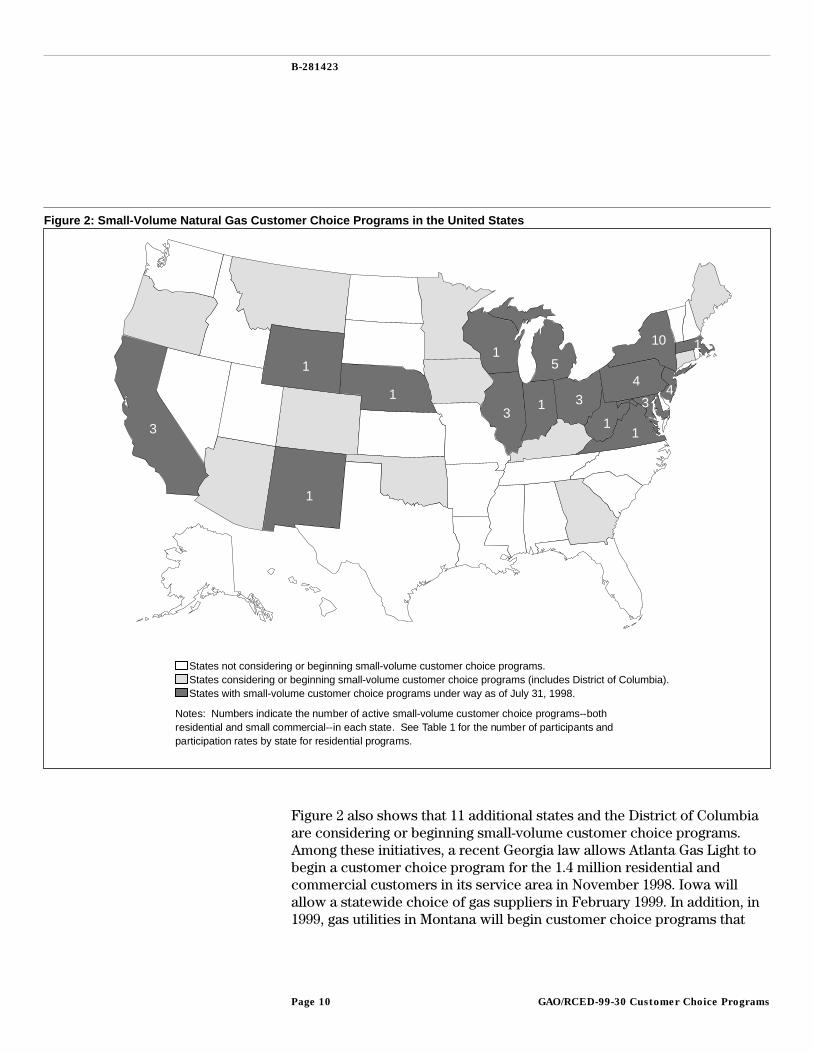
As shown in figure 2, small-volume customer choice programs—allowingchoice for residential and/or small commercial customers—areconcentrated in midwestern and eastern states. As of July 31, 1998, NewYork had 10 active customer choice programs, followed by Michigan,which had 5. New Jersey and Pennsylvania each had four customer choiceprograms under way, and Ohio, Illinois, and Maryland each had threeactive programs.
13Through interviews with industry experts at DOE, the American Gas Association, and local gasutilities, we determined that 43 gas utilities offered customer choice programs for residential and/orsmall commercial gas users. The American Gas Association represents natural gas utilities. We mailedquestionnaires to all 43 gas utilities and received responses from 38 of them. Information used in thisreport on customers’ and gas marketers’ participation is based on these responses.
GAO/RCED-99-30 Customer Choice ProgramsPage 9
B-281423
Figure 2: Small-Volume Natural Gas Customer Choice Programs in the United States
States not considering or beginning small-volume customer choice programs.States considering or beginning small-volume customer choice programs (includes District of Columbia). States with small-volume customer choice programs under way as of July 31, 1998.
3
1
1
13
15
1
Notes: Numbers indicate the number of active small-volume customer choice programs--bothresidential and small commercial--in each state. See Table 1 for the number of participants andparticipation rates by state for residential programs.
431
110
4
1
3
Figure 2 also shows that 11 additional states and the District of Columbiaare considering or beginning small-volume customer choice programs.Among these initiatives, a recent Georgia law allows Atlanta Gas Light tobegin a customer choice program for the 1.4 million residential andcommercial customers in its service area in November 1998. Iowa willallow a statewide choice of gas suppliers in February 1999. In addition, in1999, gas utilities in Montana will begin customer choice programs that
GAO/RCED-99-30 Customer Choice ProgramsPage 10
B-281423
will offer a choice of gas suppliers to most of their residential andcommercial gas users. The other states that are considering or beginningprograms are likely to begin customer choice programs in 1999 or 2000.
In addition, gas utilities and state regulators in Ohio, Illinois,Massachusetts, Michigan, New Jersey, Virginia, and Wyoming areexpanding existing customer choice programs. The American GasAssociation (AGA) reported that once all these programs are under way, 33percent, or 18.1 million, of the 54 million households in the United Stateswith natural gas service will be able to choose their gas supplier. AGA alsoestimated that more than 40 percent of the country’s commercialcustomers can now, or soon will be able to, buy gas from a nonutilitysupplier.14
Status of Residential CustomerChoice Programs
Thirty-four of the 43 local gas utilities we surveyed reported that they hadresidential customer choice programs under way as of July 31, 1998.15
Thirty-one of these utilities reported that they began their customer choiceprograms in 1996 or later. In California, three residential customer choiceprograms began in 1991. Of the 34 residential customer choice programs,14 had specific ending dates and may be considered pilot programs. Pilotprograms may be limited to one town or county within a gas utility’sservice area and can restrict the number of customers eligible toparticipate in the program. State regulators may direct gas utilities to limiteligibility to less than all customers in their service area so they can gainexperience in administering a choice program before broadening it.
Status of Small CommercialCustomer Choice Programs
Thirty-five gas utilities also reported that they had small commercialchoice programs under way as of July 31, 1998. Twenty-eight of theseprograms began in 1996 or later, while 7 began in 1988 through 1995. Ofthe 35 small commercial customer choice programs, 15 had specificending dates and may be considered pilot programs. Thirty-two gasutilities reported that they had both residential and small commercialcustomer choice programs under way as of July 31, 1998.
14Providing New Services to Residential Natural Gas Customers: A Summary of Customer Choice PilotPrograms and Initiatives 1998 Update, AGA Issue Brief 1998-03 (July 31, 1998).
15Four gas utilities reported that they did not have residential programs under way as of July 31, 1998.We did not receive responses from the other five gas utilities.
GAO/RCED-99-30 Customer Choice ProgramsPage 11
B-281423
Residential ParticipationRates Are Low Nationallyand Vary Greatly AmongPrograms
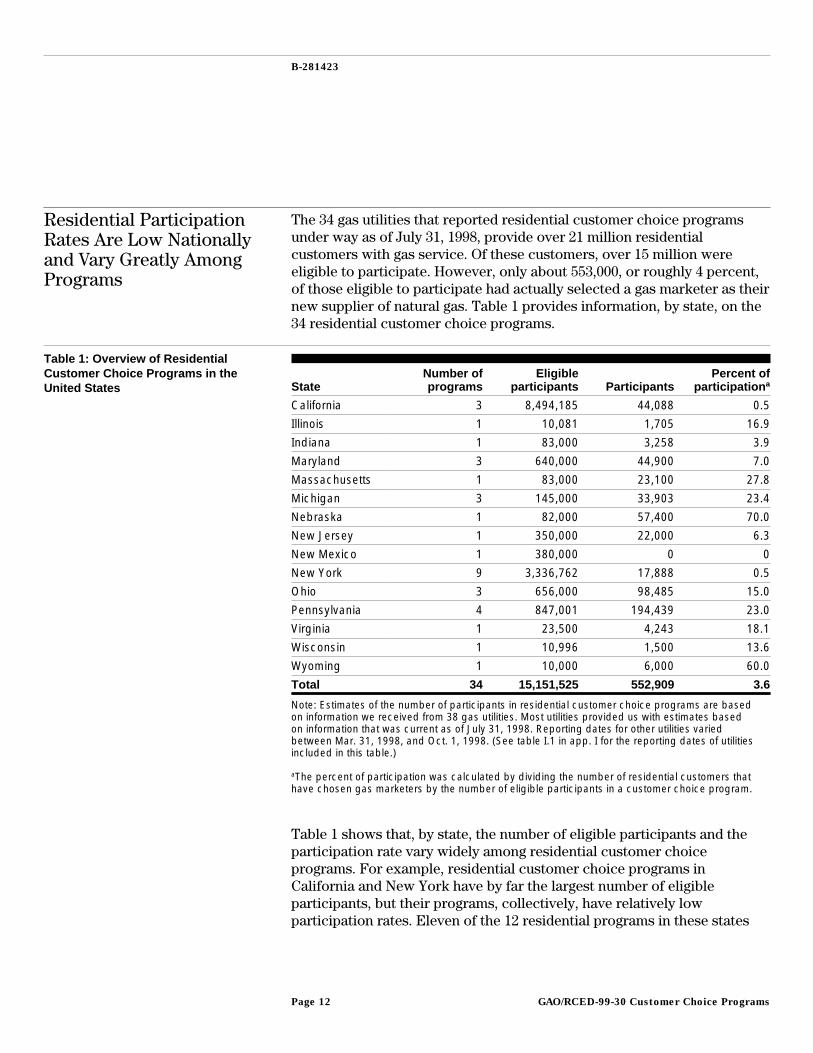
The 34 gas utilities that reported residential customer choice programsunder way as of July 31, 1998, provide over 21 million residentialcustomers with gas service. Of these customers, over 15 million wereeligible to participate. However, only about 553,000, or roughly 4 percent,of those eligible to participate had actually selected a gas marketer as theirnew supplier of natural gas. Table 1 provides information, by state, on the34 residential customer choice programs.
Table 1: Overview of ResidentialCustomer Choice Programs in theUnited States State
Number ofprograms
Eligibleparticipants Participants
Percent ofparticipation a
California 3 8,494,185 44,088 0.5
Illinois 1 10,081 1,705 16.9
Indiana 1 83,000 3,258 3.9
Maryland 3 640,000 44,900 7.0
Massachusetts 1 83,000 23,100 27.8
Michigan 3 145,000 33,903 23.4
Nebraska 1 82,000 57,400 70.0
New Jersey 1 350,000 22,000 6.3
New Mexico 1 380,000 0 0
New York 9 3,336,762 17,888 0.5
Ohio 3 656,000 98,485 15.0
Pennsylvania 4 847,001 194,439 23.0
Virginia 1 23,500 4,243 18.1
Wisconsin 1 10,996 1,500 13.6
Wyoming 1 10,000 6,000 60.0
Total 34 15,151,525 552,909 3.6
Note: Estimates of the number of participants in residential customer choice programs are basedon information we received from 38 gas utilities. Most utilities provided us with estimates basedon information that was current as of July 31, 1998. Reporting dates for other utilities variedbetween Mar. 31, 1998, and Oct. 1, 1998. (See table I.1 in app. I for the reporting dates of utilitiesincluded in this table.)
aThe percent of participation was calculated by dividing the number of residential customers thathave chosen gas marketers by the number of eligible participants in a customer choice program.
Table 1 shows that, by state, the number of eligible participants and theparticipation rate vary widely among residential customer choiceprograms. For example, residential customer choice programs inCalifornia and New York have by far the largest number of eligibleparticipants, but their programs, collectively, have relatively lowparticipation rates. Eleven of the 12 residential programs in these states
GAO/RCED-99-30 Customer Choice ProgramsPage 12
B-281423
had participation rates of under 1 percent. The four residential customerchoice programs in Pennsylvania account for about one-third of all suchparticipants nationwide. Residential customer choice programs in Ohio,Michigan, and Maryland also account for a large percentage of the totalparticipation nationwide.
Across individual programs, participation rates varied greatly. Forinstance, as of September 9, 1998, 70 percent of the 82,000 residentialcustomers eligible to participate in Nebraska’s KN Energy choice programwere participating. In contrast, as of August 31, 1998, none of the 380,000eligible residential customers were participating in the Public ServiceCompany of New Mexico’s program because of the unavailability of gasmarketers. (See table I.1, in app. I, for the number of participants andparticipation rates for each of the 34 residential customer choice programsin our survey.)
National figures for participation in small commercial programs could notbe determined. Several gas utilities that responded to our survey keptinformation for commercial customers but did not keep separateinformation for small commercial customers. Also, several programs haddifferent gas usage requirements for small commercial participation,making comparisons among programs unreliable. For instance, someprograms were open to all commercial customers regardless of annual gasusage, while others set annual limits on gas usage for participation. To theextent that information was available, table I.2, in appendix I, identifiessmall commercial customer choice programs by state, the number ofeligible participants, participants, and participation rates.
Residential ParticipationRates Are Determined by aNumber of Factors
According to state regulators, gas utility representatives, and gasmarketers we spoke with, residential participation rates in customerchoice programs are determined by many factors. An important factor isthe potential of residential customers to save money by purchasing gasfrom a gas marketer rather than from a gas utility. Savings are defined asthe difference between what the gas utility would charge and what the gasmarketer charges for gas delivered to a utility’s city gate. As discussed inthe next section, gas utilities told us that customers’ savings come from acombination of gas marketers’ savings on upstream transportation andstorage costs and on the cost of gas. In some states, customers are alsoachieving savings because natural gas sold by marketers is subject tofewer state and local taxes than gas sold by local gas utilities. To theextent gas marketers pay lower taxes, they can charge lower prices.
GAO/RCED-99-30 Customer Choice ProgramsPage 13
B-281423
State regulators, gas utilities, and gas marketers told us that other factorsinfluencing customers’ participation include efforts to make customersaware of choice programs through education and outreach activities. InMassachusetts, Bay State Gas Company was able to achieve a relativelyhigh rate of customer participation partially through public educationefforts coordinated through a collaborative process with state regulators,consumer representatives, and gas marketers. Bay State Gas Companyoffered customer choice to all its residential customers in Springfield,Massachusetts, in the summer of 1997. The collaborative promotioncampaign that followed involved direct mail and billing statement insertsfrom the gas utility, media advertising in 10 newspapers, four televisionstations, and nine radio stations, and individual campaigns by gasmarketers. As of July 31, 1998, almost 28 percent of the residentialcustomers in the Springfield area had selected a gas marketer under theprogram.
Another collaborative effort took place under Columbia Gas of Ohio’sprogram. In this program, Columbia Gas of Ohio offered customer choiceto about 160,000 residential and 11,500 small business customers in itsToledo, Ohio, service area beginning in April 1997. The gas utility alsocollaborated with state regulators, consumer representatives, and gasmarketers to find the best way to continue, improve, and expand thechoice program. Public education efforts for this program began with a14-day advertising moratorium, during which gas marketers voluntarilyrefrained from contacting or enrolling customers. During this moratorium,only Columbia Gas of Ohio, the Public Utility Commission of Ohio (PUCO),and the Ohio Consumers’ Council could contact customers and informthem of the choice program.16 The moratorium and subsequenteducational campaigns included print, television, radio, billboard and mailadvertising, news releases, and community events. As of July 31, 1998,53,985 residential customers, or 34 percent of all eligible customers, hadchosen a gas marketer under the program.
Other programs may have encouraged participation by making it easier forcustomers to participate. For example, in Nebraska and Wyoming, KNEnergy allowed customers to select gas suppliers through mail-inballoting. For these programs, KN Energy sent ballots to all eligible
16Because of customers’ initial confusion over pricing and marketers’ offers, PUCO later extended themoratorium’s time frame for the first 45 days of the Cincinnati Gas and Electric Company program andfor the first 90 days of the East Ohio Gas program. In addition, PUCO developed and distributed aprice comparison chart to help customers understand the pricing options available to them.
GAO/RCED-99-30 Customer Choice ProgramsPage 14
B-281423
residential and commercial customers in order for them to select a gasmarketer. Balloting took place during 2-week open seasons.17
While potential savings and customer education and outreach efforts canincrease customers’ participation, program rules, such as caps onparticipation, can limit overall participation. For instance, some programslimit eligibility to less than all the customers in their service area so thatgas utilities can gain experience in administering a program prior tobroadening it. Thirteen gas utilities in our survey reported that eligibilitywas limited to fewer than half of all the residential customers in theirservice area. For example, under the SEMCO Energy Gas Company’sBattle Creek Division program in Michigan, participation is capped at1,000 residential customers, which is only 3 percent of the 32,400residential customers in the utility’s service area. Under the Baltimore Gasand Electric Company’s customer choice program, while all residentialcustomers were eligible, participation was capped at 50,000 residentialcustomers, which was only 9 percent of the 530,000 residential customersin the utility’s service area.18
Many Factors Affect GasMarketers’ Participation
State regulators, gas utilities, and gas marketers told us that gas marketers’participation in customer choice programs is influenced by the potentialfor the gas marketers to earn a profit on their gas sales. They also said thatlimits on customers’ participation in some areas may be such that amarketer cannot expect to make a profit. For instance, some programslimit customers’ eligibility, and gas marketers may not offer service inthese programs because they may be unable to recover administrative andmarketing costs. One marketer told us that it will not participate in achoice program that has fewer than 100,000 eligible customers if theservice area is remote and the marketer cannot combine its marketingeffort for a remote area with its efforts to sell gas to other customers inadjacent programs. Generally, residential customer choice programs thathad fewer eligible customers had fewer marketers offering gas services.For example, the Central Illinois Light Company’s choice program limitsparticipation to 10,081 customers, which is 6 percent of the 183,058
17Aside from the two KN Energy programs, only five other gas utilities in our survey—The Peoples GasLight and Coke Company and Nicor Gas of Illinois, Michigan Consolidated Gas, Wisconsin GasCompany, and National Fuel Gas of Pennsylvania—required customer choice participants to choosegas marketers during open seasons. Other gas utilities in our survey allowed participants to choose gasmarketers through rolling enrollment.
18The utility reached this cap in Oct. 1998. Data used in this report for Baltimore Gas and Electric arecurrent as of July 31, 1998.
GAO/RCED-99-30 Customer Choice ProgramsPage 15
B-281423
customers in its service territory. This choice program is served by onlyone marketer.
Geographical factors can also discourage marketers’ participation. Forexample, in the New Mexico customer choice program, no gas marketersare currently active for residential customers. The New Mexico PublicUtility Commission and gas utility representatives in the state reportedthat marketers did not see the potential for financial benefit in theprogram, given the relatively low cost of gas in the state. One gas marketerthat left the residential choice program in New Mexico told us theadministrative and advertising costs it incurred in attracting residentialcustomers exceeded the profits it could make in selling gas to thesecustomers.
The potential for gas marketers to earn profits may also be affected byprogram rules, such as whether gas marketers can contract for their owntransportation services to transport gas to the gas utility. Under tworesidential customer choice programs in New York—New York StateElectric and Gas and Rochester Gas and Electric—only one gas marketerwas participating in each program, and the marketers were required toassume existing pipeline contracts. The New York Public ServicesCommission reported that gas marketers may not be participating in somestate customer choice programs because their profit margins are too thin.The commission issued an order on November 3, 1998, that would allow,by April 1, 1999, gas marketers participating in any customer choiceprogram in the state to contract for their own transportation services.19
Other program rules and fees may also limit gas marketers’ participation.For instance, several customer choice programs require gas marketers tosign up a minimum number of customers, called aggregation requirements,in order to participate as marketers. If these aggregation requirements areset at a high enough level, they can limit gas marketers’ participation. Forexample, in California, gas marketers must meet a 250,000-therm20
aggregation minimum in order to be able to offer services in the state’scustomer choice programs. In a January 1998 report, the California Public
19Policy Statement Concerning the Future of the Natural Gas Industry in New York State and OrderTerminating Capacity Assignment, State of New York Public Service Commission (Case 93-G-0932 andCase 97-G-1380, Nov. 3, 1998).
20A therm is a heat measurement for natural gas that is equivalent to 100,000 British thermal units.Each California residential customer consumed about 532 therms annually in 1996.
GAO/RCED-99-30 Customer Choice ProgramsPage 16
B-281423
Utility Commission recommended eliminating this aggregationrequirement because it hindered marketers’ participation.21
Under the Central Illinois Gas Company program, gas marketers arerequired to post a $300 bond per customer served. According to the utility,a gas marketer complained that the bond is a barrier to marketers’participation. This program is currently served by only one gasmarketer—the utility’s marketing affiliate. Gas marketers have told us thatother utilities require that marketers post performance bonds or securitydeposits per customer served and that these costs can constitute afinancial barrier to entry for them. One gas marketer told us that a $10 percustomer security deposit requirement constituted a $200,000 “entry fee” ifthe marketer wanted to supply gas to 20,000 customers in a customerchoice program.
Table I.3 in appendix I lists the number of gas marketers participating incurrent small-volume customer choice programs.
Some CustomerSavings and NewService OptionsReported forCustomer ChoicePrograms
Although customer choice programs are relatively new, some informationon the impacts of these programs exists. Several gas utilities in our surveyreported that program participants achieved savings and greater serviceoptions with no apparent reduction in service reliability. While gas utilitiesreported few reliability problems with gas marketers’ deliveries, somenoted that customer choice programs are less than 3 years old and thereliability of gas marketers’ deliveries has yet to be tested. Most gasutilities in our survey did not provide an estimate of customer savings, inpart because their programs were in their initial stages of operation andinformation on savings were unavailable from gas marketers. Savingsestimates ranged from 1 to 15 percent on total gas bills and were estimatedto come from lower transportation and storage costs, the lower cost ofgas, and savings on state and local taxes. Most gas utilities in our surveyhave set up independent marketing arms, called affiliates, to sell gas as aseparate service to residential and small commercial gas users. For severalof the customer choice programs that we surveyed, these marketingaffiliates have large market shares, raising concerns about howcompetitive these programs are and thus their potential to reduce prices tocustomers.
21Strategies for Natural Gas Reform: Exploring Options for Converging Energy Markets, Division ofStrategic Planning, California Public Utilities Commission (Jan. 21, 1998).
GAO/RCED-99-30 Customer Choice ProgramsPage 17
B-281423
Estimates of Savings Vary Twelve of the 38 gas utilities that responded to our questionnaireestimated savings for residential and small commercial customersparticipating in their customer choice programs. These estimates rangedfrom savings of 1 to 15 percent on total gas bills compared with theamounts that would have been paid under the prior regulated rates. Elevenof these utilities estimated savings of at least 5 percent on monthly gasbills. Gas utilities in our survey responded that these results likely camefrom a combination of marketers’ savings on interstate transportation andstorage costs, savings on the cost of gas itself, and savings that themarketers experience because state and local taxes are levied on utilities’gas sales but not on marketers’ gas sales.
Savings Potential May Dependon Components of Gas BillOpen to Competition
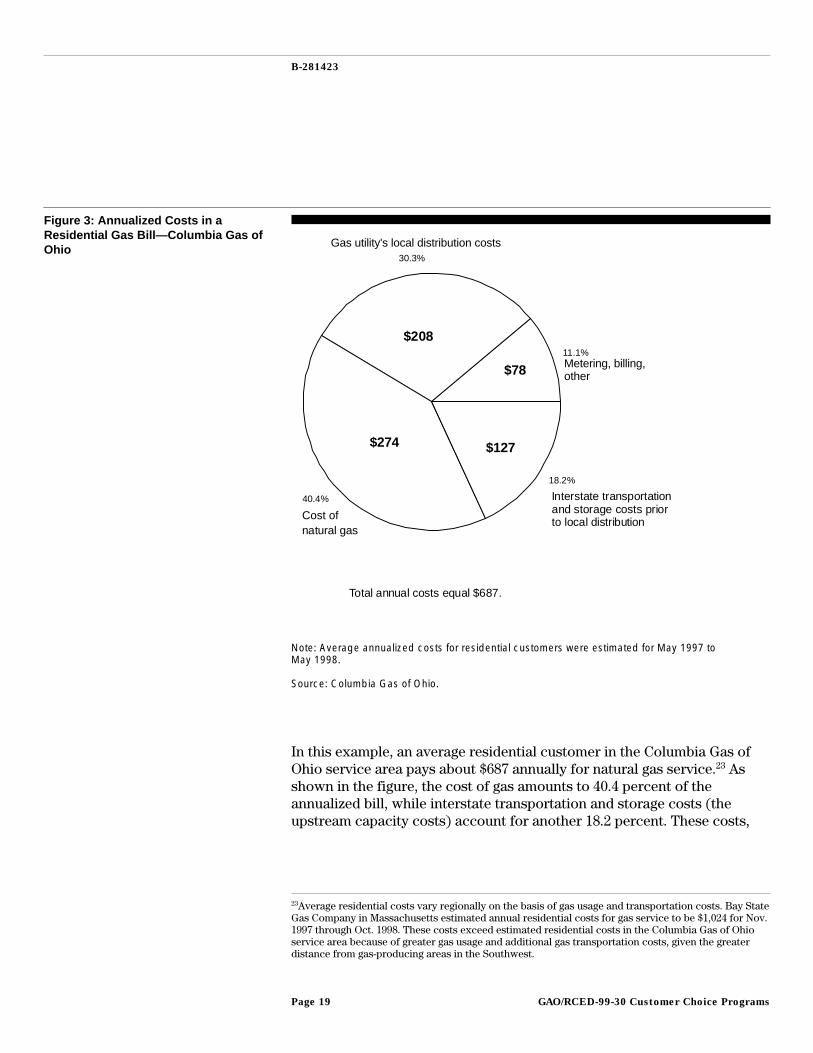
All customer choice programs allow gas marketers to attract customersthrough price competition on the cost of gas. However, not all programsallow gas marketers to attract customers through price competition on thecost of transportation services, called upstream capacity.22 Customerchoice programs that allow for price competition on both the cost of gasand upstream capacity open a larger percentage of a gas bill to potentialprice savings than customer choice programs that allow for pricecompetition only on the cost of gas. Figure 3 illustrates this point byidentifying the service components and their estimated costs in an averageannualized residential gas bill in the Midwest.
22As noted earlier, these costs include ones for pipeline transportation and storage that occur betweenthe source of gas supply and the beginning of a gas utility’s local distribution system.
GAO/RCED-99-30 Customer Choice ProgramsPage 18
B-281423
Figure 3: Annualized Costs in aResidential Gas Bill—Columbia Gas ofOhio
11.1%
30.3%
40.4%
18.2%
Gas utility's local distribution costs
Metering, billing, other
Interstate transportation and storage costs prior to local distribution
$208
$274 $127
$78
Total annual costs equal $687.
Cost of natural gas
Note: Average annualized costs for residential customers were estimated for May 1997 toMay 1998.
Source: Columbia Gas of Ohio.
In this example, an average residential customer in the Columbia Gas ofOhio service area pays about $687 annually for natural gas service.23 Asshown in the figure, the cost of gas amounts to 40.4 percent of theannualized bill, while interstate transportation and storage costs (theupstream capacity costs) account for another 18.2 percent. These costs,
23Average residential costs vary regionally on the basis of gas usage and transportation costs. Bay StateGas Company in Massachusetts estimated annual residential costs for gas service to be $1,024 for Nov.1997 through Oct. 1998. These costs exceed estimated residential costs in the Columbia Gas of Ohioservice area because of greater gas usage and additional gas transportation costs, given the greaterdistance from gas-producing areas in the Southwest.
GAO/RCED-99-30 Customer Choice ProgramsPage 19
B-281423
almost 59 percent of the annualized bill, are pass-through costs24 from thelocal gas utility to the customer. It is generally in these servicecomponents—the cost of the gas and its delivery to the local gasutility—that price competition in customer choice programs takes place.Customer choice typically means a choice in the gas supply to the localgas utility, called the city gate. The remaining 41 percent of the annualizedbill includes costs that occur after the gas utility receives the gas, such ascosts for local gas distribution through utility-owned pipelines, local gasstorage costs, the salaries of utility employees, return on investment,billing, metering, and customer service.25
Some gas marketers and gas utilities told us that savings on the cost of gasare likely to be small. They told us that the national market for natural gasis competitive and that the commodity can be bought by gas utilities andgas marketers at similar prices.
However, several gas utilities and gas marketers told us that savings onupstream capacity can be significant. As noted earlier, to guarantee theavailability of pipeline and storage space necessary for the delivery of theirgas, gas utilities reserve upstream capacity through negotiated contractswith pipeline companies. These contracts are often long-term—up to 20years—for priority pipeline and storage space (called firm capacity26). Gasutilities were often required to purchase firm long-term transportationcontracts by state regulators to ensure that gas would be delivered toresidential and small commercial customers regardless of demand.
In practice, firm capacity contracts have often meant that gas utilities hadunused capacity during off-peak periods, such as the summer months,when the demand for gas heating is low. In other words, gas utilitiesreserved sufficient capacity to meet their maximum loads, although thismeant that for the rest of the year they were paying for unused capacityand passing these costs to their customers.
24Pass-through costs mean that regulators generally allow the utility to fully recover such costs, withno opportunity for profit or loss, unless regulators determine some portion of upstream costs to beexcessively high or not prudent. Depending on state law, the utility may be faced with some costdisallowances. Gas utilities generally earn profits through a regulated rate of return based on theircosts of providing local transportation for the gas and related services.
25On the basis of this example, a customer choice program that resulted in a 10-percent annual savingsfor a residential customer on the cost of gas, as well as on transportation and storage costs beforelocal distribution, would amount to about $40, or about $3.35 a month, for the customer.
26Firm service is defined as gas sold or transported with an obligation for delivery.
GAO/RCED-99-30 Customer Choice ProgramsPage 20
B-281423
In contrast to gas utilities, gas marketers have more flexibility to servetheir customers through a mix of firm and interruptible27 capacitycontracts. In addition, gas marketers can buy capacity released from gasutilities through a secondary market,28 at rates lower than those paid bythe gas utilities. Several gas marketers told us they believe that they candeliver gas reliably and at less cost than gas utilities through thesecontracting methods. Some gas utility representatives and state regulatorsquestion, however, whether gas marketers have contracted for sufficientcapacity to ensure the reliable delivery of gas during periods of peakdemand. Because of gas utilities’ obligation to serve, they may not have theflexibility to contract for short-term capacity that gas marketers have.
Figure 3 also highlights the fact that the relative size of these costcomponents can limit the amount of potential customer savings. The coststructure shown in figure 3 varies regionally, depending upon the need forinterstate transportation and gas storage. Small-volume gas users insouthwestern states pay low interstate transportation and storage costsbecause of the proximity of gas-producing fields. In these states, anysignificant price competition is likely to be limited to the pricing of gasamong gas marketers. However, in midwestern and eastern states,interstate transportation and storage costs can amount to a significantportion of a gas bill, making competition on this portion of a gas bill alarger source of potential savings. For example, Bay State Gas Company inMassachusetts estimates that its residential customers pay about $293annually for the natural gas itself and nearly $271 annually for theinterstate transportation and storage of the gas prior to its localdistribution and consumption.
Utilities Report Savings onUpstream Capacity
Eleven gas utilities in our survey responded that customer choiceprograms achieved some savings for customers because gas marketershave lower upstream transportation and storage costs than do gas utilities.However, gas utilities were unsure of the amount of savings resulting fromthese lower costs, given the unavailability of information on gas
27Interruptible service is defined as a low-priority service subject to interruption when necessary toserve the needs of firm customers or higher-priority interruptible customers.
28In 1992, FERC Order 636 allowed, among other things, the holders of firm capacity contracts torelease capacity back to pipeline companies for resale to others. At that time, the price of resales ofpipeline capacity contracts in the secondary market were capped at regulated tariff rates, which meantthat the price paid in the secondary market would not exceed what the gas utility had paid for thecapacity, even during peak-use periods. In an Aug. 1998 notice of proposed rulemaking, FERCproposed to remove this price cap for the resales of short-term (less than 1-year) capacity contracts.FERC concluded that the price cap on released capacity had given gas utilities a disincentive to releasecapacity in this market. Several gas marketers, gas utilities, and state regulators told us that federalaction to release the cap will enhance the efficiency of the secondary market, thereby leading topotentially greater cost savings and possible gains in reliability.
GAO/RCED-99-30 Customer Choice ProgramsPage 21
B-281423
marketers’ sources of savings. Of the 38 gas utilities in our survey, 26 allowfor savings on upstream capacity because they allow gas marketers tocontract, at least in part, for their own transportation services. Elevenother gas utilities in our survey do not allow gas marketers to contract fortheir own transportation services. These utilities require gas marketers touse transportation services previously contracted for by the utilities.29 Inthese instances, the gas marketer is required to take this capacity at fullregulated rates and use it to deliver the gas to the gas utility.30 (See tableI.4 in app. I for a listing of customer choice programs’ rules regarding thetreatment of upstream capacity.)
As noted earlier, requiring gas marketers to use upstream capacitypreviously contracted for by gas utilities is likely to mean lower potentialsavings for customer choice participants. Gas marketers told us thatrequiring them to use the gas utility’s existing upstream transportationservices at full regulated rates forces them to copy the utility’s gas serviceand limits their ability to offer savings to customers. Gas marketers told usthat when they arrange for their own upstream capacity, they can use adiverse portfolio of upstream capacity contracts, including firm,interruptible, and secondary market contracts. As a result, they told us,they can transport gas to customers at lower costs than gas utilities.
Several gas utilities and state regulators told us that if they allow gasmarketers to contract for their own transportation services, gas utilitiesmay be unable to recover part of the cost of existing upstream capacitycontracts. Gas utilities negotiated many of these contracts on the basis ofestimated volumes and use patterns for existing and future customersprior to the beginning of customer choice programs. Customer choiceprograms that allow marketers to contract for their own transportationservices can result in gas utilities’ having smaller customer bases torecover their upstream capacity contracts. In other words, gas utilitiesmust still pay for the upstream capacity contracts they were required topurchase to serve gas customers that no longer buy their gas andtransportation services from them. This can result in inequities if gasutilities recover the costs of capacity contracts from only those customers
29Also referred to as mandatory capacity assignment.
30Gas utilities are tied to long-term contracts with interstate pipeline companies at the cost-of-serviceregulated rates. These contracts can limit flexibility in bringing the lowest-cost gas to the city gate withthe lowest upstream capacity costs. Even if a choice program does not require mandatory assignment,it may limit marketers’ options by specifying limited receipt and delivery points for bringing gas to thecity gate.
GAO/RCED-99-30 Customer Choice ProgramsPage 22
B-281423
currently using upstream transportation services contracted for by theutilities.31
In many cases, gas utilities charge their customers a surcharge in order torecover costs associated with their customer choice programs. Thesecosts may include program implementation costs, such as advertising andcustomer education expenses, and unused upstream capacity. Nineteengas utilities in our survey charge their customers a surcharge in order torecover these costs. Table I.5 in appendix I identifies whether gas utilitiescharge customers to recover transition costs resulting from customerchoice programs. Importantly, such charges are often applied to allcustomers that use the gas utility’s local distribution service, whether theyparticipate in a customer choice program or not. This can result in anincreased cost for gas service for those customers not participating incustomer choice programs.
Utilities Report Savings on theCost of Gas
Nine gas utilities in our survey responded that customer choice programsachieve some cost savings because gas marketers may be able to buy gasmore cheaply than gas utilities can. One respondent noted that gasmarketers are also more likely to purchase futures contracts32 for gas,which can minimize swings in the price of the fuel. Many gas utilities donot use these contracts when purchasing natural gas supplies partlybecause of concerns that state regulators will not allow them to recoverfutures trading costs. As noted earlier, other gas utility representatives andgas marketers have told us that savings on the cost of gas itself are likelyto be small because gas utilities, like marketers and other major gaspurchasers, can buy gas at competitive prices.
Savings Due to Tax Avoidance Sales taxes and other business taxes differ from state to state and mayeven vary by locality. The amount of tax savings would also varyconsiderably. Gas utilities in seven states—Illinois, Maryland, Michigan,New Jersey, New Mexico, New York, and Pennsylvania—reported to usthat sales of natural gas by gas marketers were subject to fewer state taxesthan gas sales by local gas utilities. Thus, to the extent they paid lowertaxes, gas marketers were able to offer residential and small commercialcustomers natural gas at a lower price than the local gas utility in thesestates.
31Inequities can be mitigated in the short run by selling unused capacity via the secondary market. Inthe long run, upstream capacity can be “turned back” to pipeline companies when capacity contractsexpire.
32Futures contracts allow the purchasers of a commodity (natural gas) to lock in a purchase price atsome point in the future. These contracts can be used to guard against unforeseen price increases inthe commodity.
GAO/RCED-99-30 Customer Choice ProgramsPage 23
B-281423
In Pennsylvania, local gas utilities pay a 5-percent gross receipts tax onboth the cost of gas and their local delivery charge. Gas utilities and otherbusinesses pass this tax on to consumers and often itemize it on theirmonthly bills. According to gas utility representatives in Pennsylvania, ifcustomers purchase gas from gas marketers that do not do business inPennsylvania or that are not regulated by the state’s Public UtilityCommission, they avoid the tax on both the cost of gas and the deliverycharge. We were told this tax is avoided even though the local gas utilitycharges for local gas delivery whether customers buy the gas from a gasmarketer or the utility. A state regulatory official told us that gasmarketers are passing this tax savings along to program customers, andthis tax savings may amount to more than half of the savings in some ofthe Pennsylvania programs.
In Maryland, gas companies pay a 2-percent gross receipts tax on both thecost of gas and the utilities’ delivery charge. However, according to gasutility representatives in Maryland, when customers purchase gas from agas marketer not subject to the Maryland gross receipts tax, they avoid thetax on the cost of gas but still pay the tax on the utility’s local deliverycharge. In Michigan, the reverse was reported by a gas utility.
In New York, local sales taxes can affect the amount of savings thatparticipants can expect in a customer choice program. Residentialparticipants in Brooklyn Union Gas’s two programs pay different salestaxes because of local sales tax differences between counties. Thesedifferences can range from 1 to 4 percent on the cost of gas and the localdelivery charge. In Illinois, a gas utility representative reported that gasmarketers’ sales are exempt from the state sales tax.
Until a 1998 tax change, New Jersey residential customers avoided thestate’s 13.5-percent gross receipts and franchise tax by purchasing gasfrom a gas marketer rather than a gas utility. Beginning in January 1998,New Jersey replaced this tax with separate taxes that applied equally togas sales from nonutilities and utilities.
As happened in New Jersey, other states may close gaps in tax treatmentbetween utilities’ and gas marketers’ gas sales in order to preclude the lossof tax revenues. According to state regulators we spoke with, it is unlikelythat differential tax treatment will continue to be a significant source ofsavings in customer choice programs. For the Columbia Gas of Ohioprogram, the gas utility itself structured its local distribution charges to
GAO/RCED-99-30 Customer Choice ProgramsPage 24
B-281423
customers to effectively equalize the tax burden for all customers, whetherthey purchased gas from the utility or a gas marketer.
Many Marketing AffiliatesHave Large Market Shares
In many states, state regulators permit gas utilities to create their own gasmarketers, called marketing affiliates, to compete with other nonutility gasmarketers for customers in customer choice programs.33 These marketingaffiliates are wholly or partly owned by the gas utility or its parentcompany. For several customer choice programs that we surveyed, thesemarketing affiliates had large market shares, raising concerns among stateregulators about how competitive these programs are and thus theirpotential to reduce prices. Of the 38 utilities that responded to our survey,33 had marketing affiliates that offer gas services, while 5 did not havemarketing affiliates. Of the 33 gas utilities with marketing affiliates, severalhad substantial customer participation, largely because of the customersign-ups initiated by the marketing affiliates.
For instance, the concentration of the affiliates’ market share has beenrelatively high in three of the four Pennsylvania residential customerchoice programs. The affiliate for the Equitable Gas residential choiceprogram served all 42,000 residential customers participating in the gasutility’s choice program as of August 31, 1998. As of July 31, 1998, thePeoples Natural Gas affiliate served 79 percent of all residential customersparticipating in the utility’s program. As of September 10, 1998, theNational Fuel Gas affiliate served 63 percent of all residential customersparticipating in the utility’s program. These choice programs account for asignificant portion of residential customers’ participationnationwide—159,000, or 27 percent, of residential participants in customerchoice programs. Only the affiliate for the Pennsylvania Columbia Gasprogram did not have the largest market share.
Another large customer choice program with a relatively high affiliatemarket share is the East Ohio Gas choice program. For this program, theEast Ohio Gas marketing affiliate served 83 percent of the 32,000participating residential customers as of March 31, 1998. All the programsmentioned above that have high market concentrations also require thatgas marketers use the gas utility’s existing upstream transportation andstorage. The marketing affiliate in the fourth Pennsylvania program—theColumbia Gas of Pennsylvania program—had only the third largest marketshare among marketers in the program, and the program allows marketers
33FERC also prescribes standards of conduct applicable to transactions between interstate pipelinecompanies and their marketing affiliates.
GAO/RCED-99-30 Customer Choice ProgramsPage 25
B-281423
the option of using the gas utility’s existing upstream transportation andstorage or contracting for their own.
In our review of the three Ohio customer choice programs, we found theonly program that required gas marketers to use the gas utility’s existingupstream transportation and storage—the East Ohio Gas program—alsohad the highest market concentration by its affiliate. The two other Ohioprograms—the Cincinnati Gas and Electric program and the Columbia Gasof Ohio program—gave gas marketers the option to use the gas utility’sexisting upstream transportation and storage or to contract for their own.
Anticompetitive factors are a concern among state regulators weinterviewed. Gas marketers and regulators have raised concerns about themarketing affiliates of gas utilities operating in their parent company’sservice area. Concerns include the potential for a gas utility to subsidize itsaffiliate with rate-payer funds or to extend to its affiliate preferentialtreatment over other marketers for any services or information. In manystates, regulators have instituted affiliate rules or codes of conduct aimedat preventing and penalizing abuses in relationships between gas utilitiesand their affiliates.
Gas Utilities Report SomeProblems With Marketers’Reliability and Behavior
Three gas utilities in our survey reported reliability problems withmarketers, and 11 gas utilities reported problems with marketers’ conduct.In one case, the problem reported was a failure by a gas marketer todeliver gas to the gas utility for local distribution when required.
While some gas utilities reported few reliability problems with gasmarketers’ deliveries, some utilities and state regulators noted thatcustomer choice programs are less than 3 years old and the reliability ofgas marketers’ deliveries has yet to be tested. A study by the staff of thePublic Utility Commission of Ohio (PUCO) found that while marketersdemonstrated their ability to deliver directed quantities of gas to city gatesduring the 1997-98 winter, that winter was unseasonably warm, andmarketers’ ability to supply quantities of gas at or above peak conditionswas not tested. The report concluded that because of limited information,the PUCO staff could not state with any certainty that marketers’ ability todeliver daily quantities under severe weather conditions would mirrortheir performance during the 1997-98 winter.34
34Staff Evaluation of Ohio’s Natural Gas Customer Choice Programs: Columbia Gas of Ohio, East OhioGas, and Cincinnati Gas and Electric Companies, submitted by the staff of PUCO (May 1998).
GAO/RCED-99-30 Customer Choice ProgramsPage 26
B-281423
While some gas utilities have concerns about gas marketers’ reliability,particularly if gas marketers are allowed to arrange for their owntransportation of gas to a utility’s city gate, gas utilities can useenforcement mechanisms to ensure the reliability of service. All of the gasutilities responding to our survey reported that they have the authority toeither suspend marketers from programs or levy penalties on marketersfor failing to deliver gas according to set delivery schedules.
In addition to the mechanisms available to gas utilities to ensure gasmarketers’ reliability, the emergence of a secondary market for releasedcapacity gives gas marketers access to pipeline transportation. As notedearlier, in 1992, FERC issued Order 636, which, among other things, allowedholders of firm capacity reservations to release unused capacity back topipeline companies for resale to others. While this market has beensomewhat limited because of a FERC-required price cap on the resales ofpipeline contracts, FERC has recently proposed to remove this price cap. Ina May 1998 report, DOE concluded that “the unused capability of theinterstate pipeline system for transportation service appears to besubstantial.”35 DOE reported that during the 1996-97 heating year,37 percent of the nation’s gas pipeline system capacity went unused.
Gas Marketers OfferCustomers AdditionalService Options
Thirty-one gas utilities in our survey responded that gas marketers wereoffering residential and small commercial customers additional servicechoices. Most of these choices provide residential and small commercialgas users with an opportunity to reduce their exposure to wide swings inthe price of gas. Among the service choices, gas marketers most oftenoffered customer choice participants the option of buying their gas at afixed price—30 of the 31 utilities responding to our survey. Six gas utilitiesresponded that gas marketers were offering customers the option of afixed monthly bill. Gas utilities also noted that gas marketers were offeringcustomers nongas services, such as free carbon monoxide detectors andthe option to buy electricity and other fuels, such as propane and fuel oil.For 27 of the programs we surveyed, gas marketers were allowed to billthe customer directly for marketer-provided services.
Observations Competition for residential and small commercial natural gas users isgradually emerging in the United States. Regulators, gas utilities, and gasmarketers are currently experimenting with ways to create small-volumecustomer choice programs that attract gas marketers, offer savings to
35Deliverability on the Interstate Natural Gas Pipeline System, (DOE/EIA-0618(98), May 1998).
GAO/RCED-99-30 Customer Choice ProgramsPage 27
B-281423
customers, and ensure the reliability of service. While efficient,competitive programs that fully tap the potential for customer savings andensure reliable service are taking time to develop, the speed of thisdevelopment may be sensitive to certain key features of program design.Key program design features include customer education efforts, theremoval of barriers to entry for gas marketers, and the arrangement of theupstream transportation of gas that increases the potential for customersavings while ensuring reliability. Given geographical limitations and thesavings already achieved through past deregulation efforts, some gasutilities, state regulators, and state legislatures may struggle with ways tofind additional savings for customers. However, in other states,opportunities for savings exist, and collaborative efforts among regulators,utilities, and marketers in a few programs have shown that key designfeatures can be successfully addressed. Competition for residential andsmall commercial gas users may also provide an incentive for thoseutilities wishing to continue selling natural gas to find ways to reduce theprices they charge and offer additional services. In this way, even thosecustomers choosing not to switch to marketers may benefit.
Customer choice programs provide gas utilities with the opportunity toposition themselves for a more competitive environment. Some observersbelieve that the changing regulatory environment and competition acrossenergy markets will favor utility companies that are creating energymarketing affiliates or forging alliances with other complementary energycompanies.
Agency Comments We provided the Department of Energy with a copy of a draft of this reportfor review and comment. We met with the Director and staff of the NaturalGas Division, Energy Information Agency, as well as staff of the PolicyOffice, to obtain the Department’s comments. The Department agreed withthe facts presented and provided some technical clarifications whereappropriate. The Department’s comments are presented in appendix III.
Scope andMethodology
Through interviews with industry experts at DOE, AGA, and local gasutilities, we determined there were 43 gas utilities that offered customerchoice programs for residential and/or small commercial gas users. Toidentify the initial experiences of competition in retail gas markets and toidentify the impacts of these initiatives on small-volume customers, wesurveyed all natural gas utilities in the United States that had customerchoice programs under way as of July 31, 1998, for residential or small
GAO/RCED-99-30 Customer Choice ProgramsPage 28
B-281423
commercial customers. We designed and mailed a questionnaire to all 43utilities that covered areas of customers’ and gas marketers’ participation,the regulation of gas marketers, customer savings, and quality of service.We surveyed gas utilities because they were the most available source ofinformation for the rules of customer choice programs and the levels ofcustomer’s and gas marketers’ participation.
We received responses from 38 of the 43 gas utilities. Informationpresented in the report on customers’ and gas marketers’ participation,program rules, and projected customer savings are based on these 38responses. The results of the survey are shown in appendix II. In addition,we conducted follow-up telephone interviews with questionnairerespondents to clarify and add to the information gathered in thequestionnaires.36
In addition to the questionnaire, we conducted case studies on individualprograms in Ohio, Massachusetts, and New Mexico. We reviewedcustomer choice programs in Ohio because industry observers noted thatthe state had among the most developed programs in the country. Weselected programs in New Mexico and Massachusetts for review becauseof their proximity to, and long distance from, natural gas production areas,respectively. We interviewed natural gas utility officials, gas marketers,state regulators, and industry experts in these states. We also reviewedexisting evaluations of gas utility customer choice programs from stateregulators, DOE’s Energy Information Agency, and AGA.
We performed our review from March through November 1998 inaccordance with generally accepted government auditing standards.
As arranged with your offices, we will send copies of this report to theappropriate Senate and House committees. We will also make copiesavailable to others on request.
36Thirty-four of the 38 gas utilities responding reported they had residential customer choice programsunder way as of July 31, 1998.
GAO/RCED-99-30 Customer Choice ProgramsPage 29
B-281423
Please call me at (202) 512-3841 if you have any questions about thisreport. Major contributors to this report are listed in appendix IV.
Susan D. KladivaAssociate Director, Energy, Resources, and Science Issues
GAO/RCED-99-30 Customer Choice ProgramsPage 30

GAO/RCED-99-30 Customer Choice ProgramsPage 31
Contents
Letter 1
Appendix I Selected Results FromSurvey Questionnaire
34
Appendix II Customer ChoiceSurvey and Results
45
Appendix II Customer ChoiceSurvey and Results
46
Appendix III Comments From theDepartment of Energy
61
Appendix IV Major Contributors toThis Report
63
Tables Table 1: Overview of Residential Customer Choice Programs inthe United States
12
Table I.1: Participation in Residential Customer Choice Programs 34 Table I.2: Participation in Small Commercial Customer Choice
Programs37
Table I.3: Gas Marketers’ Participation in Customer ChoicePrograms
39
Table I.4: Natural Gas Utility Treatment of Upstream Capacity inCustomer Choice Programs
41
Table I.5: Natural Gas Utility Treatment of Transitional CostsResulting From Customer Choice Programs
43
GAO/RCED-99-30 Customer Choice ProgramsPage 32
Contents
Figures Figure 1: Natural Gas Delivery System From the Wellhead to theBurner Tip
5
Figure 2: Small-Volume Natural Gas Customer Choice Programsin the United States
10
Figure 3: Annualized Costs in a Residential Gas Bill—ColumbiaGas of Ohio
19
Abbreviations
AGA American Gas AssociationDOE Department of EnergyEIA Energy Information AgencyFERC Federal Energy Regulatory CommissionGAO General Accounting Officemcf 1,000 cubic feet of gasPUCO Public Utility Commission of Ohio
GAO/RCED-99-30 Customer Choice ProgramsPage 33
Appendix I
Selected Results From Survey Questionnaire
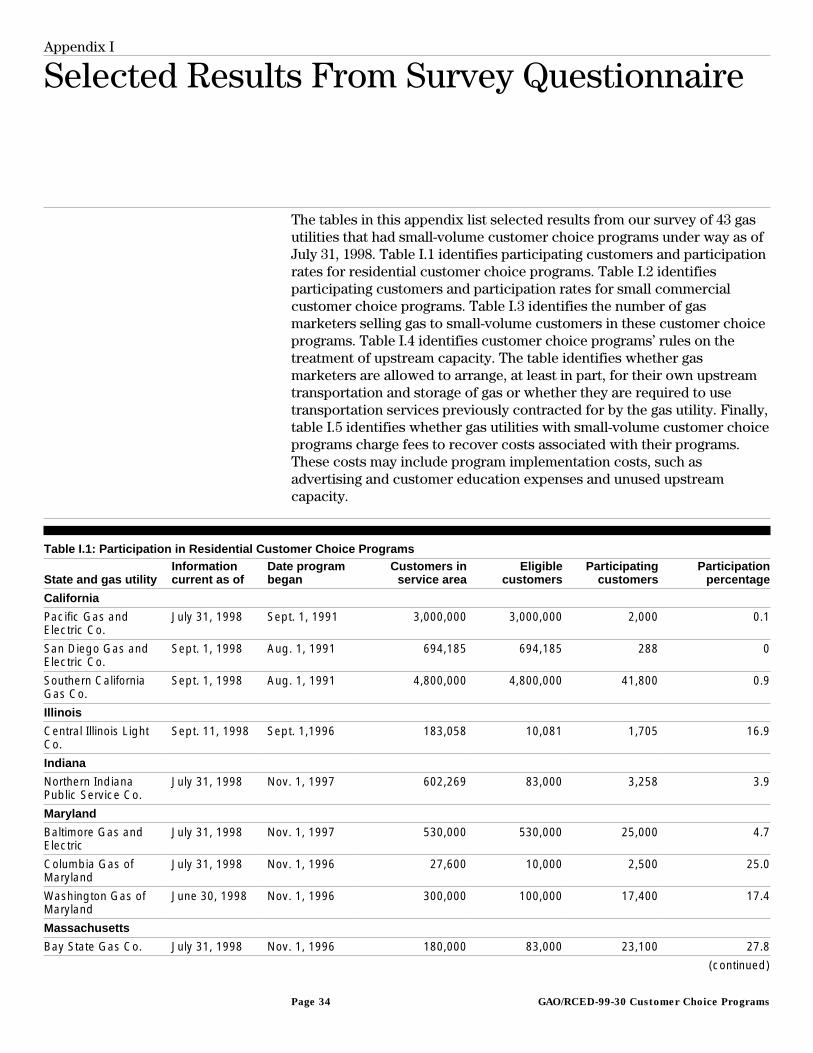
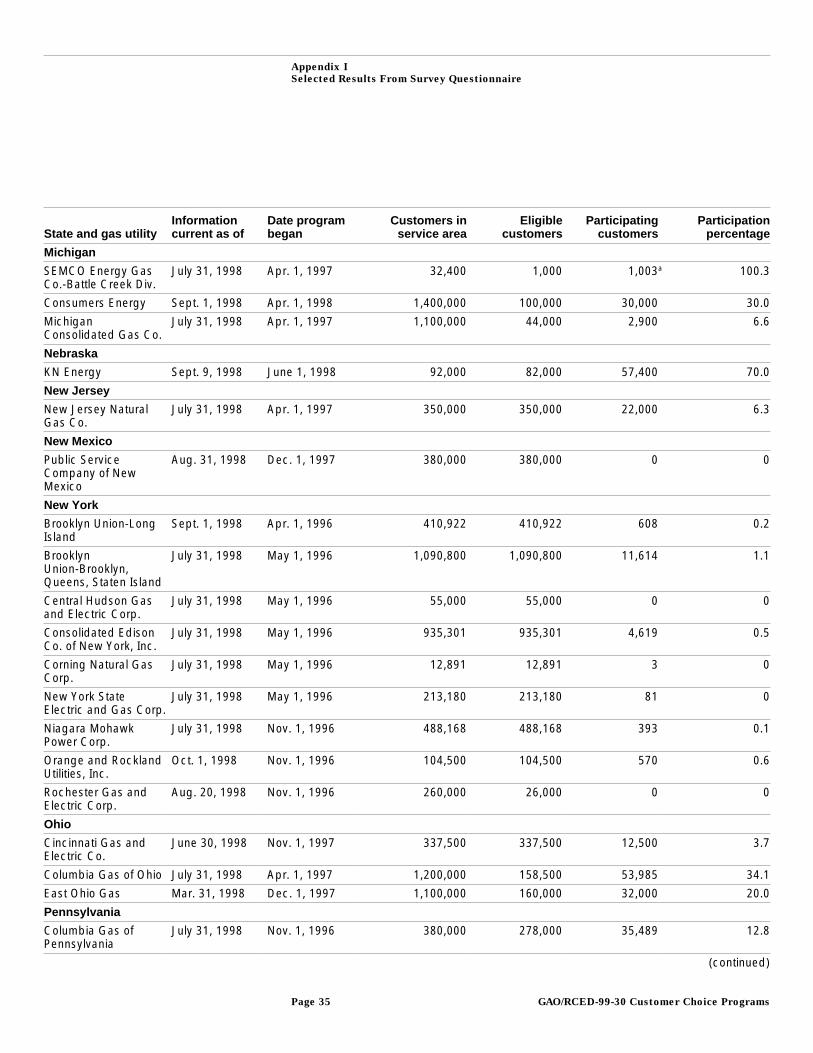
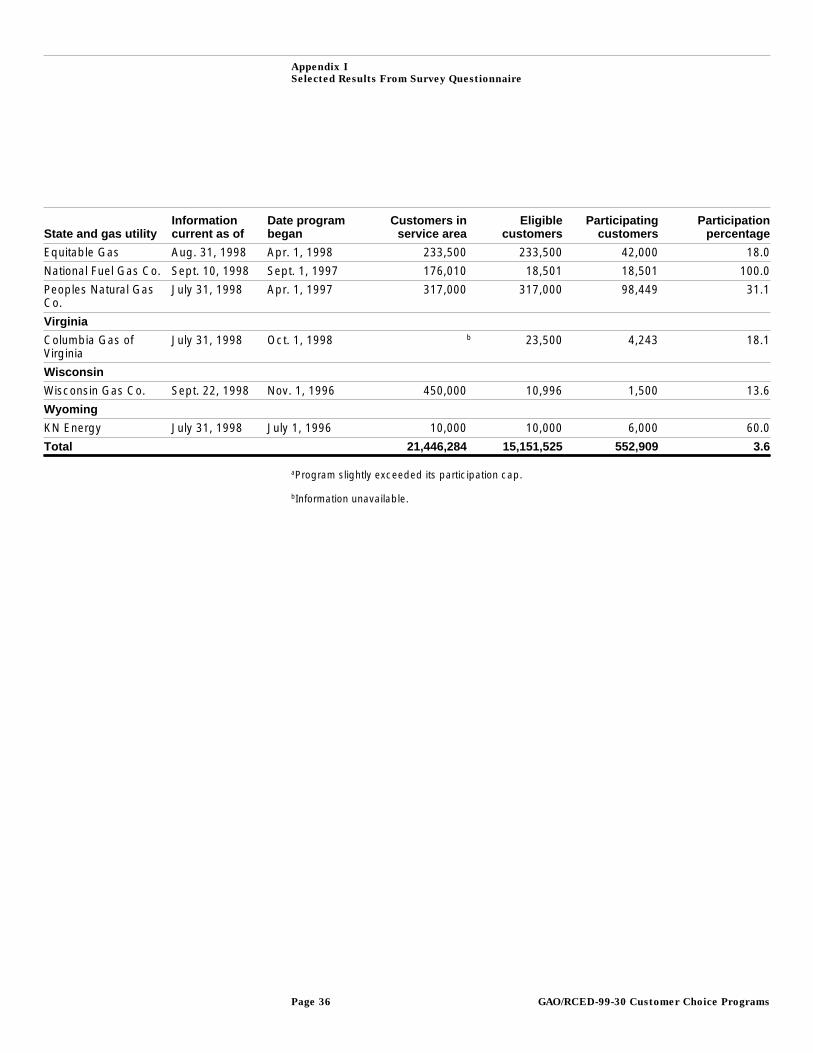
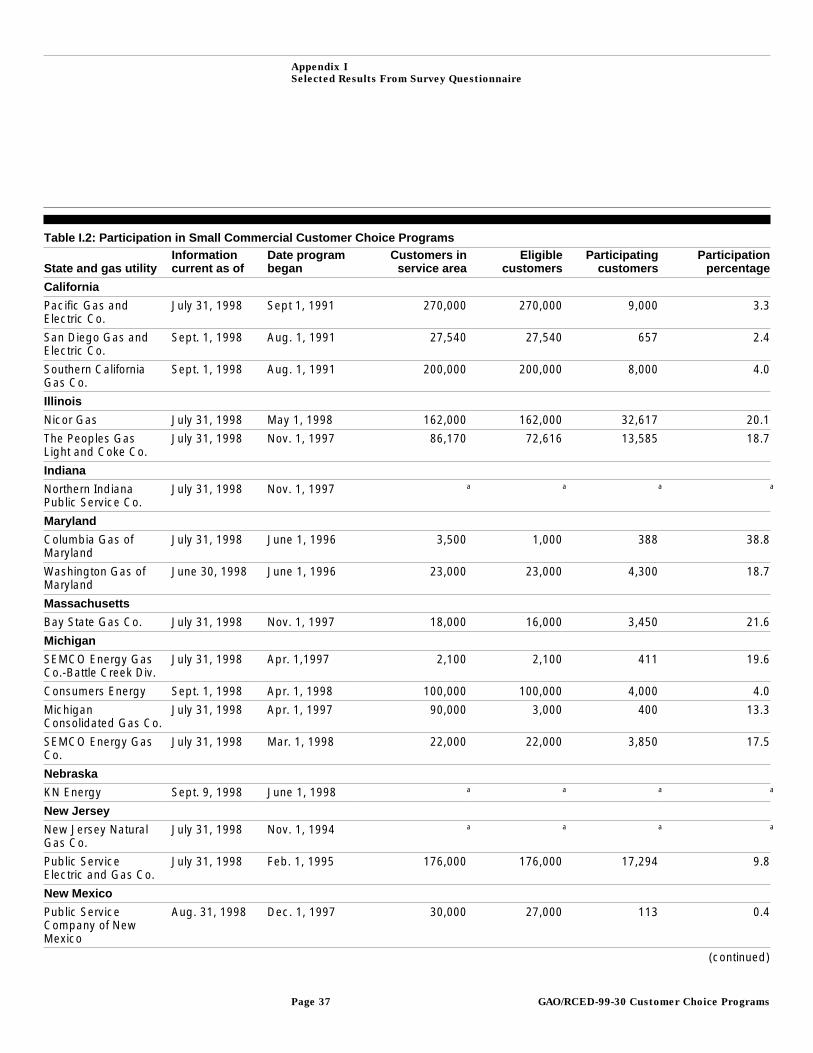
The tables in this appendix list selected results from our survey of 43 gasutilities that had small-volume customer choice programs under way as ofJuly 31, 1998. Table I.1 identifies participating customers and participationrates for residential customer choice programs. Table I.2 identifiesparticipating customers and participation rates for small commercialcustomer choice programs. Table I.3 identifies the number of gasmarketers selling gas to small-volume customers in these customer choiceprograms. Table I.4 identifies customer choice programs’ rules on thetreatment of upstream capacity. The table identifies whether gasmarketers are allowed to arrange, at least in part, for their own upstreamtransportation and storage of gas or whether they are required to usetransportation services previously contracted for by the gas utility. Finally,table I.5 identifies whether gas utilities with small-volume customer choiceprograms charge fees to recover costs associated with their programs.These costs may include program implementation costs, such asadvertising and customer education expenses and unused upstreamcapacity.
Table I.1: Participation in Residential Customer Choice Programs
State and gas utilityInformationcurrent as of
Date programbegan
Customers inservice area
Eligiblecustomers
Participatingcustomers
Participationpercentage
California
Pacific Gas andElectric Co.
July 31, 1998 Sept. 1, 1991 3,000,000 3,000,000 2,000 0.1
San Diego Gas andElectric Co.
Sept. 1, 1998 Aug. 1, 1991 694,185 694,185 288 0
Southern CaliforniaGas Co.
Sept. 1, 1998 Aug. 1, 1991 4,800,000 4,800,000 41,800 0.9
Illinois
Central Illinois LightCo.
Sept. 11, 1998 Sept. 1,1996 183,058 10,081 1,705 16.9
Indiana
Northern IndianaPublic Service Co.
July 31, 1998 Nov. 1, 1997 602,269 83,000 3,258 3.9
Maryland
Baltimore Gas andElectric
July 31, 1998 Nov. 1, 1997 530,000 530,000 25,000 4.7
Columbia Gas ofMaryland
July 31, 1998 Nov. 1, 1996 27,600 10,000 2,500 25.0
Washington Gas ofMaryland
June 30, 1998 Nov. 1, 1996 300,000 100,000 17,400 17.4
Massachusetts
Bay State Gas Co. July 31, 1998 Nov. 1, 1996 180,000 83,000 23,100 27.8
(continued)
GAO/RCED-99-30 Customer Choice ProgramsPage 34
Appendix I
Selected Results From Survey Questionnaire
State and gas utilityInformationcurrent as of
Date programbegan
Customers inservice area
Eligiblecustomers
Participatingcustomers
Participationpercentage
Michigan
SEMCO Energy GasCo.-Battle Creek Div.
July 31, 1998 Apr. 1, 1997 32,400 1,000 1,003a 100.3
Consumers Energy Sept. 1, 1998 Apr. 1, 1998 1,400,000 100,000 30,000 30.0
MichiganConsolidated Gas Co.
July 31, 1998 Apr. 1, 1997 1,100,000 44,000 2,900 6.6
Nebraska
KN Energy Sept. 9, 1998 June 1, 1998 92,000 82,000 57,400 70.0
New Jersey
New Jersey NaturalGas Co.
July 31, 1998 Apr. 1, 1997 350,000 350,000 22,000 6.3
New Mexico
Public ServiceCompany of NewMexico
Aug. 31, 1998 Dec. 1, 1997 380,000 380,000 0 0
New York
Brooklyn Union-LongIsland
Sept. 1, 1998 Apr. 1, 1996 410,922 410,922 608 0.2
BrooklynUnion-Brooklyn,Queens, Staten Island
July 31, 1998 May 1, 1996 1,090,800 1,090,800 11,614 1.1
Central Hudson Gasand Electric Corp.
July 31, 1998 May 1, 1996 55,000 55,000 0 0
Consolidated EdisonCo. of New York, Inc.
July 31, 1998 May 1, 1996 935,301 935,301 4,619 0.5
Corning Natural GasCorp.
July 31, 1998 May 1, 1996 12,891 12,891 3 0
New York StateElectric and Gas Corp.
July 31, 1998 May 1, 1996 213,180 213,180 81 0
Niagara MohawkPower Corp.
July 31, 1998 Nov. 1, 1996 488,168 488,168 393 0.1
Orange and RocklandUtilities, Inc.
Oct. 1, 1998 Nov. 1, 1996 104,500 104,500 570 0.6
Rochester Gas andElectric Corp.
Aug. 20, 1998 Nov. 1, 1996 260,000 26,000 0 0
Ohio
Cincinnati Gas andElectric Co.
June 30, 1998 Nov. 1, 1997 337,500 337,500 12,500 3.7
Columbia Gas of Ohio July 31, 1998 Apr. 1, 1997 1,200,000 158,500 53,985 34.1
East Ohio Gas Mar. 31, 1998 Dec. 1, 1997 1,100,000 160,000 32,000 20.0
Pennsylvania
Columbia Gas ofPennsylvania
July 31, 1998 Nov. 1, 1996 380,000 278,000 35,489 12.8
(continued)
GAO/RCED-99-30 Customer Choice ProgramsPage 35
Appendix I
Selected Results From Survey Questionnaire
State and gas utilityInformationcurrent as of
Date programbegan
Customers inservice area
Eligiblecustomers
Participatingcustomers
Participationpercentage
Equitable Gas Aug. 31, 1998 Apr. 1, 1998 233,500 233,500 42,000 18.0
National Fuel Gas Co. Sept. 10, 1998 Sept. 1, 1997 176,010 18,501 18,501 100.0
Peoples Natural GasCo.
July 31, 1998 Apr. 1, 1997 317,000 317,000 98,449 31.1
Virginia
Columbia Gas ofVirginia
July 31, 1998 Oct. 1, 1998 b 23,500 4,243 18.1
Wisconsin
Wisconsin Gas Co. Sept. 22, 1998 Nov. 1, 1996 450,000 10,996 1,500 13.6
Wyoming
KN Energy July 31, 1998 July 1, 1996 10,000 10,000 6,000 60.0
Total 21,446,284 15,151,525 552,909 3.6
aProgram slightly exceeded its participation cap.
bInformation unavailable.
GAO/RCED-99-30 Customer Choice ProgramsPage 36
Appendix I
Selected Results From Survey Questionnaire
Table I.2: Participation in Small Commercial Customer Choice Programs
State and gas utilityInformationcurrent as of
Date programbegan
Customers inservice area
Eligiblecustomers
Participatingcustomers
Participationpercentage
California
Pacific Gas andElectric Co.
July 31, 1998 Sept 1, 1991 270,000 270,000 9,000 3.3
San Diego Gas andElectric Co.
Sept. 1, 1998 Aug. 1, 1991 27,540 27,540 657 2.4
Southern CaliforniaGas Co.
Sept. 1, 1998 Aug. 1, 1991 200,000 200,000 8,000 4.0
Illinois
Nicor Gas July 31, 1998 May 1, 1998 162,000 162,000 32,617 20.1
The Peoples GasLight and Coke Co.
July 31, 1998 Nov. 1, 1997 86,170 72,616 13,585 18.7
Indiana
Northern IndianaPublic Service Co.
July 31, 1998 Nov. 1, 1997 a a a a
Maryland
Columbia Gas ofMaryland
July 31, 1998 June 1, 1996 3,500 1,000 388 38.8
Washington Gas ofMaryland
June 30, 1998 June 1, 1996 23,000 23,000 4,300 18.7
Massachusetts
Bay State Gas Co. July 31, 1998 Nov. 1, 1997 18,000 16,000 3,450 21.6
Michigan
SEMCO Energy GasCo.-Battle Creek Div.
July 31, 1998 Apr. 1,1997 2,100 2,100 411 19.6
Consumers Energy Sept. 1, 1998 Apr. 1, 1998 100,000 100,000 4,000 4.0
MichiganConsolidated Gas Co.
July 31, 1998 Apr. 1, 1997 90,000 3,000 400 13.3
SEMCO Energy GasCo.
July 31, 1998 Mar. 1, 1998 22,000 22,000 3,850 17.5
Nebraska
KN Energy Sept. 9, 1998 June 1, 1998 a a a a
New Jersey
New Jersey NaturalGas Co.
July 31, 1998 Nov. 1, 1994 a a a a
Public ServiceElectric and Gas Co.
July 31, 1998 Feb. 1, 1995 176,000 176,000 17,294 9.8
New Mexico
Public ServiceCompany of NewMexico
Aug. 31, 1998 Dec. 1, 1997 30,000 27,000 113 0.4
(continued)
GAO/RCED-99-30 Customer Choice ProgramsPage 37
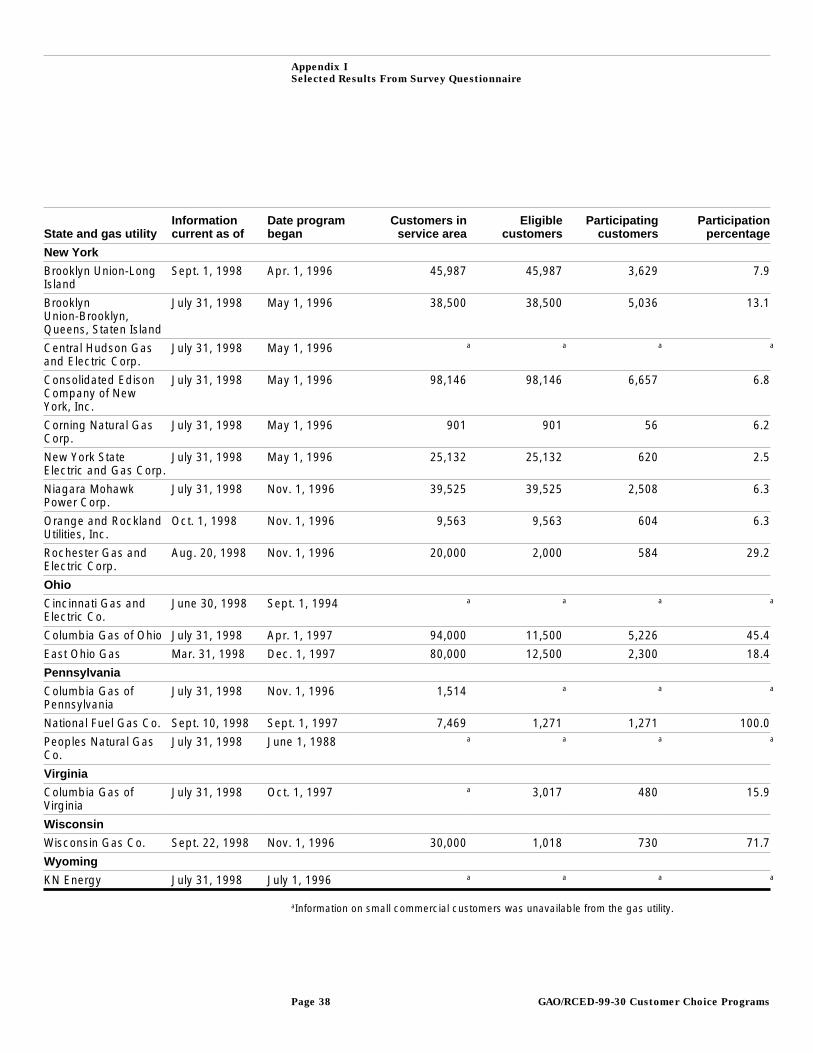
Appendix I
Selected Results From Survey Questionnaire
State and gas utilityInformationcurrent as of
Date programbegan
Customers inservice area
Eligiblecustomers
Participatingcustomers
Participationpercentage
New York
Brooklyn Union-LongIsland
Sept. 1, 1998 Apr. 1, 1996 45,987 45,987 3,629 7.9
BrooklynUnion-Brooklyn,Queens, Staten Island
July 31, 1998 May 1, 1996 38,500 38,500 5,036 13.1
Central Hudson Gasand Electric Corp.
July 31, 1998 May 1, 1996 a a a a
Consolidated EdisonCompany of NewYork, Inc.
July 31, 1998 May 1, 1996 98,146 98,146 6,657 6.8
Corning Natural GasCorp.
July 31, 1998 May 1, 1996 901 901 56 6.2
New York StateElectric and Gas Corp.
July 31, 1998 May 1, 1996 25,132 25,132 620 2.5
Niagara MohawkPower Corp.
July 31, 1998 Nov. 1, 1996 39,525 39,525 2,508 6.3
Orange and RocklandUtilities, Inc.
Oct. 1, 1998 Nov. 1, 1996 9,563 9,563 604 6.3
Rochester Gas andElectric Corp.
Aug. 20, 1998 Nov. 1, 1996 20,000 2,000 584 29.2
Ohio
Cincinnati Gas andElectric Co.
June 30, 1998 Sept. 1, 1994 a a a a
Columbia Gas of Ohio July 31, 1998 Apr. 1, 1997 94,000 11,500 5,226 45.4
East Ohio Gas Mar. 31, 1998 Dec. 1, 1997 80,000 12,500 2,300 18.4
Pennsylvania
Columbia Gas ofPennsylvania
July 31, 1998 Nov. 1, 1996 1,514 a a a
National Fuel Gas Co. Sept. 10, 1998 Sept. 1, 1997 7,469 1,271 1,271 100.0
Peoples Natural GasCo.
July 31, 1998 June 1, 1988 a a a a
Virginia
Columbia Gas ofVirginia
July 31, 1998 Oct. 1, 1997 a 3,017 480 15.9
Wisconsin
Wisconsin Gas Co. Sept. 22, 1998 Nov. 1, 1996 30,000 1,018 730 71.7
Wyoming
KN Energy July 31, 1998 July 1, 1996 a a a a
aInformation on small commercial customers was unavailable from the gas utility.
GAO/RCED-99-30 Customer Choice ProgramsPage 38
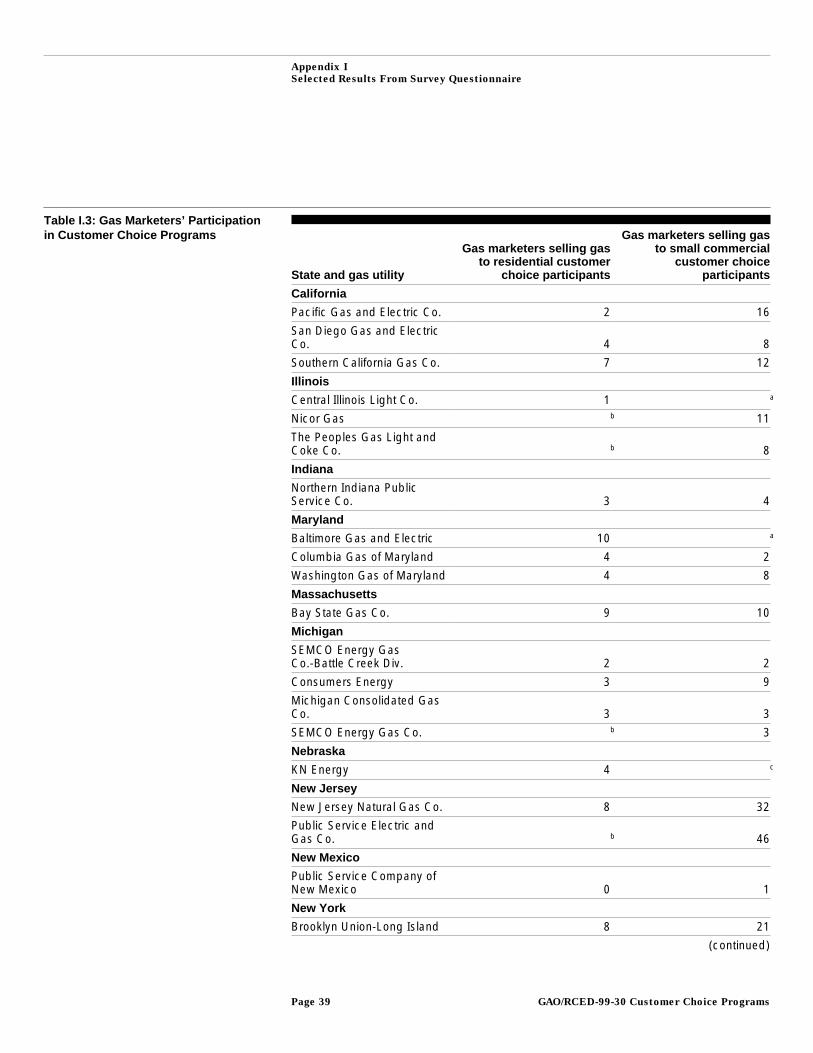
Appendix I
Selected Results From Survey Questionnaire
Table I.3: Gas Marketers’ Participationin Customer Choice Programs
State and gas utility
Gas marketers selling gasto residential customer
choice participants
Gas marketers selling gasto small commercial
customer choiceparticipants
California
Pacific Gas and Electric Co. 2 16
San Diego Gas and ElectricCo. 4 8
Southern California Gas Co. 7 12
Illinois
Central Illinois Light Co. 1 a
Nicor Gas b 11
The Peoples Gas Light andCoke Co. b 8
Indiana
Northern Indiana PublicService Co. 3 4
Maryland
Baltimore Gas and Electric 10 a
Columbia Gas of Maryland 4 2
Washington Gas of Maryland 4 8
Massachusetts
Bay State Gas Co. 9 10
Michigan
SEMCO Energy GasCo.-Battle Creek Div. 2 2
Consumers Energy 3 9
Michigan Consolidated GasCo. 3 3
SEMCO Energy Gas Co. b 3
Nebraska
KN Energy 4 c
New Jersey
New Jersey Natural Gas Co. 8 32
Public Service Electric andGas Co. b 46
New Mexico
Public Service Company ofNew Mexico 0 1
New York
Brooklyn Union-Long Island 8 21
(continued)
GAO/RCED-99-30 Customer Choice ProgramsPage 39
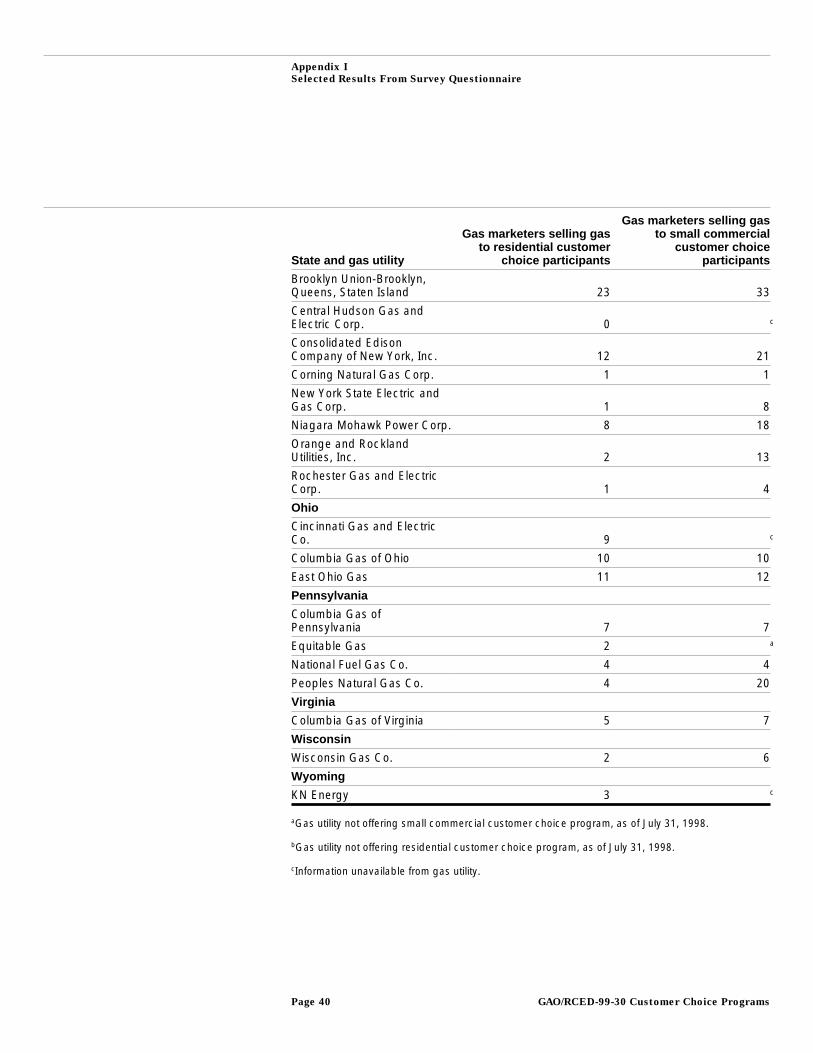
Appendix I
Selected Results From Survey Questionnaire
State and gas utility
Gas marketers selling gasto residential customer
choice participants
Gas marketers selling gasto small commercial
customer choiceparticipants
Brooklyn Union-Brooklyn,Queens, Staten Island 23 33
Central Hudson Gas andElectric Corp. 0 c
Consolidated EdisonCompany of New York, Inc. 12 21
Corning Natural Gas Corp. 1 1
New York State Electric andGas Corp. 1 8
Niagara Mohawk Power Corp. 8 18
Orange and RocklandUtilities, Inc. 2 13
Rochester Gas and ElectricCorp. 1 4
Ohio
Cincinnati Gas and ElectricCo. 9 c
Columbia Gas of Ohio 10 10
East Ohio Gas 11 12
Pennsylvania
Columbia Gas ofPennsylvania 7 7
Equitable Gas 2 a
National Fuel Gas Co. 4 4
Peoples Natural Gas Co. 4 20
Virginia
Columbia Gas of Virginia 5 7
Wisconsin
Wisconsin Gas Co. 2 6
Wyoming
KN Energy 3 c
aGas utility not offering small commercial customer choice program, as of July 31, 1998.
bGas utility not offering residential customer choice program, as of July 31, 1998.
cInformation unavailable from gas utility.
GAO/RCED-99-30 Customer Choice ProgramsPage 40
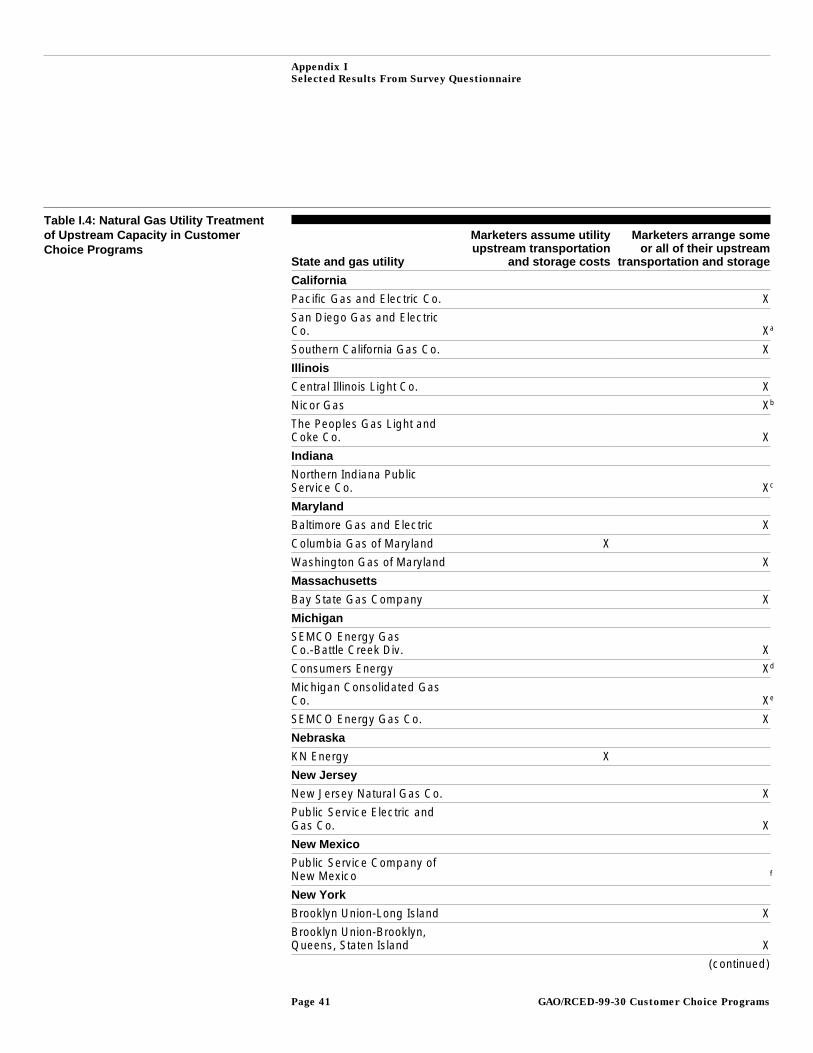
Appendix I
Selected Results From Survey Questionnaire
Table I.4: Natural Gas Utility Treatmentof Upstream Capacity in CustomerChoice Programs
State and gas utility
Marketers assume utilityupstream transportation
and storage costs
Marketers arrange someor all of their upstream
transportation and storage
California
Pacific Gas and Electric Co. X
San Diego Gas and ElectricCo. Xa
Southern California Gas Co. X
Illinois
Central Illinois Light Co. X
Nicor Gas Xb
The Peoples Gas Light andCoke Co. X
Indiana
Northern Indiana PublicService Co. Xc
Maryland
Baltimore Gas and Electric X
Columbia Gas of Maryland X
Washington Gas of Maryland X
Massachusetts
Bay State Gas Company X
Michigan
SEMCO Energy GasCo.-Battle Creek Div. X
Consumers Energy Xd
Michigan Consolidated GasCo. Xe
SEMCO Energy Gas Co. X
Nebraska
KN Energy X
New Jersey
New Jersey Natural Gas Co. X
Public Service Electric andGas Co. X
New Mexico
Public Service Company ofNew Mexico f
New York
Brooklyn Union-Long Island X
Brooklyn Union-Brooklyn,Queens, Staten Island X
(continued)
GAO/RCED-99-30 Customer Choice ProgramsPage 41
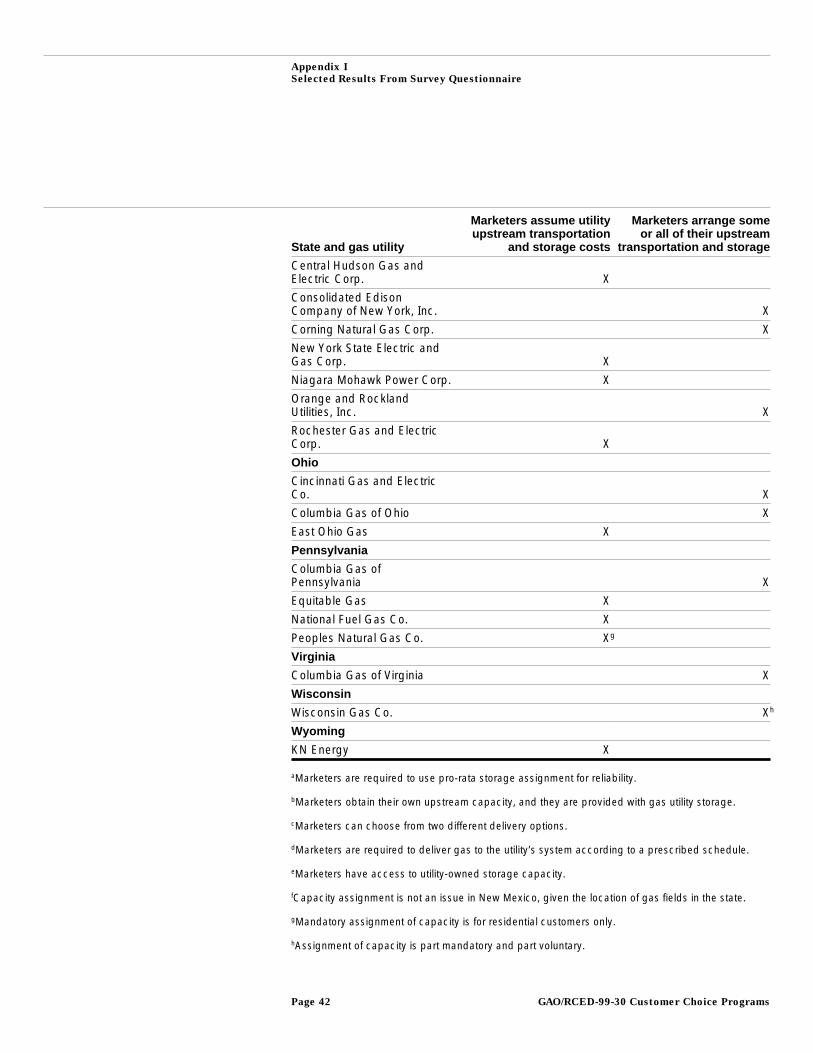
Appendix I
Selected Results From Survey Questionnaire
State and gas utility
Marketers assume utilityupstream transportation
and storage costs
Marketers arrange someor all of their upstream
transportation and storage
Central Hudson Gas andElectric Corp. X
Consolidated EdisonCompany of New York, Inc. X
Corning Natural Gas Corp. X
New York State Electric andGas Corp. X
Niagara Mohawk Power Corp. X
Orange and RocklandUtilities, Inc. X
Rochester Gas and ElectricCorp. X
Ohio
Cincinnati Gas and ElectricCo. X
Columbia Gas of Ohio X
East Ohio Gas X
Pennsylvania
Columbia Gas ofPennsylvania X
Equitable Gas X
National Fuel Gas Co. X
Peoples Natural Gas Co. Xg
Virginia
Columbia Gas of Virginia X
Wisconsin
Wisconsin Gas Co. Xh
Wyoming
KN Energy X
aMarketers are required to use pro-rata storage assignment for reliability.
bMarketers obtain their own upstream capacity, and they are provided with gas utility storage.
cMarketers can choose from two different delivery options.
dMarketers are required to deliver gas to the utility’s system according to a prescribed schedule.
eMarketers have access to utility-owned storage capacity.
fCapacity assignment is not an issue in New Mexico, given the location of gas fields in the state.
gMandatory assignment of capacity is for residential customers only.
hAssignment of capacity is part mandatory and part voluntary.
GAO/RCED-99-30 Customer Choice ProgramsPage 42
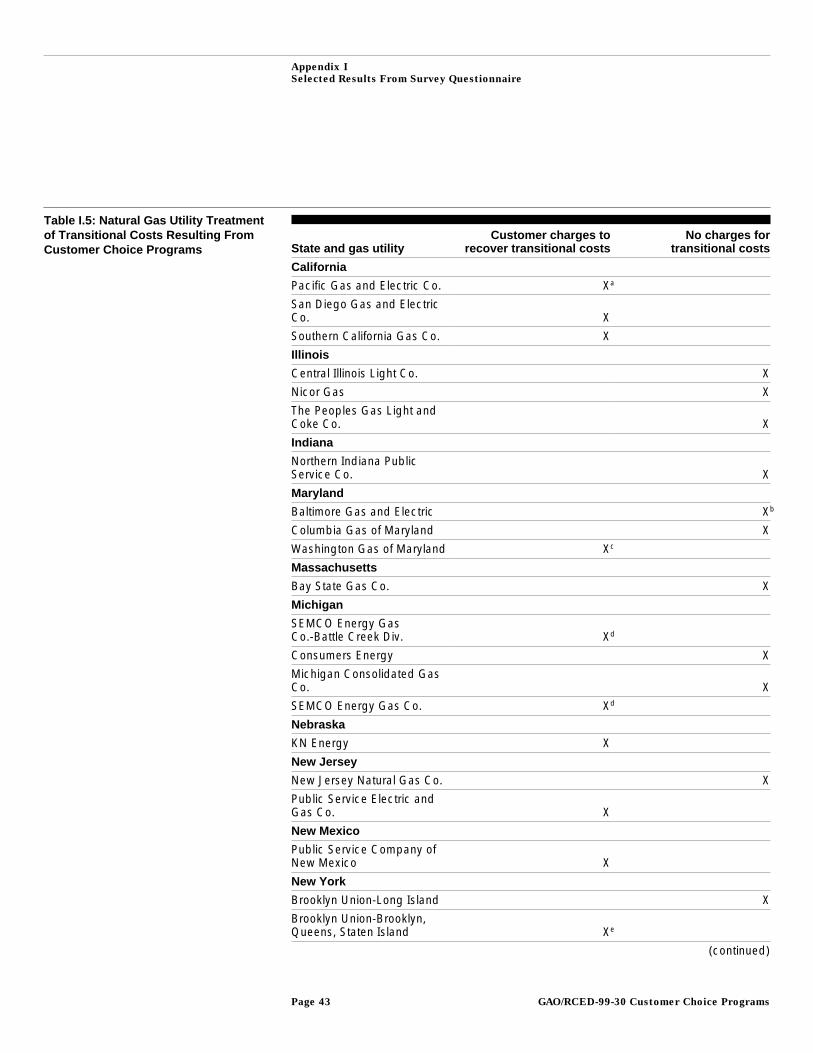
Appendix I
Selected Results From Survey Questionnaire
Table I.5: Natural Gas Utility Treatmentof Transitional Costs Resulting FromCustomer Choice Programs State and gas utility
Customer charges torecover transitional costs
No charges fortransitional costs
California
Pacific Gas and Electric Co. Xa
San Diego Gas and ElectricCo. X
Southern California Gas Co. X
Illinois
Central Illinois Light Co. X
Nicor Gas X
The Peoples Gas Light andCoke Co. X
Indiana
Northern Indiana PublicService Co. X
Maryland
Baltimore Gas and Electric Xb
Columbia Gas of Maryland X
Washington Gas of Maryland Xc
Massachusetts
Bay State Gas Co. X
Michigan
SEMCO Energy GasCo.-Battle Creek Div. Xd
Consumers Energy X
Michigan Consolidated GasCo. X
SEMCO Energy Gas Co. Xd
Nebraska
KN Energy X
New Jersey
New Jersey Natural Gas Co. X
Public Service Electric andGas Co. X
New Mexico
Public Service Company ofNew Mexico X
New York
Brooklyn Union-Long Island X
Brooklyn Union-Brooklyn,Queens, Staten Island Xe
(continued)
GAO/RCED-99-30 Customer Choice ProgramsPage 43
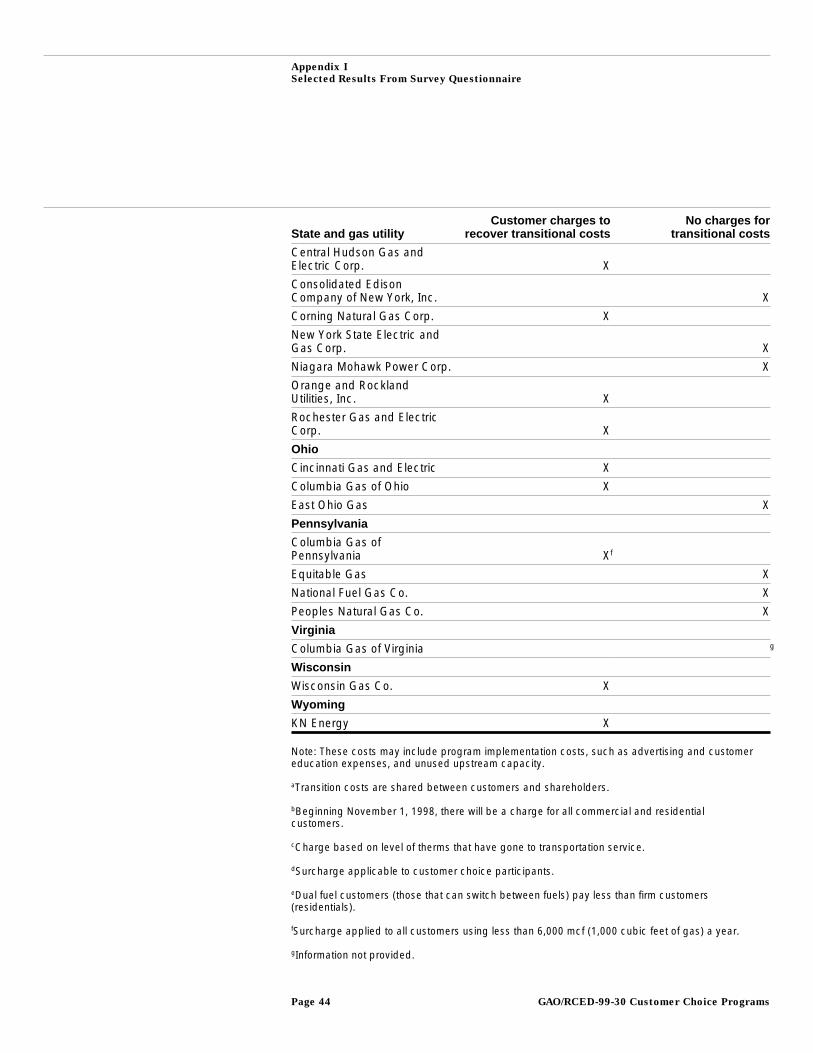
Appendix I
Selected Results From Survey Questionnaire
State and gas utilityCustomer charges to
recover transitional costsNo charges for
transitional costs
Central Hudson Gas andElectric Corp. X
Consolidated EdisonCompany of New York, Inc. X
Corning Natural Gas Corp. X
New York State Electric andGas Corp. X
Niagara Mohawk Power Corp. X
Orange and RocklandUtilities, Inc. X
Rochester Gas and ElectricCorp. X
Ohio
Cincinnati Gas and Electric X
Columbia Gas of Ohio X
East Ohio Gas X
Pennsylvania
Columbia Gas ofPennsylvania Xf
Equitable Gas X
National Fuel Gas Co. X
Peoples Natural Gas Co. X
Virginia
Columbia Gas of Virginia g
Wisconsin
Wisconsin Gas Co. X
Wyoming
KN Energy X
Note: These costs may include program implementation costs, such as advertising and customereducation expenses, and unused upstream capacity.
aTransition costs are shared between customers and shareholders.
bBeginning November 1, 1998, there will be a charge for all commercial and residentialcustomers.
cCharge based on level of therms that have gone to transportation service.
dSurcharge applicable to customer choice participants.
eDual fuel customers (those that can switch between fuels) pay less than firm customers(residentials).
fSurcharge applied to all customers using less than 6,000 mcf (1,000 cubic feet of gas) a year.
gInformation not provided.
GAO/RCED-99-30 Customer Choice ProgramsPage 44
Appendix II
Customer Choice Survey and Results
We mailed a questionnaire to 43 gas utilities that had either, or both,residential or small commercial customer choice programs under way asof July 31, 1998. The questionnaire, reprinted below, contained 41questions covering customers’ and marketers’ participation, marketers’certification and regulation, customer savings, and quality of service. Wereceived responses from 38 gas utilities.
For most of the questions in the reprinted survey, we identified thenumber of gas utilities that marked each box in each question. For thequestions on customers’ and marketers’ participation, we included theresults in the tables in appendix I and referred the reader to these tables.For some questions on marketers’ participation and the estimates ofcustomer savings, we identified the range of responses. Also, several gasutilities did not respond to all of the questions, so some questions havefewer total respondents than others.
GAO/RCED-99-30 Customer Choice ProgramsPage 45
Appendix II
Customer Choice Survey and Results
GAO/RCED-99-30 Customer Choice ProgramsPage 46
Appendix II
Customer Choice Survey and Results
GAO/RCED-99-30 Customer Choice ProgramsPage 47
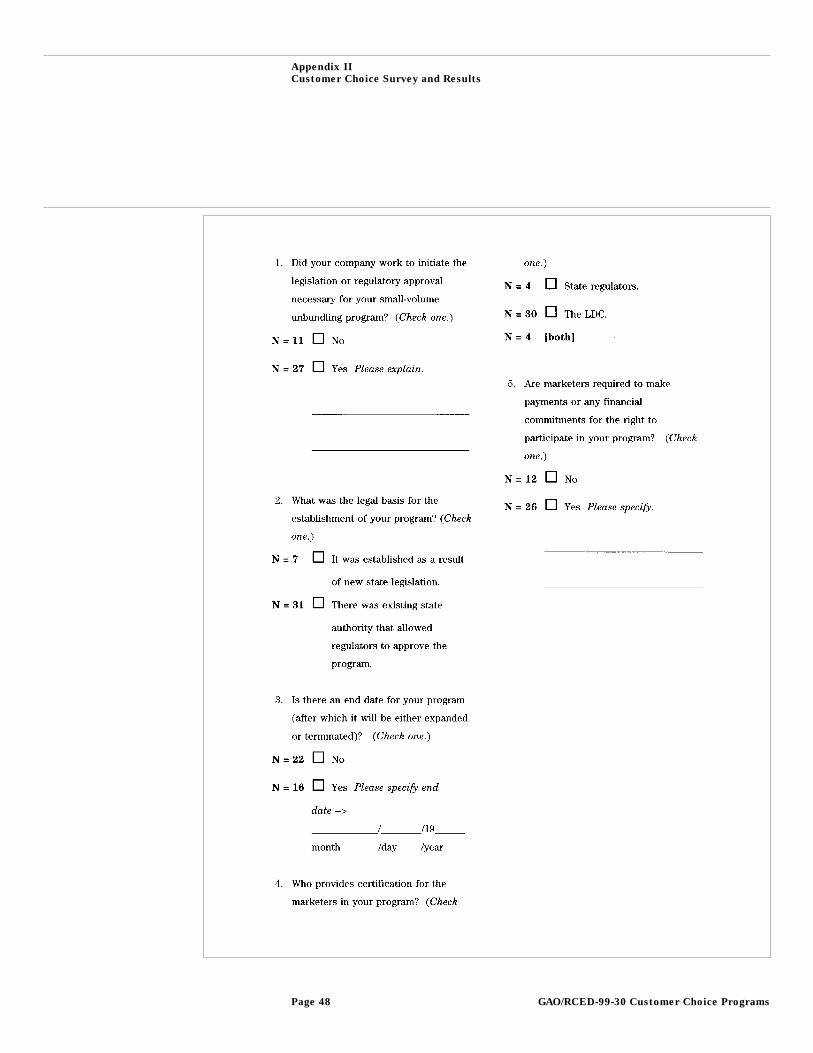
Appendix II
Customer Choice Survey and Results
GAO/RCED-99-30 Customer Choice ProgramsPage 48
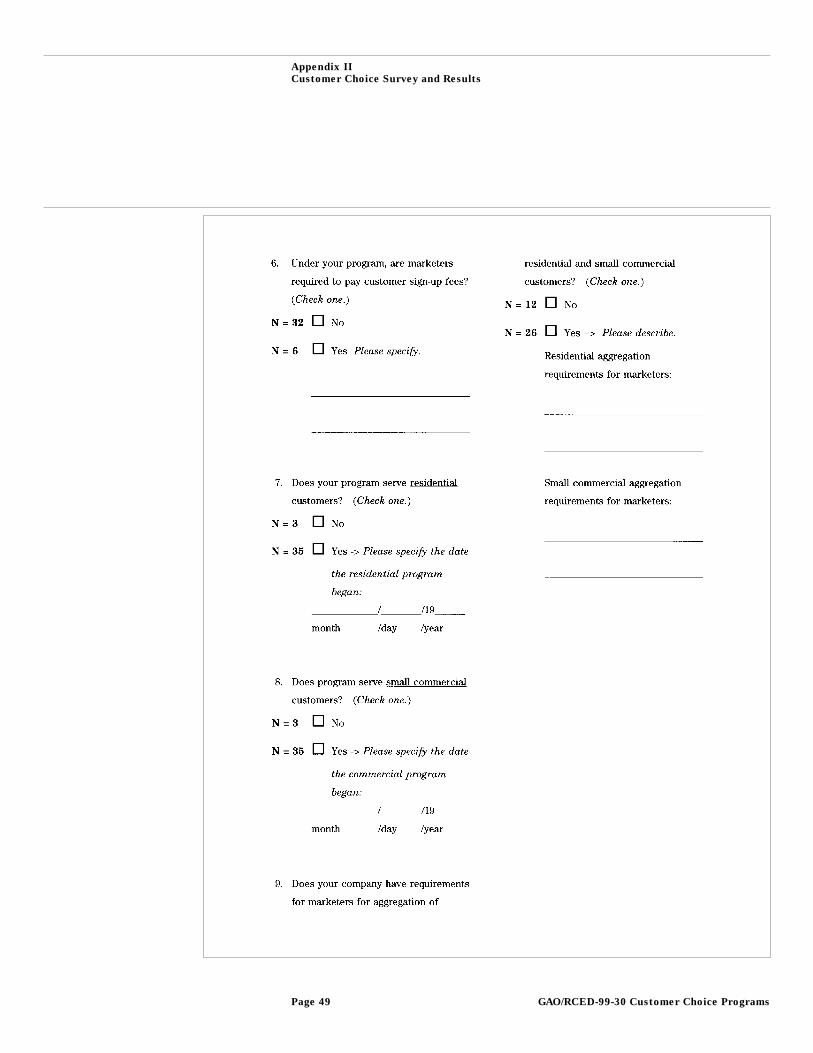
Appendix II
Customer Choice Survey and Results
GAO/RCED-99-30 Customer Choice ProgramsPage 49
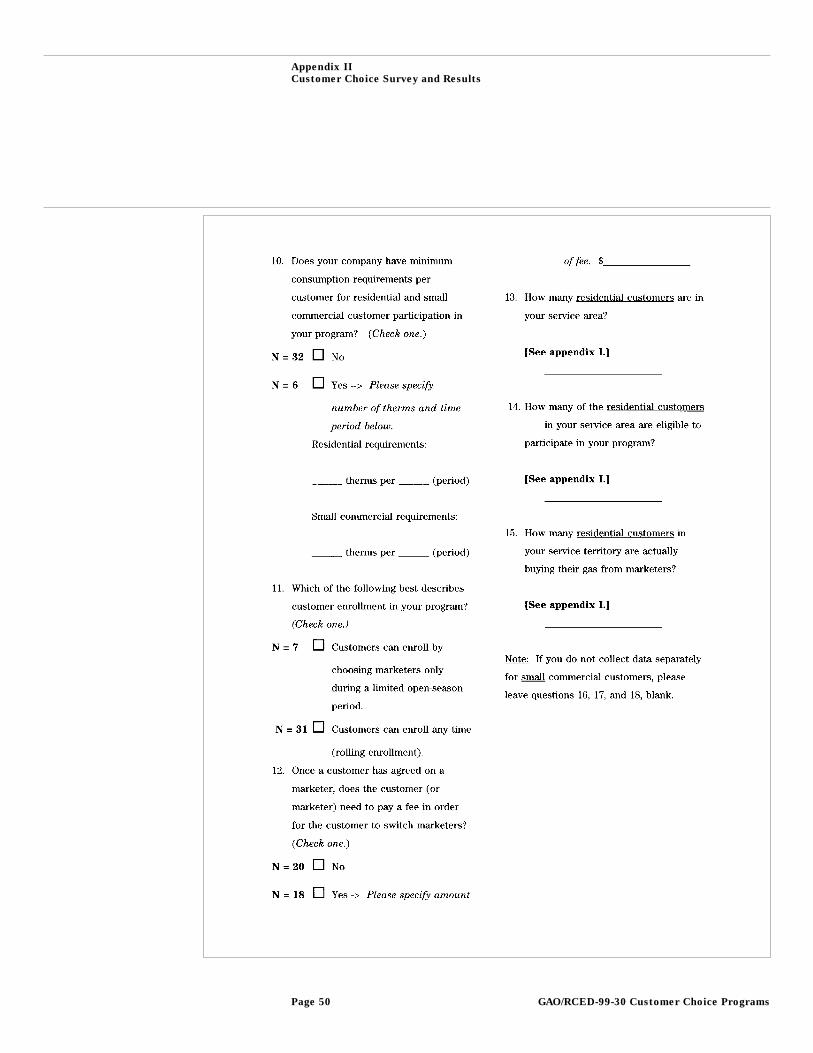
Appendix II
Customer Choice Survey and Results
GAO/RCED-99-30 Customer Choice ProgramsPage 50
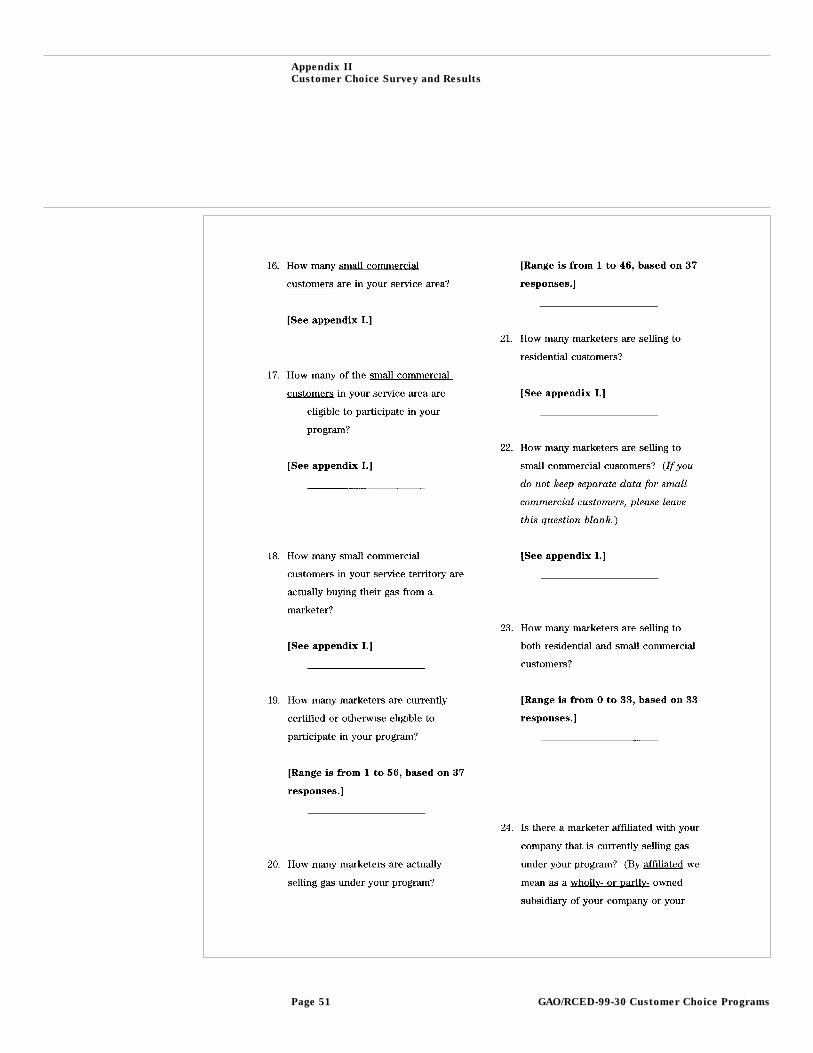
Appendix II
Customer Choice Survey and Results
GAO/RCED-99-30 Customer Choice ProgramsPage 51
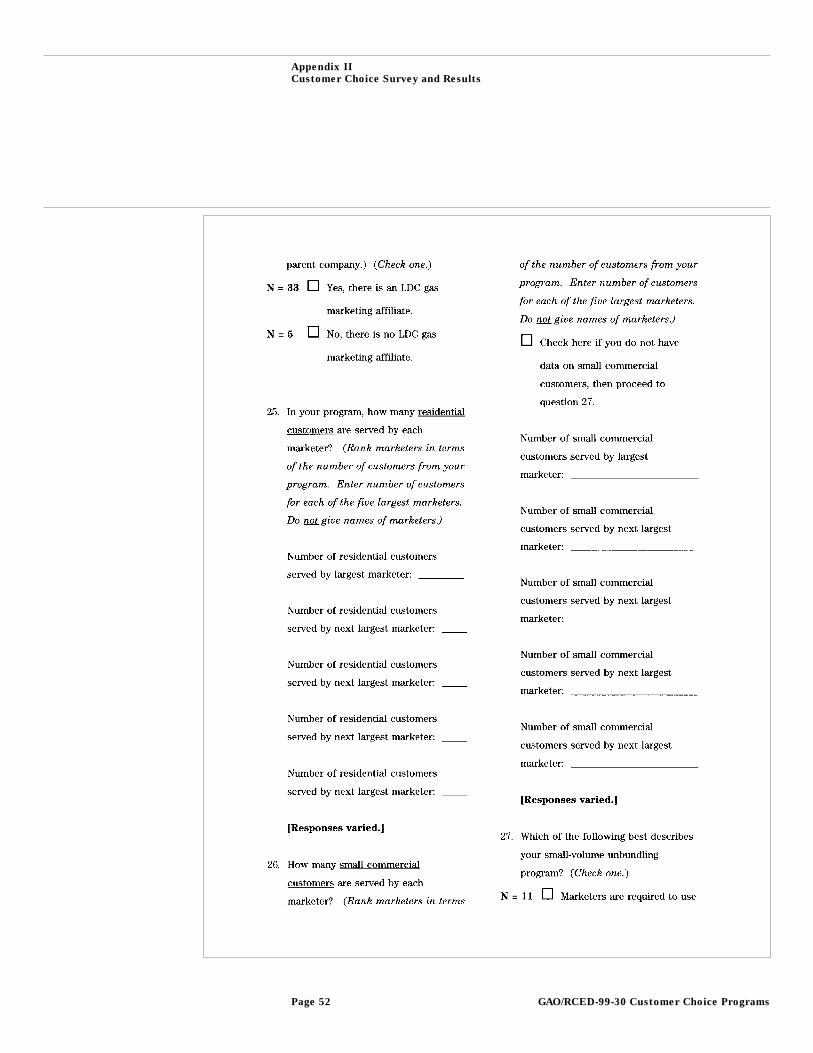
Appendix II
Customer Choice Survey and Results
GAO/RCED-99-30 Customer Choice ProgramsPage 52
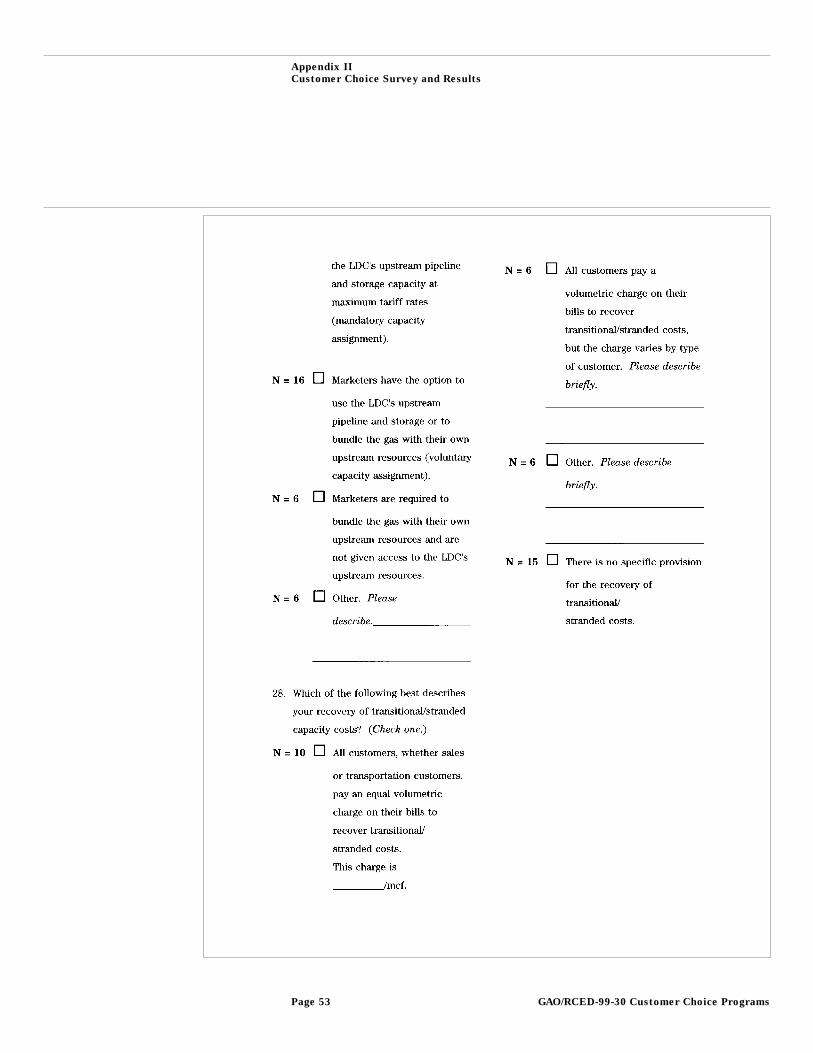
Appendix II
Customer Choice Survey and Results
GAO/RCED-99-30 Customer Choice ProgramsPage 53
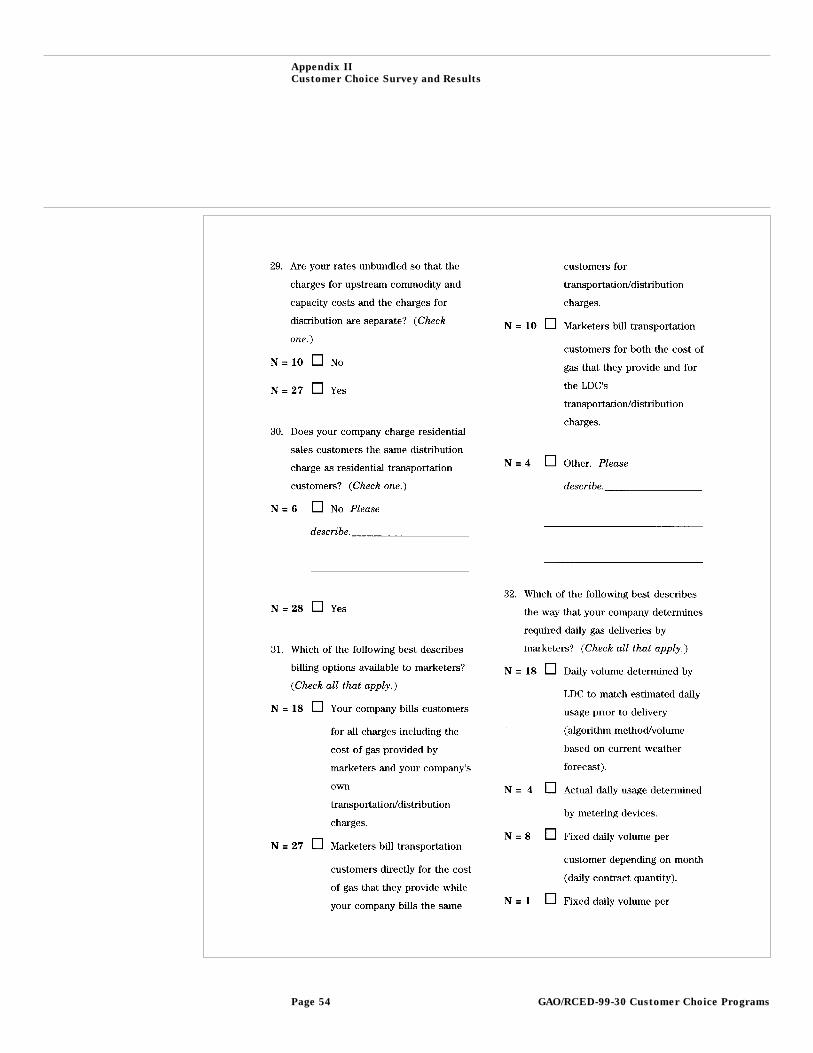
Appendix II
Customer Choice Survey and Results
GAO/RCED-99-30 Customer Choice ProgramsPage 54
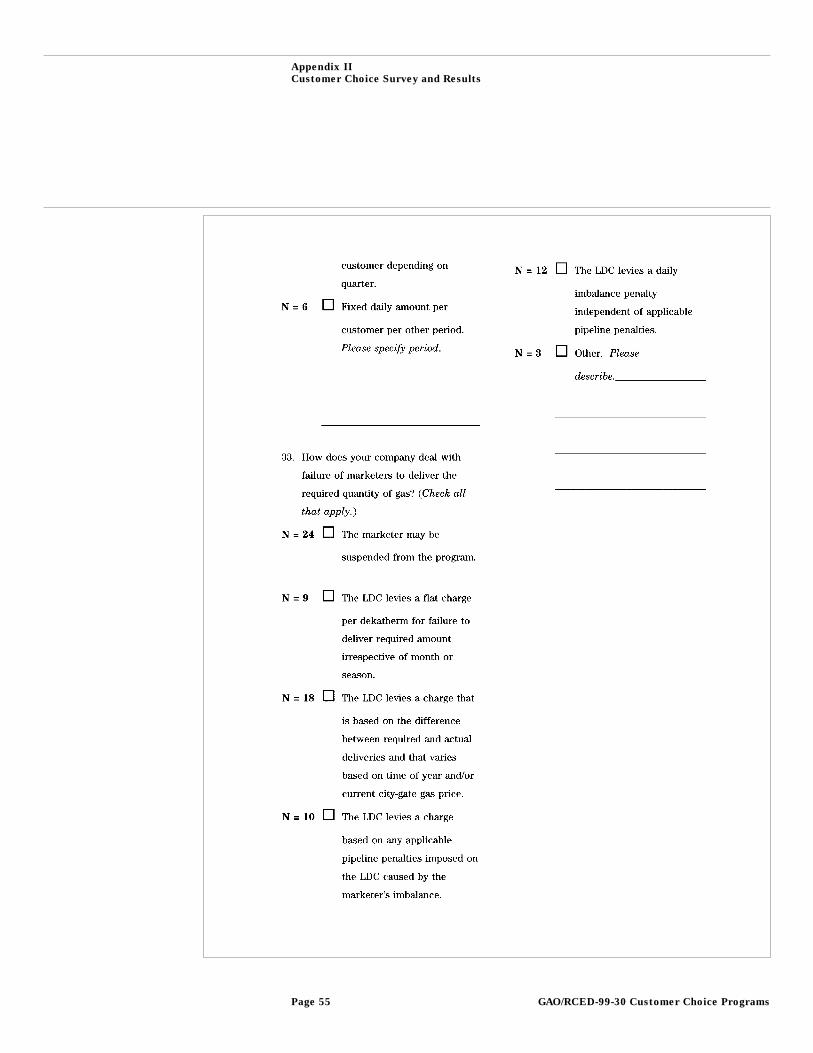
Appendix II
Customer Choice Survey and Results
GAO/RCED-99-30 Customer Choice ProgramsPage 55
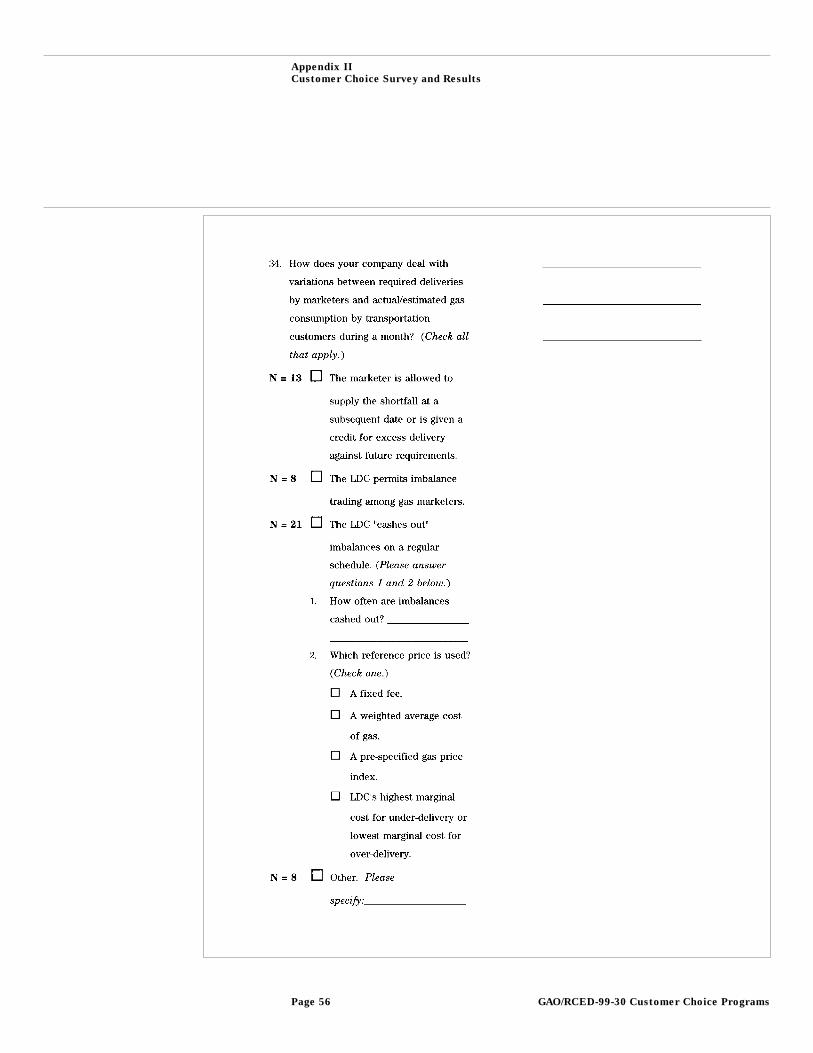
Appendix II
Customer Choice Survey and Results
GAO/RCED-99-30 Customer Choice ProgramsPage 56
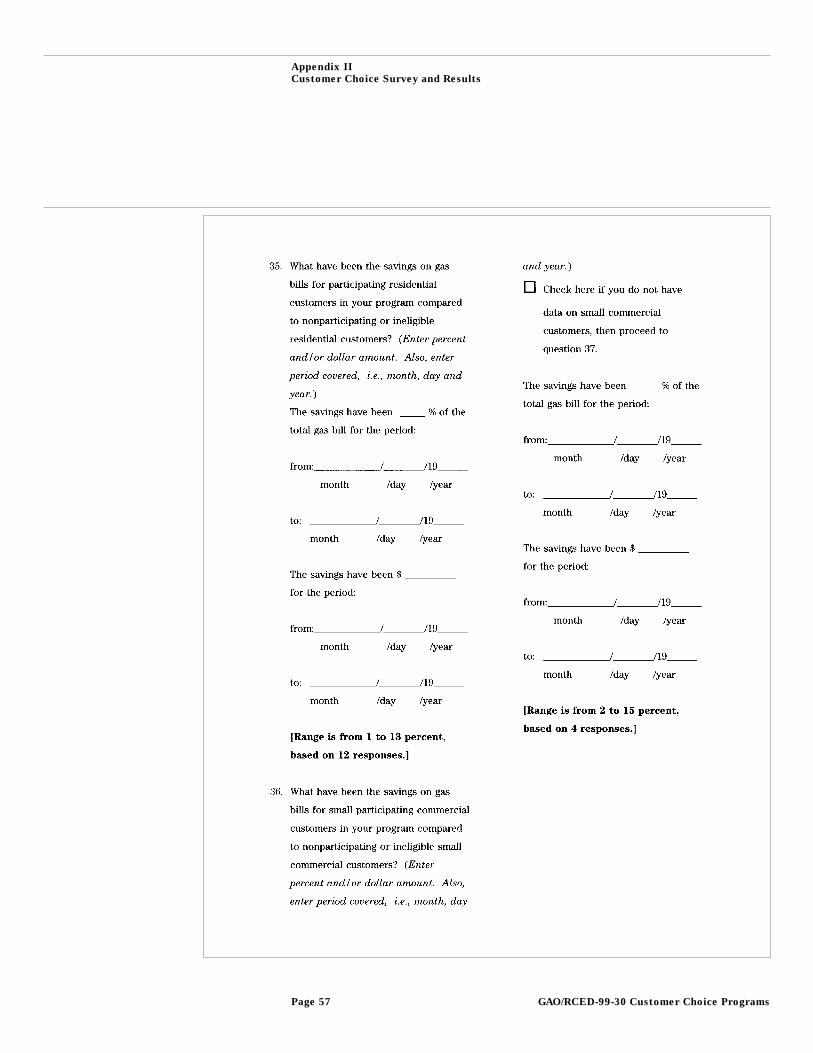
Appendix II
Customer Choice Survey and Results
GAO/RCED-99-30 Customer Choice ProgramsPage 57
Appendix II
Customer Choice Survey and Results
GAO/RCED-99-30 Customer Choice ProgramsPage 58
Appendix II
Customer Choice Survey and Results
GAO/RCED-99-30 Customer Choice ProgramsPage 59

Appendix II
Customer Choice Survey and Results
GAO/RCED-99-30 Customer Choice ProgramsPage 60
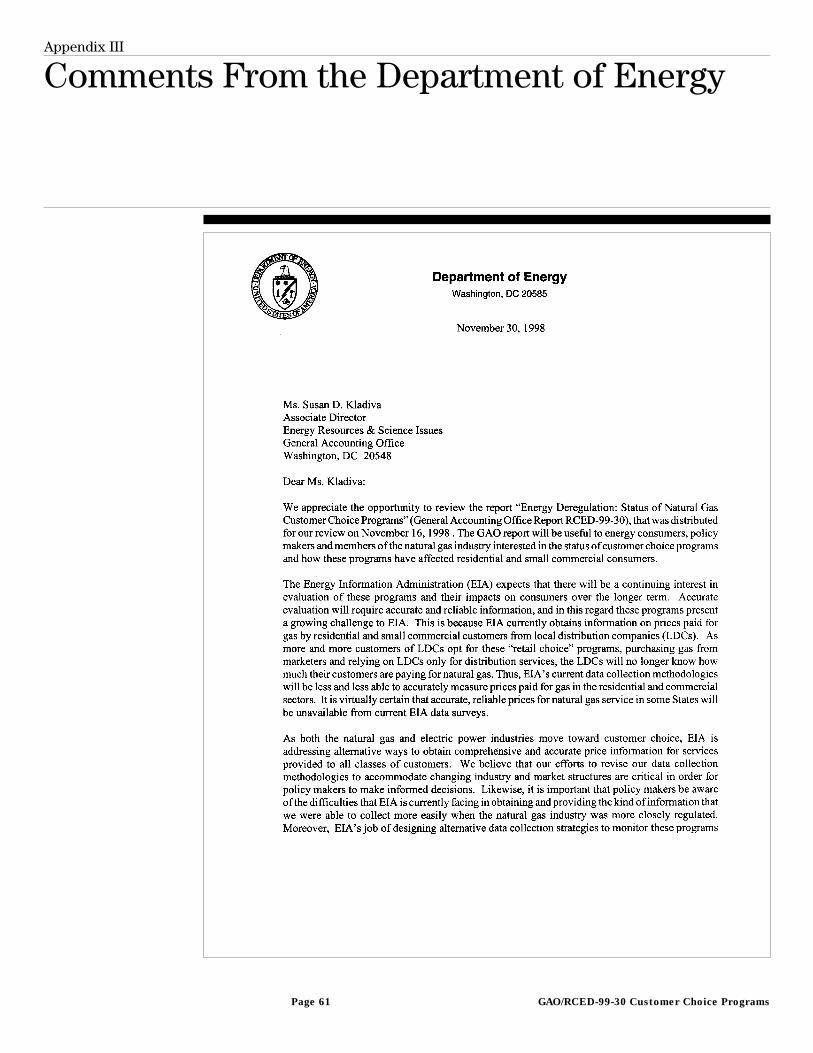
Appendix III
Comments From the Department of Energy
GAO/RCED-99-30 Customer Choice ProgramsPage 61
Appendix III
Comments From the Department of Energy
GAO/RCED-99-30 Customer Choice ProgramsPage 62
Appendix IV
Major Contributors to This Report
Resources,Community andEconomicDevelopment Division
Charles W. Bausell, Jr., Assistant DirectorTimothy L. Minelli, Evaluator-in-ChargePhilip G. Farah, Senior EconomistLynne L. Goldfarb, Publishing AdvisorLynn M. Musser, Senior Social Science Analyst
(141182) GAO/RCED-99-30 Customer Choice ProgramsPage 63
Ordering Information
The first copy of each GAO report and testimony is free.
Additional copies are $2 each. Orders should be sent to the
following address, accompanied by a check or money order
made out to the Superintendent of Documents, when
necessary. VISA and MasterCard credit cards are accepted, also.
Orders for 100 or more copies to be mailed to a single address
are discounted 25 percent.
Orders by mail:
U.S. General Accounting Office
P.O. Box 37050
Washington, DC 20013
or visit:
Room 1100
700 4th St. NW (corner of 4th and G Sts. NW)
U.S. General Accounting Office
Washington, DC
Orders may also be placed by calling (202) 512-6000
or by using fax number (202) 512-6061, or TDD (202) 512-2537.
Each day, GAO issues a list of newly available reports and
testimony. To receive facsimile copies of the daily list or any
list from the past 30 days, please call (202) 512-6000 using a
touchtone phone. A recorded menu will provide information on
how to obtain these lists.
For information on how to access GAO reports on the INTERNET,
send an e-mail message with "info" in the body to:
or visit GAO’s World Wide Web Home Page at:
http://www.gao.gov
PRINTED ON RECYCLED PAPER

United StatesGeneral Accounting OfficeWashington, D.C. 20548-0001
Official BusinessPenalty for Private Use $300
Address Correction Requested
Bulk RatePostage & Fees Paid
GAOPermit No. G100