banking deregulation
TRANSCRIPT

07-033
Copyright © 2006, 2007 by William Kerr and Ramana Nanda
Working papers are in draft form. This working paper is distributed for purposes of comment and discussion only. It may not be reproduced without permission of the copyright holder. Copies of working papers are available from the author.
Democratizing Entry: Banking Deregulations, Financing Constraints, and Entrepreneurship William Kerr Ramana Nanda

Democratizing Entry: Banking Deregulations,Financing Constraints, and Entrepreneurship�
William Kerr and Ramana NandaHarvard Business School
Boston MA
HBS Working Paper 07-033 (Revised)12 December 2007
Abstract
We study how US branch-banking deregulations a¤ected the entry and exit of �rmsin the non-�nancial sector using establishment-level data from the US Census Bureau�sLongitudinal Business Database. The comprehensive micro-data allow us to study how theentry rate, the distribution of entry sizes, and survival rates for �rms responded to changesin banking competition. We also distinguish the relative e¤ect of the policy reforms on theentry of startups versus facility expansions by existing �rms. We �nd that the deregulationsreduced �nancing constraints, particularly among small startups, and improved ex anteallocative e¢ ciency across the entire �rm-size distribution. However, the US deregulationsalso led to a dramatic increase in �churning�at the lower end of the size distribution, wherenew startups fail within the �rst three years following entry. This churning emphasizesa new mechanism through which �nancial sector reforms impact product markets. It isnot exclusively better ex ante allocation of capital to quali�ed projects that causes creativedestruction; rather banking deregulations can also �democratize�entry by allowing manymore startups to be founded. The vast majority of these new entrants fail along the way,but a few survive ex post to displace incumbents.
JEL Classi�cation: E44, G21, L26, L43, M13.
Key Words: banking, �nancial constraints, entrepreneurship, entry, exit, creative de-struction, growth, deregulation.
�Comments are appreciated and can be sent to [email protected] and [email protected]. We are grateful toRodrigo Canales, Nicola Cetorelli, Shawn Cole, Jim Davis, Ed Glaeser, Victoria Ivashina, Ron Jarmin, JoshLerner, Javier Miranda, Steve Ross, David Scharfstein, Antoinette Schoar, Jesper Sorensen, Phil Strahan, RebeccaZarutskie and seminar participants at the Census Bureau, Kellogg, Harvard, IPE, MIT, New York FRB, NBER,Reserve Bank of India, and the University of Connecticut for insightful comments on this paper. We alsothank the Innovation Policy and the Economy group for �nancial assistance. The research in this paper wasconducted while the authors were Special Sworn Status researchers of the U.S. Census Bureau at the BostonCensus Research Data Center (BRDC). Support for this research from NSF grant (ITR-0427889) is gratefullyacknowledged. Research results and conclusions expressed are our own and do not necessarily re�ect the viewsof the Census Bureau or NSF. This paper has been screened to insure that no con�dential data are revealed.
1

1 Introduction
The �nancial sector�s role for driving economic growth and development has received increas-ing attention in recent years, with several authors articulating a positive relationship between�nancial development and economic growth at the cross-country level (e.g., Beck et al. 2000;Levine 1997; Levine et al. 2000). This research argues that better �nancing environments areassociated with higher economic growth, at least in part, because they facilitate better allocationof capital across investment opportunities, thereby promoting entrepreneurship and the Schum-peterian process of creative destruction (e.g., King and Levine 1993a,b; Rajan and Zingales 2003;Aghion et al. 2007; Bertrand et al. 2007).
Despite the wealth of cross-country research, however, there are few empirical studies thatdirectly examine how changes in �nancial markets impact the entry and exit of �rms in productmarkets (e.g., Black and Strahan 2002; Cetorelli and Strahan 2006; Zarutskie 2006; Bertrandet al. 2007).1 Understanding the micro-mechanisms through which the �nancing environmentimpacts industry structure and economic growth is particularly important given that theoreticalmodels relating �nancial development to product market outcomes often yield ambiguous, oreven opposing, predictions.2
This paper studies how the US banking deregulations that lifted local banking monopoliesfrom the late 1970s through the early 1990s impacted entrepreneurship and industry structure innon-�nancial sectors. The structure of the banking industry is a major in�uence on the �nancingenvironment faced by �rms, with bank debt comprising up to 60% of their total borrowings (e.g.,Petersen and Rajan 1994). Small businesses, and new ventures in particular, rely heavily onbanks for �nancing their operations as they have fewer outside sources of �nancing (e.g., Bergerand Udell 2002; Fluck et al. 1998). Reducing distortions in the banking sector, such as liftinglocal monopolies in banking markets, can therefore have �rst-order e¤ects on product marketoutcomes.
We examine how the entry rates, the distributions of entry sizes, and the survival rates for�rms in product markets responded to changes in banking competition. We employ detailedestablishment-level data collected by the US Census Bureau that annually tracks every USprivate-sector establishment from 1976 to 1999. While our study is most closely related toBlack and Strahan (2002) and Cetorelli and Strahan (2006), three particular advantages of thesedata facilitate a more detailed examination of the mechanisms through which the deregulations
1Most research examining �nancing constraints focuses on established �rms (e.g., Banerjee and Du�o 2004;Fazzari et al. 1988; Kaplan and Zingales 1997, 2000; Moyen 2004; Paravisini 2005) or the transition of individualsinto entrepreneurship (e.g., Evans and Jovanovic 1989; Gentry and Hubbard 2000; Hurst and Lusardi 2004).
2Levine (1997) outlines the ambiguous predictions of enhanced liquidity on economic growth. Black andStrahan (2002) outline two opposing channels through which banking deregulations impact entrepreneurship.
1

a¤ected entry and exit. First, the data cover all US establishments, including private �rms, smallbusinesses, and �micro�establishments of one or more individuals. We can thus characterizebetter the impacts of the reforms across the entire �rm-size distribution. These better dataare especially true for the very small startups that are likely to be most a¤ected by capitalconstraints for entry but are often excluded or subsampled in large-scale datasets.
Second, the panel nature of the data allows us to track individual establishments over time.This feature allows us to separate analyses of entry rates (i.e., the extensive margin) fromestimations of changes in entry sizes (i.e., the intensive margin). We do so through studies ofthe entry-size distribution and of the size of entrants in their �rst year compared to subsequentgrowth within establishment. This delineation improves upon aggregate metrics like averageentry size that confound the two margins.3 The panel structure also a¤ords a detailed study ofsurvival rates for new entrants, which again can be considered at di¤erent points in the entry-sizedistribution.
Third, we can separate new establishments into startups and additional facilities being openedby existing �rms. This feature allows us to compare how the banking deregulations impactedthe entry and exit of startups � that, in general, face greater �nancing constraints � to theentry and closure of plants by multi-unit �rms. In addition to having substantive value, thisdistinction is also valuable from an econometric standpoint as it allows us to control for agreater set of omitted variables than prior studies. By using the facility expansions of existing�rms as a �within state-industry-year�baseline against which to compare the founding of newventures, we are able to control both for annual changes in the overall entry rates of startupsversus existing �rms and for aggregate entry conditions at the state-industry-year level. Ouridenti�cation strategy therefore isolates the impact that changes in the �nancing environmenthave on entrepreneurship over-and-above the increase in facility expansions by existing �rms.4
Similar to Black and Strahan (2002), we �nd that the interstate banking deregulations led to asubstantial increase in the entry rates of startups. Our work further demonstrates that startupsexhibited a greater increase in entry than facility expansions and that this e¤ect was particularlystrong among establishments entering with 20 employees or fewer. Moreover, for those �rmsthat survived at least three years, startups entered at larger sizes relative to new establishmentsof existing �rms. These results provide compelling evidence that the deregulations reduced�nancing constraints and that startups �which tend to have fewer sources of external �nance
3Lower �nancing constraints may facilitate larger entry sizes for �rms that would have entered regardless (e.g.,Evans and Jovanovic 1989; Cabral and Mata 2003), an intensive margin e¤ect that would promote higher averageentry sizes. If the deregulations also in�uence entry rates, however, average entry sizes will capture changes onboth the intensive and extensive margin (e.g., greater entry at the bottom of the size distribution that decreasesaverage entry size).
4We also provide new evidence regarding the dynamic patterns of entry and exit in the non-�nancial sectorsafter the banking deregulations, which suggests that e¤ects on the product market were a consequence of thereform rather than causing them.
2

and hence are more sensitive to reductions in interest rates or credit rationing �bene�ted morefrom the deregulations than existing �rms.
We also �nd that the increase in startup activity relative to facility expansions is present,albeit smaller, at the higher end of the size distribution. Since �rms that are entering at over100 employees are not as likely to be credit constrained on the extensive margin, this �ndingis consistent with the view that deregulation improved allocative e¢ ciency across the �rm-sizedistribution, so that good investment ideas of startups were more likely to be �nanced despitethe fact that they were not �insiders�or privileged clients (e.g., Jayaratne and Strahan 1996;Laeven 2000; Rajan and Zingales 2003; Bertrand et al. 2007).
The most striking feature of the US deregulations, however, was the dramatic increase in theentry of establishments that failed within three years. This �churning�was particularly strongfor small �rms. For example, startup establishments entering with 6-20 employees experiencedan over 30% increase in churning relative to facility expansions of multi-unit �rms. This strongincrease in churning following the deregulations cannot be explained solely within a model ofbetter ex ante allocation of capital to quali�ed projects. Rather, another channel throughwhich banking competition facilitates the process of creative destruction is to allow many morestartups to be founded, only some of which survive ex post to displace eventually incumbents.This process suggests that the relative impacts of banking deregulation on entrepreneurship mayfar exceed impacts on the displacement of incumbents, which we show to be consistent with theUS experience.
Our �ndings are relevant to the developing empirical literature documenting how reforms tothe banking sector may positively impact the real economy through the reallocation of resourcesin non-�nancial sectors (e.g., Bertrand et al. 2007; Cetorelli and Strahan 2006; Cetorelli 2004).This study not only provides further evidence that well functioning capital markets strengthenentrepreneurship in local economies, but also better characterizes the mechanisms surroundingthis entry. Most importantly, deregulation may facilitate creative destruction through the�democratization�of entry rather than just through ex ante allocative e¢ ciency. These resultscomplement Bertrand et al.�s (2007) study of the French banking deregulations�impact for �rmswith over 100 employees.
Our results also complement prior research examining the relationship between banking struc-ture and lending to existing small businesses (e.g., Petersen and Rajan 1994; Berger and Udell1995). Although the theory is ambiguous as to whether concentrated banking markets are goodfor entrepreneurship, our results support the view that more competitive banking markets havea positive e¤ect on the entry of small, �nancially constrained �rms (e.g., Erel 2006; Berger etal. 2005; Black and Strahan 2002). However, our �ndings on churning paint a richer portraitof how banking deregulations impact product markets.
3

The rest of the paper is structured as follows. Section 2 provides a more detailed descriptionof the theoretical considerations and our empirical approach. The third section introduces theLongitudinal Business Database (LBD) and compares the aggregate entry behavior of startup�rms and multi-unit facility expansions. We report our panel estimation results on the entryrates, entry sizes, survival, and churning of new establishments in Section 4. Sections 3 and 4also provide new evidence from the LBD regarding changes in banking structure following thederegulations. In Section 5, we conclude our study by identifying further how our results �tinto the literature and the areas for future research.
2 Theoretical Considerations and Estimation Design
Our empirical approach exploits cross-state variation in the timing of branch banking deregu-lations in the US. The 1970s through the mid 1990s experienced a signi�cant liberalization inthe ability of banks to establish branches and to expand across state borders (either throughnew branches or acquisitions). Prior to these liberalizations, banks faced multiple restrictionson geographic expansion both within and across states.
The McFadden Act of 1927 required national banks to obey state-level restrictions on branch-ing, e¤ectively prohibiting cross-state branch banking. In addition, many states developedstringent rules governing the conduct of branch banking within their territories. The mostrestrictive of these, known as unit banking, limited each bank to a single branch. Althoughbanks responded to these restrictions by forming multibank holding companies (MBHCs) thatowned more than one bank, states in turn restricted the activities of MBHCs. Restrictions onintrastate branching for MBHCs focused on the market share and concentration of these holdingcompanies, while the Douglas Amendment of 1956 prevented a MBHC from owning banks acrossstate borders.
As shown in Figure 1, only 12 states had some form of intrastate branch banking deregulationprior to 1970, and no state allowed interstate branch banking. Starting in the 1970s, andespecially in the 1980s, most states passed laws deregulating the restrictions on the ability ofbanks to open or acquire new branches. Two classes of restrictions were eased over this period.First, intrastate deregulations for branch banking allowed banks to expand within the passingstate either by acquiring other bank branches or by setting up new bank branches themselves.This allowed for more competition in the local banking market, in some cases even breaking-upe¤ective monopolies that existed prior to these liberalizations.5
5The intrastate branch banking deregulations consist of two elements. The �rst deregulation allows banksto expand within states through mergers and acquisitions. The second allows banks to open de novo branches.We focus on the leading edge of these intrastate reforms in this paper.
4

Second, interstate branch banking deregulations allowed banks to acquire branches in otherstates with which their �home state�had negotiated such a bilateral agreement. This class ofreforms further reduced the monopoly power of local banks, in particular due to the signi�cantimprovements in the market for corporate control (e.g., Berger et al. 2001).6 In part due toreciprocal nature of these agreements, most states undertook interstate deregulations in the mid1980s to early 1990s. These state-level reforms culminated in the Riegle-Neal Interstate Bankingand Branching E¢ ciency Act of 1994, which overturned the McFadden Act and allowed nationalinterstate branch banking after 1995. In e¤ect, the Riegle-Neal Act put out-of-state banks onpar with local banks in every state, with important implications for capital reserves and bankinge¢ ciency across the industry.7
The period following the liberalization of interstate branch banking led to an expansion of thelarge MBHCs across state borders and a signi�cant fall in the number of small local banks. Table1A documents aggregate changes in the banking sector taken from the LBD. The total numberof banks fell by 30% from the mid-1970s to the mid-1990s. The share of large banks, de�ned ashaving more than 500 employees, and the share of branches controlled by large banks increasedover the same period. There was also a sharp increase in the share of branches controlled byout-of-state banks, growing from 2% to 25%, suggesting a robust market for corporate controlacross state borders.8
Our �ndings on the changes in the banking industry using the LBD data mirror those usingbank assets rather than bank employees as a metric for bank size. For example, Berger etal. (2001) �nd that the fall in the number of banks is almost completely accounted for by thereduction in small banks with assets under $100m. Moreover, they �nd that the percentage ofindustry assets managed by �megabanks�(i.e., with more than $100b in assets) almost doubledfrom 1977 to 1994. The percentage of industry assets managed by small banks, on the otherhand, halved over the same period.
The increase in banking competition and strengthening of the market for corporate controldue to the deregulations are thought to have improved allocative e¢ ciency by allowing capitalto �ow more freely towards projects yielding the highest returns and to more e¢ cient producers.Moreover, although the number of banks fell over this period, the number of bank branchesincreased considerably, re�ecting greater competition and increased consumer choice in local
6The interstate deregulations may have also improved economies of scale, although Berger et al. (2001) arguethat the mergers resulted in few cost savings on average.
7The Riegle-Neal Act opened up nationwide acquisition of banks across state lines so that a bank in any statecould acquire another bank in any state, regardless of whether their respective �home states�had negotiated anagreement allowing cross-state acquisitions (unless a state explicitly opted out). In addition, the Riegle-NealAct allowed banks to set up new branches across state borders without the need to acquire a subsidiary bank,and MBHCs could convert subsidiaries into branches. Kane (1996) carefully discusses the Riegle-Neal Act.
8The �nancial sector is less precisely measured than product markets in the LBD prior to 1992. These bankingstatistics, nevertheless, are indicative of the substantial shifts in the sector�s structure during this period. Seealso Berger et al. (2001) and Janicki and Prescott (2006).
5

markets. From a theoretical perspective, these reforms could have had a strong positive e¤ecton entrepreneurship if startups face substantial credit constraints. Moreover, since entrepreneurshave fewer non-bank options for �nancing their projects relative to existing �rms (e.g., internalcash �ow, bond markets), more e¢ cient allocation of capital within the banking industry shouldlead to larger increases in startup entry relative to facility expansions by existing �rms.
However, there are two theoretical reasons why these reforms may instead harm the entryof startups. First, Petersen and Rajan (1995) argue that startups bene�t from concentratedbanking markets because a monopolist bank can engage in inter-temporal cross-subsidizationof loans. As a monopolist bank can charge above-market interest rates to mature �rms, theycan in turn charge below-market rates to potential entrepreneurs. By doing so, the monopolistbank can maximize the long-term pool of older �rms to which they lend. Increased competitionweakens the market power of local banks for mature �rms, reducing their ability to chargeabove-market rates, and thereby weakens their incentives for charging below-market rates tonew entrants as well.
Second, several studies argue that small banks have a comparative advantage relative to largebanks at making lending decisions for startups because they are better at screening on �soft�versus �hard�information (e.g., Stein 2002; Berger et al. 2005). If lending decisions in largerbanks are based on a more hierarchical decision process, the ultimate adjudication decisions maycome from o¢ cers who do not know potential borrowers personally. These decisions are morelikely to be based on credit scoring models that inherently focus on hard information. On theother hand, local loan o¢ cers at small banks know information about borrowers that cannotbe condensed into a credit score. This ability to lend and monitor based on soft informationmay give local loan o¢ cers a comparative advantage in lending to entrepreneurs. Since thebanking reforms led to a shift in industry structure from small banks towards large banks, thiscould have had a direct negative e¤ect on lending to startups relative to established �rms with ahistory of audited accounts. On both fronts, therefore, this second set of theories suggest thatentrepreneurs may have su¤ered from the banking deregulations.
As can be seen from Figure 1, the timings of the intrastate and interstate branch bankingderegulations are su¢ ciently di¤erent and independent across states that we can jointly inves-tigate the e¤ect of these two reforms on startup entry. We prefer to model the reforms jointlyto isolate better their respective impacts, but our results are robust to estimating the e¤ect ofthe two reforms separately. The intrastate deregulation captures the relative trade-o¤ betweenallocative e¢ ciency from increased competition and the potential cost to entrepreneurs from aloss of concentrated markets. The interstate deregulation captures the trade-o¤ between thesee¢ ciencies and the potential cost to entrepreneurs from the shift away from small banks as asource of small business lending. Our study can therefore also be seen as a test for the pres-ence of �nancing constraints in entrepreneurship. Since there are several theoretical channels
6

through which banking competition may hinder startup activity, evidence of a net increase inentrepreneurship relative to facility expansions of existing �rms would indicate a strong, positivebene�t to entrepreneurship through increased competition among banks.
We construct tight comparisons of startup entry rates to the facility expansions of existing�rms that remove all local conditions common to the two types of entrants. We use the facilityexpansion comparison, rather than �rm growth through employment adjustments at existingplants, to create a baseline with similar discontinuous �nancing requirements. We further controlfor aggregate changes in entry rates for both types of �rms. This platform is only feasible dueto our establishment-level data. Since the cross-state variation in the timing of the reforms mayhave been correlated with the structure of the banking industry9, prior research regarding thee¤ect of these banking deregulations on the non-�nancial sector relies on interactions between thetiming of the reforms and each industry�s dependence on external �nance to achieve identi�cation(e.g., Cetorelli and Gambera 2001; Cetorelli and Strahan 2006). We go further by exploitingvariation across types of entrants within state-industry-year cells. This estimation approachcontrols for a greater set of omitted factors than earlier work, and we utilize a dynamic modelthat parses out transitory features of the adjustment process. Most importantly, though, theelasticities of establishment openings for existing �rms provide an important benchmark forisolating the relative importance of these deregulations for entrepreneurship speci�cally.
3 Longitudinal Business Database
The data for this study are drawn from the Longitudinal Business Database (LBD). Sourcedfrom US tax records and Census Bureau surveys, the LBD provides annual observations forevery private-sector establishment with payroll from 1976 to 1999. Approximately 3.9m es-tablishments, representing over 68m employees, are included each year. As the micro-recordsdocument the universe of establishments and �rms, rather than a strati�ed random sample orpublished aggregate tabulations, the Census Bureau data are an unparalleled laboratory forstudying entrepreneurship rates and the life cycles of �rms in the US. In addition, the LBDlists the physical location of establishments rather than the location where they are incorpo-
9Accounts of the political economy of the reforms suggest their passage are mostly exogenous to productmarkets, driven in part by federal actions and state-level structure of the banking industry. Black and Strahan(2001) argue that some of the impetus for the intrastate deregulations came from initiatives taken by the O¢ ceof the Comptroller of the Currency that put banks with national charters on par with Savings and Loans (S&Ls)and savings banks that could branch freely within states. The interstate deregulations were driven in part bythe S&L crisis in the early 1980s when federal legislators allowed failed banks and thrifts to be acquired bybanks in any state, regardless of the state laws governing these transactions. These paved the way for bilateralnegotiations between various states to allow interstate banking to capture the bene�ts of larger, diversi�ed banksthat were less susceptible to failure. Kroszner and Strahan (1999) also note that the timing of the reforms aredriven in part by the relative strength of banking interest groups that favored the deregulation. These issues arefurther discussed below. Appendix Table 1 lists each state and the dates of the branch banking deregulations.
7

rated, which allows us to circumvent issues related to higher incorporations in certain states likeDelaware.
The comprehensive nature of the LBD facilitates the development of complete state-industry-year panels of birth counts by type of �rm and the distribution of establishment entry sizes (interms of employment). Each establishment is given a unique, time-invariant identi�er that canbe longitudinally tracked. This allows us to identify the year of entry for new startups or theopening of new plants by existing �rms.10 Second, the LBD assigns a �rm identi�er to eachestablishment that facilitates a linkage to other establishments in LBD. This �rm hierarchyallows us to separate new startups from expansions by existing multi-unit �rms.
Publicly available series do not provide birth counts by state-industry cells; even when theydo provide approximations based on total employment, the Census Bureau is required to suppressvalues that compromise the con�dentiality of individual establishments. Moreover, the entry ofstartups versus expansion establishments is not released. Building from the microdata overcomesthese limitations. Our data include the manufacturing, services, retail trade, wholesale trade,mining, transportation, and construction sectors from 1977 to 1998.11
Table 2 provides descriptive statistics on entrants in our sample. Over 80% of the 400k newestablishments opened in each year are new �rm formations. Figure 2 plots the relative entrycounts over time of startup establishments and the expansion establishments of existing �rms,with entry counts in 1977-1981 normalized to 100% for each group. While startups constitutethe vast majority of new establishments, this time plot demonstrates that the relative increase instartup activity has consistently lagged that of expansion establishments since the early 1980s.There is only a 10% increase in the raw number of startup entrants over the twenty-year period,despite a 20% overall growth in LBD employment. Measured in terms of rates, Davis et al.(2006) document a substantial reduction in business entry and exit from the late 1970s to thelate 1990s using the LBD. Figure 2 also documents a broad decline in entry during the early1990s. This is consistent with the decline in credit available to �rms during this period (e.g.,Berger et al. 2001; Zarutskie 2006).
These aggregate trends are important when interpreting the upcoming panel estimation re-sults. We will control for the aggregate trends of startups and expansion entry by existing �rmswith separate year �xed e¤ects for each type of �rm. These panel e¤ects remove aggregatetrends that a¤ect these two groups di¤erently and would otherwise bias the parameter estimates
10We de�ne entry for a given establishment as the �rst year that it has positive employment. We do notinclude exit and re-entry in our birth counts. The data begin in 1976, and we consider entry from 1977 onward.11Jarmin and Miranda (2002) describe the construction of the LBD. Sectors not included in the LBD are
agriculture, forestry and �shing, public administration, and private households. We also exclude the US postalservice, restaurants and food stores, hospitals, education services, and social services. Finally, we separate the�nancial services sector for analysis. Incomplete LBD records require dropping 25 state-year �les: 1978 (12states), 1983 (4), 1984 (4), 1985 (1), 1986 (1), 1989 (1), and 1993 (2).
8

(e.g., di¤erent cyclical volatilities for �rm formations). These aggregate trends, however, includeoverall movements in credit access that are partly due to deregulations. The inference of panelestimations using the cross-state banking variation is in part from greater or weaker relativedeclines in startup entry rates for states that have deregulated versus those that have not.
While startups account for the majority of new establishments, existing �rms open newestablishments at much larger sizes. New establishments of existing �rms start on average withfour times the employment of startups. Figure 3 documents the distribution of establishmententry sizes for these types of �rms. 76% of new startups begin with �ve or fewer employees,versus 44% for expansion establishments of existing �rms. These distributions suggest startupsmay face constraints on the intensive margin of entry size as well as the extensive margin ofentry rates. Looking at the capital-intensive manufacturing sector in Figure 4, the distributiondi¤erentials are even more pronounced. There are, however, many other factors that need to beconsidered in modelling starting establishment size to isolate the role of �nancing constraints.
Manufacturing accounts for just under 10% of the total entry; manufacturing, services, whole-sale trade, and retail trade jointly account for 75% of the total entry of new establishments.12
Despite the well-documented concentration of high-tech entrepreneurship within regions like Sil-icon Valley and Boston�s Route 128, the broad entry and exit rates we consider are more evenlyspread across US regions. There are also no substantial di¤erences in the extent to which star-tups versus existing �rms open new establishments across regions. These geographic regularitiesaid our using of cross-state variation in banking deregulations to study entrepreneurship, as theresults are not overly dependent upon the outcomes of a single state or region.13
Table 2 also shows that the aggregate distributions of establishment exits across the sizedistribution, industries, and geographic regions are relatively similar to entry for the period ofstudy. On the other hand, the rate of �churning��de�ned as establishments that exit withinthree years of entry � is much larger for startups (46%) relative to that of established �rms(28%) and more concentrated at the lower end of the size distribution.
4 Empirical Results
This section reports our empirical results regarding establishment entry rates, entry sizes, exitrates, and churning. We begin with state-year panel estimations that separately examine the12The exclusion of health, education, social services, and community organizations reduces the proportion of
services entry in the sample relative to the overall population. The relative entry and exit of startups versusexisting �rms in retail trade and construction are quite di¤erent. Our core estimations control for detailedindustry di¤erences, and we have further con�rmed that our results are robust to excluding these sectors entirely.13Dunne et al. (1989), Davis et al. (1996), and Glaeser and Kerr (2007) provide additional details on entry
patterns in the manufacturing sector. Dumais et al. (2002) and Ellison et al. (2007) consider the agglomerationand coagglomeration of startup and existing �rm expansion, respectively.
9

entry rates of startups and expansion establishments. We then turn to dynamic tests andstacked regressions to focus on more stringent identi�cation of the e¤ect of banking deregulationon entry rates and entry sizes of startups relative to those of existing �rms. Lastly, we considerestablishment exits and the churning process using the empirical apparatus developed with theentry regressions.
Our results suggest that US banking deregulations reduced �nancing constraints and im-proved ex ante allocative e¢ ciency. However, we also show that the deregulations substantiallyincreased �churning�of startups at the lower end of the size distribution. This more prominent�nding suggests that reduced distortions in the US banking industry �democratized�entry amongstartups in product markets. While some of these startups survived ex post to enable the processof creative destruction, much of the startup entry at the lower end of the size distribution wasshort-lived.
4.1 Pre-Post Estimations of Entry Rates at the State-Year Level
Our characterization of banking deregulations and entry rates begins with a simple panel datamodel at the state-year level. The estimation takes the form,
ln(BIRTypest ) = �s + � t + �TRATRAst + �TERTERst + "st; (1)
where �s and � t are vectors of state and year �xed e¤ects, respectively. The state e¤ects controlfor �xed di¤erences in entry rates across states due to factors like California�s larger economicsize. The year e¤ects account for aggregate changes in entry rates over time that result fromthe business cycle, national policy changes, and so on. BIRst is the total count of establishmentbirths in the state-year cell for the indicated Type of �rm: startups or existing �rms. TRAst andTERst model the intrastate and interstate banking deregulations, respectively. These indicatorvariables take a value of zero before the deregulations and one afterwards. As BIRst is measuredin logs, the � coe¢ cients measure the mean percentage increase in a state�s births in the yearsfollowing the deregulations.14
Panel A of Table 3 reports two regressions for three samples: all sectors, manufacturing only,and non-manufacturing. The �rst regression of each set considers startup entry rates, whilethe second regression focuses on the entry rates of new establishments opened by existing �rms.
14The LBD is centered on March of each year. We thus date the reforms such that a passage of TRA in1987, for example, is coded as changing from 0 to 1 in 1988. We also include in each regression an interactionof the reforms with an indicator for an Economic Census year (i.e., 1977, 1982, 1987, 1992, 1997). In theseyears, more manpower is devoted to updating the business registry. As a result, longitudinal bumps occurin establishment entry counts for both types of �rms. These interactions �exibly accommodate these shifts,although the interactions are insigni�cant and their coe¢ cients are not informative. They can be excluded fromthe regressions without impacting the results. See Autor et al. (2007) for further details.
10

These six regressions are all undertaken at the state-year level, so that the observation countsdo not change across columns. We conservatively cluster standard errors at the state cross-sectional level to address the serial correlation concerns for di¤erences-in-di¤erences estimationsof Bertrand et al. (2004). Regressions are weighted by 1977-1985 total birth employment in thestate cell; these weights do not change across entrant types.15
The speci�cations �nd that interstate banking deregulation is consistently associated withhigher rates of startup entry. The coe¢ cient elasticity of 6% is smaller, but similar in di-rection, to the 11% elasticity of Black and Strahan (2002) using Dun & Bradstreet incorpo-rations. This positive response is evident for the whole sample and for the manufacturingand non-manufacturing subsamples. In unreported regressions examining sectors with thenon-manufacturing subsample, stronger e¤ects are found in wholesale and retail trade than inservices. Nevertheless, a higher and statistically signi�cant entry of startups following the in-terstate reform is evident for each sector analyzed. We �nd the intrastate banking deregulationis associated with higher entry rates in the manufacturing sector only. For non-manufacturers,which again comprise the bulk of the sample, no e¤ect on entry is registered.16
These results suggest the interstate branch banking deregulations had a very large economicimpact, leading to a 6% growth in startup birth rates. It is premature, however, to inferthat these deregulations have a direct, causal bene�t for entrepreneurship. Looking at theestablishment entry rates of existing �rms, the second regression of each set, we �nd a similarpattern of coe¢ cients. The interstate banking deregulations are associated with higher entryrates that are statistically di¤erent from zero. Although the estimated elasticity of 4% forfacility expansions is somewhat weaker than the 6% estimated for startups, we cannot reject thehypothesis that these elasticities are the same statistically.
4.2 Dynamic Estimations of Entry Rates at the State-Year Level
The pre-post estimations �nd higher entry rates for both startups and facility expansions aroundthe interstate deregulations. It is possible, of course, that the deregulations were a response togreater levels of economic activity, including entrepreneurship, rather than the cause of them.For example, Kroszner and Strahan (1999) argue that the timing of the reforms are driven inpart by the relative strength of banking interest groups that favored the deregulation. In orderto examine this proposition more carefully, we turn to dynamic extensions of (1) that identify
15The weights a¤ord population estimations of the impact of the banking deregulations. Similar results areobtained in unweighted regressions of these state-year panels.16Black and Strahan (2002) �nd a 3% elasticity in Dun & Bradstreet incorporations to intrastate deregulations.
11

whether the timing of product market entry following the deregulations is in a pattern consistentwith a causal interpretation.17 These speci�cations take the form,
ln(BIRTypest ) = �s + � t +
3Xq=�2
�TRAt+q�TRAst+q + �TRAt+4TRAst+4 (2)
+3X
q=�2�TERt+q�TERst+q + �TERt+4TERst+4 + "st.
The post-reform indicators in (1), TRAst and TERst, are replaced by a series of lead and lagindicators. TRAst+4 and TERst+4 take a unit value four or more years after the deregulation.The variables
P3q=�2�TRAst+q and
P3q=�2�TERst+q are six separate indicator variables that
span the six-year period from two years prior to the reform to three years after the reform.These six indicators take a unit value in their speci�c lead or lag year and are zero otherwise.Their coe¢ cient pattern thus models the short-term dynamic e¤ects around the reform, withTRAst+4 and TERst+4 capturing outcomes four or more years after the deregulations.
Our main coe¢ cients of interest are the long-term e¤ects �TRAt+4 and �TERt+4. The co-e¢ cients
P3q=�2 �TRAt+q and
P3q=�2 �TERt+q focus on the timing of the reform and document
whether the entry of new establishments following the reforms is consistent with a causal e¤ect.In particular, we should be concerned if a strong lead e¤ect is evident just before the dereg-ulations are passed, regardless of whether it is heightened or diminished entry counts, as thiswould suggest an omitted factor is highly correlated with the timing of the deregulations. Wealso want to con�rm that the dynamic pattern of e¤ects leading into the long-term e¤ects makeseconomic sense. The coe¢ cient values for the leads and lags in (2) are relative to the periodthree years before the reforms and earlier; by comparison, the post indicators in (1) are relativeto the period immediately before the reforms.
Panel B of Table 3 reports six speci�cations that again examine startups and facility expan-sions both within and outside of the manufacturing sector. To conserve space, we report inTable 3 a condensed form of (2) where the six single-year leads and lags are consolidated intothree two-year increments. The long-term e¤ects are still captured by the four-year lag coe¢ -cients �TRAt+4 and �TERt+4. Appendix Table 2 reports the complete dynamic speci�cations forthe full sample.
The dynamic speci�cations show a very consistent entry response for startups and facilityexpansions to the interstate banking deregulation. In both cases, the forward e¤ect is of small17The dynamic speci�cations identify whether the timing of product market entry is consistent with greater
competition in the banking industry, even if the introduction of the competition itself was endogenous to thebanking sector. Such a test has yet to be documented in a consistent way in the literature. Endogeneity inthe banking sector can still be viewed as exogenous to the product markets, especially the relative impacts forstartups versus facility expansions that we study later in this section. The stacked speci�cations ultimatelyremove all state-industry-year trends.
12

magnitude and not statistically di¤erent from zero. After the reforms, the coe¢ cients showan increasing pattern consistent with growing �nancial access due to greater bank competition.The long-run magnitudes again maintain the expected order, with startups having a greaterelasticity than the expansion establishment formations of existing �rms. No consistent e¤ect isagain evident for the intrastate deregulations.
A potential concern with these results is that they may be driven by unobserved changesin industry structure or similar factors that are correlated with changes in the structure of thebanking industry. For example, changes in technology may be independently associated withstructural changes in both sectors. It is important to note that all states but one moved fromthe control to the treatment group during our sample period, suggesting that the timing ofany omitted factor would need to be closely correlated with the timing of the deregulations.Appendix Table 2 also shows that the results are robust to including linear state time trends.These linear trends center identi�cation on the discontinuities surrounding the reforms. Wefurther address these concerns below with our stacked framework.
The second and third sets of regressions in Panel B highlight that the long-run elasticities ofentry in non-manufacturing sectors are higher than those in the manufacturing sector. Somemay �nd this surprising given the perceived higher �nancial dependency of manufacturing. Twonotes can be made. First, many industries within manufacturing (e.g., leather goods) are lessdependent on external �nance than those in trade or services; we test directly the �nancialdependency prediction later in this section and �nd some evidence for it. More importantly,manufacturing is experiencing stagnant employment trends during this period, while other sec-tors are expanding. It is not surprising that the elasticities of establishment entry to changesin �nancing constraints are weaker for a declining sector. For a hypothetical industry with noentrepreneurial enticement, the expected elasticity from the deregulations would be zero.
To verify that our results are being driven by enhanced bank competition following thederegulations, we also consider dynamic speci�cations that analyze how the US deregulationsimpacted the commercial banking industry itself. These estimations, available upon request,show a sharp increase in the number of out-of-state banks following the interstate deregulations.Moreover, a signi�cant proportion of this growth was driven by large banks with an average of500 or more employees over the period 1977-1985. These trends con�rm deregulation�s role in thedescriptive statistics outlined in Table 1. The observed growth of out-of-state banks following theinterstate deregulations is informative of the mechanism through which banking liberalizationsimpacted entry in the non-�nancial sector. Both factors follow the interstate deregulationsin dynamically consistent patterns, with limited to no response to intrastate deregulations.Taken together, these results suggest that increased competition from out-of-state banks playeda particularly important role in promoting entry of new establishments, both of new startups
13

and of existing �rms, following the interstate deregulations.18
4.3 Stacked Estimations of Entry Rates at the State-Industry-Type-Year Level
The state-year panel estimations provide us with two pieces of evidence for moving forward.First, we note that the most simple estimation highlights that interstate deregulations had apositive, signi�cant e¤ect on the entry of new establishments. Moreover, this entry response isdynamically consistent with the view that greater competition from out-of-state banks increasedcredit for startup �rms. While this e¤ect is stronger for startup establishments, we also notedthe somewhat smaller, but still statistically signi�cant, response for the entry of expansionestablishments associated with existing �rms. We cannot reject the hypothesis that the twoentry elasticities are the same at the state-year level.
When discussing the dynamic speci�cations, we noted the potential for omitted variables tobias our estimations if the unmodeled factors are very tightly linked to the passage of the branchbanking deregulations. While the dynamic speci�cations and the linear state time trends helpmitigate this concern, we make additional progress in this section through a more stringentdi¤erences-in-di¤erences speci�cation. This estimation procedure directly contrasts the e¤ectof the banking deregulations on startups with facility expansions by established �rms. Theempirical claim is that facility expansions can serve as an appropriate control group conditionalon removing the aggregate di¤erences documented in Figure 2. Panel B of Table 3 suggeststhat this strategy is reasonable. Similar to the startups, the facility expansions do not have alead pattern prior to the interstate reforms; moreover, the dynamic growth in their coe¢ cientsis reasonable.
Aside from controlling for potential omitted variables, our identi�cation strategy also hasa useful substantive interpretation in that it teases out the di¤erential response of startups tochanges in banking deregulations over and above the heightened facility expansions of existing�rms. Since startups are particularly dependent on banks for external �nance, these results canalso be interpreted as a technique for understanding how much more important changes in thestructure of the banking industry are for entrepreneurship relative to existing �rms.
With this comparison in mind, we move to a more stringent speci�cation that exploits thefull potential of the Census Bureau data. We calculate from the LBD entry counts by cells
18As in Table 1, we identify commercial bank establishments as SIC 602. A particular advantage of theLBD data in this context is the ability to study the long-run e¤ects of these reforms on the number and size ofout-of-state banks. Following the Riegle-Neal Act of 1994, banks are not required to hold their assets locally ineach subsidiary. Accordingly, prior studies using bank assets have been limited in their ability to draw inferencesbeyond 1994. Since the LBD focuses on establishment-level employment, it provides a consistent longitudinalmetric before and after the Riegle-Neal Act.
14

constructed on four dimensions: state, SIC2 industry, year, and type (i.e., startup or existing�rm). Put another way, we stack the data so that both entry types are included in the sameregression rather than in separate regressions; we also incorporate the industry dimension. Over110k observations are created through this technique. We can easily relate this augmentedspeci�cation, however, to the earlier state-year estimations through the speci�cation,
ln(BIRTypesit ) = �Typesi + �Typet +3X
q=�2�StartupTRAt+q�TRA
Startupst+q + �StartupTRAt+4TRA
Startupst+4 (3)
+
3Xq=�2
�ExistingTRAt+q�TRAExistingst+q + �ExistingTRAt+4TRA
Existingst+4
+
3Xq=�2
�StartupTERt+q�TERStartupst+q + �StartupTERt+4TER
Startupst+4
+3X
q=�2�ExistingTERt+q�TER
Existingst+q + �ExistingTERt+4TER
Existingst+4 + �Typesit :
In this speci�cation, �Typesi is a vector of state-industry-type cross-sectional �xed e¤ects similarto state vector �s in (2). Likewise, �
Typet extends the earlier vector of year �xed e¤ects � t to be
by Type. These two extensions allow the startups and existing �rms to have independent panele¤ects as in Table 3�s separated regressions. The remainder of (3) interacts the dynamic TRAand TER deregulation indicators from (2) to be by Type. By interacting both Type forms, themain e¤ect is dropped and the coe¢ cients replicate the single Type speci�cations above.19
The �rst column of Table 4 shows this proposed similarity. The dependent variable is againthe log establishment entry counts in constructed cells. The �rst block of coe¢ cients is for thestartup type interactions with the two sets of reforms; these coe¢ cients are very close to theestimates in Column 1 of Table 3. The lower block shows interactions for expansions by existing�rms; these parallel Column 2 of Table 3. These coe¢ cients are estimated jointly, with standarderrors conservatively clustered at the state-type level. The minor di¤erences to Table 4 comefrom including the industry dimension, but the dynamic patterns and coe¢ cient magnitudes aresimilar to the earlier estimates.
Columns 2 through 4 of Table 4 extend (3) to include state-industry-year �xed e¤ects �sit;
19Similar to the earlier speci�cations, we include interactions for Economic Census years and weight the re-gressions by the 1977-1985 birth employments in the state-industry cell. While all state-year observations havestartup and facility expansions, this is not true at the industry level. To maintain a consistent observationcount in log speci�cations, we recode a zero entry count as one and include unreported dummies for zero countobservations by type. The results are robust to dropping these observations entirely; in general, these cellsreceive very small weight.
15

ln(BIRTypesit ) = �Typesi + �Typet + �sit (4)
+3X
q=�2�StartupTRAt+q�TRA
Startupst+q + �StartupTRAt+4TRA
Startupst+4
+3X
q=�2�StartupTERt+q�TER
Startupst+q + �StartupTERt+4TER
Startupst+4 + �Typesit :
As these additional �sit �xed e¤ects saturate the model, the dynamic coe¢ cients for startup �rmsbecome relative to the establishment expansions of existing �rms. Indeed, this speci�cation isonly possible by contrasting types within a state-industry-year cell, and separate coe¢ cients forexpansion establishments are no longer estimated.
The �sit �xed e¤ects fully absorb changes in local conditions at the state-industry level.They thus account for the state-year and industry-year dynamics typically modelled in thisliterature.20 Moreover, the �sit �xed e¤ects control for the unique outcomes of specialized state-industry combinations like software in Silicon Valley and the automotive industry in Michigan.This modelling advantage goes well beyond long-term levels di¤erences. It further captureslongitudinal changes at the state-industry level in overall entry rates, sector sizes, and businessvolatilities.
From an econometric standpoint, this speci�cation allows us to isolate the elasticity frommore potential omitted factors. As omitted factors would need to operate within state-industrycells, this technique provides new con�dence against endogeneity concerns. This structurealso demonstrates the comparability of our count-based estimations and entry-rate formulationsrelative to local cell sizes. From a substantive perspective, this stacked speci�cation directlycontrasts the growth of startup entry following the banking reforms to the establishment expan-sions of existing �rms. This allows us to better tease out the impact of the changing �nancialconditions for entrepreneurship speci�cally versus economic growth more generally.
Column 2�s di¤erential elasticity estimate of 11% for startups relative to the opening ofnew establishments by existing �rms is our preferred estimation. This estimate is statisticallydi¤erent from zero; recall that this statistical di¤erence could not be established with the ear-lier state-year estimations. Among states, California has the largest impact on the interstate�ndings, but excluding this state results in only a small elasticity decrease to 8% that remainsstatistically signi�cant. Columns 3 and 4 report two other robustness checks, the �rst an un-weighted speci�cation and the second dropping the period after the passage of the Riegle-Neal
20It is important to note that cross-sectional �xed e¤ects are also included. Estimations without the cross-sectional controls can be biased by the non-proportional allocation of industries across states, even if state-yearand industry-year controls are included.
16

Act of 1994 that allowed national interstate branch banking. The continued positive elasticityand the dynamic pattern suggest that the interstate deregulations had a positive impact forentrepreneurship relative to existing businesses. More generally, it points to speci�c �nancingconstraints faced by entrepreneurs that were in part eased by these reforms.
Table 4 again highlights that there was no consistent e¤ect of the intrastate banking dereg-ulations on entry rates. These results are consistent with Black and Strahan (2002) and alsohighlight that their �nding that the intrastate banking deregulations had marginal e¤ects onentry was not driven by compositional di¤erences in industry growth across states. Given thehigh rates of entry subsequent to the interstate deregulations, the lack of entry following theintrastate reforms is somewhat puzzling. We discuss this, and related issues, in greater detailin Section 5 below.
Table 5 further examines whether di¤erences across industries are consistent with our bank-ing constraints and entrepreneurship hypothesis. If startups are more �nancially constrained,the relative entry elasticities of startups compared to facility expansions should be greater inindustries that are more dependent on external �nance compared to less dependent industries.We follow Rajan and Zingales (1998), Cetorelli and Strahan (2006), and Aghion et al. (2007) inconstructing a metric of industry-level dependence on external �nance.21 The higher coe¢ cientmagnitudes for �nancially dependent sectors support the theoretical prediction, although someof the long-term elasticities are not statistically di¤erent between the two industry groupings.The di¤erences within manufacturing �the typical sector studied in these papers �are strongerthan the overall di¤erences.
Overall, the industry dimension again supports the interpretation of interstate banking re-forms acting to increase startup entry relative to facility expansions. These results primarilyserve as a robustness check and to relate our work to the literature. This test, however, ismore stringent than has been identi�ed in prior work on credit constraints. We have threedi¤erences: pre-post reforms, startups versus facility expansions, and industry-dependence onexternal �nance.
4.4 Stacked Estimations of Entry Size
Having documented the e¤ect of the banking reforms on the overall entry rates for startupestablishments, we turn to the distribution of entry sizes for �rms. Theoretical models suggestthat even if potential entrepreneurs are not precluded from starting new businesses due to
21We compute a measure of external dependence at the SIC2 level through the universe of Compustat �rmsin the �Industrial Annual�database for 1990-2000. We then create an indicator variable for an industry beingabove or below the median external dependence that is interacted with the regressors. Main e¤ects are absorbedinto the cross-sectional �xed e¤ects.
17

�nancing constraints, they may still start �rms that are smaller than optimal for the projectsat hand (e.g., Evans and Jovanovic 1989). If indeed the increases in relative entry rates are anindication of �nancing constraints facing potential entrepreneurs, we may also �nd e¤ects in theintensive margin of initial �rm employment.
Empirically identifying the e¤ect of changes in �nancing constraints on the intensive marginof entry is complicated by the fact that there are simultaneous changes in both the extensive andthe intensive margins. The ideal estimations would compare entry sizes before and after thereforms for �rms that would have entered regardless of the banking deregulations. In this case,average entry size could be an appropriate metric. The earlier estimations, however, documentthat greater entry is facilitated by the deregulations, and we do not have a way of distinguishingwhich �rms would have entered in the counterfactual. This is particularly true at the lower endof the size distribution, where we might expect to see the strongest e¤ects on both the intensiveand extensive margins of greater �nancial access.
To clarify these issues, we �rst repeat the stacked speci�cation with the vector of state-industry-year e¤ects (4) for di¤erent entry sizes. We group entering establishments into foursize categories based upon employment in the year of entry: 1-5 employees, 6-20 employees,21-100 employees, and over 100 employees. The coe¢ cients on the banking reform indicatorsin these regressions estimate the relative elasticity of startup entry to facility expansions withineach size grouping. The results of these regressions are reported in the �rst four columns ofTable 6.
Table 6 shows that relative growth in startup entry rates following the interstate deregulationsare particularly strong at the lower end of the entry-size distribution. The increased entry of�rms with fewer than 20 employees o¤ers the best indication of the extensive margin of entry.The greater relative increase in entry within the 6-20 employee category suggests that while �rmsentering at very small sizes may be able to substitute bank �nance with personal savings andfunds from friends and family, this is less likely to be true for those trying to enter at somewhathigher �rm sizes (e.g., Fluck et al. 1998). The coe¢ cient in this speci�cation implies a 22%increase in the relative entry of the 6-20 employee category following the interstate deregulations.Although much weaker, there is also an indication of increased entry at even larger �rm sizes,suggesting that the reforms may have a¤ected the intensive margin by boosting the size at which�rms enter. This entry pattern is therefore consistent with �nancing constraints impacting bothextensive and intensive margins of entrepreneurship.22
We also undertake a second test in Column 5 of Table 6 that employs the longitudinal natureof the Census Bureau data. We �rst restrict the sample to the 1977-1996 period to allow us22Table 6 �nds more mixed evidence than the aggregate entry regressions regarding the impact of intrastate
deregulations. There is some evidence that relative entry rates for startups, especially in the larger size categories,may have declined following these reforms.
18

to observe entrants for three years after their foundings; we also condition the sample on cellswhere entry occurs. For each establishment that survives three years, we calculate its entrysize relative to the maximum employment it achieves in its �rst three years of operation. Wethen calculate the mean of this entry-size ratio by state-industry-type-year cells. Examiningthe unweighted means across these cells, startup �rms and facility expansions enter at 68% and75% of their maximum three-year sizes, respectively.
These lower relative entry sizes for startups may directly re�ect �nancing constraints onthe intensive margin, but the di¤erential may include other factors like increased caution dueto greater uncertainty. To assess whether �nancing constraints play an important role, wetest whether startups enter closer to their maximum three-year sizes after the banking dereg-ulations. Using the stacked framework with the vector of state-industry-year e¤ects (4), theestimation is again a comparison to the baseline provided by facility expansions. This approachprovides a more direct metric of �nancing constraints on the intensive margin by looking within-establishment rather than at the cross-section of entry. It is potentially limited, however, bythe conditioning on survival for three years.23
Column 5 of Table 6 again �nds no measurable impact on the intensive margin followingthe intrastate deregulations. Following the interstate deregulations, however, there was a 2%increase in the entry sizes of startups compared to the maximum sizes they achieved in the �rstthree years of operation. This estimation is again a relative comparison to the responses ofexpansion establishments for existing �rms, providing evidence that entrepreneurs in particularare able to enter closer to their optimal project sizes following the deregulations. While a fullanalysis of entry sizes requires a broader investigation of the �rm-size distribution, this resultagain suggests that the e¤ects of �nancing constraints for entrepreneurship are present on boththe extensive and intensive entry margins.
4.5 Stacked Estimations of Establishment Exit Rates and Churn
We now turn to the impact of the banking deregulations on establishment exits and churn. Oneof the ways that banking deregulations are argued to facilitate the process of creative destructionis through improved allocative e¢ ciency by moving capital away from poorly performing �rmsto better opportunities (e.g., Bertrand et al. 2007). Table 7 tests this hypothesis within the USby documenting exit rates across di¤erent parts of the establishment size distribution. As with
23In particular, startups have di¤erent hazard functions of failure relative to facility expansions, and this mayintroduce some bias in the mean ratios. Taking manufacturing as an example, about 50% of startups fail intheir �rst three years of operation versus 40% of expansion establishments. The three-year window trades o¤this survival bias with allowing more time for new establishments to reach their desired size (e.g., due to internalcash �ows or better external �nance opportunities).
19

Table 6, the coe¢ cients re�ect the relative increase or decline in exit rates for single-unit �rmscompared to establishments belonging to multi-unit �rms.
Similar to the entry speci�cations, relative exits increased following the interstate deregu-lations, while no impact is evident with the intrastate reforms. Columns 2 and 3 of Table 7document that exit rates for single-unit �rms with 20 employees or fewer increased more than20% compared to establishments belonging to multi-unit �rms. The relative increase in startupexits with �ve employees or less, in fact, exceed the entry gains documented in Table 6. How-ever, this is not due to a large, absolute decline in the number of small �rms. Rather, as wedocument in Table 8, it is due to the dramatic increase in the number of very short-lived estab-lishments at the lower end of the size distribution. In the growing US economy, �rm starts aregreater in number than �rm closures throughout the period studied. Adding these churningestablishments to these starts and exits results in a higher elasticity for exits.
Examining the upper end of the size distribution, the relative increase in exits for largersingle-unit �rms was substantially smaller than at the lower end. Moreover, the di¤erencesbetween single-unit and multi-unit establishments are only marginally signi�cant statistically.The direction of these responses, however, do suggest that there was not a large-scale increasein the closure of poorly performing incumbent �rms following the reforms. If this were true,exit rates for single-unit �rms at the higher end of the size distribution would have been lower.This limited closure suggests that the dramatic increases in entry promoted by the deregulationslikely resulted in much smaller changes in product market structure.
Table 8 brings these entry and exit results together. We separate entry of new establishmentsinto those that survive more than three years (labeled longer-term entrants) and those that exitwithin three years of entry (labeled churn). Similar to the entry-size estimations, this sampleis restricted to the 1977-1996 period to allow us to observe these outcomes.
Panel A demonstrates that longer-term entry following the interstate deregulations was fairlyconsistent across the entry-size distribution, with even the largest startup establishments expe-riencing a 10% increase in entry rates relative to facility expansions. This uniformity acrossthe size distribution contrasts sharply with Table 6�s skewness of overall entry towards the lowerend of the size distribution. Since these large establishments are not as likely to be creditconstrained on the extensive margin, these results are consistent with the view that allocativee¢ ciency improved following the deregulations. That is, startup �rms may have received �-nancing for projects that they would not have prior to the deregulations because they were not�insiders�or past clients of banks.
Panel B of Table 8 paints a more dramatic picture of the e¤ects of the US banking deregu-lations. We �nd a 27% increase in churning for startups relative to existing �rms following the
20

interstate banking deregulations. Moreover, all of this churning increase came from �rms thatentered with 100 employees or fewer; no response is evident in the largest size category.24 Thisenormous increase in short-lived entry of small �rms reconciles Table 6�s skewness of overallentry towards the lower end of the size distribution with the uniformity of longer-term entryacross the size distribution evident in Panel A of Table 8. This churning is further evident inTable 7�s substantial growth in relative startup exits among �rms with 20 employees or fewer.
This substantial increase in the entry of new establishments that fail within three years wasnot just a consequence of banks learning about di¤erent markets following the deregulations.The dynamic pattern suggests the churning e¤ect grows after the deregulations to its highestlevel four or more years subsequent to the reform. This pattern also cannot be explained solelythrough a model of improved ex ante allocative e¢ ciency on the part of banks. Instead, itsuggests the deregulations also impact the process of creative destruction by �democratizing�entry. Many, many more �rms are started, some of which ultimately compete with and perhapsdisplace incumbents. A large number of these entrants, however, fail along the way.
The outcomes documented in Table 8 suggest that the net result of the US banking deregula-tions for the displacement of incumbents should be much weaker than the deregulation�s impacton entry itself. We con�rm this to be true in estimations that track the �ve or ten largest�rms in 1980 for each state-industry cell over the sample period. We �nd that the interstatederegulations subsequently reduced these (log) incumbent market shares by approximately 0.5%.While this e¤ect is statistically signi�cant, it is modest in economic magnitude. We also do not�nd measurable changes in Her�ndahl indices of local industry structure. These estimations,available upon request, con�rm that the dramatic increase in entry translated much less intochanges in overall market leadership.25
5 Conclusions
Although there is a growing consensus that �nancial markets play an important role in drivingeconomic growth, the micro-foundations behind this relationship are much less understood. Therole of the banking industry in promoting entry through the e¢ cient allocation of capital is ofparticular interest in this context, since there is increasing evidence that entrepreneurship playsa key role in facilitating innovation, impacting industry structure, and promoting economicgrowth.
24Some evidence of a lead e¤ect exists for the smallest entrants following the interstate reform (Table 8, PanelB). The dynamic growth in coe¢ cients, along with the general absence of lead e¤ects on the entry and exitmargins throughout this paper, mitigates this concern.25This result di¤ers from Bertrand et al. (2007) and is most likely due to better pre-reform banking conditions
in the US compared to France.
21

This paper examines how the increase in US banking competition through the deregulationof branch banking a¤ected both the entry and survival of new establishments. We employunique establishment-level data housed in the Census Bureau�s Longitudinal Business Database.These micro-records facilitate several analyses that have not been undertaken in prior work.First, they allow us to compare the elasticity of entry for startups relative to the opening of newplants by existing �rms. This technique controls for a greater set of omitted variables than priorwork and isolates better the di¤erential e¤ect of �nancial-sector reforms for entrepreneurship.Second, the longitudinal structure enables examinations of how entry sizes were a¤ected by thereforms, how entry and exit rates changed throughout the establishment size distribution, andhow the survival rates of new ventures changed. This detail sheds more light on the mechanismsthrough which the deregulations impacted product market outcomes.
We do not �nd that the intrastate branch banking deregulations had a consistent, measuredimpact on either the entry rates or the entry sizes of new establishments. This was true forboth startups and new establishments of existing �rms. Our �ndings suggest that the intrastatebranch banking deregulations did not a¤ect the competitive environment of the local bankingindustry signi�cantly, at least not in such a way that a¤ected the net entry of new businesses.
On the other hand, the interstate deregulations had a strong, positive e¤ect on the entry ofstartups compared to facility expansions by existing �rms �an overall relative elasticity of 11%.Among startups entering with 20 or fewer employees, the elasticity was even higher at 15-22%.We also �nd evidence for growth in employment size at entry. Overall, our results suggest thatthe US deregulations reduced �nancing constraints and bene�ted startups more than existing�rms. We also �nd some evidence consistent with the view that the deregulations improvedallocative e¢ ciency and somewhat reduced market shares of incumbents in product markets.
The more striking �nding, however, is the growth in entrepreneurial churn at the lower endof the size distribution. We �nd that the entry of startup establishments that fail within threeyears increased as much as 30% relative to new establishments of existing �rms. While weare not yet able to distinguish between various explanations for this churning result26, it doeshighlight that the increase in banking competition seems to �democratize�entry. The US bankingderegulations facilitated the process of creative destruction not just by improved e¢ ciency inthe ex ante allocation of capital, but also through large-scale entry and subsequent closures of�rms ex post.
The churning results also help reconcile the apparent contradictory �ndings of Black andStrahan (2002), who report large increases in entry rates of startups following the interstate
26Possible explanations include 1) lower �nancing constraints leads to weaker or more frivolous entry (e.g.,Nanda 2007), 2) greater competition leads to higher failure rates, and 3) changes in the structure of banking �in particular the loss of relationship banking �cause the churn.
22

deregulations, and Cetorelli and Strahan (2006), who report a decline in the overall share of�rms at the lower end of the �rm-size distribution following the same reforms. We �nd thatmuch of the entry at the lower end of the size distribution was short-lived. Our churning resultthus helps explain why the large growth in entrepreneurship did not translate into larger changesin �rm-size distribution.
Further, this paper sheds light on a possible reason why studies regarding the e¤ects ofbanking competition on small businesses have had somewhat contradictory results. Consistentwith the literature documenting a fall in credit extended to small businesses in the early 1990s(e.g., Berger et al. 2001; Zarutskie 2006), we also �nd a dip in startup activity over thatperiod. Indeed, we further document how the relative growth of startups has lagged behind thegrowth of establishment openings by existing �rms since the late 1970s (e.g., Davis et al. 2006).The positive elasticities of our panel estimations, however, suggest that increases in bankingcompetition in part dampened national declines in startup entry in states that deregulatedinterstate branch banking relative to states that did not.
We see two areas in particular that warrant further study. First, the speci�c mechanismsthrough which the increased banking competition impacted entrepreneurial entry should beanalyzed, especially the trade-o¤ between greater competition and the bene�ts of relationshipbanking. The limited impact of the intrastate deregulations for entry rates, especially comparedto the interstate deregulations, suggests that either the intrastate deregulations did not haveenough bite or that there was something speci�c about the out-of-state banks that was importantfor promoting entrepreneurship. While some argue that the interstate deregulations enhancedthe market for corporate control, others suggest that the main bene�ts of the interstate bankingderegulation were the better allocation of credit and the better use of technology by the large,multi-state banks.
Understanding these mechanisms is an important question for future analysis, especiallywhether the reforms came at the expense of �rms that rely more on soft information. Forexample, our �ndings that so many �rms fail within the �rst three years, particularly at lowerend of the size distribution, leaves open the possibility that there may in fact be a dark side tobanking deregulations for entrepreneurial startups as suggested by Petersen and Rajan (1995).If changes in the organizational structure of banks following the deregulation led to di¤erentlending strategies (e.g., Berger et al. 2005; Sah and Stiglitz 1986) or lowered the ability for banksto evaluate projects because of weaker relationships, this may have had negative consequencesfor the survival of startups. On the other hand, the higher churning result may also implygreater e¢ ciency in that banks were quicker to terminate weaker �rms after the reforms (e.g.,Gine and Love 2006).
Second, relating product market changes due to US banking deregulations to aggregate pro-
23

ductivity growth is an important area of further investigation. Our results, and those of Blackand Strahan (2002), emphasize that interstate banking deregulations had a much larger impacton the entry and exit of �rms than the intrastate deregulations. A number of studies regardingaggregate productivity growth emphasize the importance of reallocations across �rms versuswithin-establishment growth (e.g., Foster et al. 2001). These two literature strands are hard toreconcile, however, with Jayaratne and Strahan�s (1996) �nding that intrastate deregulations hada more consistent impact for US output and productivity growth than the interstate reforms.27
Perhaps our churning �nding can bridge this gap. We intend to investigate this in future studiesof how greater �nancial access and increased entrepreneurship might have long-term impacts onindustrial structure and economic performance.
27This puzzle exists within panel estimations, like our work and Jayaratne and Strahan (1996), and also at theaggregate level. Davis et al. (2006) note that the aggregate US trend towards declining �rm volatility from the1970s onward is di¢ cult to reconcile with the large US aggregate productivity gains over the same period usingstandard Schumpeterian theories.
24

References[1] Aghion, P., T. Fally, and S. Scarpetta. 2007. �Credit constraints as a barrier to the entry
and post-entry growth of �rms.�Economic Policy, pp. 731-79.
[2] Autor, D., W. Kerr, and A. Kugler. 2007. �Does employment protection reduce productiv-ity? Evidence from U.S. states.�Economic Journal, 117:521, pp. 189-217.
[3] Banerjee, A. and E. Du�o. 2004. �Do �rms want to borrow more? Testing credit constraintsusing a directed lending program.�MIT Working Paper.
[4] Beck, T. and R. Levine. 2002. �Industry growth and capital allocation: Does having amarket - or bank - based system matter?�Journal of Financial Economics, 64:2, pp. 147-80.
[5] Beck, T., R. Levine, and N. Loayza. 2000. �Finance and the sources of growth.�Journal ofFinancial Economics, 58:1-2, pp. 261-300.
[6] Berger, A. N., A. K. Kashyap, and J. M. Scalise. 1995. �The transformation of the USbanking industry. What a long, strange trip it�s been.� Brookings Papers on EconomicActivity, 2, pp. 55-218.
[7] Berger, A. N., L. F. Klapper, and G. F. Udell. 2001. �The ability of banks to lend toinformationally opaque small businesses.�Journal of Banking & Finance, 25:12, pp. 2127-67.
[8] Berger, A. N., N. H. Miller, M. A. Petersen, R. G. Rajan, and J. C. Stein. 2005. �Doesfunction follow organizational form? Evidence from the lending practices of large and smallbanks.�Journal of Financial Economics, 76:2, pp. 237-69.
[9] Berger, A. N. and G. F. Udell. 1995. �Relationship lending and lines of credit in small �rm�nance.�Journal of Business, 68:3, pp. 351-81.
[10] Berger, A. N. and G. F. Udell. 2002. �Small business credit availability and relationshiplending: The importance of bank organisational structure.�Economic Journal, 112:477, pp.F32-F53.
[11] Bertrand, M., E. Du�o, and S. Mullainathan. 2004. �How much should we trust di¤erencein di¤erences estimates?�The Quarterly Journal of Economics, 119:1, pp. 249-75.
[12] Bertrand, M., A. Schoar, and D. Thesmar. 2007. �Banking deregulation and industry struc-ture: Evidence from the French banking reforms of 1985.� Journal of Finance, 62:2, pp.597-628.
[13] Black, S. E. and P. E. Strahan. 2001. �The division of spoils: Rent sharing and discrimina-tion in a regulated industry.�American Economic Review, 91:4, pp. 814-31.
[14] Black, S. E. and P. E. Strahan. 2002. �Entrepreneurship and bank credit availability.�Journal of Finance, 57:6, pp. 2807-33.
[15] Cabral, L. M. B. and J. Mata. 2003. �On the evolution of the �rm size distribution: Factsand theory.�American Economic Review, 93:4, pp. 1075-90.
[16] Cetorelli, N. 2004. �Real e¤ects of bank competition.�Journal of Money, Credit and Bank-ing, 36:3, pp. 543-58.
[17] Cetorelli, N. and M. Gambera. 2001. �Banking market structure, �nancial dependence andgrowth: International evidence from industry data.�Journal of Finance, 56:2, pp. 617-48.
25

[18] Cetorelli, N. and P. E. Strahan. 2006. �Finance as a barrier to entry: Bank competitionand industry structure in local U.S. markets.�Journal of Finance, 61:1, pp. 437-61.
[19] Davis, S., J. Haltiwanger, R. Jarmin, and J. Miranda. 2006. �Volatility and dispersion inbusiness growth rates: Publicly traded versus privately held �rms.�NBER Working Paper12354.
[20] Davis, S., J. Haltiwanger, and S. Schuh. 1996. Job Creation and Destruction, Cambridge:MIT Press.
[21] Dumais, G., G. Ellison, and E. Glaeser. 2002. �Geographic concentration as a dynamicprocess.�Review of Economics and Statistics, 84, pp. 193-204.
[22] Dunne, T., M. Roberts, and L. Samuelson. 1989, �Patterns of �rm entry and exit in U.S.manufacturing industries.�The RAND Journal of Economics, 19, pp. 495-515.
[23] Ellison, G., E. Glaeser, andW. Kerr. 2007. �What causes industry agglomeration? Evidencefrom coagglomeration patterns.�NBER Working Paper 13068.
[24] Erel, I. 2006. �The e¤ect of bank mergers on loan prices: Evidence from the U.S.�WorkingPaper.
[25] Evans, D. S. and B. Jovanovic. 1989. �An estimated model of entrepreneurial choice underliquidity constraints.�Journal of Political Economy, 97:4, pp. 808-27.
[26] Fazzari, S. M., R. G. Hubbard, and B. C. Petersen. 1988. �Financing constraints andcorporate investment.�Brookings Papers on Economic Activity, 1, pp. 141-95.
[27] Fluck, Z., D. Holtz-Eakin, and H. S. Rosen. 1998. �Where does the money come from? The�nancing of small entrepreneurial enterprises.�NYU Stern Working Paper.
[28] Foster, L., J. Haltiwanger, and C.J. Krizan. 2001. �Aggregate productivity growth: Lessonsfrom the microeconomic evidence.�In Dean E., M. Harper, and C. Hutten, ed. New Devel-opments in Productivity Analysis, Chicago: University of Chicago Press.
[29] Gentry, W. and G. Hubbard. 2000. �Entrepreneurship and household saving.�NBERWork-ing Paper 7894.
[30] Gine, X. and I. Love. 2006. �Do reorganization costs matter for e¢ ciency? Evidence froma bankruptcy reform in Colombia.�World Bank Policy Research Working Paper 3970.
[31] Glaeser, E. and W. Kerr. 2007. �Local industrial conditions and entrepreneurship: Howmuch of the spatial distribution can we explain?�Working Paper.
[32] Hurst, E. and A. Lusardi. 2004. �Liquidity constraints, household wealth, and entrepre-neurship.�Journal of Political Economy, 112:2, pp. 319-47.
[33] Janicki, H. and E. Prescott. 2006. �Changes in the size distribution of U.S. banks: 1960-2005.�Federal Reserve Bank of Richmond Economic Quarterly, 92:4, pp. 291-316.
[34] Jarmin, R. and J. Miranda. 2002. �The longitudinal business database.� CES WorkingPaper.
[35] Jayaratne, J. and P. E. Strahan. 1996. �The �nance-growth nexus: Evidence from bankbranch deregulation.�Quarterly Journal of Economics, 111:3, pp. 639-70.
26

[36] Kane, E. J. 1996. �De Jure interstate banking: Why only now?� Journal of Money, Creditand Banking, 28:2, pp. 141-61.
[37] Kaplan, S. N. and L. Zingales. 1997. �Do investment-cash �ow sensitivities provide usefulmeasures of �nancing constraints?�Quarterly Journal of Economics, 112:1, pp. 169-215.
[38] Kaplan, S. N. and L. Zingales. 2000. �Investment-cash �ow sensitivities are not valid mea-sures of �nancing constraints.�Quarterly Journal of Economics, 115:2, pp. 707-12.
[39] King, R. G. and R. Levine. 1993a. �Finance and growth - Schumpeter might be right.�Quarterly Journal of Economics, 108:3, pp. 717-37.
[40] King, R. G. and R. Levine. 1993b. �Finance, entrepreneurship, and growth - Theory andevidence.�Journal of Monetary Economics, 32:3, pp. 513-42.
[41] Kroszner, R. S. and P. E. Strahan. 1999. �What drives deregulation? Economics and politicsof the relaxation of bank branching restrictions.�Quarterly Journal of Economics, 114:4,pp. 1437-67.
[42] Laeven, L. 2000. �Does �nancial liberalization relax �nancing constraints on �rms?�WorldBank Working Paper 2467.
[43] Levine, R. 1997. �Financial development and economic growth: Views and agenda.�Journalof Economic Literature, 35:2, pp. 688-726.
[44] Levine, R., N. Loayza, and T. Beck. 2000. �Financial intermediation and growth: Causalityand causes.�Journal of Monetary Economics, 46:1, pp. 31-77.
[45] Moyen, N. 2004. �Investment-cash �ow sensitivities: Constrained versus unconstrained�rms.�Journal of Finance, 59:5, pp. 2061-92.
[46] Nanda, R. 2007. �Cost of external �nance and selection into entrepreneurship.�HBS Work-ing Paper.
[47] Paravisini, D. 2005. �Constrained banks and constrained borrowers: The e¤ect of bankliquidity on the availability of credit.�Working Paper.
[48] Petersen, M. A. and R. G. Rajan. 1994. �The bene�ts of lending relationships - Evidencefrom small business data.�Journal of Finance, 49:1, pp. 3-37.
[49] Petersen, M. A. and R. G. Rajan. 1995. �The e¤ect of credit market competition on lendingrelationships.�Quarterly Journal of Economics, 110:2, pp. 407-43.
[50] Rajan, R. G. and L. Zingales. 1998. �Financial dependence and growth.�American Eco-nomic Review, 88:3, pp. 559-86.
[51] Rajan, R. G. and L. Zingales. 2003. �The great reversals: The politics of �nancial develop-ment in the twentieth century.�Journal of Financial Economics, 69:1, pp. 5-50.
[52] Sah, R. K. and J. E. Stiglitz. 1986. �The architecture of economic systems: Hierarchies andpolyarchies.�American Economic Review, 76:4, pp. 716-27.
[53] Stein, J. C. 2002. �Information production and capital allocation: Decentralized versushierarchical �rms.�Journal of Finance, 57:5, pp. 1891-921.
[54] Zarutskie, R. 2006. �Evidence on the e¤ects of bank competition on �rm borrowing andinvestment.�Journal of Financial Economics, 81, 503-37.
27

Fig. 1: U.S. Branch Banking Deregulations
0
10
20
30
40
50
p1970 1973 1977 1981 1985 1989 1993
Cum
ulat
ive
Stat
es P
assi
ng R
efor
ms
Intrastate Deregulations Interstate Deregulations
LBD Sample Period
Fig. 2: Relative Birth Counts by Type
80%
90%
100%
110%
120%
130%
140%
1977-1981 1982-1986 1987-1991 1992-1996
Entr
y C
ount
s R
elat
ive
to 1
977-
1981
Startup Entry Ct. MU Firm Entry Ct. Total LBD Empl.

Fig. 3: Distribution of Entry Sizes All Sectors, By Type of Entrant
0%
20%
40%
60%
80%
100%
Over 100 21-100 6-20 1-5
Number of Employees in the First Year of Operation
Cum
ulat
ive
Shar
e of
Ent
rant
s
Multi-Unit Firms Startup Firms
Fig. 4: Distribution of Entry Sizes Manufacturing Sector, By Type of Entrant
0%
20%
40%
60%
80%
100%
Over 100 21-100 6-20 1-5
Number of Employees in the First Year of Operation
Cum
ulat
ive
Shar
e of
Ent
rant
s
Multi-Unit Firms Startup Firms

1977 1994
12,810 8,547
79.0% 69.8%0.3% 2.6%
38,231 64,155
49.5% 65.9%52.4% 62.4%2.4% 25.3%
1979 1994
12,463 7,92680.3% 71.1%
3.26 4.029% 19%
14% 7%
Table 1B: Asset-Based Descriptive Statistics on U.S. Banking Industry
Total Number of Banking Organizations
Source: Berger et al. (2001).
Small Banks (less than $100m in assets)
Real Gross Industry Assets (in trillions of 1994 dollars)Industry Assets in Megabanks (more than $100b in assets)Industry Assets in Small Banks (less than $100m in assets)
Table 1A: LBD-Based Descriptive Statistics on U.S. Banking Industry
Notes: Descriptive details taken from LBD for SIC 602 (1987 classifications).
Total Number of Banking Organizations
% with less than 50 employees % with branches in multiple states
Total Number of Banking Branches
% owned by banks with 500+ employees % owned by banks with mean 500+ employees before 1985 % owned by banks originally located in other states

All New Multi-Unit All Single-Unit Multi-Unit All New Multi-UnitEntrants Startups Facilities Exits Firms Facilities Entrants Start-ups Facilities
Mean Annual Counts 407,783 335,807 71,976 362,376 299,668 62,708 173,371 153,519 19,852
Mean Annual Empl. 3,811,409 2,081,801 1,729,608 3,454,544 1,919,014 1,535,530
Mean Annual Size 9.3 6.2 24.0 9.5 6.4 24.5
Share of Entrants 43% 46% 28%
Size Distribution
1-5 Employees 70.3% 75.9% 44.4% 71.3% 76.1% 48.6% 76.2% 79.3% 51.9% 6-20 Employees 22.8% 19.8% 36.6% 21.5% 19.2% 32.5% 18.8% 17.1% 31.6% 21-100 Employees 5.8% 3.8% 14.9% 6.1% 4.3% 14.6% 4.4% 3.2% 13.1% 100+ Employees 1.1% 0.4% 4.1% 1.1% 0.5% 4.3% 0.7% 0.4% 3.4%
Sector Distribution
Manufacturing 9% 9% 6% 9% 9% 9% 8% 9% 7% Services 28% 29% 22% 27% 28% 20% 29% 30% 23% Wholesale Trade 12% 11% 17% 12% 11% 19% 11% 10% 18% Retail Trade 25% 22% 42% 27% 25% 40% 25% 23% 38% Mining 1% 1% 1% 1% 1% 1% 1% 1% 2% Construction 17% 20% 1% 17% 20% 2% 18% 20% 2% Transportation 7% 7% 10% 7% 6% 9% 7% 7% 10%
Geographic Distribution
Northeast 19% 20% 17% 20% 20% 18% 18% 18% 17% South 36% 35% 37% 35% 35% 35% 37% 37% 37% Midwest 22% 21% 24% 22% 21% 24% 20% 20% 23% West Coast 24% 24% 22% 23% 23% 22% 24% 24% 23%
Notes: Descriptive statistics for establishments outside of the financial sector in the Longitudinal Business Database. Entry and exit statistics are calculated over 1977-1998. Churning entrants, defined as new establishments failing within three years of entry, are calculated over 1977-1996. The size distribution of churning entrants is calculated in their first year of operation. Jarmin and Miranda (2002) describe the construction of the LBD. The LBD includes incorporated firms only; unincorporated businesses and partnerships are not considered in this study. Sectors not included in the LBD are agriculture, forestry and fishing, public administration, and private households. We also exclude the US postal service, restaurants and food stores, hospitals, education services, and social services. Incomplete LBD records require dropping 25 state-year files: 1978 (12 states), 1983 (4), 1984 (4), 1985 (1), 1986 (1), 1989 (1), and 1993 (2).
Table 2: LBD Descriptive Statistics on U.S. Product MarketsEntering Establishments Exiting Establishments Churning Establishments
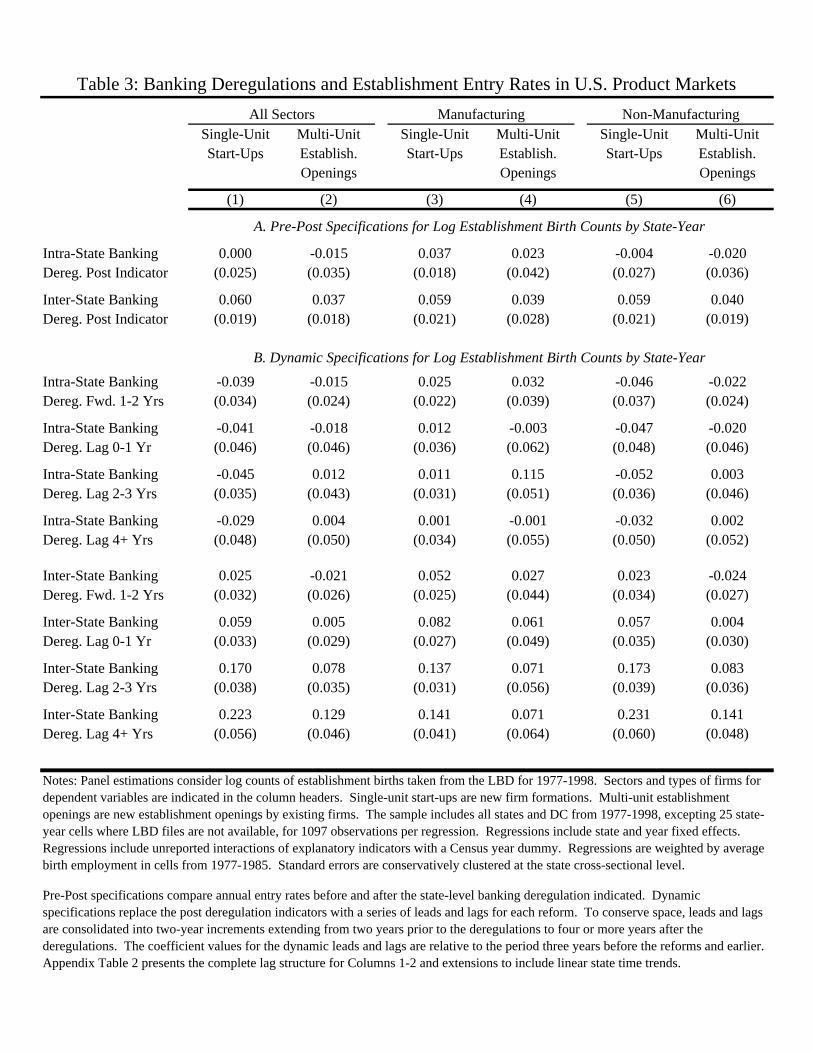
Single-Unit Multi-Unit Single-Unit Multi-Unit Single-Unit Multi-UnitStart-Ups Establish. Start-Ups Establish. Start-Ups Establish.
Openings Openings Openings
(1) (2) (3) (4) (5) (6)
Intra-State Banking 0.000 -0.015 0.037 0.023 -0.004 -0.020Dereg. Post Indicator (0.025) (0.035) (0.018) (0.042) (0.027) (0.036)
Inter-State Banking 0.060 0.037 0.059 0.039 0.059 0.040Dereg. Post Indicator (0.019) (0.018) (0.021) (0.028) (0.021) (0.019)
Intra-State Banking -0.039 -0.015 0.025 0.032 -0.046 -0.022Dereg. Fwd. 1-2 Yrs (0.034) (0.024) (0.022) (0.039) (0.037) (0.024)
Intra-State Banking -0.041 -0.018 0.012 -0.003 -0.047 -0.020Dereg. Lag 0-1 Yr (0.046) (0.046) (0.036) (0.062) (0.048) (0.046)
Intra-State Banking -0.045 0.012 0.011 0.115 -0.052 0.003Dereg. Lag 2-3 Yrs (0.035) (0.043) (0.031) (0.051) (0.036) (0.046)
Intra-State Banking -0.029 0.004 0.001 -0.001 -0.032 0.002Dereg. Lag 4+ Yrs (0.048) (0.050) (0.034) (0.055) (0.050) (0.052)
Inter-State Banking 0.025 -0.021 0.052 0.027 0.023 -0.024Dereg. Fwd. 1-2 Yrs (0.032) (0.026) (0.025) (0.044) (0.034) (0.027)
Inter-State Banking 0.059 0.005 0.082 0.061 0.057 0.004Dereg. Lag 0-1 Yr (0.033) (0.029) (0.027) (0.049) (0.035) (0.030)
Inter-State Banking 0.170 0.078 0.137 0.071 0.173 0.083Dereg. Lag 2-3 Yrs (0.038) (0.035) (0.031) (0.056) (0.039) (0.036)
Inter-State Banking 0.223 0.129 0.141 0.071 0.231 0.141Dereg. Lag 4+ Yrs (0.056) (0.046) (0.041) (0.064) (0.060) (0.048)
Pre-Post specifications compare annual entry rates before and after the state-level banking deregulation indicated. Dynamic specifications replace the post deregulation indicators with a series of leads and lags for each reform. To conserve space, leads and lags are consolidated into two-year increments extending from two years prior to the deregulations to four or more years after the deregulations. The coefficient values for the dynamic leads and lags are relative to the period three years before the reforms and earlier. Appendix Table 2 presents the complete lag structure for Columns 1-2 and extensions to include linear state time trends.
Table 3: Banking Deregulations and Establishment Entry Rates in U.S. Product Markets
Notes: Panel estimations consider log counts of establishment births taken from the LBD for 1977-1998. Sectors and types of firms for dependent variables are indicated in the column headers. Single-unit start-ups are new firm formations. Multi-unit establishment openings are new establishment openings by existing firms. The sample includes all states and DC from 1977-1998, excepting 25 state-year cells where LBD files are not available, for 1097 observations per regression. Regressions include state and year fixed effects. Regressions include unreported interactions of explanatory indicators with a Census year dummy. Regressions are weighted by average birth employment in cells from 1977-1985. Standard errors are conservatively clustered at the state cross-sectional level.
Non-ManufacturingManufacturingAll Sectors
A. Pre-Post Specifications for Log Establishment Birth Counts by State-Year
B. Dynamic Specifications for Log Establishment Birth Counts by State-Year

Single-Unit Start-Ups Interactions:Intra-State Banking Dereg. Fwd. 1-2 Yrs -0.037 (0.030) -0.016 (0.023) -0.006 (0.022) -0.006 (0.022)Intra-State Banking Dereg. Lag 0-1 Yrs -0.044 (0.039) -0.022 (0.035) 0.007 (0.025) -0.007 (0.031)Intra-State Banking Dereg. Lag 2-3 Yrs -0.055 (0.027) -0.082 (0.036) -0.050 (0.026) -0.051 (0.034)Intra-State Banking Dereg. Lag 4+ Yrs -0.035 (0.039) -0.045 (0.029) -0.056 (0.019) 0.021 (0.029)
Inter-State Banking Dereg. Fwd. 1-2 Yrs 0.028 (0.028) 0.027 (0.031) 0.028 (0.021) 0.031 (0.031)Inter-State Banking Dereg. Lag 0-1 Yrs 0.054 (0.027) 0.038 (0.033) 0.021 (0.029) 0.050 (0.033)Inter-State Banking Dereg. Lag 2-3 Yrs 0.152 (0.033) 0.073 (0.039) 0.033 (0.027) 0.089 (0.040)Inter-State Banking Dereg. Lag 4+ Yrs 0.202 (0.041) 0.106 (0.038) 0.059 (0.033) 0.122 (0.045)
Existing Firm Expansions Interactions:Intra-State Banking Dereg. Fwd. 1-2 Yrs -0.021 (0.030)Intra-State Banking Dereg. Lag 0-1 Yrs -0.021 (0.048)Intra-State Banking Dereg. Lag 2-3 Yrs 0.026 (0.044)Intra-State Banking Dereg. Lag 4+ Yrs 0.009 (0.052)
Inter-State Banking Dereg. Fwd. 1-2 Yrs 0.001 (0.031)Inter-State Banking Dereg. Lag 0-1 Yrs 0.016 (0.036)Inter-State Banking Dereg. Lag 2-3 Yrs 0.079 (0.036)Inter-State Banking Dereg. Lag 4+ Yrs 0.096 (0.049)
Observations 85,884
Weights
(3) (4)
Absorbed
111,894 111,894 111,894
ST-SIC-YRFE
(2)
Absorbed Absorbed
Table 4: Stacked Specifications of Establishment Entry Rates in U.S. Product Markets
Notes: Panel estimations consider log birth counts of establishments taken from the LBD for 1977-1998. Annual cells are constructed by State-SIC2-Type, where Type includes entering start-ups and existing firms. Banking deregulations are dynamically modeled through indicator variables as in Table 3. All regressions include cross-sectional State-SIC2-Type and longitudinal Type-Year fixed effects. Columns 2-4 further include State-SIC2-Year fixed effects that remove all local conditions common across Types. In these saturated models, the start-up response is estimated relative to facility expansions, and separate coefficients for expansion establishments are no longer estimated or reported. Regressions include unreported dummies for cells with zero births and unreported interactions of explanatory variables with a Census year dummy. Regressions are weighted by average birth employment in cells from 1977-1985. Standard errors are conservatively clustered at the cross-sectional State-Type level.
Dependent Variable is Log Establishment Birth Counts by State-SIC2-Type-Year
Regr. WithST-SIC-TYPE
& TYPE-YR FE
(1)
Column 2Restricting
Column 1Adding
Prior to 1994
Column 2Without
Sample to

Financially Dependent SectorsSingle-Unit Start-Ups Interactions:Intra-State Banking Dereg. Fwd. 1-2 Yrs -0.029 (0.023) 0.003 (0.026) -0.018 (0.023) 0.070 (0.054)Intra-State Banking Dereg. Lag 0-1 Yrs -0.023 (0.036) 0.036 (0.031) -0.001 (0.032) 0.046 (0.052)Intra-State Banking Dereg. Lag 2-3 Yrs -0.077 (0.037) 0.003 (0.029) -0.037 (0.035) -0.174 (0.059)Intra-State Banking Dereg. Lag 4+ Yrs -0.043 (0.031) -0.037 (0.025) 0.034 (0.034) 0.004 (0.060)
Inter-State Banking Dereg. Fwd. 1-2 Yrs 0.032 (0.031) 0.052 (0.025) 0.035 (0.030) 0.051 (0.063)Inter-State Banking Dereg. Lag 0-1 Yrs 0.005 (0.030) 0.014 (0.034) 0.017 (0.031) 0.092 (0.064)Inter-State Banking Dereg. Lag 2-3 Yrs 0.063 (0.039) 0.040 (0.031) 0.076 (0.041) 0.140 (0.083)Inter-State Banking Dereg. Lag 4+ Yrs 0.118 (0.039) 0.098 (0.037) 0.141 (0.046) 0.224 (0.087)
Non-Financially Dependent SectorsSingle-Unit Start-Ups Interactions:Intra-State Banking Dereg. Fwd. 1-2 Yrs 0.012 (0.036) -0.015 (0.029) 0.021 (0.036) 0.007 (0.039)Intra-State Banking Dereg. Lag 0-1 Yrs -0.018 (0.039) -0.021 (0.029) -0.017 (0.041) -0.003 (0.060)Intra-State Banking Dereg. Lag 2-3 Yrs -0.088 (0.041) -0.100 (0.030) -0.078 (0.052) -0.066 (0.055)Intra-State Banking Dereg. Lag 4+ Yrs -0.048 (0.032) -0.075 (0.022) -0.006 (0.048) -0.033 (0.041)
Inter-State Banking Dereg. Fwd. 1-2 Yrs 0.019 (0.035) 0.004 (0.022) 0.026 (0.034) 0.027 (0.038)Inter-State Banking Dereg. Lag 0-1 Yrs 0.109 (0.044) 0.029 (0.031) 0.123 (0.043) -0.031 (0.058)Inter-State Banking Dereg. Lag 2-3 Yrs 0.093 (0.041) 0.026 (0.028) 0.115 (0.044) 0.014 (0.071)Inter-State Banking Dereg. Lag 4+ Yrs 0.078 (0.038) 0.021 (0.033) 0.082 (0.055) -0.031 (0.107)
Observations
Notes: See Table 4. Additional interactions taken for financially dependent sectors versus non-financially dependent sectors. Financial dependence is defined through Compustat as described in the text.
Dependent Variable is Log Establishment Birth Counts by State-SIC2-Type-Year
Regr. WithST-SIC-TYPE& TYPE-YR
& ST-SIC-YR FE
(1)
Column 1Restricting
Column 1
43,880
Sample to
Table 5: Financial Dependency in Stacked Specifications of Establishment Entry
WithoutColumn 1Restricting
(4)
Sample toManufacturing
111,894 111,894 85,884
Weights
(2)
Prior to 1994
(3)

Single-Unit Start-Ups Interactions:Intra-State Banking Dereg. Fwd. 1-2 Yrs -0.032 (0.028) -0.009 (0.032) -0.037 (0.030) -0.007 (0.039) -0.001 (0.008)Intra-State Banking Dereg. Lag 0-1 Yrs 0.005 (0.032) -0.056 (0.040) -0.021 (0.049) -0.034 (0.051) 0.002 (0.009)Intra-State Banking Dereg. Lag 2-3 Yrs -0.099 (0.041) -0.075 (0.038) -0.045 (0.043) -0.110 (0.058) 0.005 (0.007)Intra-State Banking Dereg. Lag 4+ Yrs -0.034 (0.036) -0.067 (0.037) -0.062 (0.029) -0.059 (0.048) 0.003 (0.009)
Inter-State Banking Dereg. Fwd. 1-2 Yrs 0.037 (0.029) 0.064 (0.038) 0.032 (0.043) 0.063 (0.046) 0.000 (0.008)Inter-State Banking Dereg. Lag 0-1 Yrs 0.052 (0.026) 0.096 (0.030) 0.011 (0.036) 0.108 (0.065) 0.002 (0.008)Inter-State Banking Dereg. Lag 2-3 Yrs 0.114 (0.034) 0.148 (0.040) 0.046 (0.057) 0.138 (0.048) 0.014 (0.008)Inter-State Banking Dereg. Lag 4+ Yrs 0.148 (0.046) 0.223 (0.042) 0.067 (0.056) 0.097 (0.045) 0.022 (0.011)
Observations
Regressions of BirthBirths by Establishment Size Category
Table 6: Stacked Specifications of Entry Size Distribution in U.S. Product Markets
Entry Size Relative toMax Size in First 3 Yrs
(5)
Births with21-100 Empl.
85,586111,894
(2)
111,894
(3) (4)
Dependent Variable is Log Establishment Birth Counts by State-SIC2-Type-Year (Col. 1-4)
Notes: See Table 4. All regressions include cross-sectional State-SIC2-Type and longitudinal Type-Year fixed effects. Regressions further include State-SIC2-Year fixed effects that remove all local conditions common across Types. In these saturated models, the start-up response is estimated relative to facility expansions, and separate coefficients for expansion establishments are no longer estimated or reported. Columns 1-4 repeat the full stacked specification (Column 2 of Table 4) with births in different size categories. Column 5 substitutes the mean ratio of entry size relative to the maximum size achieved in the first three years of operation. These entry size ratios are calculated at the establishment level and are conditional on survival for three years. Unweighted means from the underlying distributions are calculated for each state-industry-type-year cell.
Births with1-5 Empl.
(1)
Births with101+ Empl.
111,894 111,894
Births with6-20 Empl.

Single-Unit Start-Ups Interactions:Intra-State Banking Dereg. Fwd. 1-2 Yrs -0.023 (0.033) -0.002 (0.035) -0.038 (0.041) -0.007 (0.046) -0.011 (0.056)Intra-State Banking Dereg. Lag 0-1 Yrs -0.057 (0.042) -0.050 (0.047) -0.066 (0.049) -0.036 (0.043) -0.034 (0.065)Intra-State Banking Dereg. Lag 2-3 Yrs -0.091 (0.047) -0.103 (0.057) -0.084 (0.044) -0.060 (0.055) -0.111 (0.078)Intra-State Banking Dereg. Lag 4+ Yrs -0.036 (0.029) -0.028 (0.026) -0.045 (0.038) -0.034 (0.042) 0.001 (0.048)
Inter-State Banking Dereg. Fwd. 1-2 Yrs 0.001 (0.023) 0.003 (0.021) 0.011 (0.022) -0.007 (0.026) 0.047 (0.049)Inter-State Banking Dereg. Lag 0-1 Yrs 0.038 (0.030) 0.054 (0.028) 0.053 (0.035) 0.017 (0.044) 0.028 (0.067)Inter-State Banking Dereg. Lag 2-3 Yrs 0.091 (0.045) 0.125 (0.046) 0.111 (0.058) 0.054 (0.060) 0.064 (0.064)Inter-State Banking Dereg. Lag 4+ Yrs 0.172 (0.054) 0.203 (0.064) 0.210 (0.067) 0.082 (0.072) 0.091 (0.055)
Observations
1-5 Empl.
(2)
Exits with101+ Empl.
Notes: See Table 4. All regressions include cross-sectional State-SIC2-Type and longitudinal Type-Year fixed effects. Regressions further include State-SIC2-Year fixed effects that remove all local conditions common across Types. In these saturated models, the start-up response is estimated relative to facility expansions, and separate coefficients for expansion establishments are no longer estimated or reported.
Exits by Establishment Size Category
Table 7: Stacked Specifications of Exit Size Distribution in U.S. Product Markets
Exits with21-100 Empl.
111,894
(3)
111,894
(4) (5)
AllExits
(1)
111,894
Dependent Variable is Log Establishment Exit Counts by State-SIC2-Type-Year
111,894 111,894
Exits with6-20 Empl.
Exits with

Single-Unit Start-Ups Interactions:Intra-State Banking Dereg. Fwd. 1-2 Yrs -0.015 (0.020) -0.017 (0.022) -0.020 (0.035) -0.060 (0.038) -0.048 (0.043)Intra-State Banking Dereg. Lag 0-1 Yrs -0.006 (0.027) 0.032 (0.026) -0.052 (0.036) -0.046 (0.037) -0.060 (0.040)Intra-State Banking Dereg. Lag 2-3 Yrs -0.050 (0.035) -0.042 (0.032) -0.046 (0.034) -0.013 (0.040) -0.056 (0.045)Intra-State Banking Dereg. Lag 4+ Yrs -0.020 (0.034) 0.023 (0.037) -0.042 (0.038) -0.031 (0.036) -0.033 (0.056)
Inter-State Banking Dereg. Fwd. 1-2 Yrs 0.044 (0.033) 0.044 (0.036) 0.053 (0.039) 0.059 (0.046) 0.047 (0.032)Inter-State Banking Dereg. Lag 0-1 Yrs 0.057 (0.030) 0.055 (0.034) 0.079 (0.030) 0.051 (0.040) 0.092 (0.028)Inter-State Banking Dereg. Lag 2-3 Yrs 0.086 (0.039) 0.121 (0.044) 0.128 (0.038) 0.092 (0.061) 0.118 (0.041)Inter-State Banking Dereg. Lag 4+ Yrs 0.078 (0.039) 0.099 (0.054) 0.169 (0.045) 0.054 (0.059) 0.102 (0.069)
Observations
Single-Unit Start-Ups Interactions:Intra-State Banking Dereg. Fwd. 1-2 Yrs -0.005 (0.032) -0.019 (0.037) 0.021 (0.038) -0.005 (0.030) -0.009 (0.050)Intra-State Banking Dereg. Lag 0-1 Yrs -0.020 (0.040) -0.007 (0.031) -0.030 (0.046) 0.019 (0.050) -0.038 (0.073)Intra-State Banking Dereg. Lag 2-3 Yrs -0.112 (0.044) -0.080 (0.032) -0.071 (0.044) -0.037 (0.036) -0.115 (0.065)Intra-State Banking Dereg. Lag 4+ Yrs -0.040 (0.046) 0.002 (0.040) -0.045 (0.044) -0.022 (0.035) -0.043 (0.062)
Inter-State Banking Dereg. Fwd. 1-2 Yrs 0.063 (0.029) 0.063 (0.021) 0.098 (0.032) 0.050 (0.040) 0.022 (0.049)Inter-State Banking Dereg. Lag 0-1 Yrs 0.091 (0.039) 0.093 (0.024) 0.106 (0.035) 0.019 (0.042) 0.055 (0.072)Inter-State Banking Dereg. Lag 2-3 Yrs 0.148 (0.048) 0.147 (0.035) 0.208 (0.051) 0.094 (0.052) 0.051 (0.083)Inter-State Banking Dereg. Lag 4+ Yrs 0.267 (0.056) 0.258 (0.049) 0.338 (0.067) 0.170 (0.050) -0.024 (0.055)
Observations
Notes: See Table 4. All regressions include cross-sectional State-SIC2-Type and longitudinal Type-Year fixed effects. Regressions further include State-SIC2-Year fixed effects that remove all local conditions common across Types. In these saturated models, the start-up response is estimated relative to facility expansions, and separate coefficients for expansion establishments are no longer estimated or reported. Panel A looks at birth rates of establishments that survive more than three years, while Panel B looks at birth rates of establishments that fail within three years of entry.
101,490 101,490101,490 101,490 101,490
Table 8: Entry Rates by Long-Term Survivors versus Churning in U.S. Product MarketsBirths by Establishment Size Category
All Births with Births with Births with Births with
(1)
B. Entrants that Survive Three Years or Less (Churn)
Births 1-5 Empl. 6-20 Empl. 21-100 Empl.
A. Entrants that Survive More Than Three Years (Long-Term)
(3)
101,490
(4)
101,490 101,490 101,490
101+ Empl.
(5)(2)
101,490

Intrastate de novo Intrastate M&A InterstateState Deregulation Deregulation Deregulation
Alabama 1990 1981 1987Alaska 1970 1970 1982Arizona 1970 1970 1986Arkansas Not deregulated 1994 1989California 1970 1970 1987Colorado Not deregulated 1991 1988Connecticut 1988 1980 1983Delaware 1970 1970 1988District of Columbia 1970 1970 1985Florida 1988 1988 1985Georgia Not deregulated 1983 1985Hawaii 1986 1986 Not deregulatedIdaho 1970 1970 1985Illinois 1993 1988 1986Indiana 1991 1989 1986Iowa Not deregulated Not deregulated 1991Kansas 1990 1987 1992Kentucky Not deregulated 1990 1984Louisiana 1988 1988 1987Maine 1975 1975 1978Maryland 1970 1970 1985Massachusetts 1984 1984 1983Michigan 1988 1987 1986Minnesota Not deregulated 1993 1986Mississippi 1989 1986 1988Missouri 1990 1990 1986Montana Not deregulated 1990 1993Nebraska Not deregulated 1985 1990Nevada 1970 1970 1985New Hampshire 1987 1987 1987New Jersey Not deregulated 1977 1986New Mexico 1991 1991 1989New York 1976 1976 1982North Carolina 1970 1970 1985North Dakota Not deregulated 1987 1991Ohio 1989 1979 1985Oklahoma Not deregulated 1988 1987Oregon 1985 1985 1986Pennsylvania 1990 1982 1986Rhode Island 1970 1970 1984South Carolina 1970 1970 1986South Dakota 1970 1970 1988Tennessee 1990 1985 1985Texas 1988 1988 1987Utah 1981 1981 1984Vermont 1970 1970 1988Virginia 1987 1978 1985Washington 1985 1985 1987West Virginia 1987 1987 1988Wisconsin 1990 1990 1987Wyoming Not deregulated 1988 1987
App. Table 1: Timing of State Branch Banking Deregulations
Source: Jayaratne and Strahan (1996). Deregulations prior to 1970 are listed as 1970.

Single-Unit Multi-Unit Single-Unit Multi-UnitStart-Ups Establish. Start-Ups Establish.
Openings Openings
(1) (2) (3) (4)
Intra-State Banking 0.006 -0.049 0.001 -0.045Dereg. Fwd. 2 Yrs (0.023) (0.029) (0.019) (0.030)
Intra-State Banking -0.055 0.003 -0.070 0.004Dereg. Fwd. 1 Yrs (0.041) (0.027) (0.041) (0.033)
Intra-State Banking -0.038 -0.016 -0.057 -0.013Dereg. Change (0.043) (0.035) (0.044) (0.046)
Intra-State Banking -0.047 -0.017 -0.073 -0.027Dereg. Lag 1 Yr (0.048) (0.057) (0.053) (0.062)
Intra-State Banking -0.061 0.002 -0.085 -0.005Dereg. Lag 2 Yrs (0.043) (0.051) (0.051) (0.059)
Intra-State Banking -0.023 0.029 -0.049 0.014Dereg. Lag 3 Yrs (0.039) (0.043) (0.060) (0.060)
Intra-State Banking -0.029 0.006 -0.067 0.010Dereg. Lag 4+ Yrs (0.050) (0.051) (0.058) (0.065)
Inter-State Banking 0.008 -0.019 0.035 -0.019Dereg. Fwd. 2 Yrs (0.032) (0.027) (0.034) (0.024)
Inter-State Banking 0.062 -0.018 0.099 -0.012Dereg. Fwd. 1 Yrs (0.041) (0.031) (0.042) (0.031)
Inter-State Banking 0.043 0.003 0.078 -0.004Dereg. Change (0.036) (0.035) (0.035) (0.034)
Inter-State Banking 0.106 0.012 0.144 -0.001Dereg. Lag 1 Yr (0.036) (0.032) (0.039) (0.036)
Inter-State Banking 0.168 0.067 0.206 0.050Dereg. Lag 2 Yrs (0.041) (0.036) (0.047) (0.039)
Inter-State Banking 0.226 0.112 0.263 0.088Dereg. Lag 3 Yrs (0.047) (0.036) (0.058) (0.048)
Inter-State Banking 0.258 0.144 0.278 0.098Dereg. Lag 4+ Yrs (0.060) (0.049) (0.078) (0.067)
App. Table 2: Complete Dynamic Specifications for Table 3
Notes: See Table 3.
Dependent Variable is Log Est. Birth Counts by State-Year
All Sectors Adding Linear State Time Trends