regulatory trends and the status of deregulation in the ... · regulatory trends and the status of...
TRANSCRIPT
Regulatory Trends and the Status of Deregulation in the Natural Gas Business
Regulatory Trends and the Status of Deregulation in the Natural Gas Business
ESC Technology and Market Assessment ForumChicago, Illinois
October 27, 2011
Cynthia J. MarpleDirector, Rates and Regulatory Affairs
ESC Technology and Market Assessment ForumChicago, Illinois
October 27, 2011
Cynthia J. MarpleDirector, Rates and Regulatory Affairs

4
Place a photo or a graphic here.
Dimensions: 4.3 x 4.15
Natural Gas: Clean, Abundant, Efficient, Domestic
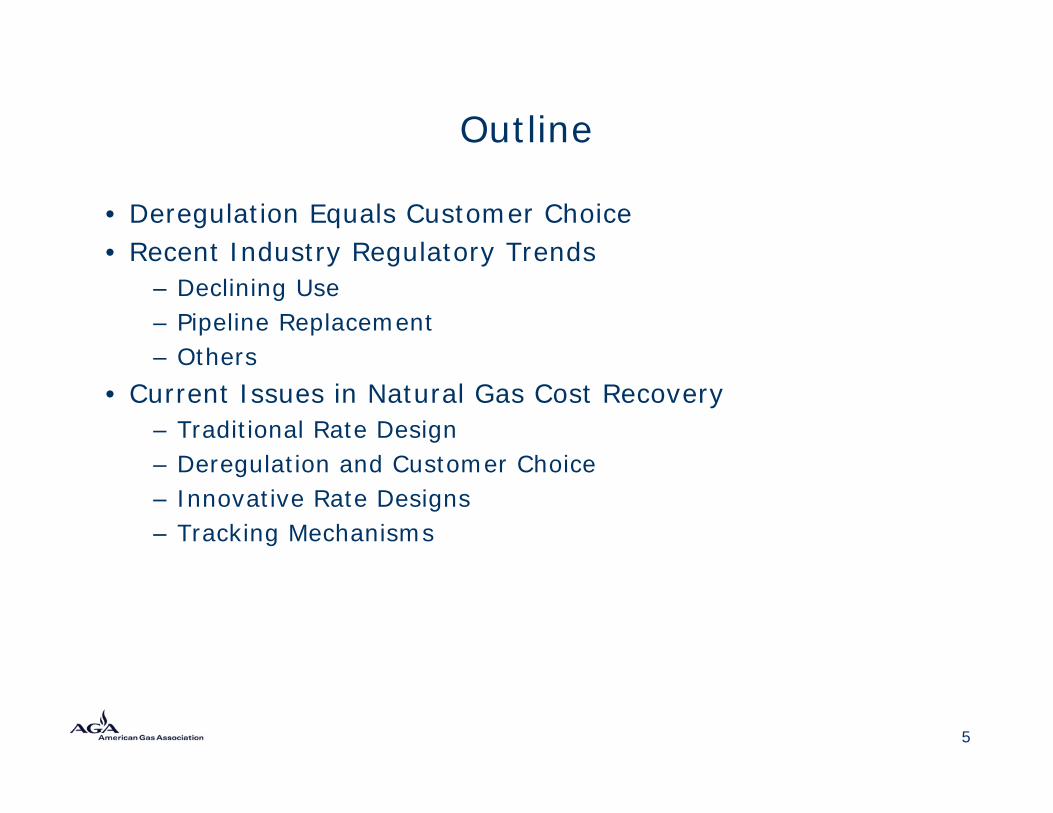
Outline
• Deregulation Equals Customer Choice• Recent Industry Regulatory Trends
– Declining Use– Pipeline Replacement– Others
• Current Issues in Natural Gas Cost Recovery– Traditional Rate Design – Deregulation and Customer Choice– Innovative Rate Designs– Tracking Mechanisms
5
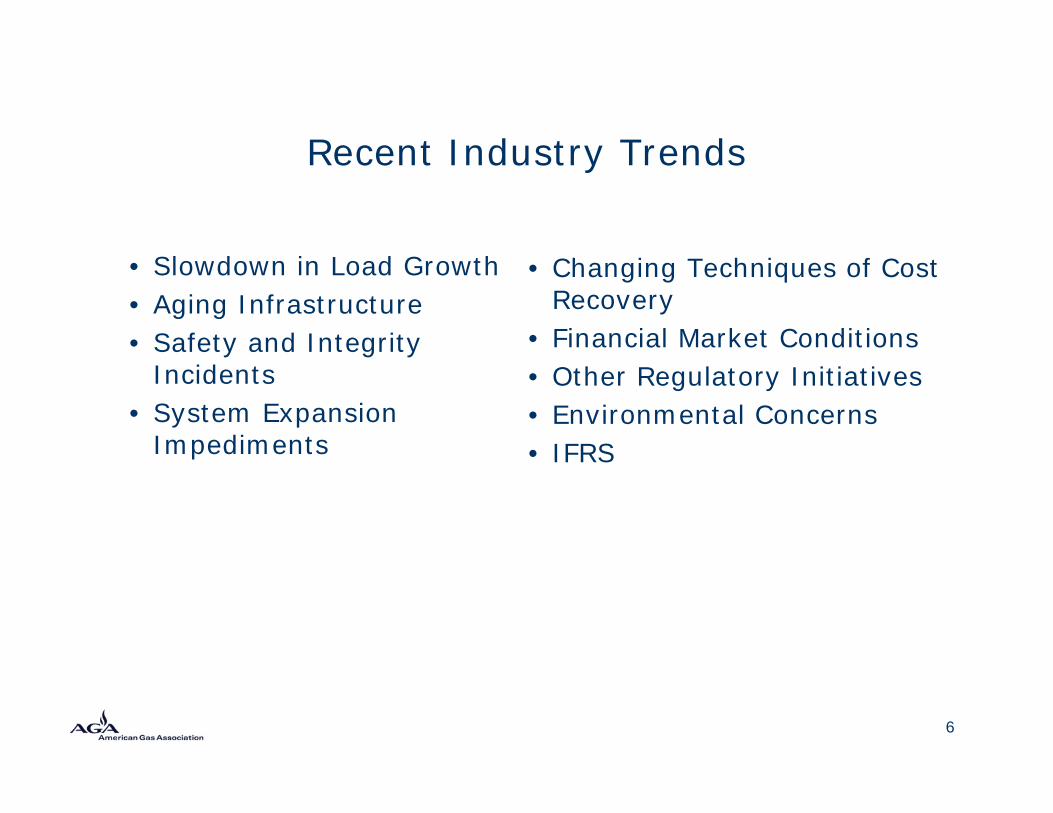
Recent Industry Trends
• Slowdown in Load Growth• Aging Infrastructure• Safety and Integrity
Incidents• System Expansion
Impediments
• Changing Techniques of Cost Recovery
• Financial Market Conditions• Other Regulatory Initiatives• Environmental Concerns• IFRS
6
7
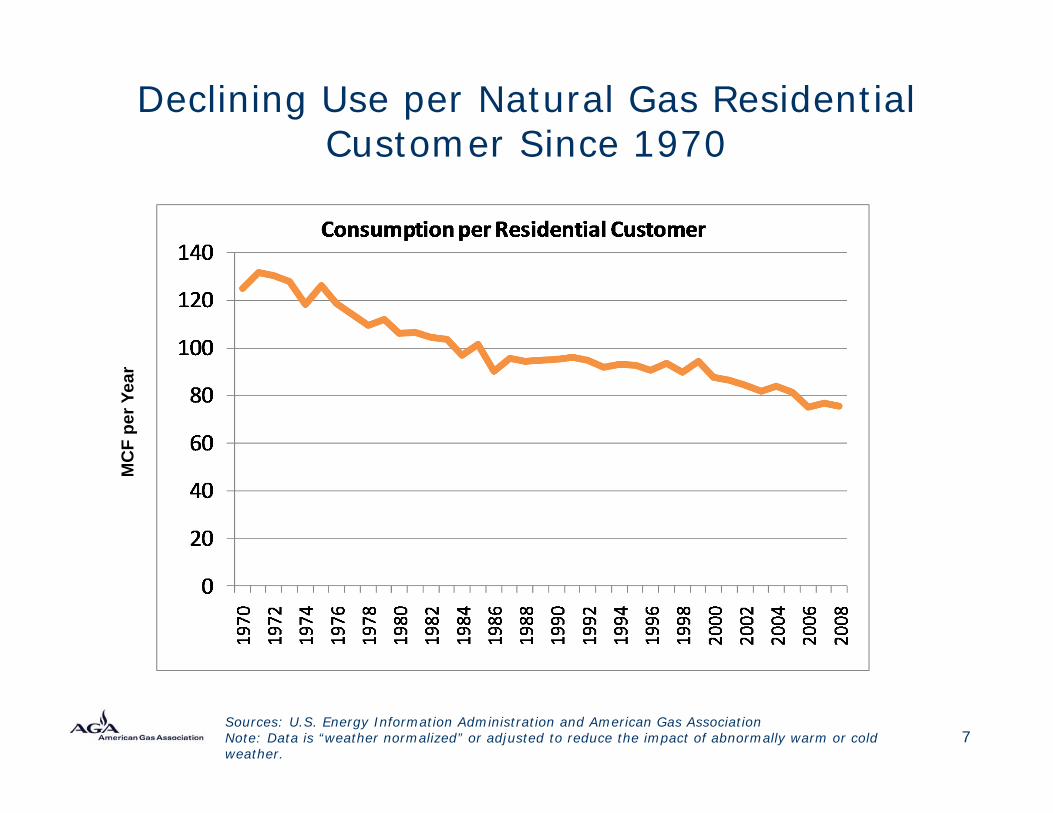
Declining Use per Natural Gas Residential Customer Since 1970
Sources: U.S. Energy Information Administration and American Gas AssociationNote: Data is “weather normalized” or adjusted to reduce the impact of abnormally warm or cold weather.
MC
F pe
r Yea
r
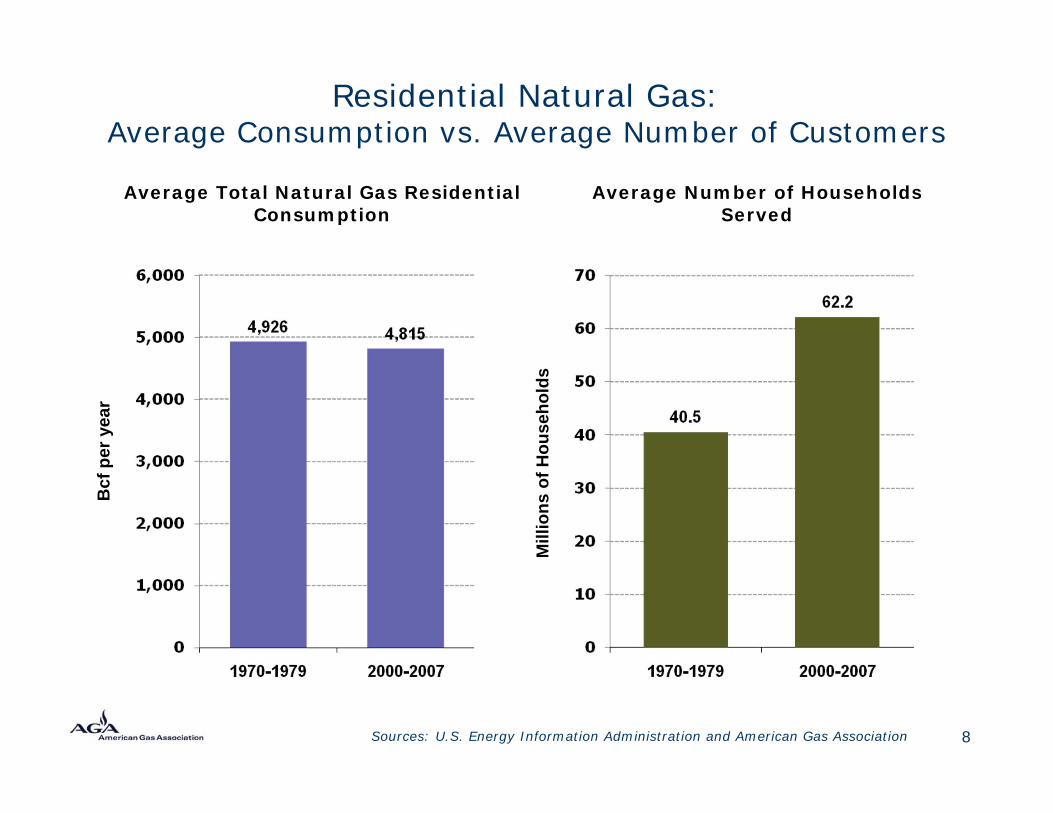
Residential Natural Gas: Average Consumption vs. Average Number of Customers
Sources: U.S. Energy Information Administration and American Gas Association
Average Total Natural Gas Residential Consumption
Average Number of Households Served
Bcf
per
yea
r
Mill
ions
of H
ouse
hold
s
8
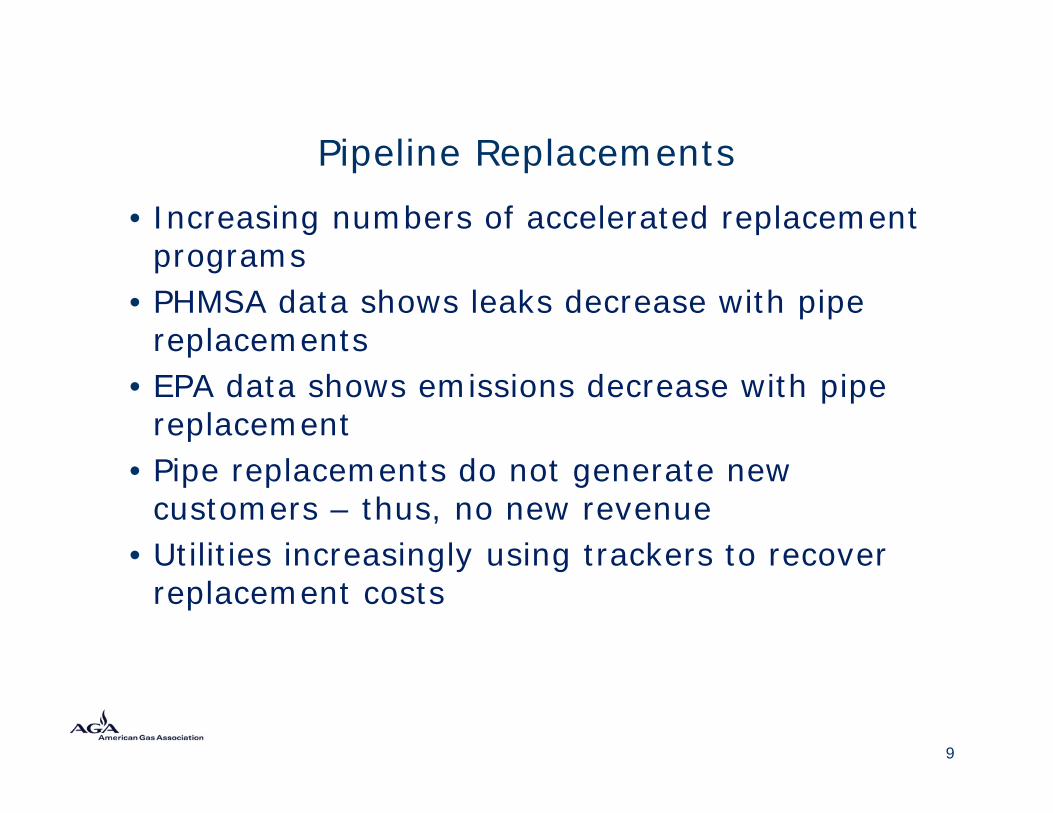
Pipeline Replacements
• Increasing numbers of accelerated replacement programs
• PHMSA data shows leaks decrease with pipe replacements
• EPA data shows emissions decrease with pipe replacement
• Pipe replacements do not generate new customers – thus, no new revenue
• Utilities increasingly using trackers to recover replacement costs
9
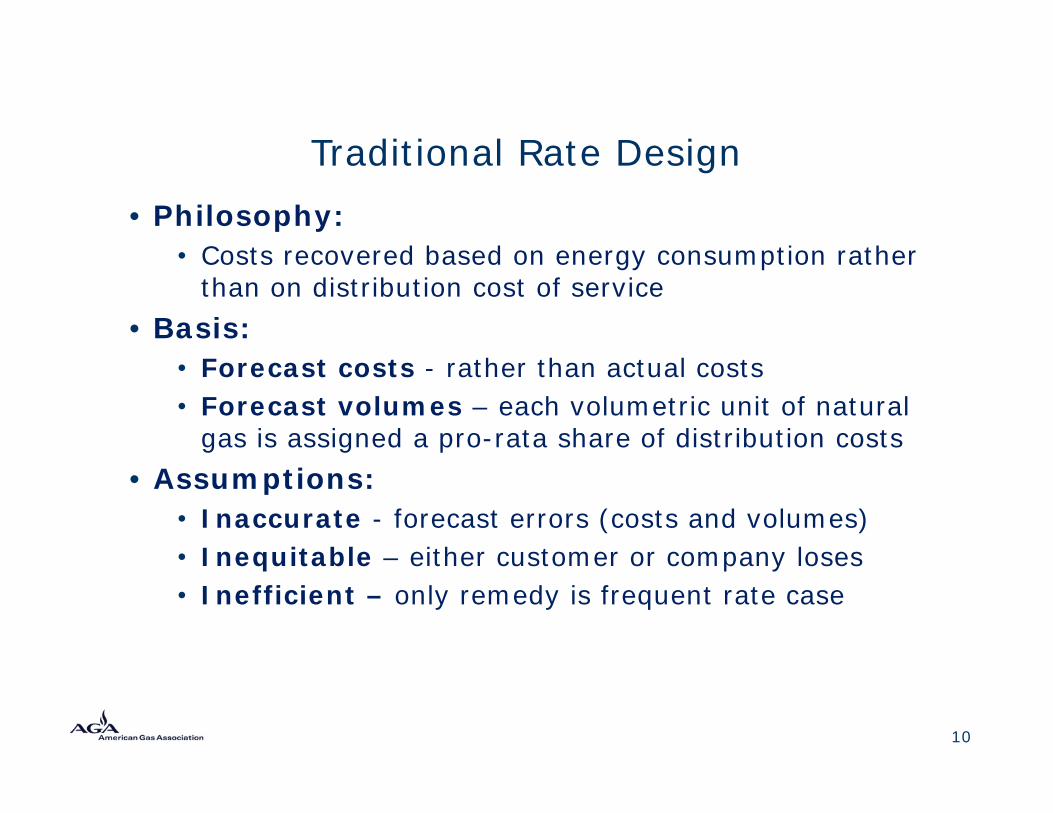
Traditional Rate Design• Philosophy:
• Costs recovered based on energy consumption rather than on distribution cost of service
• Basis:• Forecast costs - rather than actual costs• Forecast volumes – each volumetric unit of natural
gas is assigned a pro-rata share of distribution costs• Assumptions:
• Inaccurate - forecast errors (costs and volumes)• Inequitable – either customer or company loses• Inefficient – only remedy is frequent rate case
10
11
Service Distinctions
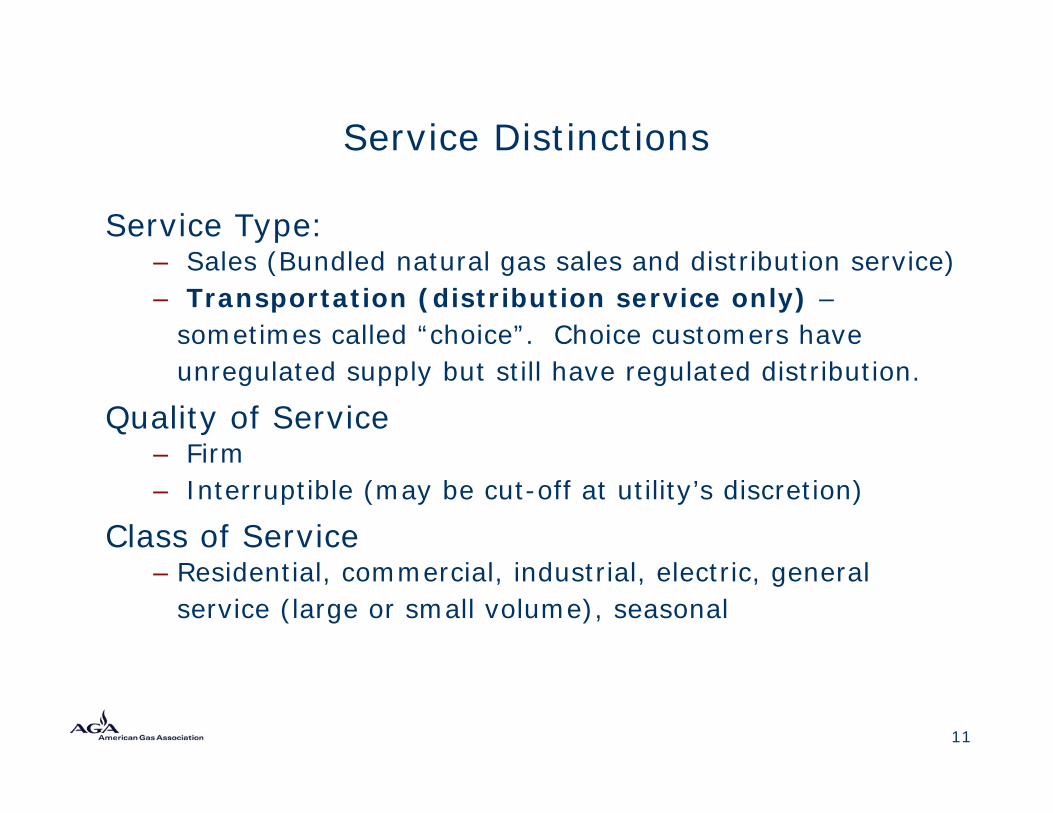
Service Type:– Sales (Bundled natural gas sales and distribution service)– Transportation (distribution service only) –
sometimes called “choice”. Choice customers have unregulated supply but still have regulated distribution.
Quality of Service– Firm – Interruptible (may be cut-off at utility’s discretion)
Class of Service– Residential, commercial, industrial, electric, general
service (large or small volume), seasonal
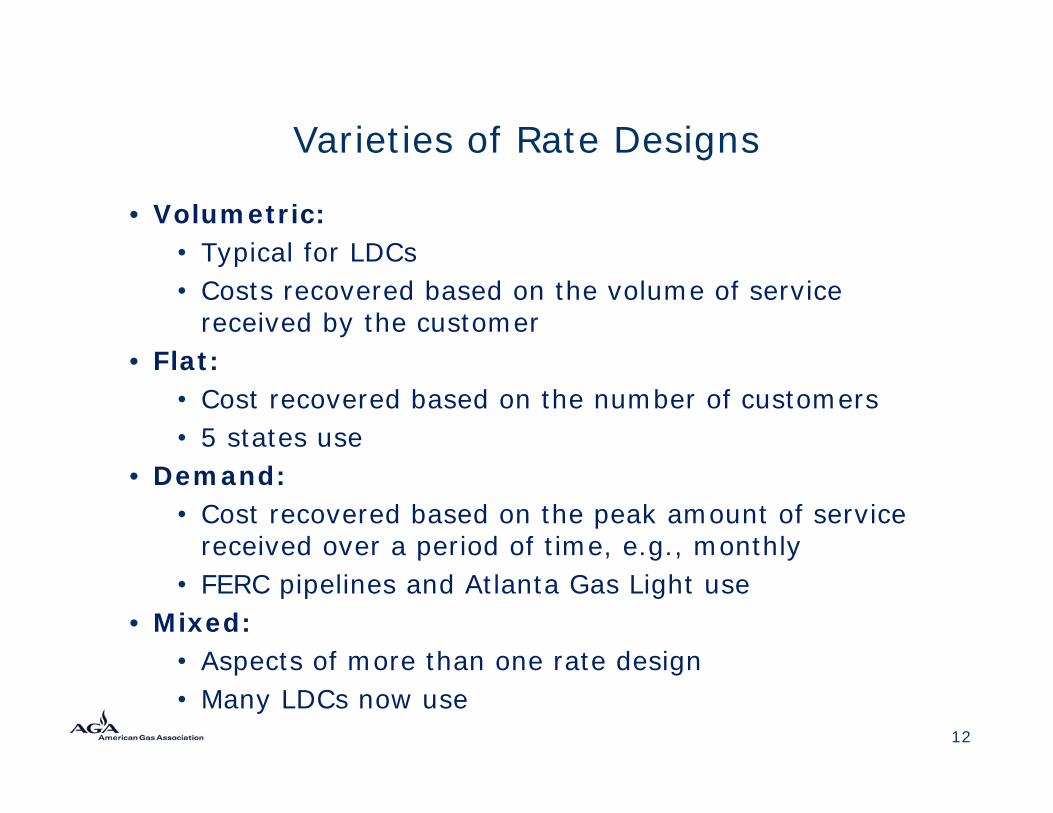
Varieties of Rate Designs
• Volumetric:• Typical for LDCs• Costs recovered based on the volume of service
received by the customer• Flat:
• Cost recovered based on the number of customers• 5 states use
• Demand:• Cost recovered based on the peak amount of service
received over a period of time, e.g., monthly• FERC pipelines and Atlanta Gas Light use
• Mixed:• Aspects of more than one rate design• Many LDCs now use
12

13
Cost of Service Study
• A detailed analysis of 3 costs: rate base, expenses, and return
• Rate Base– Amount of money in facilities and equipment, reduced
by depreciation; base on which return is earned.
• Expenses– O&M, depreciation, and taxes
• Return– Rate of return established through a cost of capital study
and risk analysis - approved by regulator– Rate of return x rate base = allowed return
14
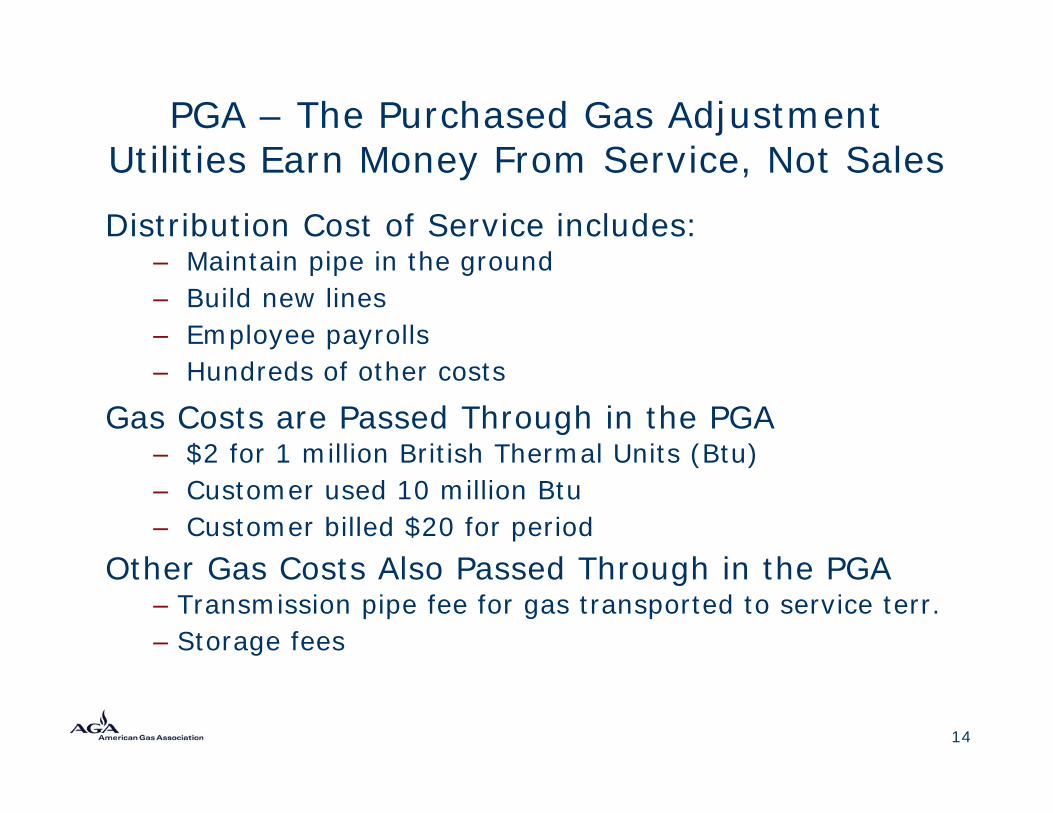
PGA – The Purchased Gas AdjustmentUtilities Earn Money From Service, Not Sales
Distribution Cost of Service includes:– Maintain pipe in the ground– Build new lines– Employee payrolls– Hundreds of other costs
Gas Costs are Passed Through in the PGA– $2 for 1 million British Thermal Units (Btu)– Customer used 10 million Btu– Customer billed $20 for period
Other Gas Costs Also Passed Through in the PGA– Transmission pipe fee for gas transported to service terr.– Storage fees
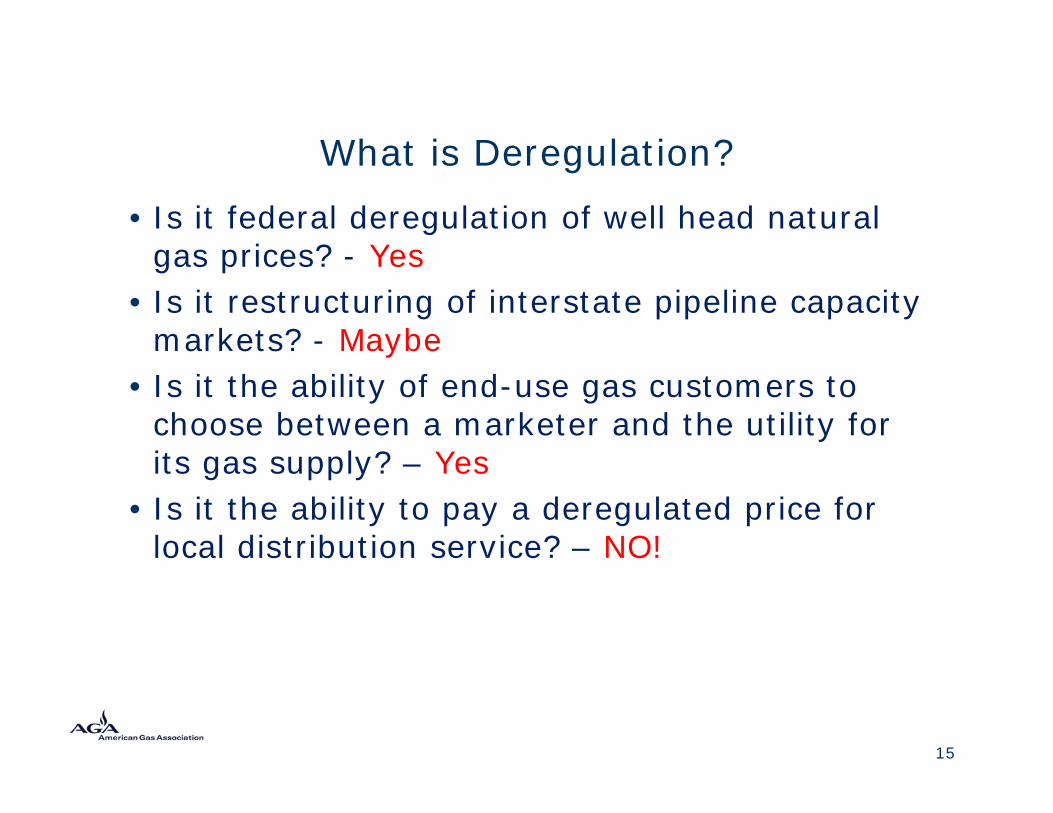
What is Deregulation?
• Is it federal deregulation of well head natural gas prices? - Yes
• Is it restructuring of interstate pipeline capacity markets? - Maybe
• Is it the ability of end-use gas customers to choose between a marketer and the utility for its gas supply? – Yes
• Is it the ability to pay a deregulated price for local distribution service? – NO!
15
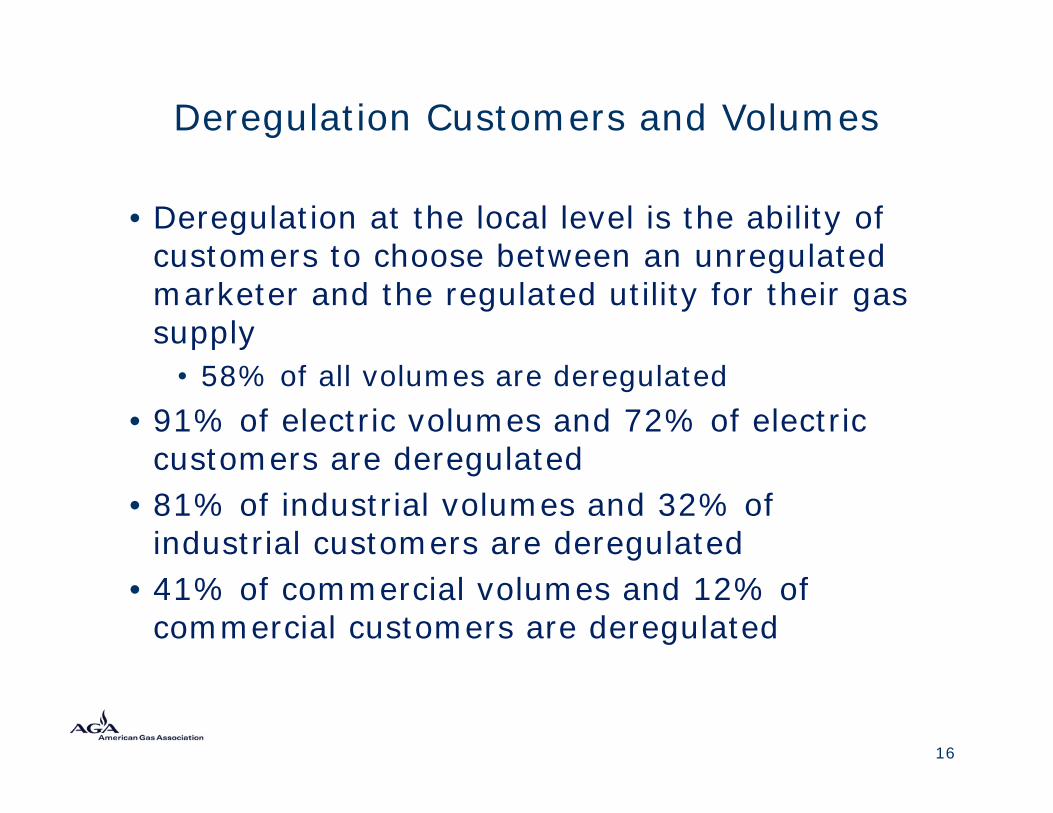
Deregulation Customers and Volumes
• Deregulation at the local level is the ability of customers to choose between an unregulated marketer and the regulated utility for their gas supply
• 58% of all volumes are deregulated• 91% of electric volumes and 72% of electric
customers are deregulated• 81% of industrial volumes and 32% of
industrial customers are deregulated• 41% of commercial volumes and 12% of
commercial customers are deregulated
16
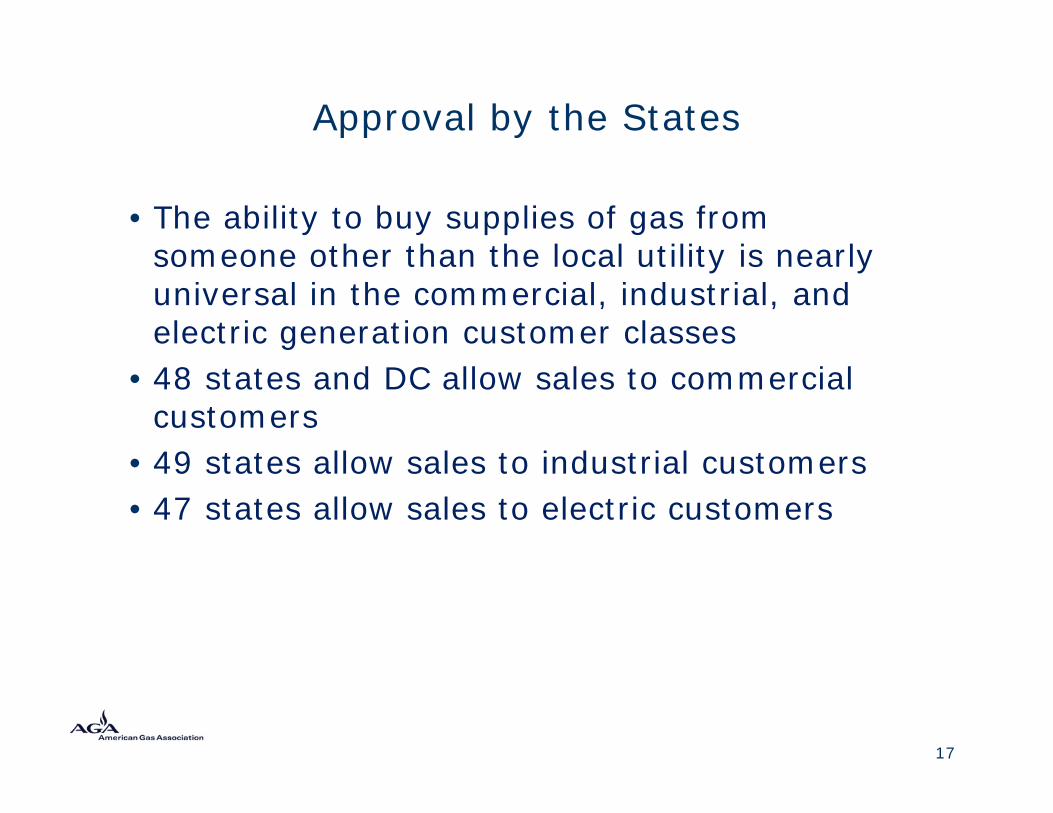
Approval by the States
• The ability to buy supplies of gas from someone other than the local utility is nearly universal in the commercial, industrial, and electric generation customer classes
• 48 states and DC allow sales to commercial customers
• 49 states allow sales to industrial customers• 47 states allow sales to electric customers
17

Residential Customer Choice Customers and Volumes
• 21 states and the District of Columbia allow residential customers to choose between an unregulated marketer and the regulated utility for their gas supply
• These programs are frequently called customer choice, and the number of states offering them has not changed since 2003.
• Choice is available to approximately 55% of all residential customers and to 50% of all residential volumes
• Only 8% of residential customers choose a deregulated supplier.
18
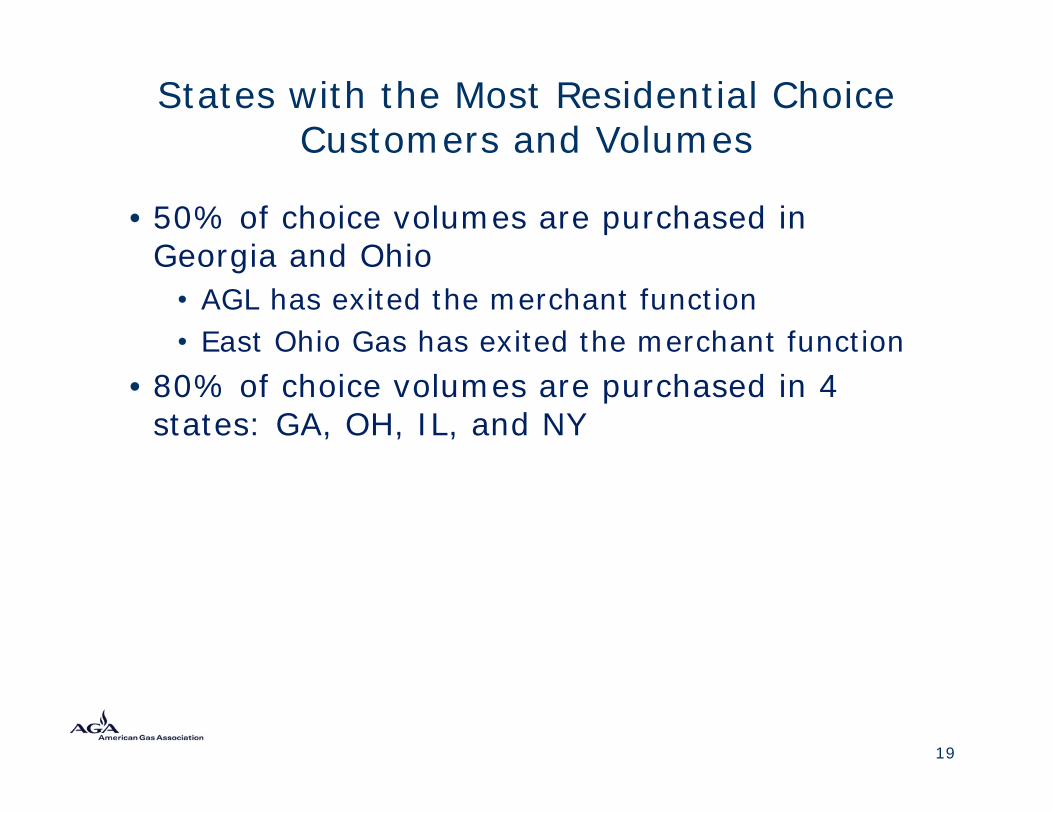
States with the Most Residential Choice Customers and Volumes
• 50% of choice volumes are purchased in Georgia and Ohio
• AGL has exited the merchant function• East Ohio Gas has exited the merchant function
• 80% of choice volumes are purchased in 4 states: GA, OH, IL, and NY
19
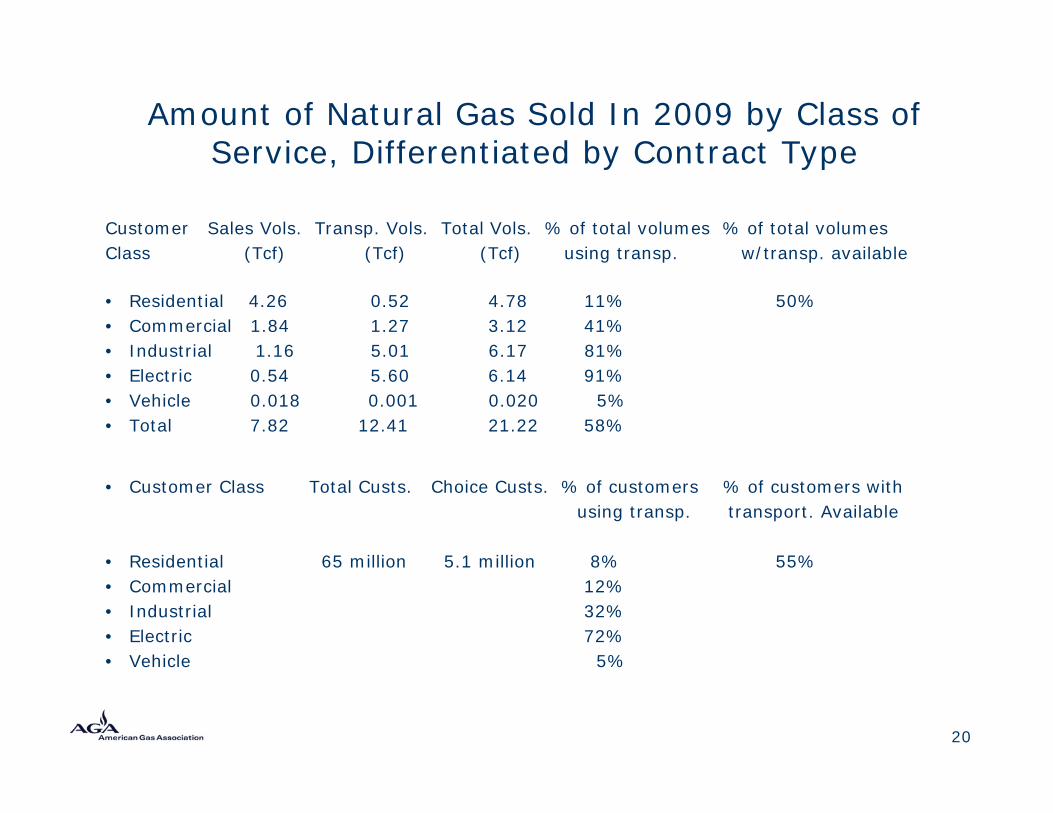
Amount of Natural Gas Sold In 2009 by Class of Service, Differentiated by Contract Type
Customer Sales Vols. Transp. Vols. Total Vols. % of total volumes % of total volumesClass (Tcf) (Tcf) (Tcf) using transp. w/transp. available
• Residential 4.26 0.52 4.78 11% 50%• Commercial 1.84 1.27 3.12 41%• Industrial 1.16 5.01 6.17 81%• Electric 0.54 5.60 6.14 91%• Vehicle 0.018 0.001 0.020 5%• Total 7.82 12.41 21.22 58%
• Customer Class Total Custs. Choice Custs. % of customers % of customers withusing transp. transport. Available
• Residential 65 million 5.1 million 8% 55%• Commercial 12%• Industrial 32%• Electric 72%• Vehicle 5%
20
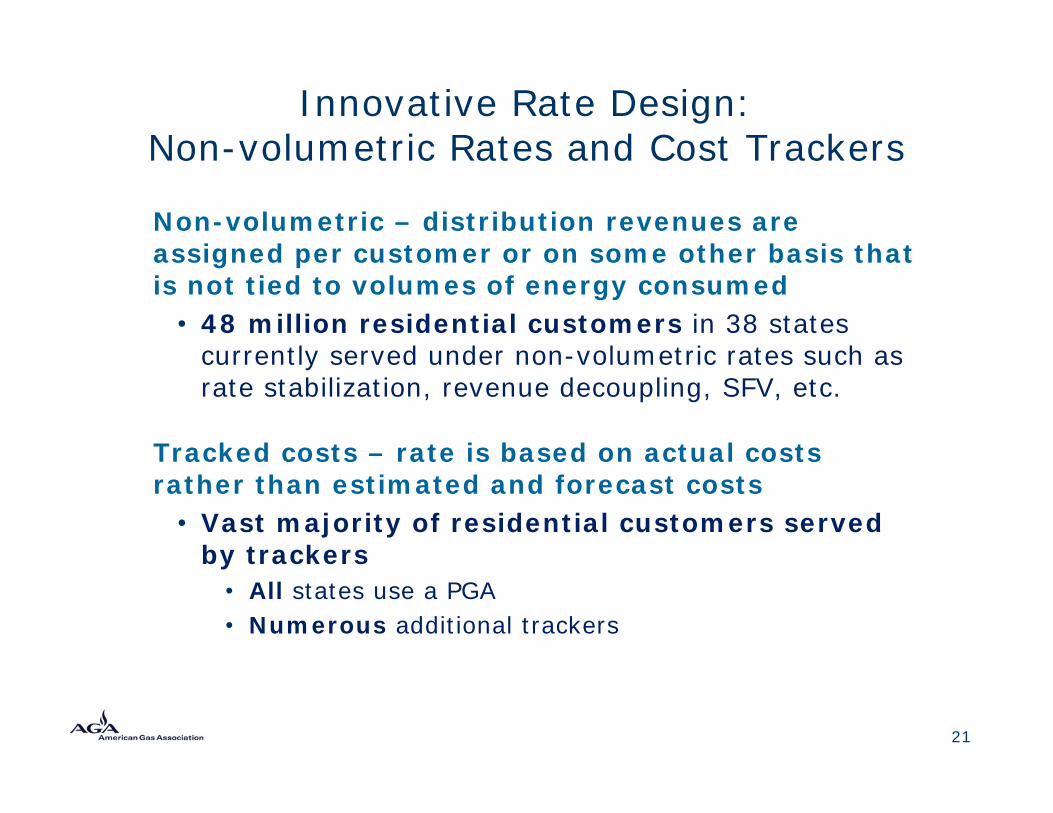
Innovative Rate Design: Non-volumetric Rates and Cost Trackers
Non-volumetric – distribution revenues are assigned per customer or on some other basis that is not tied to volumes of energy consumed
• 48 million residential customers in 38 states currently served under non-volumetric rates such as rate stabilization, revenue decoupling, SFV, etc.
Tracked costs – rate is based on actual costs rather than estimated and forecast costs
• Vast majority of residential customers served by trackers
• All states use a PGA• Numerous additional trackers
21
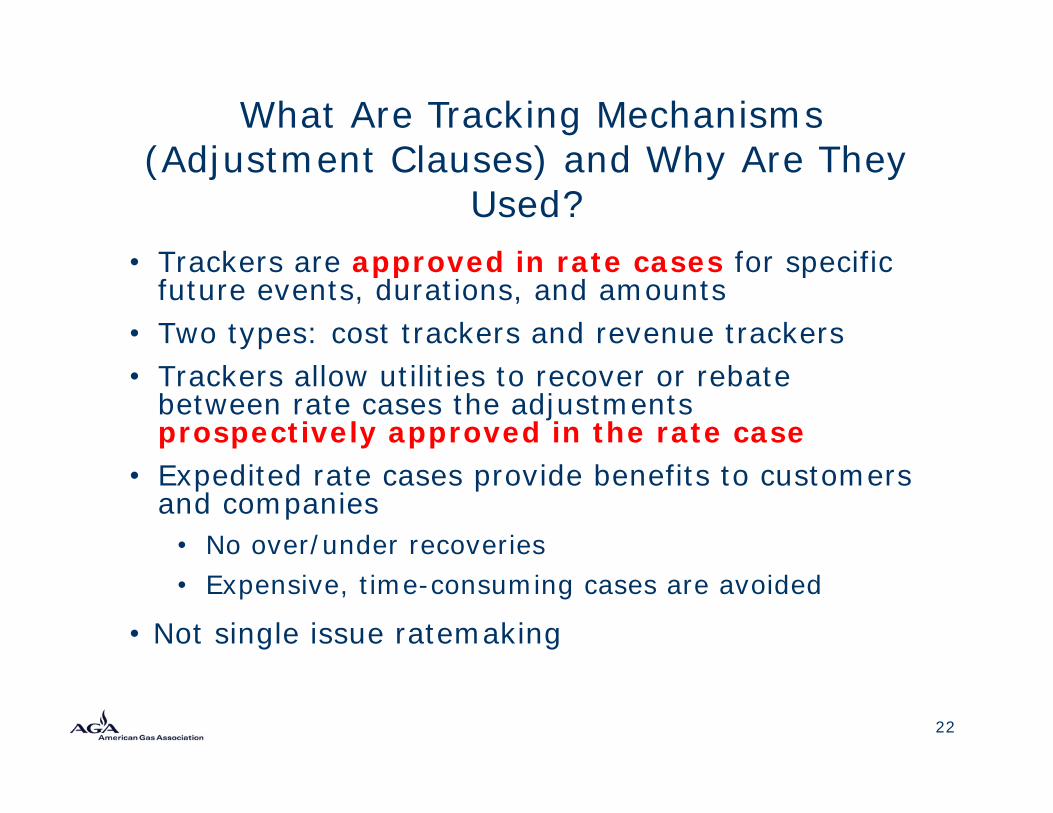
What Are Tracking Mechanisms (Adjustment Clauses) and Why Are They
Used?• Trackers are approved in rate cases for specific
future events, durations, and amounts• Two types: cost trackers and revenue trackers• Trackers allow utilities to recover or rebate
between rate cases the adjustments prospectively approved in the rate case
• Expedited rate cases provide benefits to customers and companies
• No over/under recoveries• Expensive, time-consuming cases are avoided
• Not single issue ratemaking
22
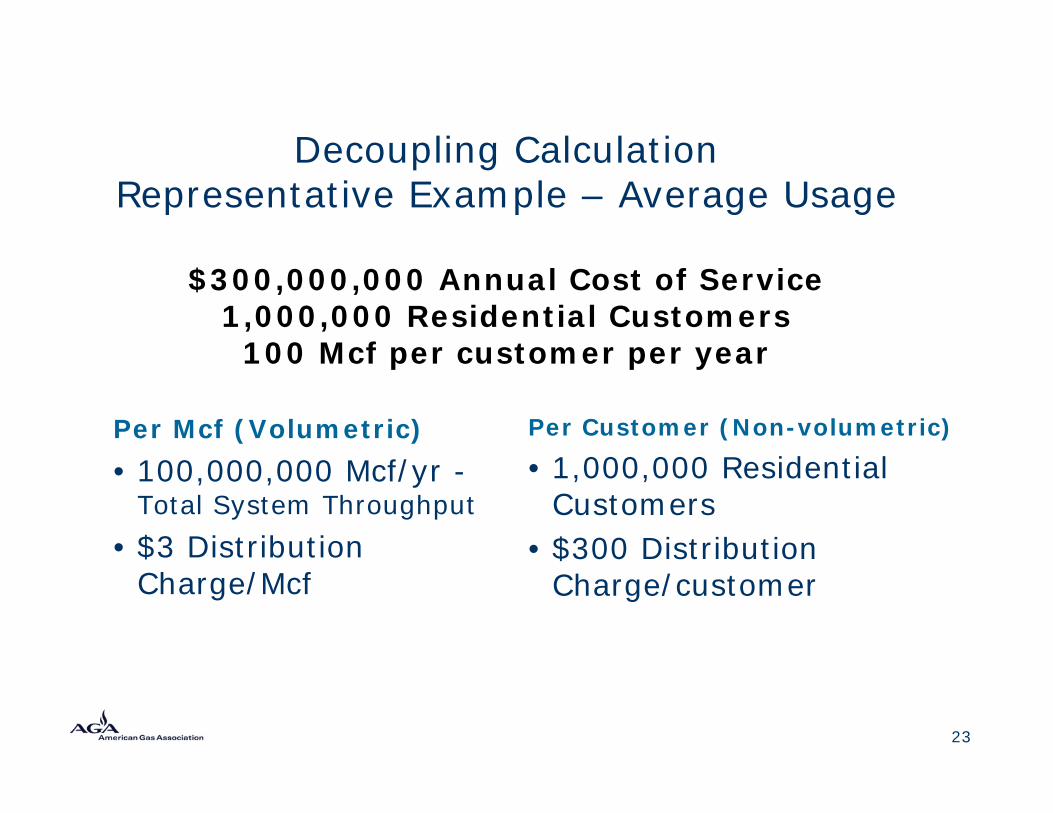
Decoupling Calculation Representative Example – Average Usage
$300,000,000 Annual Cost of Service 1,000,000 Residential Customers
100 Mcf per customer per year
Per Mcf (Volumetric)• 100,000,000 Mcf/yr -
Total System Throughput• $3 Distribution
Charge/Mcf
Per Customer (Non-volumetric)
• 1,000,000 Residential Customers
• $300 Distribution Charge/customer
23
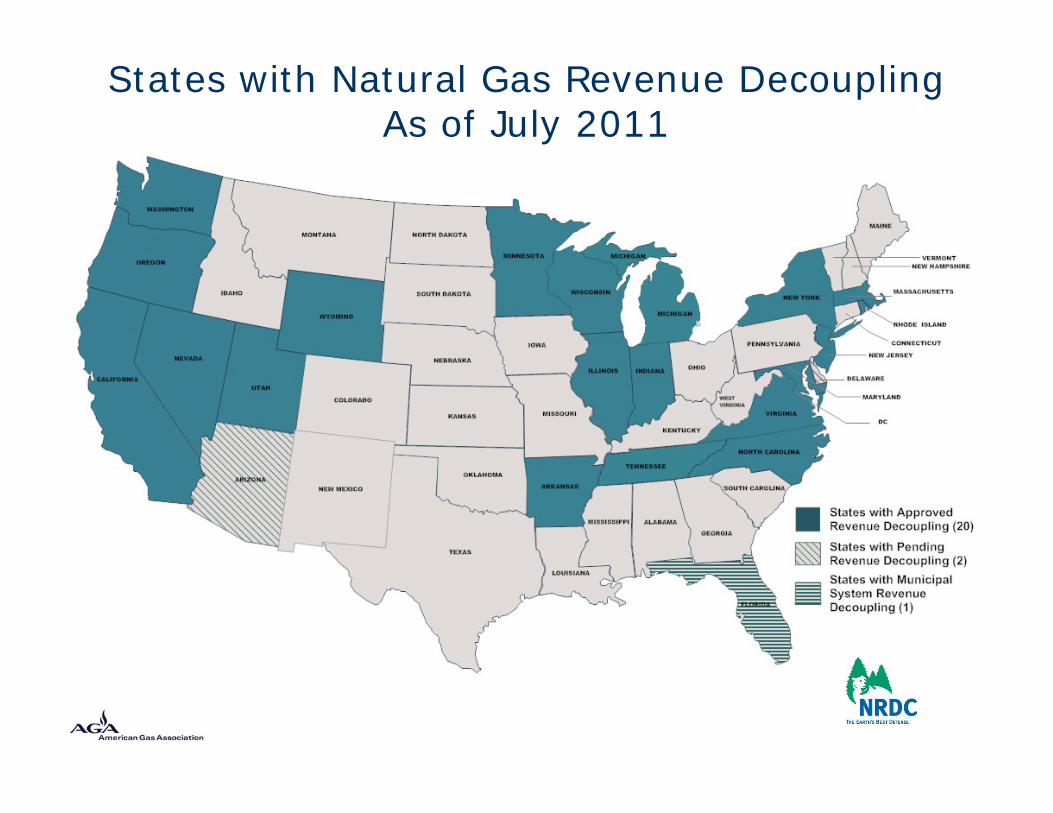
States with Natural Gas Revenue DecouplingAs of July 2011
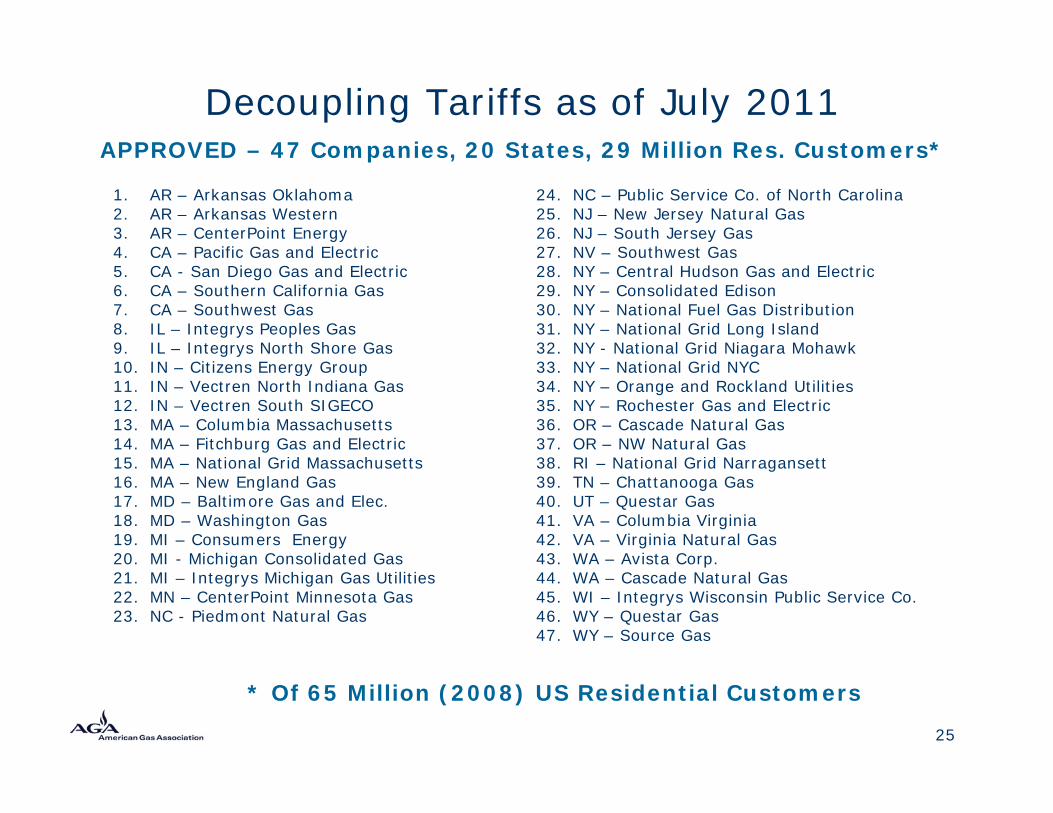
Decoupling Tariffs as of July 2011APPROVED – 47 Companies, 20 States, 29 Million Res. Customers*
1. AR – Arkansas Oklahoma2. AR – Arkansas Western3. AR – CenterPoint Energy4. CA – Pacific Gas and Electric5. CA - San Diego Gas and Electric6. CA – Southern California Gas7. CA – Southwest Gas 8. IL – Integrys Peoples Gas9. IL – Integrys North Shore Gas10. IN – Citizens Energy Group11. IN – Vectren North Indiana Gas12. IN – Vectren South SIGECO13. MA – Columbia Massachusetts14. MA – Fitchburg Gas and Electric 15. MA – National Grid Massachusetts16. MA – New England Gas17. MD – Baltimore Gas and Elec.18. MD – Washington Gas 19. MI – Consumers Energy 20. MI - Michigan Consolidated Gas 21. MI – Integrys Michigan Gas Utilities22. MN – CenterPoint Minnesota Gas23. NC - Piedmont Natural Gas
25
24. NC – Public Service Co. of North Carolina 25. NJ – New Jersey Natural Gas26. NJ – South Jersey Gas27. NV – Southwest Gas28. NY – Central Hudson Gas and Electric29. NY – Consolidated Edison30. NY – National Fuel Gas Distribution31. NY – National Grid Long Island 32. NY - National Grid Niagara Mohawk 33. NY – National Grid NYC 34. NY – Orange and Rockland Utilities35. NY – Rochester Gas and Electric36. OR – Cascade Natural Gas37. OR – NW Natural Gas38. RI – National Grid Narragansett39. TN – Chattanooga Gas40. UT – Questar Gas41. VA – Columbia Virginia42. VA – Virginia Natural Gas43. WA – Avista Corp.44. WA – Cascade Natural Gas45. WI – Integrys Wisconsin Public Service Co. 46. WY – Questar Gas47. WY – Source Gas
* Of 65 Million (2008) US Residential Customers
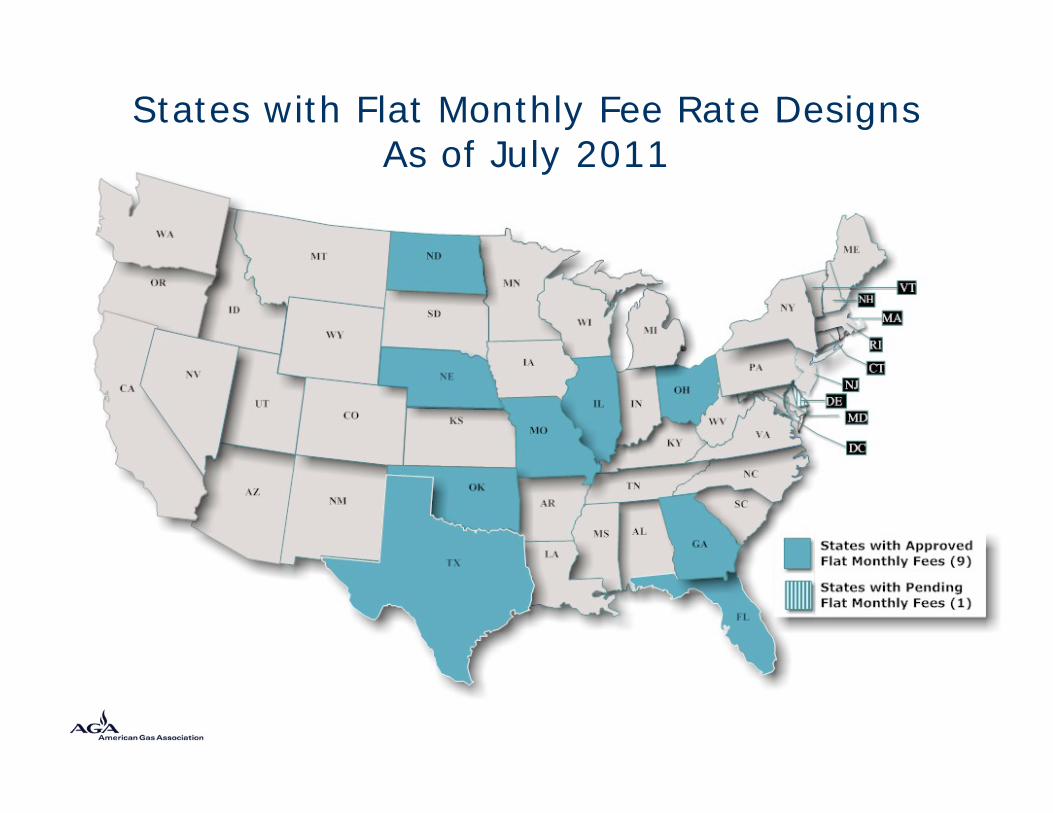
States with Flat Monthly Fee Rate DesignsAs of July 2011
Flat Monthly Fee Rate Design (SFV)as of July 2011
Approved – 15 Companies, 9 States, 9 Million Res. Customers*1. FL – TECO Peoples Gas – Three-tier monthly charge plus small variable charge2. GA – Atlanta Gas Light – Individually determined monthly demand charge (Straight Fixed Variable)3. IL – Nicor Gas – Flat fee plus a small variable charge4. MO – Atmos Energy – Flat fee plus a small variable charge; 75% of costs recovered in monthly fee5. MO – Empire District Gas6. MO – Laclede Gas – Modified rate blocks7. MO – Missouri Gas Energy - Flat monthly fee - $28 residential/$39.26 small general service8. NE – SourceGas – Modified rate blocks9. ND – Xcel Energy – $18.48 flat monthly fee10. OH – Columbia Ohio – Flat fee11. OH – Dominion East Ohio – Flat fee plus small variable charge12. OH – Duke Energy – Flat fee13. OH – Vectren Ohio - $18.37 flat monthly fee14. OK – Oklahoma Natural Gas – Two-tier plan – Offers customers a choice15. TX – Texas Gas Service El Paso – $10.80 flat fee up to 200 ccf/month
Pending – 4 Companies, 1 State, 1 Million Res. Customers*1. DE – Delmarva Power and Light2. IL – Integrys North Shore Gas3. IL – Integrys Peoples Gas Light and Coke 4. NE - Black Hills – Two-tier, declining block rate
27* Of 65 Million (2008) US Residential Customers
Flat Monthly Fee (FMF) CalculationAverage Usage
FMF Rate Design
• 100 Mcf/year• $300 Distribution
Charge/year• $300/12 months• $25 Distribution
Charge/month
FMF with 5% volume reduction
• 95 Mcf/year• $300 Distribution
Charge/year• $300/12 months• $25 Distribution
Charge/monthregardless of Mcf consumed
28
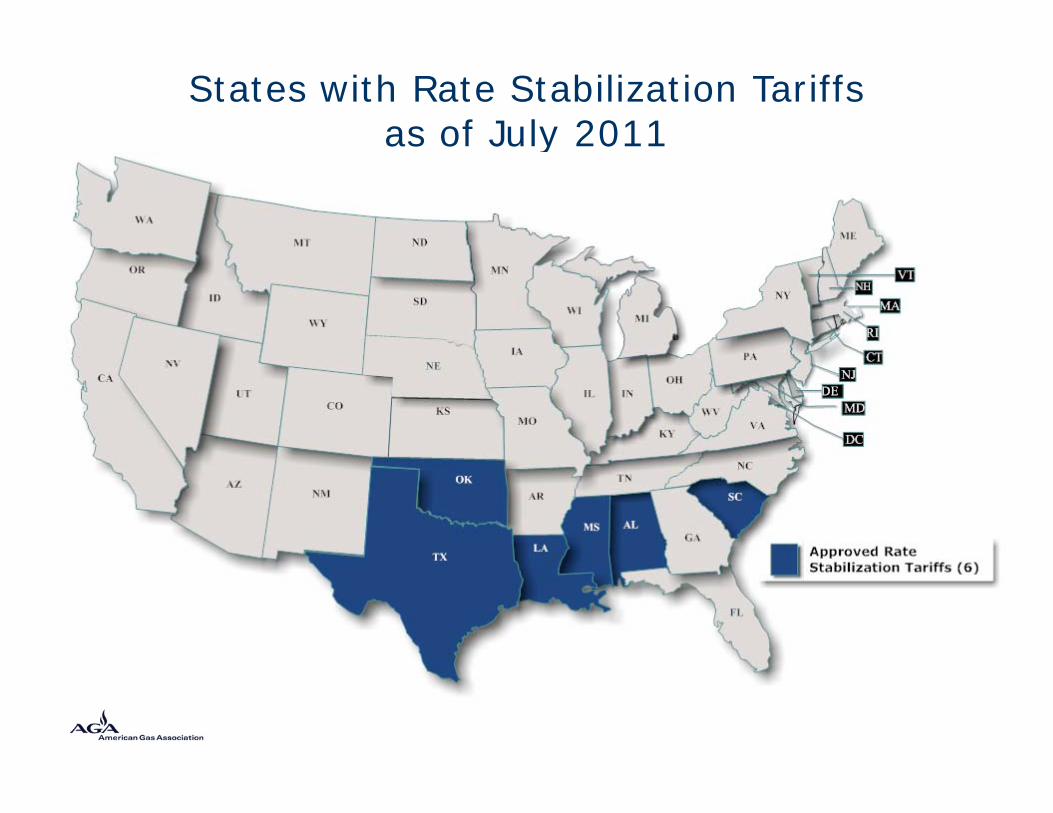
States with Rate Stabilization Tariffsas of July 2011
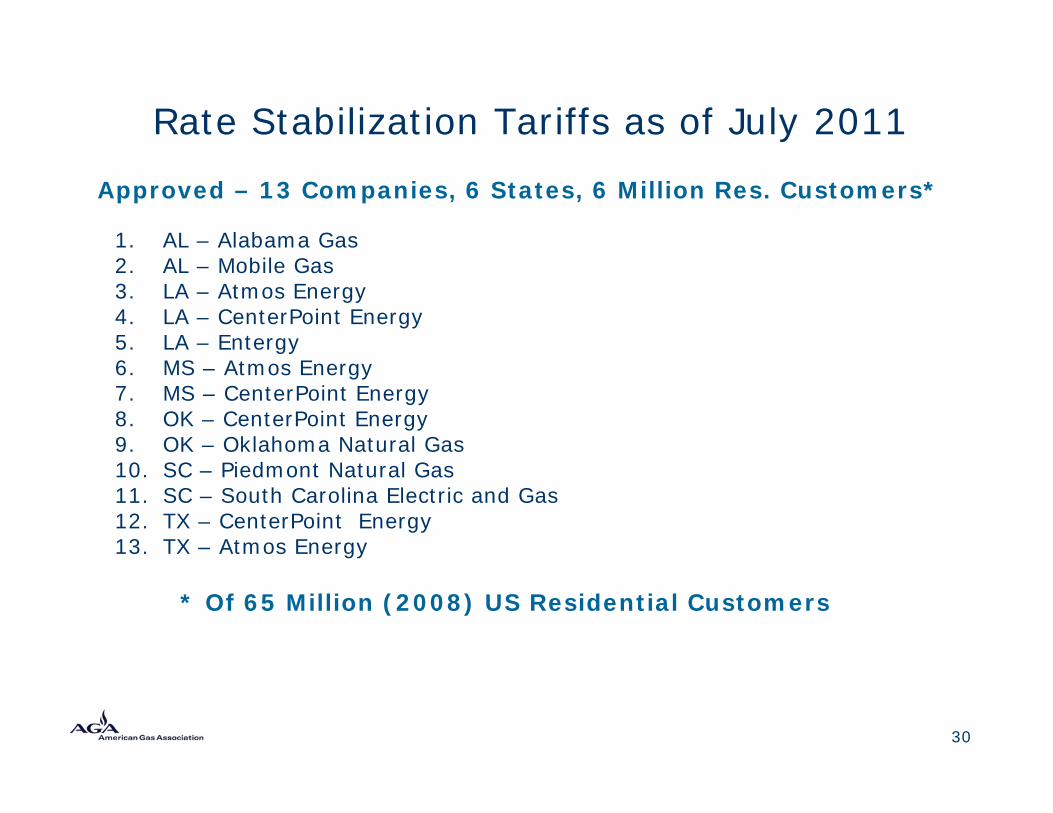
Rate Stabilization Tariffs as of July 2011
Approved – 13 Companies, 6 States, 6 Million Res. Customers*
1. AL – Alabama Gas2. AL – Mobile Gas3. LA – Atmos Energy4. LA – CenterPoint Energy5. LA – Entergy6. MS – Atmos Energy7. MS – CenterPoint Energy8. OK – CenterPoint Energy9. OK – Oklahoma Natural Gas10. SC – Piedmont Natural Gas11. SC – South Carolina Electric and Gas12. TX – CenterPoint Energy13. TX – Atmos Energy
* Of 65 Million (2008) US Residential Customers
30
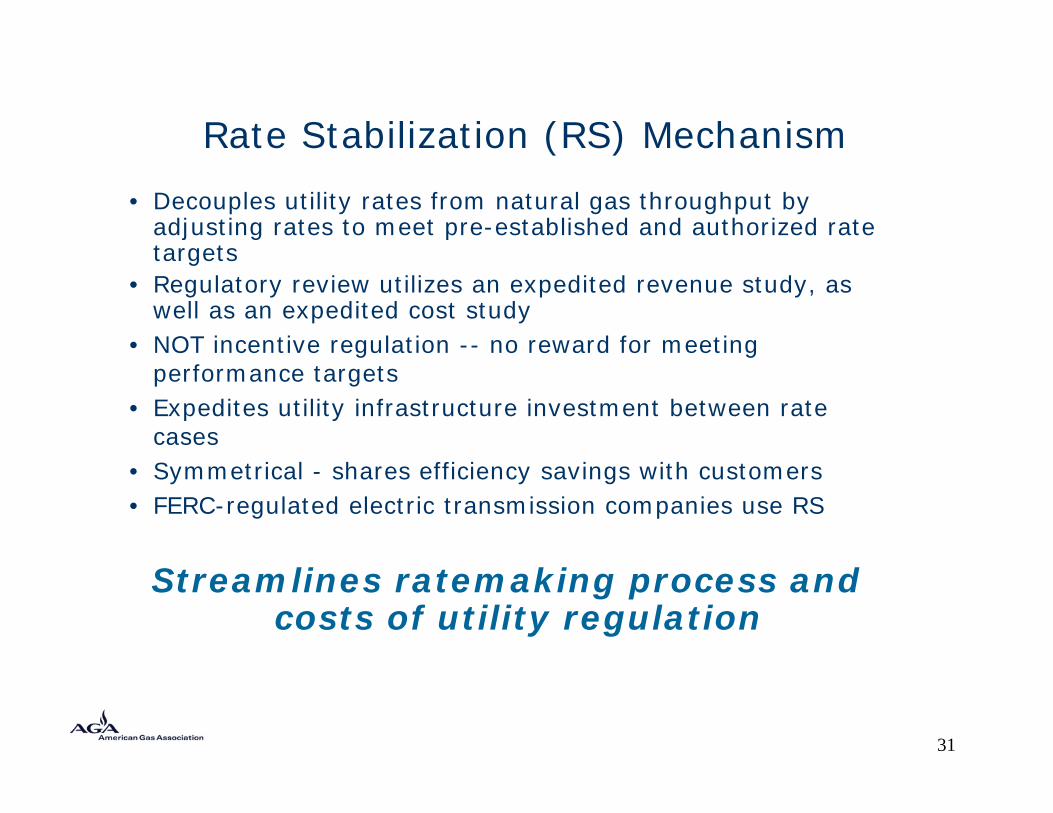
Rate Stabilization (RS) Mechanism
• Decouples utility rates from natural gas throughput by adjusting rates to meet pre-established and authorized rate targets
• Regulatory review utilizes an expedited revenue study, as well as an expedited cost study
• NOT incentive regulation -- no reward for meeting performance targets
• Expedites utility infrastructure investment between rate cases
• Symmetrical - shares efficiency savings with customers• FERC-regulated electric transmission companies use RS
Streamlines ratemaking process and costs of utility regulation
31
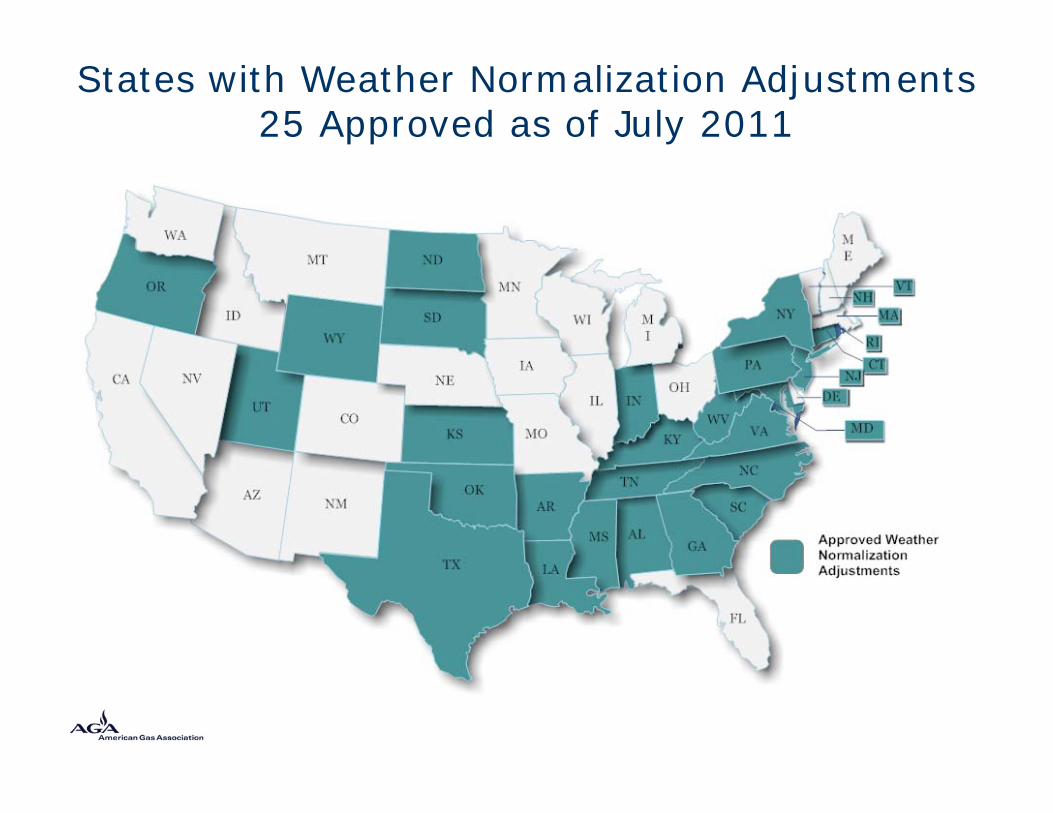
States with Weather Normalization Adjustments25 Approved as of July 2011
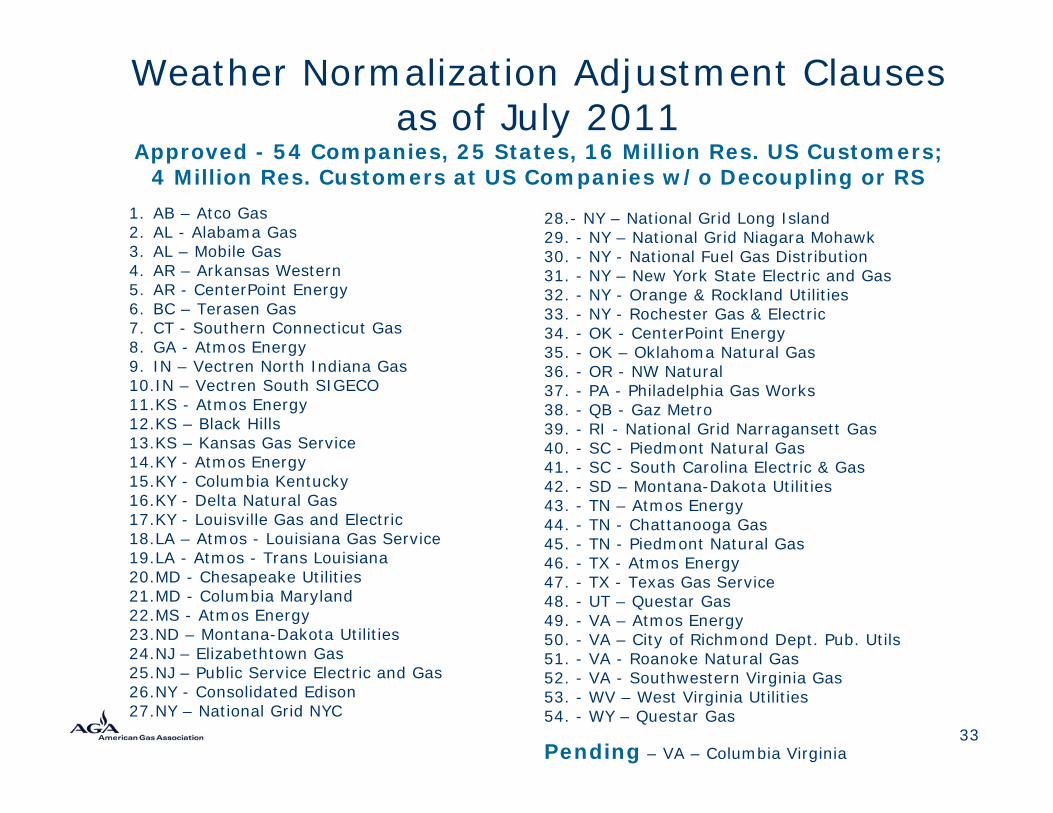
Weather Normalization Adjustment Clauses as of July 2011
Approved - 54 Companies, 25 States, 16 Million Res. US Customers; 4 Million Res. Customers at US Companies w/o Decoupling or RS
1. AB – Atco Gas2. AL - Alabama Gas3. AL – Mobile Gas4. AR – Arkansas Western5. AR - CenterPoint Energy6. BC – Terasen Gas7. CT - Southern Connecticut Gas8. GA - Atmos Energy9. IN – Vectren North Indiana Gas10.IN – Vectren South SIGECO11.KS - Atmos Energy12.KS – Black Hills13.KS – Kansas Gas Service14.KY - Atmos Energy15.KY - Columbia Kentucky16.KY - Delta Natural Gas17.KY - Louisville Gas and Electric18.LA – Atmos - Louisiana Gas Service19.LA - Atmos - Trans Louisiana20.MD - Chesapeake Utilities21.MD - Columbia Maryland22.MS - Atmos Energy23.ND – Montana-Dakota Utilities24.NJ – Elizabethtown Gas25.NJ – Public Service Electric and Gas26.NY - Consolidated Edison27.NY – National Grid NYC
28.- NY – National Grid Long Island29. - NY – National Grid Niagara Mohawk30. - NY - National Fuel Gas Distribution31. - NY – New York State Electric and Gas32. - NY - Orange & Rockland Utilities33. - NY - Rochester Gas & Electric 34. - OK - CenterPoint Energy35. - OK – Oklahoma Natural Gas36. - OR - NW Natural37. - PA - Philadelphia Gas Works38. - QB - Gaz Metro39. - RI - National Grid Narragansett Gas40. - SC - Piedmont Natural Gas41. - SC - South Carolina Electric & Gas42. - SD – Montana-Dakota Utilities43. - TN – Atmos Energy44. - TN - Chattanooga Gas45. - TN - Piedmont Natural Gas46. - TX - Atmos Energy47. - TX - Texas Gas Service48. - UT – Questar Gas49. - VA – Atmos Energy50. - VA – City of Richmond Dept. Pub. Utils51. - VA - Roanoke Natural Gas52. - VA - Southwestern Virginia Gas53. - WV – West Virginia Utilities54. - WY – Questar Gas
Pending – VA – Columbia Virginia33
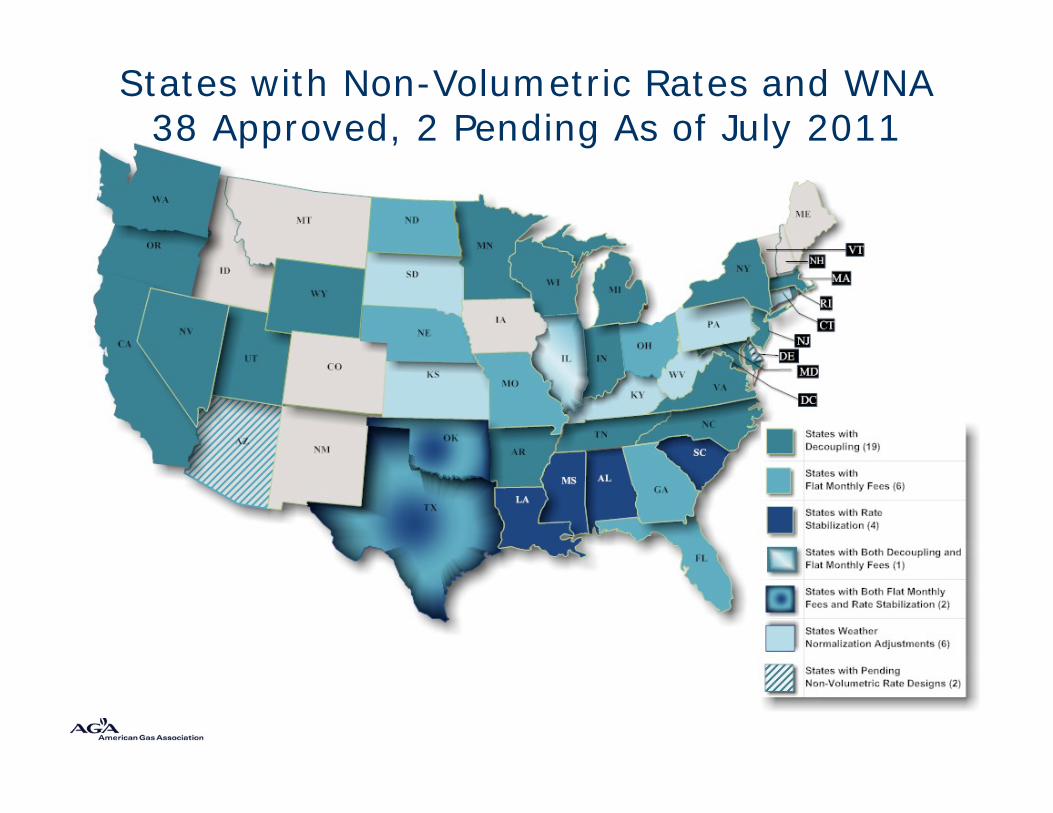
States with Non-Volumetric Rates and WNA38 Approved, 2 Pending As of July 2011
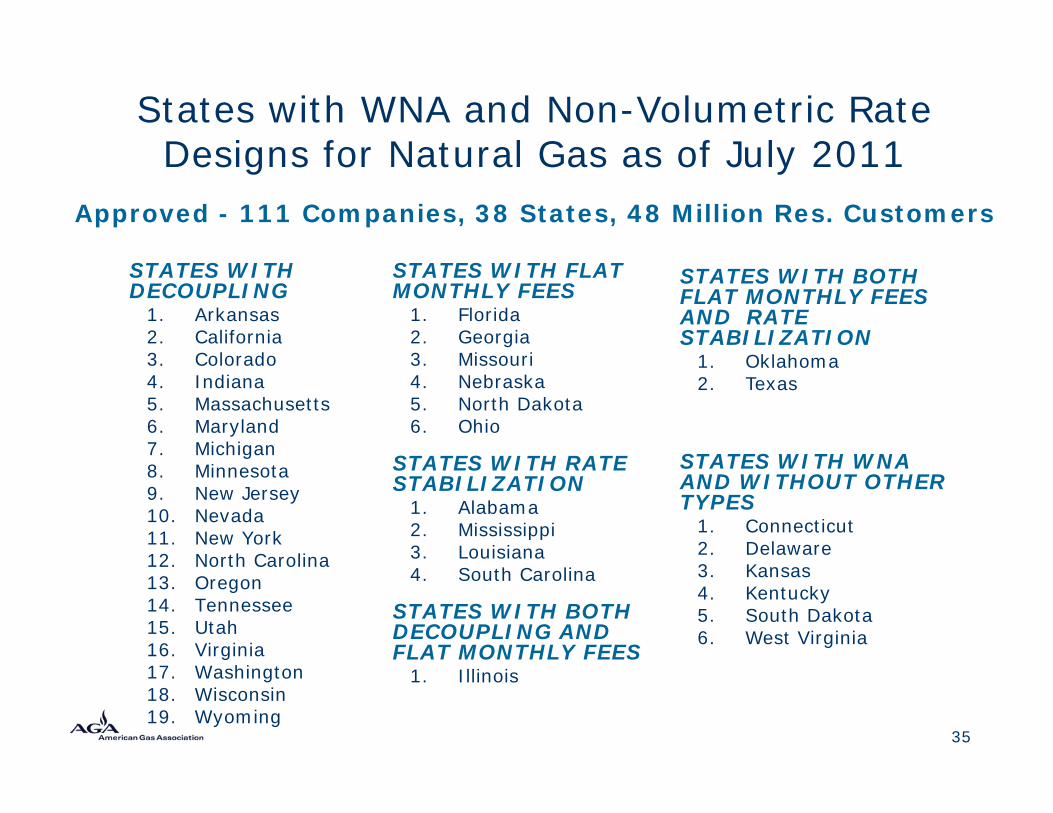
States with WNA and Non-Volumetric Rate Designs for Natural Gas as of July 2011
Approved - 111 Companies, 38 States, 48 Million Res. Customers
STATES WITH DECOUPLING
1. Arkansas2. California3. Colorado4. Indiana5. Massachusetts6. Maryland7. Michigan8. Minnesota9. New Jersey10. Nevada11. New York12. North Carolina13. Oregon14. Tennessee15. Utah16. Virginia17. Washington18. Wisconsin19. Wyoming
STATES WITH FLAT MONTHLY FEES
1. Florida2. Georgia3. Missouri4. Nebraska5. North Dakota6. Ohio
STATES WITH RATE STABILIZATION
1. Alabama2. Mississippi3. Louisiana4. South Carolina
STATES WITH BOTH DECOUPLING AND FLAT MONTHLY FEES
1. Illinois
35
STATES WITH BOTH FLAT MONTHLY FEES AND RATE STABILIZATION
1. Oklahoma2. Texas
STATES WITH WNA AND WITHOUT OTHER TYPES
1. Connecticut2. Delaware3. Kansas4. Kentucky5. South Dakota6. West Virginia
Infrastructure Investment Cost Recovery Issues
• States encouraging utilities to maximize safety and reliability investments
• Federal Pipeline Safety Act of 2002 requires increased maintenance and safety investments
• Rate Lag – Traditional rates do not recover costs until after investment made, sometimes several years
• Rate Shock – large investments over short periods
36
Advantages of Innovative Rates and Cost Trackers for Infrastructure Cost Recovery
• Investments to ensure system safety and upgrade delivery reliability are made on an timely basis
• Timely cost recovery for utilities– Leads to utility financial stability and reduced capital costs
• Expensive rate cases, whose costs are recovered from customers, are avoided
• Moderate bill impacts for customers– Cost recovery over several years and small adjustments to rates
avoids customer rate shock
37
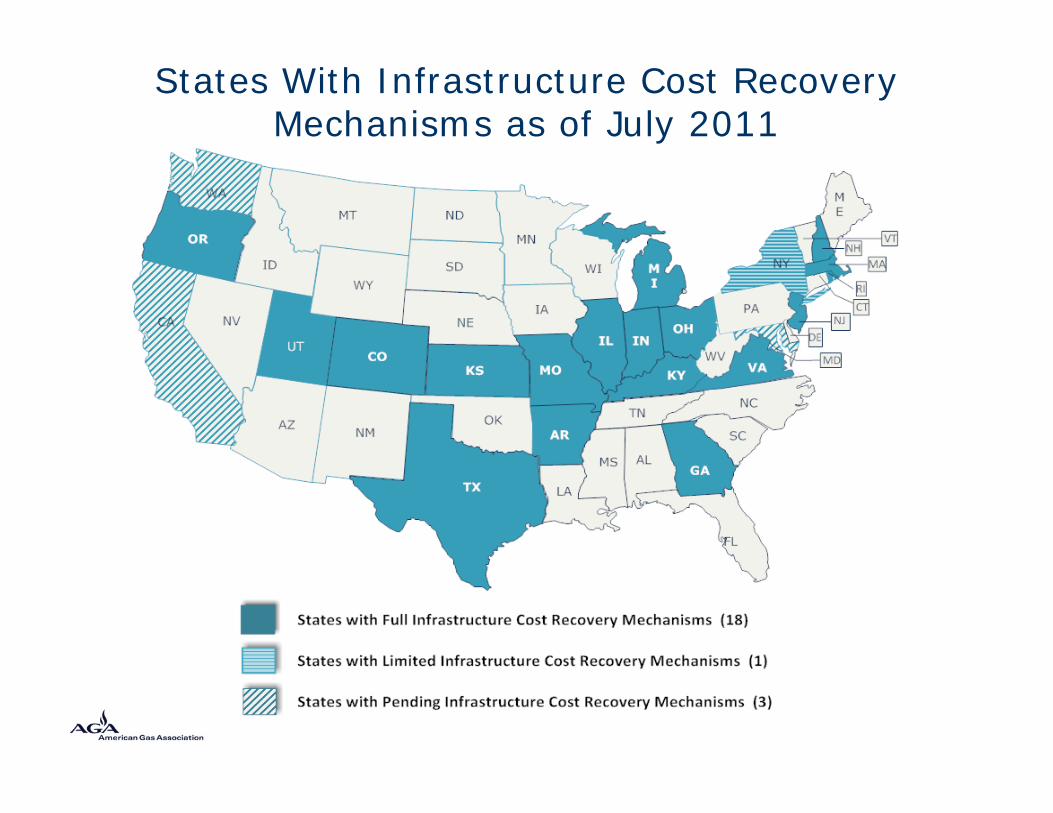
States With Infrastructure Cost Recovery Mechanisms as of July 2011
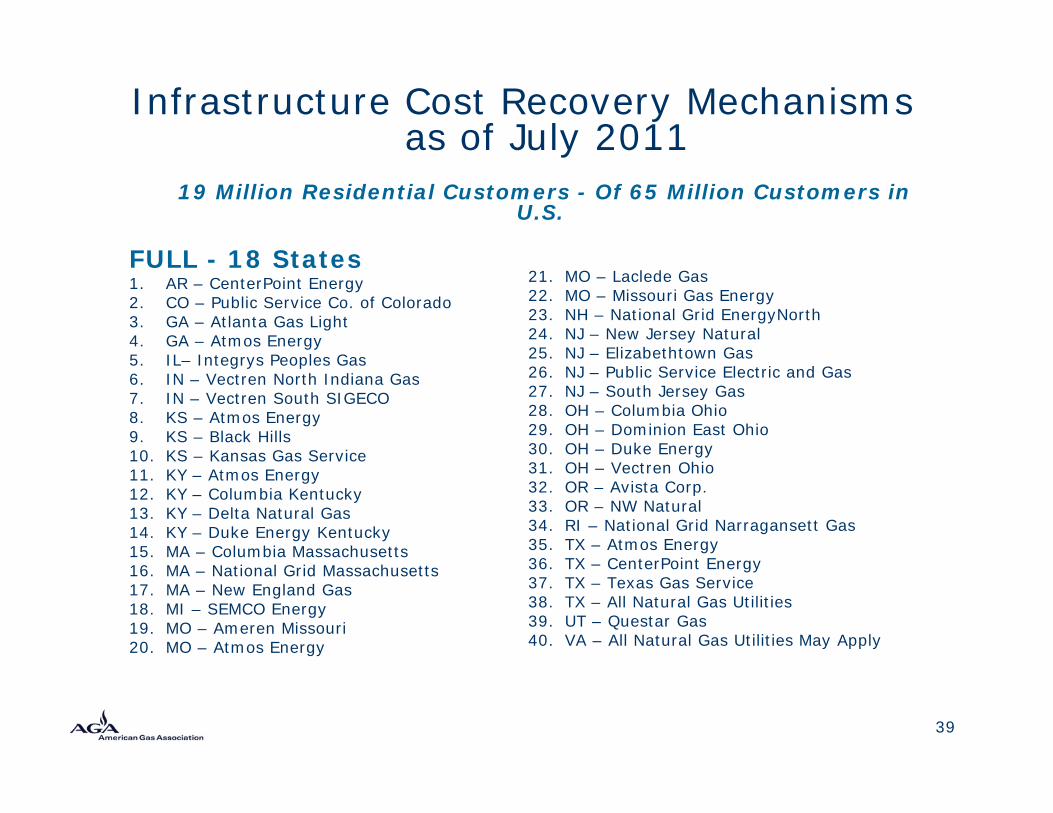
Infrastructure Cost Recovery Mechanismsas of July 2011
19 Million Residential Customers - Of 65 Million Customers in U.S.
FULL - 18 States1. AR – CenterPoint Energy2. CO – Public Service Co. of Colorado3. GA – Atlanta Gas Light4. GA – Atmos Energy5. IL– Integrys Peoples Gas 6. IN – Vectren North Indiana Gas7. IN – Vectren South SIGECO8. KS – Atmos Energy9. KS – Black Hills10. KS – Kansas Gas Service11. KY – Atmos Energy12. KY – Columbia Kentucky13. KY – Delta Natural Gas14. KY – Duke Energy Kentucky15. MA – Columbia Massachusetts16. MA – National Grid Massachusetts17. MA – New England Gas18. MI – SEMCO Energy19. MO – Ameren Missouri20. MO – Atmos Energy
21. MO – Laclede Gas22. MO – Missouri Gas Energy23. NH – National Grid EnergyNorth24. NJ – New Jersey Natural25. NJ – Elizabethtown Gas26. NJ – Public Service Electric and Gas 27. NJ – South Jersey Gas 28. OH – Columbia Ohio29. OH – Dominion East Ohio30. OH – Duke Energy31. OH – Vectren Ohio32. OR – Avista Corp.33. OR – NW Natural34. RI – National Grid Narragansett Gas35. TX – Atmos Energy36. TX – CenterPoint Energy37. TX – Texas Gas Service38. TX – All Natural Gas Utilities39. UT – Questar Gas40. VA – All Natural Gas Utilities May Apply
39
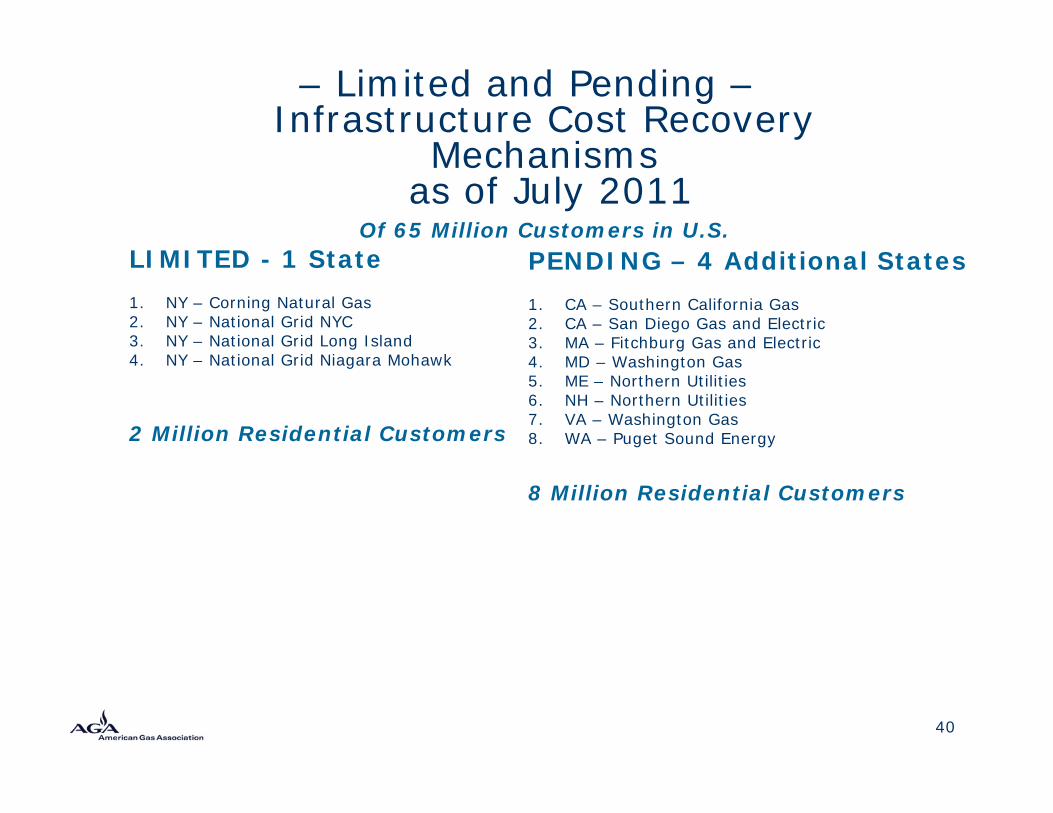
– Limited and Pending –Infrastructure Cost Recovery
Mechanisms as of July 2011
Of 65 Million Customers in U.S.LIMITED - 1 State1. NY – Corning Natural Gas2. NY – National Grid NYC3. NY – National Grid Long Island4. NY – National Grid Niagara Mohawk
2 Million Residential Customers
PENDING – 4 Additional States1. CA – Southern California Gas2. CA – San Diego Gas and Electric3. MA – Fitchburg Gas and Electric4. MD – Washington Gas5. ME – Northern Utilities6. NH – Northern Utilities7. VA – Washington Gas8. WA – Puget Sound Energy
8 Million Residential Customers
40
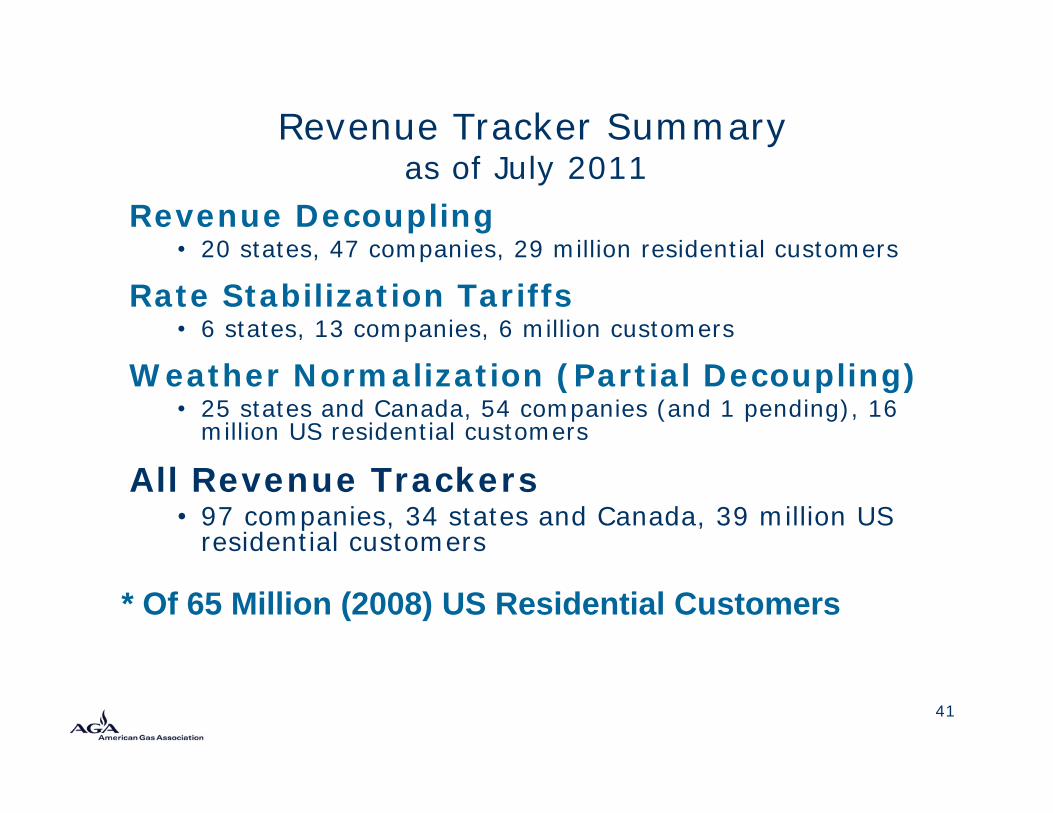
Revenue Tracker Summaryas of July 2011
Revenue Decoupling• 20 states, 47 companies, 29 million residential customers
Rate Stabilization Tariffs• 6 states, 13 companies, 6 million customers
Weather Normalization (Partial Decoupling)• 25 states and Canada, 54 companies (and 1 pending), 16
million US residential customers
All Revenue Trackers• 97 companies, 34 states and Canada, 39 million US
residential customers
41
* Of 65 Million (2008) US Residential Customers
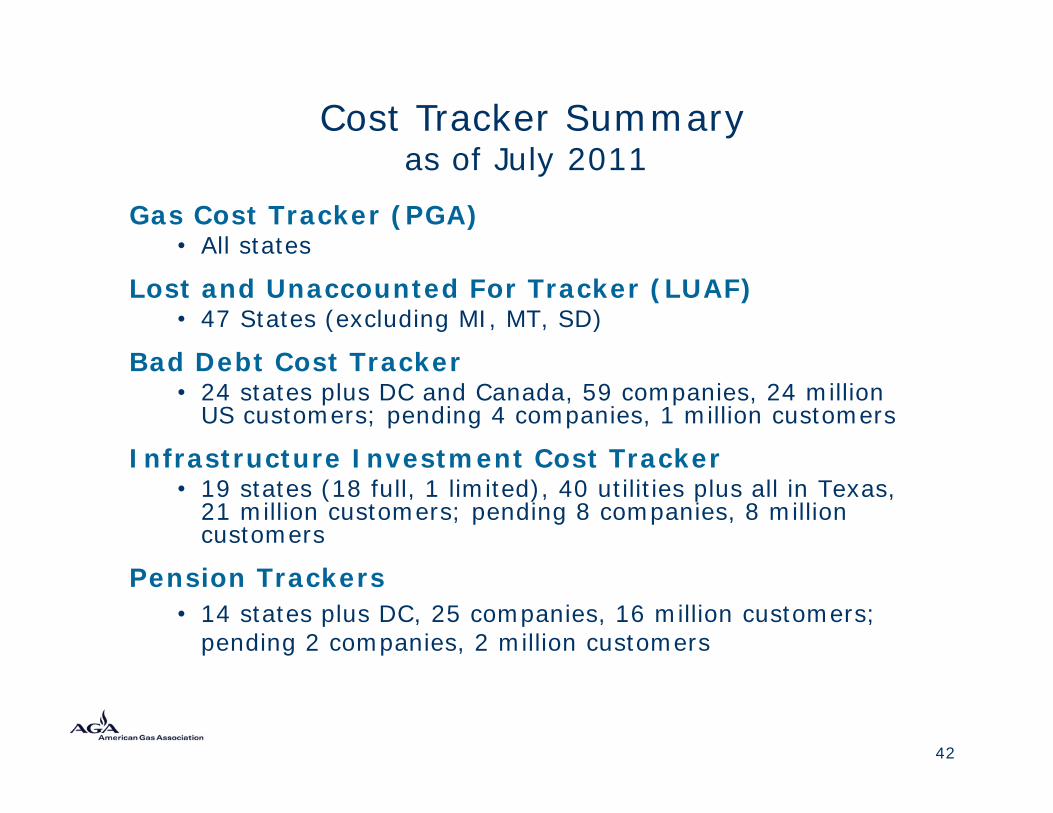
Cost Tracker Summaryas of July 2011
Gas Cost Tracker (PGA)• All states
Lost and Unaccounted For Tracker (LUAF)• 47 States (excluding MI, MT, SD)
Bad Debt Cost Tracker• 24 states plus DC and Canada, 59 companies, 24 million
US customers; pending 4 companies, 1 million customers
Infrastructure Investment Cost Tracker• 19 states (18 full, 1 limited), 40 utilities plus all in Texas,
21 million customers; pending 8 companies, 8 million customers
Pension Trackers• 14 states plus DC, 25 companies, 16 million customers;
pending 2 companies, 2 million customers
42
Cynthia J. MarpleCynthia J. MarpleDirector, Rates and Regulatory Affairs
Director, Rates and Regulatory [email protected]
202-824-7228www.aga.org