ecosystem services: dynamics, modeling and valuation
TRANSCRIPT

Ecosystem Services:Dynamics, Modeling and
Valuation

GrowingEconomicSubsystem
RecycledMatter
Energy
Resources
Energy
Resources
SolarEnergy
Waste Heat
"EmptyWorld"
SinkFunctions
SourceFunctions
Finite Global Ecosystem

Labor
Land
EconomicProcess
GoodsandServices
CulturalNorms andPolicy
IndividualUtility/welfare
Consumption(based on fixedpreferences)
Improvement
Education, Training,Research
Building
Investment(decisions about, taxesgovernment spending,education,science andtechnologypolicy, etc., basedon existing propertyrights regimes)
Property rights
Private Public
GNP
Manufacturedcapital
”Empty World" Model of the Economy
Perf
ect
Su
bst
itu
tab
ility
Betw
een
Fact
ors

GrowingEconomic
Subsystem
RecycledMatter
Resources
SolarEnergy
Waste Heat
"FullWorld"
Energy Energy
Resources
FInite Global Ecosystem
SinkFunctions
SourceFunctions

The “Nature” of Goods and Services

Degradation of ecosystem services often causes significant
harm to human well-being
– The total economic value associated with managing ecosystems more sustainably is often higher than the value associated with conversion
– Conversion may still occur because private economic benefits are often greater for the converted system

Human CapitalEconomic
Production
Process
GoodsandServices
EvolvingCulturalNorms andPolicy
Well Being(Individual andCommunity)
Consumption(based on changing,adaptingpreferences)
Education, training,
research.
Building
Investment(decisions about, taxescommunity spending,education, science andtechnology policy, etc., basedon complex propertyrights regimes)
Individual Public
GNP
Wastes
Common
Ecologicalservices/amenities
having, being
- having,- being
negative impacts on all forms of capital
being, doing, relating
Restoration,
ConservationNatural Capital
ManufacturedCapital
having
positive impacts on human capital capacity
doing, relatingComplex propertyrights regimes
SolarEnergy
SocialCapital
Lim
ited
Su
bst
ituta
bili
tyB
etw
ee
n C
ap
ital F
orm
s
“Full World” Model of the Ecological Economic System
Waste heat
Institutional
rules, norms, etc.
Materially closed earth system
From: Costanza, R., J. C. Cumberland, H. E. Daly, R. Goodland, and R. Norgaard. 1997. An Introduction to Ecological Economics. St. Lucie Press, Boca Raton, 275 pp.
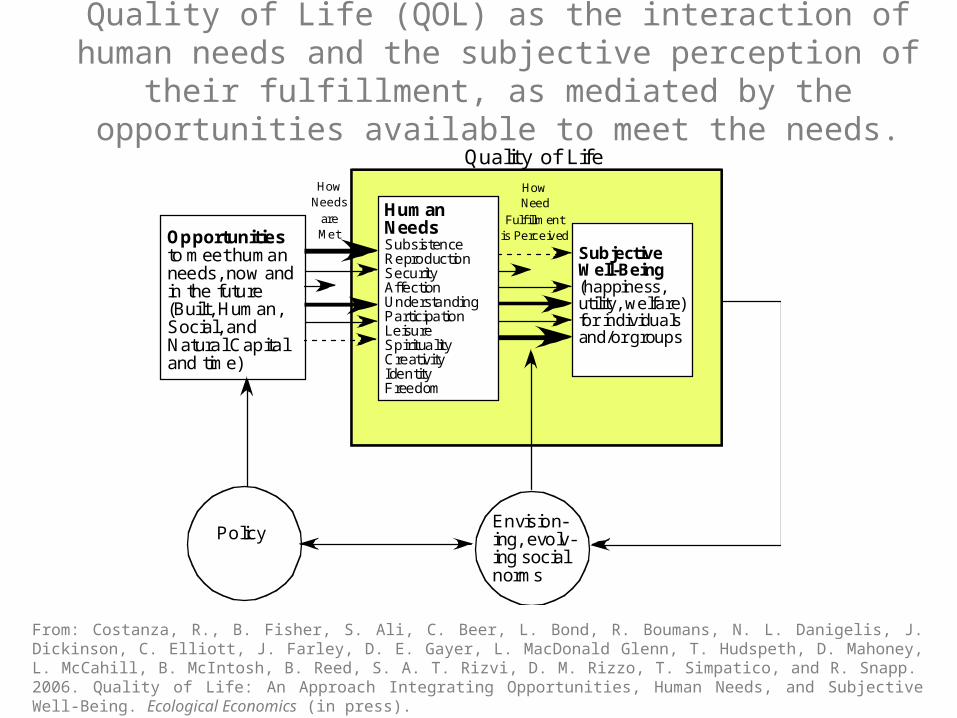
HumanNeedsSubsistenceReproductionSecurityAffectionUnderstandingParticipationLeisureSpiritualityCreativityIdentityFreedom
SubjectiveWell-Being(happiness,utility, welfare)for individualsand/or groups
Quality of Life
Opportunitiesto meet humanneeds, now andin the future(Built, Human,Social, andNatural Capitaland time)
PolicyEnvision-ing, evolv-ing socialnorms
HowNeeds
areMet
HowNeed
Fulfillmentis Perceived
Quality of Life (QOL) as the interaction of human needs and the subjective perception of their fulfillment, as mediated by the
opportunities available to meet the needs.
From: Costanza, R., B. Fisher, S. Ali, C. Beer, L. Bond, R. Boumans, N. L. Danigelis, J. Dickinson, C. Elliott, J. Farley, D. E. Gayer, L. MacDonald Glenn, T. Hudspeth, D. Mahoney, L. McCahill, B. McIntosh, B. Reed, S. A. T. Rizvi, D. M. Rizzo, T. Simpatico, and R. Snapp. 2006. Quality of Life: An Approach Integrating Opportunities, Human Needs, and Subjective Well-Being. Ecological Economics (in press).


This is the 2nd most cited article in the last 10 years in the Ecology/Environment area according to the ISI Web of Science.
NATURE |VOL 387 | 15 MAY 1997 253
article
The value of the world’s ecosystemservices and natural capitalRobert Costanza*†, Ralph d’Arge‡, Rudolf de Groot§, Stephen Farberk, Monica Grasso†, Bruce Hannon¶,Karin Limburg#I, Shahid Naeem**, Robert V. O’Neill††, Jose Paruelo‡‡, Robert G. Raskin§§, Paul Suttonkk& Marjan van den Belt¶¶* Center for Environmental and Estuarine Studies, Zoology Department, and † Insitute for Ecological Economics, University of Maryland, Box 38, Solomons,Maryland 20688, USA‡ Economics Department (emeritus), University of Wyoming, Laramie, Wyoming 82070, USA§ Center for Environment and Climate Studies, Wageningen Agricultural University, PO Box 9101, 6700 HB Wageninengen, The NetherlandskGraduate School of Public and International Affairs, University of Pittsburgh, Pittsburgh, Pennsylvania 15260, USA¶ Geography Department and NCSA, University of Illinois, Urbana, Illinois 61801, USA# Institute of Ecosystem Studies, Millbrook, New York, USA** Department of Ecology, Evolution and Behavior, University of Minnesota, St Paul, Minnesota 55108, USA†† Environmental Sciences Division, Oak Ridge National Laboratory, Oak Ridge, Tennessee 37831, USA‡‡ Department of Ecology, Faculty of Agronomy, University of Buenos Aires, Av. San Martin 4453, 1417 Buenos Aires, Argentina§§ Jet Propulsion Laboratory, Pasadena, California 91109, USAkkNational Center for Geographic Information and Analysis, Department of Geography, University of California at Santa Barbara, Santa Barbara, California 93106,USA¶¶ Ecological Economics Research and Applications Inc., PO Box 1589, Solomons, Maryland 20688, USA. . . . . . . . . . . . . . . . . . . . . . . . . . . . . . . . . . . . . . . . . . . . . . . . . . . . . . . . . . . . . . . . . . . . . . . . . . . . . . . . . . . . . . . . . . . . . . . . . . . . . . . . . . . . . . . . . . . . . . . . . . . . . . . . . . . . . . . . . . . . . . . . . . . . . . . . . . . . . . . . . . . . . . . . . . . . . . . . . . . . . . . . . . . . . . . . . . . . . . . . . . . . . . . . . . . . . . . . . . . . . . . . . . . . . . . . . . . . . . . . . . . . . . . .
The services of ecological systems and the natural capital stocksthat produce them are critical to the functioning of theEarth’s life-support system. They contribute to human welfare, both directly and indirectly, and therefore representpart of the total economic value of the planet.We have estimated the current economic value of 17 ecosystem servicesfor 16 biomes, based on published studies and a few original calculations. For the entire biosphere, the value (most ofwhich is outside the market) is estimated to be in the range of US$16–54 trillion (1012) per year, with an average ofUS$33trillion per year. Because of the nature of the uncertainties, thismust be considered a minimum estimate. Globalgross national product total is around US$18 trillion per year.

Focus: Consequences of Ecosystem Change for Human Well-being

Tools for Analyses

GUMBO (Global Unified Model of the BiOsphere)
From: Boumans, R., R. Costanza, J. Farley, M. A. Wilson, R. Portela, J. Rotmans, F. Villa, and M. Grasso. 2002. Modeling the Dynamics of the Integrated Earth System and the Value of Global Ecosystem Services Using the GUMBO Model. Ecological Economics 41: 529-560
Atmosphere
Anthropo-sphere
EcosystemServices
HumanImpacts
Natural Capital Human-madeCapital(includes Built CapitalHuman Capital,and Social Capital
SolarEnergy
Hydrosphere
Lithosphere
Biosphere
11 Biomes

GUMBO
0
1
2
3
4Atmosphere
Water Cycle
Land - Soil
Demographic
Political
Development
Cultural-Values
Economics
Landuse change
Industry - Pollution
Energy
Agriculture
Freshwater
Biogeochemistry
Natural Systems
Social SystemsHuman - Environment Feedback
TARGETS
0
1
2
3
4Atmosphere
Water Cycle
Land - Soil
Demographic
Political
Development
Cultural-Values
Economics
Landuse change
Industry - Pollution
Energy
Agriculture
Freshwater
Biogeochemistry
Natural Systems
Social SystemsHuman - Environment Feedback
DICE
0
1
2
3
4Atmosphere
Water Cycle
Land - Soil
Demographic
Political
Development
Cultural-Values
Economics
Landuse change
Industry - Pollution
Energy
Agriculture
Freshwater
Biogeochemistry
Natural Systems
Social SystemsHuman - Environment Feedback
IFs
0
1
2
3
4Atmosphere
Water Cycle
Land - Soil
Demographic
Political
Development
Cultural-Values
Economics
Landuse change
Industry - Pollution
Energy
Agriculture
Freshwater
Biogeochemistry
Natural Systems
Social SystemsHuman - Environment Feedback
IMAGE-2
0
1
2
3
4Atmosphere
Water Cycle
Land - Soil
Demographic
Political
Development
Cultural-Values
Economics
Landuse change
Industry - Pollution
Energy
Agriculture
Freshwater
Biogeochemistry
Natural Systems
Social SystemsHuman - Environment Feedback
IMAGE
0
1
2
3
4Atmosphere
Water Cycle
Land - Soil
Demographic
Political
Development
Cultural-Values
Economics
Landuse change
Industry - Pollution
Energy
Agriculture
Freshwater
Biogeochemistry
Natural Systems
Social SystemsHuman - Environment Feedback
WORLD3
0
1
2
3
4Atmosphere
Water Cycle
Land - Soil
Demographic
Political
Development
Cultural-Values
Economics
Landuse change
Industry - Pollution
Energy
Agriculture
Freshwater
Biogeochemistry
Natural Systems
Social SystemsHuman - Environment Feedback
MODEL COMPLEXITY0 = Not addressed in model.1 = Exogenous input to model.2 = Endogenous w/o feedback in model3 = Endogenous w/ feedback (mid-complexity)4 = Endogenous w/ feedback (very complex)
DEGREE OF HISTORIC CALIBRATIONLow High
Amoeba diagram of complexity with which Integrated Global Models (IGMs) capture socioeconomic systems, natural systems, and feedbacks (from Costanza, R., R. Leemans, R. Boumans, and E. Gaddis. 2006. Integrated global models. Dahlem Workshop on Integrated History and future of People on Earth (IHOPE). (in press)

Ecosystem functions: The capacity of natural processes and components to provide goods and services that satisfy human needs. (de Groot, 1992)Ecosystem Services: Valued Ecosystem Functions.
R.S. de Groot et al. / Ecological Economics 41 (2002) 393–408

Werners, S.E. and R. Boumans (2005) Simulating global feedbacks between Sea Level Rise, Water for Agriculture and the complex Socio-economic Development of the IPCC Scenarios,
In: Proceedings Environmental Modelling and Software Society Conference: Complexity and Integrated Resources Management (IEMSS2004), Osnabrück, June 2004
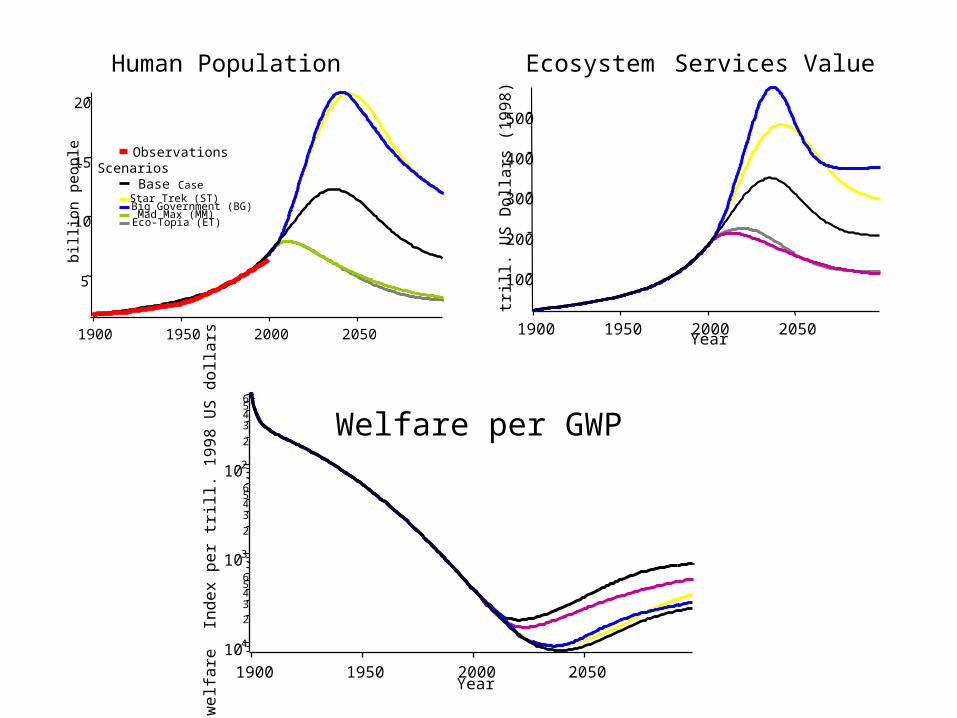
20
15
10
5
bill
ion p
eop
le
2050200019501900
Human Population
ObservationsScenarios
Base Case Star Trek (ST) Big Government (BG) Mad Max (MM) Eco-Topia (ET)
500
400
300
200
100trill
. U
S D
olla
rs (
19
98
)
2050200019501900Year
Ecosystem Services Value
10-4
23456
10-32
3456
10-22
3456
welfare
In
dex p
er
trill
. 1
99
8 U
S d
olla
rs
2050200019501900Year
Welfare per GWP


Ecosystem Evaluations

Conventional economic valuation presumes that people have well-formed preferences and enough
information about trade-offs that they can adequately judge their “willingness-to-pay.”
These assumptions do not hold for many ecosystem services.
Therefore we must:

• (1) inform people’s preferences as demonstrated by DeGroot et al. Costanza et al.;
• (2) allow groups to discuss the issues and “construct” their preferences in development under ARIES, TNC InVest and the ESR (Corporate Ecosystem Services Review, developed by the World Resource Institute
or
• (3) use other techniques that do not rely on preferences to estimate the contribution to human welfare of ecosystem services (i.e. using the models developed to directly infer marginal contributions to welfare). The MIMES approach.

Ecological Economics 41 (2002) 393–408 SPECIAL ISSUE:
A typology for the classification, description and valuation of ecosystem functions, goods and services
Rudolf S. de Groot, Matthew A. Wilson, Roelof M.J. Boumans


Value Typology

Existing & Emerging Tools
• ARIES (Assessment and Research Infrastructure for Ecosystem Services), which is under development by the University of Vermont’s Ecoinformatics Collaboratory (within the Gund Institute for Ecological Economics), Conservation International, Earth Economics, as well as with collaboration from experts at Wageningen University. An initial online version will be launched in 2008.
• ESR (Corporate Ecosystem Services Review), which was launched in March 2008 by the World Resources Institute (WRI), the Meridian Institute, and the World Business Council on Sustainable Development (WBCSD).
• InVEST (Integrated Valuation of Ecosystem Services and Tradeoffs), which is in development by The Natural Capital Project—a joint venture among Stanford University’s Woods Institute for the Environment, The Nature Conservancy, and World Wildlife Fund—with the goal of issuing a manual in the Summer / Fall 2008 and software in Fall / Winter 2008.
• MIMES (Multiscale Integrated Models of Ecosystem Services), which is currently available in an early version (“beta plus”) from the University of Vermont’s Gund Institute for Ecological Economics.
•

Ecosystem Services and Land Cover Types

The Rapid Accessment Valuation Tool (RAV)

Info on the Benefit transfer Method
• http://www.ecosystemvaluation.org/

1 Not every forest provides ecosystem services at the same rate
2 Ecosystem service values are specific in time and space
• Problems with the Benefits Transfer Method

Ecosystem Services classified according to spatial characteristicsOmni-directional, Global (does not depend on proximity)
Carbon sequestration (NPP)Carbon storage Existence of “nature”
Omni-directional, Local (depends on proximity)Storm protectionWaste treatment Pollination
Directional flow related: flow from point of production to point of useWater supplyWater regulation/flood protectionNutrient regulationSediment regulation
In situ (point of use)Rangeland for livestockNitrogen mineralization for ag. productionSoil formationRaw materialsNon-timber forest products
User movement flow related: flow of people to unique natural featuresAesthetic/recreation potential

Innovative, online dynamic modeling and mapping tools for ecosystem services
analysis at multiple scales (2013)
Dynamic Modeling and Mapping Tool
-10
-8
-6
-4
-2
0
2
4
6
8
10
12
ForestNative
grasslandHeadwater
wetlandRiparian
forestVegetatedbuffer strip
Rip Rapslope Row crop Grass seed Urban
Nutrient removal
Temperature regulation
Carbon Sequestration
Habitat
Flood protection
Food & Goods

MIMES Objectives / Goals
• Develop a sophisticated and transferable system to elucidate dynamics of ecosystem services. – Develop a dynamic spatial model – Collect data
– Provide a user interface • Understand the link between ecosystem
services and human welfare– Develop valuation protocols
• Forecast changes in ecosystem functions and values under various management scenarios.– Model scenario development
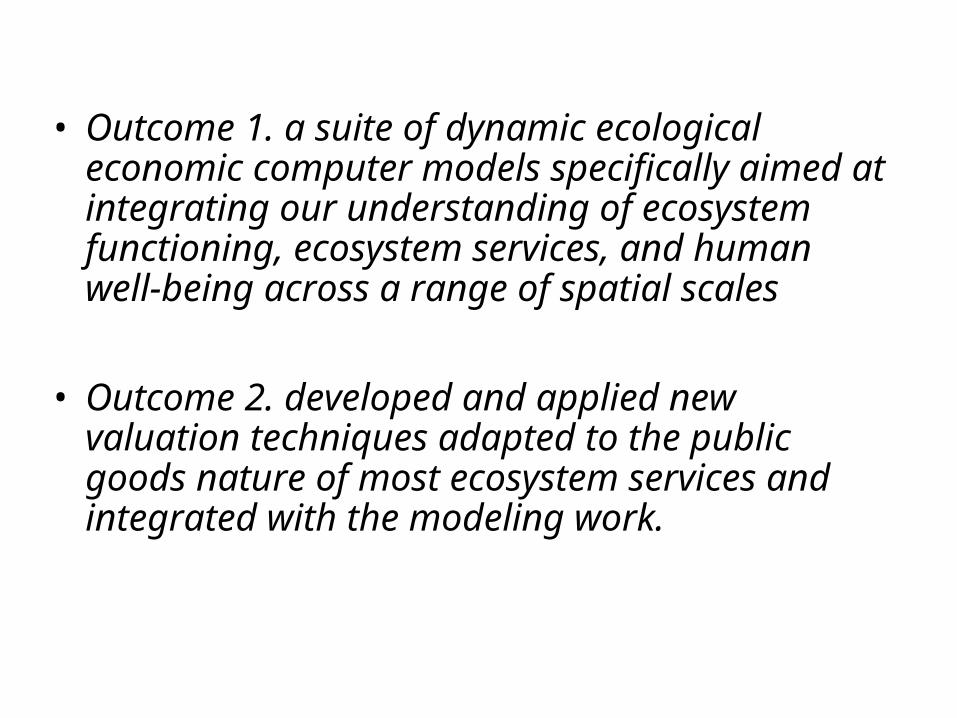
• Outcome 1. a suite of dynamic ecological economic computer models specifically aimed at integrating our understanding of ecosystem functioning, ecosystem services, and human well-being across a range of spatial scales
• Outcome 2. developed and applied new valuation techniques adapted to the public goods nature of most ecosystem services and integrated with the modeling work.

LocationsBiosphere
Earth Surfaces
NutrientCycling
Hydrosphere Lithosphere Atmosphere
Anthroposphere
Cultures
Biodiversity
EcosystemServices
Water by
Reservoir
Geological Carbon
Ores
Earth Energy
Gasses
ExchangesBetweenLocations
Social Capital
Human Capital
Economie
MIMES organization and Interaction Matrix

Spatially explicit functional modeling
Economics Sectors
Final demand
GovernmentInvestments
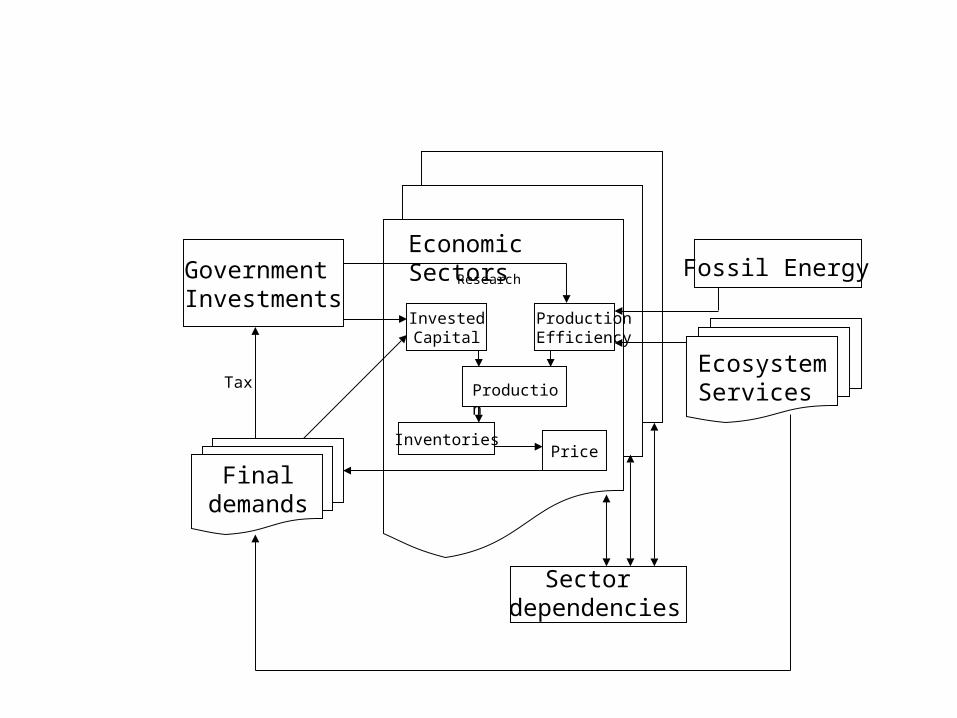
InvestedCapital
ProductionEfficiency
PriceInventories
Economic SectorsFossil Energy
Sector dependencies
Finaldemands
Government Investments
ProductionTax
Research
EcosystemServices

Oceans
Ecosystems (% Area)
Croplands Wetlands
Urban
Forests
Tundra

1990 economic production in $ PPP per country
Agriculture
Households
Tourism
Transportation
Fisheries
Research
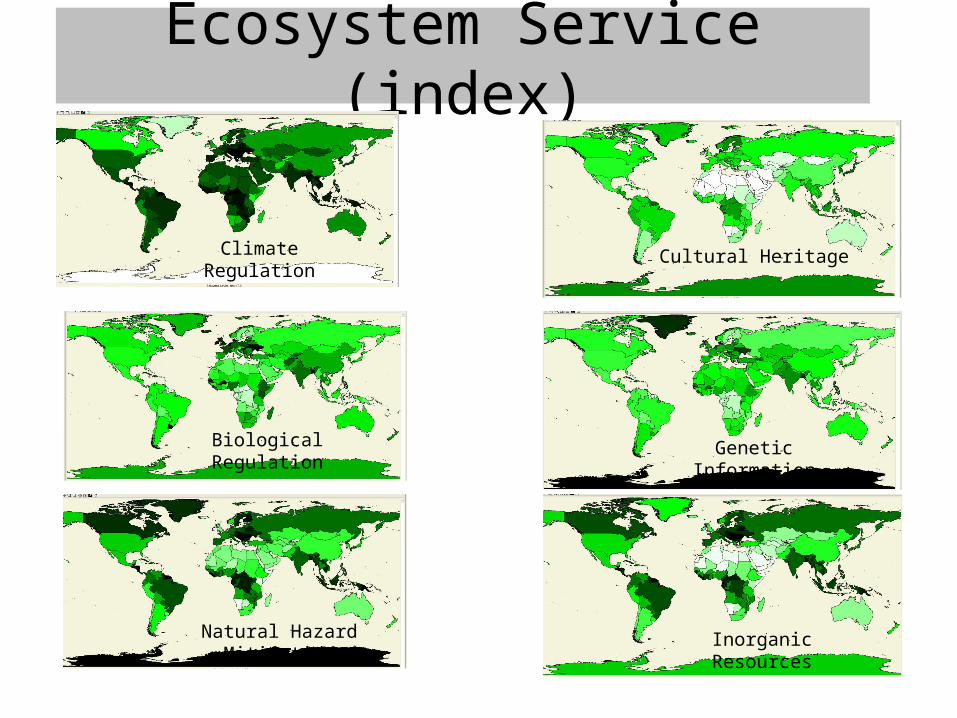
Ecosystem Service (index)
Climate Regulation
Biological Regulation
Natural Hazard Mitigation
Cultural Heritage
Genetic Information
Inorganic Resources
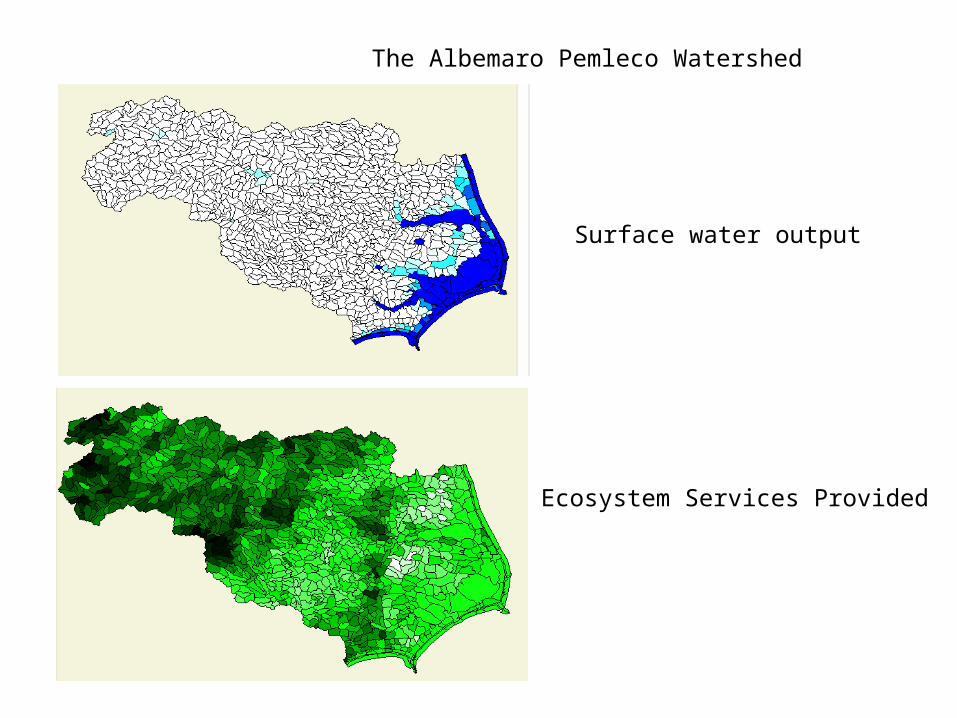
Surface water output
Ecosystem Services Provided
The Albemaro Pemleco Watershed

Ecological Research ProgramCore Science at Systems Level

Biodiversity
surface waterSWAT
Geological Carbon
Ores
Earth Energy
GassesMARKAL
CMAQ
Social Capital
Human Capital
Location12 Midwest States
Anthroposphere
Atmosphere
Biosphere
LithosphereHydrosphere
Ecosystem Services
ReVAeconomic vitalityclimate regulation
water qualitywater quantityhuman health quality of lifebiodiversityrecreation
Nutrient CyclingSWAT
nitrogensedimentAtrazinecarbon
phosphorus
Earth SurfacesNLCD and CDL
water, forest, wetland,amended cropland,
urban
river channel
groundwater
Cultures
EconomyFAPRI

US WetlandsBiosphere
Earth Surfaces
Nutrient CyclingCENTURY
C, N, P
Hydrosphere Lithosphere Atmosphere
Anthroposphere
Cultures
BiodiversityWaterfowl in MS
Vector-borne disease
EcosystemServices
Carbon sequestrationWater quality/quantityFlood/storm protection
Wildlife habitatFisheries supportHuman well-being
Water CyclingKINEROS2-OPUS2
SWATProbabilistic storm
surge
Geological Carbon
Ores
Earth EnergyAtm. forcing
Gasses
Social Capital
Human Capital
Economy
Location

Biosphere
Earth Surfaces
NutrientCycling
Hydrosphere Lithosphere Atmosphere
Anthroposphere
Cultures
Biodiversity
EcosystemServices
Water by Reservoir Geological Carbon
Ores
Earth Energy
GassesCMAQ
H20, N, Hg
Social Capital
Human Capital
Economy
BASS
water cleansingprimary productivity fish community compositionfish whole body conc. (Hg) water quantity
Habitat Suitability
SWAT N,P, Hg, Pesticides
GFLOW
WASP
LocationCoastal Carolinas*

Biosphere
Earth SurfacesReef, algae, wetland, forest,
urban, agriculture
Nutrient CyclingNitrogenCaCO3
Hydrosphere LithosphereAtmosphere
Anthroposphere
Cultures
Biodiversity
EcosystemServices
Shoreline protection
FishingTourism
Biodiversity
Social Capital
Human Capital
Economy
LDI indexStatistical models
Coastal protection indexStatistical modelsSORTIE
WRI valuation methods
Geological Carbon
Ores
Earth EnergyClimate change
SST, solar radiation
GasesClimate change
CO2
Open water
Groundwater
Ocean circulationStorm frequency
Surface water
Benthic substrate
LocationCoral Reefs

Biosphere
Earth Surfaceswater, forest, wetlands,
agriculture, urban
NutrientCycling
C, N, P, Hg
Hydrosphere
Anthroposphere
Cultures
Biodiversity
EcosystemServiceswater supplywater quality
CO2 sequestration flood protection
food and fiber productionhabitat and biodiversity
recreationnitrogen regulation
Water by
Reservoir
Lithosphere
Geological Carbon
Ores
Atmosphere
Earth Energy
GassesO3
Social Capital
Human Capital
Economy
LocationTampa Bay

Biosphere
Earth SurfacesForests, WetlandsAgriculture, Urban
NutrientCyclingGT MELCentury
SPARROWN, C, Hg
Hydrosphere Lithosphere Atmosphere
Anthroposphere
Cultures
BiodiversityPATCH
EcosystemServicesWater Supply
Flood ProtectionCO2 SequestrationNitrogen ControlFood and Fiber
HabitatBiodiversity
Sense of Place
Water GA Tech Model
CLIGENKINEROS
MODFLOW
Geological Carbon
Ores
Earth Energy
Gasses
Social Capital
Human Capital
Economy
LocationWillamette Basin