national marine ecosystem service valuation kiribati
TRANSCRIPT
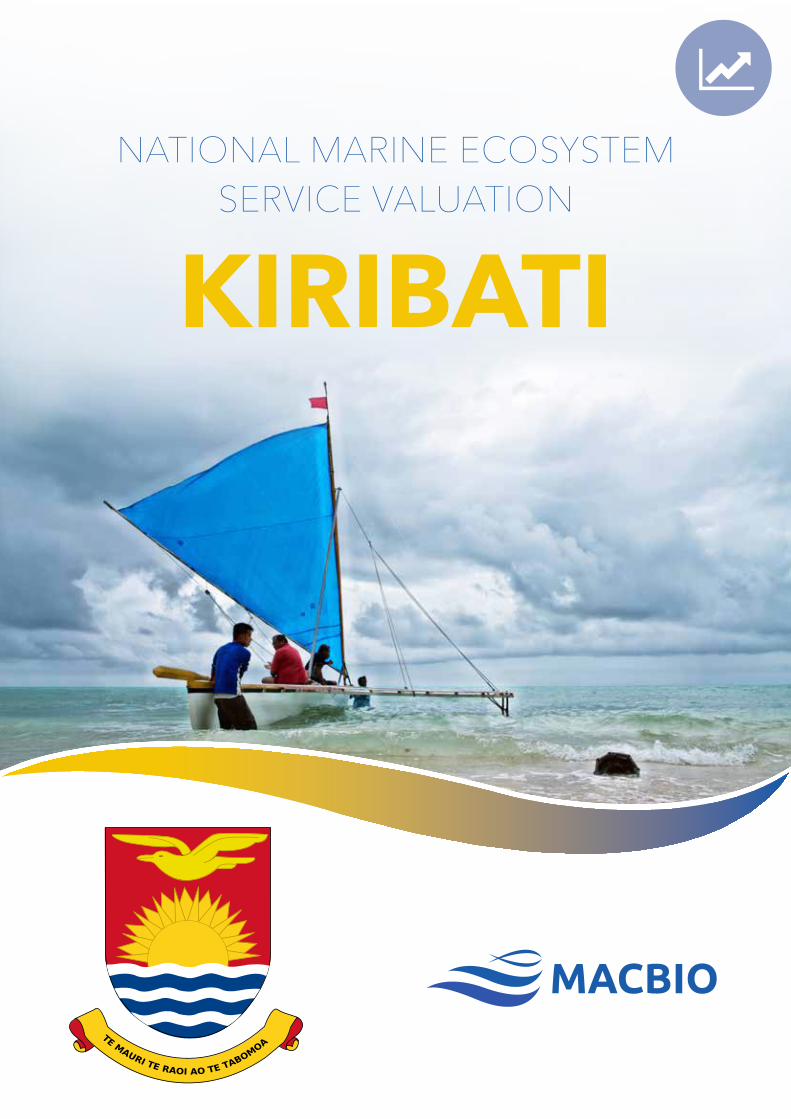
NATIONAL MARINE ECOSYSTEM SERVICE VALUATION
KIRIBATI
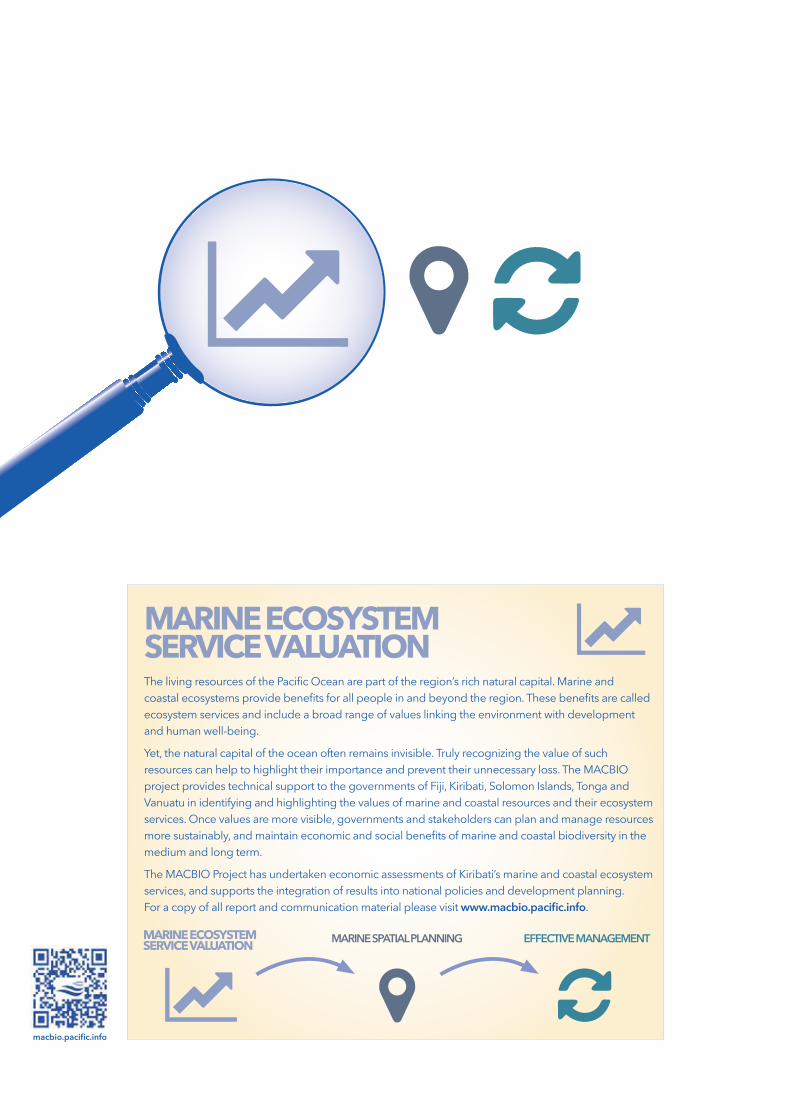
MARINE ECOSYSTEM SERVICE VALUATION MARINE SPATIAL PLANNING EFFECTIVE MANAGEMENT
MARINE ECOSYSTEM SERVICE VALUATIONThe living resources of the Pacific Ocean are part of the region’s rich natural capital. Marine and coastal ecosystems provide benefits for all people in and beyond the region. These benefits are called ecosystem services and include a broad range of values linking the environment with development and human well-being.
Yet, the natural capital of the ocean often remains invisible. Truly recognizing the value of such resources can help to highlight their importance and prevent their unnecessary loss. The MACBIO project provides technical support to the governments of Fiji, Kiribati, Solomon Islands, Tonga and Vanuatu in identifying and highlighting the values of marine and coastal resources and their ecosystem services. Once values are more visible, governments and stakeholders can plan and manage resources more sustainably, and maintain economic and social benefits of marine and coastal biodiversity in the medium and long term.
The MACBIO Project has undertaken economic assessments of Kiribati’s marine and coastal ecosystem services, and supports the integration of results into national policies and development planning. For a copy of all report and communication material please visit www.macbio.pacific.info.
PrinciPal author: Iete Rouatu1
contributing authors: Guillaume Leport2, Nicolas Pascal3, Hans Wendt4, Riibeta Abeta5
Editors: Luke Brander6, Leanne Fernandes4, Jacob Salcone4, Andrew Seidl7
author aFFiliations
1 Independent consultant, Betio (Takoronga), Tarawa, Kiribati
2 Centre de Recherches Insulaires et Observatoire de l’Environnement, Scientific Research Unit , Centre National de la Recherche Scientifique (CNRS) – Ecole Pratique des Hautes Etudes (EPHE), Papetoai, Moorea, French Polynesia
3 Blue Finance, Washington DC, USA; Emua, Vanuatu
4 MACBIO project, IUCN Oceania Regional Office, Fiji
5 MACBIO project, GIZ-MACBIO Office, Fiji
6 Brander Environmental Economics, Hong Kong
7 Colorado State University – Department of Agricultural and Resource Economics, Fort Collins, Colorado, USA
© 2015 MACBIO
NATIONAL MARINE ECOSYSTEM SERVICE VALUATION
KIRIBATI
© MACBIO 2015
All MACBIO Project partners including the Secretariat of the Pacific Regional Environment Programme (SPREP), the International Union for Conservation of Nature (IUCN) and Deutsche Gesellschaft für Internationale Zusammenarbeit (GIZ) are the inherent copyright owners of this publication.
Reproduction of this publication for educational or other non-commercial uses is authorized without prior written permission from the copyright holder(s) provided the source is fully acknowledged.
Reproduction of this publication for resale or other commercial purposes is prohibited without prior written permission of the copyright holder(s).The designation of geographical entities in this publication, and the presentation of the material do not imply the expression of any opinion whatsoever on the part of SPREP, IUCN, GIZ or the German Federal Ministry for the Environment, Nature Conservation, Building and Nuclear Safety (BMUB) concerning the legal status of any country, territory, or area, or of its authorities, or concerning the delimitation of its frontiers or boundaries.
This document has been produced with funds provided by the International Climate Initiative (IKI). BMUB supports this initiative on the basis of a decision adopted by the German Bundestag. The views expressed herein should not be taken, in any way, to reflect the official opinion of the Federal Government of Germany.
The views expressed in this publication do not necessarily reflect those of SPREP/IUCN/GIZ/BMUB.
MACBIO holds the copyright of all photographs, unless otherwise indicated.
Recommended citation: Rouatu I, Leport G, Pascal N, Wendt H, Abeta R, Brander L, Fernandes L, Seidl A, Salcone J (2017) National marine ecosystem service valuation: Kiribati. MACBIO (GIZ/IUCN/SPREP): Suva, Fiji. 83 pp.

KIRIBATI
CONTENTS
ACROnYMS IX
EXECuTIVE SuMMARY 1
1 InTROduCTIOn 5
2 COnTEXT 9
3 COnCEPTuAL FRAMEWORK 23
4 LITERATuRE REVIEW 27
5 METHOdS 29
6 RESuLTS 31
7 dISCuSSIOn 69
8 RECOMMEndATIOnS 70
9 CAVEATS And COnSIdERATIOnS 71
10 REFEREnCES 73
11 ACKnOWLEdGEMEnTS 75
12 APPEndIX I GLOSSARY 77
13 APPEndIX II STAKEHOLdER COnSuLTATIOnS, ATTEndEE LISTS 79
14 APPEndIX III TunA CATCH BY nATIOnAL WATERS: 1997–2013 83
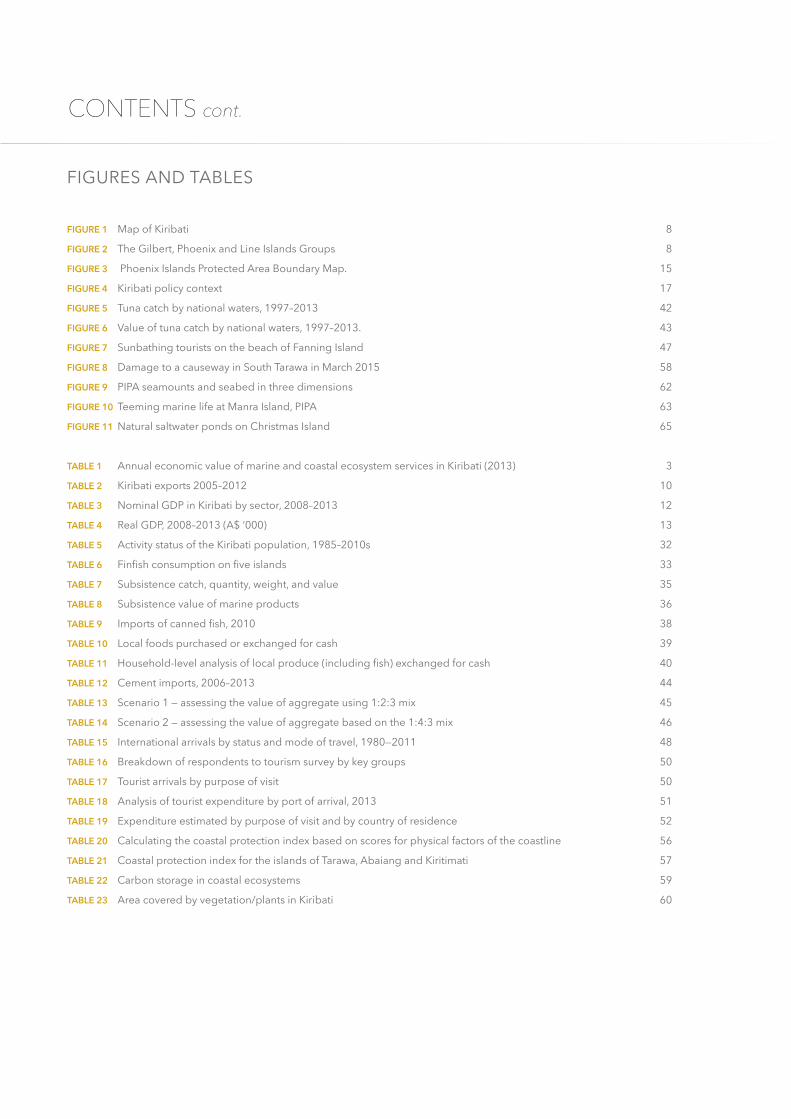
CONTENTS cont.
FIGuRES And TABLES
FIGuRE 1 Map of Kiribati 8
FIGuRE 2 The Gilbert, Phoenix and Line Islands Groups 8
FIGuRE 3 Phoenix Islands Protected Area Boundary Map. 15
FIGuRE 4 Kiribati policy context 17
FIGuRE 5 Tuna catch by national waters, 1997–2013 42
FIGuRE 6 Value of tuna catch by national waters, 1997–2013. 43
FIGuRE 7 Sunbathing tourists on the beach of Fanning Island 47
FIGuRE 8 damage to a causeway in South Tarawa in March 2015 58
FIGuRE 9 PIPA seamounts and seabed in three dimensions 62
FIGuRE 10 Teeming marine life at Manra Island, PIPA 63
FIGuRE 11 natural saltwater ponds on Christmas Island 65
TAbLE 1 Annual economic value of marine and coastal ecosystem services in Kiribati (2013) 3
TAbLE 2 Kiribati exports 2005–2012 10
TAbLE 3 nominal GdP in Kiribati by sector, 2008–2013 12
TAbLE 4 Real GdP, 2008–2013 (A$ ‘000) 13
TAbLE 5 Activity status of the Kiribati population, 1985–2010s 32
TAbLE 6 Finfish consumption on five islands 33
TAbLE 7 Subsistence catch, quantity, weight, and value 35
TAbLE 8 Subsistence value of marine products 36
TAbLE 9 Imports of canned fish, 2010 38
TAbLE 10 Local foods purchased or exchanged for cash 39
TAbLE 11 Household-level analysis of local produce (including fish) exchanged for cash 40
TAbLE 12 Cement imports, 2006–2013 44
TAbLE 13 Scenario 1 — assessing the value of aggregate using 1:2:3 mix 45
TAbLE 14 Scenario 2 — assessing the value of aggregate based on the 1:4:3 mix 46
TAbLE 15 International arrivals by status and mode of travel, 1980—2011 48
TAbLE 16 Breakdown of respondents to tourism survey by key groups 50
TAbLE 17 Tourist arrivals by purpose of visit 50
TAbLE 18 Analysis of tourist expenditure by port of arrival, 2013 51
TAbLE 19 Expenditure estimated by purpose of visit and by country of residence 52
TAbLE 20 Calculating the coastal protection index based on scores for physical factors of the coastline 56
TAbLE 21 Coastal protection index for the islands of Tarawa, Abaiang and Kiritimati 57
TAbLE 22 Carbon storage in coastal ecosystems 59
TAbLE 23 Area covered by vegetation/plants in Kiribati 60
ixNATIONAL MARINE ECOSYSTEM SERVICE VALUATION KIRIBATI
ACRONYMS
ACIAR Australian Centre for International Agricultural Research
AusAID Australian Agency for International Development
BMUB German Federal Ministry for the Environment, Nature Conservation and Nuclear Safety
CBD Convention on Biological Diversity
CBFM Community-based fisheries management
CPPL Central Pacific Producers Limited
DSM Deep-sea mineral
EEZ Exclusive economic zone
EU European Union
FAO United Nations Food and Agricultural Organization
FFA Pacific Islands Forum Fisheries Agency
FOB Free-on-board
FSPK Foundation of the Peoples of the South Pacific –Kiribati
GBR Great Barrier Reef
GDP Gross Domestic Product
GEF Global Environment Facility
GIS Geographic Information Systems
GIZ German Agency for International Cooperation
HIES Household Income and Expenditure Survey
IUCN International Union for Conservation of Nature
KAO Kiribati and Otoshiro
KCM Kiribati Copra Mill
KCS Kiribati Copra Society
KFL Kiribati Fish Ltd
KIEP Kiribati Integrated Environment Policy
KMEL Kiritimati Marine Export Ltd
KNSO Kiribati National Statistics Office
KPA Key Policy Area
MACBIO Marine and Coastal Biodiversity Management in Pacific Island Countries
MELAD Ministry of Environment, Lands and Agricultural Development
MPA Marine protected area
NBSAP National Biodiversity Strategy Action Plan
NGO Non-government organisation
NOAA National Oceanic and Atmospheric Administration
PACRAFI Pacific Catastrophe Risk Assessment and Financing Initiative
PIFS Pacific Island Forum Secretariat
PIPA Phoenix Islands Protected Area
PNG Papua New Guinea
Ramsar Convention on Wetlands of International Importance
SCC Social cost of carbon
SOE State-owned enterprises
SOPAC Pacific Islands Applied Geoscience Commission (now GeoScience Division), SPC
SPC Secretariat of the Pacific Community
SPREP Secretariat of the Pacific Regional Environment Programme
SRMU Strategic Risk Management Unit, Office of the President
TEEB The Economics of Ecosystems and Biodiversity
UNDP United Nations Development Program
UNESCO United Nations Educational, Scientific and Cultural Organization
WTP Willingness-to-pay

1NATIONAL MARINE ECOSYSTEM SERVICE VALUATION KIRIBATI
ExECUTIVE SUMMARY
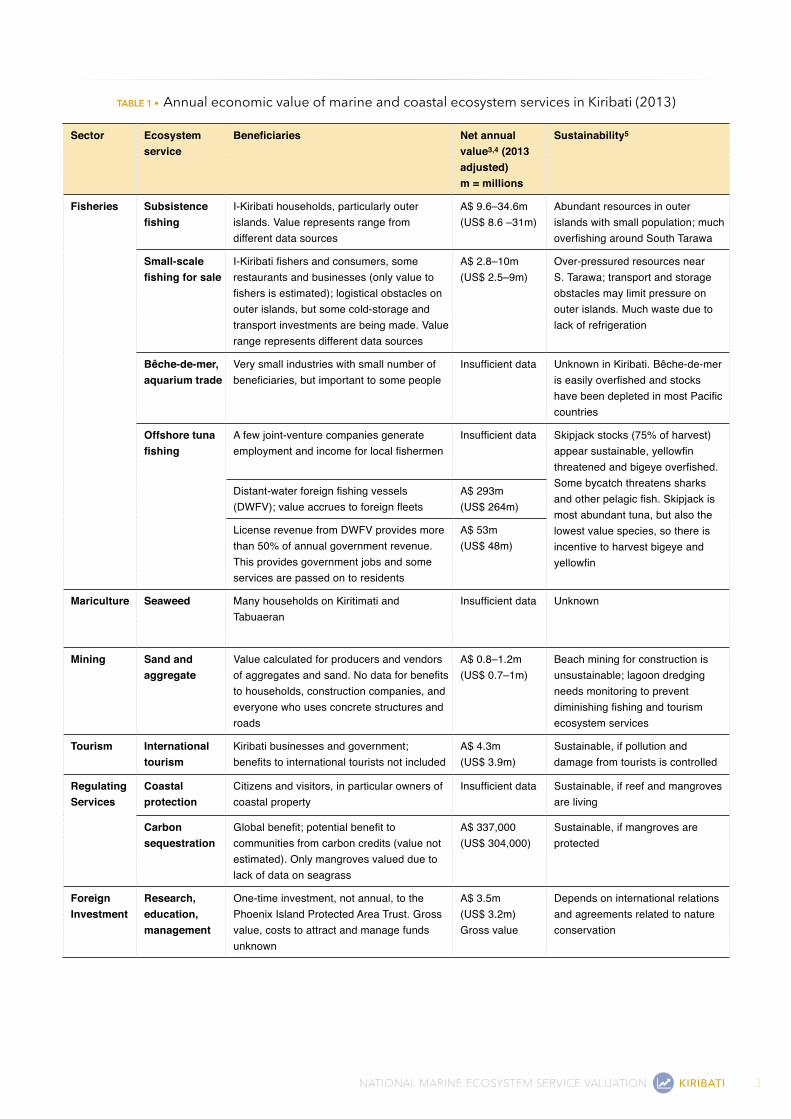
This study aimed to determine an economic value1 of seven marine and coastal ecosystem services in Kiribati. It is part of the MACBIO (Marine and Coastal Biodiversity Management in Pacific Island Countries) project, which aims to improve the management of marine and coastal biodiversity in Pacific Island countries.
Marine and coastal ecosystems provide important benefits for society and contribute to the livelihoods, food security and safety of millions of people around the world. These benefits (called ecosystem services) are often not visible in national accounts or in business operations; their value is usually only perceived when they are lost. Assigning monetary values to ecosystem services makes the ecosystem service benefits more visible and contributes to improving their wise use and management. The seven ecosystem services addressed in this report are subsistence fisheries, commercial fisheries, aggregate and mineral mining, tourism and recreation, coastal protection, carbon sequestration and research, management and education.
The monetary values of the ecosystem services identified in this study vary; some are small (in thousands of dollars) but some are worth millions of dollars. While all the selected ecosystem services identified for the study are important, some are critical to the welfare of the people of Kiribati. In particular, subsistence food provision is critical to the livelihood and welfare of the people in Kiribati. In fact, in terms of food security, subsistence is the most practical solution. Even without money, a person in Kiribati can survive by simply walking on the lagoon or reef flats collecting sea shells (katura and the koumara) or sea worms (te ibo) and eating these with breadfruit or coconuts with coconut juice for drink; this is pure subsistence living. However, pure subsistence living no longer occurs in Kiribati. Even people on the outer islands buy goods and services to augment the largely subsistence aspects of their lifestyle. Conversely, people mainly involved in the formal economy often undertake subsistence activities to supplement their cash incomes.
Two sources of data were used to estimate the value of subsistence fishing in Kiribati: Ministry of Fisheries data and the 2006 Household Income and Expenditure Survey (HIES). The economic value of subsistence fishing estimated using these two sources differed significantly, probably because the scope, coverage and timing of the data sources are different. The gross value of subsistence fishing, estimated from multiple data sources, was between A$2 3.7 and A$ 38.5 million per year. The lower estimate of A$ 3.7 million per year is unlikely to be a true reflection of actual subsistence value. Instead, the Ministry of Fisheries estimate of net value of A$ 9.6–19.2 million per year is used. Subsistence fishing costs are minimal, so the value-added was similar to the gross value, approximately A$ 9.6–34.5 million per year.
The analysis of commercial fishing was done for two categories: small-scale (household-level) commercial fishing, and industrial fishing. The economic value of commercial fishing was estimated from various data sources. The gross value of small-scale commercial fishing ranged from A$ 7 million to A$ 25 million per year. This estimate included small-scale tuna fishing, with a gross value of about A$ 4 million per year. Small-scale inshore commercial fishers generally use outboard engines therefore their operational costs are higher than those of subsistence fishers. In this analysis, fuel costs were assumed to be 60% of the gross output, leaving a value-added of A$ 2.8–10 million.
Kiribati has no large fishing vessels apart from those that fish under ownership arrangements with the Kiribati Government. This analysis focused on foreign fishing vessels that purchase licences to fish in the Kiribati Exclusive Economic Zone. The average catch over 2010–2015 was 330,000 tonnes per year, with a value of US$ 660 million. With the high cost of fuel, the value-added was estimated at US$ 264 million. Most of this value is captured by distant-water fishing nations, although recently, some tuna has been locally processed and exported. Tuna fishing also provides some employment to i-Kiribati fishermen. The largest benefit of tuna fishing to Kiribati is licence revenue. The total licence value was approximately 7% of the gross value of the catch, around A$ 53 million per year.
The total weight of aggregates mined was between 31,175 and 43,345 tonnes, estimated as a proportion of the amount of cement imported into Kiribati. The value of aggregates extracted to make cement was A$ 2.02–2.6 million. Once costs were subtracted, the value-added was approximately A$ 0.8–1.2 million. The total weight of aggregates estimated using this method was smaller than previous estimates because our analysis was based on imported cement only. It did not
1 Throughout the report, technical terms in italics are explained in the glossary (Appendix I: Glossary)
2 All values are in Australian dollars (A$) unless otherwise stated. This is the national currency of Kiribati.
2 KIRIBATI NATIONAL MARINE ECOSYSTEM SERVICE VALUATION
include aggregates used without cement. Therefore, the monetary value of the service from aggregates is likely to be higher than calculated here.
Income from tourism was estimated for Christmas (Kiritimati) Island and for South Tarawa based on the number of arrivals — data kept by the National Statistics Office — and on a tourism survey conducted in 2013. On Christmas Island, the gross revenue from tourism was A$ 3.8 million and the intermediate cost was A$ 2.3 million giving a value-added of A$ 1.5 million. On South Tarawa the gross was A$ 6.9 million and the value-added was A$ 2.8 million. In total, tourism value-added was estimated at A$ 4.3 million. The study did not include tourists from visiting ships or yachts, therefore income from tourism could be much higher than calculated here.
The land area of Kiribati consists largely of atolls that are at risk of erosion, damage from tsunamis and inundation due to rising sea levels. Coastal protection against erosion or tsunamis and the role of reefs in the process of beach formation are important services. However, we were not able to estimate the monetary value of these services as inadequate data were available.
With respect to carbon sequestration, only mangroves were considered, due to data constraints. The total area of mangroves in Kiribati is 7.9 km2 or about 1% of the total land area of the country. The monetary value of carbon sequestration by mangrove ecosystems was estimated to be A$ 337,000 per year. While the monetary value of carbon sequestration is relatively small, it is well known that there other services or benefits that the mangroves provide such as control of coastal erosion, food habitat and construction materials.
Estimating the economic value of benefits obtained from education and research in marine ecosystems was difficult because no data are available. However there is potential for the Phoenix Islands Protected Area (PIPA) to become an important area for research and study in the future because of its size and unique features. PIPA is one of the largest marine reserves in the world. While PIPA does not have a fully developed tourism sector or research centre, there is some evidence that a financial benefit can be derived from marine reserves, if properly developed and managed.
There were obvious data gaps that limited the valuation of marine ecosystem services in Kiribati. All the ecosystem services analysed were data-deficient but some deficiencies were more acute than others. Collection and collation of data on ecosystem services is conducted sporadically with limited centralised storage or analysis. Future efforts to prioritise data collection, storage and analysis in a central agency would improve reporting and valuation of important ecosystem services for the benefit of their management and protection in the long term.
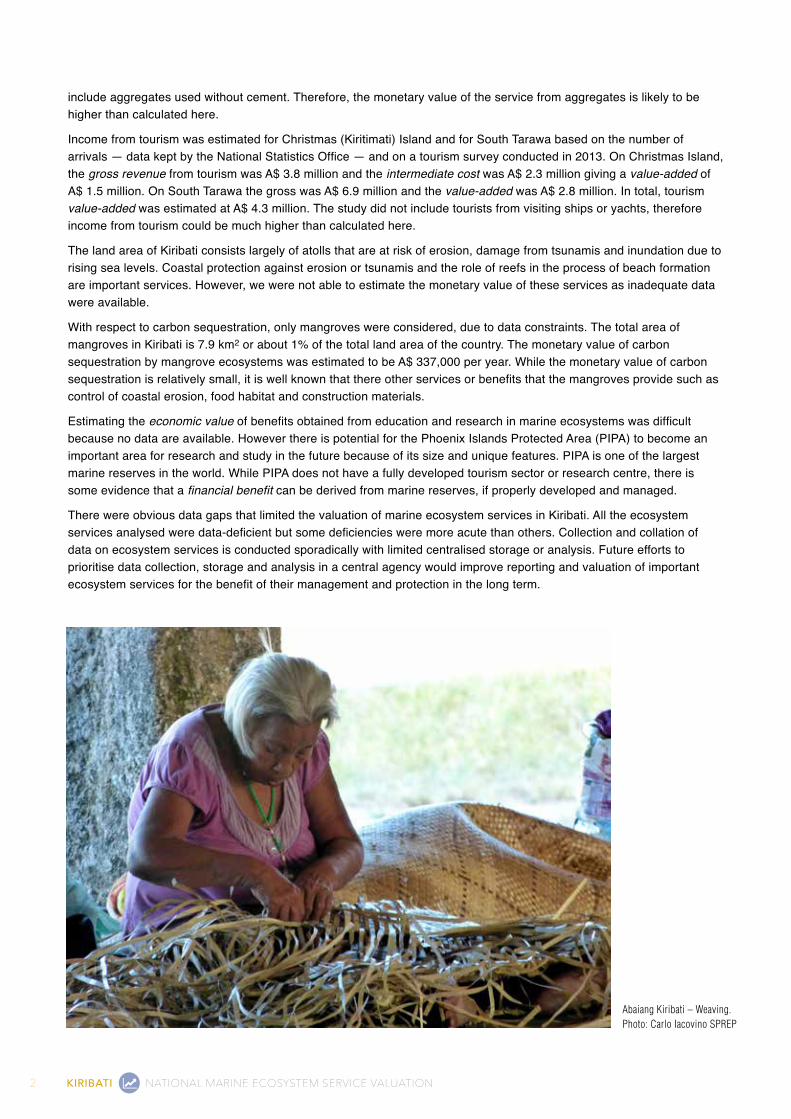
Abaiang Kiribati – Weaving. Photo: Carlo Iacovino SPREP
3NATIONAL MARINE ECOSYSTEM SERVICE VALUATION KIRIBATI
TABLE 1 • Annual economic value of marine and coastal ecosystem services in Kiribati (2013)
Sector Ecosystem service
Beneficiaries Net annual value3,4 (2013 adjusted)m = millions
Sustainability5
Fisheries Subsistence fishing
I-Kiribati households, particularly outer islands. Value represents range from different data sources
A$ 9.6–34.6m(US$ 8.6 –31m)
Abundant resources in outer islands with small population; much overfishing around South Tarawa
Small-scale fishing for sale
I-Kiribati fishers and consumers, some restaurants and businesses (only value to fishers is estimated); logistical obstacles on outer islands, but some cold-storage and transport investments are being made. Value range represents different data sources
A$ 2.8–10m(US$ 2.5–9m)
Over-pressured resources near S. Tarawa; transport and storage obstacles may limit pressure on outer islands. Much waste due to lack of refrigeration
Bêche-de-mer, aquarium trade
Very small industries with small number of beneficiaries, but important to some people
Insufficient data Unknown in Kiribati. Bêche-de-mer is easily overfished and stocks have been depleted in most Pacific countries
Offshore tuna fishing
A few joint-venture companies generate employment and income for local fishermen
Insufficient data Skipjack stocks (75% of harvest) appear sustainable, yellowfin threatened and bigeye overfished. Some bycatch threatens sharks and other pelagic fish. Skipjack is most abundant tuna, but also the lowest value species, so there is incentive to harvest bigeye and yellowfin
Distant-water foreign fishing vessels (DWFV); value accrues to foreign fleets
A$ 293m(US$ 264m)
License revenue from DWFV provides more than 50% of annual government revenue. This provides government jobs and some services are passed on to residents
A$ 53m(US$ 48m)
Mariculture Seaweed Many households on Kiritimati and Tabuaeran
Insufficient data Unknown
Mining Sand and aggregate
Value calculated for producers and vendors of aggregates and sand. No data for benefits to households, construction companies, and everyone who uses concrete structures and roads
A$ 0.8–1.2m(US$ 0.7–1m)
Beach mining for construction is unsustainable; lagoon dredging needs monitoring to prevent diminishing fishing and tourism ecosystem services
Tourism International tourism
Kiribati businesses and government; benefits to international tourists not included
A$ 4.3m(US$ 3.9m)
Sustainable, if pollution and damage from tourists is controlled
Regulating Services
Coastal protection
Citizens and visitors, in particular owners of coastal property
Insufficient data Sustainable, if reef and mangroves are living
Carbon sequestration
Global benefit; potential benefit to communities from carbon credits (value not estimated). Only mangroves valued due to lack of data on seagrass
A$ 337,000(US$ 304,000)
Sustainable, if mangroves are protected
Foreign Investment
Research, education, management
One-time investment, not annual, to the Phoenix Island Protected Area Trust. Gross value, costs to attract and manage funds unknown
A$ 3.5m(US$ 3.2m)Gross value
Depends on international relations and agreements related to nature conservation

5NATIONAL MARINE ECOSYSTEM SERVICE VALUATION KIRIBATI
1. INTROdUCTION
1.1 MARINE ANd COASTAL BIOdIVERSITY MANAgEMENT IN PACIfIC ISLANd COUNTRIES (MACBIO)Funded by the German Federal Ministry for the Environment, Nature Conservation, Building and Nuclear Safety (BMUB) for a period of five years through the International Climate Initiative (IKI), the Marine and Coastal Biodiversity Management in Pacific Island Countries (MACBIO) project aims to strengthen the sustainable management of marine and coastal biodiversity by supporting economic ecosystem assessments, marine spatial planning and consultations in regard to marine protected areas (MPAs). The economic valuations of marine ecosystems will contribute to national development plans. The project also aims to assist governments to extend and/or redesign MPA networks using seascape-level planning. The project will, in addition, demonstrate effective approaches for site management, including payment for ecosystem services and other conservation finance tools. Tried and tested concepts and instruments will be shared with governments and stakeholders throughout the Pacific community and disseminated internationally.
MACBIO is being implemented in five Pacific Island countries with the support of the German Agency for International Cooperation (GIZ) in close collaboration with the Secretariat of the Pacific Regional Environment Programme (SPREP) and with technical support from the International Union for Conservation of Nature (IUCN).
These efforts to support improved management of marine and coastal biodiversity on the volcanic islands of Fiji, Solomon Islands and Vanuatu and the atolls of Kiribati and Tonga will help countries to meet their commitments under the Convention on Biological Diversity (CBD) Strategic Plan 2011–2020 and the relevant Aichi targets, including the Programme of Work on Protected Areas and the Programme of Work on Island Biodiversity.
All five countries are working towards achieving the quantitative Aichi Target 11: 10% of the coastal and marine environment in protected areas by 20203. As of 2014, the MACBIO countries had protected the following percentages of their marine and coastal environment: Fiji = 2%; Kiribati = 11%; Solomon Islands = > 5%; Tonga = 2%; Vanuatu = > 1%. With the exception of Kiribati, the countries remain a long way from achieving this Aichi target. Most of the existing MPAs are not ecologically representative and countries lack the means to ensure the conservation and sustainable use of resources. Most Pacific Island countries are facing severe challenges in regard to human resources and funding, inadequate law enforcement and lack of access to the information needed for marine biodiversity management.
Under the MACBIO project, IUCN Oceania is primarily responsible for conducting national-scale economic assessments of marine and coastal ecosystem services in all five MACBIO countries, including conducting a data gap analysis. National reports on the value of marine and coastal ecosystem services will be provided to countries to inform marine spatial planning and marine resource management in general. This is one of those reports.
3 Aichi Target 11: By 2020, at least 17% of terrestrial and inland water, and 10% of coastal and marine areas, especially areas of particular importance for biodiversity and ecosystem services, are conserved through effectively and equitably managed, ecologically representative and well connected systems of protected areas and other effective area-based conservation measures, and integrated into the wider landscapes and seascapes.
6 KIRIBATI NATIONAL MARINE ECOSYSTEM SERVICE VALUATION
1.2 PROBLEM STATEMENTAlthough the people and economies of the Pacific Island countries depend to a large extent on marine and coastal ecosystems, marine resource management should receive more attention in national plans and strategies (e.g. strategies relating to national development planning, tourism, food security, livelihoods, disaster mitigation and climate change adaptation) (MSWG 2005; PIFS 2007; Pratt and Govan 2011). This is due partly to a lack of understanding of the full economic value of marine and coastal ecosystem services (TEEB 2012).
The economic contribution of biodiversity and ecosystem services to the wellbeing of Pacific Islanders is understated for a variety of reasons including:
■ Substantial resource-based economic activity exists outside of formal markets (subsistence)
■ Customary resource tenure arrangements poorly reflect individual economic decisions and pricing in markets
■ Government agencies in the region typically have relatively low capacity in environmental economics and green national accounting
■ Many countries of the region are relatively young and/or have lacked continuity in governance which has contributed to a lack of long-term data and analysis of ecosystem service stocks and flows at the national level
■ Many countries of the region have a history of a two-tiered economy, one export and expatriate-led and the other traditional village-based and subsistence-oriented. Both tiers, however, are largely dependent on the same resource base. Planning and policy has generally struggled to address the interest of both dimensions of resource-based economic development at the national scale.
Identifying the economic value of marine and coastal ecosystems and taking these findings into account in national planning processes can help create incentives for more effective protection and sustainable use of marine species diversity. This, in turn, will help to sustain the benefits that people derive from those marine and coastal ecosystems.
1.3 PURPOSE ANd OBjECTIVESThe MACBIO project has undertaken national-level economic assessments of marine and coastal ecosystems in the five project countries in a manner compatible with the global The Economics of Ecosystems and Biodiversity (TEEB) initiative. The work aimed to contribute to national development plans and marine resource management policies and decision-making.
The principal objective of the economic component of MACBIO was to help countries to identify, quantify and, as far as possible, value in monetary units the most relevant marine and coastal ecosystem services in each MACBIO country. This has resulted in national assessments of the human benefits of marine and coastal ecosystems. Reports of these comprehensive surveys of the current state of knowledge and priority knowledge gaps account for marine natural capital and provide a baseline on which more detailed valuation studies can be built. The information provided within these reports can be used to guide, design and develop marine resources management plans, policies, assessments, legislation and tools, such as MPAs and environmental impact assessments.
This economic valuation is intended to enhance ecosystem-based marine and coastal resource management to lead to more resilient coastal and marine ecosystems, more effective conservation of marine biodiversity, and to contribute to climate change adaptation and mitigation, as well as to securing and strengthening local livelihoods and food security.
This report quantifies the value of seven marine and coastal ecosystem services in Kiribati: subsistence food provision; commercial food harvesting; mineral and aggregate mining; tourism; carbon sequestration; coastal protection; and research, management and education.
There are many more ecosystem services that do or can benefit people but the seven chosen are the focus of this study. Some other marine ecosystem services and values are discussed, albeit briefly, towards the end of the report.
7NATIONAL MARINE ECOSYSTEM SERVICE VALUATION KIRIBATI
1.4 dESCRIPTION Of ThE gEO-POLITICAL BOUNdARIES Of ANALYSIS (SCOPE)With an area of 180 million km2 the Pacific represents around 50% of the global sea surface and a third of the Earth’s surface. The 22 Pacific Island States and Territories comprise more than 200 mountainous volcanic islands and some 2,500 flat islands and atolls. The Exclusive Economic Zones (EEZs) of the five project countries cover approximately 7,560,000 km2, an area the size of Australia. The project region is one of the world’s centres of marine biodiversity, with an unusually large number of endemic species. Despite the importance of the region’s biodiversity for people’s food and livelihoods, comprehensive species and habitat inventories are often lacking, as well as adequate valuation of the ecosystem services they provide to people.
MACBIO adopts a national-scale assessment of the economics of ecosystem services and biodiversity in direct response to the factors that contribute to a lack of appropriate information to manage the natural wealth of Pacific Island nations. In Kiribati we chose to conduct a national-scale assessment in part because it would have the largest and broadest potential relevance to policy and decision-makers. Furthermore, the human resources and funding required to conduct valuations specific to each policy or initiative related to the marine environment are unlikely to be available in small Pacific Island countries.
An overview of the national-level values of marine and coastal ecosystem services can be used in a variety of ways, in a manner that policy-specific analyses cannot. Consider, for example:
■ Although subsistence marine and coastal resource use and management primarily takes place at the village or community level, it does so within an economic and policy context at a national scale.
■ Commercial fishing is often managed at the national scale (if not the regional or international scale).
■ Infrastructure investment decisions to mitigate disaster risk in coastal zones are often best managed through national planning processes in this region.
■ Most Pacific Island nations have only one international airport, one main deep water port and one primary commercial centre, so any economic development policy relying on these (e.g. to do with marine tourism) becomes an issue of national policy.
■ Many Pacific Island nations have committed to national-level planning and policy efforts under one or more UN Conventions. National-scale capacity-building, data collection, storage and analysis help to reduce redundancy and perhaps create synergies with other parallel efforts and country-scale commitments in the region.
■ Many of the compensatory and regulatory policy tools available and being used to promote behaviour in line with both natural wealth management and sustainable economic development objectives are most often national-level tools. These might include payment for ecosystem services approaches, entry and/or exit fees, hotel taxes, taboo seasons, catch limits, or policies on use of coral for construction materials, clearing of mangroves, water, sewage and solid waste disposal, among other issues and concerns.
1.5 REPORT INTROdUCTIONThis study was carried out under the auspices of the MACBIO project in close collaboration with the Ministry of Environment, Lands and Agricultural Development (MELAD), the Ministry of Fisheries and Marine Resources Development, the Office of National Accounts and other parts of the Kiribati Government. While MACBIO provided methodological guidelines (Salcone et al. 2015) and the government ministries helped in the provision of data, the analysis and the write-up was the responsibility of the senior author whose findings and views are reflected in this report.
This report provides details of the country-specific context within which the economic evaluation was conducted and explains the methodological framework for the analysis. The specific methods applied in the report are discussed briefly (see Salcone et al. 2015 for detailed methods). This report synthesises existing data and draws conclusions where possible. This work has revealed important knowledge gaps and high priorities for future data collection. Results are provided for a range of marine economic goods and services (termed services). At the minimum, the human benefits from marine and coastal ecosystems are described in detail. Following the identification and description, marine ecosystem services are quantified, if data are available, and, where possible, economic valuations for the marine services are provided. In some cases, data deficiencies meant that scenario analysis was conducted to complete the estimates.
The report finally provides some overall conclusions and recommendations.
8 KIRIBATI NATIONAL MARINE ECOSYSTEM SERVICE VALUATION
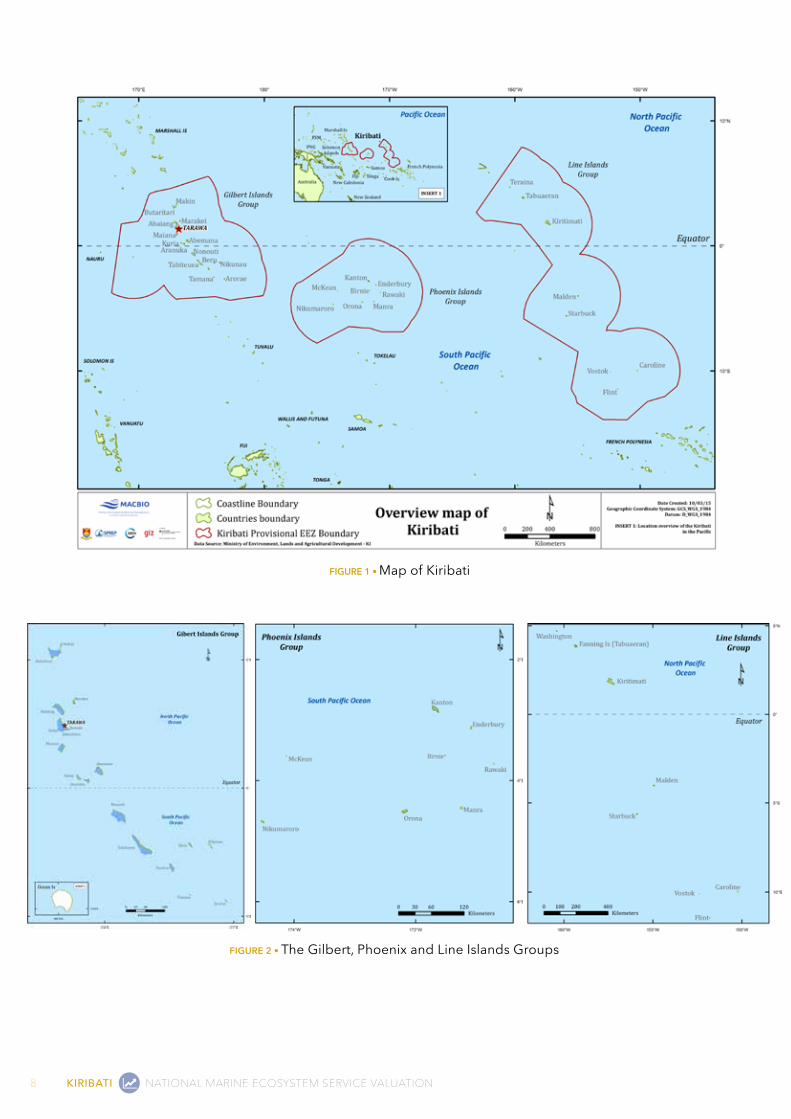
FigurE 1 • Map of Kiribati
FigurE 2 • The Gilbert, Phoenix and Line Islands Groups
9NATIONAL MARINE ECOSYSTEM SERVICE VALUATION KIRIBATI
2. CONTExT
2.1 dEMOgRAPhIC ANd ECONOMIC COUNTRY PROfILEKiribati is an independent country in the Pacific with a population of 103,058 according to the 2010 Census, and a population growth rate of just less than 2% per annum (KNSO 2012). The country comprises 33 atoll islands, rising barely a metre above sea level, straddling the equator and bisected by the International Date Line (Figure 1). Twenty-two of the islands are inhabited. The total land mass of all the islands is 810 km2; Christmas Island in the Line Islands has the largest land mass of 388 km2, almost half of the total land area of Kiribati. But while the land area is relatively small, the ocean area is huge—it covers 3.5 million km2—and the Kiribati EEZ is, in fact, one of the largest in the world. There are three main geographical regions in the country (Figure 2): the Gilbert Islands group (in the west and close to the International Dateline); the Phoenix group (approximately halfway between the Gilbert Islands and the Line Islands); and the Line Islands (further to the east and close to Hawaii).
Kiribati lies within 10 degrees (north and south) of the equator. Cyclones do not generally occur in Kiribati, but strong westerly gales often pound coastal areas. In the past, people generally avoided these strong winds by living further inland or on the eastern sides of the islands. People tend to live on the lagoon side of atolls rather than on the ocean side which is prone to strong winds and waves. Occasionally, strong cyclones in nearby countries have had impacts in Kiribati; in recent years trees have been uprooted and houses damaged by these winds.
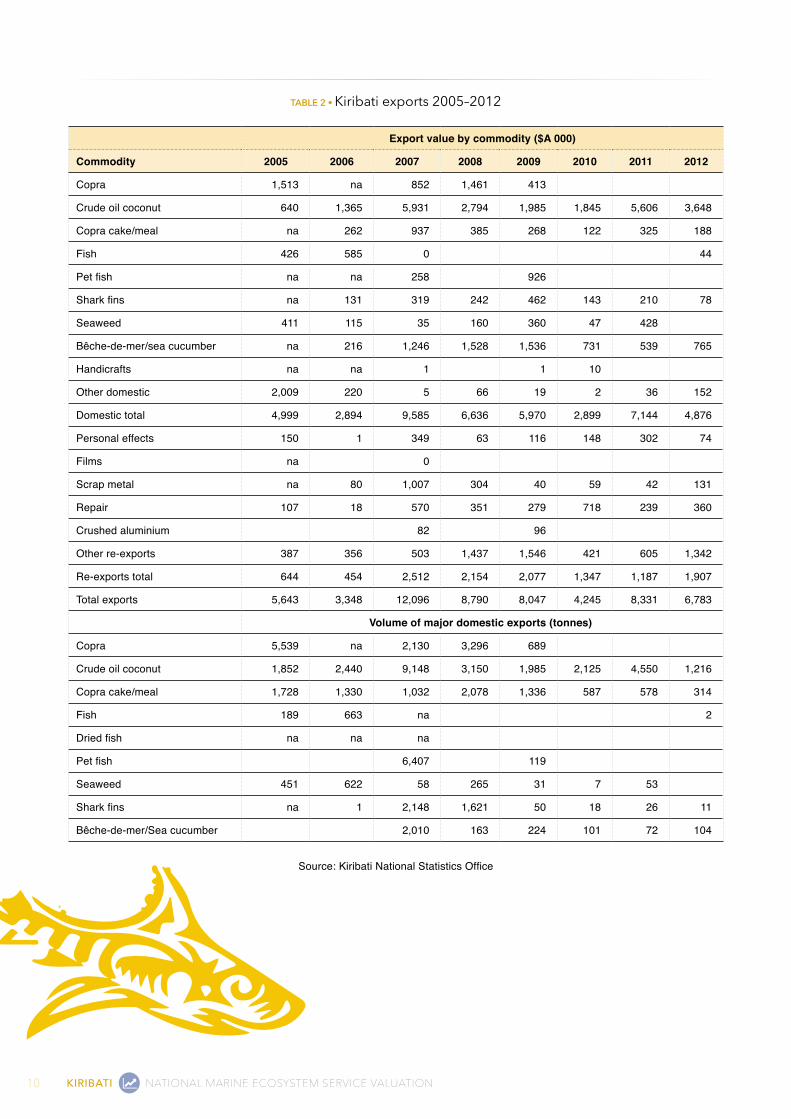
I-Kiribati, like people in most island nations, rely on coconuts4 and fish as their main diet and sources of income. Copra is cut by individual farmers5 and sold to the Kiribati Copra Society (KCS) which then has the option to sell it to the Kiribati Copra Mill (KCM)6 or to export it. Both KCS and KCM are located on Betio, South Tarawa. Coconut oil, extracted from raw copra, has higher export value than raw copra and therefore most copra ends up in the copra mill. The value of copra exports is generally less than A$ 2 million per year while coconut oil export can reach A$ 5 million in a good year (Table 2).
The total value of all exports is between A$ 3 and A$ 7 million a year against the imports value of A$ 90 million. The huge trade deficit is partially offset by aid funding, seamen remittances, fishing vessel licences and interest earned on the government reserve fund invested abroad in bonds and equities.
Although tuna are abundant in Kiribati, there are few fishing vessels or fish processing facilities in the country, apart from two or three small joint ventures: the Kiribati and Otoshiro (KAO) fishing company (a joint venture between the Japanese Otoshiro company and the Kiribati Government); the joint venture between the Japanese Taichin Co and the Kiribati Government; and Kiribati Fish Ltd (KFL). The KAO started in 1994, but after 5–6 years of operation there is little contact with the joint venture vessel. Like the KAO, the Taichin venture began in 2010, but there is currently little dividend from the joint venture.
The KFL is a new joint venture between Golden Ocean Fish based in Fiji, Shanghai Deep Sea Fishery based in China, and the Central Pacific Producers Limited (CPPL) based in Kiribati. The company started in 2012 and the investment in the fish processing factory and fishing operation base is more than US$ 8.0 million. In fact, the joint venture was conceived in 2007 by the CPPL Board of Directors, and the Kiribati Government pursued the idea in 2011. The Board7 decided on the joint venture because the foreign partners had fishing vessels, overseas contacts and markets, experience in handling fishery products, and were ready to take on local workers and process locally caught catch. The fish processing factory was built according to the requirements of US Food and Drug Administration and the European Union (EU) because the company hopes to export the products to the EU and USA. The company also sells to the local market with retail outlets on Betio and Teinainano Urban Council (South Tarawa)8. In order to supply the company with good quality tuna, KFL conducted training workshops with local fishers on how to preserve tuna caught on their small fishing boats. The training sessions have led to improvements in the quality of tuna sold in the KFL outlets.
4 With the monetisation of the economy more and more people now eat rice instead of coconuts. Besides, coconuts are now reserved for use for copra so people are turning to other food substitutes.
5 In the past some copra plantations were owned by foreigners, especially in the Line Islands, but they were all bought by the Kiribati Government after independence.
6 There have been discussions on merging the KCS and KCM, but no action has yet occurred. The merger was proposed to mitigate disagreement and conflict between the two copra businesses, most particularly about their different internal copra prices.
7 This Board was dissolved in 2007 just prior to the signing of the agreement with The Shanghai Deep Sea Fishing Company and Golden Ocean.
8 The Teinainano Urban Council which has jurisdiction from Tanaea to Bairiki.
10 KIRIBATI NATIONAL MARINE ECOSYSTEM SERVICE VALUATION
TABLE 2 • Kiribati exports 2005–2012
Export value by commodity ($A 000)
Commodity 2005 2006 2007 2008 2009 2010 2011 2012
Copra 1,513 na 852 1,461 413
Crude oil coconut 640 1,365 5,931 2,794 1,985 1,845 5,606 3,648
Copra cake/meal na 262 937 385 268 122 325 188
Fish 426 585 0 44
Pet fish na na 258 926
Shark fins na 131 319 242 462 143 210 78
Seaweed 411 115 35 160 360 47 428
Bêche-de-mer/sea cucumber na 216 1,246 1,528 1,536 731 539 765
Handicrafts na na 1 1 10
Other domestic 2,009 220 5 66 19 2 36 152
Domestic total 4,999 2,894 9,585 6,636 5,970 2,899 7,144 4,876
Personal effects 150 1 349 63 116 148 302 74
Films na 0
Scrap metal na 80 1,007 304 40 59 42 131
Repair 107 18 570 351 279 718 239 360
Crushed aluminium 82 96
Other re-exports 387 356 503 1,437 1,546 421 605 1,342
Re-exports total 644 454 2,512 2,154 2,077 1,347 1,187 1,907
Total exports 5,643 3,348 12,096 8,790 8,047 4,245 8,331 6,783
Volume of major domestic exports (tonnes)
Copra 5,539 na 2,130 3,296 689
Crude oil coconut 1,852 2,440 9,148 3,150 1,985 2,125 4,550 1,216
Copra cake/meal 1,728 1,330 1,032 2,078 1,336 587 578 314
Fish 189 663 na 2
Dried fish na na na
Pet fish 6,407 119
Seaweed 451 622 58 265 31 7 53
Shark fins na 1 2,148 1,621 50 18 26 11
Bêche-de-mer/Sea cucumber 2,010 163 224 101 72 104
Source: Kiribati National Statistics Office
11NATIONAL MARINE ECOSYSTEM SERVICE VALUATION KIRIBATI
The economy of Kiribati can be considered a mix of subsistence and monetary economies. Subsistence is the dominant lifestyle on the outer islands and rural areas while the formal monetary or commercial sector is restricted mainly to the urban areas (e.g. South Tarawa and Christmas Island). The monetary sector is dominated by the government ministries and state-owned enterprises (SOEs). The private sector is generally small but has shown significant growth in recent years after a previous decline and demise of several SOEs9. People in Kiribati generally participate in both economies, i.e. some may work in the cash sector, say in government ministries, but after work they go fishing for their own consumption. Likewise people on the outer islands may grow their own babai (swamp taro) crop or collect coconuts for their own consumption, but they may also cut and dry coconuts for cash. They also fish for their own consumption, and if there are surplus fish or leftovers, they sell them or simply give them to their neighbours. Subsistence is the means by which most, if not all, people in Kiribati are able to survive. For instance, when there is no more money or cash to buy food, people collect shellfish or small fish from the lagoon or ocean flat, or coconuts or pandanus fruits from the bush.
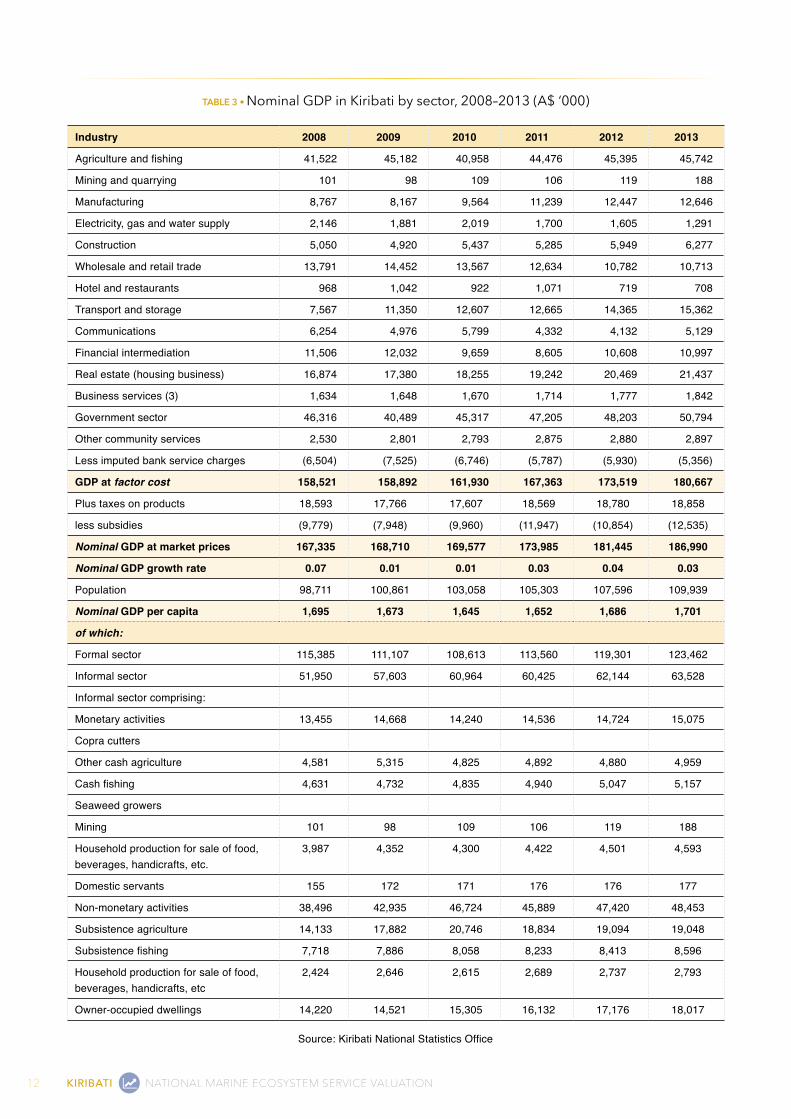
There has been little economic growth in the past five years (Table 3). In fact, in 2010 and 2011, the real gross domestic product (GDP) per capita declined by 3.1% and 2.4% respectively (unpublished data, KNSO). Kiribati has one of the lowest GDP per capita in Pacific Island countries. According to the World Bank, the per capita GDP in Kiribati in 2013 was US$ 1,651, below that of the Solomon Islands (US$ 1,954) and Tuvalu (US$ 3,861). For comparison, the 2013 per capita GDP in New Zealand was US$ 41,556 and in Australia the per capita GDP was US$ 67,468 (World Bank 2014).
About half of the GDP in Kiribati comes from the informal sector and this sector is further split between monetary (24%) and non-monetary (76%) activities (Table 3). The non-monetary sector is comprised mainly of subsistence activities.
The government is the largest sector with a value-added of A$ 42.8 million (or almost 30% of the total GDP at factor cost) in 2013. The bulk of this value-added, however, is salaries and wages, not profit or consumption of fixed assets. This shows that the economy of Kiribati is relatively undeveloped compared with developed economies in which the private sector is the leading sector and the backbone of the economy.
The manufacturing sector apparently contributes A$ 6.7 million to the economy (Table 4). However, this is misleading because there are few factories in the country apart from the Kiribati Copra Mill and the shipyard company which was virtually closed in 2014. Commercial manufacturing is virtually non-existent in Kiribati, which is typically the case for undeveloped economies. The high figure for manufacturing comes from the non-monetary sector which is basically household ‘manufacturing’ activities, such as mat-weaving, making local cigarettes (from tobacco), handicrafts, construction of canoes, cooking and selling foods, etc., all informal and small in scale. The figure for manufacturing is crudely estimated based on a single household survey conducted in 2006, projected population figures, and inflation rates as measured by the retail price indices. This valuation method is questionable because of the lack of robust data on activities.
9 There is an ongoing ADB project on economic reform that aims specifically to revive and strengthen SOEs.
12 KIRIBATI NATIONAL MARINE ECOSYSTEM SERVICE VALUATION
TABLE 3 • nominal GdP in Kiribati by sector, 2008–2013 (A$ ‘000)
Industry 2008 2009 2010 2011 2012 2013
Agriculture and fishing 41,522 45,182 40,958 44,476 45,395 45,742
Mining and quarrying 101 98 109 106 119 188
Manufacturing 8,767 8,167 9,564 11,239 12,447 12,646
Electricity, gas and water supply 2,146 1,881 2,019 1,700 1,605 1,291
Construction 5,050 4,920 5,437 5,285 5,949 6,277
Wholesale and retail trade 13,791 14,452 13,567 12,634 10,782 10,713
Hotel and restaurants 968 1,042 922 1,071 719 708
Transport and storage 7,567 11,350 12,607 12,665 14,365 15,362
Communications 6,254 4,976 5,799 4,332 4,132 5,129
Financial intermediation 11,506 12,032 9,659 8,605 10,608 10,997
Real estate (housing business) 16,874 17,380 18,255 19,242 20,469 21,437
Business services (3) 1,634 1,648 1,670 1,714 1,777 1,842
Government sector 46,316 40,489 45,317 47,205 48,203 50,794
Other community services 2,530 2,801 2,793 2,875 2,880 2,897
Less imputed bank service charges (6,504) (7,525) (6,746) (5,787) (5,930) (5,356)
GDP at factor cost 158,521 158,892 161,930 167,363 173,519 180,667
Plus taxes on products 18,593 17,766 17,607 18,569 18,780 18,858
less subsidies (9,779) (7,948) (9,960) (11,947) (10,854) (12,535)
Nominal GDP at market prices 167,335 168,710 169,577 173,985 181,445 186,990
Nominal GDP growth rate 0.07 0.01 0.01 0.03 0.04 0.03
Population 98,711 100,861 103,058 105,303 107,596 109,939
Nominal GDP per capita 1,695 1,673 1,645 1,652 1,686 1,701
of which:
Formal sector 115,385 111,107 108,613 113,560 119,301 123,462
Informal sector 51,950 57,603 60,964 60,425 62,144 63,528
Informal sector comprising:
Monetary activities 13,455 14,668 14,240 14,536 14,724 15,075
Copra cutters
Other cash agriculture 4,581 5,315 4,825 4,892 4,880 4,959
Cash fishing 4,631 4,732 4,835 4,940 5,047 5,157
Seaweed growers
Mining 101 98 109 106 119 188
Household production for sale of food, beverages, handicrafts, etc.
3,987 4,352 4,300 4,422 4,501 4,593
Domestic servants 155 172 171 176 176 177
Non-monetary activities 38,496 42,935 46,724 45,889 47,420 48,453
Subsistence agriculture 14,133 17,882 20,746 18,834 19,094 19,048
Subsistence fishing 7,718 7,886 8,058 8,233 8,413 8,596
Household production for sale of food, beverages, handicrafts, etc
2,424 2,646 2,615 2,689 2,737 2,793
Owner-occupied dwellings 14,220 14,521 15,305 16,132 17,176 18,017
Source: Kiribati National Statistics Office
13NATIONAL MARINE ECOSYSTEM SERVICE VALUATION KIRIBATI
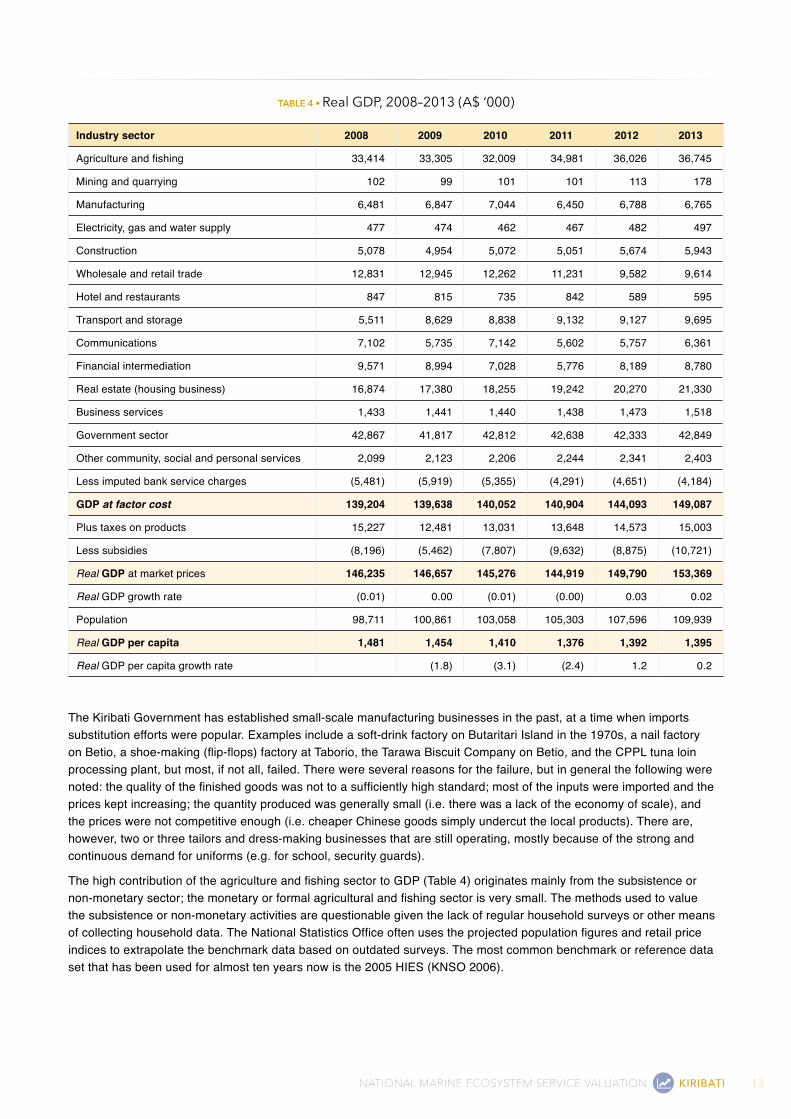
TABLE 4 • Real GdP, 2008–2013 (A$ ‘000)
Industry sector 2008 2009 2010 2011 2012 2013
Agriculture and fishing 33,414 33,305 32,009 34,981 36,026 36,745
Mining and quarrying 102 99 101 101 113 178
Manufacturing 6,481 6,847 7,044 6,450 6,788 6,765
Electricity, gas and water supply 477 474 462 467 482 497
Construction 5,078 4,954 5,072 5,051 5,674 5,943
Wholesale and retail trade 12,831 12,945 12,262 11,231 9,582 9,614
Hotel and restaurants 847 815 735 842 589 595
Transport and storage 5,511 8,629 8,838 9,132 9,127 9,695
Communications 7,102 5,735 7,142 5,602 5,757 6,361
Financial intermediation 9,571 8,994 7,028 5,776 8,189 8,780
Real estate (housing business) 16,874 17,380 18,255 19,242 20,270 21,330
Business services 1,433 1,441 1,440 1,438 1,473 1,518
Government sector 42,867 41,817 42,812 42,638 42,333 42,849
Other community, social and personal services 2,099 2,123 2,206 2,244 2,341 2,403
Less imputed bank service charges (5,481) (5,919) (5,355) (4,291) (4,651) (4,184)
GDP at factor cost 139,204 139,638 140,052 140,904 144,093 149,087
Plus taxes on products 15,227 12,481 13,031 13,648 14,573 15,003
Less subsidies (8,196) (5,462) (7,807) (9,632) (8,875) (10,721)
Real GDP at market prices 146,235 146,657 145,276 144,919 149,790 153,369
Real GDP growth rate (0.01) 0.00 (0.01) (0.00) 0.03 0.02
Population 98,711 100,861 103,058 105,303 107,596 109,939
Real GDP per capita 1,481 1,454 1,410 1,376 1,392 1,395
Real GDP per capita growth rate (1.8) (3.1) (2.4) 1.2 0.2
The Kiribati Government has established small-scale manufacturing businesses in the past, at a time when imports substitution efforts were popular. Examples include a soft-drink factory on Butaritari Island in the 1970s, a nail factory on Betio, a shoe-making (flip-flops) factory at Taborio, the Tarawa Biscuit Company on Betio, and the CPPL tuna loin processing plant, but most, if not all, failed. There were several reasons for the failure, but in general the following were noted: the quality of the finished goods was not to a sufficiently high standard; most of the inputs were imported and the prices kept increasing; the quantity produced was generally small (i.e. there was a lack of the economy of scale), and the prices were not competitive enough (i.e. cheaper Chinese goods simply undercut the local products). There are, however, two or three tailors and dress-making businesses that are still operating, mostly because of the strong and continuous demand for uniforms (e.g. for school, security guards).
The high contribution of the agriculture and fishing sector to GDP (Table 4) originates mainly from the subsistence or non-monetary sector; the monetary or formal agricultural and fishing sector is very small. The methods used to value the subsistence or non-monetary activities are questionable given the lack of regular household surveys or other means of collecting household data. The National Statistics Office often uses the projected population figures and retail price indices to extrapolate the benchmark data based on outdated surveys. The most common benchmark or reference data set that has been used for almost ten years now is the 2005 HIES (KNSO 2006).

14 KIRIBATI NATIONAL MARINE ECOSYSTEM SERVICE VALUATION
2.2 INSTITUTIONAL CONTExTThere are several key ministries and government departments that are involved with management of the natural resources and ecosystems of Kiribati: the Ministry of Environment, Lands and Agricultural Development; the Ministry of Fisheries and Marine Resources Development, Agriculture Division; the National Economic Planning Office; the Ministry of Internal Affairs; and the Kiribati National Statistics Office (KNSO), among others.
The mandates and core responsibilities of Government of Kiribati ministries are contained in the Directions Assigning Ministerial Responsibilities document (Republic of Kiribati 2012). Although each ministry has assigned sectoral focus and objectives, there are overlaps in responsibility for management of marine and coastal resources and biodiversity, not surprising in a country with very limited land space and huge ocean.
The Ministry of Fisheries and Marine Resources Development is responsible for aspects of fisheries development and management issues including offshore mining and mineral prospecting, fishing monitoring and surveillance, scientific research on existing natural resources and regional and international agreements related to fisheries.
The Fisheries Division has Fisheries Assistants stationed at island councils in most of the outer islands of Kiribati. Their role is to deliver the ministry responsibilities for fisheries development and management in rural communities. The Fisheries Assistants have been instrumental in conducting artisanal fisheries surveys. The Fisheries Division and island councils have initiated the establishment of MPAs at island scales and the introduction of fisheries management regimes such as closed areas, taboo on species and seasonal fishing in identified areas. However, the management of these measures rests with the councils and has had mixed success due to absence of regulatory frameworks (specific by-laws) and budget provisions.
The Geology and Coastal Management Division of the Ministry of Fisheries and Marine Resources Development holds much of the spatial data and Geographic Information System (GIS) expertise for the marine area, including maritime boundaries, deep-sea mining exploration and mining, coastal minerals and offshore dredging. Working in partnership with Council of Regional Organisations in the Pacific agencies such as the Secretariat of the Pacific Community (SPC), they have undertaken significant assessment studies on these areas including cost-benefit analysis for offshore dredging and deep-sea mining.
The Ministry of Finance and Economic Development is the central line ministry in the sense that it manages, among other things, national fiscal and economic policy, economic development planning, formulation of national development strategies, budgeting and internal auditing. The National Economic Planning Office consolidates the Kiribati National Development Strategy and conducts monitoring and evaluation of national performance against budgeted provisions and alignment with regional and international obligations. This role is critical for integrating the economic valuation of the MACBIO project into future developmental planning and budgeting.
The KNSO holds much of the national statistics data such as the population census and Household Income and Expenditure Surveys for many of the outer islands. Apparently there is very limited environmental or natural resource data available within the KNSO database. This is probably due to the absence of mechanisms and human capacity to draw existing environmental statistics into the central data repository. A number of strategy documents refer to the need to develop a national data and information centre to coordinate, share and manage existing fragmented information for improved decision-making and increased effectiveness and efficiency. The KNSO will have a critical role in facilitating this strategy.
The Ministry of Communication, Transport and Tourism Development has two divisions that are related to management of marine ecosystems. The Marine Division regulates navigational infrastructure and standards, reef passages, ship registry and prevention of marine pollution. They hold significant numbers of navigational charts that need digitising to conform to electronically available charts. This information is important for identification of shipping lanes and has implications for communities (local fishers, passengers, other sectors) and marine ecosystems.
The Kiribati National Tourism Office aspires to promote small-scale ecotourism deriving economic benefits from services available from the marine environment. A pilot project primarily based on conservation and ecotourism concept was trialled in the island of Nonouti. This was done through promoting Nonouti as a bonefishing10 destination for international anglers who pay fees for access to fishing to benefit the community in return for their efforts in banning fishing for bonefish on their island. Small-scale ecotourism initiatives are increasing in Kiribati and may draw more public attention to effective management of marine biodiversity through an understanding of the value of ecosystem services and resources and essential infrastructure needed for these sustainable investments.
10 Bonefishing is saltwater fly-fishing for bonefish. It is a popular form of sport fishing done from a small boat or by wading.
15NATIONAL MARINE ECOSYSTEM SERVICE VALUATION KIRIBATI
The Ministry of Environment, Lands and Agricultural Development is assigned responsibility for environment and conservation, MPAs including PIPA, marine pollution, foreshore management and biodiversity management. These mandates are relevant to MACBIO components including economic valuation and marine biodiversity management. The ministry houses several key departments and programs that have similar objectives to the MACBIO project. These include the Environment and Conservation Division, the PIPA Trust and PIPA Management Office, and the Land Management Division.
The Environment and Conservation Division is responsible for environmental management including implementing legal and multi-lateral environmental agreement obligations prescribed under the Environment Act 1999. The Division promotes environmental management practices through conservation, environmental impact assessment, and sustainability practices. They consolidate national environmental strategies for protection and resilience of the Kiribati environment including the marine environment. Because of limited personnel capacity their work is confined to Tarawa and Kiritimati Islands.
The Phoenix Islands Protected Area (PIPA) Trust is a not-for-profit non-governmental organisation (NGO) established under the law of Kiribati. Their objective is to provide long-term sustainable financing for the conservation of both terrestrial and marine biodiversity in the PIPA. The PIPA Management Office is the management and technical arm of the PIPA and works closely with the PIPA Trust office.
The Land Management Division, although solely responsible for land related issues, has GIS expertise and has assisted several government departments to digitise boundaries and layers of designated activities. These include Ramsar site boundaries, key biodiversity area layers and mangrove restoration coverage areas.
In 2014, the Ministry of Internal Affairs was reformed from the former Ministry of Internal and Social Affairs. This reformation has allowed this ministry to focus on local government, rural development and planning in the outer islands. The ministry, in collaboration with outer island councils, has responsibility to execute the government’s interventions and priorities to improve the wellbeing of outer island communities. This is being achieved through integrating various projects and activities of other line ministries through the Ministry of Internal Affairs. In this respect, the ministry, island councils and island communities are jointly responsible for the successful implementation of interventions. The outer island councils have the legal power to create by-laws concerning management of marine resources. Few fisheries-related by-laws have been processed due to chronic lack of human resources skilled in fisheries and legislation drafting.
The Ministry of Line and Phoenix Islands Development was established specifically to administer development in this particular area of Kiribati. It is worth noting that Kiritimati Island has been a hub of game fishing and small-scale nature-based tourism activities such as diving and bird watching. One of the main commercial businesses operating in Kiritimati Islands is the pet fish trade for the ornamental aquarium market. The ministry works closely with extension braches of other line ministries stationed in Kiritimati.
The Office of Beretitenti (President) includes the Strategic Risk Management Unit (SRMU). The primary objective of this unit is to advise Cabinet and H.E. the President on matters concerning threats and risks to Kiribati that might hinder future development aspirations as a sovereign state. The SRMU works closely with line ministries and other partners as needed to find strategic, effective and cost-efficient solutions or diplomatic positions to minimise or avoid the possible ramifications of risks and threats. The unit coordinates national strategies for climate change and disaster. Given the central position of this unit, it plays a crucial role in coordination of possible overlapping and conflicting responsibilities between individual line ministries. The unit promotes urgent and cross-sectoral policy-related action such as information-sharing and integrating particular themes into policies.
There are very few international NGOs based in Kiribati and therefore most of the external programmes/projects are driven by government agencies. The Foundation of the Peoples of the South Pacific—Kiribati (FSPK) is the only international NGO in Kiribati. In the past, the FSPK, in collaboration with the SPC, ran an awareness program which involved translation of marine species names into their local names and developing awareness-raising materials on destructive fishing. It is unknown how the wide dissemination and update of these materials impacted fisheries management in the outer islands communities.
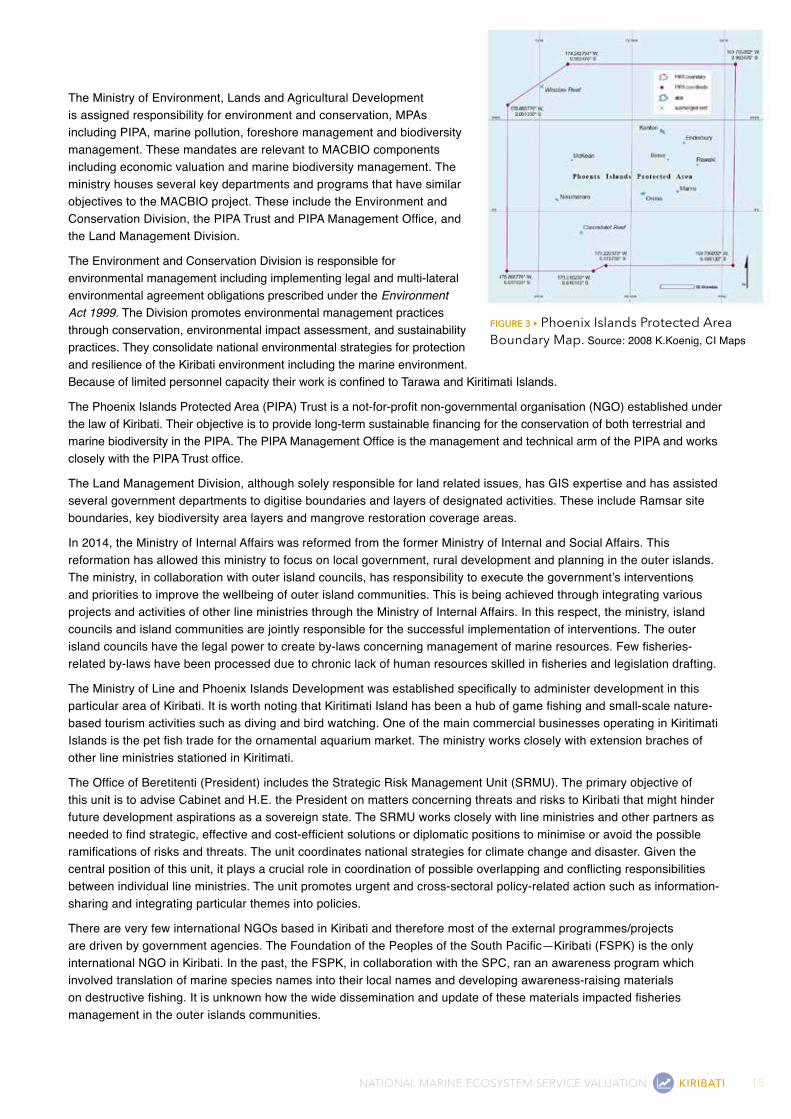
FigurE 3 • Phoenix Islands Protected Area Boundary Map. Source: 2008 K.Koenig, CI Maps
16 KIRIBATI NATIONAL MARINE ECOSYSTEM SERVICE VALUATION
Photo: © Rimon Photography
RIMAGE ©
Faith-based organisations are dominant and powerful in terms of community empowerment and mobilisation. The Roman Catholic Church and Kiribati Protestant Church are the two main denominations in Kiribati. Society in Kiribati tends to split largely based on the church people belong to. Each church has unique settings (e.g. women’s church groups, youth groups, village-based church groups) and church activities play a central role in daily life and decisions in communities.
The traditional governing system is also still practised in some outer islands of Kiribati. This is called the Unimane system, which literally means elder members of communities/villages forming a decision-making body. This system was the main form of customary governance before Western governance systems were introduced. These days this significant system is promoted in outer islands especially when there are civil conflicts among villagers that are beyond the island council’s control. It is recognised by most i-Kiribati as the most powerful decision-making body in their home islands.
Economic information can be used for decision-making by all these ministries and NGOs. Data on natural resources or ecosystem system services are collected by individual ministries and government departments but are not systematically or comprehensively collated or presented in an accessible format. For instance, the Ministry of Fisheries collects fisheries data on the outer islands but the data are not shared with National Statistics Office for calculation of household income and national accounts. The fisheries data are also not shared with any other ministry. In short, there are arrangements to collect and collate information on a regular and systematic basis but these arrangements are not centralised. This problem is alluded to in the Kiribati Development Plan 2012–2015, p 44 (Government of Kiribati 2012a).
Numerous laws and policies provide for the protection of the natural environment, however environmental monitoring, enforcement, collaboration and coordination of responses have been weak. This calls for more effective coordination and implementation of environmental monitoring and enforcement by key government ministries and agencies. Government agencies involved in environment protection, management, monitoring and enforcement need to be strengthened and adequately resourced. This is also crucial for the effective delivery of services at the national level.
Economic valuation of natural resources and the environment has proved useful to advocate for the proper use of environmental assets and services. A dollar value on natural assets and services provided by natural capital encourages people, including policy-makers, to better appreciate the importance of the assets. Economic valuation of environmental assets and services in Kiribati should help ongoing efforts by the Ministry of Environment and the Ministry of Fisheries, for example, to limit or contain excessive use or exploitation of natural resources.
17NATIONAL MARINE ECOSYSTEM SERVICE VALUATION KIRIBATI
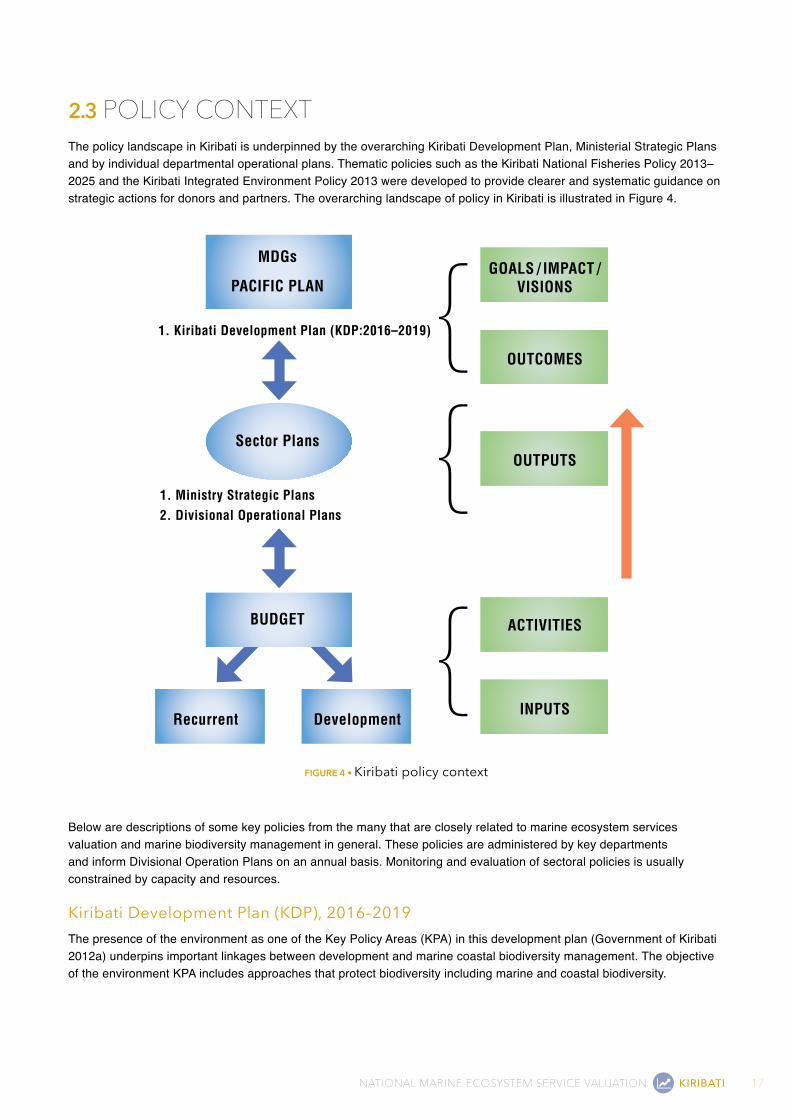
2.3 POLICY CONTExTThe policy landscape in Kiribati is underpinned by the overarching Kiribati Development Plan, Ministerial Strategic Plans and by individual departmental operational plans. Thematic policies such as the Kiribati National Fisheries Policy 2013–2025 and the Kiribati Integrated Environment Policy 2013 were developed to provide clearer and systematic guidance on strategic actions for donors and partners. The overarching landscape of policy in Kiribati is illustrated in Figure 4.
MDGs
PACIFIC PLAN
1. Kiribati Development Plan (KDP:2016–2019)
Sector Plans
1. Ministry Strategic Plans
2. Divisional Operational Plans
BUDGET
Recurrent Development
GOALS / IMPACT / VISIONS
OUTCOMES
OUTPUTS
ACTIVITIES
INPUTS
FigurE 4 • Kiribati policy context
Below are descriptions of some key policies from the many that are closely related to marine ecosystem services valuation and marine biodiversity management in general. These policies are administered by key departments and inform Divisional Operation Plans on an annual basis. Monitoring and evaluation of sectoral policies is usually constrained by capacity and resources.
Kiribati development Plan (KdP), 2016–2019The presence of the environment as one of the Key Policy Areas (KPA) in this development plan (Government of Kiribati 2012a) underpins important linkages between development and marine coastal biodiversity management. The objective of the environment KPA includes approaches that protect biodiversity including marine and coastal biodiversity.
18 KIRIBATI NATIONAL MARINE ECOSYSTEM SERVICE VALUATION
Kiribati national Fisheries Policy, 2013–2025This policy (Government of Kiribati 2012b) contains several strategies and approaches that are closely aligned to marine and coastal biodiversity management, although focused more on development of offshore and inshore fisheries resources for food security and revenue. Several of its strategic objectives mention sustainable fishing practices, long-term conservation of fisheries/marine ecosystems and resilience of marine coastal resources from climate change. This policy mentioned a value of A$ 110 million per year for fisheries, broken down into government revenue from licences valued at A$ 46 million in 2001, and A$ 34 million for subsistence fishing per year.
Kiribati Integrated Environment Policy (KIEP)The KIEP (Government of Kiribati 2013) references several strategies that are directly linked with the notion of marine and coastal biodiversity management, particularly internationally-driven commitments such as Aichi targets from the CBD and programmes on biodiversity and environment protection.
Kiribati national Biodiversity Strategy and Action PlanThe document (Government of Kiribati 2006) contains nationally determined strategies for threats and issues associated with marine and coastal biodiversity. These include monetary values of marine biodiversity and management approaches such as protected/conservation areas and reserves. The plan reports values for coastal fisheries (A$ 23,000 in 2002), tuna catch (A$ 26 million in 1998), aquarium fish trade (A$ 2.5 million in 2002), seaweed mariculture (A$ 652,000 in 2002), and shark fins (A$ 437,212 in 2002). Marine ecosystem services values were not mentioned.
Kiribati Action Plan for Implementing the CBd Program of Work on Protected Areas, 2011The document contains relevant information regarding marine and coastal biodiversity, particularly in the context of national targets for protected areas, barriers and issues inhibiting effective management and key strategic actions.
Joint Implementation Plan for Climate Change and disaster Risk Management, 2014–2023Strategy Four on water, food and ecosystems security and resilience has synergistic relationships with marine and coastal biodiversity management. There are several specific actions under this broad strategy that are closely aligned to marine and coastal management. Although other strategies are equally relevant, this joint implementation plan presents a potential mechanism to mainstream the importance of the sustainable use of marine and coastal biodiversity/resources. This report specifically recognises the value of coastal fisheries (around A$ 110 million per year). Other values of the services provided by marine and coastal ecosystems are not valued or quantified.
Phoenix Island Protected Area Management Plan, 2010–2014Most of the activities in the PIPA management plan (Government of Kiribati 2009) are related to the management of the marine and coastal biodiversity in this isolated group of islands in Kiribati. The lessons learned will be very helpful for the management of marine and coastal biodiversity in other Pacific Islands.
Kiribati Shark Sanctuary, 2015In 2015, the Government of Kiribati passed the Shark Sanctuary Regulations 2015. The purpose of the regulation is to establish a shark sanctuary in Kiribati waters to ensure the conservation of sharks. Whereby a person must not catch, capture or kill a shark; engage in fishing for shark; or remove a shark fin from, or otherwise mutilate or injure, a shark.
The Shark Sanctuary was supported by the Council of Elders of Makin, Butaritari, Marakei, Abaiang, Tokatarawa, Maiana, Abemama, Onotoa, Nikunau, Nonouti, Arorae and Kiritimati and led the Kiribati government to create the Kiribati Shark Sanctuary Regulation and signed by President Tong in April 2015.
The Kiribati Government places great importance on the environment and natural resources, manifested in the numerous government policies and projects to mitigate the adverse impacts of human exploitation, commercial undertakings, and climate change on the environment and natural resources. Some of the larger projects include the Kiribati Adaptation Project (KAP), a multi-million-dollar project funded by the World Bank, the PIPA, the SRMU within the Office of the President that oversees the risks associated with climate change and over-population. In addition, the Ministry of Environment has formulated policies and implemented projects to address environmental and resource issues such as biodiversity loss, coastal erosion, pollution and invasive species.
19NATIONAL MARINE ECOSYSTEM SERVICE VALUATION KIRIBATI
The KIEP Document states:
“People will always rely heavily on the environment to service their needs. Protecting, managing and utilizing the environment (on a) sustainable basis are vital, especially in a low-lying nation like Kiribati. Like many other Small Island Developing States and Least Developed Countries, Kiribati has suffered heavily the impacts of globalization in particular global climate change. The transition from a traditional subsistence lifestyle to a contemporary market-based economy, has brought with it key environmental challenges that adversely affect the overall health of the environment. Some of these key environmental challenges like the loss of island biodiversity, waste and pollution and the unsustainable use of natural resources are further magnified by the impacts of global climate change”.
Synthesising the various plans and documents it is clear that the Kiribati Government considers the environment and natural resources as fundamentally important to the lives of people now and in the future. There is recognition that the environment and the ecosystems provide benefits to people but what is not clear is the magnitude, in dollar terms, of these benefits. The objective of this study is to provide dollar values to the ecosystem services so that people, including policy-makers, can put into context the value the marine environment and natural resources of Kiribati, some of which are already declining, if not already on an irreversible path of damage or extinction.
Economic values for marine and coastal ecosystem services will further inform policy-makers to enhance sustainable management of marine resources and development planning and policy formulation.
2.3.1 POLICY APPLICATIOnS FOR MARInE ECOnOMIC EVALuATIOnSDiscussions and consultations within Kiribati (see Appendix II: Stakeholder consultations, attendee lists) identified the following specific uses for the results of this work:
■ To help promote conservation efforts by including information on the value of marine ecosystem services in the National Biodiversity Strategy Action Plan (NBSAP)
■ To assist decision-making about mangroves, seagrasses and coral reefs, listed as three key ecosystems in the National Environmental Act
■ To inform feasibility studies exploring dredging of aggregate in Tarawa Lagoon
■ To assess local benefits versus costs of tuna fishing and licensing
■ To help decision-makers understand the value of the relationship between marine resource management and food production
■ To evaluate potential losses from climate change (hard infrastructure costs)
■ To value the local fishery to support adequate fisheries management for inshore/nearshore fisheries
■ To improve assessments of the potential costs and benefits of mining of deep-sea minerals
■ To inform aspects of a cost-benefit analysis of Fish Aggregating Devices (FADs)
■ To help evaluate the pros and cons of mangrove projects
■ To feed estimates of the economic value of Kiribati ecosystems into the review of the Access and Benefit-Sharing National Policy
■ To provide valuable baseline information for environmental impact assessments
■ To encourage people to focus on conserving marine resources, particularly for potential of sustainable giant clam and bonefish markets
■ To assist the Fisheries Minister to analyse the consequences of depleted stocks of fish
■ To help analyse the degree to which mining of deep-sea mineral (and also aggregate deposits) could conflict with fishing uses and values. The Division of (marine) Mineral Resources has been conducting an analysis of deep-sea mining within the Kiribati EEZ
20 KIRIBATI NATIONAL MARINE ECOSYSTEM SERVICE VALUATION
■ To contribute to evaluating the impact on local fishers of commercial tuna fleets selling their damaged fish and bycatch to local markets at very low rates, undercutting local fishers
■ To help argue for greater efforts to better address coastal erosion which impacts on coastal habitats as well as built infrastructure
■ To contribute to an analysis of the willingness-to-pay for research and education licences within PIPA
■ Information on potential tourism values and carbon sequestration values of PIPA can be used for the PIPA Trust Fund
■ To show the community how healthy ecosystems can benefit ecotourism and how ecotourism can benefit the people of Kiribati.
Government and other participants also commented that they would like to see:
■ Mentoring on economics
■ Placement of a strong resource economist in Kiribati.
2.4 RELATEd PROjECTS ANd INITIATIVESThere are a number of international, regional, sub-regional and national commitments, projects and/or initiatives that are relevant to this work.
Sustainable use and conservation of marine and coastal biodiversity are priority action areas of the Strategic Plan of the CBD. The Pacific CBD member states, including Kiribati, have expressed their commitment to the implementation of the extensive CBD resolutions on the conservation and sustainable use of marine and coastal biodiversity.
In this regard, the MACBIO project responds to the needs of Kiribati by:
■ Assisting the government in achieving the Aichi targets as a contribution to the CBD Strategic Plan for Biodiversity 2011–2020
■ Implementing actions outlined in the country’s NBSAP
■ Contributing directly to the CBD Programme of Work on Protected Areas, especially to attainment of Aichi Target 11
■ Assisting with implementation of the CBD Programme of Work on Island Biodiversity in accordance with the CBD COP 11 decision.
Beyond the CBD, Kiribati has other commitments, interests and projects that this report can contribute to. For example, it will be:
■ Contributing to implementation of the Pacific Regional Environment Strategic Plan 2011–2015
■ Implementing some of the principles for regional integration and cooperation for the purpose of conserving marine resources formulated in the Pacific Oceanscape Framework and supported by high-level decision-makers
■ Initiating a system of environmental-economic accounts (green national accounting)
■ Contributing to other projects, such as Ridge-to-Reef and RESCCUE.
Through its implementation partners, the MACBIO project is a member of the Marine Sector Working Group of the Pacific regional organisations (Pacific Island Forum Secretariat (PIFS), SPREP, SPC and University of the South Pacific) with locally active international environmental NGOs as observers. This allows for project activities not only to be coordinated with other projects in the target countries but also to serve as examples in other Pacific Island States and Territories.
The transferability of successful approaches is enhanced by involving other representatives of regional institutions and by running workshops at regional events attended by all Pacific Island states, such as the Pacific Climate Change Roundtable and the Pacific Island Roundtable for Nature Conservation.
Dissemination of the knowledge gained from the project and its incorporation into global and regional processes is promoted through continuous dialogue with relevant global institutions (TEEB Global, UNEP World Conservation Monitoring Centre, EU Joint Research Centre, IUCN World Commission on Protected Areas) and cooperation with ongoing BMUB International Climate Initiative projects in the field of marine and coastal biodiversity.
21NATIONAL MARINE ECOSYSTEM SERVICE VALUATION KIRIBATI
Other projects in Kiribati that share related objectives, interventions or points of synergies are described below. MACBIO is coordinating efforts with these projects.
Kiribati Adaptation Program Phase III — Coastal ComponentThis is a climate change adaptation project that was funded jointly by the Global Environment Facility (GEF), AusAID, Japan, Global Facility for Disaster and the Kiribati Government. The total project cost is US$ 10 million over 2012–2016. The project objective is to increase the resilience of Kiribati through freshwater and coastal protection and focuses only on South Tarawa and North Tarawa. The coastal protection component may have some synergies with MACBIO in terms of community-based approaches to coastal protection measures.
Ridge-to-Reef ProjectThe Kiribati Resilient Islands, Resilient Communities project is part of the broader Pacific Islands Ridge-to-Reef (R2R) programme. The goal of the programme is to maintain and enhance Pacific Island countries’ ecosystem goods and services (provisioning, regulating, supporting and cultural) through integrated approaches to land, water, forest, biodiversity and coastal resource management that contribute to poverty reduction, sustainable livelihoods and climate resilience.
The overall aim of the project is to build on the baseline activities and to use GEF resources to focus on selected areas and outer islands to demonstrate an integrated approach to land and resource planning and management and biodiversity conservation, consistent with the ridge-to-reef approach.
The project made a final round of consultations for the preparation of a detail work program in 2014. The main components of the project include: i) collection and analysis of information and elaboration of activities for biodiversity conservation and integrated land management; ii) development of land and coastal management plans; iii) capacity-building in biodiversity conservation and integrated land management; and iv) project management. The project shares goals with the MACBIO project, particularly in the areas of information collection and capacity-building.
ACIAR–SPC Community-based Fisheries Management ProjectThe aim of this project is to improve community-based fisheries management (CBFM) in Kiribati as well as other Pacific Island countries. This project will approach this issue through assessment of critical success factors for implementing CBFM concepts, investigation on how CBFM concepts interact with broader livelihood choices, and social and customary norms of decision-making around CBFM.
The project has selected Butaritari and North Tarawa as pilot sites and therefore has held initial consultations with island councils of these islands, and conducted study missions and implementation since early 2014.
SPC–Eu Environmentally Safe Aggregate for Tarawa ProjectThe Environmentally Safe Aggregate for Tarawa Project is designed to protect the fragile beaches of South Tarawa from damage caused by unsustainable gravel mining by the local population. This is realised through the provision of an alternative supply of construction aggregate from the lagoon basin that has been identified as viable for such uses. The mining industry is in an early stage of development and has designated areas for mining including environmental standards and procedures to minimise the effects of the industry on the wider lagoon ecosystems and resources. Cost-benefit analysis has been undertaken to inform this project. Much of the information from this project will be useful for the MACBIO project in terms of supporting existing efforts of Kiribati on wider marine and coastal resources management.
Australia-funded Enhancing Pacific Ocean Governance ProjectThis project has three components: support the Pacific Islands Forum Secretariat’s Ocean Commissioner; supporting Pacific Island countries with formalising their boundaries; and country-specific work in the Solomon Islands and Kiribati. This latter involves building spatial data infrastructure, data collation, collation of metadata regarding past and present marine and coastal projects in Kiribati and supporting marine spatial planning in Tarawa Lagoon.
PIPA ProjectThe PIPA project, funded by GEF, supports Government of Kiribati efforts to manage the Phoenix Islands Protected Area through implementation of a management plan with assistance from partners. The project is ongoing and the management plan has recently been reviewed. The PIPA project is expected to run fully from its endowment fund in the coming years. Although PIPA operates in a specific island group, several of its concepts and lessons are relevant to MACBIO.

23NATIONAL MARINE ECOSYSTEM SERVICE VALUATION KIRIBATI
3. CONCEPTUAL fRAMEwORk
The primary purpose of this assessment was to provide decision-makers and policy-makers (at all levels) with information about the value that people place on their marine and coastal ecosystems. This was with a view to inform the development of decisions and policies with more concrete information about marine ecosystem values that are otherwise not fully appreciated or considered. For this reason, significant effort was made to conduct the work collaboratively, and with close interaction with key influential government and non-government stakeholders as well as technical staff within Kiribati (see Appendix II).
3.1 dEfINITIONSEcosystemAn ecosystem is a dynamic complex of plant, animal and micro-organism communities and their non-living environment interacting as a functional unit. Natural ecosystems have varying attributes (e.g. particular species of plants and animals) and perform various functions (e.g. photosynthesis, chemical and nutrient cycling). Many of these attributes and functions benefit human activities, communities, and industries.
Ecosystem servicesEcosystem services are the benefits humans receive from the natural attributes and functions of ecosystems (cf. Figure 5). These benefits could be material goods such as timber or fish, or biological services such as the treatment of human waste and carbon sequestration.
The value of marine (and other) ecosystem services to people is often not visible in markets, business transactions or in national economic accounts. Their value is often only perceived when the services are diminished or lost. Assigning monetary values to marine ecosystem services to reflect their importance to I-Kiribati people is a powerful tool to make these benefits visible and improve their wise use and management. The process of assigning monetary values to ecosystem services that benefit people is called economic valuation.
PROVISIONING• Seafoods• Building Materials• Minerals
CuLTuRAL• Tourism• Recreation• Cultural Identity
REGuLATING• Coastal Protection• Carbon Sequestration
SuPPORTING• nutrient Cycling • Photosynthesis • Habitat
FigurE 5 • Marine ecosystem services
Economic value and economic valuationEconomic value refers to quantified net benefit that humans derive from a good or service, whether or not there is a market and monetary transaction for the goods and services. Economic value needs to be distinguished from economic activity (also known as financial or exchange value), which is a measure of cash flows and is observed in markets11. While economic activity from market transactions is often used to calculate economic value, economic activity is not in and of itself a measure of human benefit. Economic activity, however, is an interesting measure12. The number of formal
11 Analysis of economic activity often focuses on ‘multiplier effects’, that is, the proportion of cash flows from one industry that spill over into other industries through inter-industry linkages.
12 GDP, produced through the System of National Accounts (SNA), is a measure of economic activity. The UN Statistics Division has recently published guidance for a System of Environmental-Economic Accounts (SEEA), which provides an accounting framework that is consistent and can be integrated with the structure, classifications, definitions and accounting rules of the SNA, thereby enabling the analysis of changes in natural capital, its contribution to the economy and the impacts of economic activities on it. It should be noted, however, that this system is restrictive in terms of the

24 KIRIBATI NATIONAL MARINE ECOSYSTEM SERVICE VALUATION
sector jobs and the likelihood of capital investment are closely related to economic activity, and this is of interest to the public, civil servants and policy-makers. This report focuses on measuring economic value. Caution must be taken not to compare economic activity to economic value. Although both can be represented in dollars per year, they are different measurements of benefits.
In assessing and comparing ecosystem services, there are sometimes trade-offs to be made between different ecosystem services. For example, mining a coral reef for building materials is likely to diminish its value as a source of food from fishing. Other ecosystem services can be complementary, for example, the coastal protection value of coral reefs and their tourism value from diving or snorkelling.
Consumer and producer surplusIn general, the analysis in this report is based on the microeconomic concepts of consumer and producer surplus. Consumer and producer surplus are net measures; they measure the difference between the benefits and the costs of a particular good or service. Producer surplus is the benefit received by businesses, firms, or individuals who sell a good or service; consumer surplus is the benefit received by individuals who purchase or enjoy freely a good or service. For market transactions, producer surplus is synonymous with value-added or profit.
Willingness-to-pay and willingness-to-acceptBenefits are quantified by an individual’s willingness-to-pay (WTP) or a business’s willingness-to-accept, or rather, how much money an individual or business would willingly trade for providing or receiving a good or service. The difference between consumers’ maximum WTP and what they actually pay is the consumers’ benefit from the transaction. Consumer WTP is represented graphically as a demand curve.
Total economic valueThe total economic value of an ecosystem service includes all of the net benefits humans receive from that ecosystem service. Total economic value is a quantification of the full contribution ecosystems make to human wellbeing. It includes market and non-market values (i.e. direct use value, indirect use value, and existence, or non-use value) and therefore represents the full benefit humans receive from ecosystem functions.
In practice, total economic value is nearly impossible to calculate because the data required are rarely available. For example, fisheries resources offer benefits to those who harvest and sell seafood products (producers), as well as those who consume seafood products (consumers). The total economic value of the fishery is a sum of the producer and consumer benefits. However, consumer benefits are difficult to estimate and, in the case of export products, they accrue to individuals distant from the natural resource. Producer benefits alone are commonly used to estimate the value of fisheries, as is done in this report. It should be noted, however, that these estimates are a lower-bound value and do not represent total economic value.
Further definitions can be found in the glossary (Appendix I: Glossary).
3.2 ThE ECONOMICS Of ECOSYSTEMS ANd BIOdIVERSITYAs an implementing partner on the MACBIO project, IUCN Oceania is responsible for national assessment of marine and coastal ecosystem services in Fiji, Kiribati, Solomon Islands, Tonga and Vanuatu. These national reports follow the approach for assessing ecosystem services developed by the TEEB initiative (www.teebweb.org). The TEEB approach comprises six steps:
1. Specify and agree on the relevant policy issues with stakeholders
2. Identify the most relevant ecosystem services
3. Define information requirements and select appropriate methods
4. Quantify, then value, ecosystem services
5. Identify and appraise policy options and distributional impacts
type of services and values that can be assessed.

25NATIONAL MARINE ECOSYSTEM SERVICE VALUATION KIRIBATI
6. Review, refine and report.
The MACBIO model for economic assessment of ecosystems was to conduct research in partnership with local organisations and government representatives to improve their capacity to analyse and synthesise ecosystem data. In addition, this collaborative approach contributed to in-county understanding of and belief in the results of the ecosystem service valuations. Capacity development included basic training on resource economics concepts, recommendations for modifying or improving data collection, discussions about how economic service valuations could be used in government and elsewhere and ongoing monitoring and evaluation of ecosystem service values to achieve sustainable development. To this end, the ecosystem service valuation included the participation of government staff and local resource managers at every opportunity to permanently augment the capacity of country nationals to use ecosystem data and economic valuation in development of policies and resource management decision-making.
Stakeholder workshops were held to determine specific uses for the economic valuation in Kiribati, including which policy issues could be supported by more information about the value of ecosystem services (TEEB Step 1, see Section 2.3.1). The policy issues identified by stakeholders covered a wide range of topics. Given the resource constraints in Kiribati, it was deemed unlikely that a detailed marine economic service valuation would be conducted for every policy context described. It was decided, therefore, to conduct a more generic marine ecosystem service valuation which could be used in whole or in part to inform a range of different existing and potential policy and decision-making situations. These workshops, and individual discussions and existing documentation, helped to identify the most relevant ecosystem services in Kiribati (Step 2 of the TEEB process).
Steps 2–6 of the TEEB process were conducted in-country with in-country colleagues. The TEEB approach encourages economic valuation practitioners to engage with stakeholders not just to identify needs and policy applications for the ecosystem service valuation but also to develop methods for valuation that met those particular needs and to ensure that the data provided were useful and relevant. In addition, in-country colleagues advised about the best way to communicate the results to those who can use the information. This report forms the basis for any communication products.
A methodological guidance document (Salcone et al. 2015) was created in consultation with the country-based research teams to ensure as-consistent-as-possible treatment across the five study sites.
It is anticipated that this initial baseline report will provide a platform from which to identify priority actions — national policy development, national and watershed-scale data collection, regular analysis, planning and outreach — that better incorporate ecosystem service stocks, flows, and values into ongoing national discussions and policy processes (Steps 5 and 6).
3.3 APPLICATIONS Of MARINE ECOSYSTEM SERVICE VALUATIONThere are three main categories of applications of marine ecosystem service valuation: 1) to enable rational decision-making, via cost-benefit analyses or other analyses of the trade-offs of different management decisions; 2) as a technical tool to set prices for protecting resources or compensation for ecosystem damages; or 3) as general information, to raise awareness about the human benefits of healthy ecosystems and support policy and governance that manages resources from a social equity perspective (Mermet et al. 2014). The third application can lead to full integration of the benefits of ecosystems into national accounting (natural capital accounting). National-scale ecosystem service valuation is applicable mostly to this third use, that is, general information for planning and advocacy.
Stakeholders explicitly identified the uses of the marine ecosystem valuation for Kiribati during workshops and other discussions. These uses are presented in Section 2.3.1.

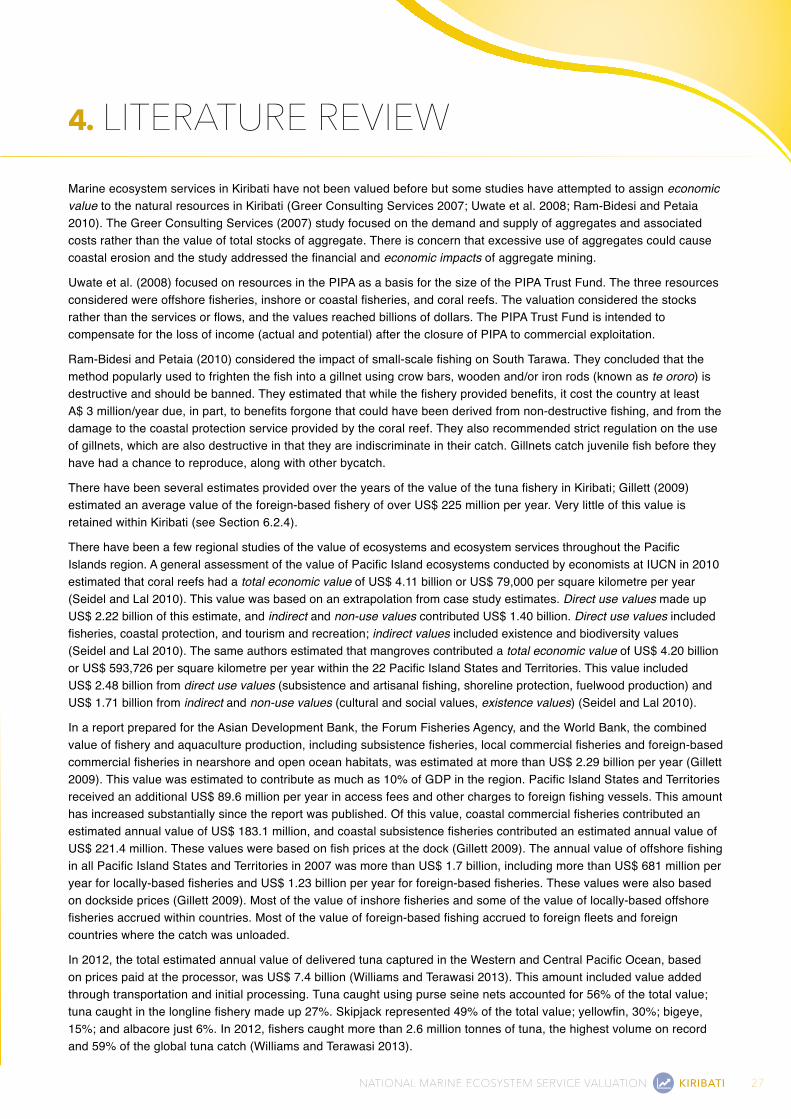
27NATIONAL MARINE ECOSYSTEM SERVICE VALUATION KIRIBATI
4. LITERATURE REVIEwMarine ecosystem services in Kiribati have not been valued before but some studies have attempted to assign economic value to the natural resources in Kiribati (Greer Consulting Services 2007; Uwate et al. 2008; Ram-Bidesi and Petaia 2010). The Greer Consulting Services (2007) study focused on the demand and supply of aggregates and associated costs rather than the value of total stocks of aggregate. There is concern that excessive use of aggregates could cause coastal erosion and the study addressed the financial and economic impacts of aggregate mining.
Uwate et al. (2008) focused on resources in the PIPA as a basis for the size of the PIPA Trust Fund. The three resources considered were offshore fisheries, inshore or coastal fisheries, and coral reefs. The valuation considered the stocks rather than the services or flows, and the values reached billions of dollars. The PIPA Trust Fund is intended to compensate for the loss of income (actual and potential) after the closure of PIPA to commercial exploitation.
Ram-Bidesi and Petaia (2010) considered the impact of small-scale fishing on South Tarawa. They concluded that the method popularly used to frighten the fish into a gillnet using crow bars, wooden and/or iron rods (known as te ororo) is destructive and should be banned. They estimated that while the fishery provided benefits, it cost the country at least A$ 3 million/year due, in part, to benefits forgone that could have been derived from non-destructive fishing, and from the damage to the coastal protection service provided by the coral reef. They also recommended strict regulation on the use of gillnets, which are also destructive in that they are indiscriminate in their catch. Gillnets catch juvenile fish before they have had a chance to reproduce, along with other bycatch.
There have been several estimates provided over the years of the value of the tuna fishery in Kiribati; Gillett (2009) estimated an average value of the foreign-based fishery of over US$ 225 million per year. Very little of this value is retained within Kiribati (see Section 6.2.4).
There have been a few regional studies of the value of ecosystems and ecosystem services throughout the Pacific Islands region. A general assessment of the value of Pacific Island ecosystems conducted by economists at IUCN in 2010 estimated that coral reefs had a total economic value of US$ 4.11 billion or US$ 79,000 per square kilometre per year (Seidel and Lal 2010). This value was based on an extrapolation from case study estimates. Direct use values made up US$ 2.22 billion of this estimate, and indirect and non-use values contributed US$ 1.40 billion. Direct use values included fisheries, coastal protection, and tourism and recreation; indirect values included existence and biodiversity values (Seidel and Lal 2010). The same authors estimated that mangroves contributed a total economic value of US$ 4.20 billion or US$ 593,726 per square kilometre per year within the 22 Pacific Island States and Territories. This value included US$ 2.48 billion from direct use values (subsistence and artisanal fishing, shoreline protection, fuelwood production) and US$ 1.71 billion from indirect and non-use values (cultural and social values, existence values) (Seidel and Lal 2010).
In a report prepared for the Asian Development Bank, the Forum Fisheries Agency, and the World Bank, the combined value of fishery and aquaculture production, including subsistence fisheries, local commercial fisheries and foreign-based commercial fisheries in nearshore and open ocean habitats, was estimated at more than US$ 2.29 billion per year (Gillett 2009). This value was estimated to contribute as much as 10% of GDP in the region. Pacific Island States and Territories received an additional US$ 89.6 million per year in access fees and other charges to foreign fishing vessels. This amount has increased substantially since the report was published. Of this value, coastal commercial fisheries contributed an estimated annual value of US$ 183.1 million, and coastal subsistence fisheries contributed an estimated annual value of US$ 221.4 million. These values were based on fish prices at the dock (Gillett 2009). The annual value of offshore fishing in all Pacific Island States and Territories in 2007 was more than US$ 1.7 billion, including more than US$ 681 million per year for locally-based fisheries and US$ 1.23 billion per year for foreign-based fisheries. These values were also based on dockside prices (Gillett 2009). Most of the value of inshore fisheries and some of the value of locally-based offshore fisheries accrued within countries. Most of the value of foreign-based fishing accrued to foreign fleets and foreign countries where the catch was unloaded.
In 2012, the total estimated annual value of delivered tuna captured in the Western and Central Pacific Ocean, based on prices paid at the processor, was US$ 7.4 billion (Williams and Terawasi 2013). This amount included value added through transportation and initial processing. Tuna caught using purse seine nets accounted for 56% of the total value; tuna caught in the longline fishery made up 27%. Skipjack represented 49% of the total value; yellowfin, 30%; bigeye, 15%; and albacore just 6%. In 2012, fishers caught more than 2.6 million tonnes of tuna, the highest volume on record and 59% of the global tuna catch (Williams and Terawasi 2013).


29NATIONAL MARINE ECOSYSTEM SERVICE VALUATION KIRIBATI
5. METhOdSThe general methods are presented in Salcone et al. (2015). Specific details of methods applied in this report are presented below or in the relevant sections of the report.
As far as possible, government staff and other relevant parties within Kiribati worked with the authors to answer questions, supply information and data and to identify data gaps for this report (TEEB steps 1–4). See Appendix II: Stakeholder consultations, attendee lists for the list of people consulted. These colleagues also identified in-country policies, plans, strategies and other marine resource management tools to which this work could contribute.
5.1 OVERVIEw Of ESTIMATION METhOdSThis analysis identified seven key ecosystem services that are described and valued in this report:
1. Subsistence food
2. Commercial food
3. Minerals and aggregate
4. Tourism and recreation
5. Coastal protection
6. Carbon sequestration
7. Environmental research, management and education.
Marine and coastal ecosystems provide many more ecosystem services than the seven explored here. These seven were identified as nationally important, potentially quantifiable with existing data and amenable to policy intervention or private action.
The detailed and specific mathematical methods and data requirements for estimating the value of these seven marine and coastal ecosystem services are provided in Salcone et al. (2015). This is a methodological guidance document created in consultation with the country-based research teams and other Pacific resource economists to ensure consistent treatment across the five study sites.
Where sufficient data are available, ecosystem service valuation represents producer and/or consumer surplus and includes market and non-market values for direct and indirect ecosystem services. Where sufficient data do not exist to implement the most appropriate methods, the next best possible ecological-economic analysis has been conducted. This may include qualitative descriptors of values or reference to other locations with data on the identified values. Gaps in data and previous research are partially offset with the authors’ judgment based on economic theory.
Introductions to the specific methods for evaluation of each of these seven ecosystem services are given in Chapter 6.
Unless otherwise stated, all monetary values have been converted to 2013 US dollars (US$), or Australian dollars (A$), the local currency. Currencies have been converted using the most appropriate price or currency inflation indices for comparison of benefits or costs. Throughout the report an exchange rate of US$ 1 = AUD$ 1.11 is used.
5.2 SECONdARY dATA SOURCESMACBIO was not intended to collect primary data. Instead, the objective was to locate existing sources of data that can be used to conduct ecosystem service valuation and identify data gaps. Data were sourced from government departments, particularly the MELAD, the Ministry of Fisheries and Marine Resource Development and the National Statistics Office. Primary data sources included the 2006 HIES and the 2010 population census. The Fisheries Division provided data on subsistence fishing harvest; additional fisheries data were obtained from reports by the Pacific Islands Forum Fisheries Agency (FFA). The National Statistics Office provided data on international trade for estimates of

30 KIRIBATI NATIONAL MARINE ECOSYSTEM SERVICE VALUATION
aggregate mining based on the amount of cement imported. The Kiribati Tourism Office provided data from their 2014 tourism survey. The Lands Division, MELAD, provided data on vegetation cover to estimate carbon sequestration by mangroves. In some instances, different ministries or departments are referred to as the source of the information but no document is cited. This is because data were provided directly to the author (e.g. by the National Statistics Office). Where national data were not available, if possible finer scale (within country) data were used to provide insights into national values.
In other instances where data were unavailable, values for similar ecosystem services from similar ecosystems in other countries were used to consider the relative value of the respective ecosystem service. Results or other findings which are not ascribed to a source are based on the knowledge of the authors.
5.3 dATA gAP ANALYSISA major focus of this research effort was identifying gaps and weaknesses in data that prohibited the accurate valuation of marine and coastal ecosystem services. The importance of this exercise should not be understated. This report encourages and supports the use of ecosystem service valuation in national planning and policy-making, but in many instances a true economic value of the human benefits of ecosystems could not be estimated because of a shortage of ecological or socio-economic information. These data gaps are described where ecosystem services are quantified in Chapter 6.
5.4 dATA SYNThESIS ANd ExTRAPOLATIONFisheries, aggregate mining, tourism and carbon sequestration benefits are estimated based upon actual Kiribati data, in so much as it is available. No extrapolations from results or data from other Pacific countries has been done for this report, although general connections are drawn to other countries in regards to tourism and research and management.
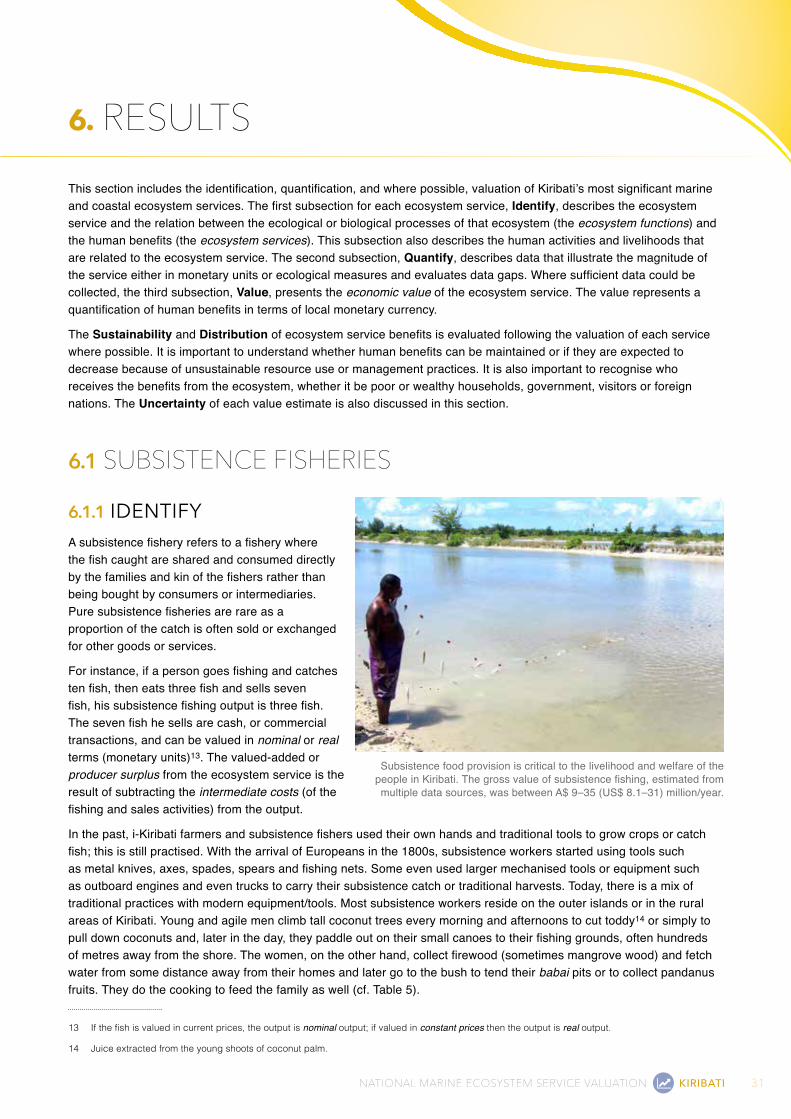
31NATIONAL MARINE ECOSYSTEM SERVICE VALUATION KIRIBATI
6. RESULTSThis section includes the identification, quantification, and where possible, valuation of Kiribati’s most significant marine and coastal ecosystem services. The first subsection for each ecosystem service, Identify, describes the ecosystem service and the relation between the ecological or biological processes of that ecosystem (the ecosystem functions) and the human benefits (the ecosystem services). This subsection also describes the human activities and livelihoods that are related to the ecosystem service. The second subsection, Quantify, describes data that illustrate the magnitude of the service either in monetary units or ecological measures and evaluates data gaps. Where sufficient data could be collected, the third subsection, Value, presents the economic value of the ecosystem service. The value represents a quantification of human benefits in terms of local monetary currency.
The Sustainability and Distribution of ecosystem service benefits is evaluated following the valuation of each service where possible. It is important to understand whether human benefits can be maintained or if they are expected to decrease because of unsustainable resource use or management practices. It is also important to recognise who receives the benefits from the ecosystem, whether it be poor or wealthy households, government, visitors or foreign nations. The Uncertainty of each value estimate is also discussed in this section.
6.1 SUBSISTENCE fIShERIES
6.1.1 IdEnTIFYA subsistence fishery refers to a fishery where the fish caught are shared and consumed directly by the families and kin of the fishers rather than being bought by consumers or intermediaries. Pure subsistence fisheries are rare as a proportion of the catch is often sold or exchanged for other goods or services.
For instance, if a person goes fishing and catches ten fish, then eats three fish and sells seven fish, his subsistence fishing output is three fish. The seven fish he sells are cash, or commercial transactions, and can be valued in nominal or real terms (monetary units)13. The valued-added or producer surplus from the ecosystem service is the result of subtracting the intermediate costs (of the fishing and sales activities) from the output.
In the past, i-Kiribati farmers and subsistence fishers used their own hands and traditional tools to grow crops or catch fish; this is still practised. With the arrival of Europeans in the 1800s, subsistence workers started using tools such as metal knives, axes, spades, spears and fishing nets. Some even used larger mechanised tools or equipment such as outboard engines and even trucks to carry their subsistence catch or traditional harvests. Today, there is a mix of traditional practices with modern equipment/tools. Most subsistence workers reside on the outer islands or in the rural areas of Kiribati. Young and agile men climb tall coconut trees every morning and afternoons to cut toddy14 or simply to pull down coconuts and, later in the day, they paddle out on their small canoes to their fishing grounds, often hundreds of metres away from the shore. The women, on the other hand, collect firewood (sometimes mangrove wood) and fetch water from some distance away from their homes and later go to the bush to tend their babai pits or to collect pandanus fruits. They do the cooking to feed the family as well (cf. Table 5).
13 If the fish is valued in current prices, the output is nominal output; if valued in constant prices then the output is real output.
14 Juice extracted from the young shoots of coconut palm.
Subsistence food provision is critical to the livelihood and welfare of the people in Kiribati. The gross value of subsistence fishing, estimated from multiple data sources, was between A$ 9–35 (US$ 8.1–31) million/year.
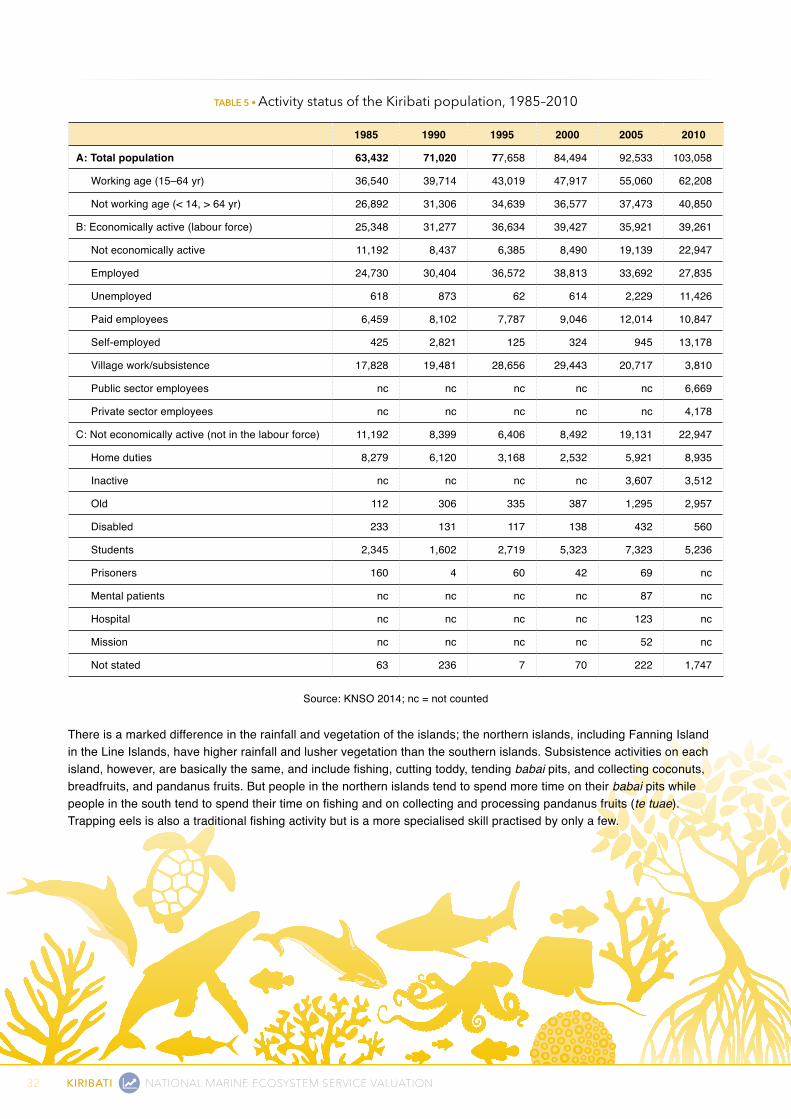
32 KIRIBATI NATIONAL MARINE ECOSYSTEM SERVICE VALUATION
TABLE 5 • Activity status of the Kiribati population, 1985–2010
1985 1990 1995 2000 2005 2010
A: Total population 63,432 71,020 77,658 84,494 92,533 103,058
Working age (15–64 yr) 36,540 39,714 43,019 47,917 55,060 62,208
Not working age (< 14, > 64 yr) 26,892 31,306 34,639 36,577 37,473 40,850
B: Economically active (labour force) 25,348 31,277 36,634 39,427 35,921 39,261
Not economically active 11,192 8,437 6,385 8,490 19,139 22,947
Employed 24,730 30,404 36,572 38,813 33,692 27,835
Unemployed 618 873 62 614 2,229 11,426
Paid employees 6,459 8,102 7,787 9,046 12,014 10,847
Self-employed 425 2,821 125 324 945 13,178
Village work/subsistence 17,828 19,481 28,656 29,443 20,717 3,810
Public sector employees nc nc nc nc nc 6,669
Private sector employees nc nc nc nc nc 4,178
C: Not economically active (not in the labour force) 11,192 8,399 6,406 8,492 19,131 22,947
Home duties 8,279 6,120 3,168 2,532 5,921 8,935
Inactive nc nc nc nc 3,607 3,512
Old 112 306 335 387 1,295 2,957
Disabled 233 131 117 138 432 560
Students 2,345 1,602 2,719 5,323 7,323 5,236
Prisoners 160 4 60 42 69 nc
Mental patients nc nc nc nc 87 nc
Hospital nc nc nc nc 123 nc
Mission nc nc nc nc 52 nc
Not stated 63 236 7 70 222 1,747
Source: KNSO 2014; nc = not counted
There is a marked difference in the rainfall and vegetation of the islands; the northern islands, including Fanning Island in the Line Islands, have higher rainfall and lusher vegetation than the southern islands. Subsistence activities on each island, however, are basically the same, and include fishing, cutting toddy, tending babai pits, and collecting coconuts, breadfruits, and pandanus fruits. But people in the northern islands tend to spend more time on their babai pits while people in the south tend to spend their time on fishing and on collecting and processing pandanus fruits (te tuae). Trapping eels is also a traditional fishing activity but is a more specialised skill practised by only a few.

33NATIONAL MARINE ECOSYSTEM SERVICE VALUATION KIRIBATI
6.1.2 METHOdOLOGYThe formula for the value-added or producer surplus of fishing is:
Value added = (Harvestkg • Price of fish$–kg)– Harvest Costs$
The important variables in the formula are the harvest amount (the amount of fish caught), and the market price of fish. The product of these two variables are multiplied is the gross value or gross output of the fisheries. The value-added is the gross value minus the harvest cost or the cost of fishing.
The total catch of fishing is separated into catch of different fish species because the different fished species do not have the same nutritional content nor do they have the same value or price. To separate subsistence from commercial output, the quantities of fish consumed, sold or wasted are calculated.
For the subsistence fisheries output, the nutritional content of the fish consumed would ideally be calculated, and the value of market substitutes for this content used to put monetary value on subsistence foods. For instance, if a canned mackerel provides the same nutritional value as the fish locally caught and consumed then the price of canned mackerel would be used to put a monetary value on the subsistence food. This method is recommended and used in some studies. However, in the case where the subsistence foods consumed are also sold in the market, more accurate prices are readily available so there is no need to work through the nutritional exercise. For instance, tuna is commonly sold in the local market and it is also one of the main subsistence foods consumed by people in Kiribati. Therefore the market price of tuna can be applied to the total subsistence catch to calculate the gross value of the subsistence fishing.
The challenge is to calculate the total amount of subsistence fish catch in the country. Monitoring and recording subsistence fish catch is difficult and in Kiribati the small and scattered islands make it uneconomical to collect such data, at least on a regular basis. Nevertheless, the government has fisheries officers on the outer islands who have been asked to collect such information. In this study, the information from the fisheries officers is used separately from the results of the HIES carried out in 2006.
6.1.3 MInISTRY OF FISHERIES dATA
6.1.3.1 QuAnTIFYAt the time of analysis the Ministry of Fisheries had provided data for five of the 22 inhabited islands (Table 6). It is important to note that this table refers to finfish only, excluding other marine foods such as seashells, octopus and lobsters.
TABLE 6 • Finfish consumption on five islands
Island Year Tota
l hou
seho
lds
Popu
latio
n
Num
ber o
f ho
useh
olds
sur
veye
d
Num
ber o
f peo
ple
surv
eyed
Tota
l con
sum
ptio
n of
fin
fish
(kg/
yr)
Hou
seho
ld a
vera
ge
cons
umpt
ion
(kg/
yr)
Per c
apita
ave
rage
co
nsum
ptio
n (k
g/yr
)
Per c
apita
ave
rage
co
nsum
ptio
n (p
ro
rata
)* (k
g/yr
)
Aranuka 2012 214 1,057 110 565 64,739 303 61 8
Butaritari 2012 630 4,346 212 1,125 371,677 590 86 24
Nikunau 2013 365 1,907 177 979 109,598 300 57 14
Tamana 2011 202 951 72 351 152,095 753 160 14
Beru 2012 449 2,099 230 1,053 116,549 260 56 14
Total/Average 1,860 10,360 801 4,073 814,658 441 84 74
Source: Ministry of Fisheries data 2014. *The pro rata figure is derived by multiplying the per capita average consumption by the relative weights, e.g. for Aranuka, (565/4073) X 61 = 8; for Beru, (1053/4073) X 56 = 14.
34 KIRIBATI NATIONAL MARINE ECOSYSTEM SERVICE VALUATION
The average per capita consumption of finfish per year in Kiribati is 84 kg. This is the simple arithmetic average of the five islands. The per capita consumption using a weighted average based on the island population is 74 kg. This figure is significantly higher than the world average of 16.4 kg (FAO 2008). Nevertheless, the figure is plausible because people in Kiribati eat fish almost daily. The calculated figures of 84 kg or 74 kg are consistent with the FAO Food Supply Balance sheet of 75 kg per capita per year.
The calculated per capita figure of 74 kg per year translates to 1.4 kg per week which, assuming a normal household size is 4–6 persons, means that each household would eat at least one tuna per week. We are assuming that a normal size tuna sold in the market weighs 3–6 kg.
The total population of Kiribati was 103,058 in 2010 (KNSO 2012). Using that figure, 7.63 million kg (or 7,626 tonnes) of finfish are consumed per year by the people of Kiribati.
6.1.3.2 VALuEAt the time of writing, the price of fish on South Tarawa (urban area) was A$ 2.80 per kg. Therefore the gross value of finfish consumed at home is estimated at A$ 21.35 million. At the outer islands price (A$ 1.40) the gross value of finfish consumption in the country would be A$ 10.68 million. This leads to a net economic value of A$ 9.6–19.2 million assuming fishing costs of about 10% of gross15.
The price of fish on the outer islands is much less than on South Tarawa—about half or a third. For instance flying fish (onauti) is sold for 50 cents each in South Tarawa but on the outer islands the price can be 30 cents or even less. Likewise a tuna worth A$ 30 in South Tarawa could be sold for A$ 10 or even less on the outer islands.
It would be more realistic to apply the price of fish on South Tarawa to the catch on South Tarawa only and for the outer islands to use the outer islands price but there is no catch data for South Tarawa alone, i.e. the total catch estimated is extrapolated for the whole country.
In the calculation above, only finfish is considered. Most i-Kiribati households consume invertebrates as well as finfish, including bivalves, squid, octopus and lobsters. Thus the true value of seafood consumed at home is significantly higher than these estimates.
To determine the value of subsistence fishing, that is seafood products caught and consumed at home, expenditure on fish and invertebrates purchased at stores and roadside stalls would need to be subtracted from the gross value of seafood consumed. Unfortunately this data was not available. A combination of detailed harvest and consumption data would facilitate a precise calculation of the value of subsistence fishing. The HIES could be improved to collect this data. If we assume, arbitrarily16, that 50% of finfish consumption comes from self-caught finfish, the value of subsistence finfish would be A$ 5.4–10.7 million per year (depending on fish prices which vary between urban and rural areas). The net economic value would be about A$ 4.8–9.6 million per year (90% of gross).
The value of A$ ~10–19 million derived from Ministry of Fisheries data is lower than the figure of A$ 34 million (A$ 38.5 million in 2013 prices) quoted from Gillet (2009) by Campbell and Hanich (2014). The Gillett (2009) estimate seems high, perhaps because it estimates consumption of about 135 kg of fish per person per year using urban fish prices. As noted by these authors, the subsistence catch data are uncertain and much is out-of-date.
The difference in the value from different sources is also due to the different scope and coverage of the surveys and the islands covered.
15 There is very little cost involved in subsistence fishing since the activity depends very much on manual labour, which has negligible opportunity cost, and therefore we can assign just 10% of the gross value as the fishing costs leaving 90% as the value-added or producer surplus. This 10% will include the costs of fishing hooks, fishing lines, etc.
16 An estimate of the amount of seafood purchased versus caught could not be located for Kiribati, but Bell et al. (2009) estimated for rural households in Fiji that 52% of seafood consumption came from subsistence.
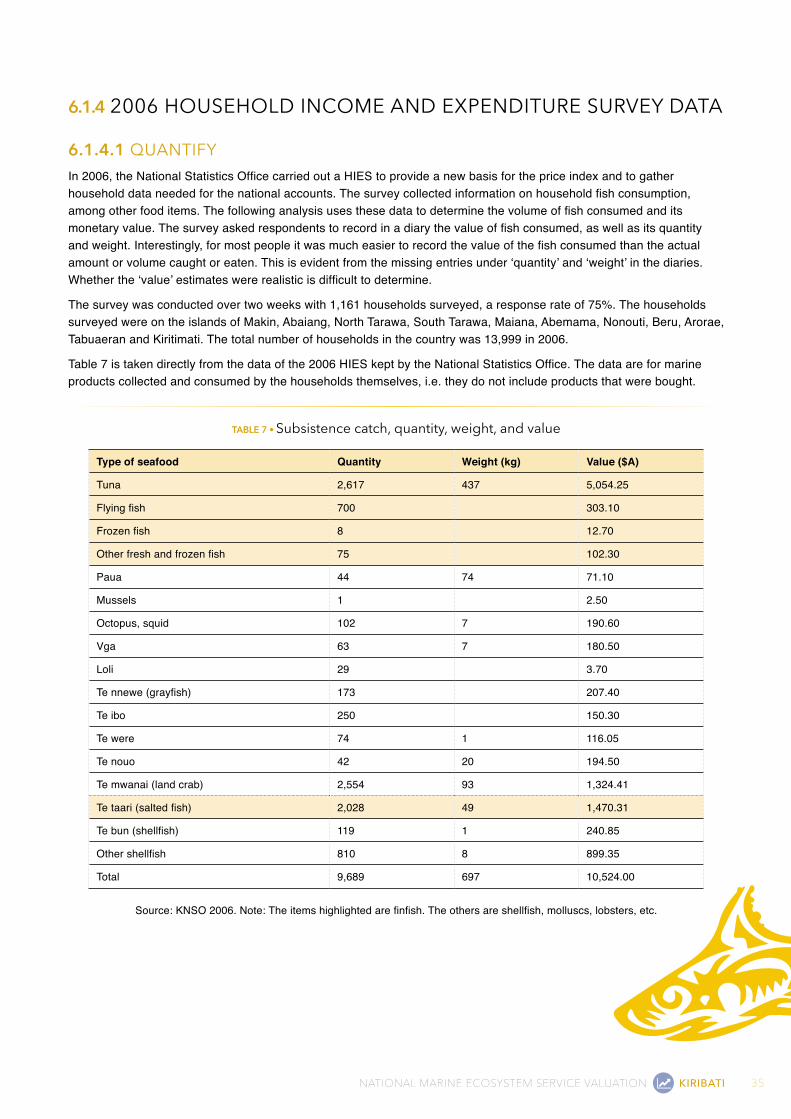
35NATIONAL MARINE ECOSYSTEM SERVICE VALUATION KIRIBATI
6.1.4 2006 HOuSEHOLd InCOME And EXPEndITuRE SuRVEY dATA
6.1.4.1 QuAnTIFYIn 2006, the National Statistics Office carried out a HIES to provide a new basis for the price index and to gather household data needed for the national accounts. The survey collected information on household fish consumption, among other food items. The following analysis uses these data to determine the volume of fish consumed and its monetary value. The survey asked respondents to record in a diary the value of fish consumed, as well as its quantity and weight. Interestingly, for most people it was much easier to record the value of the fish consumed than the actual amount or volume caught or eaten. This is evident from the missing entries under ‘quantity’ and ‘weight’ in the diaries. Whether the ‘value’ estimates were realistic is difficult to determine.
The survey was conducted over two weeks with 1,161 households surveyed, a response rate of 75%. The households surveyed were on the islands of Makin, Abaiang, North Tarawa, South Tarawa, Maiana, Abemama, Nonouti, Beru, Arorae, Tabuaeran and Kiritimati. The total number of households in the country was 13,999 in 2006.
Table 7 is taken directly from the data of the 2006 HIES kept by the National Statistics Office. The data are for marine products collected and consumed by the households themselves, i.e. they do not include products that were bought.
TABLE 7 • Subsistence catch, quantity, weight, and value
Type of seafood Quantity Weight (kg) Value ($A)
Tuna 2,617 437 5,054.25
Flying fish 700 303.10
Frozen fish 8 12.70
Other fresh and frozen fish 75 102.30
Paua 44 74 71.10
Mussels 1 2.50
Octopus, squid 102 7 190.60
Vga 63 7 180.50
Loli 29 3.70
Te nnewe (grayfish) 173 207.40
Te ibo 250 150.30
Te were 74 1 116.05
Te nouo 42 20 194.50
Te mwanai (land crab) 2,554 93 1,324.41
Te taari (salted fish) 2,028 49 1,470.31
Te bun (shellfish) 119 1 240.85
Other shellfish 810 8 899.35
Total 9,689 697 10,524.00
Source: KNSO 2006. Note: The items highlighted are finfish. The others are shellfish, molluscs, lobsters, etc.
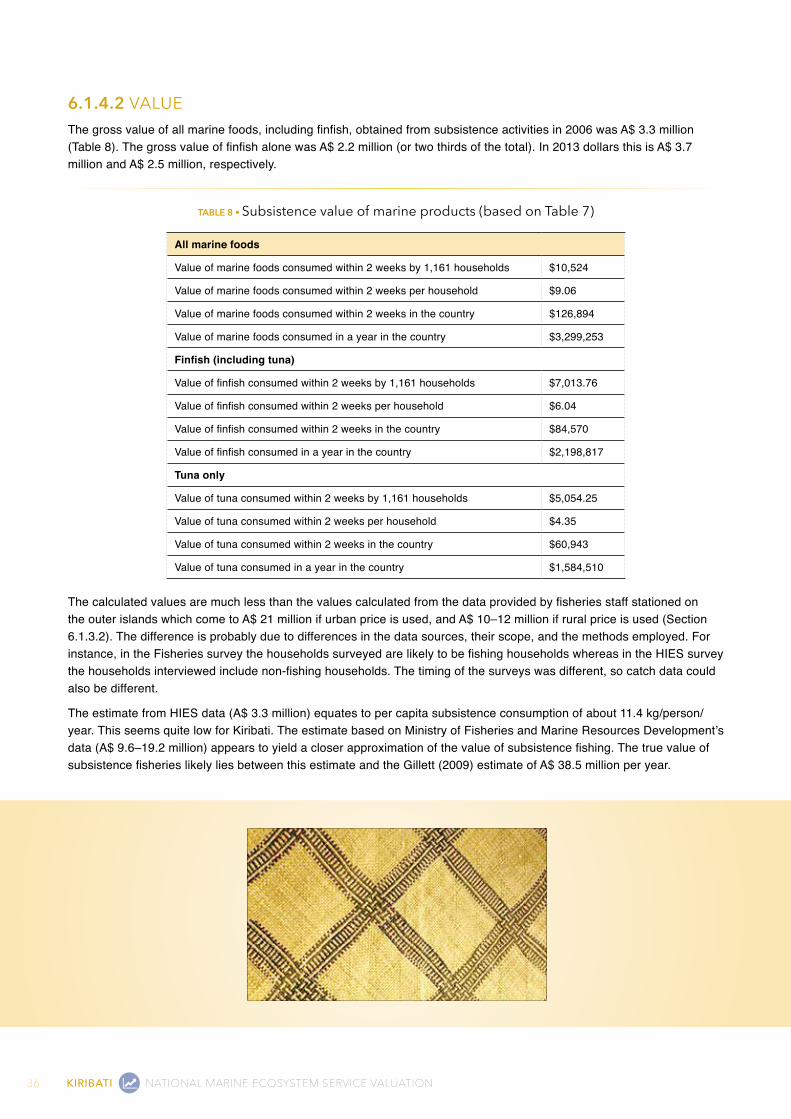
36 KIRIBATI NATIONAL MARINE ECOSYSTEM SERVICE VALUATION
6.1.4.2 VALuEThe gross value of all marine foods, including finfish, obtained from subsistence activities in 2006 was A$ 3.3 million (Table 8). The gross value of finfish alone was A$ 2.2 million (or two thirds of the total). In 2013 dollars this is A$ 3.7 million and A$ 2.5 million, respectively.
TABLE 8 • Subsistence value of marine products (based on Table 7)
All marine foods
Value of marine foods consumed within 2 weeks by 1,161 households $10,524
Value of marine foods consumed within 2 weeks per household $9.06
Value of marine foods consumed within 2 weeks in the country $126,894
Value of marine foods consumed in a year in the country $3,299,253
Finfish (including tuna)
Value of finfish consumed within 2 weeks by 1,161 households $7,013.76
Value of finfish consumed within 2 weeks per household $6.04
Value of finfish consumed within 2 weeks in the country $84,570
Value of finfish consumed in a year in the country $2,198,817
Tuna only
Value of tuna consumed within 2 weeks by 1,161 households $5,054.25
Value of tuna consumed within 2 weeks per household $4.35
Value of tuna consumed within 2 weeks in the country $60,943
Value of tuna consumed in a year in the country $1,584,510
The calculated values are much less than the values calculated from the data provided by fisheries staff stationed on the outer islands which come to A$ 21 million if urban price is used, and A$ 10–12 million if rural price is used (Section 6.1.3.2). The difference is probably due to differences in the data sources, their scope, and the methods employed. For instance, in the Fisheries survey the households surveyed are likely to be fishing households whereas in the HIES survey the households interviewed include non-fishing households. The timing of the surveys was different, so catch data could also be different.
The estimate from HIES data (A$ 3.3 million) equates to per capita subsistence consumption of about 11.4 kg/person/year. This seems quite low for Kiribati. The estimate based on Ministry of Fisheries and Marine Resources Development’s data (A$ 9.6–19.2 million) appears to yield a closer approximation of the value of subsistence fishing. The true value of subsistence fisheries likely lies between this estimate and the Gillett (2009) estimate of A$ 38.5 million per year.
37NATIONAL MARINE ECOSYSTEM SERVICE VALUATION KIRIBATI
6.2 COMMERCIAL fIShERIES6.2.1 IdEnTIFYCommercial fishing refers to fishing (or collecting seafood) for sale and industrial output from larger fishing vessels, mostly foreign fishing vessels fishing in Kiribati EEZ.
Domestic commercial fishing (artisanal fishing) involves fishers going out on boats (generally less than 6 metres, some aluminium but most wooden) with outboard motors, typically in groups of three or four. Most artisanal fishers operate out of South Tarawa. There 126 full-time commercial fishing boats and 88 part-time commercial fishing boats (Campbell and Hanich 2014). The fishers usually fish between Maiana and Tarawa and sometimes around Abaiang — these two islands are closest to Tarawa. Most boats use 40 horsepower engines and the cost of fuel is a constraint for fishers. On average, one boat uses 40 to 60 litres of fuel per fishing trip, equivalent to A$ 50–70 per trip. The high cost of fuel means that the fishers need to catch a minimum number of tuna before they earn a profit. It is very easy to make a loss, and some fishers lose their boats and engines to the bank after defaulting on their debt payment.
The most common diet of the Kiribati people these days is fish and rice. Rice is imported but fish is locally caught. In the past, coconuts, breadfruits, and babai (swamp taro), would be eaten with fish but are more difficult to obtain now because of the increasing population and the lack of suitable land for agriculture. Most people in Kiribati, especially the younger generation, prefer to eat rice over local foods. In times of rice shortage, which occasionally happens, people, including those on the outer islands, complain and ask the government to intervene. Rice shortage in Kiribati is a crisis and the Ministry of Commerce has been assigned to monitor rice imports and distribution to ensure continuity of rice supply.
6.2.2 METHOdOLOGYThe estimate of how much fish is obtained from the Kiribati ecosystem and exchanged for cash includes household-level production and industrial production. Therefore, the analysis is split into household-level and industrial estimates; together they constitute the total catch of commercial fishing in Kiribati. The market price is applied to this catch data to obtain gross output of commercial fisheries, then the relevant operating costs are subtracted to calculate the value-added or producer surplus.
6.2.3 HOuSEHOLd-LEVEL PROduCTIOn
6.2.3.1 QuAnTIFYFor this exercise we used the 2006 HIES data on consumption. Household members reported what they consumed and how much was obtained through subsistence means vs purchased with cash. The survey did not ask specifically about production or the amount of fish caught. That is, what we know from the survey is the amount of fish bought by households. The bulk of this comes from artisanal fishers who sell their catch to households as well as to institutions and businesses.
The marine foods purchased with cash constitute the bulk of the output of artisanal commercial fishers. How much is sold to institutions and businesses is not known so the output calculated is an underestimate. This analysis assumes that all fresh fish bought in the shops originated from artisanal fishers. Therefore the total amount of fish bought by households for consumption purposes is assumed to be the same as the total output of artisanal fishers. The CPPL and the KFL sell fresh fish to local people, but these companies buy from local fishers as well. Therefore, the assumption is reasonable.
There is very little fresh fish imported to Kiribati. However, people in Kiribati like canned or tinned mackerel (te taman) as well. So when there is a shortage of local fish, say because of prolonged bad weather, or because of a fuel shortage, people buy canned fish. In 2010, the value of canned fish imports was a half million dollars with an estimated unit value of over A$ 8 per kg free-on-board (FOB)17 (Table 9). This unit price is four times the price of local fish and is much higher than the price found in the shops. This could mean that the weight of canned fish items may have been underestimated or it may be that the FOB price is overestimated. From experience, it is likely the weight has been underestimated because customs duty is based on value and, therefore, there will be more effort to make sure the price or value is correct. Regardless, the price of canned fish is still relatively expensive; nonetheless some people still prefer it over fresh, local fish. To some, it is a delicacy or a treat to eat canned mackerel.
17 Excludes freight and insurance costs.
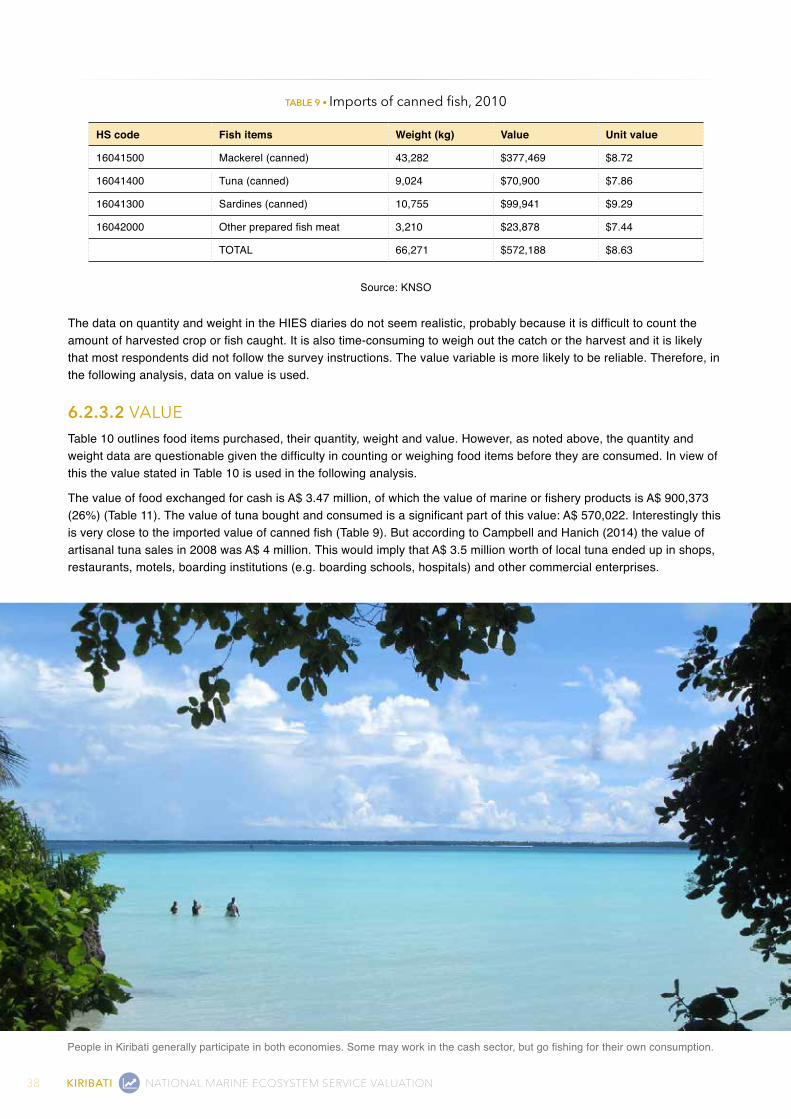
38 KIRIBATI NATIONAL MARINE ECOSYSTEM SERVICE VALUATION
TABLE 9 • Imports of canned fish, 2010
HS code Fish items Weight (kg) Value Unit value
16041500 Mackerel (canned) 43,282 $377,469 $8.72
16041400 Tuna (canned) 9,024 $70,900 $7.86
16041300 Sardines (canned) 10,755 $99,941 $9.29
16042000 Other prepared fish meat 3,210 $23,878 $7.44
TOTAL 66,271 $572,188 $8.63
Source: KNSO
The data on quantity and weight in the HIES diaries do not seem realistic, probably because it is difficult to count the amount of harvested crop or fish caught. It is also time-consuming to weigh out the catch or the harvest and it is likely that most respondents did not follow the survey instructions. The value variable is more likely to be reliable. Therefore, in the following analysis, data on value is used.
6.2.3.2 VALuETable 10 outlines food items purchased, their quantity, weight and value. However, as noted above, the quantity and weight data are questionable given the difficulty in counting or weighing food items before they are consumed. In view of this the value stated in Table 10 is used in the following analysis.
The value of food exchanged for cash is A$ 3.47 million, of which the value of marine or fishery products is A$ 900,373 (26%) (Table 11). The value of tuna bought and consumed is a significant part of this value: A$ 570,022. Interestingly this is very close to the imported value of canned fish (Table 9). But according to Campbell and Hanich (2014) the value of artisanal tuna sales in 2008 was A$ 4 million. This would imply that A$ 3.5 million worth of local tuna ended up in shops, restaurants, motels, boarding institutions (e.g. boarding schools, hospitals) and other commercial enterprises.
People in Kiribati generally participate in both economies. Some may work in the cash sector, but go fishing for their own consumption.

39NATIONAL MARINE ECOSYSTEM SERVICE VALUATION KIRIBATI
TABLE 10 • Local foods purchased or exchanged for cash
Item Category Quantity Weight (kg) Value ($A)
Coconut Fruit 435 41 304.06
Bananas Fruit 205 61.90
Coconut (drinking nut) Fruit 18 13.80
Coconut (dry nut) Fruit 5 70.20
Lemons Fruit 1 1.00
Pawpaws Fruit 32 10 41.70
Pandanus fruit Fruit 53 26.00
Breadfruit Fruit 321 4 312.80
Te bekei Fruit 27 4 29.50
Te buatoro Fruit 1 1.50
Lu (taro leaves) Vegetables 31 2.40
Cucumber Vegetables 9 15.00
Pumpkin Vegetables 71 4 134.60
Other fresh vegetables Vegetables 91 1 68.40
Vegetables Vegetables 13 27.15
Pork (fresh) Meat and meat products 239 407.55
Tuna Fish and shellfish 1059 190 1,818.25
Flying fish Fish and shellfish 214 107.00
Paua Fish and shellfish 44 74 71.10
Octopus, squid Fish and shellfish 6 31.00
Vga Fish and shellfish 21 12.00
Loli Fish and shellfish 29 3.70
Te nnewe Fish and shellfish 85 91.40
Te ibo Fish and shellfish 15 6.30
Te were Fish and shellfish 21 1 14.30
Te nouo Fish and shellfish 2 16.00
Te mwanai Fish and shellfish 119 69.70
Te taari Fish and shellfish 843 17 547.20
Te bun Fish and shellfish 47 19.00
Other shellfish Fish and shellfish 316 68.70
Toddy Other foods 331 0 294.60
Kamimai Other foods 37 89.0
Te beneka Other foods 62 1 48.50
Kaokioki Alcohol 43 95.40
Fish* Take-aways and food eaten outside the home 5,683 584 6,161.55
Fish total (excluding Fish*) Fish and marine items 2,821 282 2,876
Total All foods 10,529 934 11,082
Source: KNSO 2006. *The fish in Table 10 that is eaten as take-away food or outside the home includes rice or chips and so is not just fish and, therefore, is not included in the analysis. This contributes to underestimation of the value of local commercial fisheries.
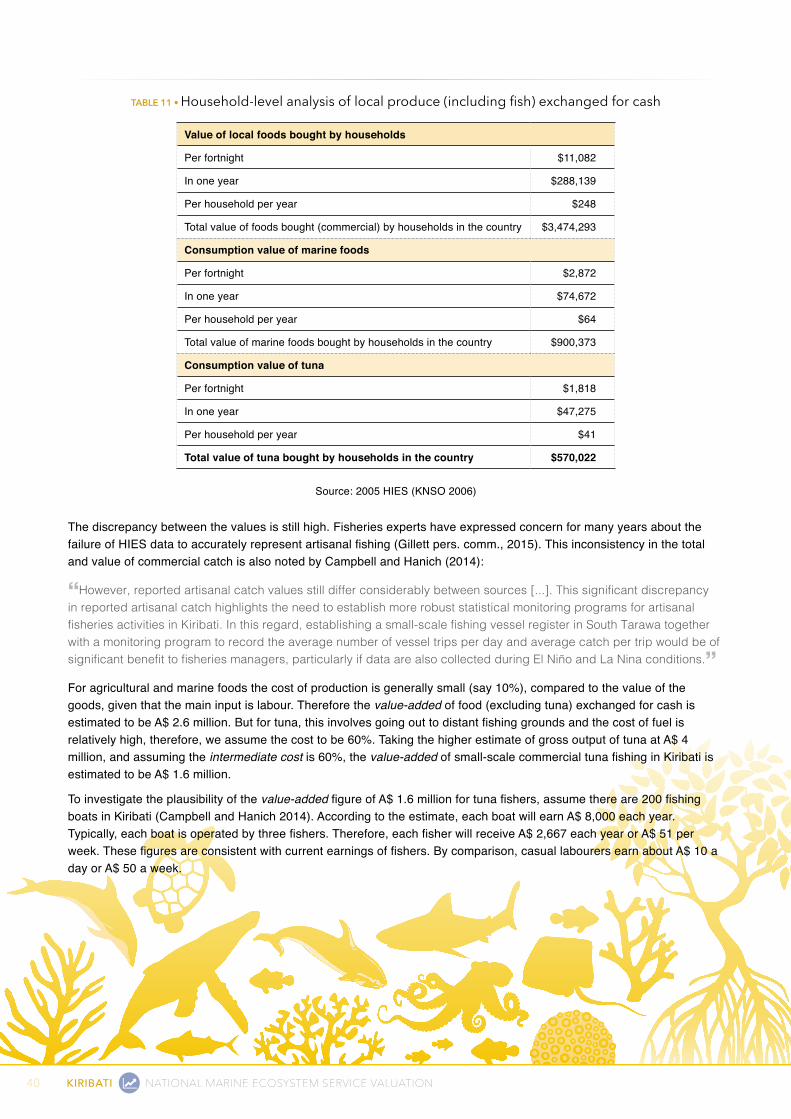
40 KIRIBATI NATIONAL MARINE ECOSYSTEM SERVICE VALUATION
TABLE 11 • Household-level analysis of local produce (including fish) exchanged for cash
Value of local foods bought by households
Per fortnight $11,082
In one year $288,139
Per household per year $248
Total value of foods bought (commercial) by households in the country $3,474,293
Consumption value of marine foods
Per fortnight $2,872
In one year $74,672
Per household per year $64
Total value of marine foods bought by households in the country $900,373
Consumption value of tuna
Per fortnight $1,818
In one year $47,275
Per household per year $41
Total value of tuna bought by households in the country $570,022
Source: 2005 HIES (KNSO 2006)
The discrepancy between the values is still high. Fisheries experts have expressed concern for many years about the failure of HIES data to accurately represent artisanal fishing (Gillett pers. comm., 2015). This inconsistency in the total and value of commercial catch is also noted by Campbell and Hanich (2014):
“However, reported artisanal catch values still differ considerably between sources [...]. This significant discrepancy in reported artisanal catch highlights the need to establish more robust statistical monitoring programs for artisanal fisheries activities in Kiribati. In this regard, establishing a small-scale fishing vessel register in South Tarawa together with a monitoring program to record the average number of vessel trips per day and average catch per trip would be of significant benefit to fisheries managers, particularly if data are also collected during El Niño and La Nina conditions.”For agricultural and marine foods the cost of production is generally small (say 10%), compared to the value of the goods, given that the main input is labour. Therefore the value-added of food (excluding tuna) exchanged for cash is estimated to be A$ 2.6 million. But for tuna, this involves going out to distant fishing grounds and the cost of fuel is relatively high, therefore, we assume the cost to be 60%. Taking the higher estimate of gross output of tuna at A$ 4 million, and assuming the intermediate cost is 60%, the value-added of small-scale commercial tuna fishing in Kiribati is estimated to be A$ 1.6 million.
To investigate the plausibility of the value-added figure of A$ 1.6 million for tuna fishers, assume there are 200 fishing boats in Kiribati (Campbell and Hanich 2014). According to the estimate, each boat will earn A$ 8,000 each year. Typically, each boat is operated by three fishers. Therefore, each fisher will receive A$ 2,667 each year or A$ 51 per week. These figures are consistent with current earnings of fishers. By comparison, casual labourers earn about A$ 10 a day or A$ 50 a week.
41NATIONAL MARINE ECOSYSTEM SERVICE VALUATION KIRIBATI
6.2.4 InduSTRIAL FISHERIES OuTPuT
6.2.4.1 IdEnTIFYThere are very few factories or businesses in Kiribati catching or harvesting fishery products to sell in the market. The few that exist are the Central Pacific Producers Limited (CPPL), the government-owned fishing company, Kiribati Fish Limited (KFL), a joint fishing venture (China, Fiji, and Kiribati), and the KAO company, a joint venture between Otoshiro fishing company and the Kiribati Government. Another joint venture is between Kiribati and Taichin from Japan. In addition to these joint ventures, Kiribati issues fishing licences to foreign vessels to fish in the Kiribati EEZ. The licence value is between 4% and 13% (average 7%) of the value of the total catch when the foreign vessels sell their catch overseas.
Kiribati fishing venturesThe CPPL is not actually involved in fishing because it does not have its own fishing vessels18. The company relies on local fishers to supply fish and on the undersized tuna offloaded by foreign fishing vessels anchored at Betio. This company was created in 2001 after TeMautari Ltd., the first government-owned fishing company, was closed down. The CPPL in fact was set up to replace the functions and services of three fishing enterprises, all government-owned: TeMautari Ltd, the Kiritimati Marine Export Ltd (KMEL) and the Outer Islands Fishing Project (Barclay and Cartwright, 2007). CPPL has a branch on Kiritimati Island which sells fish to the local community and exports some to Hawaii. The main problem with the Christmas Island operation is the rudimentary nature and uncertainty of the airline connection to Hawaii. This transport problem also faced the KMEL before it was merged with CPPL.
The KAO company, a joint venture between the Kiribati Government and Otoshiro fishing company (from Japan), started in 1994 and has one vessel, but after 10 years or so there was hardly any contact with the vessel (Barclay and Cartwright 2007). The other joint venture, between Taichin Ltd and the Kiribati Government, started in 2010 and has been silent since the launch. There have certainly been no dividends received so far.
The KFL is a new company but has already started selling fish locally and abroad. The processing facility is located on Betio and has retail outlets on Betio and on South Tarawa. There are 100 locals working for the company and 50 boat owners supplying fish to the company19. The foreign partners in this company have fishing vessels and good connections to overseas markets. At the moment the company has four long-liners employing 30 locals as crew; the number may go up when two more long-liners join the fleet in the future. There is convincing evidence that the company will generate more employment and value-added in the future.
distant Water Fishing nation vesselsMost of the tuna fishing in Kiribati is carried out by fishing vessels that come from outside the Pacific Island countries. These are called Distant Water Fishing Nations vessels.
6.2.4.2 QuAnTIFYThere are hundreds of foreign fishing vessels fishing in Kiribati EEZ, and most, if not all, fish for tuna20. There has been a significant increase in the number of fishing vessels over the years. In 2005 there were 99 purse seiners and 162 long-liners 162 (a total of 261 fishing vessels; Barclay and Cartwright 2007). Their catch in 2004 was 47,795 and 6,273 tonnes, respectively. In 2007 the number of purse seiners increased to 171, long-liners to 160, and six pole-and-line vessels joined the tuna fleet (a total of 337 vessels; Campbell and Hanich 2014). Four years later (2011) the number of fishing vessels increased further to 195 purse seiners, 256 long-liners and four pole-and-line vessels, a total of 455 vessels (Campbell and Hanich 2014). The total catch and value is provided in Appendix III: Tuna catch by national waters: 1997–2013. Catch data for Papua New Guinea (PNG) and the Solomon Islands are shown for comparative purposes.
18 The company used to have a craft (a canoe type vessel but larger), called Tekokona, but it was mainly used as a trial vessel until it was decommissioned.
19 These figures are taken from a paper provided by the Environment and Conservation Division, MELAD.
20 There are four main species of tuna caught in the Kiribati waters: skipjack (76%), yellowfin (16%), bigeye (8%), and albacore (< 1%).

42 KIRIBATI NATIONAL MARINE ECOSYSTEM SERVICE VALUATION
The annual average tuna catch in Kiribati waters in the last ten years was 260,000 tonnes and the average value was US$ 470 million. In the last five years, the annual average increased to 330,000 tonnes21 with a value of US$ 660 million. The volume of catch has substantially increased in recent years commensurate with the increase in the number of fishing vessels (Figure 6).
FigurE 6 • Tuna catch by national waters, 1997–2013. Source: FFA (see Appendix III: Tuna catch by national waters: 1997–2013). note: The sub-total refers to the regional sub-total.
The direction of change of the total catch in Kiribati waters is opposite to that of PNG and to some extent the Solomon Islands (Figure 6). For instance, in 2000 the catch in Kiribati waters decreased to 151,652 tonnes but in PNG waters the catch increased to 276,480 tonnes but in 2001 the catch in Kiribati waters increased to 281,077 tonnes while in PNG waters the catch declined to 164,428 tonnes. This pattern occurred again in 2010, when the catch in Kiribati waters decreased to 232,010 tonnes while the catch in PNG sharply increased to 715,051 tonnes. The peaks in catch in Kiribati have an interval of between 3 and 5 years, closely following the El Niño climate pattern in the Pacific. If this cycle continues into the future, a decline in catch is expected. The income from fishing licences fluctuates significantly depending on the El Niño effect.
6.2.4.3 VALuETuna catch in Kiribati waters has steadily increased in the last five years with an average annual catch of 330,000 t and an average annual value of US$ 660 million (Figure 7).
The operating costs of foreign fishing vessels are not known. However, given that the vessels consume a large amount of fuel and rely on powerful and quality equipment, we assume that the intermediate cost of operating and maintaining purse seiners is relatively high, say 60% of the gross output. Therefore the value-added of the fishing companies is approximately US$ 264 million per year.
In addition to the value-added of the foreign fishing companies, which largely accrues outside the country, the Kiribati Government receives revenue from selling fishing licences each year. The average value of the licences in the last five years was US$ 50 million (A$ 55.5 million), approximately one third of the country’s GDP and half of the government’s annual budget. In previous years the average licence fee was A$ 20–40 million. In recent years the fee has significantly increased to almost A$ 100 million. This is due to favourable weather patterns and the fact that the cost of vessel days to the foreign fishing vessels has increased considerably recently.
21 This is somewhat consistent with Campbell and Hanich (2014) average figure of 320,730 metric tonnes.
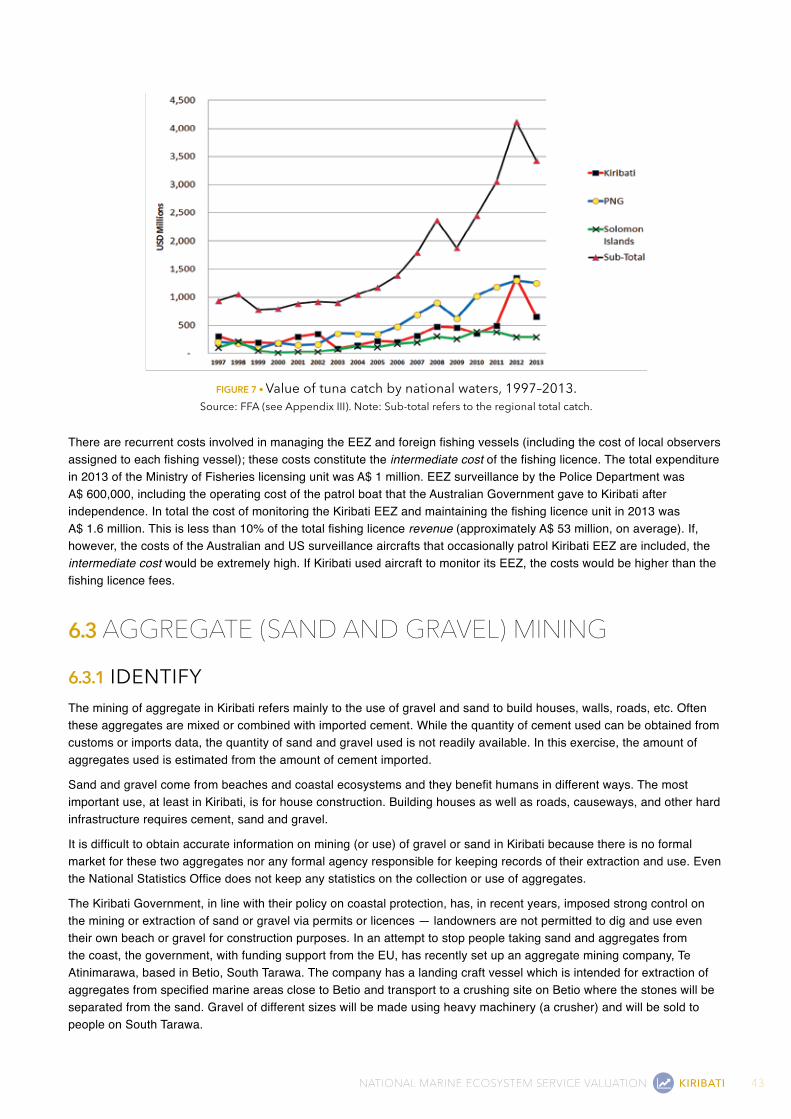
43NATIONAL MARINE ECOSYSTEM SERVICE VALUATION KIRIBATI
FigurE 7 • Value of tuna catch by national waters, 1997–2013. Source: FFA (see Appendix III). note: Sub-total refers to the regional total catch.
There are recurrent costs involved in managing the EEZ and foreign fishing vessels (including the cost of local observers assigned to each fishing vessel); these costs constitute the intermediate cost of the fishing licence. The total expenditure in 2013 of the Ministry of Fisheries licensing unit was A$ 1 million. EEZ surveillance by the Police Department was A$ 600,000, including the operating cost of the patrol boat that the Australian Government gave to Kiribati after independence. In total the cost of monitoring the Kiribati EEZ and maintaining the fishing licence unit in 2013 was A$ 1.6 million. This is less than 10% of the total fishing licence revenue (approximately A$ 53 million, on average). If, however, the costs of the Australian and US surveillance aircrafts that occasionally patrol Kiribati EEZ are included, the intermediate cost would be extremely high. If Kiribati used aircraft to monitor its EEZ, the costs would be higher than the fishing licence fees.
6.3 AggREgATE (SANd ANd gRAVEL) MININg
6.3.1 IdEnTIFYThe mining of aggregate in Kiribati refers mainly to the use of gravel and sand to build houses, walls, roads, etc. Often these aggregates are mixed or combined with imported cement. While the quantity of cement used can be obtained from customs or imports data, the quantity of sand and gravel used is not readily available. In this exercise, the amount of aggregates used is estimated from the amount of cement imported.
Sand and gravel come from beaches and coastal ecosystems and they benefit humans in different ways. The most important use, at least in Kiribati, is for house construction. Building houses as well as roads, causeways, and other hard infrastructure requires cement, sand and gravel.
It is difficult to obtain accurate information on mining (or use) of gravel or sand in Kiribati because there is no formal market for these two aggregates nor any formal agency responsible for keeping records of their extraction and use. Even the National Statistics Office does not keep any statistics on the collection or use of aggregates.
The Kiribati Government, in line with their policy on coastal protection, has, in recent years, imposed strong control on the mining or extraction of sand or gravel via permits or licences — landowners are not permitted to dig and use even their own beach or gravel for construction purposes. In an attempt to stop people taking sand and aggregates from the coast, the government, with funding support from the EU, has recently set up an aggregate mining company, Te Atinimarawa, based in Betio, South Tarawa. The company has a landing craft vessel which is intended for extraction of aggregates from specified marine areas close to Betio and transport to a crushing site on Betio where the stones will be separated from the sand. Gravel of different sizes will be made using heavy machinery (a crusher) and will be sold to people on South Tarawa.
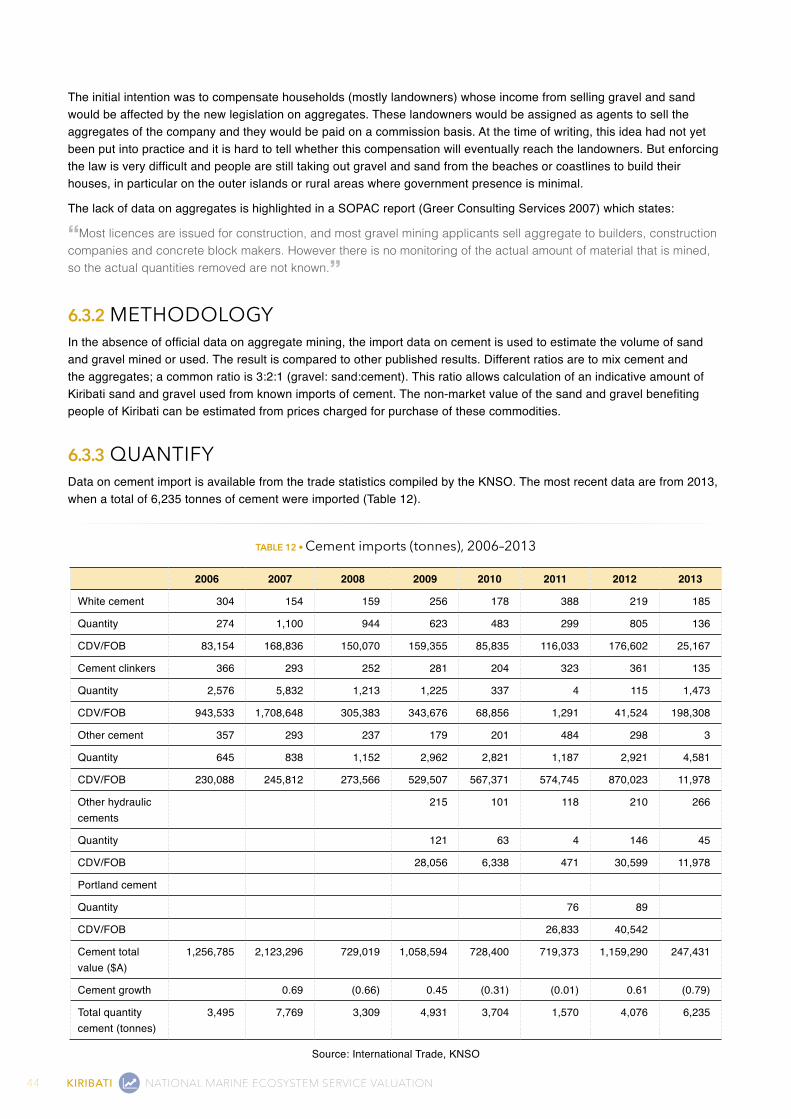
44 KIRIBATI NATIONAL MARINE ECOSYSTEM SERVICE VALUATION
The initial intention was to compensate households (mostly landowners) whose income from selling gravel and sand would be affected by the new legislation on aggregates. These landowners would be assigned as agents to sell the aggregates of the company and they would be paid on a commission basis. At the time of writing, this idea had not yet been put into practice and it is hard to tell whether this compensation will eventually reach the landowners. But enforcing the law is very difficult and people are still taking out gravel and sand from the beaches or coastlines to build their houses, in particular on the outer islands or rural areas where government presence is minimal.
The lack of data on aggregates is highlighted in a SOPAC report (Greer Consulting Services 2007) which states:
“Most licences are issued for construction, and most gravel mining applicants sell aggregate to builders, construction companies and concrete block makers. However there is no monitoring of the actual amount of material that is mined, so the actual quantities removed are not known.”
6.3.2 METHOdOLOGYIn the absence of official data on aggregate mining, the import data on cement is used to estimate the volume of sand and gravel mined or used. The result is compared to other published results. Different ratios are to mix cement and the aggregates; a common ratio is 3:2:1 (gravel: sand:cement). This ratio allows calculation of an indicative amount of Kiribati sand and gravel used from known imports of cement. The non-market value of the sand and gravel benefiting people of Kiribati can be estimated from prices charged for purchase of these commodities.
6.3.3 QuAnTIFYData on cement import is available from the trade statistics compiled by the KNSO. The most recent data are from 2013, when a total of 6,235 tonnes of cement were imported (Table 12).
TABLE 12 • Cement imports (tonnes), 2006–2013
2006 2007 2008 2009 2010 2011 2012 2013
White cement 304 154 159 256 178 388 219 185
Quantity 274 1,100 944 623 483 299 805 136
CDV/FOB 83,154 168,836 150,070 159,355 85,835 116,033 176,602 25,167
Cement clinkers 366 293 252 281 204 323 361 135
Quantity 2,576 5,832 1,213 1,225 337 4 115 1,473
CDV/FOB 943,533 1,708,648 305,383 343,676 68,856 1,291 41,524 198,308
Other cement 357 293 237 179 201 484 298 3
Quantity 645 838 1,152 2,962 2,821 1,187 2,921 4,581
CDV/FOB 230,088 245,812 273,566 529,507 567,371 574,745 870,023 11,978
Other hydraulic cements
215 101 118 210 266
Quantity 121 63 4 146 45
CDV/FOB 28,056 6,338 471 30,599 11,978
Portland cement
Quantity 76 89
CDV/FOB 26,833 40,542
Cement total value ($A)
1,256,785 2,123,296 729,019 1,058,594 728,400 719,373 1,159,290 247,431
Cement growth 0.69 (0.66) 0.45 (0.31) (0.01) 0.61 (0.79)
Total quantity cement (tonnes)
3,495 7,769 3,309 4,931 3,704 1,570 4,076 6,235
Source: International Trade, KNSO
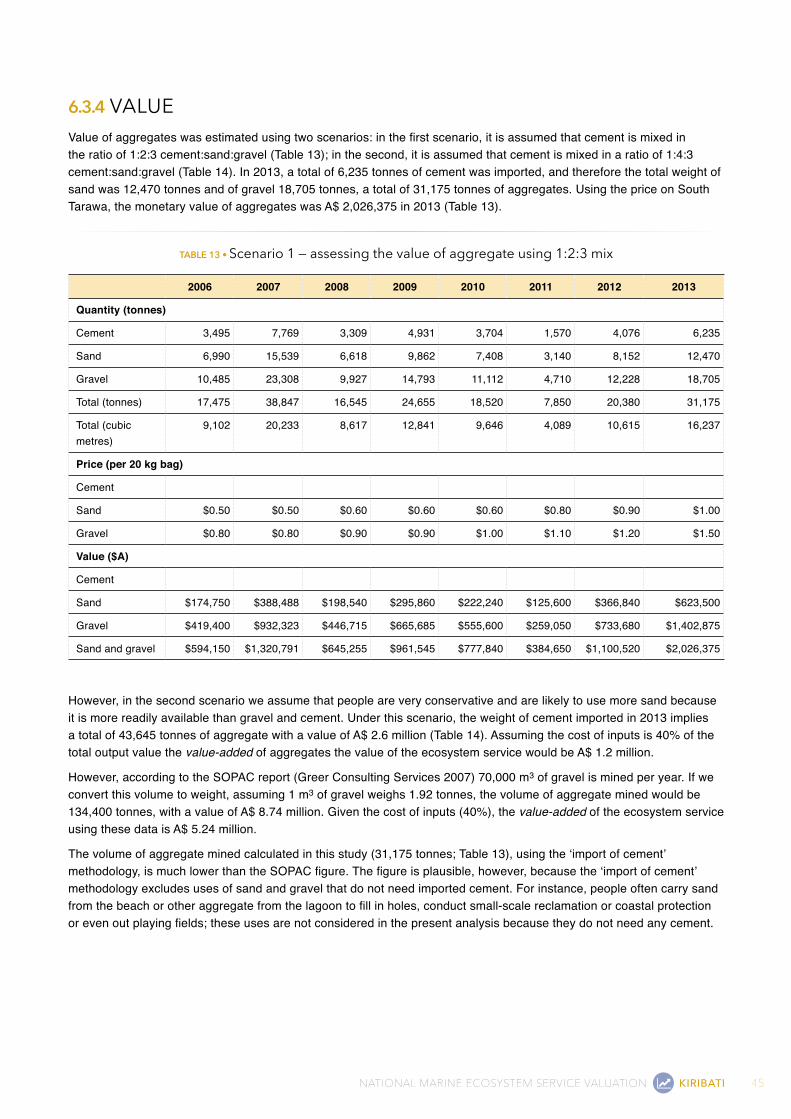
45NATIONAL MARINE ECOSYSTEM SERVICE VALUATION KIRIBATI
6.3.4 VALuEValue of aggregates was estimated using two scenarios: in the first scenario, it is assumed that cement is mixed in the ratio of 1:2:3 cement:sand:gravel (Table 13); in the second, it is assumed that cement is mixed in a ratio of 1:4:3 cement:sand:gravel (Table 14). In 2013, a total of 6,235 tonnes of cement was imported, and therefore the total weight of sand was 12,470 tonnes and of gravel 18,705 tonnes, a total of 31,175 tonnes of aggregates. Using the price on South Tarawa, the monetary value of aggregates was A$ 2,026,375 in 2013 (Table 13).
TABLE 13 • Scenario 1 — assessing the value of aggregate using 1:2:3 mix
2006 2007 2008 2009 2010 2011 2012 2013
Quantity (tonnes)
Cement 3,495 7,769 3,309 4,931 3,704 1,570 4,076 6,235
Sand 6,990 15,539 6,618 9,862 7,408 3,140 8,152 12,470
Gravel 10,485 23,308 9,927 14,793 11,112 4,710 12,228 18,705
Total (tonnes) 17,475 38,847 16,545 24,655 18,520 7,850 20,380 31,175
Total (cubic metres)
9,102 20,233 8,617 12,841 9,646 4,089 10,615 16,237
Price (per 20 kg bag)
Cement
Sand $0.50 $0.50 $0.60 $0.60 $0.60 $0.80 $0.90 $1.00
Gravel $0.80 $0.80 $0.90 $0.90 $1.00 $1.10 $1.20 $1.50
Value ($A)
Cement
Sand $174,750 $388,488 $198,540 $295,860 $222,240 $125,600 $366,840 $623,500
Gravel $419,400 $932,323 $446,715 $665,685 $555,600 $259,050 $733,680 $1,402,875
Sand and gravel $594,150 $1,320,791 $645,255 $961,545 $777,840 $384,650 $1,100,520 $2,026,375
However, in the second scenario we assume that people are very conservative and are likely to use more sand because it is more readily available than gravel and cement. Under this scenario, the weight of cement imported in 2013 implies a total of 43,645 tonnes of aggregate with a value of A$ 2.6 million (Table 14). Assuming the cost of inputs is 40% of the total output value the value-added of aggregates the value of the ecosystem service would be A$ 1.2 million.
However, according to the SOPAC report (Greer Consulting Services 2007) 70,000 m3 of gravel is mined per year. If we convert this volume to weight, assuming 1 m3 of gravel weighs 1.92 tonnes, the volume of aggregate mined would be 134,400 tonnes, with a value of A$ 8.74 million. Given the cost of inputs (40%), the value-added of the ecosystem service using these data is A$ 5.24 million.
The volume of aggregate mined calculated in this study (31,175 tonnes; Table 13), using the ‘import of cement’ methodology, is much lower than the SOPAC figure. The figure is plausible, however, because the ‘import of cement’ methodology excludes uses of sand and gravel that do not need imported cement. For instance, people often carry sand from the beach or other aggregate from the lagoon to fill in holes, conduct small-scale reclamation or coastal protection or even out playing fields; these uses are not considered in the present analysis because they do not need any cement.
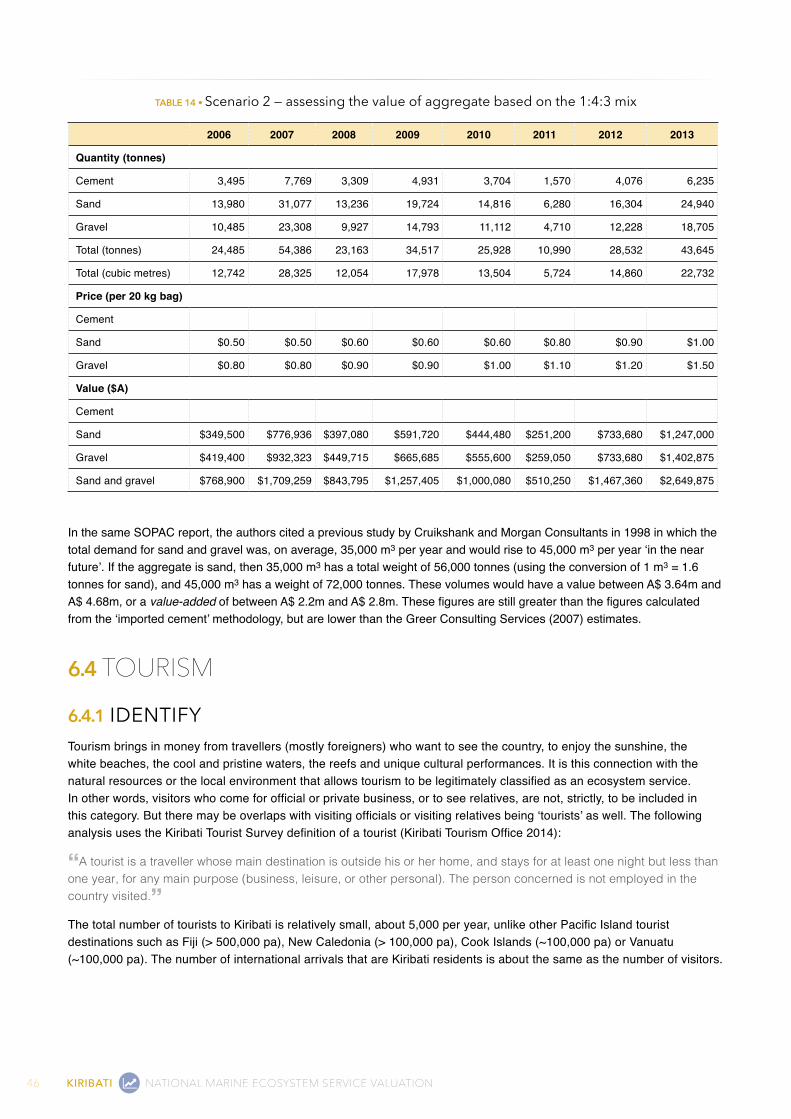
46 KIRIBATI NATIONAL MARINE ECOSYSTEM SERVICE VALUATION
TABLE 14 • Scenario 2 — assessing the value of aggregate based on the 1:4:3 mix
2006 2007 2008 2009 2010 2011 2012 2013
Quantity (tonnes)
Cement 3,495 7,769 3,309 4,931 3,704 1,570 4,076 6,235
Sand 13,980 31,077 13,236 19,724 14,816 6,280 16,304 24,940
Gravel 10,485 23,308 9,927 14,793 11,112 4,710 12,228 18,705
Total (tonnes) 24,485 54,386 23,163 34,517 25,928 10,990 28,532 43,645
Total (cubic metres) 12,742 28,325 12,054 17,978 13,504 5,724 14,860 22,732
Price (per 20 kg bag)
Cement
Sand $0.50 $0.50 $0.60 $0.60 $0.60 $0.80 $0.90 $1.00
Gravel $0.80 $0.80 $0.90 $0.90 $1.00 $1.10 $1.20 $1.50
Value ($A)
Cement
Sand $349,500 $776,936 $397,080 $591,720 $444,480 $251,200 $733,680 $1,247,000
Gravel $419,400 $932,323 $449,715 $665,685 $555,600 $259,050 $733,680 $1,402,875
Sand and gravel $768,900 $1,709,259 $843,795 $1,257,405 $1,000,080 $510,250 $1,467,360 $2,649,875
In the same SOPAC report, the authors cited a previous study by Cruikshank and Morgan Consultants in 1998 in which the total demand for sand and gravel was, on average, 35,000 m3 per year and would rise to 45,000 m3 per year ‘in the near future’. If the aggregate is sand, then 35,000 m3 has a total weight of 56,000 tonnes (using the conversion of 1 m3 = 1.6 tonnes for sand), and 45,000 m3 has a weight of 72,000 tonnes. These volumes would have a value between A$ 3.64m and A$ 4.68m, or a value-added of between A$ 2.2m and A$ 2.8m. These figures are still greater than the figures calculated from the ‘imported cement’ methodology, but are lower than the Greer Consulting Services (2007) estimates.
6.4 TOURISM
6.4.1 IdEnTIFYTourism brings in money from travellers (mostly foreigners) who want to see the country, to enjoy the sunshine, the white beaches, the cool and pristine waters, the reefs and unique cultural performances. It is this connection with the natural resources or the local environment that allows tourism to be legitimately classified as an ecosystem service. In other words, visitors who come for official or private business, or to see relatives, are not, strictly, to be included in this category. But there may be overlaps with visiting officials or visiting relatives being ‘tourists’ as well. The following analysis uses the Kiribati Tourist Survey definition of a tourist (Kiribati Tourism Office 2014):
“A tourist is a traveller whose main destination is outside his or her home, and stays for at least one night but less than one year, for any main purpose (business, leisure, or other personal). The person concerned is not employed in the country visited.”The total number of tourists to Kiribati is relatively small, about 5,000 per year, unlike other Pacific Island tourist destinations such as Fiji (> 500,000 pa), New Caledonia (> 100,000 pa), Cook Islands (~100,000 pa) or Vanuatu (~100,000 pa). The number of international arrivals that are Kiribati residents is about the same as the number of visitors.
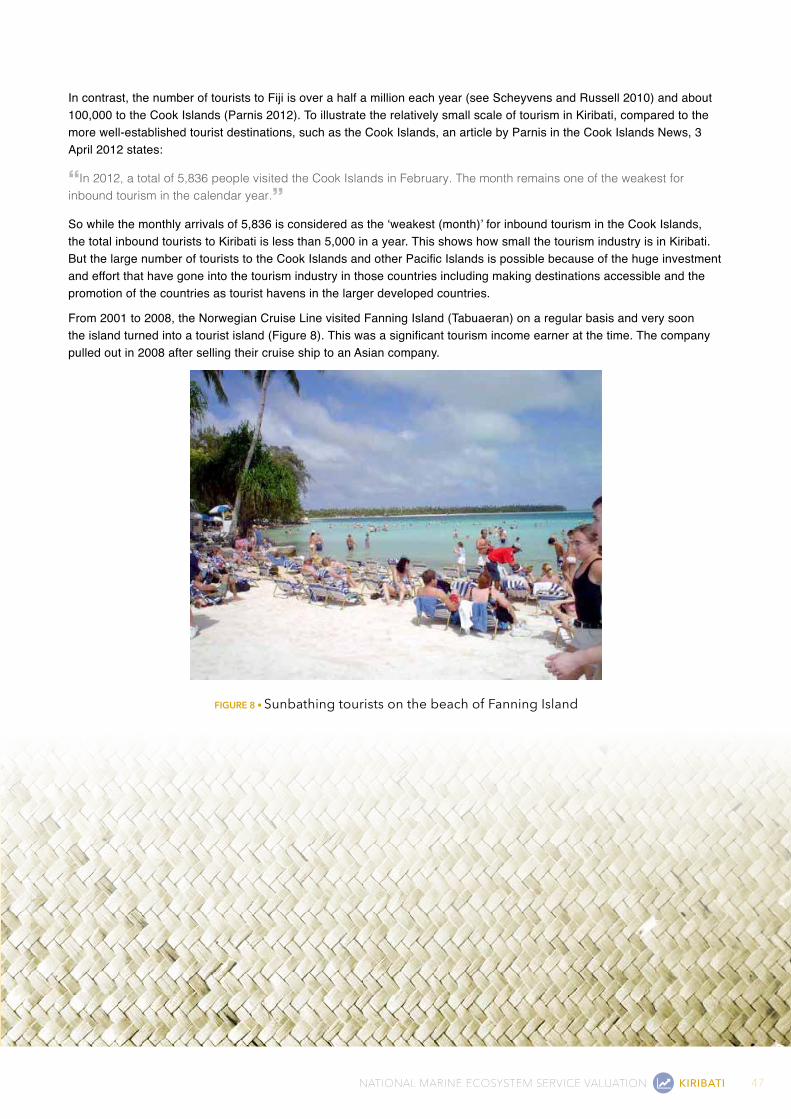
47NATIONAL MARINE ECOSYSTEM SERVICE VALUATION KIRIBATI
In contrast, the number of tourists to Fiji is over a half a million each year (see Scheyvens and Russell 2010) and about 100,000 to the Cook Islands (Parnis 2012). To illustrate the relatively small scale of tourism in Kiribati, compared to the more well-established tourist destinations, such as the Cook Islands, an article by Parnis in the Cook Islands News, 3 April 2012 states:
“In 2012, a total of 5,836 people visited the Cook Islands in February. The month remains one of the weakest for inbound tourism in the calendar year.”So while the monthly arrivals of 5,836 is considered as the ‘weakest (month)’ for inbound tourism in the Cook Islands, the total inbound tourists to Kiribati is less than 5,000 in a year. This shows how small the tourism industry is in Kiribati. But the large number of tourists to the Cook Islands and other Pacific Islands is possible because of the huge investment and effort that have gone into the tourism industry in those countries including making destinations accessible and the promotion of the countries as tourist havens in the larger developed countries.
From 2001 to 2008, the Norwegian Cruise Line visited Fanning Island (Tabuaeran) on a regular basis and very soon the island turned into a tourist island (Figure 8). This was a significant tourism income earner at the time. The company pulled out in 2008 after selling their cruise ship to an Asian company.
FigurE 8 • Sunbathing tourists on the beach of Fanning Island
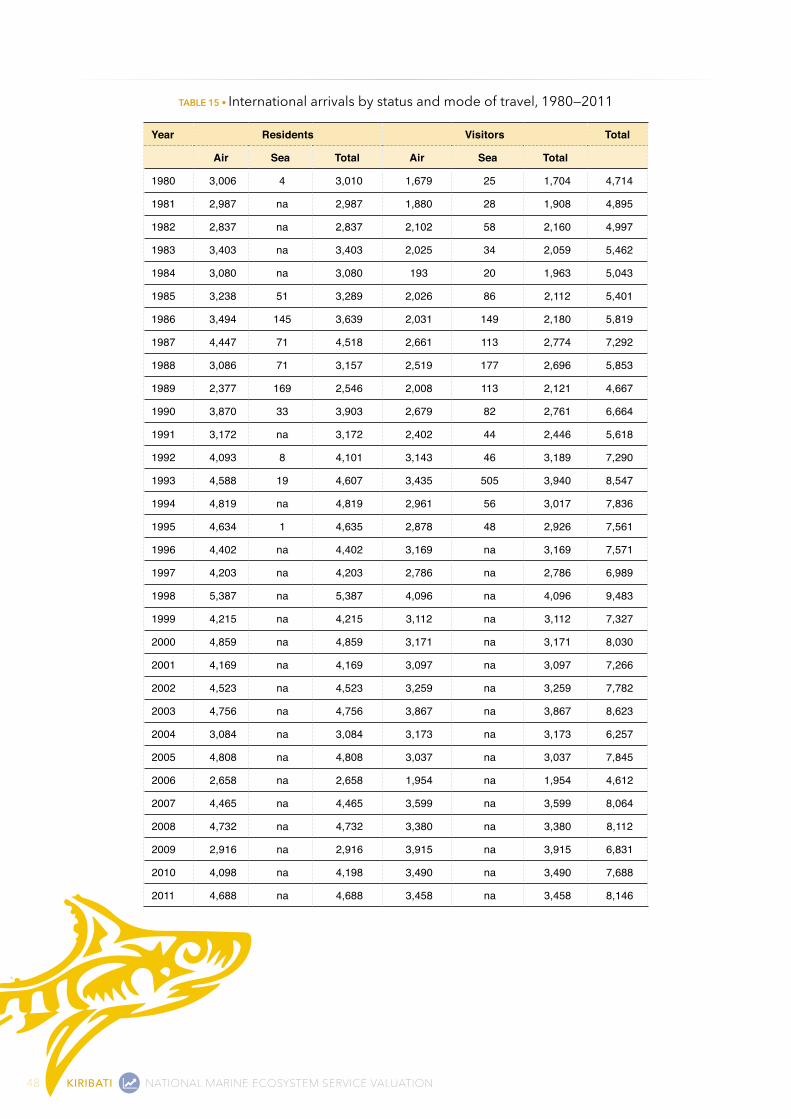
48 KIRIBATI NATIONAL MARINE ECOSYSTEM SERVICE VALUATION
TABLE 15 • International arrivals by status and mode of travel, 1980—2011
Year Residents Visitors Total
Air Sea Total Air Sea Total
1980 3,006 4 3,010 1,679 25 1,704 4,714
1981 2,987 na 2,987 1,880 28 1,908 4,895
1982 2,837 na 2,837 2,102 58 2,160 4,997
1983 3,403 na 3,403 2,025 34 2,059 5,462
1984 3,080 na 3,080 193 20 1,963 5,043
1985 3,238 51 3,289 2,026 86 2,112 5,401
1986 3,494 145 3,639 2,031 149 2,180 5,819
1987 4,447 71 4,518 2,661 113 2,774 7,292
1988 3,086 71 3,157 2,519 177 2,696 5,853
1989 2,377 169 2,546 2,008 113 2,121 4,667
1990 3,870 33 3,903 2,679 82 2,761 6,664
1991 3,172 na 3,172 2,402 44 2,446 5,618
1992 4,093 8 4,101 3,143 46 3,189 7,290
1993 4,588 19 4,607 3,435 505 3,940 8,547
1994 4,819 na 4,819 2,961 56 3,017 7,836
1995 4,634 1 4,635 2,878 48 2,926 7,561
1996 4,402 na 4,402 3,169 na 3,169 7,571
1997 4,203 na 4,203 2,786 na 2,786 6,989
1998 5,387 na 5,387 4,096 na 4,096 9,483
1999 4,215 na 4,215 3,112 na 3,112 7,327
2000 4,859 na 4,859 3,171 na 3,171 8,030
2001 4,169 na 4,169 3,097 na 3,097 7,266
2002 4,523 na 4,523 3,259 na 3,259 7,782
2003 4,756 na 4,756 3,867 na 3,867 8,623
2004 3,084 na 3,084 3,173 na 3,173 6,257
2005 4,808 na 4,808 3,037 na 3,037 7,845
2006 2,658 na 2,658 1,954 na 1,954 4,612
2007 4,465 na 4,465 3,599 na 3,599 8,064
2008 4,732 na 4,732 3,380 na 3,380 8,112
2009 2,916 na 2,916 3,915 na 3,915 6,831
2010 4,098 na 4,198 3,490 na 3,490 7,688
2011 4,688 na 4,688 3,458 na 3,458 8,146
49NATIONAL MARINE ECOSYSTEM SERVICE VALUATION KIRIBATI
6.4.2 METHOdOLOGYTourism as a service provides income and benefits to local people and it is important that the value of such service is estimated. This has not been done before because of the inherent difficulty in deciding what industries or activities comprise or constitute the tourism sector, as well as the lack of tourism data. The following analysis is based on the tourism survey report produced in January, 2014, by the Kiribati Tourism Office in close collaboration with the South Pacific Tourism (Suva).
Consumer surplus is not considered here because data are not available. What is known is that consumer surplus, or benefit, would accrue mostly to foreigners or non-residents because these are the people who enjoy the tourism benefits derived from using the marine ecosystems. Producer surplus of tourism is ideally calculated using the formula:
Producer surplus($) = (Total Tourism Revenue$ – Tourism Industry Costs$) • ECF
where ECF = ecosystem contribution factor.
The degree of association between marine and coastal ecosystems and different tourist activities can be called the ecosystem contribution factor. The net producer value of the ecosystem services is calculated by multiplying the ecosystem contribution factor by the difference between the tourists’ expenditures and the tourism industry’s costs. Since all areas of Kiribati can be considered ‘marine and coastal’ and because most visitor activities in Kiribati are related to marine and coastal resources, we assume that tourism in Kiribati is 100% dependent on marine and coastal ecosystems (ECF = 1).
Revenue is calculated using the total number of tourists and the amount each tourist spends. The costs of the industry, intermediate costs, are difficult to measure because access to the accounts of hotels and tourist operators is not readily available, and it was not possible to undertake a survey in this project. For these reasons costs are estimated.
6.4.3 QuAnTIFYThe total number of tourists22 is estimated from the immigration statistics compiled regularly by the KNSO from arrival forms (Table 15). All international arrivals are required to fill in arrival forms that are kept by the Immigration Office, Ministry of Foreign Affairs. Some departure data are also available from the KNSO.
The immigration statistics bulletin identifies international arrivals by nationality, country of residence and purpose of visit, among other categories. However, there are no data on money brought in by international passengers, nor on money spent in the country by departing passengers. The data on these factors are available from tourism surveys conducted by the Tourism Office and the South Pacific Tourism Council, the most recent of which was done in 2013. The results of this survey and the immigration statistics produced by the National Statistics Office provide the basis for the following calculations.
The tourism survey was conducted over a period of eight months (April to November 2013) with a sample size of 538 (453 at Bonriki airport, and 85 at Cassidy airport, Kiritimati Island; Table 16).
22 There is no category of passengers designated specifically as ‘tourists’ and sometimes all foreigners or non-residents are considered or treated as tourists.
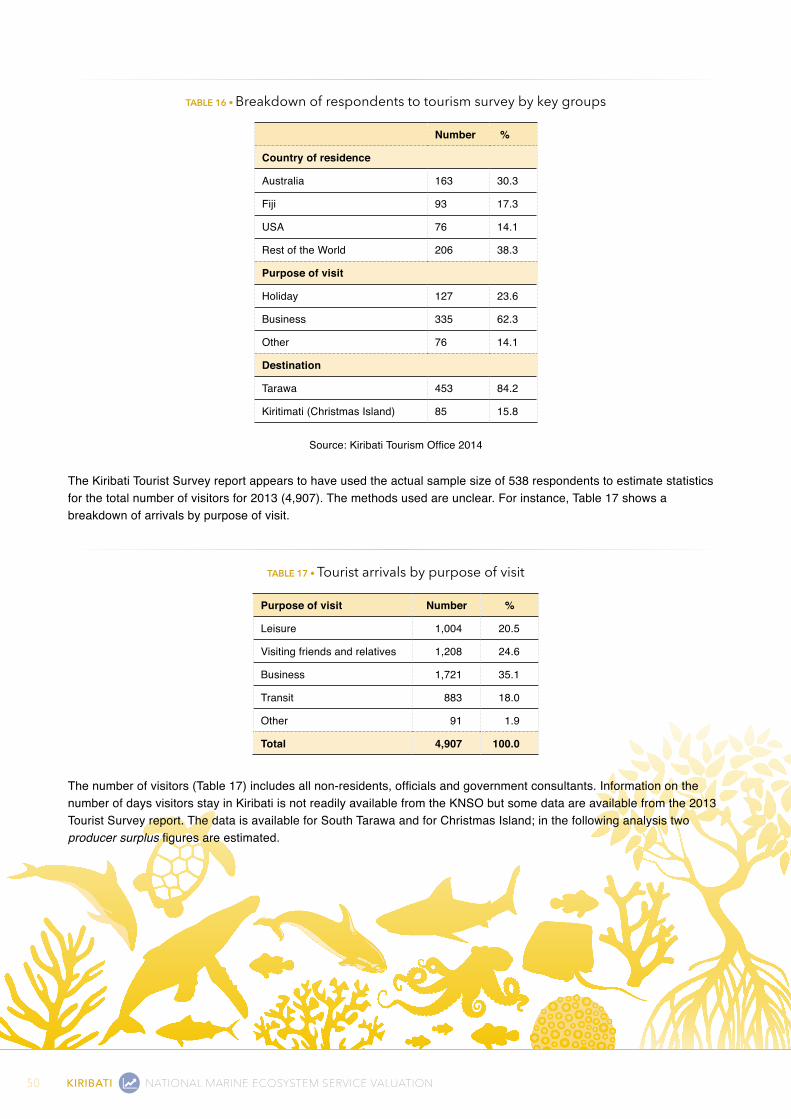
50 KIRIBATI NATIONAL MARINE ECOSYSTEM SERVICE VALUATION
TABLE 16 • Breakdown of respondents to tourism survey by key groups
Number %
Country of residence
Australia 163 30.3
Fiji 93 17.3
USA 76 14.1
Rest of the World 206 38.3
Purpose of visit
Holiday 127 23.6
Business 335 62.3
Other 76 14.1
Destination
Tarawa 453 84.2
Kiritimati (Christmas Island) 85 15.8
Source: Kiribati Tourism Office 2014
The Kiribati Tourist Survey report appears to have used the actual sample size of 538 respondents to estimate statistics for the total number of visitors for 2013 (4,907). The methods used are unclear. For instance, Table 17 shows a breakdown of arrivals by purpose of visit.
TABLE 17 • Tourist arrivals by purpose of visit
Purpose of visit Number %
Leisure 1,004 20.5
Visiting friends and relatives 1,208 24.6
Business 1,721 35.1
Transit 883 18.0
Other 91 1.9
Total 4,907 100.0
The number of visitors (Table 17) includes all non-residents, officials and government consultants. Information on the number of days visitors stay in Kiribati is not readily available from the KNSO but some data are available from the 2013 Tourist Survey report. The data is available for South Tarawa and for Christmas Island; in the following analysis two producer surplus figures are estimated.
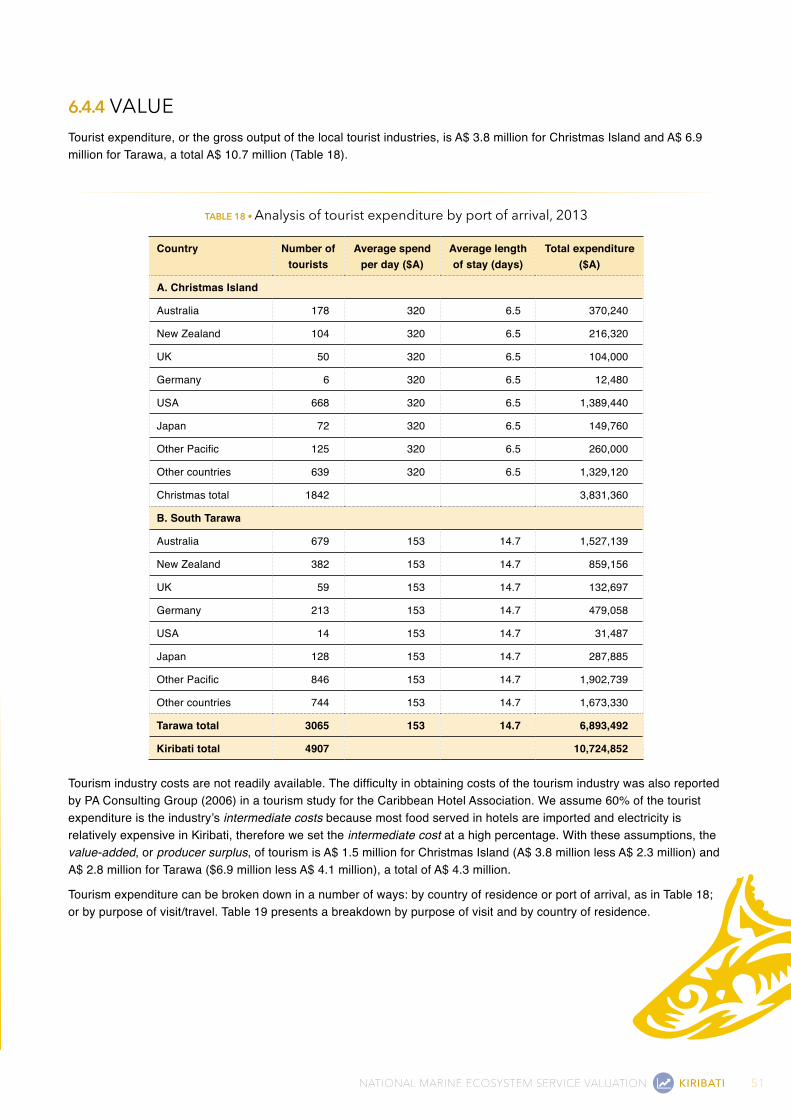
51NATIONAL MARINE ECOSYSTEM SERVICE VALUATION KIRIBATI
6.4.4 VALuETourist expenditure, or the gross output of the local tourist industries, is A$ 3.8 million for Christmas Island and A$ 6.9 million for Tarawa, a total A$ 10.7 million (Table 18).
TABLE 18 • Analysis of tourist expenditure by port of arrival, 2013
Country Number of tourists
Average spend per day ($A)
Average length of stay (days)
Total expenditure ($A)
A. Christmas Island
Australia 178 320 6.5 370,240
New Zealand 104 320 6.5 216,320
UK 50 320 6.5 104,000
Germany 6 320 6.5 12,480
USA 668 320 6.5 1,389,440
Japan 72 320 6.5 149,760
Other Pacific 125 320 6.5 260,000
Other countries 639 320 6.5 1,329,120
Christmas total 1842 3,831,360
B. South Tarawa
Australia 679 153 14.7 1,527,139
New Zealand 382 153 14.7 859,156
UK 59 153 14.7 132,697
Germany 213 153 14.7 479,058
USA 14 153 14.7 31,487
Japan 128 153 14.7 287,885
Other Pacific 846 153 14.7 1,902,739
Other countries 744 153 14.7 1,673,330
Tarawa total 3065 153 14.7 6,893,492
Kiribati total 4907 10,724,852
Tourism industry costs are not readily available. The difficulty in obtaining costs of the tourism industry was also reported by PA Consulting Group (2006) in a tourism study for the Caribbean Hotel Association. We assume 60% of the tourist expenditure is the industry’s intermediate costs because most food served in hotels are imported and electricity is relatively expensive in Kiribati, therefore we set the intermediate cost at a high percentage. With these assumptions, the value-added, or producer surplus, of tourism is A$ 1.5 million for Christmas Island (A$ 3.8 million less A$ 2.3 million) and A$ 2.8 million for Tarawa ($6.9 million less A$ 4.1 million), a total of A$ 4.3 million.
Tourism expenditure can be broken down in a number of ways: by country of residence or port of arrival, as in Table 18; or by purpose of visit/travel. Table 19 presents a breakdown by purpose of visit and by country of residence.
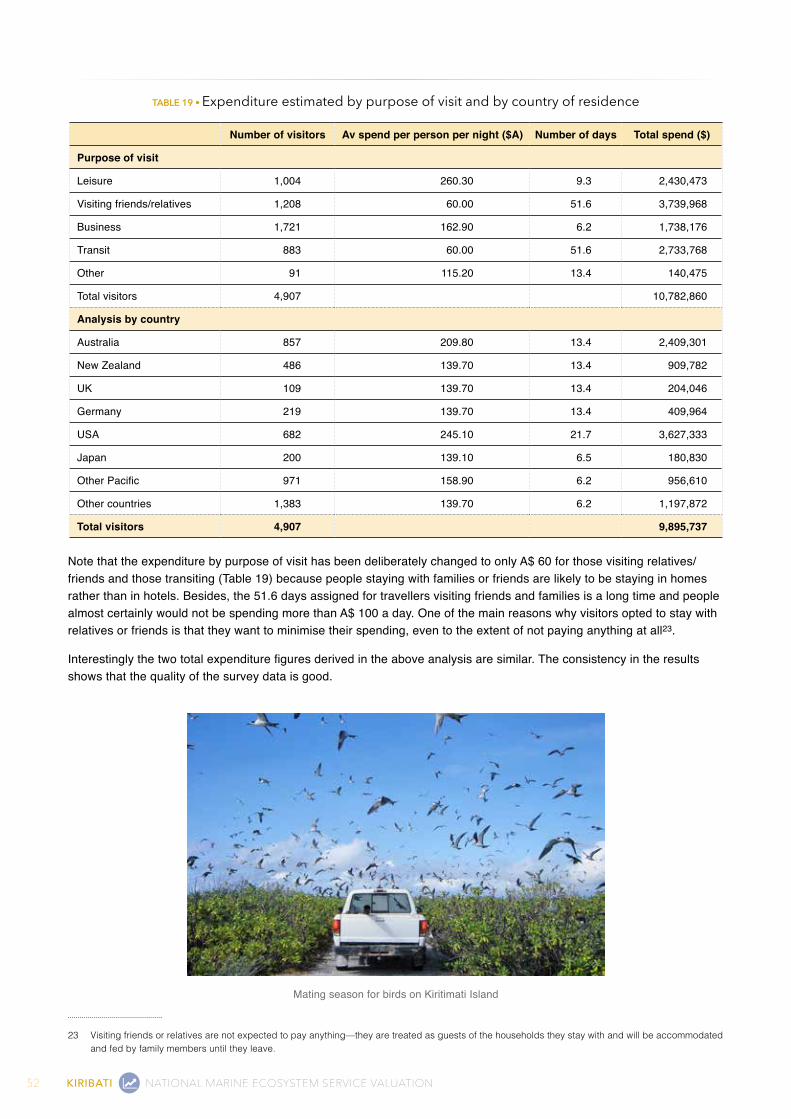
52 KIRIBATI NATIONAL MARINE ECOSYSTEM SERVICE VALUATION
TABLE 19 • Expenditure estimated by purpose of visit and by country of residence
Number of visitors Av spend per person per night ($A) Number of days Total spend ($)
Purpose of visit
Leisure 1,004 260.30 9.3 2,430,473
Visiting friends/relatives 1,208 60.00 51.6 3,739,968
Business 1,721 162.90 6.2 1,738,176
Transit 883 60.00 51.6 2,733,768
Other 91 115.20 13.4 140,475
Total visitors 4,907 10,782,860
Analysis by country
Australia 857 209.80 13.4 2,409,301
New Zealand 486 139.70 13.4 909,782
UK 109 139.70 13.4 204,046
Germany 219 139.70 13.4 409,964
USA 682 245.10 21.7 3,627,333
Japan 200 139.10 6.5 180,830
Other Pacific 971 158.90 6.2 956,610
Other countries 1,383 139.70 6.2 1,197,872
Total visitors 4,907 9,895,737
Note that the expenditure by purpose of visit has been deliberately changed to only A$ 60 for those visiting relatives/friends and those transiting (Table 19) because people staying with families or friends are likely to be staying in homes rather than in hotels. Besides, the 51.6 days assigned for travellers visiting friends and families is a long time and people almost certainly would not be spending more than A$ 100 a day. One of the main reasons why visitors opted to stay with relatives or friends is that they want to minimise their spending, even to the extent of not paying anything at all23.
Interestingly the two total expenditure figures derived in the above analysis are similar. The consistency in the results shows that the quality of the survey data is good.
Mating season for birds on Kiritimati Island
23 Visiting friends or relatives are not expected to pay anything—they are treated as guests of the households they stay with and will be accommodated and fed by family members until they leave.
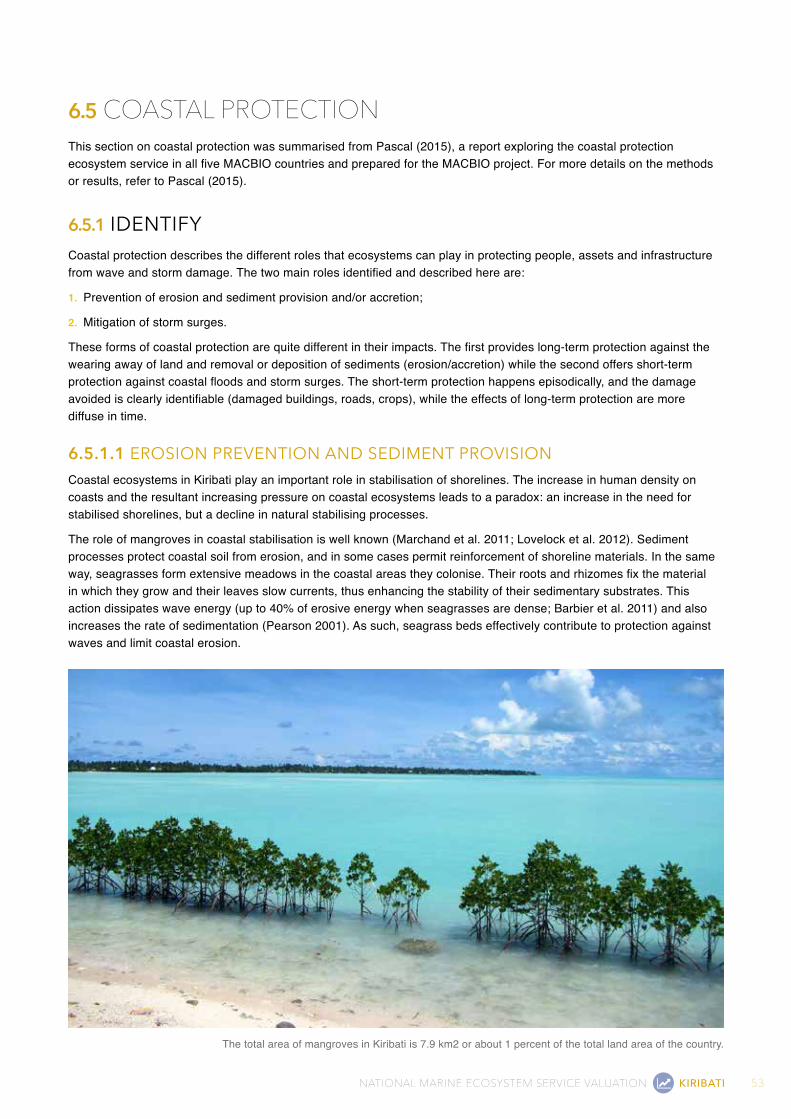
53NATIONAL MARINE ECOSYSTEM SERVICE VALUATION KIRIBATI
6.5 COASTAL PROTECTIONThis section on coastal protection was summarised from Pascal (2015), a report exploring the coastal protection ecosystem service in all five MACBIO countries and prepared for the MACBIO project. For more details on the methods or results, refer to Pascal (2015).
6.5.1 IdEnTIFYCoastal protection describes the different roles that ecosystems can play in protecting people, assets and infrastructure from wave and storm damage. The two main roles identified and described here are:
1. Prevention of erosion and sediment provision and/or accretion;
2. Mitigation of storm surges.
These forms of coastal protection are quite different in their impacts. The first provides long-term protection against the wearing away of land and removal or deposition of sediments (erosion/accretion) while the second offers short-term protection against coastal floods and storm surges. The short-term protection happens episodically, and the damage avoided is clearly identifiable (damaged buildings, roads, crops), while the effects of long-term protection are more diffuse in time.
6.5.1.1 EROSIOn PREVEnTIOn And SEdIMEnT PROVISIOnCoastal ecosystems in Kiribati play an important role in stabilisation of shorelines. The increase in human density on coasts and the resultant increasing pressure on coastal ecosystems leads to a paradox: an increase in the need for stabilised shorelines, but a decline in natural stabilising processes.
The role of mangroves in coastal stabilisation is well known (Marchand et al. 2011; Lovelock et al. 2012). Sediment processes protect coastal soil from erosion, and in some cases permit reinforcement of shoreline materials. In the same way, seagrasses form extensive meadows in the coastal areas they colonise. Their roots and rhizomes fix the material in which they grow and their leaves slow currents, thus enhancing the stability of their sedimentary substrates. This action dissipates wave energy (up to 40% of erosive energy when seagrasses are dense; Barbier et al. 2011) and also increases the rate of sedimentation (Pearson 2001). As such, seagrass beds effectively contribute to protection against waves and limit coastal erosion.
The total area of mangroves in Kiribati is 7.9 km2 or about 1 percent of the total land area of the country.
54 KIRIBATI NATIONAL MARINE ECOSYSTEM SERVICE VALUATION
In addition, reefs are known to participate in beach formation, even though the processes involved are not yet well described (Pérez-Maqueo et al. 2007). Beach formation occurs with accumulation of sediments from various origins (marine or alluvial), a phenomenon known as sedimentation. Coastlines near coral reefs receive sediments in the form of small dead coral particles. Accumulation on the coastline of those sediments is the source of beach formation. Sedimentary accretion also maintains and nourishes beaches, in opposition to natural or anthropogenic erosion (Huang et al. 2007).
Kiribati has various levels of protection against erosion due to the location and quantity of several marine and coastal ecosystems. The scope of this study was to identify all ecosystem services at a national scale and, where possible, quantify/value those with readily available data. Many authors agree that the assessment of erosion prevention and sediment provision is a data-demanding exercise and requires a fine resolution of analysis (Lugo-Fernandez et al. 1998; Penning-Rowsell et al. 2003; Van Der Meulen et al. 2004). For example, on a 1 km scale, neighbouring beaches can suffer both erosion and sand accretion depending on geomorphological and biological factors (Brander et al. 2004). Although it has not been possible to precisely quantify the ecosystem service of protection against erosion, three major aspects have been identified for Kiribati:
1. stabilisation of shorelines, critical in high human density sites (e.g. South Tarawa)
2. beach formation and stabilisation, important in tourist areas
3. atoll formation and stabilisation, very important for atoll countries such as Kiribati.
The role of coral reefs in processes involved in erosion protection (sedimentation and accretion) is currently less well understood than the role of mangroves. Furthermore, although some natural processes involved in erosion protection are well described, it is still difficult to quantify or estimate the economic value of such processes.
6.5.1.2 STORM SuRGE MITIGATIOnThis study focuses on the value of storm surge mitigation by coral reefs, which is one of the most important aspects of coastal protection provided by marine ecosystems (Laurans et al. 2013). As a point of reference, average annual direct loss caused by tropical cyclone floods in 15 South Pacific countries was calculated to be up to US$ 80 million (2009 prices) with 60% of the damage resulting from loss of residential buildings, 30% from loss of cash crops and 10% from damage to infrastructure (PCRAFI 2011).
Storm systems such as tropical cyclones and mid-latitude storms and their associated cold fronts are the primary causes of storm surges24. Storm surges can interact with other ocean processes such as tides and waves to further increase coastal sea levels and flooding, and have maximum impact when they coincide with high tide. Breaking waves at the coast can also produce an increase in coastal sea levels, known as wave setup. Storm surges occurring at higher mean sea levels enable inundation and damaging waves to penetrate further inland, which increases flooding, erosion and damage to the built infrastructure and natural ecosystems. The effect of rising mean sea levels due to climate change will be felt most profoundly during tsunamis or extreme storm conditions (CSIRO and Australian Bureau of Meteorology 2007)25.
Coastal bathymetry (the shape and depth of the seafloor), the presence of bays and headlands and the proximity of other islands also affect the height of storm surges. Wide and gently sloping continental shelves amplify storm surges, while bays and channels can funnel and increase the height of storm surges.
Coral reefs, seagrass and mangroves provide protection against waves by forming barriers along the coastline. As a result, lagoons, which are protected by barrier reefs, are relatively calm areas that provide multiple ecosystem services (e.g. biomass production supporting fisheries and scenic beauty supporting tourism). Several studies have shown that reefs act in a similar manner to breakwaters or shallow coasts (Lugo-Fernandez et al. 1998; Brander et al. 2004; Kench and Brander 2009). They impose strong constraints on the swell of the ocean, resulting in transformations of wave characteristics and rapid attenuation of wave energy. Waves formed by the wind store a large part of their energy at the surface, and this force can be absorbed by fringing reefs and reef crests, sometimes up to 90% at low tide (Lugo-Fernandez et al. 1998). The degree of energy absorption is highly variable and depends on the type of reef, the depth
24 A storm surge is an abnormal rise of water generated by a storm, over and above the predicted astronomical tide.
25 A tsunami differs from a wind-generated wave in that the former is much larger and its energy is distributed throughout the water column. The impact of bathymetry in wave attenuation is even more important in tsunamis, due to this vertical distribution of energy throughout the water column rather than the surface distribution of storm surge waves.
55NATIONAL MARINE ECOSYSTEM SERVICE VALUATION KIRIBATI
and the waves (Kench and Brander 2009). The role of coral reefs and mangroves in coastal protection is difficult to isolate from other variables and, in fact, a combination of factors impact on the level of protection provided. The primary factors influencing attenuation of wave energy are:
i. bathymetry (shape and depth of sea or ocean floor)
ii. geomorphology (soil origin and composition)
iii. topography (coastal and inland surface shape, as well as shoreline indentations)
iv. biological cover (presence of other ecosystems in the coastal area) (Burke 2004).
Few studies have focused on isolating the specific role of coral reefs within this combination of factors (Badola and Hussain 2005). In addition to the complexity of quantifying the specific contribution of coral reefs to coastal protection, an analysis by Barbier et al. (2008) found that the relationship between reef area and absorption of wave energy was nonlinear. Similar nonlinear effects have been measured for the effect of mangroves on wave height. Waves of 1.1 m in the sea are reduced to 0.91 m in the mangrove forest if the forest has an extension of 100 m. The wave continues to decline, at a slower rate, for each additional 100 m of mangrove extension inland. For a forest extending 1000 m inland, the waves would be reduced to a negligible 0.12 m26 (Barbier et al. 2008).
6.5.2 QuAnTIFYUnfortunately, this study was unable to look at coastal protection from cyclones. Only one cyclone (of unknown intensity) has been recorded in an area of 50 nautical miles around Tarawa since 1940 according to the US National Oceanic and Atmospheric Administration (NOAA) historical cyclone tracks. And while coastal protection against flood from cyclones is not the only coastal protection ecosystem service provided by coral reefs (e.g. there is also protection from severe storms), it was the only one monetised in the MACBIO study. The record of one cyclone near Kiribati since 1940 is not sufficient to estimate a probability of storm occurrence for the country. Therefore, coastal protection against flood from cyclones has not been evaluated in this study. Nevertheless, we provide a qualitative assessment of the coastal protection index and assets at risk in Kiribati because we recognise that severe storms do occur in Kiribati and can impact upon human infrastructure, agriculture, fisheries and biodiversity
The land area of Kiribati consists largely of atolls that are at risk of erosion, damage from tsunamis and inundation due to rising sea levels. Coastal protection against erosion or tsunamis, as well as participation of reefs in the process of beach formation, should be valued in the future.
6.5.2.1 COASTAL PROTECTIOn IndEXTwo methods can be used to assess the role of coral reefs27 in coastal protection: methods based on biological properties of reefs, and methods based on physical and mechanical properties of the reefs. Due to the large quantity of information required for the biological method, and the requirement for small study areas, we chose to use a physical and mechanical model for our evaluation. One of the main limitations of such models is that we were not able to assess the true relationship between coral mortality and its role in loss of the coastal protection service.
The model used for this study scores coastal stability based on seven physical characteristics (Table 20). These physical characteristics were given a score between 1 and 5 and the average was calculated to produce a unique index value for each segment of shoreline: the coastal protection index.
26 In addition, some studies have shown that the extent of reefs or mangrove may not be the main factor influencing the reduction of damage on the coast from waves derived from tsunamis (Done et al. 1996; Pérez-Maqueo et al. 2007; Greer Consulting Services 2007).
27 Three major ecosystems contribute to coastal protection: coral reefs, mangroves and seagrasses. Nonetheless methodologies to assess economic impacts of mangroves and seagrass in terms of coastal protection are not yet consolidated (Huang et al. 2007; Pérez-Maqueo et al. 2007; IFRECOR 2011; Pascal 2014). The specific role of those ecosystems is not monetarised in the present study; they are only used in the coastal protection index as one of the main factors contributing to coastal protection.
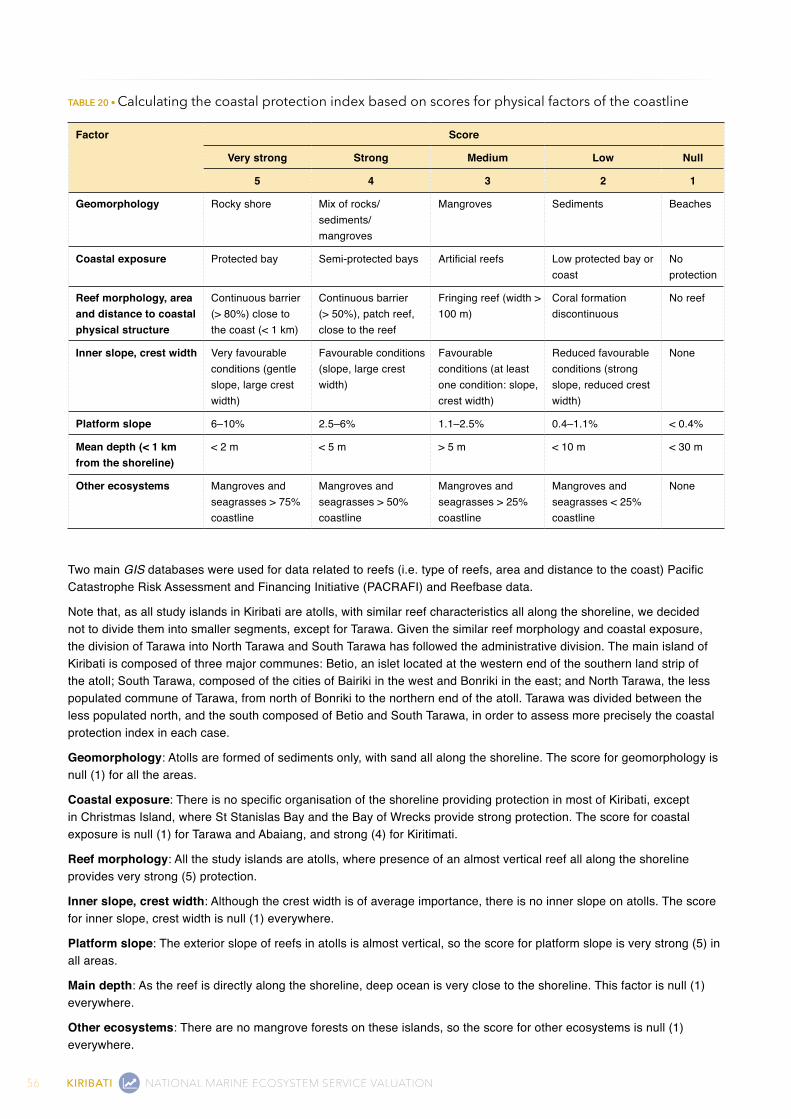
56 KIRIBATI NATIONAL MARINE ECOSYSTEM SERVICE VALUATION
TABLE 20 • Calculating the coastal protection index based on scores for physical factors of the coastline
Factor Score
Very strong Strong Medium Low Null
5 4 3 2 1
Geomorphology Rocky shore Mix of rocks/ sediments/ mangroves
Mangroves Sediments Beaches
Coastal exposure Protected bay Semi-protected bays Artificial reefs Low protected bay or coast
No protection
Reef morphology, area and distance to coastal physical structure
Continuous barrier (> 80%) close to the coast (< 1 km)
Continuous barrier (> 50%), patch reef, close to the reef
Fringing reef (width > 100 m)
Coral formation discontinuous
No reef
Inner slope, crest width Very favourable conditions (gentle slope, large crest width)
Favourable conditions (slope, large crest width)
Favourable conditions (at least one condition: slope, crest width)
Reduced favourable conditions (strong slope, reduced crest width)
None
Platform slope 6–10% 2.5–6% 1.1–2.5% 0.4–1.1% < 0.4%
Mean depth (< 1 km from the shoreline)
< 2 m < 5 m > 5 m < 10 m < 30 m
Other ecosystems Mangroves and seagrasses > 75% coastline
Mangroves and seagrasses > 50% coastline
Mangroves and seagrasses > 25% coastline
Mangroves and seagrasses < 25% coastline
None
Two main GIS databases were used for data related to reefs (i.e. type of reefs, area and distance to the coast) Pacific Catastrophe Risk Assessment and Financing Initiative (PACRAFI) and Reefbase data.
Note that, as all study islands in Kiribati are atolls, with similar reef characteristics all along the shoreline, we decided not to divide them into smaller segments, except for Tarawa. Given the similar reef morphology and coastal exposure, the division of Tarawa into North Tarawa and South Tarawa has followed the administrative division. The main island of Kiribati is composed of three major communes: Betio, an islet located at the western end of the southern land strip of the atoll; South Tarawa, composed of the cities of Bairiki in the west and Bonriki in the east; and North Tarawa, the less populated commune of Tarawa, from north of Bonriki to the northern end of the atoll. Tarawa was divided between the less populated north, and the south composed of Betio and South Tarawa, in order to assess more precisely the coastal protection index in each case.
Geomorphology: Atolls are formed of sediments only, with sand all along the shoreline. The score for geomorphology is null (1) for all the areas.
Coastal exposure: There is no specific organisation of the shoreline providing protection in most of Kiribati, except in Christmas Island, where St Stanislas Bay and the Bay of Wrecks provide strong protection. The score for coastal exposure is null (1) for Tarawa and Abaiang, and strong (4) for Kiritimati.
Reef morphology: All the study islands are atolls, where presence of an almost vertical reef all along the shoreline provides very strong (5) protection.
Inner slope, crest width: Although the crest width is of average importance, there is no inner slope on atolls. The score for inner slope, crest width is null (1) everywhere.
Platform slope: The exterior slope of reefs in atolls is almost vertical, so the score for platform slope is very strong (5) in all areas.
Main depth: As the reef is directly along the shoreline, deep ocean is very close to the shoreline. This factor is null (1) everywhere.
Other ecosystems: There are no mangrove forests on these islands, so the score for other ecosystems is null (1) everywhere.

57NATIONAL MARINE ECOSYSTEM SERVICE VALUATION KIRIBATI
These results are summarised in Table 21.
TABLE 21 • Coastal protection index for the islands of Tarawa, Abaiang and Kiritimati
Factor North Tarawa South Tarawa Abaiang Kiritimati
Geomorphology 1 1 1 1
Coastal exposure 1 1 1 4
Reef morphology, area and distance to the coast 5 5 5 5
Inner slope, crest width 2 2 2 2
Platform slope 5 5 5 5
main depth (1 km away from the coast) 1 1 1 1
Other ecosystems 1 1 1 1
Average 2 2 2 3
6.5.2.2 MAIn nOTABLE ASSETS AT RISKWe assessed the number, type and location of residential buildings and hotels at risk from coastal flooding and tsunamis. No robust information related to other construction works, such as public buildings and infrastructure (e.g. roads, bridges and airports) was available. Agricultural crops were also not included in the study, due to the absence of intensive crop production in the areas at risk. Data on indirect tangible damage (e.g. loss of tourism revenue, emergency costs, traffic disruption) were also unavailable.
Main cities: The main cities of Tarawa are located in South Tarawa (Bonriki and Bairiki).
Tourism: the hotel market is not well developed in Kiribati. There are no starred hotels. The four hotels in Tarawa are all concentrated in South Tarawa (there are also five bed-and-breakfasts). In Kiritimati, there is one big hotel, the Captain Cook hotel, providing 24 rooms and 20 bungalows, and three other hotels (Crystal Beach Resort, Adventure Dive and Fishing Lodge and The Villages), each providing six rooms.
6.5.3 VALuENo valuation of coastal protection has been undertaken for Kiribati because the method employed in the MACBIO study focuses only on coastal protection provided by coral reefs against flooding caused by cyclones. This method focuses only upon the probability of cyclone, which is nil in Kiribati, but not storm occurrence.
Nonetheless, the values are likely to be significant because storms do occur in Kiribati: wave damage and storm surge can impact built infrastructure and coastal habitats can mitigate these impacts (Figure 8).
6.5.4 SuSTAInABILITYReef, mangrove, and seagrass ecosystems provide consistent coastal protection benefits indefinitely, as long as the ecosystems remain intact. Damage to reefs and mangroves from coastal development is an ongoing threat (Burke et al. 2008). The magnitude of the services could be increased in some instances by restoring blighted or damaged reefs, mangroves, and seagrasses.
Climate change, in particular acidification of oceans and warmer water temperatures, could impact reefs and mangroves and threaten the sustainability of this ecosystem service. Climate change may also increase the intensity and severity of storms, increasing the importance of coastal protection services but also increase the expected damages.
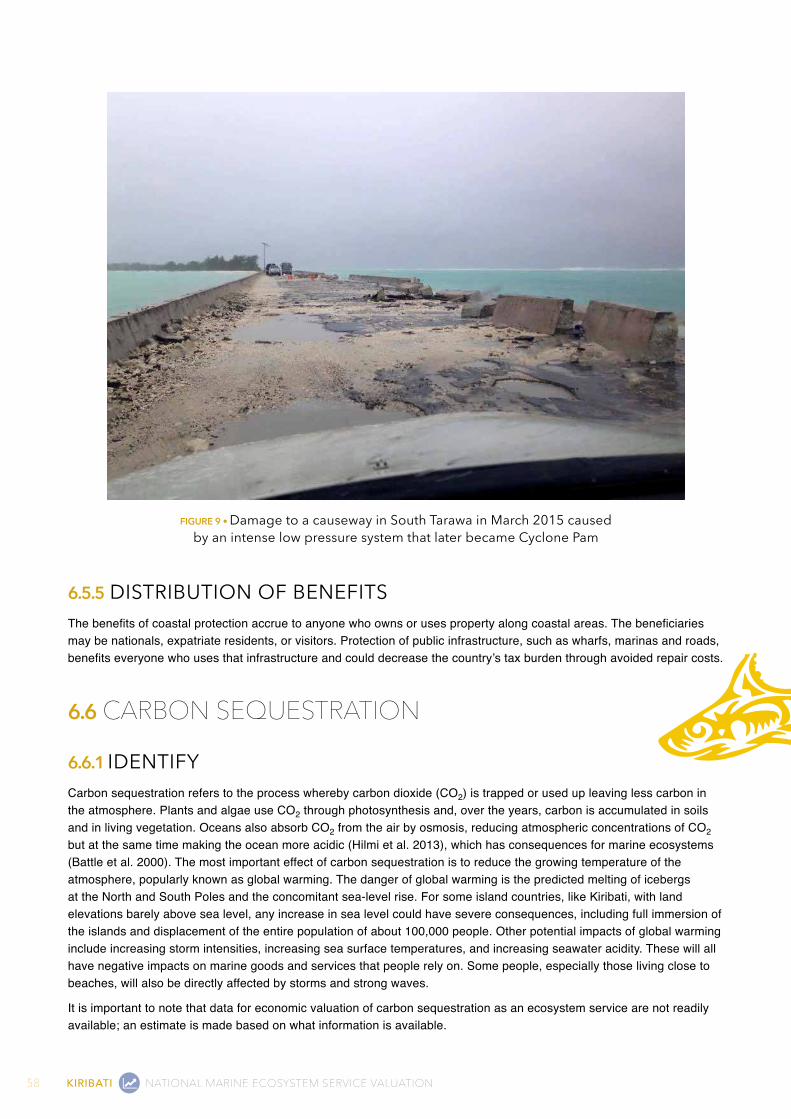
58 KIRIBATI NATIONAL MARINE ECOSYSTEM SERVICE VALUATION
FigurE 9 • damage to a causeway in South Tarawa in March 2015 caused by an intense low pressure system that later became Cyclone Pam
6.5.5 dISTRIBuTIOn OF BEnEFITSThe benefits of coastal protection accrue to anyone who owns or uses property along coastal areas. The beneficiaries may be nationals, expatriate residents, or visitors. Protection of public infrastructure, such as wharfs, marinas and roads, benefits everyone who uses that infrastructure and could decrease the country’s tax burden through avoided repair costs.
6.6 CARBON SEqUESTRATION
6.6.1 IdEnTIFYCarbon sequestration refers to the process whereby carbon dioxide (CO2) is trapped or used up leaving less carbon in the atmosphere. Plants and algae use CO2 through photosynthesis and, over the years, carbon is accumulated in soils and in living vegetation. Oceans also absorb CO2 from the air by osmosis, reducing atmospheric concentrations of CO2 but at the same time making the ocean more acidic (Hilmi et al. 2013), which has consequences for marine ecosystems (Battle et al. 2000). The most important effect of carbon sequestration is to reduce the growing temperature of the atmosphere, popularly known as global warming. The danger of global warming is the predicted melting of icebergs at the North and South Poles and the concomitant sea-level rise. For some island countries, like Kiribati, with land elevations barely above sea level, any increase in sea level could have severe consequences, including full immersion of the islands and displacement of the entire population of about 100,000 people. Other potential impacts of global warming include increasing storm intensities, increasing sea surface temperatures, and increasing seawater acidity. These will all have negative impacts on marine goods and services that people rely on. Some people, especially those living close to beaches, will also be directly affected by storms and strong waves.
It is important to note that data for economic valuation of carbon sequestration as an ecosystem service are not readily available; an estimate is made based on what information is available.
59NATIONAL MARINE ECOSYSTEM SERVICE VALUATION KIRIBATI
6.6.2 METHOdOLOGYThe net amount of carbon sequestered by an ecosystem is the sum of the rate of sequestration of each species (rs,t) and the amount of stored carbon that would be released if the ecosystem were damaged or destroyed (qs,t), over a given time period.
Value Carbon Sequestrationt = Σ(rs,t = qs,t) • Value per tonne carbon
The subscript s refers to the species; the subscript t refers to the length of time analysed, usually one year. Data on the rates of carbon sequestration by different species within different ecosystems in Kiribati were not available so ecosystem-level data are used instead. Estimates, then, of the rate of carbon sequestration per ecosystem and the extent of those ecosystems can be used to estimate annual quantities of carbon sequestration; data on the quantity of stored carbon in different ecosystems and reduction in extent of those ecosystems can be used to estimate the annual quantity carbon prevented from release or decay into the atmosphere.
6.6.3 QuAnTIFYCarbon is trapped or stored in the soil beneath the trees or vegetation and in the biomass itself. This is a service because preventing the escape of carbon to the atmosphere to form CO2 prevents increases in greenhouse gases and increased warming of the atmosphere. Habitats are carbon sinks but if the habitat is destroyed or burnt, carbon will be released to the atmosphere. However, neither the stock of carbon nor the carbon sequestration rate has ever been measured in Kiribati. Therefore measurements from other studies are used to calculate the value of carbon sequestration in Kiribati.
Murray et al. (2011) produced estimates of carbon stored in marine ecosystems and annual carbon sequestration rates of coastal habitats (Table 22). Soil organic carbon is by far the biggest carbon sink in coastal habitats. In relative terms, about 95% to 99% of total carbon stocks of salt marshes and seagrasses are stored in the soils beneath them. In mangrove systems, 50% to 90% of the total carbon stock is in the soil carbon pool. The rest is in living biomass, such as woody vegetation.
TABLE 22 • Carbon storage in coastal ecosystems
Coastal habitat Soil organic carbont CO2e/ha
Carbon in biomasst CO2e/ha
Sequestration ratet CO2e/ha/yr
Seagrass 500 0.4–18.3 4
Salt marsh 917 12–60 6–8
Estuarine mangrove 1600 237–563 6–8
Oceanic mangrove 1800 – 6–8
Tropical forests* 1.8–2.7*
Source: Murray et al. 2011; *Lewis et al. 2009
The area of mangrove habitat in Kiribati is known and is 7.9 km2 (Table 23). It should be noted, however, that the data are not complete because there is no information for some islands. Data on extent of seagrasses is not available.
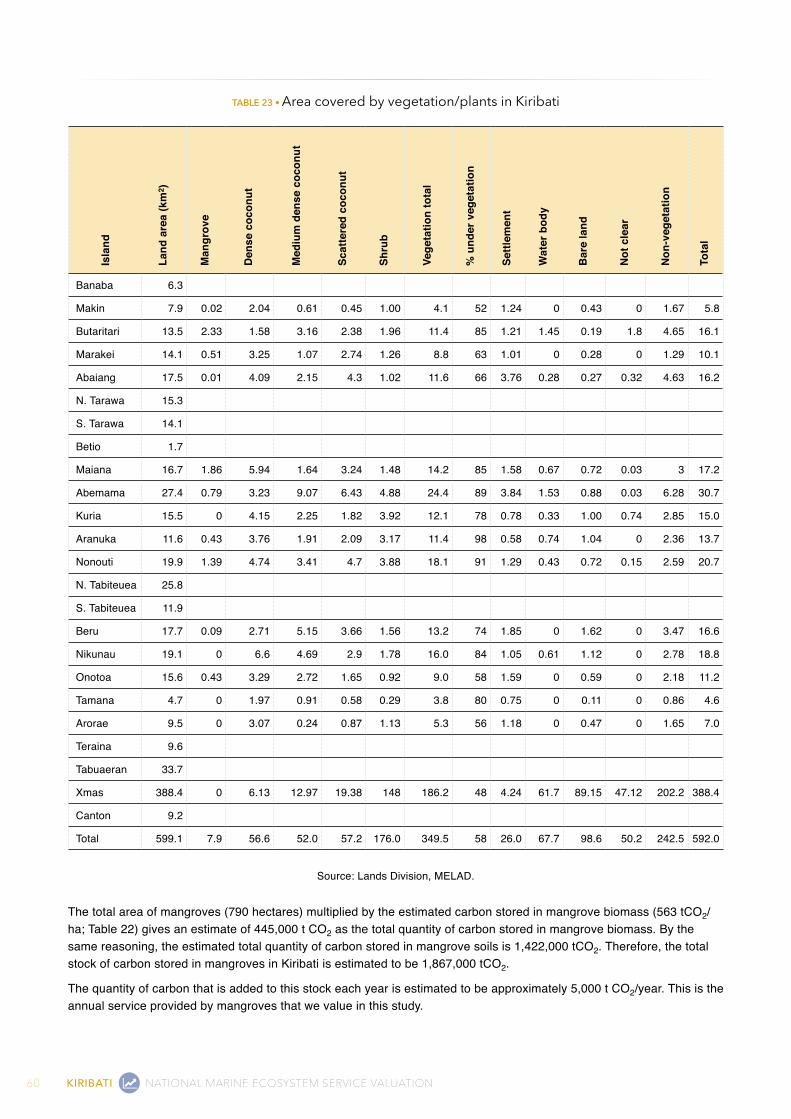
60 KIRIBATI NATIONAL MARINE ECOSYSTEM SERVICE VALUATION
TABLE 23 • Area covered by vegetation/plants in KiribatiIs
land
Land
are
a (k
m2 )
Man
grov
e
Den
se c
ocon
ut
Med
ium
den
se c
ocon
ut
Scat
tere
d co
conu
t
Shru
b
Vege
tatio
n to
tal
% u
nder
veg
etat
ion
Settl
emen
t
Wat
er b
ody
Bar
e la
nd
Not
cle
ar
Non
-veg
etat
ion
Tota
l
Banaba 6.3
Makin 7.9 0.02 2.04 0.61 0.45 1.00 4.1 52 1.24 0 0.43 0 1.67 5.8
Butaritari 13.5 2.33 1.58 3.16 2.38 1.96 11.4 85 1.21 1.45 0.19 1.8 4.65 16.1
Marakei 14.1 0.51 3.25 1.07 2.74 1.26 8.8 63 1.01 0 0.28 0 1.29 10.1
Abaiang 17.5 0.01 4.09 2.15 4.3 1.02 11.6 66 3.76 0.28 0.27 0.32 4.63 16.2
N. Tarawa 15.3
S. Tarawa 14.1
Betio 1.7
Maiana 16.7 1.86 5.94 1.64 3.24 1.48 14.2 85 1.58 0.67 0.72 0.03 3 17.2
Abemama 27.4 0.79 3.23 9.07 6.43 4.88 24.4 89 3.84 1.53 0.88 0.03 6.28 30.7
Kuria 15.5 0 4.15 2.25 1.82 3.92 12.1 78 0.78 0.33 1.00 0.74 2.85 15.0
Aranuka 11.6 0.43 3.76 1.91 2.09 3.17 11.4 98 0.58 0.74 1.04 0 2.36 13.7
Nonouti 19.9 1.39 4.74 3.41 4.7 3.88 18.1 91 1.29 0.43 0.72 0.15 2.59 20.7
N. Tabiteuea 25.8
S. Tabiteuea 11.9
Beru 17.7 0.09 2.71 5.15 3.66 1.56 13.2 74 1.85 0 1.62 0 3.47 16.6
Nikunau 19.1 0 6.6 4.69 2.9 1.78 16.0 84 1.05 0.61 1.12 0 2.78 18.8
Onotoa 15.6 0.43 3.29 2.72 1.65 0.92 9.0 58 1.59 0 0.59 0 2.18 11.2
Tamana 4.7 0 1.97 0.91 0.58 0.29 3.8 80 0.75 0 0.11 0 0.86 4.6
Arorae 9.5 0 3.07 0.24 0.87 1.13 5.3 56 1.18 0 0.47 0 1.65 7.0
Teraina 9.6
Tabuaeran 33.7
Xmas 388.4 0 6.13 12.97 19.38 148 186.2 48 4.24 61.7 89.15 47.12 202.2 388.4
Canton 9.2
Total 599.1 7.9 56.6 52.0 57.2 176.0 349.5 58 26.0 67.7 98.6 50.2 242.5 592.0
Source: Lands Division, MELAD.
The total area of mangroves (790 hectares) multiplied by the estimated carbon stored in mangrove biomass (563 tCO2/ha; Table 22) gives an estimate of 445,000 t CO2 as the total quantity of carbon stored in mangrove biomass. By the same reasoning, the estimated total quantity of carbon stored in mangrove soils is 1,422,000 tCO2. Therefore, the total stock of carbon stored in mangroves in Kiribati is estimated to be 1,867,000 tCO2.
The quantity of carbon that is added to this stock each year is estimated to be approximately 5,000 t CO2/year. This is the annual service provided by mangroves that we value in this study.
61NATIONAL MARINE ECOSYSTEM SERVICE VALUATION KIRIBATI
6.6.4 VALuEThe value per tonne of CO2 is the social cost of carbon (SCC), which is the monetary value of damages caused by emitting one more tonne of CO2 in a given year (Pearce 2003). The SCC therefore also represents the value of damages avoided for a small reduction in emissions, in other words, the benefit of CO2 sequestration (US EPA 2014). The SCC is intended to be a comprehensive estimate of climate change damage but due to current limitations in the integrated assessment models and data used to estimate SCC, it does not include all important damages and is likely to underestimate the full damage from CO2 emissions. The estimated SCC used by the US EPA and other US agencies for appraisal of emissions reductions in 2015 is US$ 61, using an annual discount rate of 2.5%.
The value of the ongoing sequestration of carbon in Kiribati is therefore A$ 337,000 (US$ 304,000) per year. This is computed by multiplying the quantity of carbon that is added to the stock of carbon stored in mangroves (approximately 5,000 tCO2/year) by the SCC (US$ 61).
6.7 RESEARCh, MANAgEMENT ANd EdUCATION
6.7.1 IdEnTIFYPeople study animals, plants and natural habitats for several reasons but in most cases the ultimate aim is to learn something useful that people, including future generations, can benefit from. For instance, people study marine animals or a particular fish in order to understand their habitat, their mating or breeding time, their breeding ground, their lifecycle, their food and place in the food chain. This information is important to fishers as well as to people managing the stock of fish, including planners and policy-makers. More efficient fishing methods or more effective management methods can be formulated with knowledge of the fish’s habitat, life history and behaviour. Lack of knowledge about species exploitation can result in overfishing and, possibly, a decline or an extinction of that species and other species dependent on it. For instance, in Kiribati, particularly on South Tarawa, it was very common to catch and eat a small fish (about 10 cm in length) known as tetarabuti up to the 1970s. When the fishing company TeMautari28 was set up in 1981, the company fishing vessels used the small fish as their bait and quickly the fish disappeared from the lagoons of most islands. With no more bait, the fishing vessels could no longer fish and the company’s profit dropped significantly. After some years, the company, once hailed as the future of country, was forced to close down. In the meantime, i-Kiribati who used these fish for food had to find alternative food sources.
The eventual demise of TeMautari Limited highlighted the importance of so many things that planners and policy-makers need to know or be aware of, including knowledge of the lagoon or the fish ecosystem. For example, not knowing the biology or lifecycle of the tetarabuti meant that the reproductive rate of the fish was unknown so the fish was over-harvested to near-extinction. There were other reasons why TeMautari failed, such as inappropriate fishing methods, the wrong type of fishing vessels, the high cost of transportation, the lack of markets, and other factors. Many of these could have been avoided had there been a good understanding of the marine ecosystems and applying a scientifically-based fisheries management system.
Scientific studies of the marine environment, for example the Phoenix Islands, contribute to the understanding of the resources available and the formulation of appropriate strategies to develop and sustain the wealth or benefits from such areas.
6.7.2 OBJECTIVEThis section explores and discusses the economic value of research and education related to marine ecosystems in Kiribati. Unfortunately, there are few data on this topic. However, the Phoenix Islands and the surrounding seas have been designated a protected marine reserve (PIPA; Figure 10) and it is hoped that researchers around the world will be attracted to this site in the future. The importance of PIPA as a research area is underlined in a Ministry of Environment project document submitted to the United Nations for GEF funding:
28 The company vessels are all pole and line vessels. The company, after suffering severe financial problems, closed in 2001 and was replaced by the CCPL (Central Pacific Products Limited).
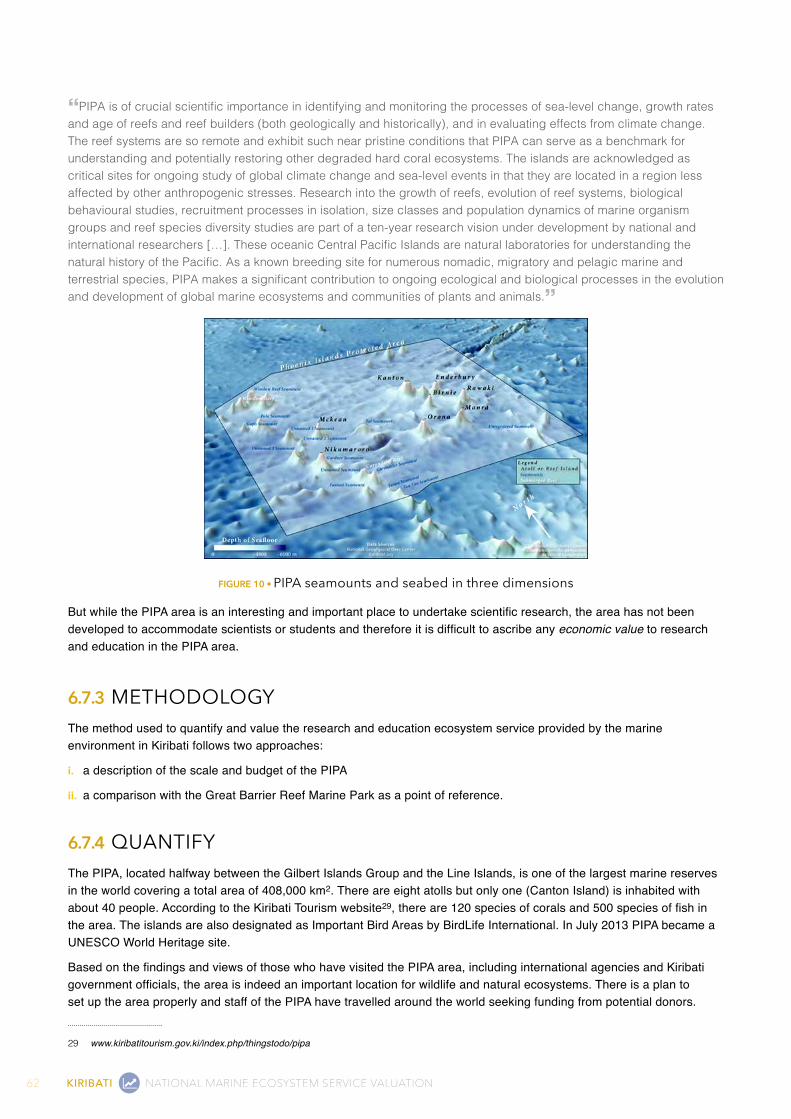
62 KIRIBATI NATIONAL MARINE ECOSYSTEM SERVICE VALUATION
“PIPA is of crucial scientific importance in identifying and monitoring the processes of sea-level change, growth rates and age of reefs and reef builders (both geologically and historically), and in evaluating effects from climate change. The reef systems are so remote and exhibit such near pristine conditions that PIPA can serve as a benchmark for understanding and potentially restoring other degraded hard coral ecosystems. The islands are acknowledged as critical sites for ongoing study of global climate change and sea-level events in that they are located in a region less affected by other anthropogenic stresses. Research into the growth of reefs, evolution of reef systems, biological behavioural studies, recruitment processes in isolation, size classes and population dynamics of marine organism groups and reef species diversity studies are part of a ten-year research vision under development by national and international researchers […]. These oceanic Central Pacific Islands are natural laboratories for understanding the natural history of the Pacific. As a known breeding site for numerous nomadic, migratory and pelagic marine and terrestrial species, PIPA makes a significant contribution to ongoing ecological and biological processes in the evolution and development of global marine ecosystems and communities of plants and animals.”
FigurE 10 • PIPA seamounts and seabed in three dimensions
But while the PIPA area is an interesting and important place to undertake scientific research, the area has not been developed to accommodate scientists or students and therefore it is difficult to ascribe any economic value to research and education in the PIPA area.
6.7.3 METHOdOLOGYThe method used to quantify and value the research and education ecosystem service provided by the marine environment in Kiribati follows two approaches:
i. a description of the scale and budget of the PIPA
ii. a comparison with the Great Barrier Reef Marine Park as a point of reference.
6.7.4 QuAnTIFYThe PIPA, located halfway between the Gilbert Islands Group and the Line Islands, is one of the largest marine reserves in the world covering a total area of 408,000 km2. There are eight atolls but only one (Canton Island) is inhabited with about 40 people. According to the Kiribati Tourism website29, there are 120 species of corals and 500 species of fish in the area. The islands are also designated as Important Bird Areas by BirdLife International. In July 2013 PIPA became a UNESCO World Heritage site.
Based on the findings and views of those who have visited the PIPA area, including international agencies and Kiribati government officials, the area is indeed an important location for wildlife and natural ecosystems. There is a plan to set up the area properly and staff of the PIPA have travelled around the world seeking funding from potential donors.
29 www.kiribatitourism.gov.ki/index.php/thingstodo/pipa
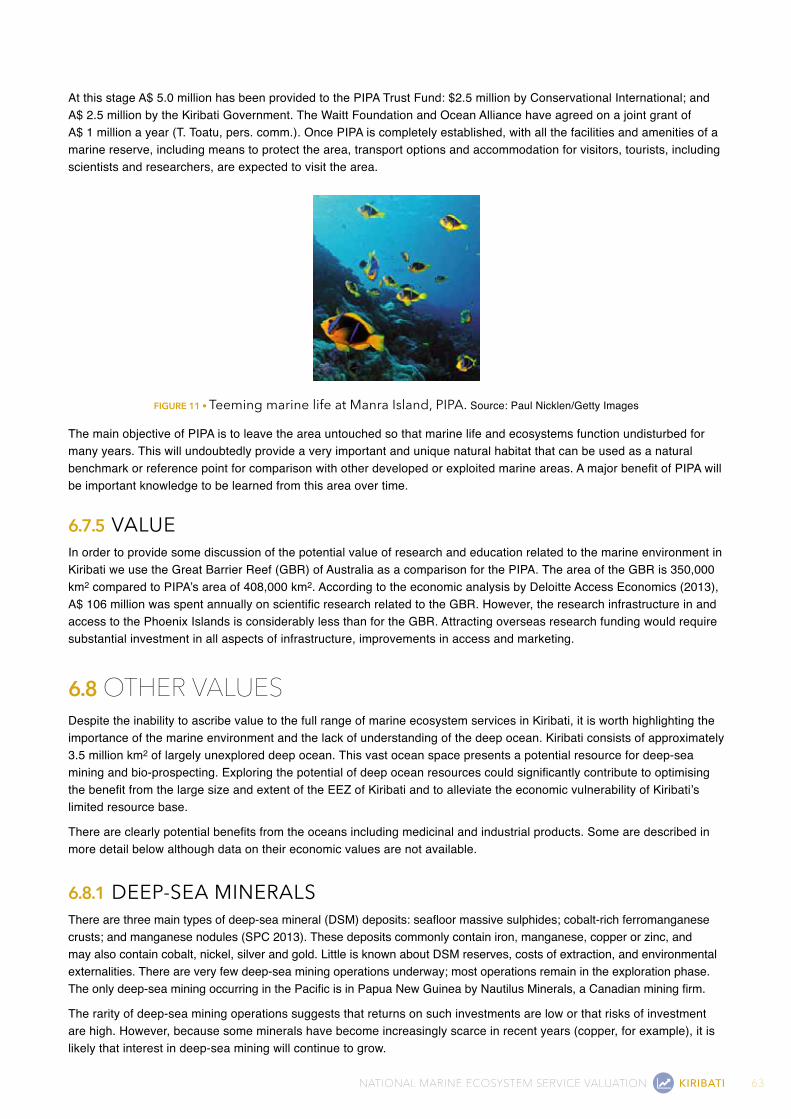
63NATIONAL MARINE ECOSYSTEM SERVICE VALUATION KIRIBATI
At this stage A$ 5.0 million has been provided to the PIPA Trust Fund: $2.5 million by Conservational International; and A$ 2.5 million by the Kiribati Government. The Waitt Foundation and Ocean Alliance have agreed on a joint grant of A$ 1 million a year (T. Toatu, pers. comm.). Once PIPA is completely established, with all the facilities and amenities of a marine reserve, including means to protect the area, transport options and accommodation for visitors, tourists, including scientists and researchers, are expected to visit the area.
FigurE 11 • Teeming marine life at Manra Island, PIPA. Source: Paul Nicklen/Getty Images
The main objective of PIPA is to leave the area untouched so that marine life and ecosystems function undisturbed for many years. This will undoubtedly provide a very important and unique natural habitat that can be used as a natural benchmark or reference point for comparison with other developed or exploited marine areas. A major benefit of PIPA will be important knowledge to be learned from this area over time.
6.7.5 VALuEIn order to provide some discussion of the potential value of research and education related to the marine environment in Kiribati we use the Great Barrier Reef (GBR) of Australia as a comparison for the PIPA. The area of the GBR is 350,000 km2 compared to PIPA’s area of 408,000 km2. According to the economic analysis by Deloitte Access Economics (2013), A$ 106 million was spent annually on scientific research related to the GBR. However, the research infrastructure in and access to the Phoenix Islands is considerably less than for the GBR. Attracting overseas research funding would require substantial investment in all aspects of infrastructure, improvements in access and marketing.
6.8 OThER VALUESDespite the inability to ascribe value to the full range of marine ecosystem services in Kiribati, it is worth highlighting the importance of the marine environment and the lack of understanding of the deep ocean. Kiribati consists of approximately 3.5 million km2 of largely unexplored deep ocean. This vast ocean space presents a potential resource for deep-sea mining and bio-prospecting. Exploring the potential of deep ocean resources could significantly contribute to optimising the benefit from the large size and extent of the EEZ of Kiribati and to alleviate the economic vulnerability of Kiribati’s limited resource base.
There are clearly potential benefits from the oceans including medicinal and industrial products. Some are described in more detail below although data on their economic values are not available.
6.8.1 dEEP-SEA MInERALSThere are three main types of deep-sea mineral (DSM) deposits: seafloor massive sulphides; cobalt-rich ferromanganese crusts; and manganese nodules (SPC 2013). These deposits commonly contain iron, manganese, copper or zinc, and may also contain cobalt, nickel, silver and gold. Little is known about DSM reserves, costs of extraction, and environmental externalities. There are very few deep-sea mining operations underway; most operations remain in the exploration phase. The only deep-sea mining occurring in the Pacific is in Papua New Guinea by Nautilus Minerals, a Canadian mining firm.
The rarity of deep-sea mining operations suggests that returns on such investments are low or that risks of investment are high. However, because some minerals have become increasingly scarce in recent years (copper, for example), it is likely that interest in deep-sea mining will continue to grow.

64 KIRIBATI NATIONAL MARINE ECOSYSTEM SERVICE VALUATION
Early mineral explorations in Kiribati waters in the 1960s and 1970s identified the presence of polymetallic nodules and cobalt-rich crusts. Later explorations by SOPAC and Japan confirmed the presence of mineral deposits but no studies have yet assessed the economic viability of potential minerals for exploration and mining30.
6.8.2 BIO-PROSPECTInGBio-prospecting is the process of discovering and commercialising new products from natural sources. Marine resources, particularly in areas with high biodiversity such as coral reefs or unique ecology such as deep-sea thermal vents, may have potentially marketable products or elements that could lead to marketable products. Deep-sea bio-prospecting is a relatively new field but already several patents have been developed for products from deep-sea organisms. The Nagoya Protocol on Access to Genetic Resources and the Fair and Equitable Sharing of Benefits Arising from their Utilization is an international agreement which aims at sharing the benefits arising from the use of genetic resources in a fair and equitable way.
6.8.3 MARICuLTuREMariculture is a specialised branch of aquaculture involving the cultivation of marine organisms for food and other products in the open ocean, an enclosed section of the ocean, or in tanks, ponds or raceways which are filled with seawater.
In Kiribati there are enclosed ponds that are used for breeding and cultivation of fish, especially milkfish (Chanos chanos). Some ponds are natural ponds while some are man-made or artificial ponds. Some ponds start off as natural ponds but people, seeing that they can breed fish in them, start to clean and look after them, like their own babai pits or food gardens. Quoting from Campbell and Hanich (2014):
“Kiribati has been farming milkfish in ponds for subsistence purposes for more than a century […]. It has been reported that ‘every Island Council in Kiribati has a milkfish farm’ […] but this may no longer be the case.”On Christmas Island, there are many natural ponds filled with milkfish (Figure 12) and the government has closed off some ponds to the public, holding these as reserves for milkfish that can be exported overseas. Milkfish export from Christmas Island is generally in small volumes and infrequent because of the lack of international transport. Air Nauru31 used to service the Tarawa–Christmas Island route, freighting small quantities of milkfish to Nauru but the airline stopped operating. CPPL exports some milkfish which it buys on ad-hoc basis from the Fisheries Division.
30 The state-owned enterprise, Marawa Research and Exploration Ltd, has applied to the International Seabed Authority to explore for seafloor manganese nodules in international waters and carry out related scientific research and environmental studies. The application covers approximately 75,000 km2 of seafloor in the north-east Pacific Ocean (Clarion-Clipperton Zone) in water depths up to 5,000 metres (www.marawaresearch.com).
31 Air Nauru is now replaced by Our Airline.
In Kiribati fishermen use a mix of traditional practices and modern equipment/tools.
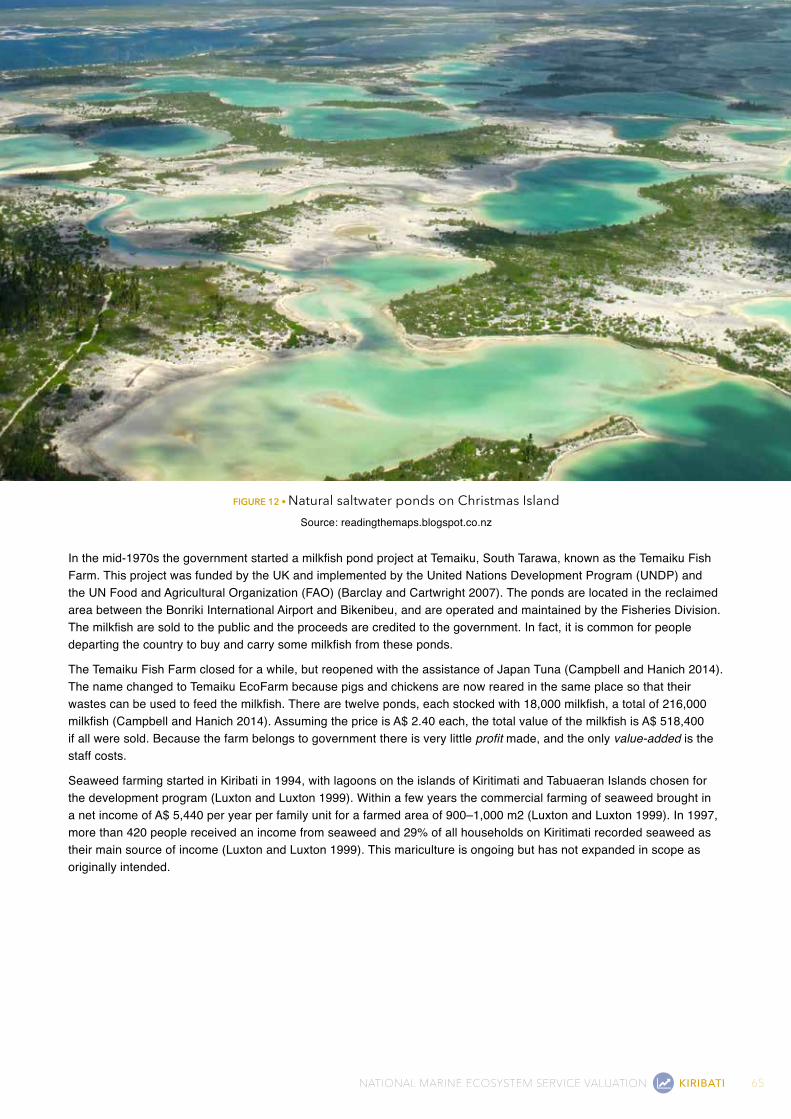
65NATIONAL MARINE ECOSYSTEM SERVICE VALUATION KIRIBATI
FigurE 12 • natural saltwater ponds on Christmas IslandSource: readingthemaps.blogspot.co.nz
In the mid-1970s the government started a milkfish pond project at Temaiku, South Tarawa, known as the Temaiku Fish Farm. This project was funded by the UK and implemented by the United Nations Development Program (UNDP) and the UN Food and Agricultural Organization (FAO) (Barclay and Cartwright 2007). The ponds are located in the reclaimed area between the Bonriki International Airport and Bikenibeu, and are operated and maintained by the Fisheries Division. The milkfish are sold to the public and the proceeds are credited to the government. In fact, it is common for people departing the country to buy and carry some milkfish from these ponds.
The Temaiku Fish Farm closed for a while, but reopened with the assistance of Japan Tuna (Campbell and Hanich 2014). The name changed to Temaiku EcoFarm because pigs and chickens are now reared in the same place so that their wastes can be used to feed the milkfish. There are twelve ponds, each stocked with 18,000 milkfish, a total of 216,000 milkfish (Campbell and Hanich 2014). Assuming the price is A$ 2.40 each, the total value of the milkfish is A$ 518,400 if all were sold. Because the farm belongs to government there is very little profit made, and the only value-added is the staff costs.
Seaweed farming started in Kiribati in 1994, with lagoons on the islands of Kiritimati and Tabuaeran Islands chosen for the development program (Luxton and Luxton 1999). Within a few years the commercial farming of seaweed brought in a net income of A$ 5,440 per year per family unit for a farmed area of 900–1,000 m2 (Luxton and Luxton 1999). In 1997, more than 420 people received an income from seaweed and 29% of all households on Kiritimati recorded seaweed as their main source of income (Luxton and Luxton 1999). This mariculture is ongoing but has not expanded in scope as originally intended.
66 KIRIBATI NATIONAL MARINE ECOSYSTEM SERVICE VALUATION
6.8.4 CuLTuRAL VALuES OF MARInE And COASTAL RESOuRCES OF KIRIBATIMarine and coastal resources have been of great importance and significance to the Kiribati people since early settlement of Kiribati. The marine and coastal resources provide not only vital sources of food, but also cultural and recreational benefit to the people, especially those living on the outer islands. Unfortunately, as in most countries, the significance of the cultural values and practices has diminished over time as people embrace modern culture and lifestyles. Some of the traditional or cultural activities related to the ocean and marine life are explained below but are no longer widely practised although they still form part of the essence of the i-Kiribati. All information is based on the author’s personal knowledge or from Norman (2010).
TeKauti (the energising ritual)This is a traditional practice of rising early in the morning (when it is still dark), practicing some dancing, singing or martial art, and then swimming in the cool sea. Usually the practitioner must face the waves or swim against the waves. The idea behind this ritual is that the practitioner will be energised or given extra energy (karin ang) by the waves. This is usually done before a dancing or singing competition, but nowadays people also do the practice before major games like soccer or basketball. This is a fairly well known practice and people now use the term ebure am kauti when for some reason what they set out to do, or what they had in mind did not happen the way they intended. Literally, the term means ‘wrong wake-up’.
Playing on the beachThe sandy white beach has been a central location for recreational activities in Kiribati since the early days. This makes sense, at least in the past, because Kiribati did not have recreational parks or play grounds as in most Western countries. Local people wrestle on the beach and at night, especially when it is full moon, children would gather on the beach singing, dancing, or simply chasing each other around. It is now very rare to see people gathering and singing or dancing under the trees, especially at night. The beach has significant cultural value, but it now polluted with plastics, cans, trash, etc. This is especially true on South Tarawa.
Swimming in the coastal seasAnother popular cultural or recreational activity in Kiribati is swimming in the sea. Again this makes sense because of the smallness of the land and the proximity of the sea — it takes usually about ten minutes or less to cross the island from the lagoon to the ocean. Practically all people in Kiribati can swim and have no problem travelling on canoes and ships. Swimming in the sea also brings people together and allows social interaction. There is a feeling of fun and joy, and of course relaxation, when swimming in the warm coastal waters. Some local doctors also advise their patients to swim in the sea to cure or heal their illnesses. The coastal waters certainly have a rich cultural value to people in Kiribati ranging from recreation to medical purposes.
Traditional activitiesSome cultural activities in Kiribati, like dancing, singing and building houses, require marine and coastal resources. For example, large meeting halls (maneaba) use the rock along the coast as posts. These rocks are usually very hard and very difficult to cut but there are traditional techniques that people use to cut the rocks. When the rocks have been cut, they will be carried inland to the site of the maneaba. The maneaba is the focal point of Kiribati society, and continues today to serve as a supreme institution where important decisions are made.
In dancing, dried sea shells are used as ornaments and the fine sand from the ocean beach is used on the face and body. Local composers also sit on the beach in remote locations and start composing songs after listening to the sound of the wind and the waves. Some singers drink saltwater to improve the sound and tone of their voice.
67NATIONAL MARINE ECOSYSTEM SERVICE VALUATION KIRIBATI
Kiribati mythsLike most countries, Kiribati has its own version of how the world was created and the origin of the present population. These are told in Kiribati myths; marine creatures are prominent in the myths. For instance, according to Norman (2010) Riiki the eel was responsible for separating the sky and the land:
“One of these people, the tallest amongst them was Riiki (Riiki the Eel), who had a body like a very long rope, twisting around filling holes all over the ground. One day the people realised this unique physical characteristic would be useful and asked Riiki to lift up the sky, for he was the only person capable of doing so. He agreed and with their help he began to push the sky upwards and when they could not reach any higher he continued alone…”The next two prominent characters according to Norman (2010) are Bakoa (shark) and Tabakea (land turtle). These two are sometimes referred to as humans, and sometimes as spirits. Marine creatures are important in most Kiribati myths.
FeastingUsually when there is a big function in Kiribati, especially on the outer islands, the main food is fish or marine foods, such as tuna, snappers, sharks, turtles, clam or other sea shells. It is very rare to have an important function without fish or marine foods. Any feasting without marine foods is like a foreign event with no local context.
6.9 SUMMARY Of VALUESIn summary, the monetary value of marine ecosystem services runs into millions of dollars. While it is possible to put monetary value on some ecosystem services, there are other services or benefits that people derive from the environment and natural resources that are difficult to value in monetary terms. These include cultural values and the potential value of minerals on the seabed. Table 1 (page 3) summarises the economic value estimated for marine ecosystem services identified in this study.

69NATIONAL MARINE ECOSYSTEM SERVICE VALUATION KIRIBATI
7. dISCUSSIONAn important conclusion from the project is that the monetary value of the ecosystem services is in the order of millions of dollars. These magnitudes are significant given that the GDP per capita is less than A$ 2,000. Yet the exercise did not cover all marine ecosystems, and only a few elements within the ecosystems selected. The high monetary values therefore strongly support the argument that the environment and the natural resources are of great social and economic value to the people of Kiribati and to the rest of the world.
The valuation has clearly demonstrated that the value and significance of the marine environment and natural assets of Kiribati are of national and international concern, and they must be safeguarded and managed well to secure those benefits into the future. The environment should no longer be primarily the concern of the Ministry of Environment. Although there are data gaps, and many discrepancies in estimated values among different studies, the magnitude of the value clearly suggests that the environment and natural resources, and the services that are provided by such, are too important to ignore.
It is clear that further data collection and analysis is needed to refine values of ecosystem services. Collecting and compiling natural resource or environmental statistics has always been a formidable task because the raw data are very difficult to collect. The National Statistics Office needs ecosystem services data for various reasons, one of which is to produce a comprehensive economic description of the country. However, the data are sporadically generated or collected by different ministries, and often in a form that is not very useful for economic analysis. In some instances, the ministries are reluctant to give their data to the National Statistics Office because of uncertainty about its use. In fact, the National Statistics Office should conduct regular household surveys to collect primary data but the office has insufficient funds; only two household and income surveys have been conducted since independence, one in 1996, and the second in 2006.
There is keen interest in the Ministry of Environment (MELAD) in repeating this valuation on a regular basis with other key stakeholders (e.g. KNSO). However, ministry staff need training in how to conduct economic valuation. There is also a need to determine how the data will be compiled and by whom. Data collection systems in ministries should be reviewed in order to produce the required data for the economic valuation exercise. Most importantly, the responsibility to carry out the economic valuation exercise should be formally assigned to an agency or person within government, otherwise, the impetus to continue this work may be lost once this initial exercise has been completed.
70 KIRIBATI NATIONAL MARINE ECOSYSTEM SERVICE VALUATION
8. RECOMMENdATIONS1. Given that there are significant gaps in data on ecosystems and ecosystem services, priority should be given to
establishing statistical units or monitoring agencies within each major ministry responsible for the biodiversity and natural resources of Kiribati, such as the Ministries of Environment (including the Agriculture and the Lands Divisions), Fisheries and Tourism.
2. In cases where such organisations have already been established, the focus should be on training existing staff to collect and analyse the information needed for monitoring and valuation of ecosystem services.
3. More generally, an in-depth and concerted effort should be made to train staff at the senior level on economic tools and techniques to assess and evaluate ecosystems and their related services.
4. It is worth noting that there are existing networks, such as the outer island fisheries and agriculture officers that can be used to collect subsistence and commercial data from the outer islands. In fact, some have already started collecting statistics but need training on the new set of statistics required.
5. The National Statistics Office, as the designated government agency responsible for collecting and compiling statistics for the whole country, is an ideal institution to carry out ecosystem valuation work, as part of the national accounts. The office has the legal backing to collect or obtain information from government agencies and staff with appropriate analytical skills to analyse the data.
6. Preliminary results (this report) show that the monetary value of ecosystem services is substantial. Therefore, it is timely for the Government of Kiribati and development partners to place a higher priority on ecosystems in Kiribati and to maintain existing ecosystems in a healthy and sustainable state.
Photo: © Rimon Photography
RIMAGE ©
71NATIONAL MARINE ECOSYSTEM SERVICE VALUATION KIRIBATI
9. CAVEATS ANd CONSIdERATIONSThere is a dearth of statistics in Kiribati, in particular on environment and ecosystems. A review of data gathering is needed to obtain better statistics for monitoring and planning in the future.
The absence or the lack of data has been problematic. Even the few data that were collected took considerable time to locate and retrieve and were often not specifically tailored for our purpose.
There is very good information in the HIES (KNSO 2006). However, given the time constraints of the HIES, it is likely that the true value of subsistence fishing in the country is underestimated. This would explain some of the discrepancies in values derived in the subsistence section of this report.
To obtain better information on the value of aggregates it would be useful to conduct a survey of construction firms (including private individuals) to estimate the quantity of gravel and sand they use in their construction activities. Time and funding constraints of this project prevented such a survey.
Photo: © Rimon Photography

73NATIONAL MARINE ECOSYSTEM SERVICE VALUATION KIRIBATI
10. REfERENCESBadola R, Hussain SA (2005) Valuing ecosystem functions: an
empirical study on the storm protection function of Bhitarkanika mangrove ecosystem, India. Environmental Conservation 32: 85–92.
Barbier EB, Hacker SD, Kennedy C, Koch EW, Stier AC, Silliman BR (2011) The value of estuarine and coastal ecosystem services. Ecological Monographs 81(2): 169–193.
Barbier EB, Koch EW, Silliman BR, Hacker SD, Wolanski E, Primavera J, Granek EF, Polasky S, Aswani S, Cramer LA, Stoms DM, Kennedy CJ, Bael D, Kappel CV, Perillo GME, Reed DJ (2008) Coastal ecosystem-based management with nonlinear ecological functions and values. Science 319: 89–98.
Barclay K, Cartwright I (2007) Capturing wealth from tuna: case studies from the Pacific. ANU E Press and Asia Pacific Press, Canberra.
Battle M, Bender ML, Tans PP, White JWC, Ellis JT, Conway T, Francey RJ (2000) Global carbon sinks and their variability inferred from atmospheric O2 and 13C. Science 287: 2467–2470.
Bell J, Kronen M, Vunisea A, Nash WJ, Keeble G, Demmke A, Pontifex S, Andrefouet A (2009) Planning the use of fish for food security in the Pacific. Marine Policy 33: 64–76.
Brander RW, Kench PS, Hart D (2004) Spatial and temporal variations in wave characteristics across a reef platform, Warraber Island, Torres Strait, Australia. Marine Geology 207: 169–184.
Burke L (2004) Reefs at risk in the Caribbean: economic valuation methodology. Working Paper, World Resources Institute, Washington DC. Available at www.wri.org/coastal-capital.
Burke L, Greenhalgh S, Prager D, Cooper E (2008) Coastal capital: economic valuation of coral reefs in Tobago and St. Lucia. World Resources Institute, Washington DC.
Campbell B, Hanich Q (2014) Fish for the future: Fisheries development and food security for Kiribati in an era of global climate change. Project Report: 2014-47. WorldFish, Penang, Malaysia.
CSIRO (Commonwealth Scientific and Industrial Research Organisation), Australian Bureau of Meteorology (2007) Climate Change in Australia Technical Report 2007. Chapter 5: Regional climate change projections. CSIRO Marine and Atmospheric Research, Aspendale, Australia.
Deloitte Access Economics (2013) Economic contribution of the Great Barrier Reef. Great Barrier Reef Marine Park Authority, Townsville.
Done TJ, Ogden JC, Wiebe WJ, Rosen BR (1996) Biodiversity and ecosystem function of coral reefs. Pp 393–429 in HA Mooney, JH Cushman, E Medina, OE Sala, E-D Schulze (eds), Functional roles of biodiversity: a global perspective. John Wiley and Sons Ltd.
FAO (Fisheries and Agriculture Organization of the United Nations) (2008) The State of World Fisheries and Aquaculture. FAO Fisheries, Rome.
Gillett R (2009) Fisheries in the Economies of the Pacific Island Countries and Territories. Asian Development Bank, Manila, Philippines.
Government of Kiribati (2006) Kiribati National Biodiversity Strategies and Action Plan 2005. Environment Conservation Division, Ministry of Environment, Tarawa.
Government of Kiribati (2009) Phoenix Islands Protected Area Management Plan 2010–2014. Available at http://whc.unesco.org/en/list/1325.
Government of Kiribati (2012a) Kiribati Development Plan 2012–2015 National Planning Office, Tarawa.
Government of Kiribati (2012b) Kiribati National Fisheries Policy 2013–2025. Ministry of Fisheries and Marine Resources Development, Kiribati.
Government of Kiribati (2013) Kiribati Integrated Environmental Policy. Environment Conservation Division, Ministry of Environment, Tarawa.
Greer Consulting Services (2007) Economic analysis of aggregates mining on Tarawa. Project Report 71b, EU EDF 8 – SOPAC (Pacific Islands Applied GeoScience Commission), 52 pp.
Hilmi N, Allemand D, Betti M, Gattuso JP, Kavanagh C, Lacoue-Labarthe T, Moschella P, Reynaud S, Warnau M (2013) Ocean acidification impacts on fisheries and aquaculture. In 2nd International workshop on the economics of ocean acidification: Bridging the gap between ocean acidification impacts and economic valuation, Oceanographic Museum of Monaco, 11–13 November 2012.
Huang J, Huang J-C, Poor PJ, Zhao MQ (2007) Economic valuation of beach erosion control. Marine Resource Economics 32: 221–238.
IFRECOR (2011) Guide méthodologique pour l’évaluation économique des récifs coralliens et écosystèmes associés (mangroves et herbiers). Rapport technique, Thème d’Interêt Transversal “socio-économie» des récifs coralliens. Document de travail de l’Initiative Française pour les Récifs Coralliens (IFRECOR). 90 pp.
Kench PS, Brander RW (2009) Wave processes on coral reef flats: implications for reef geomorphology using Australian case studies. Journal of Coastal Research 22: 209–221.
Kiribati Tourism Office (2014) Kiribati Tourist Survey. South Pacific Tourism, Suva, Fiji.
KNSO (Kiribati National Statistics Office) (2006) Report on the Household Income and Expenditure Survey: 2005. National Statistics Office, Tarawa.
KNSO (Kiribati National Statistics Office) (2012) Report on the Kiribati 2010 Population and Housing Census. National Statistics Office, Tarawa.
KNSO (Kiribati National Statistics Office) (2014) Kiribati 2010 Population Census: Labour Force Monograph. National Statistics Office, Tarawa.
Laurans Y, Pascal N, Binet T, Brander L, Clua E, David G, Rojat D, Seidl A (2013) Economic valuation of ecosystem services from coral reefs in the South Pacific: taking stock of recent experience. Journal of Environmental Management 116: 135–144.
Lewis SL, Lopez-Gonzalez G, Sonké B, Affum-Baffoe K, Baker TR, Ojo LO, Phillips OL Reitsma JM, White L, Comiskey JA, et al. (2009) Increasing carbon storage in intact African tropical forests. Nature 457: 1003–1006.
Lovelock CE, Skilleter GA, Saintilan N (2012) Tidal wetlands. In: ES Poloczanska, AJ Hobday and AJ Richardson (Eds) Marine Climate Change Impacts and Adaptation Report Card for Australia 2012. Available at www.oceanclimatechange.org.au. Accessed December 2014.

74 KIRIBATI NATIONAL MARINE ECOSYSTEM SERVICE VALUATION
Lugo-Fernandez A, Roberts HH, Wiseman WJ Jr (1998) Tide effects on wave attenuation and wave set-up on a Caribbean coral reef. Estuarine, Coastal and Shelf Science 47: 385–393.
Luxton D, Luxton P (1999) Development of commercial Kappaphycus production in the Line Islands, Central Pacific. Hydrobiologia 398/399: 477–486.
Marchand C, Allenbach M, Lallier-Verges E (2011) Relationships between heavy metals distribution and organic matter cycling in mangrove sediments (Conception Bay, New Caledonia). Geoderma 160(3): 444–456.
Mermet L, Laurans Y, Leménage T (2014) Tools for what trade? Analysing the Utilization of Economic Instruments and Valuations in Biodiversity Management. Agence Française de Développement, Paris, France.
MSWG (Marine Sector Working Group of the Council of Regional Organisations in the Pacific, CROP) (2005) Pacific Islands Regional Ocean Policy and Framework for Integrated Strategic Action. SPC, Noumea.
Murray B, Pendleton L, Jenkins AW, Sifleet S (2011) Green payments for blue carbon: economic incentives for protecting threatened coastal habitats. Report NI R 11-04, Nicholas Institute, Washington DC.
Norman RM (2010) English translations of the Butaritari stories. Available at www.kiribatistories.com/wp-content/uploads/Kiribati-Stories-copyright-Rosa-Muller-Norman.pdf. Accessed 14 March 2015.
PA Consulting Group (2006) Taxation and operating costs for the Caribbean hotel sector. A study prepared for the Caribbean Hotel Association. Retrieved from: www.caribbeanhotelandtourism.com/cshae/.../Tax-and-Tourism-Study. Accessed 28 Nov 2014.
Parnis E (2012) Cook Island News, 3 April 2012.
Pascal N (2014) Analysis of economic benefits of mangrove ecosystems. Case studies in Vanuatu: Eratap and Crab Bay. Technical report for International Union for Conservation of Nature, Oceania Regional Office, Mangrove EcoSystems for Climate Change Adaptation & Livelihoods Project. IUCN, Fiji. 147 pp.
Pascal N (2015) Economic valuation of marine and coastal ecosystem services : ecosystem service of coastal protection — Fiji, Kiribati, Tonga, Vanuatu and the Solomon Islands. Report to the MACBIO Project. GIZ/IUCN/SPREP, Suva, Fiji.
PCRAFI (Pacific Catastrophe Risk Assessment and Financing Initiative) (2011) Risk assessment methodology. Technical report. World Bank, Asian Development Bank and SPC/SOPAC. 18 pp.
Pearce D (2003) The social cost of carbon and its policy implications. Oxford Review of Economic Policy 19(3): 362–384.
Pearson TH (2001) Functional group ecology in soft-sediment marine benthos: The role of bioturbation. Oceanography and Marine Biology: an Annual Review 39: 233–267.
Penning-Rowsell E, Johnson C, Tunstall S (2003) The benefits of flood and coastal defence: techniques and data for 2003. Research Paper. Flood Hazard Research Centre, Middlesex University, UK.
Pérez-Maqueo O, Intralawana A, Martíneza ML (2007) Coastal disasters from the perspective of ecological economics. Ecological Economics 63: 273–284.
PIFS (Pacific Island Forum Secretariat) (2007) The Pacific plan for strengthening regional cooperation and integration. Pacific Island Forum Secretariat, Suva, Fiji.
Pratt C, Govan H (2011) Framework for a Pacific Oceanscape: a catalyst for implementation of ocean policy. Pacific Island Forum Secretariat, Suva, Fiji.
Ram-Bidesi V, Petaia S (2010) Socio-economic assessment of fishing practices by North and South Tarawa fishers in Kiribati. Report submitted to Secretariat of the Pacific Regional Environment Programme and Fisheries Division, Ministry of Marine Resources Development, Kiribati, 30 July 2010.
Republic of Kiribati (2012) The Constitution of Kiribati (Chapter Iv) Directions Assigning Ministerial Responsibility. http://www.president.gov.ki/ministries/
Salcone J, Brander L, Seidl A (2015) Pacific marine ecosystem service valuation guidebook. MACBIO IUCN/GIZ/SPREP, Suva Fiji.
Scheyvens R, Russell M (2010) Sharing the riches of tourism. Summary report — Fiji. School of People, Environment and Planning, Massey University, New Zealand. 98 pp.
Seidel H, Lal PN (2010) Economic value of the Pacific Ocean to the Pacific Island Countries and Territories. IUCN, Gland, Switzerland, 74 pp.
SPC (2013) Deep sea minerals: deep sea minerals and the green economy. E Baker Y Beaudoin (eds). Volume 2, Secretariat of the Pacific Community, Noumea.
TEEB (2012) Why value the oceans? A discussion paper. Y Beaudoin L Pendleton (eds). Available at www.teebweb.org/areas-of-work/biome-studies/teeb-for-oceans-and-coasts/. Accessed 19 March 2015.
US EPA (United States Environmental Protection Agency) (2014) Social cost of carbon. Climate Change Division, US EPA. Available at www.epa.gov/climatechange/EPAactivities/economics/scc.html.
Uwate KR, FitzGerald W, Teroroko T (2008) Valuation of Phoenix Islands marine and fisheries resources. Ministry of Environment, Lands and Agricultural Development, Tarawa.
Van Der Meulen F, Bakker TWM, Houston JA (2004) The costs of our coasts: examples of dynamic dune management from Western Europe. Pages 259–277 in ML Martinez, NP Psuty (eds), Coastal dunes: ecology and conservation. Springer–Verlag, Heidelberg, Germany.
Williams P, Terawasi P (2013) Overview of tuna fisheries in the Western and Central Pacific Ocean, including economic conditions — 2012. Paper presented at the Western and Central Pacific Fisheries Commission, Scientific Committee Ninth Regular Session, Pohnpei, Federated States of Micronesia, August 6–14 2013.
World Bank (2014) GDP per capita (current US$). World Bank, Washington DC.

75NATIONAL MARINE ECOSYSTEM SERVICE VALUATION KIRIBATI
11. ACkNOwLEdgEMENTSWe thank everyone who participated in the workshops and meetings who contributed input, guidance, data and/or information to this report and identified its utility to policy and decision-making (see participant lists in Appendix II: Stakeholder consultations, attendee lists).
We thank the Environment and Conservation Division, Kiribati Ministry of Environment, Lands and Agricultural Development (particularly Neneteiti Ruatu, Taouea Reiher). The assistance of Ms Tiriara R Moaniba, from the National Accounts Section in helping to collect data from ministries was much appreciated, as was the assistance from other ministry staff who provided raw data and other information.
We also thank the MACBIO team: Jan Steffen, Karl Kirsch-Jung, Riibeta Abeta, Warren Lee-Long, Pascale Salaun, Marian Gauna, Kate Davey, Philipp Gassner and Jimaima Le Grand for their support during the project.
Finally we wish to thank our tireless copy editor Vicky Nelson.
The MACBIO project is funded by the German Federal Ministry for Environment, Nature Conservation and Nuclear Safety (BMUB) through the International Climate Initiative (IKI). It is being implemented by the German Agency for International Cooperation (GIZ) in close collaboration with the Secretariat of the Pacific Regional Environment Programme (SPREP) and with technical support from the International Union for Conservation of Nature (IUCN).


77NATIONAL MARINE ECOSYSTEM SERVICE VALUATION KIRIBATI
12. APPEndIX I gLOSSARYAvoided damage cost valuation method: A cost-based valuation
technique that estimates the value of an ecosystem service by calculating the damage that is avoided to infrastructure, property and people by the presence of ecosystems.
Baseline: The starting point from which the impact of a policy or investment is assessed. In the context of ecosystem service valuation, the baseline is a description of the level of ecosystem service provision before a policy or investment intervention.
Beneficiary: A person that benefits from the provision of ecosystem system services.
Bequest value: the value to the current generation of knowing that something (e.g. pristine coral reef) will be available to future generations.
Choice modelling: Choice modelling attempts to model the decision process of an individual or segment in a particular context. Choice modelling may be used to estimate non-market environmental benefits and costs. It involves asking individuals to make hypothetical trade-offs between different ecosystem services.
Constant prices: Prices that have been adjusted to the price level in a specific year. Constant prices account for inflation and allow values to be compared across different time periods.
Consumer surplus: The difference between what consumers are willing to pay for a good and its price. Consumer surplus is a measure of the benefit that consumers derive from the consumption of a good or service over and above the price they have paid for it.
Contingent valuation: Contingent valuation is a survey-based economic technique for the valuation of non-market resources, such as environmental preservation or the impact of contamination. It involves determining the value of an ecosystem service by asking what individuals would be willing to pay for its presence or maintenance.
Cost-benefit analysis: An evaluation method that assesses the economic efficiency of policies, projects or investments by comparing their costs and benefits in present value terms. This type of analysis may include both market and non-market values and accounts for opportunity costs.
Direct use value: The value derived from direct use of an ecosystem, including provisioning and recreational ecosystem services. Use can be consumptive (e.g. fish for food) or non-consumptive (e.g viewing reef fish).
Discount rate: The rate used to determine the present value of a stream of future costs and benefits. The discount rate reflects individuals’ or society’s time preference and/or the productive use of capital.
Discounting: The process of calculating the present value of a stream of future values (benefits or costs). Discounting reflects individuals’ or society’s time preference and/or the productive use of capital. The formula for discounting or calculating present value is: present value = future value/(1+r)n, where r is the discount rate and n is the number of years in the future in which the cost or benefit occurs.
Economic activity analysis: An analysis that tracks the flow of dollars spent within a region (market values). Both economic impact and economic contribution analysis are types of economic activity analysis.
Economic activity: The production and consumption of goods and services. Economic activity is conventionally measured in monetary terms as the amount of money spent or earned and may include ‘multiplier effects’ of input costs and wages
Economic benefit: the net increase in social welfare. Economic benefits include both market and non-market values, producer and consumer benefits. Economic benefit refers to a positive change in human wellbeing.
Economic contribution: The gross change in economic activity associated with an industry, event, or policy in an existing regional economy.
Economic cost: A negative change in human wellbeing.Economic impact: The net changes in new economic activity
associated with an industry, event, or policy in an existing regional economy. It may be positive or negative.
Economic value: i) The monetary measure of the wellbeing associated with the production and consumption of goods and services, including ecosystem services. Economic value is comprised of producer and consumer surplus and is usually described in monetary terms. Or ii) The contribution of an action or object to human wellbeing (social welfare).
Ecosystem contribution factor: The degree of association between marine and coastal ecosystems and different tourist activities.
Ecosystem functions: The biological, geochemical and physical processes and components that take place or occur within an ecosystem.
Ecosystem service approach: A framework for analysing how human welfare is affected by the condition of the natural environment.
Ecosystem service valuation: Calculation, scientific and mathematic, of the net human benefits of an ecosystem service, usually in monetary units.
Ecosystem services: The benefits that ecosystems provide to people. This includes services (e.g. coastal protection) and goods (e.g. fish).
Ecosystem: A dynamic complex of plant, animal and micro-organism communities and their non-living environment interacting as a functional unit.
Evaluate: To assess the overall effect of a policy or investment.Evaluation: The assessment of the overall impact of a policy or
investment. Evaluations can be conducted before or after implementation of a policy or investment.
Existence value: The value that people attach to the continued existence of an ecosystem good or service, unrelated to any current or potential future use.
Factor cost: Total cost of all factors of production consumed or used in producing a good or service.
Financial benefit: A receipt of money to a government, firm, household or individual.
Financial cost: A debit of money from a government, firm, household or individual.
Free-on-board: The taxable value for a product. This value theoretically represents the market value of the product, although this is not always the case in practice.
Future value: A value that occurs in future time periods. See also present value.
Geographic Information Systems (GIS): An information system that captures, stores, manages, analyses and presents data that is linked to a geographic location.
Green accounting: The inclusion of information on environmental goods and services and/or natural capital in national, sectoral or business accounts.
Gross revenue: Money income that a firm receives from the sale of goods or services without deduction of the costs of producing those goods or services. Gross revenue from the sale of a good or service is computed as the price of the good (or service) multiplied by the quantity sold.
Gross value: The total amount made as a result of an activity.Hedonic pricing method: A method for pricing ecosystem services.
Hedonic price models assume that the price of a product reflects embodied characteristics valued by some implicit or shadow price.
Indirect use value: The value of ecosystems services that contribute to human welfare without direct contact with the elements of the ecosystem, for example regulating services such as plants producing oxygen or coral reefs providing coastal protection.
Inflation: A general rise in prices in an economy.
78 KIRIBATI NATIONAL MARINE ECOSYSTEM SERVICE VALUATION
Instrumental value: The importance of something as a means to providing something else that is of value. For example, a coral reef may have instrumental value in reducing risk to human life from extreme storm events.
Intermediate costs: The costs of inputs or intermediate goods that are used in the production of final consumption goods. For example, the cost of fishing gear used to catch fish is an intermediate cost to the harvest and sale of fish.
Intrinsic value: The value of something in and for itself, irrespective of its utility to something or someone else. Not related to human interests and therefore cannot be measured with economic methods.
Marginal value: The incremental change in value of an ecosystem service resulting from an incremental change (one additional unit) in the quantity produced or consumed.
Market value: The amount for which a good or service can be sold in a given market.
Negative externality: Negative externalities occur when the consumption or production of a good causes a harmful effect to a third party.
Net revenue: Monetary income (revenue) that a firm receives from the sale of goods and services with deduction of the costs of producing those goods and services. Net revenue from the sale of a good is computed as the price of the good multiplied by the quantity sold, minus the cost of production.
Net value: The value remaining after all deductions have been made.Nominal: The term ‘nominal’ indicates that a reported value includes
the effect of inflation. Prices, values, revenues etc. reported in ‘nominal’ terms cannot be compared directly across different time periods. See also real and constant prices.
Non-use value: The value that people gain from an ecosystem that is not based on the direct or indirect use of the resource. Non-use values may include existence values, bequest values and altruistic values.
Opportunity cost: The value to the economy of a good, service or resource in its next best alternative use.
Option value: The premium placed on maintaining environmental or natural resources for possible future uses, over and above the direct or indirect value of these uses.
Present value: A value that occurs in the present time period. Present values for costs and benefits that occur in the future can be computed through the process of discounting (see discount rate). Expressing all values (present and future) in present value terms allows them to be directly compared by accounting for society’s time preferences.
Producer surplus: The amount that producers benefit by selling at a market price that is higher than the minimum price that they would be willing to sell for. Producer surplus is computed as the difference between the cost of production and the market price. Value-added, profit, and producer surplus are similar measures of the net benefit to producers. Although they differ slightly, the terms are used synonymously for this report to represent economic value.
Profit: The difference between the revenue received by a firm and the costs incurred in the production of goods and services. Value-added, profit and producer surplus are similar measures of the net benefit to producers. Although they differ slightly, the terms are used synonymously for this report to represent economic value.
Purchasing power parity adjusted exchange rate: An exchange rate that equalises the purchasing power of two currencies in their home countries for a given basket of goods.
Purchasing power parity: An indicator of price level differences across countries. Figures represented in purchasing power parity represent the relative purchasing power of money in the given country, accounting for variance in the price of goods. Typically presented relative to the purchasing power of US dollars in the United States.
Real: The term ‘real’ indicates that a reported value excludes or controls for the effect of inflation (synonymous with constant prices). Reporting prices, values, revenues etc. in ‘real’ terms allows them to be compared directly across different time periods. See also nominal and constant prices.
Regulating services: A category of ecosystem services that refers to the benefits obtained from the regulation of ecosystem processes. Examples include water flow regulation, carbon sequestration and nutrient cycling.
Rent: Any payment for a factor of production in excess of the amount needed to bring that factor into production (see also producer surplus and resource rent).
Replacement cost method: A valuation technique that estimates the value of an ecosystem service by calculating the cost of human-constructed infrastructure that would provide same or similar service to the natural ecosystem. Common examples are sea walls and wastewater treatment plants that provide similar services to reefs, mangroves, and wetland ecosystems.
Resource rent: The difference between the total revenue generated from the extraction of a natural resource and all costs incurred during the extraction process (see also producer surplus). Refers to profit obtained by individuals or firms because they have unique access to a natural resource.
Revenue: Money income that a firm receives from the sale of goods and services (often used synonymously with gross revenue).
Social cost of carbon: The social cost of carbon is an estimate of the economic damages associated with a small increase in carbon dioxide (CO2) emissions, conventionally one tonne, in a given year. This dollar figure also represents the value of damages avoided for a small emission reduction (i.e. the benefit of a CO2 reduction).
Stated preference survey method: A survey method for valuation of non-market resources in which respondents are asked how much they would be willing to pay (or willing to accept) to maintain the existence of (or be compensated for the loss of) an environmental feature such as biodiversity.
Supporting services: A category of ecosystem services that are necessary for the production of all other ecosystem services. Examples include nutrient cycling, soil formation and primary production (photosynthesis).
Total economic value: i) All marketed and non-marketed benefits (ecosystem services) derived from any ecosystem, including direct, indirect, option and non-use values, or ii) The total value to all beneficiaries (consumer, producer, government, local, foreign) from any ecosystem service.
Use value: Economic value derived from the human use of an ecosys-tem. It is the sum of direct use, indirect use and option values.
User cost: The cost incurred over a period of time by the owner of a fixed asset as a consequence of using it to provide a flow of capital or consumption services; the implications of current consumption decisions on future opportunity. User cost is the depreciation on the asset resulting from its use.
Utilitarian value: A measure of human welfare or satisfaction. Synonymous with economic value.
Valuation: The process or practice of estimating human benefits of ecosystem services or costs of damages to ecosystem services, represented in monetary units.
Value: The contribution of an action or object to human wellbeing (social welfare).
Value-added: The difference between cost of inputs and the price of the produced good or service. Value-added can be computed for intermediate and final goods and services. Value-added, profit, and producer surplus are similar measures of the net benefit to producers. Although they differ slightly, the terms are used synonymously for this report to represent economic value.
Welfare: An individual’s satisfaction of their wants and needs. The human satisfaction or utility generated from a good or service.
Willingness-to-accept: The minimum amount of money an individual requires as compensation in order to forego a good or service.
Willingness-to-pay: The maximum amount of money an individual would pay in order to obtain a good, service, or avoid a change in condition.
79NATIONAL MARINE ECOSYSTEM SERVICE VALUATION KIRIBATI
13. APPEndIX II STAkEhOLdER CONSULTATIONS, ATTENdEE LISTS
8–10 dECEMBER 2013Consultations about the proposed economic valuation of marine resources for Kiribati were held
MACBIO staff: Dr Jan H Steffen (GIZ), Dr Sangeeta Mangubai (IUCN), Vainuupo Jungblut (SPREP), Jacob Salcone (IUCN) and Riibeta Abeta (GIZ)
ParticipantsMs Ruiti Uriano Aretaake Foundation for the Peoples of the South Pacific
Ms Nenenteiti Teariki-Ruatu Environment and Conservation Division, Ministry of Environment, Land and Agriculture Development
Mr Farran Redfern Environment and Conservation Division, Ministry of Environment, Land and Agriculture Development
Mr Kiritian Batoromaio Environment and Conservation Division, Ministry of Environment, Land and Agriculture Development
Ms Emily Dyball Environment and Conservation Division, Ministry of Environment, Land and Agriculture Development
Mr Puta Tofinga Environment and Conservation Division, Ministry of Environment, Land and Agriculture Development
Ms Teue Baikarawa Administration, Ministry of Environment, Land and Agriculture Development
Mr Tukabu Teroroko Ministry of Environment, Land and Agriculture Development
Mr Betarim Rimon Ministry of Environment, Land and Agriculture Development
Ms Naomi Biribo Ministry of Fisheries and Marine Resource Development
Ms Teebete England Ministry of Fisheries and Marine Resource Development
Mr Karibanang Aram Ministry of Fisheries and Marine Resource Development
Mr Kautoa Tonganibeia Ministry of Fisheries and Marine Resource Development
Ms Amina Uriam Ministry of Internal Affairs
Mr Terieta Mwemwenikeaki Office of Beretitenti (Office of the President)
Ms Mimitong Kirata Kiribati Adaptation Program II
11 dECEMBER 2013An economics training and consultation workshop was run by Jacob Salcone.
ParticipantsMr Tiuti Birido Tourism Office
Mr Thomas Ruaia PDD, Ministry of Fisheries and Marine Resource Development
Mr Tabomoa Tinte Environmental Health, Ministry of Health
80 KIRIBATI NATIONAL MARINE ECOSYSTEM SERVICE VALUATION
Mr Temwanoku Ioakim Livestock Officer, Agriculture, Ministry of Environment, Land and Agriculture Development
Ms Anee Naunta Customs Officer, Customs, Ministry of Finance and Economic Development
Ms Taati Eria Senior Fisheries Officer, Fisheries Division, Ministry of Fisheries and Marine Resource Development
Ms Tebete England Minerals Officer, Minerals Division, Ministry of Fisheries and Marine Resource Development
Mr Tritirua Bwatee Project Officer, Foundation for the Peoples of the South Pacific
Mr Tiaotin Enari Senior GIS Officer, Lands Division, Ministry of Environment, Land and Agriculture Development
Mr Tarakabu Tofinga Senior Land Planning Officer, Lands Division, Ministry of Environment, Land and Agriculture Development
Mr Michael Foon Disaster Risk Management Officer, Office of the President
Ms Terieta Mnemnenikeaki Deputy Secretary, Office of the President
Ms Emily Dyball Environment and Conservation Division
Mr Farran Redfern Environment, Environment and Conservation Division, Ministry of Environment, Land and Agriculture Development
Mr Koria T Port Master, Kiribati Port Authority
Mr Ribano A Senior Accountant, Kiribati SSL
Mr Takena R Agriculture Officer, ALD, Ministry of Environment, Land and Agriculture Development
Ms Beieluta T REM Officer, KCMLC/Ministry of Commerce, Industry and Cooperatives
Ms Moina T. Aroito Water Foreman, Ministry of Public Works and Utilities – Water
Ms Teeta Kabiriera Curriculum Officer, Ministry of Environment, Land and Agriculture Development
Ms Anatati Wilson Assistant Culture Officer, Culture, Ministry of Internal Affairs
Mr Puta Tofinga Environment Officer, Environment and Conservation Division, Ministry of Environment, Land and Agriculture Development
Ms Jenny Keaki-Tonganibeia National Statistics Office
9 APRIL 2014A further workshop on ecosystem service valuation was conducted by Jacob Salcone of IUCN/MACBIO.
MACBIO team: Jacob Salcone (Resource Economist, IUCN), Hans Wendt (Spatial Planner, IUCN), Iete Rouata (MACBIO Consultant) and Ms Nenenteiti Teariki-Ruatu (Director, Environment and Conservation Division)
Participants:Ms Tekimwau Otiawa Environment Conservation Division, Ministry of Environment, Land and
Agriculture Development
Mr Tion Uriam GIS Officer, Ministry of Fisheries and Marine Resource Development
Ms Tebete England Officer-in-Charge, Department of Minerals, Ministry of Fisheries and Marine Resource Development
Mr Uati Tirikai Fisheries Officer, Ministry of Fisheries and Marine Resource Development
Mr Kairaoi Lentumoa Fisheries Officer, Ministry of Fisheries and Marine Resource Development
81NATIONAL MARINE ECOSYSTEM SERVICE VALUATION KIRIBATI
Mr Kiriata Tong Ministry of Environment, Land and Agriculture Development
Ms Riria Moaniba Ministry of Environment, Land and Agriculture Development
Mr Auria Kitina Tourism Division, Ministry of Communication, Transport and Tourism Development
M Tokira Kimereti Economist, Ministry of Finance and Economic Development (planning)
Ms Orebwa Morate Statistician, Ministry of Fisheries and Marine Resource Development
Mr Thomas Ruaia Economist, Ministry of Fisheries and Marine Resource Development
Ms Kabure Yeeting Assistant Mineral Officer, Ministry of Fisheries and Marine Resource Development
One-on-one meetings were also held with:
Mr Tiimi Kaiekieki Secretary, Ministry of Environment, Land and Agriculture Development
Ms Nenenteiti Teariki-Ruatu Director, Environment and Conservation Division
Mr Kairaoi Lentumoa Fisheries statistician, Fisheries Division, Ministry of Fisheries and Marine Resource Development
Mr Tukabu Teroroko Manager, Phoenix Islands Protected Area
7–14 AuGuST 2014Further consultations on economic evaluation work were held by Dr Iete Rouata with the following people:
Ms Naomi Biribo Secretary, Ministry of Fisheries and Marine Resource Development
Mr Kautoa Tonganibeia Manager Economics and Resource Planning Unit
Mr Thomas Ruaia Department of Fisheries, Ministry of Fisheries and Marine Resource Development
Ms Tebetee England A/g Head of Minerals Division, Ministry of Fisheries and Marine Resource Development
Ms Kabure Yeeting Minerals Division, Ministry of Fisheries and Marine Resource Development
Mr Tion Uriam Minerals Division, Ministry of Fisheries and Marine Resource Development
Ms Nenenteiti Teariki-Ruatu Director, Environment and Conservation Division, Ministry of Environment, Land and Agriculture Development
Further discussions were held in 2014 by Dr Iete Rouata during the research period with:
Mr Kiritian Batoromaio Environment and Conservation Division, Ministry of Environment, Land and Agriculture Development
Mr Puta Tofinga Ministry of Environment, Land and Agriculture Development
Ms Kurinati Robuti National Planning Office
Mr Tiaontin Enari Lands Division, Ministry of Environment, Land and Agriculture Development
Ms Tebete England Ministry of Fisheries and Marine Resource Development
Mr Thomas Ruaia Ministry of Fisheries and Marine Resource Development
Ms Taatie Eria Ministry of Fisheries and Marine Resource Development
Mr Tietioma Ukenio
82 KIRIBATI NATIONAL MARINE ECOSYSTEM SERVICE VALUATION
Mr Kairaoi Lentumoa Fisheries Division, Ministry of Fisheries and Marine Resource Development
Ms Jenny Tonganibeia National Statistics Office
Mr Tuiti Biribo Tourism Division
Dr Teuea Toatu Phoenix Islands Protected Area Trust Fund
Mr Tukabu Teroroko Coordinator of the PIPA project
Ms Nenenteiti Teariki-Ruatu Director of the Environment Division, Ministry of Environment, Land and Agriculture Development
Mrs Tiriara Ikam National Statistics Office
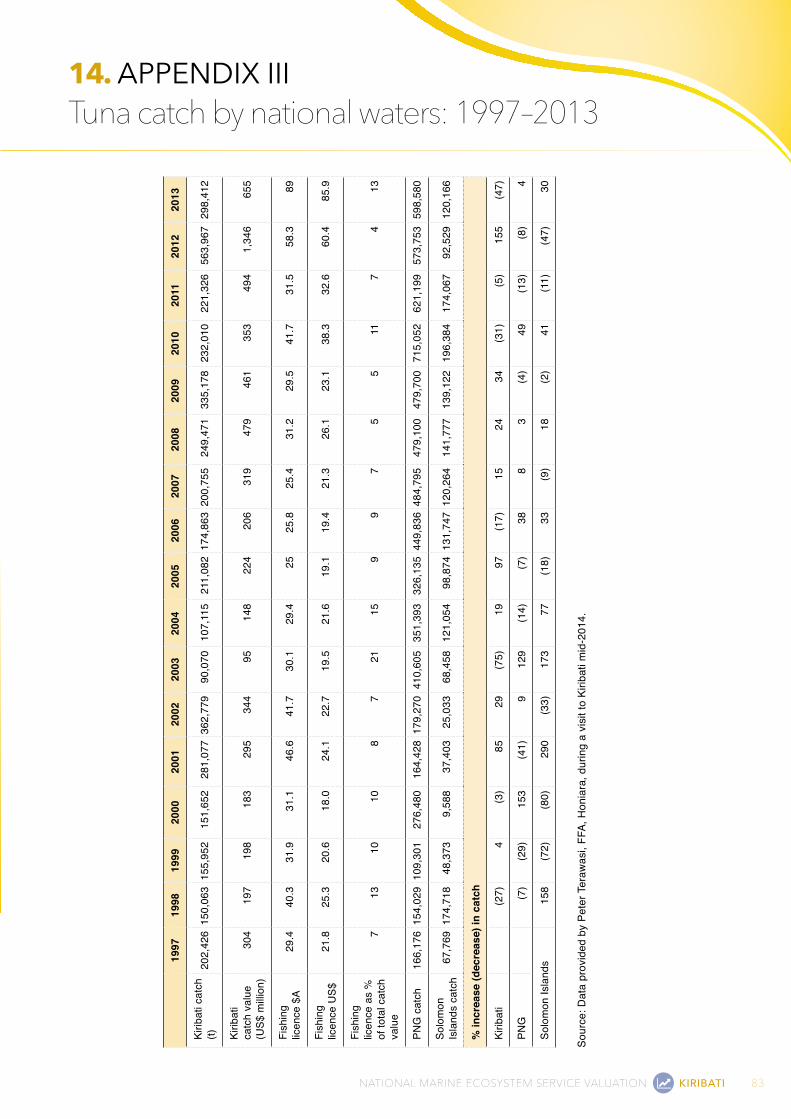
83NATIONAL MARINE ECOSYSTEM SERVICE VALUATION KIRIBATI
14. APPEndIX III Tuna catch by national waters: 1997–2013
1997
1998
1999
2000
2001
2002
2003
2004
2005
2006
2007
2008
2009
2010
2011
2012
2013
Kirib
ati c
atch
(t)
202,
426
150,
063
155,
952
151,
652
281,
077
362,
779
90,0
7010
7,11
521
1,08
217
4,86
320
0,75
524
9,47
133
5,17
823
2,01
022
1,32
656
3,96
729
8,41
2
Kirib
ati
catc
h va
lue
(US$
milli
on)
304
197
198
183
295
344
9514
822
420
631
947
946
135
349
41,
346
655
Fish
ing
licen
ce $
A29
.440
.331
.931
.146
.641
.730
.129
.425
25.8
25.4
31.2
29.5
41.7
31.5
58.3
89
Fish
ing
licen
ce U
S$21
.825
.320
.618
.024
.122
.719
.521
.619
.119
.421
.326
.123
.138
.332
.660
.485
.9
Fish
ing
licen
ce a
s %
of
tota
l cat
ch
valu
e
713
1010
87
2115
99
75
511
74
13
PNG
cat
ch16
6,17
615
4,02
910
9,30
127
6,48
016
4,42
817
9,27
041
0,60
535
1,39
332
6,13
544
9,83
648
4,79
547
9,10
047
9,70
071
5,05
262
1,19
957
3,75
359
8,58
0
Solo
mon
Is
land
s ca
tch
67,7
6917
4,71
848
,373
9,58
837
,403
25,0
3368
,458
121,
054
98,8
7413
1,74
712
0,26
414
1,77
713
9,12
219
6,38
417
4,06
792
,529
120,
166
% in
crea
se (d
ecre
ase)
in c
atch
Kirib
ati
(27)
4(3
)85
29(7
5)19
97(1
7)15
2434
(31)
(5)
155
(47)
PNG
(7)
(29)
153
(41)
912
9(1
4)(7
)38
83
(4)
49(1
3)(8
)4
Solo
mon
Isla
nds
158
(72)
(80)
290
(33)
173
77(1
8)33
(9)
18(2
)41
(11)
(47)
30
Sour
ce: D
ata
prov
ided
by
Pete
r Ter
awas
i, FF
A, H
onia
ra, d
urin
g a
visi
t to
Kirib
ati m
id-2
014.

86 KIRIBATI NATIONAL MARINE ECOSYSTEM SERVICE VALUATION