ecosystem service valuation and ecosystem asset account · pdf fileecosystem service valuation...
TRANSCRIPT
1
Ecosystem service valuation and ecosystem asset account in Japan
Takashi Hayashi
Policy Research Institute, Ministry of Agriculture, Forestry and Fisheries (PRIMAFF), Japan
Masayuki Sato
Graduate School of Human Development and Environment, Kobe University, Japan
Contact author: Takashi Hayashi
3-1-1 Kasumigaseki, Chiyoda-ku, Tokyo 100-0013, Japan
E-mail address: [email protected]
Tel.&Fax: (+81)-3-6737-9082
Abstract
This paper aims to introduce Japan’s current initiative of valuing ecosystem services and
incorporate it to SEEA-EEA. Specifically, we evaluate ecological stocks (i.e. forest and wetland)
and ecosystem services from them based on our economic valuations, and develop an accounting
system to record these values. We also aim to apply the results to macro indicators such as a
sustainability index.
Firstly, we estimate the unit value of forest and wetland by environmental-economic
valuation techniques. Contingent valuation is applied to estimate welfare values for both forest
and wetland. In addition, we estimate the exchange values of the stocks. For exchange values, a
methodology applied in the TEEB study is used. The estimated values are incorporated in the
ecosystem asset accounts in both physical and monetary term. The values are disaggregated into
their functions to provide ecosystem services. The evaluations are conducted in each prefecture
in Japan.
The ecosystem accounting in our study can provide useful datasets and information
regarding ecosystems, and contributes to the policymaking as both surplus and exchange value
of ecosystems are on the accounting, these two types of values can be used for different policy
purposes, and we can apply the estimates to macro indicators such as Inclusive Wealth Index and
the possibility of application are also mentioned briefly.
As the paper is not exclusively designated for the London Group (LG) meeting, we just
introduce Japan’s initiative of developing an ecosystem accounting. We think that the
implementation of economic valuation is still minor in the global trend of developing the
ecosystem accounting and in the LG discussions. We believe we can provide some useful
information to the discussion in the LG, particularly that of economic assessment.
Keywords
SEEA-EEA; Ecosystem asset accounting; forest; wetland; Japan
2
1. Introduction
1.1. Backgrounds and purposes
As observed in the Millennium Ecosystem Assessment and the Economics of Ecosystem and
Biodiversity (TEEB) reports, the awareness of the importance of assessing the value of
ecosystem and its services is growing. For instance, Japan government is currently formulating
policies aimed at achieving the Aichi Biodiversity Targets. At the same time, a variety of
research and policy debates aimed at achieving sustainable development are underway. As a
result, it has become urgently necessary to include the value and the role of ecosystem and its
services in the development of sustainability indicators related to policy planning and evaluation.
In the light of the efforts to establish a global framework for ecosystem accounting, such as the
System of Environmental and Economic Accounting Experimental Ecosystem Account
(SEEA-EEA), it is necessary to establish national accounting system which enables us to
evaluate the value of ecosystem and its services in Japan.
We are conducting a research project which aims to assess the value of ecosystem services
and develop an ecosystem accounting in Japan. The project also aims to apply the results to
sustainability indicators. Although many studies which evaluate the value of ecosystem and its
services have already done in Japan, studies on aggregating the values to accounting systems is
inadequate. Therefore, in this research, we will attempt to aggregate the results of economic
assessments that have been done so far using a SEEA-EEA framework.
This paper aims to introduce our current initiative of valuing ecosystem services and
incorporate it to SEEA-EEA. Specifically, we evaluate ecological stocks (i.e. forest and wetland)
and ecosystem services from them based on our economic valuations, and develop an ecosystem
accounting system to record these values.
1.2 Contribution to the LG discussions
As the paper is not exclusively designated for the London Group (LG) meeting, we just
would like to introduce Japan’s initiative of developing the ecosystem accounting. Our approach
is based on utilization of existing studies on ecosystem valuation and mainly focuses on
economic valuation. We think that implementation of economic valuation is still minor in the
global trend of developing the ecosystem accounting and in the LG discuss ions. We believe we
can provide some useful information to the discussion in the LG, particularly that of economic
assessment.
2. Accounting framework
Our fundamental approach to develop ecosystem accounting is to utilize previous studies on
evaluating ecosystem services which have been made so far, and some of them conducted
economic evaluations. Therefore, our accounting framework to be developed should include
monetary accounts as well as physical accounts. In addition, ecosystem services are quite local
3
specific particularly in Japan, as land use is “mosaic” and various ecosystems co-exist together
in a very small area. Local or regional assessment of ecosystem services is necessary as well as
national assessment.
When developing the accounting systems, what to be considered first is the type of
ecosystem to be assessed. In Japan, forest dominates roughly two thirds of national land.
Therefore, we chose forest as an ecosystem services to be assessed. Another ecosystem to be
assessed is wetland including rivers and lakes, this is because wetland is considered as one of the
most important ecosystems in Japan. Therefore, in our study, forest and wetland are chosen as
the ecosystems to be assessed. Although all types of ecosystem should be assessed
comprehensively when developing ecosystem accounting, we chose these two ecosystems for the
evaluation as the first approach due to data availability.
The second point to be considered is which accounts in the SEEA-EEA framework should
be compiled. The SEEA-EEA has multiple accounts in the framework, and it is almost
impossible to compile all of the accounts du to data availability. Additionally, some of the
accounts are not necessary when considering the nature of ecosystems and policy priority in
Japan. In our study, we compile ecosystem asset accounts because our evaluation of ecosystem is
based on asset valuation. The asset accounts are compiled for all 47 prefectures to cope with
local issues.
Thirdly, we have to consider time base: in what years the accounts should be compiled.
Although annual assessment is desirable, it takes much time and workforce. We believe that
ecosystems to be assessed in the study: forest and wetland do not change drastically in such
short period as one or two years, so we compile ecosystem accountings with an interval of
several years, considering the data availability of physical data.
Fourth, another important issue to be addressed for economic valuation is of which value
should be applied, surplus value or exchange value. Exchange value can evaluate ecosystem
services based on market value and is consistent with the System of National Accounts (SNA) ,
but it cannot evaluate non-use value of ecosystem which is not transacted in markets. On the
other hand, surplus value can evaluate externality and non-use value of ecosystem but it is
inconsistent with current SNA. Both methods have strengths and weaknesses, and which
approach should be applied depends on the purpose for the evaluation and use of its results. In
this study, we apply both surplus and exchange value for the valuation, so that users can choose
the proper approach depending on their purposes.
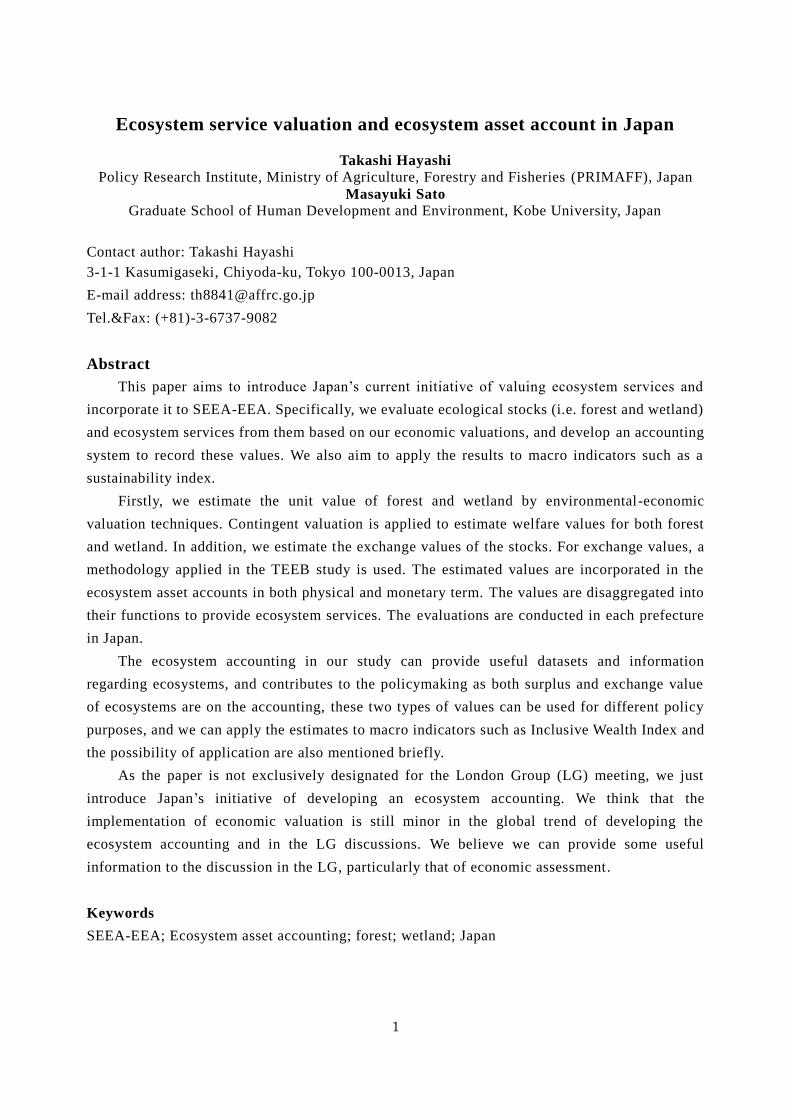
Based on the discussions above, in this study, we develop an integrated physical and
monetary asset account. This is because the data recorded on a physical account are too minor to
compile an individual physical account and most of the data is dominated by the monetary asset
values. Table 1 shows the framework of forest asset accounting. It is developed based on
SEEA-EEA framework and modified taking into account the discussions above and data
constraint and availability in Japan. Row items include opening and closing stocks, addition to
and reduction in stocks. These items are designated for recording change in stock of ecosystem
4
Ecosys
tem
asset account
Wate
r
str
age
Land s
lide
pre
ventio
n
Miti
gatio
n
of clim
ate
change
Conserv
atio
n
of
ecosys
tem
s
Tim
ber
pro
ductio
n
Wate
r
str
age
Land s
lide
pre
ventio
n
Miti
gatio
n
of clim
ate
change
Conserv
atio
n
of
ecosys
tem
s
Tim
ber
pro
ductio
n
Unit
Hecta
rem
3M
il. J
PY
Mil.
JP
YM
il. J
PY
Mil.
JP
YM
il. J
PY
Mil.
JP
YM
il. J
PY
Mil.
JP
YM
il. J
PY
Mil.
JP
YM
il. J
PY
Mil.
JP
Y
AB
CD
EF
GH
IJ
KL
MN
Openin
g s
tock
of ecosys
tem
assets
(2000s)
1
Additi
on to s
tock
2
Regenera
tion -
natu
ral
3
Regenera
tion -
hum
an a
ctiv
ity
4
Recla
ssifi
catio
ns
5
Reductio
n in
sto
ck
6
Reductio
n d
ue to e
xtra
ctio
n a
nd h
arv
est of re
sourc
es
7
Reductio
n d
ue to o
ngoin
g h
um
an a
ctiv
ity8
Cata
str
ophic
losses d
ue to h
um
an a
ctiv
ity9
Cata
str
ophic
losses d
ue to n
atu
ral e
vents
10
Recla
ssifi
catio
ns
11
Reva
luatio
n
12
--
--
Net change in
sto
ck
13
Clo
sin
g s
tock
of ecosys
tem
assets
(2010s)
14
--
: F
irgure
s n
ot re
cord
ed o
n this
cell
conceptu
ally
Sourc
e: B
ased o
n S
EE
A-E
EA
handbook
Table
6.1
Fore
st
Phys
ical v
alu
eM
oneta
ry v
alu
e
Exc
hange v
alu
eS
urp
lus v
alu
e
Tota
lT
ota
lT
ota
lT
ota
l
5
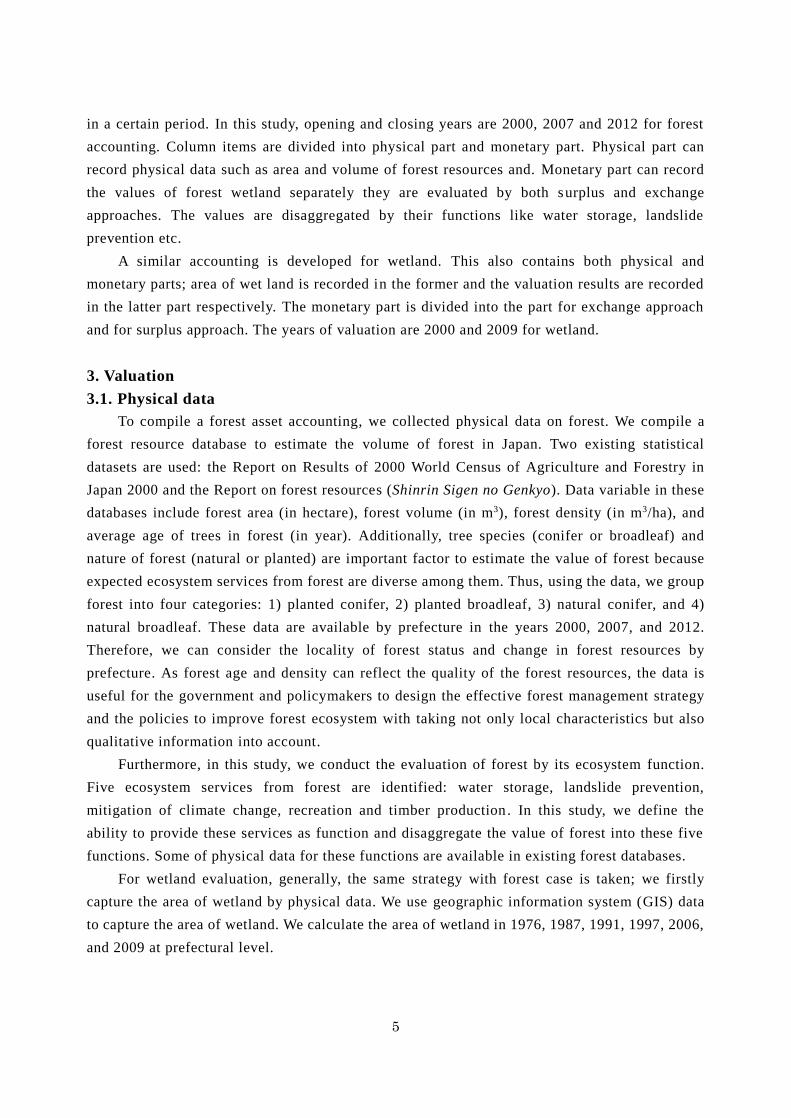
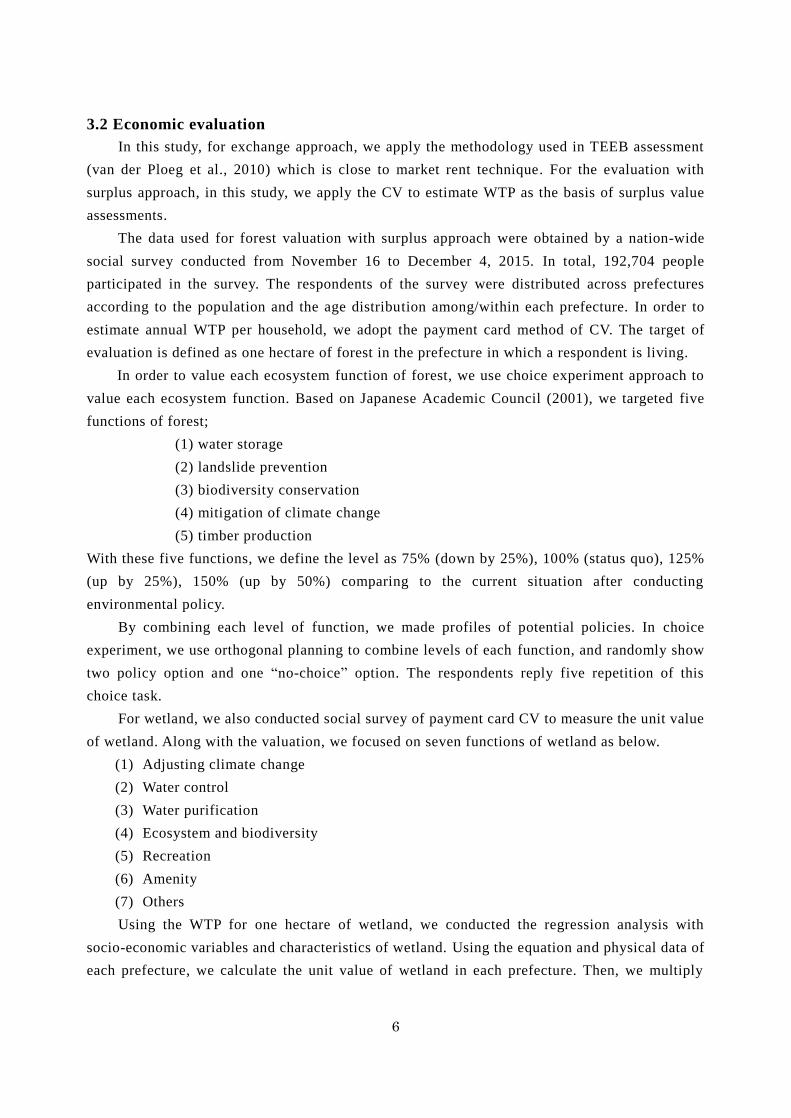
in a certain period. In this study, opening and closing years are 2000, 2007 and 2012 for forest
accounting. Column items are divided into physical part and monetary part. Physical part can
record physical data such as area and volume of forest resources and. Monetary part can record
the values of forest wetland separately they are evaluated by both surplus and exchange
approaches. The values are disaggregated by their functions like water storage, landslide
prevention etc.
A similar accounting is developed for wetland. This also contains both physical and
monetary parts; area of wet land is recorded in the former and the valuation results are recorded
in the latter part respectively. The monetary part is divided into the part for exchange approach
and for surplus approach. The years of valuation are 2000 and 2009 for wetland.
3. Valuation
3.1. Physical data
To compile a forest asset accounting, we collected physical data on forest. We compile a
forest resource database to estimate the volume of forest in Japan. Two existing statistical
datasets are used: the Report on Results of 2000 World Census of Agriculture and Forestry in
Japan 2000 and the Report on forest resources (Shinrin Sigen no Genkyo). Data variable in these
databases include forest area (in hectare), forest volume (in m3), forest density (in m3/ha), and
average age of trees in forest (in year). Additionally, tree species (conifer or broadleaf) and
nature of forest (natural or planted) are important factor to estimate the value of forest because
expected ecosystem services from forest are diverse among them. Thus, using the data, we group
forest into four categories: 1) planted conifer, 2) planted broadleaf, 3) natural conifer, and 4)
natural broadleaf. These data are available by prefecture in the years 2000, 2007, and 2012.
Therefore, we can consider the locality of forest status and change in forest resources by
prefecture. As forest age and density can reflect the quality of the forest resources, the data is
useful for the government and policymakers to design the effective forest management strategy
and the policies to improve forest ecosystem with taking not only local characteristics but also
qualitative information into account.
Furthermore, in this study, we conduct the evaluation of forest by its ecosystem function.
Five ecosystem services from forest are identified: water storage, landslide prevention,
mitigation of climate change, recreation and timber production. In this study, we define the
ability to provide these services as function and disaggregate the value of forest into these five
functions. Some of physical data for these functions are available in existing forest databases.
For wetland evaluation, generally, the same strategy with forest case is taken; we firstly
capture the area of wetland by physical data. We use geographic information system (GIS) data
to capture the area of wetland. We calculate the area of wetland in 1976, 1987, 1991, 1997, 2006,
and 2009 at prefectural level.
6
3.2 Economic evaluation
In this study, for exchange approach, we apply the methodology used in TEEB assessment
(van der Ploeg et al., 2010) which is close to market rent technique. For the evaluation with
surplus approach, in this study, we apply the CV to estimate WTP as the basis of surplus value
assessments.
The data used for forest valuation with surplus approach were obtained by a nation-wide
social survey conducted from November 16 to December 4, 2015. In total, 192,704 people
participated in the survey. The respondents of the survey were distributed across prefectures
according to the population and the age distribution among/within each prefecture. In order to
estimate annual WTP per household, we adopt the payment card method of CV. The target of
evaluation is defined as one hectare of forest in the prefecture in which a respondent is living.
In order to value each ecosystem function of forest, we use choice experiment approach to
value each ecosystem function. Based on Japanese Academic Council (2001), we targeted five
functions of forest;
(1) water storage
(2) landslide prevention
(3) biodiversity conservation
(4) mitigation of climate change
(5) timber production
With these five functions, we define the level as 75% (down by 25%), 100% (status quo), 125%
(up by 25%), 150% (up by 50%) comparing to the current situation after conducting
environmental policy.
By combining each level of function, we made profiles of potential policies. In choice
experiment, we use orthogonal planning to combine levels of each function, and randomly show
two policy option and one “no-choice” option. The respondents reply five repetition of this
choice task.
For wetland, we also conducted social survey of payment card CV to measure the unit value
of wetland. Along with the valuation, we focused on seven functions of wetland as below.
(1) Adjusting climate change
(2) Water control
(3) Water purification
(4) Ecosystem and biodiversity
(5) Recreation
(6) Amenity
(7) Others
Using the WTP for one hectare of wetland, we conducted the regression analysis with
socio-economic variables and characteristics of wetland. Using the equation and physical data of
each prefecture, we calculate the unit value of wetland in each prefecture. Then, we multiply
7
with the size of wetland, we obtained the information of wetland stock which is introduced into
the accounting framework.
Note that some part of the evaluation is now underway. In addition, the economic evaluation of
wetland with exchange value is currently underway.
4. Results
4.1. Physical data
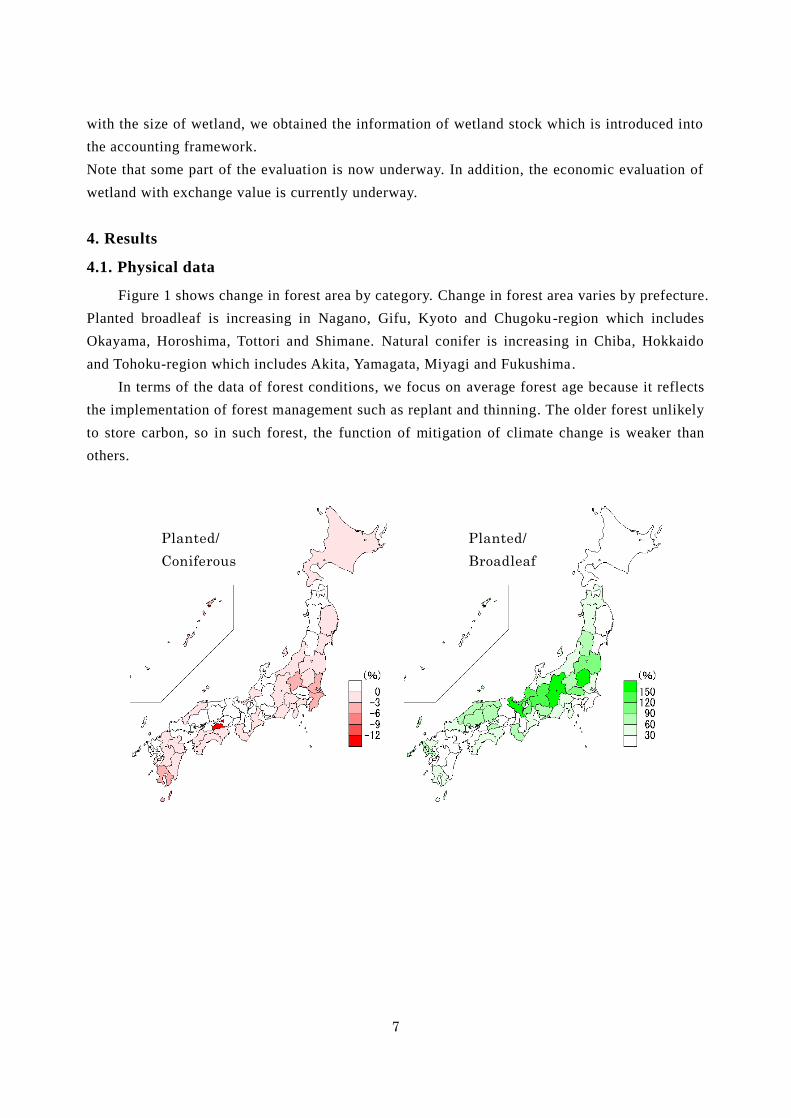
Figure 1 shows change in forest area by category. Change in forest area varies by prefecture.
Planted broadleaf is increasing in Nagano, Gifu, Kyoto and Chugoku-region which includes
Okayama, Horoshima, Tottori and Shimane. Natural conifer is increasing in Chiba, Hokkaido
and Tohoku-region which includes Akita, Yamagata, Miyagi and Fukushima.
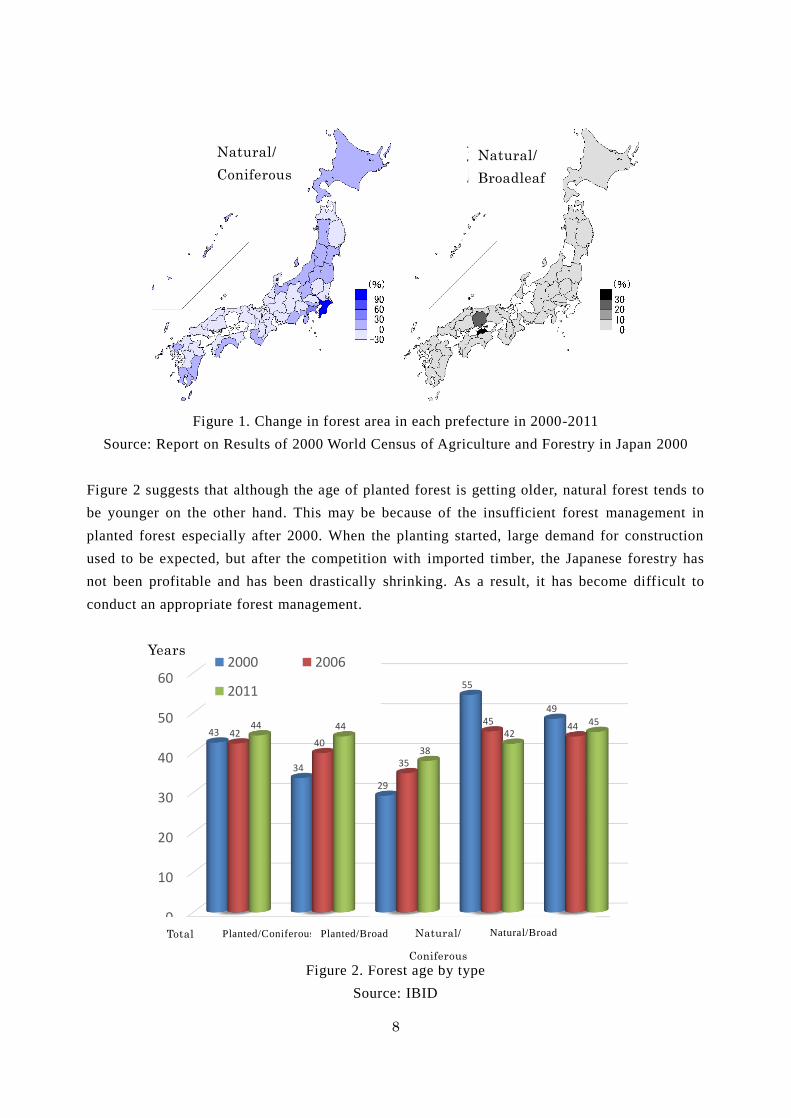
In terms of the data of forest conditions, we focus on average forest age because it reflects
the implementation of forest management such as replant and thinning. The older forest unlikely
to store carbon, so in such forest, the function of mitigation of climate change is weaker than
others.
人工林針葉樹
人工林広葉樹
Planted/
Coniferous
Planted/
Broadleaf
leaf
8
Figure 1. Change in forest area in each prefecture in 2000-2011
Source: Report on Results of 2000 World Census of Agriculture and Forestry in Japan 2000
Figure 2 suggests that although the age of planted forest is getting older, natural forest tends to
be younger on the other hand. This may be because of the insufficient forest management in
planted forest especially after 2000. When the planting started, large demand for construction
used to be expected, but after the competition with imported timber, the Japanese forestry has
not been profitable and has been drastically shrinking. As a result, it has become difficult to
conduct an appropriate forest management.
Figure 2. Forest age by type
Source: IBID
天然林広葉樹
天然林針葉樹
0
10
20
30
40
50
60
全体 人工林・
針葉樹
人工林・
広葉樹
天然林・
針葉樹
天然林・
広葉樹
43
34
29
55
49
4240
35
45 4444 44
38
4245
2000年度 2006年度
2011年度
Natural/
Coniferous
Natural/
Broadleaf
Natural/
Coniferous
Natural/Broad Planted/Coniferous Planted/Broad
leaf
Total
Years
9
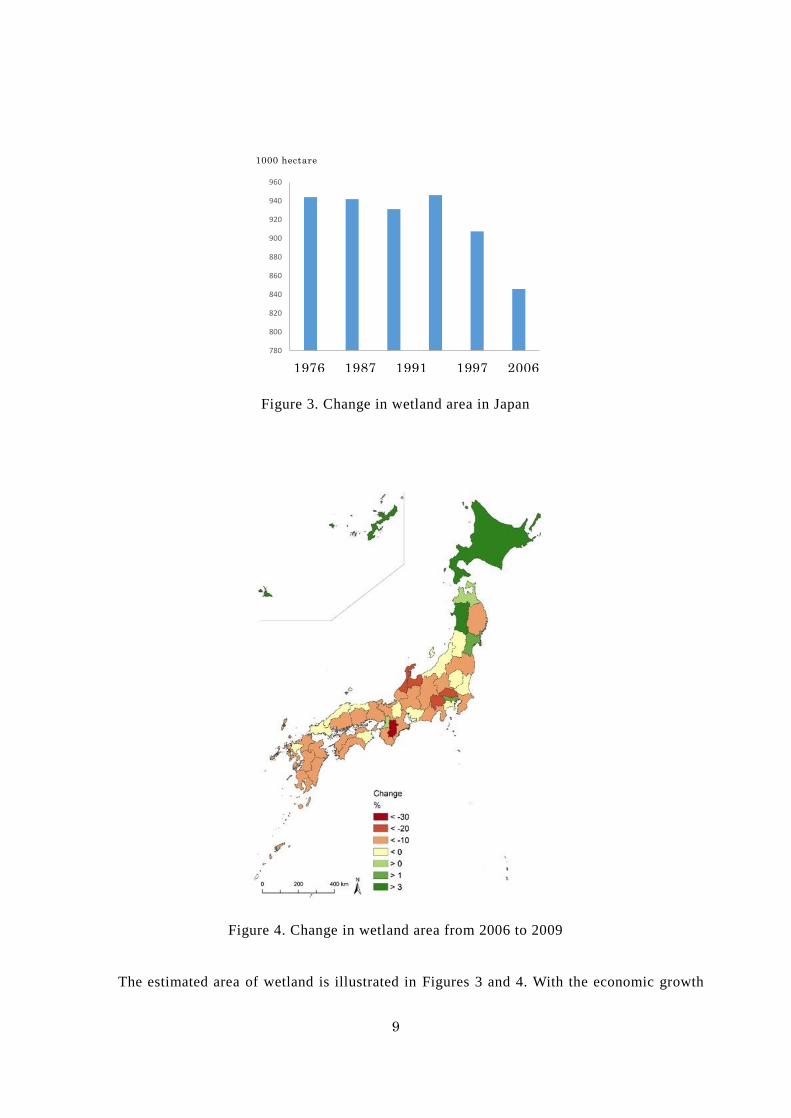
Figure 3. Change in wetland area in Japan
Figure 4. Change in wetland area from 2006 to 2009
The estimated area of wetland is illustrated in Figures 3 and 4. With the economic growth
780
800
820
840
860
880
900
920
940
960
1976年 1987年 1991年 1997年 2006年 2009年
千ha1000 hectare
1976 1987 1991 1997 2006
2009
10
and land development in Japan, the wetland area is decreasing by 10% in the past 22 years. This
decrease should not be neglected and be recorded wetland asset accounting. Figure 10 shows
change in wetland area by prefecture also varies by prefecture; some prefectures increase, some
others decreases.
4.2. Economic data
The unit value of forest measured by exchange value accounts to 662 thousand JPY per
hectare of forest. Although, at moment, we only estimated its value in whole Japan and one
single value is applied to all 47 prefectures, we are going to estimate the value by prefecture as
data will be available.
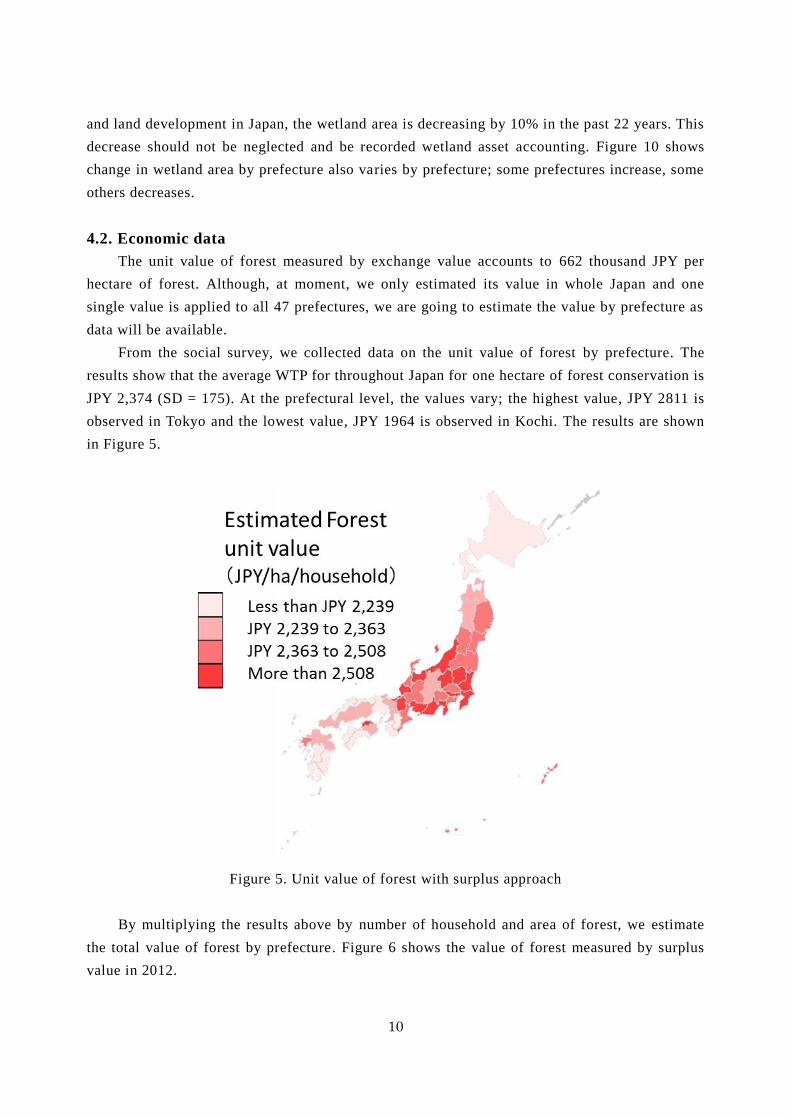
From the social survey, we collected data on the unit value of forest by prefecture. The
results show that the average WTP for throughout Japan for one hectare of forest conservation is
JPY 2,374 (SD = 175). At the prefectural level, the values vary; the highest value, JPY 2811 is
observed in Tokyo and the lowest value, JPY 1964 is observed in Kochi. The results are shown
in Figure 5.
Figure 5. Unit value of forest with surplus approach
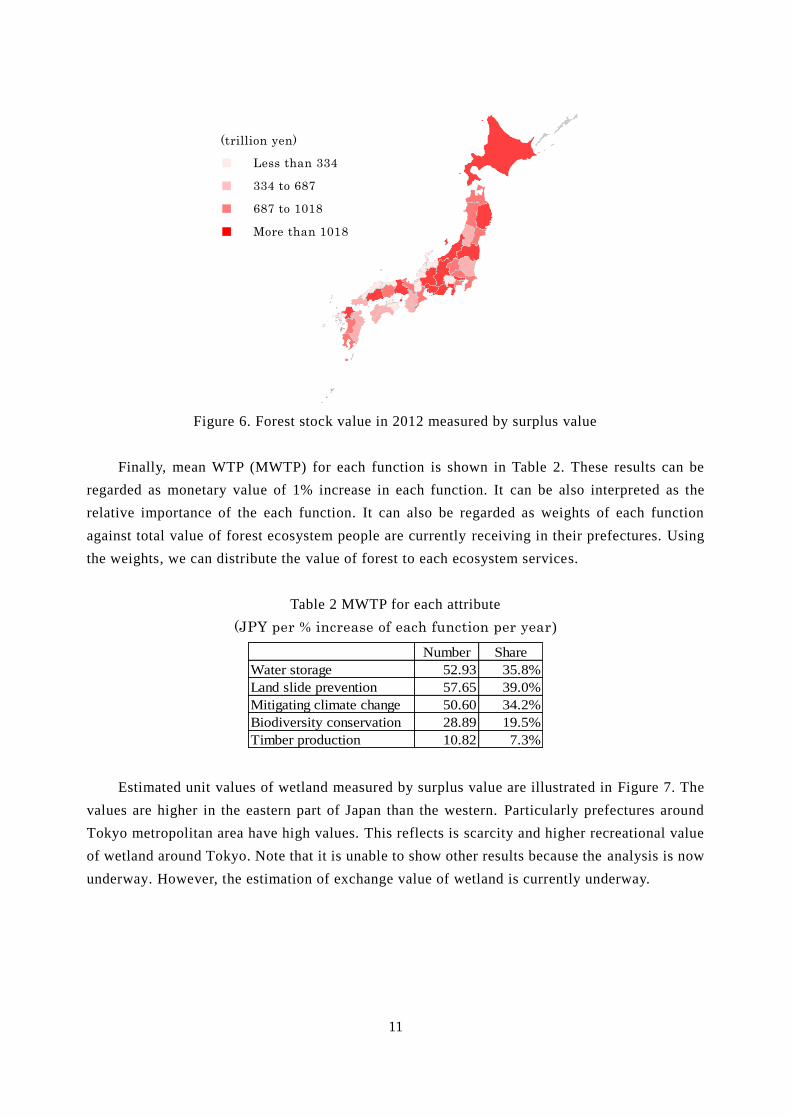
By multiplying the results above by number of household and area of forest, we estimate
the total value of forest by prefecture. Figure 6 shows the value of forest measured by surplus
value in 2012.
11
Figure 6. Forest stock value in 2012 measured by surplus value
Finally, mean WTP (MWTP) for each function is shown in Table 2. These results can be
regarded as monetary value of 1% increase in each function. It can be also interpreted as the
relative importance of the each function. It can also be regarded as weights of each function
against total value of forest ecosystem people are currently receiving in their prefectures. Using
the weights, we can distribute the value of forest to each ecosystem services.
Table 2 MWTP for each attribute
(JPY per % increase of each function per year)
Number Share
Water storage 52.93 35.8%
Land slide prevention 57.65 39.0%
Mitigating climate change 50.60 34.2%
Biodiversity conservation 28.89 19.5%
Timber production 10.82 7.3%
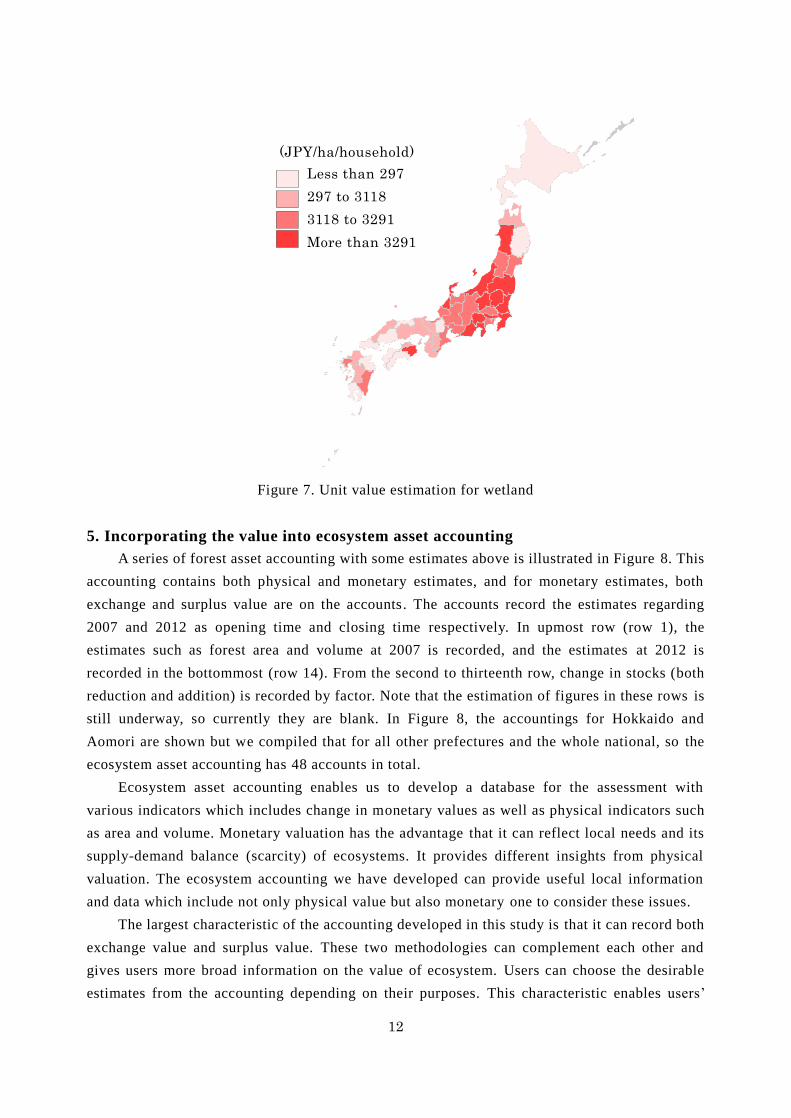
Estimated unit values of wetland measured by surplus value are illustrated in Figure 7. The
values are higher in the eastern part of Japan than the western. Particularly prefectures around
Tokyo metropolitan area have high values. This reflects is scarcity and higher recreational value
of wetland around Tokyo. Note that it is unable to show other results because the analysis is now
underway. However, the estimation of exchange value of wetland is currently underway.
(trillion yen)
■ Less than 334
■ 334 to 687
■ 687 to 1018
■ More than 1018
12
Figure 7. Unit value estimation for wetland
5. Incorporating the value into ecosystem asset accounting
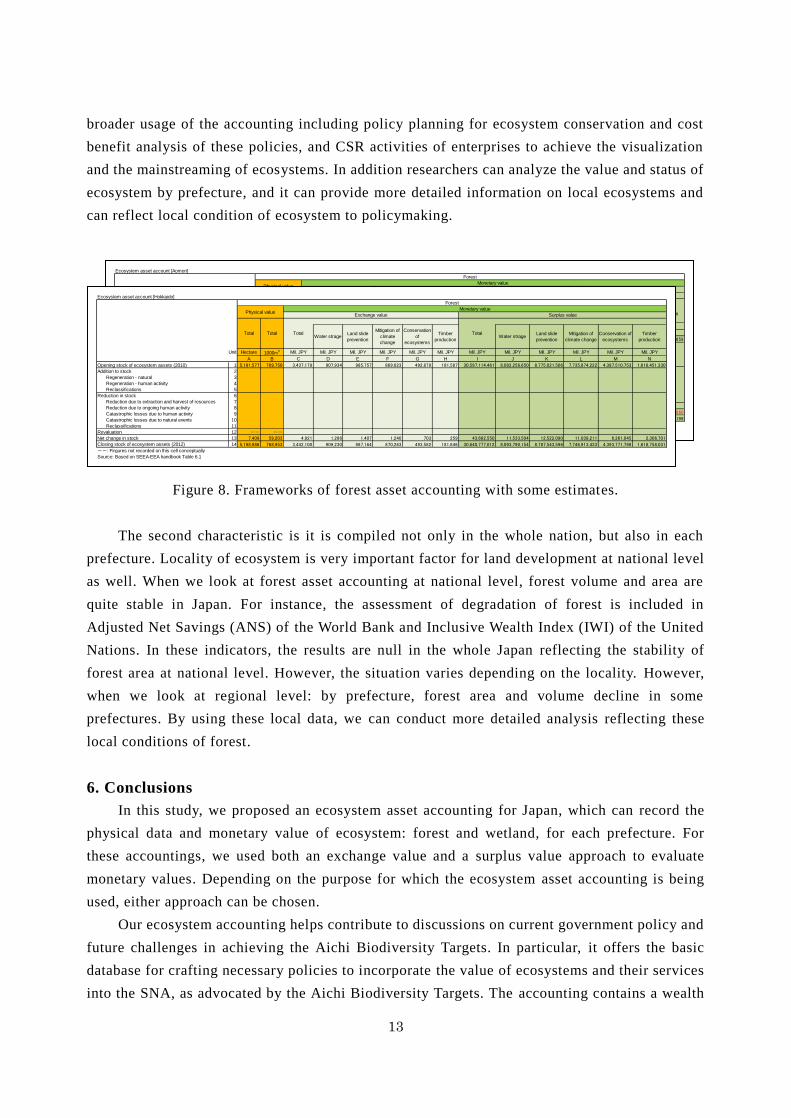
A series of forest asset accounting with some estimates above is illustrated in Figure 8. This
accounting contains both physical and monetary estimates, and for monetary estimates, both
exchange and surplus value are on the accounts. The accounts record the estimates regarding
2007 and 2012 as opening time and closing time respectively. In upmost row (row 1), the
estimates such as forest area and volume at 2007 is recorded, and the estimates at 2012 is
recorded in the bottommost (row 14). From the second to thirteenth row, change in stocks (both
reduction and addition) is recorded by factor. Note that the estimation of figures in these rows is
still underway, so currently they are blank. In Figure 8, the accountings for Hokkaido and
Aomori are shown but we compiled that for all other prefectures and the whole national, so the
ecosystem asset accounting has 48 accounts in total.
Ecosystem asset accounting enables us to develop a database for the assessment with
various indicators which includes change in monetary values as well as physical indicators such
as area and volume. Monetary valuation has the advantage that it can reflect local needs and its
supply-demand balance (scarcity) of ecosystems. It provides different insights from physical
valuation. The ecosystem accounting we have developed can provide useful local information
and data which include not only physical value but also monetary one to consider these issues.
The largest characteristic of the accounting developed in this study is that it can record both
exchange value and surplus value. These two methodologies can complement each other and
gives users more broad information on the value of ecosystem. Users can choose the desirable
estimates from the accounting depending on their purposes. This characteristic enables users’
Less than 297
297 to 3118
3118 to 3291
More than 3291
(JPY/ha/household)
13
broader usage of the accounting including policy planning for ecosystem conservation and cost
benefit analysis of these policies, and CSR activities of enterprises to achieve the visualization
and the mainstreaming of ecosystems. In addition researchers can analyze the value and status of
ecosystem by prefecture, and it can provide more detailed information on local ecosystems and
can reflect local condition of ecosystem to policymaking.
Figure 8. Frameworks of forest asset accounting with some estimates.
The second characteristic is it is compiled not only in the whole nation, but also in each
prefecture. Locality of ecosystem is very important factor for land development at national level
as well. When we look at forest asset accounting at national level, forest volume and area are
quite stable in Japan. For instance, the assessment of degradation of forest is included in
Adjusted Net Savings (ANS) of the World Bank and Inclusive Wealth Index (IWI) of the United
Nations. In these indicators, the results are null in the whole Japan reflecting the stability of
forest area at national level. However, the situation varies depending on the locality. However,
when we look at regional level: by prefecture, forest area and volume decline in some
prefectures. By using these local data, we can conduct more detailed analysis reflecting these
local conditions of forest.
6. Conclusions
In this study, we proposed an ecosystem asset accounting for Japan, which can record the
physical data and monetary value of ecosystem: forest and wetland, for each prefecture. For
these accountings, we used both an exchange value and a surplus value approach to evaluate
monetary values. Depending on the purpose for which the ecosystem asset accounting is being
used, either approach can be chosen.
Our ecosystem accounting helps contribute to discussions on current government policy and
future challenges in achieving the Aichi Biodiversity Targets. In particular, it offers the basic
database for crafting necessary policies to incorporate the value of ecosystems and their services
into the SNA, as advocated by the Aichi Biodiversity Targets. The accounting contains a wealth
Ecosystem asset account [Aomori]
Water strageLand slide
prevention
Mitigation of
climate
change
Conservation
of
ecosystems
Timber
productionWater strage
Land slide
prevention
Mitigation of
climate change
Conservation of
ecosystems
Timber
production
Unit Hectare 1000m3 Mil. JPY Mil. JPY Mil. JPY Mil. JPY Mil. JPY Mil. JPY Mil. JPY Mil. JPY Mil. JPY Mil. JPY Mil. JPY Mil. JPY
A B C D E F G H I J K L M N
Opening stock of ecosystem assets (2010) 1 609,983 112,106 403,851 106,678 115,821 102,106 57,911 21,336 798,404,476 210,899,296 228,976,378 201,860,754 114,488,189 42,179,859
Addition to stock 2
Regeneration - natural 3
Regeneration - human activity 4
Reclassifications 5
Reduction in stock 6
Reduction due to extraction and harvest of resources 7
Reduction due to ongoing human activity 8
Catastrophic losses due to human activity 9
Catastrophic losses due to natural events 10
Reclassifications 11
Revaluation 12 -- --
Net change in stock 13 -993 6,059 -651 -174 -189 -166 -94 -35 -1,299,629 -343,298 -372,724 -328,585 -186,362 -68,660
Closing stock of ecosystem assets (2012) 14 608,990 118,165 403,200 106,504 115,633 101,939 57,816 21,301 797,104,847 210,555,997 228,603,654 201,532,169 114,301,827 42,111,199
--: Firgures not recorded on this cell conceptually
Source: Based on SEEA-EEA handbook Table 6.1
Forest
Physical valueMonetary value
Exchange value Surplus value
Total Total Total Total
Ecosystem asset account [Hokkaido]
Water strageLand slide
prevention
Mitigation of
climate
change
Conservation
of
ecosystems
Timber
productionWater strage
Land slide
prevention
Mitigation of
climate change
Conservation of
ecosystems
Timber
production
Unit Hectare 1000m3 Mil. JPY Mil. JPY Mil. JPY Mil. JPY Mil. JPY Mil. JPY Mil. JPY Mil. JPY Mil. JPY Mil. JPY Mil. JPY Mil. JPY
A B C D E F G H I J K L M N
Opening stock of ecosystem assets (2010) 1 5,191,577 709,750 3,437,179 907,934 985,757 869,023 492,879 181,587 30,597,114,461 8,082,256,650 8,775,021,506 7,735,874,222 4,387,510,753 1,616,451,330
Addition to stock 2
Regeneration - natural 3
Regeneration - human activity 4
Reclassifications 5
Reduction in stock 6
Reduction due to extraction and harvest of resources 7
Reduction due to ongoing human activity 8
Catastrophic losses due to human activity 9
Catastrophic losses due to natural events 10
Reclassifications 11
Revaluation 12 -- --
Net change in stock 13 7,409 59,203 4,921 1,296 1,407 1,240 703 259 43,662,550 11,533,504 12,522,090 11,039,211 6,261,045 2,306,701
Closing stock of ecosystem assets (2012) 14 5,198,986 768,953 3,442,100 909,230 987,164 870,263 493,582 181,846 30,640,777,012 8,093,790,154 8,787,543,596 7,746,913,433 4,393,771,798 1,618,758,031
--: Firgures not recorded on this cell conceptually
Source: Based on SEEA-EEA handbook Table 6.1
Forest
Physical valueMonetary value
Exchange value Surplus value
Total Total Total Total
14
of information regarding forest, and wetland that are of particular importance to policies on
ecosystem and biodiversity conservation in Japan.
We believe that it will stimulate the mainstreaming and visualization of ecosystems and
their services. In the conservation of ecosystems, as it is difficult to visualize their benefits and
compare them with costs. For this reason, the assessment process involved in policy
implementation is often unclear. In such a case, the ability to swiftly create an economic
assessment, in both the qualitative and quantitative way, is expected by policymakers to be a
useful data source in the process of making comprehensive decisions. At the same time, the
visualization of ecosystem stock values is connected to spreading the awareness regarding the
natural capital that belongs to the residents and companies of a region. We expect that, for
corporates, if the economic value of ecosystems is assessed in a manner that links it to the SNA,
it will provide an incentive for voluntary ecosystem conservation by corporates.
Acknowledgements
This work was accomplished under the research project “Evaluation of ecosystem services
and the development of ecosystem accounting frameworks” led by Dr. Masayuki Sato, Kobe
University, and implemented under the consignment study “Policy Studies on Environmental
Economics” of Japan’s Ministry of the Environment. The authors would like to thank the
Ministry of the Environment for their financial support.
References
Japanese Academic Council (2001) Multi dimensional value of agriculture and forest related to
the global environment and human lives (in Japanese).
van der Ploeg, S., de Groot D., Wang, Y. (2010) The TEEB Valuation Database: overview of
structure, data and results.