ecosystem goods and services: definition, valuation · pdf file5/31/06 ecosystem goods and...
TRANSCRIPT
Discussion Papers report work in progress. They are written to share ideas, concepts, and theories as well as preliminary empirical data, and have not been peer reviewed or approved for publication. Comments are welcome.
RMRS-RWU-4851 Discussion Paper
Ecosystem Goods and Services: Definition, Valuation and Provision
Thomas C. Brown Rocky Mountain Research Station, U.S. Forest Service, Fort Collins, Colorado
John C. Bergstrom
Department of Agricultural and Applied Economics, University of Georgia, Athens
John B. Loomis Department of Agricultural and Resource Economics, Colorado State University,
Ft. Collins
31 May 2006
Abstract
Ecosystem goods and services emanate from a functioning ecosystem and are of direct value to humans. They enter the utility function either directly (without any other inputs), or along with labor, capital, and other produced goods as inputs in a production process resulting in consumable goods. Most ecosystem goods and services have produced—although usually imperfect—substitutes. For example, mushrooms may be cultivated, trees may be grown in plantations, and the waste assimilation properties of natural watersheds can be replaced with a waste treatment plant. It is the nature of economic and population growth that some ecosystem goods and services become depleted and that humans use inputs including more plentiful ecosystem goods and services to produce new capital and goods that compensate for such depletion. An economic question is whether the substitutes for ecosystem services cost society more to produce than the opportunity cost of protecting the original ecosystem services.
Many ecosystem services and some ecosystem goods are commonly received for free. The marketing of ecosystem goods and services is basically an effort to turn such recipients—those who benefit without ownership—into buyers, thereby providing market signals that serve to help protect valuable services. Some formal arrangement is needed to make this happen. We review the various mechanisms for marketing ecosystem goods and services.
5/31/06 Ecosystem Goods and Services 2
Table of Contents
Introduction..................................................................................................................................... 3 What Is an Ecosystem Service? ...................................................................................................... 3 Ecosystem Goods and Services Within an Economic Context....................................................... 5
General Background from Economic Growth Theory................................................................ 6 Ecosystem Good or Service Value Concepts.............................................................................. 8 Substitute Relationships.............................................................................................................. 9
Valuation of Ecosystem Services.................................................................................................. 10 Role of Economic Valuation..................................................................................................... 10 Dimensions of Economic Value ............................................................................................... 11 Graphical Illustrations of Economic Values of Ecosystem Goods and Services...................... 12 Methods for Valuing Ecosystem Goods and Services.............................................................. 13
Providing and Financing Ecosystem Goods and Services............................................................ 16 Conditions of Exchange............................................................................................................ 17 Characteristics of Ecosystem Goods and Services and Economic Efficiency.......................... 21 Mechanisms of Exchange ......................................................................................................... 23 Likelihood of Market Exchange ............................................................................................... 30
Conclusions................................................................................................................................... 32 References..................................................................................................................................... 33 Tables............................................................................................................................................ 36 Figures........................................................................................................................................... 44 Appendix. Implications and Issues for Public Land Management ............................................... 47
5/31/06 Ecosystem Goods and Services 3
Ecosystem Goods and Services: Definition, Valuation and Provision
Introduction “Ecosystem service” is the latest environmental buzzword (Boyd and Banzhaf, 2005). It
appeals to ecologists, who have long recognized the many benefits of well-functioning ecosystems, and who are pleased that others are taking notice. It appeals to resource economists, who have labored to measure the value to humans of natural resources. And it appeals to a host of others—public land managers and many private landholders included—who see opportunities for more efficient and effective provision of basic environmental service flows. With all of this interest, “ecosystem service” has quickly come to represent several related topics, four of which are (1) the measurement of ecosystem service flows and the processes underlying those flows, (2) understanding the effect of those flows on human well-being, (3) valuation of the services, and (4) provision of the services. We begin by explaining what “ecosystem service” means and how it fits within an economic context, emphasizing the fundamental contribution of ecosystem goods and services in human wellbeing, but also noting the importance of substitutes. Next we review valuation of ecosystem goods and services. Then we discuss provision and financing mechanisms for ecosystem goods and services, focusing on the conditions that facilitate market exchange and on the various mechanisms that are now used to provide and protect the goods and services.
What Is an Ecosystem Service? In the introduction to a book she edited on ecosystem services, Gretchen Daily answered the
question posed in this section in the following way:
Ecosystem services are the conditions and processes through which natural ecosystems, and the species which make them up, sustain and fulfill human life. They maintain biodiversity and the production of ecosystem goods, such as seafood, forage, timber, biomass fuels, natural fiber, and many pharmaceuticals, industrial products, and their precursors. … In addition to the production of goods, ecosystem services are the actual life-support functions, such as cleansing, recycling, and renewal, and they confer many intangible aesthetic and cultural benefits as well (Daily, 1997, p. 3).
Daily’s definition makes an important distinction, between ecosystem services and ecosystem goods. Ecosystems goods are the generally tangible, material products that result from ecosystem processes, whereas ecosystem services are in most cases improvements in the condition or location of things of value.1 Daily explains that ecosystem services are generated by a “complex of natural cycles,” from large scale biogeochemical cycles (such as the movement of carbon through the living and physical environment) to the very small scale life cycles of 1 Like most dichotomies—and the reader will encounter several in the course of this paper—the distinction between goods and services is not without exceptions or complications. For example, recreation opportunities do not fit neatly into either category, as they are neither tangible items (as are water, trees, and copper) nor improvements in conditions (as are water purification, flood mitigation, and pollination). We classify recreation opportunities as goods, based primarily on the fact that an opportunity is not an improvement in the condition of anything. Of course, taking advantage of the opportunity may improve the condition of the participant, but that is another issue.
5/31/06 Ecosystem Goods and Services 4
microorganisms. Such cycles are “the product of billions of years of evolution, and have existed in forms very similar to those seen today for at least hundreds of millions of years” (p. 5)
Daily lists several ecosystem services, such as purification of water, mitigation of floods, and pollination of plants. As she mentions, these services “are absolutely pervasive, but unnoticed by most human beings going about their daily lives” (p. 5). Unlike these ecosystem services, most ecosystem goods do not go unnoticed, as they are the basic natural resources that we consume on a regular basis. Ecosystem goods had long been recognized as key elements of wealth; it is the grand contribution of the modern ecological and hydrological science to more fully recognize and appreciate the services that nature also provides.
The tidy distinction between ecosystem services and ecosystem goods was later obscured by Costanza et al. (1997), who, after noting the difference between goods and services, proceeded to lump them into the class of “ecosystem services.” This lumping had the advantage of brevity but tended to blur the distinction between the functional nature of ecosystem services and the concrete nature of ecosystem goods. This lumping was adopted by others, including De Groot et al. (2002), the Millennium Ecosystem Assessment (Alcamo et al., 2003), and the National Research Council’s Committee on Assessing and Valuing the Services of Aquatic and Related Terrestrial Ecosystems (Heal et al., 2005). We will maintain the distinction between goods and services.
Daily’s (1997) definition makes another key point about ecosystem services: they “sustain and fulfill human life.” The emphasis here is squarely on human well-being, and thus in keeping with an economic perspective. Some might say that such an anthropocentric focus is too limiting—that it devalues the importance of ecosystem structure and processes to species other than humans, or that it runs the risk of ignoring ecosystem processes that contribute to human welfare but are not yet recognized as doing so. Clearly a focus on ecosystem services may turn out, through hubris or ignorance, to have been short-sighted, but, on the other hand, this focus is a vast improvement over business as usual and an opening for even greater consideration of ecosystem services as our understanding of the natural world improves.
Where we differ with Daily’s definition is that we, as have others (e.g., Boyd and Banzhaf, 2005; Costanza et al., 1997; de Groot et al., 2002), draw a distinction between ecosystem services and ecosystem processes. Ecosystem processes (also sometimes called functions) are the complex physical and biological cycles and interactions that underlie what we observe as the natural world. Ecosystem services are the specific results of those processes that either directly sustain or enhance human life (as does natural protection from the sun’s harmful UV rays) or maintain the quality of ecosystem goods (as water purification maintains the quality of streamflow). For example, the forces of wind and water, made possible by solar energy and gravity, produce the service we call “translocation of nutrients.” Similarly, microorganisms in the soil and stream, seeking their own life-preserving conditions, remove contaminants from water, producing the service “water purification”.
Although the difference between processes and services is more than semantic, it may not always seem so, especially when the terms used to summarize the processes are only slightly different from the terms used to characterize the service. For example, the function in which water infiltrates into watershed soils, is stored in those soils, and is later released downstream, which has been called “regulation of hydrologic flows,” produces the service called “water
5/31/06 Ecosystem Goods and Services 5
regulation” (Costanza et al., 1997). The shorthand labels we attach to processes and services must not be allowed to blur the distinction between processes and the services they perform.
Table 1 lists ecosystem goods and services. Ecosystem goods are grouped in two broad categories: renewable and nonrenewable. The nonrenewable ecosystem goods can only be used up, although recycling allows for some recapture and reuse. Renewable ecosystem goods can be received in perpetuity if the stock is managed in a sustained yield fashion (i.e., harvest equals growth). Of course, a stock of renewable resources can be used at a rate faster than its natural growth or replenishment rate. In the limit, the entire stock of some renewable resource, such as a timber stand or fish population, could be converted to an ecosystem good and consumed in one period.
The ecosystem services of Table 1 are similar to those listed by Daily (1997), with some additions and deletions. They result from an assortment of very complex, sometimes interacting physical and biological processes, touching many aspects of human life, including the air we breathe, the water we drink, our food, the weather, our health, and our outdoor recreation possibilities.
We define ecosystem goods and services generally as the flows from an ecosystem that are of relatively immediate benefit to humans and occur naturally.2 As shown in Figure 1, ecosystem goods and services result specifically from ecosystem structure and processes. Ecosystem structure refers to the abiotic and biotic components of an ecosystem and the ecological connections between these components. Ecosystem process refers to the cycles and interactions among those abiotic and biotic components, which produce ecosystem goods and services. The feedbacks in Figure 1 represent both the negative impacts of human actions on the ecosystem and human efforts to protect the ecosystem. The ways in which ecosystem structure and processes generate ecosystem services (e.g., the natural production or transformation functions) are primarily ecologists’ and other physical scientists’ area of interest and expertise. The values and provision of ecosystem goods and services that enter directly into consumers’ utility functions and also indirectly as inputs into economic production are primarily economists’ area of interest and expertise, and the focus of the following sections of this paper.
As a final point of clarification, we note that the goods and services of Table 1 derive from more than just the “ecosystem.” Indeed, they include nonrenewable resources that accumulated through geologic processes that took millions of years, as well as services that involve global hydrologic and climatic systems. Herein we will continue with the convention of referring to all of these as “ecosystem” goods and services.
Ecosystem Goods and Services within an Economic Context The focus of the modern discussion of ecosystem goods and services is on recognizing the
benefits that humans derive from a well-functioning ecosystem. Thus, it is fitting to explain how ecosystem goods and services fit within an economic theory framework.
2 Not all taxonomies of ecosystem services limit them to naturally-occurring goods and services. For example, among its set of ecosystem services the Millennium Ecosystem Assessment (Alcamo et al., 2003) includes produced commodities such as agricultural products. We limit “ecosystem services” to naturally-occurring goods and services; that is, services that exist without human action.
5/31/06 Ecosystem Goods and Services 6
General Background from Economic Growth Theory We begin by going back to the aggregate (macroeconomic) production function or growth
model for an economy as conceptualized by classical economists:
( , , )f=Y M L K (1)
where Y is the total amount of goods and services (i.e., things of relatively direct utility to humans) produced in an economy, and M, L, and K are the total amounts of land, labor and capital available in an economy, respectively.
Capital (K) refers to produced means of production, such as buildings, tools, roads, and vehicles. The meaning of capital within this framework has changed little over the years, but the meanings of land and labor have changed considerably. To classical economists such as Adam Smith and Thomas Malthus, “land” in equation (1) was the pivotal if not primary factor of production.3 Although land was recognized by most classical economists as including the entire natural world of land, sea, and atmosphere, agriculture and its land inputs were generally the primary focus (Hubacek and van der Bergh, 2006). The surplus from the land was seen as the initial and most essential source of wealth, making all other production—and the industrial revolution—possible. However, by the time of the neoclassical school, in the early 20th century, land had lost much of its cache, coming to be considered as just a factor of production, without special characteristics and generally substitutable with other factors.4 Such de-emphasis of land, plus a general lack of interest in externalities, set the stage for the rise of environmental economics in the 1960s and 1970s with works by such economists as Boulding (1966), Georgescu-Roegen (1971), Kneese (1979), and Krutilla and Fisher (1975). These economists formally recognized the importance and uniqueness of natural resources in economic production and growth.
The modern emphasis on natural resources initially focused on resource stocks, both renewable and nonrenewable. Since the early 1990s the stock of natural resources important for economic production and growth has been referred to as “natural capital” (Daly, 1994; Ayres, 1996). This new term encompasses the earth’s surface, its species, the nonliving material stocks of the earth’s crust and atmosphere from which input flows are extracted and into which waste projects get discharged, and even the sun, the source of solar radiation (England, 2000). “Natural capital” returns us to the classical understanding of land, but with an even richer appreciation of its many different components, as scientific discovery has expanded our knowledge of the natural world.
The classical notion of “labor” has also been reinvigorated. Like land, “labor” had gradually lost whatever complexity it had once embodied, succumbing to the logic of substitutability. Recently the meaning of “labor” has been explicitly broadened to include both the knowledge that labor brings to the production process and the institutional and social networks (e.g., laws, educational systems, practices of child upbringing) that underlie the formation of a trained labor force. It is now common to refer to labor and the familial and institutional processes that support
3 David Ricardo and Karl Marx were exceptions, for whom labor was considered the primary source of wealth. 4 By the middle of the 20th century, land for some economists had essentially disappeared from the production function. Solow (1956, p. 67), or example, used a production of the form Y = f(K,L), stating “the production function is homogenous of first degree. This amounts to assuming … no scarce nonagumentable resource like land.” (as quoted by England, 2000).
5/31/06 Ecosystem Goods and Services 7
it as “human capital”. Incorporating these new, more comprehensive concepts into the original aggregate production function we have:
( , , )f=Y N H K (2)
where N and H refer to natural and human capital, respectively, while K continues to refer to built capital. This new formulation recognizes the importance of the processes underlying inputs of immediate concern (i.e., natural resources and labor) in production of goods and services.
Recently economists and ecologists have turned their attention to the flows of goods and services that emanate from the stocks of natural resources. In contemporary terminology, as stated earlier, these natural resource flows, that from a utilitarian perspective are valuable to people in economic production and consumption, are referred to as ecosystem goods and services.
From an economic theory perspective, ecosystem processes are akin to a production function such as equation 1. That is, ecosystem processes can be thought of as natural production or transformation functions, specified in general form as:
( )jE r= N | H (3)
where Ej refers to the jth ecosystem good or service, N represents natural capital and r(•) is the natural production or transformation function (i.e., ecosystem process). Of course, ecosystem goods and services flow from natural capital without inputs of labor or build capital. However, in our modern world, ecosystems must consciously be left to perform their functions. Making N conditional on H in equation 3 indicates that in today’s complex world ecosystem processes are often damaged by human endeavors and are left to do their work relatively unimpeded by human enterprise only through conscious decisions to protect the ecosystem (Figure 1).
An example of an ecosystem good is natural instream flow. Following equation 3, natural instream flow is a function of N, as in:
( , , , , )Natural instream flow r precipitation terrain soils aquifers biota= (4)
That is, natural instream flow is derived from natural capital in the form of precipitation, terrain, soils, aquifers, and biota (plants and animals) found in the ecosystem. The function r(•) in equation 4 represents the ecological and hydrologic processes that produce or generate natural instream flow in a particular watershed.5
In a similar vein, human labor for a particular production process can be thought of as flowing from human capital. Like ecosystems, human systems have structure and processes. It is through the structure and processes of human systems that the labor force is created. Thus, we may think of labor as emanating from human capital (H) along with ecosystem goods and services and produced capital inputs, as:
( )jL h= E, H, K (5)
5 Nonrenewable ecosystem goods, such as gold or oil, are a special case. Here the ecosystem functions of interest played their roles over thousands or millions of years past, operating in cycles that take so long relative to our life spans that we think of the goods as nonrenewable.
5/31/06 Ecosystem Goods and Services 8
where Lj refers to the jth unit of labor and K is taken to include not only prior produced capital (fixed) factors of production but also an array of produced goods and services that serve as variable factors of production, both subject to depreciation.
Produced capital (K) is produced using land, labor, and other capital goods in a production process f:
( , , )jK f= E L K (6)
where K is as defined for equation 5.
Thus, within the modern economic framework, goods and services are derived from combinations of ecosystem goods and services, labor, and capital according to a microeconomic production function:
( , , )jQ q= E L K (7)
where Qj is a good or service of direct utility to humans produced by an individual or firm, q(•) is a production process, E indicates an array of ecosystem goods and services, L indicates an array of labor inputs, and K is as defined above. For example, if Q is potatoes E could signify soil and water plus such services as renewal of soil fertility and pollination, L is the farmer’s knowledge and labor, and K indicates the farmer’s tools as well as seeds and pesticides.
Thus each of the components of the production of final goods and services (i.e., E, L, and K) is the result of production functions and underlying processes of their own: E results from ecological production functions, L results from human production functions, and K results from economic production functions.
Ecosystem Good or Service Value Concepts Ecosystem goods and services, like the other factors of production, are of value to humans
because they enter the utility function. We define individual i’s utility function generally as:
( ), ,iU u ⎡ ⎤= ⎣ ⎦1 2E ,Q E L K (8)
E1 stands for those ecosystem goods and services that enter the utility function without any other inputs. Examples include the air that we breathe, natural temperatures, UV protection, and a landscape view. E2 represents an array of ecosystem goods and services requiring other inputs (i.e., elements of L, and K) for consumption, varying from those that enter the utility function with little in the way of other inputs to those that require large amounts of other inputs.6 Ecosystem goods requiring small amounts of labor and capital include such things as instream flow for drinking by a hiker and wild mushrooms ready for picking. Only travel to and from the site and minimal harvest effort are needed to enjoy such goods. Examples of ecosystem goods that require much more labor or capital are timber, which must be cut, hauled, and milled before it becomes lumber, and crude oil, which must be pumped, transported, and refined before it becomes gasoline.
6 The dichotomy between E1 and E2 is somewhat artificial, in that there is a continuum from those ecosystem goods and services that require little or no other inputs to be of direct utility to humans to those that require a great deal.
5/31/06 Ecosystem Goods and Services 9
All of the ecosystem services of Table 1 contribute to the maintenance or quality of one or more of the renewable ecosystem goods of the table. For example, purification of air maintains air quality, pollination and seed dispersal assist the propagation of wild plants, and maintenance of precipitation patterns assists water supply as well as natural plant and animal survival. In addition, several of the ecosystem services, especially the bottom six on the list, can directly affect utility. For example, moderation of temperature extremes, protection from harmful UV rays, and natural pest control all directly enter the utility function.
To further explain, to produce a drink of water while on a hike we directly use the instream flow, not the natural production or transformation functions (e.g., ecosystem processes) that produce the flow. Similarly, to produce a fishing trip an angler combines a recreation opportunity (including instream flow and a fish population), labor (e.g., effort, fishing skills) and built capital (e.g., boat, fishing gear) to produce a fishing experience. However, in these cases where the ecosystem service is not directly consumed, there is a derived demand for the ecosystem service, and thus for the processes and the natural capital (e.g., ecosystem structure) supporting ecosystem processes, as seen by showing equation 3 within equation 8:
( ) ( )( ), ,U u r r⎡ ⎤= =⎣ ⎦1 2E = N ,Q E N L K (9)
The ecosystem good that does enter the utility function is the result of the natural production function as specified in equation 3. The essential point here is that ecosystem goods and services are the components of the natural world that enter our utility function either directly, or indirectly as inputs in the production of final goods and services.
The various pathways by which ecosystem goods and services affect utility are depicted in Figure 2. Ecosystem services can directly affect utility (pathway 1), maintain the quality of ecosystem goods (2), or be used in the production of manufactured or agricultural goods (3). Examples of (1) include protection from harmful UV rays, and maintenance of air quality. Examples of (3) include pollination of agricultural crops and protection of the quality of streamflow that is diverted, treated, and delivered for human use. Renewable ecosystem goods can affect utility directly (4) or act as inputs in the production of goods (5) that then directly affect utility (8). Examples of such ecosystem goods include a beautiful landscape view and timber, respectively. Nonrenewable ecosystem goods, such as oil, serve as inputs in the production of produced goods (6). Built capital and labor are also used in the production of produced goods (7).
Substitute Relationships The relative quantities of E, L, and K that are required to produce a good or service Q are to
some extent substitutable. To take farming as an example, a farmer may substitute K (in the form of tractors and combines) for L (human labor). Most ecosystem goods and services have substitutes in the form K and Q. For example, considering ecosystem goods, wild mushrooms may be cultivated, and timber for wooden studs may be replaced with iron for metal studs (see the right-hand column of Table 2). Or, considering ecosystem services, the waste assimilation properties of natural watersheds can be replaced with a waste treatment plant (a form of K), and natural pest control can be replaced by pesticides (a form of Q). Of course, all of these produced substitutes require inputs including other forms of E, but this does not negate the fact that substitutes generally exist.
5/31/06 Ecosystem Goods and Services 10
It is the nature of economic and population growth that some ecosystem goods and services become depleted and that humans use their technological prowess along with inputs including more plentiful ecosystem goods and services to produce new capital and goods that compensate for such depletion. Of particular interest is whether the cost of producing substitutes for E exceeds the opportunity cost of protecting the original forms of E. For example, healthy watersheds control the amount of sediment that enters streams during precipitation events, keeping the cost of water treatment and delivery down (as well as protecting aquatic habitat). Healthy streams also perform natural waste assimilation, again containing the cost of downstream water treatment (and protecting aquatic life). The recent focus on ecosystem services has been in large part an effort to bring attention to the economic importance of natural ecosystems and the fact that when ecosystems are degraded, the services lost must often be replaced with costly substitute investments of human and built capital (de Groot et al., 2002; Loucks and Gorman, 2004).7
Valuation of Ecosystem Services The economic value of something is a measure of its contribution to human well-being
(Freeman, 2003). Economic values reflect the preferences and actions of people in a society, who are assumed to behave so as to maximize their well-being given the constraints that they face. Clearly such values are based on an instrumental view of nature and on the assumption that individuals are competent judges of what is in their best interests. These premises are arguable, and much has been written about alternative approaches to value and about the inadequacies of human decision making. However, even with its flaws, quantification of economic values can, and regularly does, provide useful information for public decisions, especially when the limitations as well as the strengths of the values are recognized.
Role of Economic Valuation It is legitimate to ask: why bother to estimate the economic value of ecosystem goods and
services? Surely it cannot be done perfectly, and even if it could, doesn’t reducing the value of ecosystem goods and services to a monetary metric somehow downplay their real or full values? The answer to these questions is that decisions are commonly made about whether to protect or degrade ecosystem goods and services, and those decisions are more likely to be made in the best interests of the relevant publics if decision makers have comparable information about what is gained and what is lost if a certain policy option is chosen (Heal et al., 2005; Salzman et al., 2001). Monetary estimates of the values of ecosystem goods or services, even if inexact, may be far better than a complete lack of such estimates, especially if the direction of the error in estimation—whether the value estimate is taken to be a lower bound or an upper bound of the actual value, for example—is known.
Economic valuation has a greater chance of providing an accurate estimate of value if the ecosystem change being evaluated is small relative to the total production of the good or service in the geographical area of interest. For example, it is easier to value a small change in water yield than to value a very large change. This is because existing prices indicate the marginal 7 The point—that it is often much cheaper to maintain a well-functioning ecosystem than to use even the most efficient modern technology—is perhaps best demonstrated by the oft cited example of New York City’s decision to protect its watershed in lieu of constructing an expensive water filtration plant (Daily and Ellison, 2002).
5/31/06 Ecosystem Goods and Services 11
value of the resource, and the marginal value applies best to a small change in quantity or quality. Large reductions would typically be undervalued if the entire change were valued at the marginal value. Fortunately, most realistic policy changes cause only relatively small changes in the production of a given ecosystem good or service.
Economic values may be used as input to benefit-cost analysis or to cost effectiveness analysis. In the former case, the benefits of a prospective policy change are compared with the costs. For example, if the prospective policy change is the commercial development of a wetland, the benefits of the development (perhaps estimated as the market price of the land once the wetland is filled in and the land is thus available for development) are compared with the costs (estimated as the cost of infilling plus the loss in ecosystem services provided by the wetland). With cost effectiveness analysis, a decision has already been made to provide some good or service (i.e., it has essentially been decided that the costs, whatever they are, are less than the benefits), and the task is to determine the most effective way to provide the benefits. The New York City water supply case (Daily and Ellison, 2002) exemplifies this situation, where the EPA, via amendments to the Safe Drinking Water Act, mandates water quality standards and the City considered the option of protecting its watershed in lieu of constructing and maintaining a filtration plant. Because the City must meet EPA standards, the issue is whether building and operating a filtration plant, or protecting the source watershed, is less expensive.8
Dimensions of Economic Value The economic value of an ecosystem good or service may consist of both use and nonuse
values. Use value may result from either direct or indirect use, as described in a previous section. Direct use involves some form of direct physical interaction with the good or service. With ecosystem goods, direct use may be consumptive (e.g., hunting) or nonconsumptive (e.g., bird watching). Consumptive uses involve some form of extraction or harvesting, whereas nonconsumptive use leaves the quantity of the good or service undiminished. However, nonconsumptive uses may affect the quality of the resource or service, perhaps by pollution or crowding. Indirect use involves ecosystem services that contribute to the quality of an ecosystem good or a produced good. For example, natural water purification that occurs in a watershed contributes to the quality of the streamflow, and natural pollination of crops enhances the farmer’s yield.
Nonuse value, also called passive use value, arises for ecosystem goods or services that people value simply for their existence. Nonuse value can be thought of as the difference between total value and use value—if use of the good or service is impossible but total value remains positive, the remaining value is nonuse value. Bequest value, the value of knowing that the resource will be available for others, including future generations, is a form of nonuse value, but bequest motives are not a necessary condition for nonuse value. Nonuse values can be substantial, but are difficult to quantify (Heal et al., 2005).
The economic value of something to an individual is the maximum amount the person would pay to get it (WTP), or the minimum amount he or she would accept to give it up (WTA).
8 Of course, if watershed protection is cheapest, the choice is obvious. However, if a filtration plant is cheapest, then further analysis is needed, because watershed protection may provide other benefits (such as wildlife habitat and recreation opportunities), and when these benefits are also considered watershed protection may then appear as the best choice. Such situations move the analysis beyond the confines of cost effectiveness analysis.
5/31/06 Ecosystem Goods and Services 12
Maximum WTP for a gain is the payment amount that leaves the individual just as well off as before the trade. Similarly, minimum WTA to agree to a loss is the amount of compensation that leaves the individual just as well off as before the trade.9 The choice of WTP or WTA as the measure of something depends on whether or not the person has property rights to it. For private goods, property rights are generally well-established, but for public goods, environmental conditions, or goods available on public land, property rights are not so obvious or easily established. For example, the right to a certain level of streamflow quality along a river, say to a person with property along the river or to a kayaker who floats the river, is a complicated matter of state and federal law, perhaps without an unambiguous resolution. The difficulty over property rights would matter little if WTP did not differ from WTA, but in some cases—especially those where close substitutes to the good or service at issue are not available (Hanemann, 1991), as may easily be the case with some ecosystem goods or services, such as unique recreation and educational opportunities or maintenance of biodiversity—WTA can substantially exceed WTP. Unfortunately, WTA is often difficult to measure, and in consequence WTP is often used even where WTA would be more appropriate, resulting in an underestimate of value. An underestimate may still be a useful input to a policy decision, as long as it is recognized as a lower bound on the true value.
We proceed here with a simple graphical illustration of some typical ecosystem valuation situations.
Graphical Illustrations of Economic Values of Ecosystem Goods and Services Demand, or marginal WTP, for a good or service is typically downward sloping, as in
Figure 3, reflecting diminishing marginal utility. If ample quantities of the good or service are available, the marginal WTP for a given unit is small. However, as the quantity available gets smaller and smaller, marginal value increases. For most goods, the demand curve touches the vertical (price) axis at some point, indicating that above that price no units are desired. However, some ecosystem goods or services may be essential for life; if such a good or service had no substitutes, demand for it would have no precise bounds, as depicted by the dotted line at the upper left of the demand curve, which rises steeply and does not touch the vertical axis. But the demand curve for the ecosystem good or service may truncate if a substitute for the service is available, as shown at a cost of ab per unit. Once the price of the ecosystem service rose to ab, users would switch to the substitute.
Supply, or marginal cost, is—past some minimum level—typically upward sloping, as curve he in Figure 4, representing increasing marginal cost. With some goods or services that are naturally supplied, however, supply may reach a maximum feasible point, as represented by the vertical supply curve beginning at point e at quantity ai of the good or service. The portion of the supply curve he shows the increasing marginal cost of protecting the ecosystem; the more protection, the greater the quantity of ecosystem good or service provided, but the higher the cost. Complete protection would cost a total depicted by area hei. The supply curve is shown beginning at quantity ah, indicating that quantity ah is forthcoming whether or not humans make any effort to protect the ecosystem. For example, if the service were water purification that
9 These measures assume that the individual has a right to her current utility level. Other possible economic measures are the WTP to avoid a loss (which leaves the individual at a lower utility level) and the WTA to give up a gain (which leaves the individual at a higher utility level).

5/31/06 Ecosystem Goods and Services 13
occurs in a watershed, quantity ah would be the amount that occurs even if no effort is made to protect the watershed, and quantity ai would be the amount of water purification that occurs if the watershed were left undisturbed.
Given demand and supply as depicted in Figure 4, the optimal amount of ecosystem protection occurs at ecosystem service level ag, at a marginal protection cost of ac. At this optimal level, the gross benefit of (i.e., the total willingness to pay for) the ecosystem service is represented by area abdfg. This total is made up of consumer surplus (area cbdf), producer surplus (area acfh), and the cost of protecting the ecosystem to the desired level (area hfg). Of course, with most ecosystem services, which tend to be public goods, the producer surplus is not captured by an actual producer, as with a commercial good, but rather stays with the consumer.
Let us assume that we are at this optimum point (ag of the ecosystem service) but that there is pressure to develop the area, which would reduce the level of the ecosystem service to ah. If the ecosystem service were left completely unprotected, so that only quantity ah were provided, consumer surplus would be reduced to area cbdkj and producer surplus would be reduced to area acjh, but the protection cost would disappear. The net change is hkf. It is this quantity that must be estimated and compared with the annualized benefit of development to assist decision makers in the decision of whether or not to let the development proceed. This general situation might apply to several of the ecosystem goods or services listed in table 1, such as timber yield or recreation opportunities from a forest area.
Now, to consider another common situation, let us assume that a level of ecosystem service is mandated by law. This law essentially establishes a vertical demand schedule at the mandated level of water quality (ei in Figure 5). In this case, given the supply of the ecosystem service indicated by “Supply (ES)” (line fgh), the optimal level of ecosystem protection is at level ae, and the total cost of protection is area fde. Now, as in the New York City water treatment case, let us assume that a built alternative to the ecosystem service exists, as depicted by the curve “Supply (built)” (line bj). To reach the mandated level of water quality would cost a total indicated by abce. Thus, the cost savings attributable to the ecosystem service is depicted by area abcdf.
Methods for Valuing Ecosystem Goods and Services As summarized by Heal et al. (2005), four principal categories of methods are available for
valuation of ecosystem goods and services:
• Revealed preference (household production function) methods, including the travel cost, hedonic, and averting behavior methods
• Stated preference methods, including contingent valuation and attribute-based methods
• Production function methods
• Replacement cost method.
We will briefly describe these methods. Heal et al. (2005) provide more detail, and many sources are available that give thorough descriptions.
The first two categories are considered nonmarket valuation methods. Recently described in some detail in Champ et al. (2003), these methods focus on individual choices and preferences,
5/31/06 Ecosystem Goods and Services 14
based on the fundamental assumption that individuals act so as to maximize their utility (thus providing true indications of value).
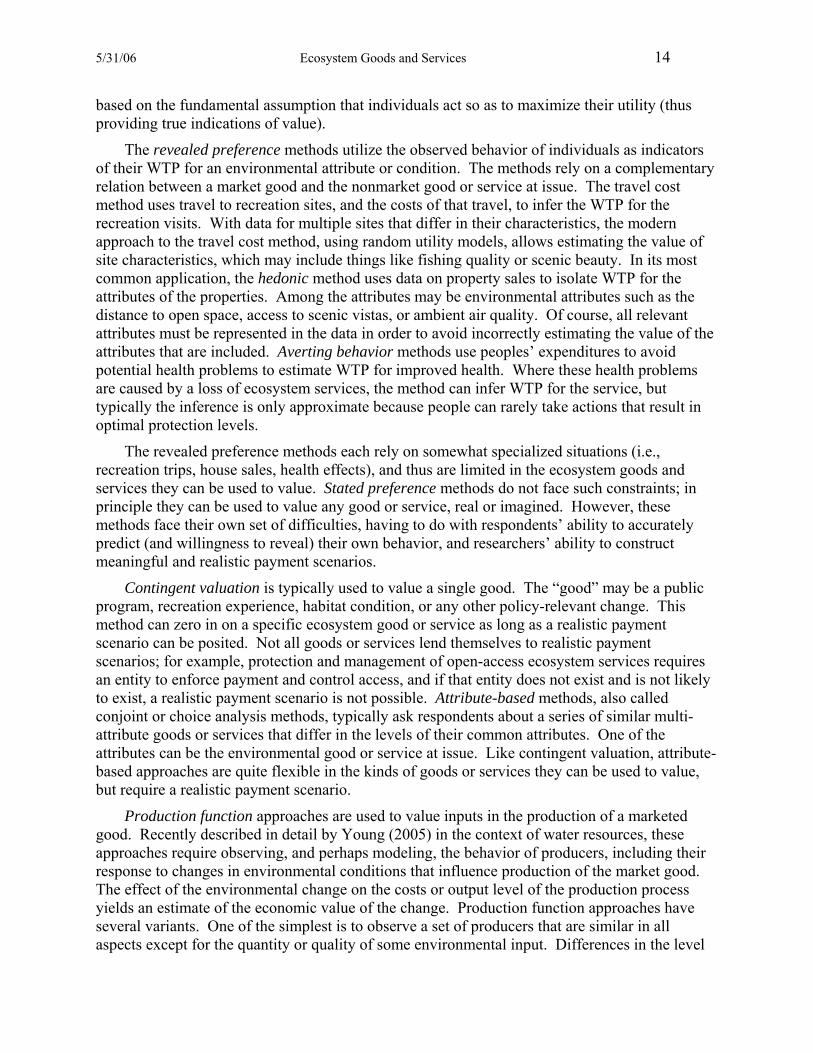
The revealed preference methods utilize the observed behavior of individuals as indicators of their WTP for an environmental attribute or condition. The methods rely on a complementary relation between a market good and the nonmarket good or service at issue. The travel cost method uses travel to recreation sites, and the costs of that travel, to infer the WTP for the recreation visits. With data for multiple sites that differ in their characteristics, the modern approach to the travel cost method, using random utility models, allows estimating the value of site characteristics, which may include things like fishing quality or scenic beauty. In its most common application, the hedonic method uses data on property sales to isolate WTP for the attributes of the properties. Among the attributes may be environmental attributes such as the distance to open space, access to scenic vistas, or ambient air quality. Of course, all relevant attributes must be represented in the data in order to avoid incorrectly estimating the value of the attributes that are included. Averting behavior methods use peoples’ expenditures to avoid potential health problems to estimate WTP for improved health. Where these health problems are caused by a loss of ecosystem services, the method can infer WTP for the service, but typically the inference is only approximate because people can rarely take actions that result in optimal protection levels.
The revealed preference methods each rely on somewhat specialized situations (i.e., recreation trips, house sales, health effects), and thus are limited in the ecosystem goods and services they can be used to value. Stated preference methods do not face such constraints; in principle they can be used to value any good or service, real or imagined. However, these methods face their own set of difficulties, having to do with respondents’ ability to accurately predict (and willingness to reveal) their own behavior, and researchers’ ability to construct meaningful and realistic payment scenarios.
Contingent valuation is typically used to value a single good. The “good” may be a public program, recreation experience, habitat condition, or any other policy-relevant change. This method can zero in on a specific ecosystem good or service as long as a realistic payment scenario can be posited. Not all goods or services lend themselves to realistic payment scenarios; for example, protection and management of open-access ecosystem services requires an entity to enforce payment and control access, and if that entity does not exist and is not likely to exist, a realistic payment scenario is not possible. Attribute-based methods, also called conjoint or choice analysis methods, typically ask respondents about a series of similar multi-attribute goods or services that differ in the levels of their common attributes. One of the attributes can be the environmental good or service at issue. Like contingent valuation, attribute-based approaches are quite flexible in the kinds of goods or services they can be used to value, but require a realistic payment scenario.
Production function approaches are used to value inputs in the production of a marketed good. Recently described in detail by Young (2005) in the context of water resources, these approaches require observing, and perhaps modeling, the behavior of producers, including their response to changes in environmental conditions that influence production of the market good. The effect of the environmental change on the costs or output level of the production process yields an estimate of the economic value of the change. Production function approaches have several variants. One of the simplest is to observe a set of producers that are similar in all aspects except for the quantity or quality of some environmental input. Differences in the level
5/31/06 Ecosystem Goods and Services 15
of output among these producers, and thus in their net revenues, holding all other inputs constant, indicates the value of the environmental input. Another, more complex approach is to carefully model the behavior of firms under conditions that differ in the level of the environmental input. Such modeling requires detailed understanding of how firms respond to varying levels of their different inputs, including the input of primary interest, the environmental condition. A key condition for using production function approaches is that the output and the other inputs are competitively priced (e.g., that subsidies do not seriously affect their prices), or, if not competitively priced, that the market interference can be adjusted for.10
Unlike the first three categories of methods, replacement cost methods do not rely on observing or modeling the behavior of persons or firms as they respond to existing or posited conditions. Rather, these methods compute the cost of replacing a lost environmental good or service, or conversely the replacement cost avoided if the environmental good or service is preserved. Because the replacement cost is a measure of cost, not of value, it is not truly a valuation method. However, the method—or, more precisely, the estimate of cost that it entails—is commonly used with ecosystem services, and thus the method deserves a closer look.
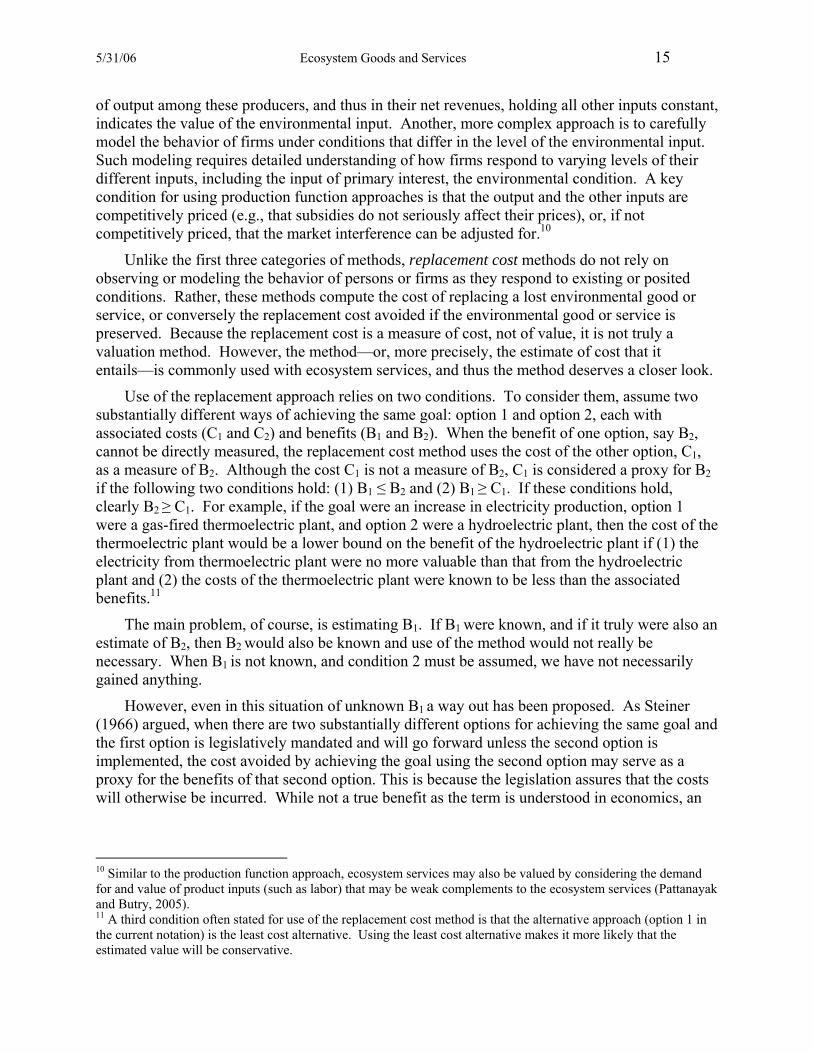
Use of the replacement approach relies on two conditions. To consider them, assume two substantially different ways of achieving the same goal: option 1 and option 2, each with associated costs (C1 and C2) and benefits (B1 and B2). When the benefit of one option, say B2, cannot be directly measured, the replacement cost method uses the cost of the other option, C1, as a measure of B2. Although the cost C1 is not a measure of B2, C1 is considered a proxy for B2 if the following two conditions hold: (1) B1 ≤ B2 and (2) B1 ≥ C1. If these conditions hold, clearly B2 ≥ C1. For example, if the goal were an increase in electricity production, option 1 were a gas-fired thermoelectric plant, and option 2 were a hydroelectric plant, then the cost of the thermoelectric plant would be a lower bound on the benefit of the hydroelectric plant if (1) the electricity from thermoelectric plant were no more valuable than that from the hydroelectric plant and (2) the costs of the thermoelectric plant were known to be less than the associated benefits.11
The main problem, of course, is estimating B1. If B1 were known, and if it truly were also an estimate of B2, then B2 would also be known and use of the method would not really be necessary. When B1 is not known, and condition 2 must be assumed, we have not necessarily gained anything.
However, even in this situation of unknown B1 a way out has been proposed. As Steiner (1966) argued, when there are two substantially different options for achieving the same goal and the first option is legislatively mandated and will go forward unless the second option is implemented, the cost avoided by achieving the goal using the second option may serve as a proxy for the benefits of that second option. This is because the legislation assures that the costs will otherwise be incurred. While not a true benefit as the term is understood in economics, an
10 Similar to the production function approach, ecosystem services may also be valued by considering the demand for and value of product inputs (such as labor) that may be weak complements to the ecosystem services (Pattanayak and Butry, 2005). 11 A third condition often stated for use of the replacement cost method is that the alternative approach (option 1 in the current notation) is the least cost alternative. Using the least cost alternative makes it more likely that the estimated value will be conservative.
5/31/06 Ecosystem Goods and Services 16
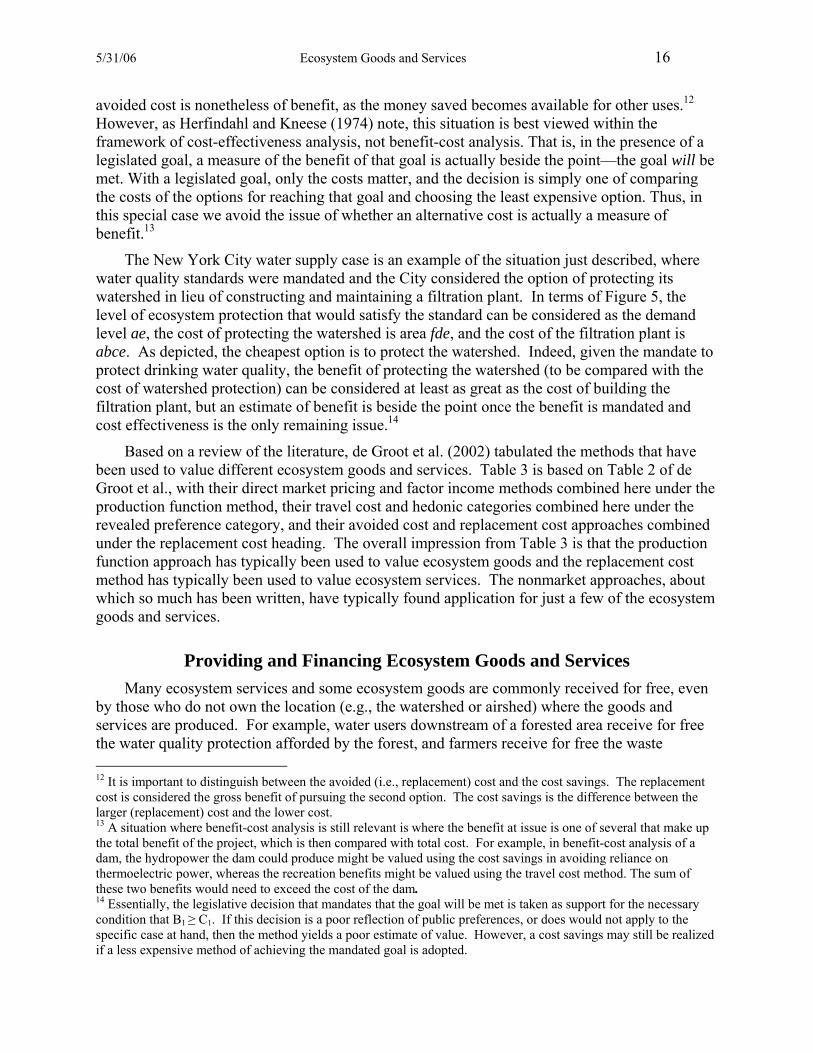
avoided cost is nonetheless of benefit, as the money saved becomes available for other uses.12 However, as Herfindahl and Kneese (1974) note, this situation is best viewed within the framework of cost-effectiveness analysis, not benefit-cost analysis. That is, in the presence of a legislated goal, a measure of the benefit of that goal is actually beside the point—the goal will be met. With a legislated goal, only the costs matter, and the decision is simply one of comparing the costs of the options for reaching that goal and choosing the least expensive option. Thus, in this special case we avoid the issue of whether an alternative cost is actually a measure of benefit.13
The New York City water supply case is an example of the situation just described, where water quality standards were mandated and the City considered the option of protecting its watershed in lieu of constructing and maintaining a filtration plant. In terms of Figure 5, the level of ecosystem protection that would satisfy the standard can be considered as the demand level ae, the cost of protecting the watershed is area fde, and the cost of the filtration plant is abce. As depicted, the cheapest option is to protect the watershed. Indeed, given the mandate to protect drinking water quality, the benefit of protecting the watershed (to be compared with the cost of watershed protection) can be considered at least as great as the cost of building the filtration plant, but an estimate of benefit is beside the point once the benefit is mandated and cost effectiveness is the only remaining issue.14
Based on a review of the literature, de Groot et al. (2002) tabulated the methods that have been used to value different ecosystem goods and services. Table 3 is based on Table 2 of de Groot et al., with their direct market pricing and factor income methods combined here under the production function method, their travel cost and hedonic categories combined here under the revealed preference category, and their avoided cost and replacement cost approaches combined under the replacement cost heading. The overall impression from Table 3 is that the production function approach has typically been used to value ecosystem goods and the replacement cost method has typically been used to value ecosystem services. The nonmarket approaches, about which so much has been written, have typically found application for just a few of the ecosystem goods and services.
Providing and Financing Ecosystem Goods and Services Many ecosystem services and some ecosystem goods are commonly received for free, even
by those who do not own the location (e.g., the watershed or airshed) where the goods and services are produced. For example, water users downstream of a forested area receive for free the water quality protection afforded by the forest, and farmers receive for free the waste 12 It is important to distinguish between the avoided (i.e., replacement) cost and the cost savings. The replacement cost is considered the gross benefit of pursuing the second option. The cost savings is the difference between the larger (replacement) cost and the lower cost. 13 A situation where benefit-cost analysis is still relevant is where the benefit at issue is one of several that make up the total benefit of the project, which is then compared with total cost. For example, in benefit-cost analysis of a dam, the hydropower the dam could produce might be valued using the cost savings in avoiding reliance on thermoelectric power, whereas the recreation benefits might be valued using the travel cost method. The sum of these two benefits would need to exceed the cost of the dam. 14 Essentially, the legislative decision that mandates that the goal will be met is taken as support for the necessary condition that B1 ≥ C1. If this decision is a poor reflection of public preferences, or does would not apply to the specific case at hand, then the method yields a poor estimate of value. However, a cost savings may still be realized if a less expensive method of achieving the mandated goal is adopted.
5/31/06 Ecosystem Goods and Services 17
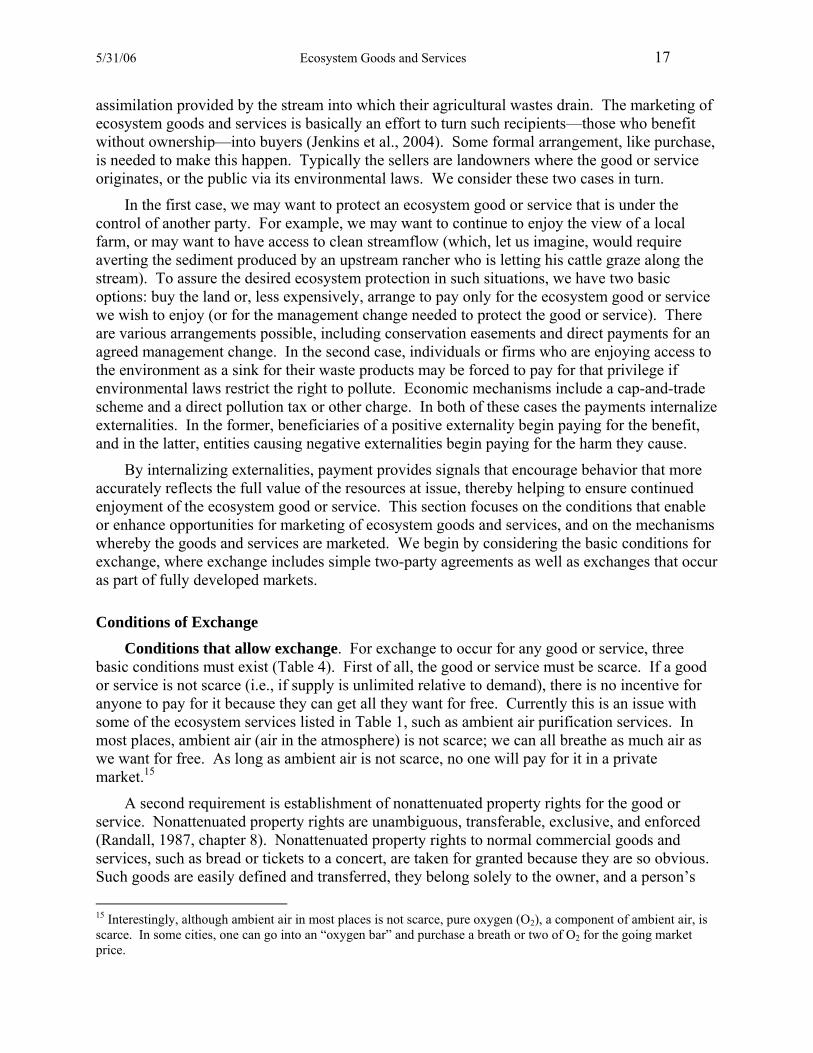
assimilation provided by the stream into which their agricultural wastes drain. The marketing of ecosystem goods and services is basically an effort to turn such recipients—those who benefit without ownership—into buyers (Jenkins et al., 2004). Some formal arrangement, like purchase, is needed to make this happen. Typically the sellers are landowners where the good or service originates, or the public via its environmental laws. We consider these two cases in turn.
In the first case, we may want to protect an ecosystem good or service that is under the control of another party. For example, we may want to continue to enjoy the view of a local farm, or may want to have access to clean streamflow (which, let us imagine, would require averting the sediment produced by an upstream rancher who is letting his cattle graze along the stream). To assure the desired ecosystem protection in such situations, we have two basic options: buy the land or, less expensively, arrange to pay only for the ecosystem good or service we wish to enjoy (or for the management change needed to protect the good or service). There are various arrangements possible, including conservation easements and direct payments for an agreed management change. In the second case, individuals or firms who are enjoying access to the environment as a sink for their waste products may be forced to pay for that privilege if environmental laws restrict the right to pollute. Economic mechanisms include a cap-and-trade scheme and a direct pollution tax or other charge. In both of these cases the payments internalize externalities. In the former, beneficiaries of a positive externality begin paying for the benefit, and in the latter, entities causing negative externalities begin paying for the harm they cause.
By internalizing externalities, payment provides signals that encourage behavior that more accurately reflects the full value of the resources at issue, thereby helping to ensure continued enjoyment of the ecosystem good or service. This section focuses on the conditions that enable or enhance opportunities for marketing of ecosystem goods and services, and on the mechanisms whereby the goods and services are marketed. We begin by considering the basic conditions for exchange, where exchange includes simple two-party agreements as well as exchanges that occur as part of fully developed markets.
Conditions of Exchange Conditions that allow exchange. For exchange to occur for any good or service, three
basic conditions must exist (Table 4). First of all, the good or service must be scarce. If a good or service is not scarce (i.e., if supply is unlimited relative to demand), there is no incentive for anyone to pay for it because they can get all they want for free. Currently this is an issue with some of the ecosystem services listed in Table 1, such as ambient air purification services. In most places, ambient air (air in the atmosphere) is not scarce; we can all breathe as much air as we want for free. As long as ambient air is not scarce, no one will pay for it in a private market.15
A second requirement is establishment of nonattenuated property rights for the good or service. Nonattenuated property rights are unambiguous, transferable, exclusive, and enforced (Randall, 1987, chapter 8). Nonattenuated property rights to normal commercial goods and services, such as bread or tickets to a concert, are taken for granted because they are so obvious. Such goods are easily defined and transferred, they belong solely to the owner, and a person’s 15 Interestingly, although ambient air in most places is not scarce, pure oxygen (O2), a component of ambient air, is scarce. In some cities, one can go into an “oxygen bar” and purchase a breath or two of O2 for the going market price.
5/31/06 Ecosystem Goods and Services 18
right to such a good is unquestioned and protected via widely available law enforcement. However, these characteristics are not so easily established for many ecosystem goods and services.
Excludability will be discussed in detail below. Here we focus on definition and measurement, and on monitoring. Definition and measurement of ecosystem goods is fairly straightforward, but for ecosystem services definition and measurement can be a major stumbling block. For example, the amount of water purification, or conversely the amount of water pollution, that occurs on a given parcel of land—either in soils or wetlands—is extremely difficult to quantify because of the multiple points at which the water enters the stream.16 The issue is further complicated by the fact that water quality is a matter of numerous different constituents. If parties cannot agree on a measurement protocol or do not have faith in the measurement that occurs, possibilities for exchange are seriously compromised.
Enforcement of exchange agreements is another hurdle. With ecosystem goods, contracts for delivery rely on fairly well-established laws that are unlikely to change in the foreseeable future. However, arrangements for provision and financing of ecosystem services are often fairly new and typically rely on unique, recently established rules announced by the government. Such rules may be subject to change, leaving uncertainty in the minds of private participants. If potential participants lack confidence that the agreements will endure and be enforced, they may decline to participate despite the announced benefits. For example, farmers may be enticed to plant trees of sensitive slopes with a promise of future payments from a governmental agency, but if the farmers have any doubt about the payments—perhaps because the agency’s funding is uncertain—they are likely to continue to plant their crops.
Once nonattenuated property rights are established for a scarce good or service, as Ronald Coase (1960) showed, market trade will automatically develop for the good or service as long as transaction costs are not excessive. Transaction costs include costs of getting information, finding willing sellers or buyers, and transferring title, which are commonly borne by the parties to the exchange. Transaction costs also include the underlying costs of establishing and enforcing nonattenuated property rights to the good or service, which are commonly borne by a governmental entity (Randall, 1983; Whitten et al, 2003). These underlying costs may involve monitoring, either of environmental conditions such as ambient water quality or air quality, or of emissions of point- or nonpoint-source pollution. If transaction costs borne by the parties to the transaction exceed the benefits of the exchange, exchange will not occur. If transaction costs borne by a government entity are excessive relative to the perceived public benefits of the resultant transactions, exchange is also unlikely to occur.
Assuming transactions costs are not prohibitive, private markets for ecosystem services that achieve economic efficiency could theoretically develop as envisioned by Coase. Economic efficiency is a common policy and management goal with respect to providing and paying for any good or service. Economic efficiency is generally defined as Pareto efficiency, a situation in which it is not possible to reallocate production or consumption in a way that makes one individual or group better off without making another individual or group worse off (Freeman, 2003; Randall, 1983). Voluntary exchanges will naturally enhance economic efficiency as long
16 This difficulty is a primary reason for the relative lack of success in the U.S. in controlling nonpoint-source water pollution, in contrast to point-source water pollution, which has largely been brought under control.
5/31/06 Ecosystem Goods and Services 19
as all parties affected by the exchange are party to the exchange (i.e., as long as externalities are not present).
Assuming transactions costs are not prohibitive, private markets for ecosystem services could theoretically develop as envisioned by Coase. Applying the strong version of the Coase Theorem, if transactions costs are zero (or negligible), the final, economically efficient, provision of ecosystem services will be independent of the initial assignment of property rights.17 As an example, consider the ecosystem service of freshwater instream flow and for simplicity assume there are two parties interested in the water, an upstream party and a downstream party. The strong version of the Coase Theorem would imply that the final economically efficient allocation of instream flow between the upstream party and downstream party resulting from market trade of the water would be independent of the initial assignment of property rights. Thus, we could assign initial water rights to either party and then let market trade between the two lead to the unique economically efficient allocation of water between the parties.
The weak—and more realistic—version of the Coase Theorem drops the assumption of zero transactions costs. Because of the presence of positive (but not prohibitively high) transactions costs, the weak version implies that the final economically efficient level of ecosystem services will depend upon the initial assignment of property rights. For example, consider again the upstream and downstream parties in the example in the previous paragraph. Under the weak version of the Coase Theorem, if water rights were initially assigned to the upstream party, we would expect the final economically efficient allocation of water resulting from market trade to favor the upstream party (i.e., the upstream party would end up with more of the streamflow than in the case of zero transaction costs). However, if water rights were initially assigned to the downstream party, theoretically we would expect the final economically efficient allocation of water resulting from market trade to favor the downstream party. Whether we initially assign water rights to the upstream or downstream party, the final allocation of water between the two parties will be economically efficient (Randall, 1987, Chapter 9).
Conditions that further improve the likelihood of exchange. We have identified three general requirements for exchange to occur: scarcity, nonattenuated property rights and nonprohibitive transactions costs. These requirements or conditions, however, are not necessarily sufficient for exchange to occur. One potential hurdle is that, because the gains from trade in an ecosystem good or service market will depend on the initial allocation of rights, the resulting distribution of resources and incomes may be viewed as unfair (Table 4). Inequity, especially involving lower income providers of ecosystem services, is a potential barrier to exchange, particularly if the exchange is of a good or service with public good qualities (Landell-Mills, 2002). Thus, for the long-term support and sustainability of an ecosystem service market, passing an economic fairness or social justice test may be another necessary condition.
Another explanation for the lack of market development could be political, social or even moral opposition to the idea of trading ecosystem goods or services. Some people, for example, hold the strong opinion that the public has inherent rights to ecosystem good or services and that provision and protection of these things should not be left up to impersonal, private transactions. For example, many people may view access to clean air and water as a fundamental human right
17 An additional condition is that income effects are negligible, where income effects refer to increased (decreased) demand for ecosystem goods and services based on increased (decreased) income resulting from who gets paid by whom for ecosystem goods and services.
5/31/06 Ecosystem Goods and Services 20
and morally object to forcing people to pay for this right through market transactions. This group would likely rather see government provide and protect clean air and water through general tax revenues, regulation and pollution taxes under the “polluter pays” principle (Randall, 1983).
Related to the matters of fairness and acceptability of exchange is the question of externalities. The existence of either pecuniary or technical externalities can lead to opposition to exchange. Pecuniary externalities arise when a transaction financially harms individuals or firms not party to the exchange. For example, when water rights are transferred from one basin to another, leading to a drop in water use in the basin of the seller, businesses or local government agencies (and the services they provide) that relied on the economic activity related to that water use may be harmed (e.g., Howe and Goemans, 2003). Technical negative externalities result from an exchange when the exchange causes individuals or firms not party to the exchange to experience lower environmental quality. For example, to return to the water transfer example, the loss of water in the seller’s basin may lead to lower water quality in the river of origin because there is less water to accept and naturally assimilate waste products. The existence of either kind of externality may lead to legal and political opposition to an exchange (e.g., Hanak, 2005)
Another factor that facilitates exchange is the presence of institutions aiding exchange, such as laws and customs that treat the item at issue as a marketable commodity, brokers that help bring buyers and sellers together, and middle-men that buy the item from sellers and then sell it to buyers. For example, water marketing in the western U.S. is facilitated by laws and customs that allow for transfer of water rights, real estate brokers that deal in water, and water banks that have no use for water themselves but serve as a clearing house, temporarily holding commitments for water delivery (Tarlock et al., 1992).
Conditions that lead to a competitive market solution. Isolated trades are not the only or even the most common exchanges of ecosystem goods and services. Markets—institutions or settings in which numerous individuals voluntarily trade units of a good or service, typically using money as the means of exchange—are common. Markets exist for many of the ecosystem goods listed in Table 1. If the conditions described above are met, and if a sufficient number of units of the good or service are available, an active market may develop. Economic efficiency is naturally enhanced through such markets if they are competitive. Voluntary exchange, however, does not assure competitiveness.
Competitive markets have several characteristics (Table 4), the most important for the current discussion being that (1) they have many buyers and sellers, so that no individual or firm can control the price or the total quantity offered for sale, (2) they internalize all costs and benefits (i.e., there are no externalities to a transaction), and (3) the good or service is rival. Under competitive conditions, market price and the quantity traded are such that the price is the point at which the marginal cost of providing the good equals the marginal benefit of its consumption.
It is not likely that a market for an ecosystem good or service—or any good or service, for that matter—will be purely competitive or completely lacking in competition. Markets lacking in competition may be monopolistic or monopsonistic. In a purely monopolistic (monopsonisitc) market, a block of sellers (buyers) would have such a strong hold on market supply (demand) that they could set price at will with no concerns about competitors stepping in to capture a larger share of the market. Not many markets for any economic goods strictly meet the
5/31/06 Ecosystem Goods and Services 21
requirements to be purely competitive or purely uncompetitive. Rather, a particular market will display degrees on competitiveness on a continuum between the two extremes.
Only some ecosystem goods and services are amenable to provision in relatively competitive markets. In other cases, as described in more detail in the next subsection, some government intervention is needed to move provision toward an efficient outcome.
Characteristics of Ecosystem Goods and Services and Economic Efficiency The degree to which a good or service is rival and exclusive determines the feasibility and
appropriateness of different provision and financing mechanisms, as well as the level to which government must be involved to produce an economically efficient allocation (Randall, 1987, chapter 9). A rival good is one for which consumption by one person reduces the amount of good or service available to others, as is the case with apples and haircuts. A nonrival good or service is one for which consumption by one person does not reduce the amount available to anyone else, as with radio signals and national defense. For a nonrival good or service, “consumption” must be thought of in a broader, passive sense. For example, when a nature lover looks out over a scenic view, he or she “consumes” enjoyment of the view without using up any of the view—thus, a scenic view is a nonrival good.
An exclusive good or service is one from which consumers can be excluded unless they meet the conditions prescribed by the party controlling the good or service. Goods offered for sale are exclusive goods. Conversely, a nonexclusive good or service is one from which consumers cannot be excluded, even if they do not pay for it. A good or service may be nonexclusive because of its physical characteristics. For example, because tuna range over the vast expanse of international ocean waters, it is not feasible for a private company or a government to establish exclusive rights over them; thus, tuna are a nonexclusive good. In a large national forest with many access points, scenic views may also be nonexclusive goods.
Crossing these bipolar dimensions, rivalry and exclusiveness, yields four categories of goods and services: rival, exclusive; rival, nonexclusive; nonrival, exclusive; and nonrival, nonexclusive. In the four cells of Table 5 we list some ecosystem goods and services that typically represent the four categories.
Free market provision and financing of goods and services (i.e., with only minimal government involvement, for things like enforcement of property rights) is best suited to rival, exclusive goods and services. As shown in Table 5, most tangible ecosystem goods, but few services, potentially can be traded efficiently in unfettered private markets. Private markets, in fact, already exist for many of the rival, exclusive goods shown in Table 5 (e.g., fossil fuels, timber and big game hunting opportunities).
Economic efficiency in a market for ecosystem goods or services is most likely to be achieved when the good or service is rival and exclusive. Thus, the rival and exclusive cell in Table 5 suggests types of ecosystem goods and services that are most likely amenable to economically efficient provision and financing by private individual buyer, individual seller markets. If exclusion is not feasible, economically efficient free market provision and financing of goods and services are also not feasible. Indeed, private markets of any type typically fail to develop for nonexclusive goods, leading to under-provision of the goods or services. For example, a landowner with the capability to protect the quality of the streamflow leaving his property will have little incentive to do so if his efforts are enjoyed for free by those
5/31/06 Ecosystem Goods and Services 22
downstream—a situation known as the “free-rider” problem. Therefore, goods and services that are nonexclusive are typically regulated or provided by the government and financed with tax revenues.
Some ecosystem services are nonexclusive because of their physical nature and distribution, such as tuna fish in the open ocean and temperature maintenance via carbon storage. Correcting this situation—making them exclusive—can be very expensive. Such costs are a form of transaction cost. For example, the transactions costs of attempting to privatize tuna in the open ocean and assigning nonattenuated property rights to one or more owners would be prohibitive because of the physical difficulties of containing tuna to a specific place in the ocean. In the case of temperature maintenance via carbon storage, there are literally billions of individual beneficiaries. The transaction costs to an individual provider of these ecosystem services involved in securing payment from all beneficiaries (or even a relatively small portion of these beneficiaries) would be prohibitive. Some ecosystem goods listed in Table 1, such as recreational opportunities provided by public parks on a no-fee basis, may also be nonexclusive because of political and cultural reasons, (Randall, 1987, Chapter 9). In these cases, privatizing ecosystem goods may not be politically or culturally acceptable.
In the case of nonrival, exclusive goods and services (Table 5), because exclusion can be established, private market provision is possible. For example, a private land owner could fence off her land and charge people who enter through a gate to view and photograph natural plants on the land. As long as congestion is not a problem and people do not destroy the plants they are viewing and photographing, use and “consumption” will be nonrival. From an economic efficiency standpoint, however, the private owner is likely to charge “too high” an entrance fee and turn away “too many” people; that is, any entrance fee above the generally low marginal cost of allowing one more person into the area to view plants would be economically inefficient.
Many nonrival, exclusive recreational opportunities are provided by the government. For example, Rocky Mountain National Park in Colorado, although a large public park, has few automobile access points. The Park Service controls access at these entry points and charges an entrance fee. Thus, the Park Service has made recreational opportunities within the park exclusive. Once inside the park, recreational opportunities are nonrival if congestion is not a problem. However, when congestion sets in (which it very much does on nice, summer days), recreation opportunities (such as hiking) can become rival (e.g., with people literally bumping into each other on the hiking trials).18
Although some ecosystem services tend to be confined within a given property and thus exclusive (e.g., maintenance of soil fertility), the effects of most are nonexclusive (Table 5). Nonexclusive ecosystem services may be rival, as when their effects are realized in the quality of rival goods; for example, waste assimilation in a river is realized in the quality of the streamflow diverted for domestic use. However, many nonexclusive ecosystem services are nonrival, such as maintenance of precipitation and temperature patterns.
In summary, economically efficient free market provision and financing is limited to rival, exclusive ecosystem goods and services. With respect to the other three categories of ecosystem goods and services listed in Table 5, self-organized markets for these goods and services could 18 The economically efficient price depends on the number of visitors. If the area were truly nonrival, the fee would be very low, but if it were rival, as on a nice summer day, the efficient fee would be high enough to avoid severe reduction of marginal benefits.
5/31/06 Ecosystem Goods and Services 23
develop, but the resulting prices and quantity of provision would be economically inefficient. Because of problems related to nonrivalry or nonexclusiveness, the ecosystem goods and services listed in the other three cells in Table 5 are likely subject to market failure defined as the failure of private individual buyer, individual seller markets to achieve economic efficiency or Pareto Efficiency in the provision and financing of goods and services (Randall, 1983). Hence, the government is more likely to be involved in providing these latter three categories of goods and services and financing them through tax revenues or user fees (when it is feasible to exclude those who don’t pay the fee), or in regulating them via cap and trade or other mechanisms.
Mechanisms of Exchange Because ecosystem goods and services fall into all four cells in Table 5, they are subject to
many different mechanisms of exchange. Ecosystem goods such as trees and forage, being excludable physical inputs in common production processes, are commonly purchased by those intending to use them. Ecosystem services, such as natural flood regulation and pollination, being generally nonexcludable flows, are not directly transferable. Because of this quality, ecosystem service flows are typically protected by controlling or at least influencing the practices that are allowed on the land where the services are provided.
The most obvious way to constrain the practices permitted on a plot of land is to own the land. When conservation-minded entities—either public (e.g., Forest Service, county open space programs) or private (e.g., TNC, progressive individual landowners)—own land, they may protect the ecological health of that land and thereby enable the provision of ecosystem services. Nowadays additions to the set of protected land typically occur either by market purchase or by set-asides of what is already public land. Purchases on the open market are commonplace. Alternatively, existing public land may be moved to a more restrictive category of use such as a wilderness designation.
Short of owning the land, ecological functions may be protected by constraining the practices that are allowed on the land. Possible methods include conservation easements, special use designation (e.g., designation of a Wild and Scenic River along a riparian area that includes private land), zoning, subsidies to land owners to follow certain practices, and enforcement of environmental protection legislation such as the Clean Water Act and the Endangered Species Act.19
Mechanisms for exchanging ecosystem goods and services fall into the four general categories shown in Table 6. Private individuals (including NGOs, firms, and other groups) can be either buyers or sellers of ecosystem goods and services. Government entities (including federal, state and local governments) can also either be buyers or sellers of ecosystem goods and services. Thus, the four general categories for exchanging ecosystem goods and services are: 1) individual buyer, individual seller; 2) individual buyer, government seller; 3) government buyer, individual seller, and 4) government buyer, government seller. These four categories are discussed in more detail below.
19 In contrast with land and water resources, air quality protection is not so much a matter of land ownership or management. Nevertheless, air quality protection legislation such as the Clear Air Act has had a significant impact on point and some non-point sources of air pollution. A prime example is the cap-and-trade program for controlling SO2 emissions.
5/31/06 Ecosystem Goods and Services 24
Individual buyer, government seller. Ecosystem goods and services are commonly financed via individual tax payments to government entities that manage public land to provide the goods and services. Non-excludable ecosystem goods and services tend to be provided by government entities to users without direct charge. For example, the water quality protection afforded by management of land as a national park or national forest is available to downstream water users without charge (except for the tax payment that enables the land management in the first place).
In the case of excludable ecosystem goods and services, fees may be charged for use or access rights to an ecosystem good or service. For example, in the U.S., federal, state and local governments charge fees for many types of outdoor recreational opportunities (e.g., entrance fees to public parks). In addition, states charge for fishing and hunting licenses. In most cases, the money generated from outdoor recreation fees goes back to protecting the ecosystems and natural resources that support recreational opportunities. The federal government in the U.S. also charges fees for stumpage, grazing rights, and mineral and energy extraction on public lands. Government fees are typically determined administratively, and may reflect a mixture of efficiency and equity considerations. As mentioned above, at nonrival recreation sites, the marginal cost is likely to be very low.
Another individual buyer, government seller arrangement is the so-called price-type approach to pollution control, whereby a governmental entity imposes a tax or fee per unit of emission. Unlike a quantity-type approach, such as the cap-and-trade approach described below, a price-type program does not announce a precise limit on the amount of pollution, either per emitter or in total; rather, the program imposes a price that may be amended periodically so that the desired level of pollution control is approximated. Such fees leave decisions about the level of emissions and ways to limit emissions up to the emitters, thereby tending to contain the overall cost of reducing emissions. In Columbia, for example, a 1993 law directs regional environmental regulatory authorities to collect fees from wastewater emitters per unit of biological oxygen demand and of total suspended solids (Blackman, 2006). Such a program has also been proposed for worldwide control of greenhouse gases, where the fees would be “harmonized” across countries in light of their different levels of economic development in a manner similar to that of tariff agreements in the international trade arena (Nordhaus, 2006). The success of such programs of course depends on the government’s ability to monitor emissions and the wherewithal to collect the fees.
Government buyer, individual seller. Payments from government entities to individuals for the protection of ecosystem services are generally known as subsidies or incentive programs. The payments, often in the form of tax incentives or cost sharing, induce landowners such as farmers and non-industrial forest owners to alter their behavior in a way that benefits others (Brown et al., 1993). Such arrangements are voluntary and naturally tend to be popular with recipients, and can increase economic efficiency as long as the marginal benefits exceed the marginal costs.
In the U.S., many incentive programs are administered by agencies of the U.S. Department of Agriculture, including the Natural Resource Conservation Service (NRCS) and the Forest Service.20 Perhaps the best knows of these programs is the Conservation Reserve Program
20 Current information is available at http://www.nrcs.usda.gov/PROGRAMS/ and http://www.fs.fed.us/spf/, respectively.
5/31/06 Ecosystem Goods and Services 25
(CRP), under which selected landowners are paid to remove land from active agricultural production (Cain and Lovejoy, 2004). Originally focused on erosion control, the program has been expanded to include wildlife habitat maintenance and other objectives. Other USDA programs include the Wetlands Reserve Program (WRP), the Grasslands Reserve Program (GRP), the Environmental Quality Incentives Program (EQIP), the Conservation Security Program (CSP), and the Forestland Enhancement Program (FEP). The WRP and GRP provide funds to assist landowners with wetland and grassland protection practices, respectively. EQIP provides funds to assist farmers and ranchers with environmental problems and regulations related to soil, water, air and other natural resources on their land. National priorities for the EQIP program currently include reduction of non-point source pollution to help meet Total Maximum Daily Loads (TMDLs), reduction of emissions that contribute to National Ambient Air Quality Standards violations, reduction of soil erosion and sedimentation, and habitat conservation for at-risk species.
The CSP is a relatively new program that provides additional incentive payments to farmers and ranchers who are “meeting the highest standards of conservation and environmental management on their operations”. The CSP is different from other USDA conservation programs in that other programs such as CRP and EQIP are designed to help farmers and ranchers address existing environmental problems and regulations. The CSP provides “green payment” type rewards to farmers and ranchers who are proactively engaged in natural resource and environmental conservation and stewardship practices that go above and beyond addressing current environmental problems and regulations (Cain and Lovejoy, 2004). Finally, the FEP provides cost sharing funds to non-industrial forest owners who develop and follow a plan for sustainable management of their forestland.
Similar programs exist in other countries, such as Costa Rica and Mexico, which authorize payments to individual forest landowners to follow certain land conservation practices (Daily and Ellison, 2002). With all of these incentive programs, the trick is to administer them well, focusing available funds on the most damaging practices in the most sensitive locations, being careful that payments are all in locations where marginal benefits exceed marginal costs. One approach, used with the CRP program, is to accept bids per acre from landowners for placing their land in the program, rank the lands for desirability of a management change, and then accept the most efficient deals.21
Government buyer, government seller. Governments may also pay (or subsidize) other governments to help provide and protect ecosystem goods and services. For example, the U.S. Environmental Protection Agency provides funds to local governments to assist with development of wastewater treatment plants that help to protect surface and ground water quality. The U.S. Agency for International Development (AID) provides funds to foreign government entities to foster resource conservation and environmental protection in their countries.
In the U.S., situations where local or state governments pay the federal government to provide and protect ecosystem goods and services are uncommon, although such payments may 21 The CRP is a market-like mechanism, although it is an uncompetitive market since there is only one buyer (the government agency). There are always many more farmers who would like to place land in the CRP than are accepted by the agency, primarily because of limited funds. Because of the difficulty of estimating the social benefits of the program, to say nothing about the difficulties of obtaining the efficient level of funding, it is unlikely that the CRP is funded at an economically efficient level.
5/31/06 Ecosystem Goods and Services 26
make sense. For example, a city may rely for its water supply on water flowing from a national forest. The national forest may not have sufficient funding to remove forest fuels to the extent necessary to significantly lower the risk of serious wildfire. Such a wildfire could result in a decrease in water quality, which in turn could impose costs on the city (the costs imposed on the Denver Water Board by sediment following the Hayman fire are an example, Graham, 2003). It may make sense in such a case for the city to contribute towards the costs of fuel treatment. For non-excludable ecosystem services, government-to-government payments are feasible because governments are the proper entities to provide such goods.
Individual buyer, individual seller. There is much current interest in providing and financing ecosystem services through new private markets characterized by individual buyer, individual seller transactions.22 Mechanisms where individuals pay individuals include both familiar markets for rival, exclusive ecosystem goods such as timber and mineral resources, nontraditional arrangements to protect ecosystem services, and cap and trade markets where permits or credits are traded.
Self-organized private markets and transactions with minimal government involvement (except to establish and enforce property rights and agreements) typically organize production and distribution of rival, exclusive goods. As mentioned above, such markets have existed for many years for many of the ecosystem goods listed in Table 1, ranging from global markets for crude oil, timber, precious gems and wildlife-related products (e.g., furs, ivory) to local markets for water and some forms of commonly-available recreation. Some of these markets are very competitive, but others lack a sufficient numbers of buyers or sellers to be considered competitive.23
Established markets with self-organized private transactions exist for many recreational opportunities, including those for hunting, fishing,24 and whitewater rafting.25 To take hunting as
22 In a recent popular book on the use of market mechanisms to protect and pay for ecosystem services, Daily and Ellison (2004) describe activities of the “Katoomba Group,” a dedicated, informal group of people from academia, government agencies and private business who share a vision of a world where ecosystem services are bought or sold in economic markets akin to the New York Stock Exchange. The “Katoomba Group” has helped to launch a web site with the purpose of facilitating ecosystem service markets by providing a clearinghouse for information on prices, regulation, science, and other issues related to ecosystem markets (www.ecosystemmarketplace.com). Other authors are more cautious on the prospect of markets for ecosystem services, considering economic efficiency, sustainability and equity (fairness) issues (Jenkins et al., 2004; Landell-Mills, 2002; Salzman, 2005). 23 The global market for crude oil is considered an uncompetitive market with relatively few sellers and many buyers. Some of the relatively few sellers in the global market for crude oil have formed a powerful cartel (OPEC) that can control the world supply and price of crude oil. The uncompetitive nature of the global crude oil market leads to economic inefficiency in the provision and price of crude oil (e.g., supply is lower and price is higher than they would be in a competitive market). Global markets for timber, precious gems and wildlife-related products are competitive markets with many sellers and buyers; thus, no single block of buyers and sellers currently controls world supply and price of these goods. Thus, provision and price of these ecosystem goods will be more economically efficient. 24 With respect to saltwater fishing, an individual or group of individuals may charter a boat and crew to go fishing in a saltwater bay or the ocean. There are typically many saltwater anglers (buyers) and charter boats and crews (sellers), so the price of a charter is fairly competitive. With respect to freshwater fishing, an angler may pay the owner of a private pond for the right to fish in the pond. Payment to the pond owner is usually a price per fish or per pound of fish caught. Because there are typically many freshwater anglers (buyers) and pond owners (sellers), the price per fish or pound per fish caught is fairly competitive. 25 Commercial outfitters provide white water rafting opportunities to clients who pay a fee per head to participate in a guided white water rafting trip down a river. In some parts of the U.S., there are only a few commercial outfitters
5/31/06 Ecosystem Goods and Services 27
an example, private markets have existed for hunting opportunities for many years. The typical hunting market arrangement is one where an individual or group of individuals leases hunting rights on private land for a negotiated payment to the landowner. In some regions of the U.S. there are many hunters (buyers) and many landowners (sellers) willing to lease hunting rights; thus, prices of private land hunting leases are fairly competitive. The rival, exclusive nature of markets for hunting, fishing, and rafting opportunities means that provision and price of these opportunities may be economically efficient, although lack of supply sometimes limits the number of suppliers so that prices are artificially high.
In recent years, markets with self-organized private transactions have developed for scenic landscapes. For example, private land trusts have been established that purchase conservation easements from private landowners to protect scenic landscapes from development. The price of a conservation easement is negotiated between the trust and the landowner. In a particular area, there are likely to be only one or few land trusts (buyers) who have the legal authority and funds to purchase conservation easements, but many landowners (sellers) who would like to sell conservation easements. Transaction costs are substantial in setting up a trust and successfully negotiating a purchase. Because of the limited number of buyers, the market for such conservation easements is likely to be uncompetitive and economically inefficient.
Another type of individual-to-individual mechanism is that of private organizations granting funds to private individuals or groups to provide and finance ecosystem goods and services. For example, Trout Unlimited provides grants to landowners to help improve trout stream habitat, and the World Wildlife Fund provides grants to landowners to protect many different types of wildlife and wildlife habitat. Other private conservation groups provide grants to purchase land to protect unique ecosystems and biodiversity (e.g., tropical rainforests). The amount of a private grant to protect ecosystem and provide goods and services may involve some negotiation between the donor organization and recipient. Grant amounts, however, are constrained and heavily determined by the amount of money a private organization has to give. Most private organizations depend on donations from private individuals for their funding. Economic theory suggests that donation mechanisms will not provide an economically efficient level of funding for ecosystem goods and services because of free-riding. Many people are unwilling to contribute towards provision of public goods, especially if they know that others will also avoid paying—hence the role for government in enforcing payment and then providing public goods.
Self-organized private transactions for water are not common, but are occurring. Perhaps the most famous case is that of Perrier-Vittel, the bottled water company, which spent several million dollars to alter the farming practices in the watershed affecting the quality of the springs were the firm acquires its water (Daily and Ellison, 2002). In the western U.S., 150 market purchases of water for environmental purposes (generally for maintaining instream flow) were reported during the period 1990-2003 (Brown, In press). Most of these purchases were by government agencies, but 14 were by private environmental organizations, and in 13 of those cases the sellers were farmers or other private parties.
(sellers) and many people who would like to go rafting (buyers). In these cases, the market is likely to lack competition with resulting economic inefficiency (e.g., rafting prices will be too high and too few opportunities will be offered). Rationing of rafting opportunities by government agencies that control river access (e.g., National Park Service, U.S. Forest Service) may also limit rafting opportunities resulting in high prices. In other parts of the U.S., there may be many commercial outfitters (sellers) and many potential clients (buyers). In these cases, the market is likely to be fairly competitive and economically efficient.
5/31/06 Ecosystem Goods and Services 28
Another category of individual-to-individual transactions involves price premiums for commercial goods paid by consumers who want to encourage or reward environment-friendly production methods. These premiums are essentially donations. For example, it is now common for power companies to offer electricity customers the opportunity to pay a premium in support of wind power. The companies use the donations to cover the production cost differential between traditional thermal and wind power. The wind-generated power is fed into the electricity grid, so that all customers receive a mixture irrespective of whether they paid the price premium. Price premiums often are associated with certification programs warranting that the goods were indeed produced using such methods. For example, the Forest Stewardship Council certifies timber operations that follow approved production and harvesting practices (Daily and Ellison, 2002), and coffee grown organically, certified as such, receives a price premium. In the forestry case, the end product is essentially the same regardless of the production methods, so that the premium is totally a donation, whereas in the coffee case the consumer receives not only the satisfaction of having encouraged eco-friendly production but also may directly benefit from the improved product.
Cap and trade programs. A widely-used approach to control negative externalities is that of cap-and-trade. These programs utilize permits to emit a regulated pollutant or credits that offset (i.e., mitigate or compensate for) the emission. Cap-and-trade is listed with individual-to-individual trades in Table 6 because permits or credits are indeed traded among individuals, but unlike the other types of individual-to-individual trades, cap-and-trade programs require substantial government involvement.
With a cap-and-trade program, a government entity (1) imposes a limit or cap on some emission or activity, (2) establishes permits or credits for the specified amount of emission or activity and allows individuals or firms to trade permits or credits under certain institutional rules, and (3) monitors the emissions or activity in question and assesses a penalty if the cap is exceeded. The ecosystem protection with such a program occurs with setting and enforcing the cap (thus cap-and-trade is known as a quantity-type approach). The trade part of cap-and-trade then allows firms in aggregate to most cost-effectively reach the cap. With permit schemes, firms that can lower their emissions at low cost do so and sell their permits to firms for which costs of cutting emissions are higher than the cost of purchasing permits. With credit schemes, firms that desire to exceed the cap must purchase credits that offset the increase in emissions.
As with the price-type approach mentioned above, cap-and-trade relies critically on the ability to accurately monitor emissions or impacts. Monitoring may focus on outputs (e.g., SO2 leaving power plant smoke stacks), inputs (e.g., quantity purchased of a certain pesticide), or change in environmental conditions (e.g., acres of wetland of a certain quality). Many factors affect the feasibility of cap-and-trade and the choice of monitoring strategy, including the availability of measurement technology and the number and locations of emissions or changes (Choi, 2006). Cap-and-trade also relies on the willingness to assess penalties for noncompliance.
Cap-and-trade is being successfully used in several important programs, including the U.S. effort to control acid rain by limiting SO2 emissions (Stavins, 1998, 2005). Fossil fuel electric power plants are issued permits by the U.S. EPA for a certain amount of SO2 emissions. The initial cap was set in 1995 for the eastern U.S.; in 2000 the cap was lowered and expanded to the rest of the U.S. The permits may be traded among the utilities, either in private transactions or during a government-sponsored auction. Compliance is encouraged via a penalty per ton of emissions that exceed the permitted level.
5/31/06 Ecosystem Goods and Services 29
One of the most well established cap-and-trade credit markets in the U.S. involves wetland mitigation banks. Under section 404 of the Clean Water Act, conversion of wetlands to non-wetlands (e.g., draining wetlands for development) is capped by the policy of “no net loss”. The no-net-loss policy for wetlands stipulates that if development of a property involves the loss of wetlands, the developer must mitigate the loss by providing new wetlands or enhancing an existing wetland. The new wetlands do not have to be on the same property. The task of finding a new wetland is facilitated by wetlands banks, which are large constructed wetlands created for the purpose of providing future offsets for developers.26 Wetland banks are available in all states of the U.S. (Randall and Taylor, 2000). Credits in a wetlands bank are created when a person or business creates new wetlands and sells the credits to the bank. Interaction between buyers and sellers through the wetlands bank generates a market price for wetlands credits. Although there may be many buyers (developers) for wetland credits, typically there are few sellers (suppliers of new wetlands), so markets for wetlands credits tend to be less than competitive.
Cap-and-trade markets also include the emerging international market for carbon credits initiated by the 1997 Kyoto Protocol. The Kyoto Protocol created scarcity for carbon credits when signatory countries agreed to reduce their emissions. In a country with a binding carbon cap, if a new business activity generates carbon emissions that would exceed the cap, these new emissions must be balanced by reducing carbon emissions somewhere else or purchasing carbon credits. Carbon credits may be purchased, for example, from forest landowners who agree to keep their land in vegetation that absorbs CO2. Because rising atmospheric carbon is a global problem, the forest owners may conceivable even be in another country. Specific rules, called the Marrakesh Accords, were agreed upon among Kyoto signatories for operation of carbon credit markets (Godal and Klaassen, 2006).
Another type of cap-and-trade market is that for transferable development rights (TDR). In the U.S., TDR programs are typically implemented at the county level, where the county government places a cap on development in the county through land use planning and regulations. In one approach, a development working in a designated high-density area would need to purchase development rights from a low-density development area, such as an area of farms and open-space that provide ecosystem goods and services. The purchase of development rights from the low-density area keeps that area in low-density development. The price of development rights is determined by interaction between buyers and sellers with government oversight. Of course, as with other markets, for a TDR market to approach the level of economic efficiency possible with purely competitive market, there must be many buyers (developers) and sellers (land owners willing to give up development rights on their land for a price).
Sustainability of markets for ecosystem goods and services. Markets where private individuals buy and sell ecosystem goods or credits for ecosystem services fall into the individual-buyer, individual-seller cell in Table 6. Because of market failure problems, especially nonexclusiveness and nonrivalness, provision and financing of many ecosystem goods and services involve government programs. These programs may involve incentives (subsidies) to private landowners, fees, taxes on emissions, or cap-and-trade mechanisms. In theory, these mechanisms could achieve economic efficiency if subsidies, taxes, fees, and caps are set at 26 A no-net-loss program could also operate without a bank or market for credits. Absent those aids, the developer would have to mitigate the wetland loss by directly creating a wetland (and perhaps buying the land on which the wetland would sit) or paying another landowner to so. The purpose of the bank is to lower the cost of complying with the no-net-loss policy by lowering the cost of finding a viable wetland credit possibility.
5/31/06 Ecosystem Goods and Services 30
economically efficient levels. However, the problem of “government failure” may be encountered which refers to the inability of government mechanisms to achieve economic efficiency because of lack of adequate information, calculation errors, implementation problems or “rent-seeking” on the part of public officials (Randall, 1983).
Any of the provision and payment mechanisms for ecosystem goods and services shown in Table 6 that do not achieve economic efficiency may not be sustainable into the future. In the case of individual-buyer, individual-seller markets, the failure to achieve economic efficiency may result in both buyers and sellers dropping out of the market to the point where the market is no longer sustainable. In the case of government-buyer, individual-seller mechanisms, failure to achieve economic efficiency may result in individual sellers dropping out of the “market” (e.g., refusing to participate in the CRP). In addition, failure to achieve economic efficiency may result in less public support for the mechanism (e.g., less political support and funding for the CRP). In the case of individual-buyer, government-seller mechanisms, failure to achieve economic efficiency may also result in buyers dropping out of the “market” (e.g., reducing participation in public land recreation where fees are charged). Less public support for the mechanism may also result (e.g., political opposition to recreation fee programs). Failure of government-buyer, government-seller mechanism to achieve economic efficiency may results in governments dropping out of the program and less public support for the program (e.g., less political support and funding for U.S. conservation and environmental assistance to foreign countries).
In addition to economic efficiency concerns, people may also have equity or fairness concerns with respect to the ecosystem good and service provision and payment mechanism listed in Table 6. From a moral or ethical standpoint, all of the mechanisms listed in Table 6 may be subject to the moral or ethical criticism that the mechanism favors some people at the expense of others. For example, concerns have been expressed that individual-buyer, individual-seller markets for ecosystem goods and services may favor rich people in developed countries at the expense of poor people in developing countries (Landell-Mills, 2002). Government-buyer, individual-seller mechanisms such as the CRP are sometimes accused of favoring larger, higher income farmers and ranchers at the expense of smaller, lower income farmers and ranchers. Individual-buyer, government-seller mechanisms such as government fee timber harvesting, extraction and grazing is sometimes accused of favoring industrial uses of public land at the expense of other use such as recreation. Government-buyer, government-seller programs such as water quality grants to local governments may be accused of favoring some states and municipalities over others (e.g., “pork barrel politics”). Provision and payment mechanisms which are viewed as being unfair or unjust (either by perception or reality) may also not be sustainable into the future because of eventual reductions in private and public support.
Likelihood of Market Exchange Much of the current interest in developing markets for ecosystem goods and services is
driven by the desire to move provision and financing of ecosystem goods and services away from mechanisms with heavy government involvement discussed above to those involving less government involvement and more private market exchange (e.g., individual to individual). We summarize the potential for market exchange of ecosystem goods and services by considering a selection of these goods and services in light of some of the major conditions for market exchange (Table 7). Ecosystem goods—including, for example, oil, timber, water for diversion,
5/31/06 Ecosystem Goods and Services 31
and developed recreation opportunities—tend to be measurable, excludable, and rival. Further, confidence is high that exchange contracts will be enforced and, with the exception of water for diversion (which requires complicated monitoring), their exchange tends to incur relatively low transaction costs. Thus, as indicated in Table 7 the likelihood of market exchange with minimal government involvement for many ecosystem goods is relatively good. Where these goods present problems is with externalities. For example, use of oil leads to air pollution and global warming, harvest of timber alters habitats and lowers scenic beauty, at least in the short-run, and downstream water users bear the cost of upstream diversions.
Dispersed recreation opportunities on public land is the most unique ecosystem good, in that such opportunities are typically not excludable without substantial effort. Attempts to impose payment of people taking advantage of dispersed recreation would incur substantial transaction costs in the form of administering the exclusion policy. Thus, as indicated in Table 7, the likelihood of market exchange with minimal government involvement is fair to poor.
Ecosystem services, assuming they are enjoyed beyond a specific property where they originate, show a decidedly different pattern from ecosystem goods (Table 7). Negative externalities, of course, are not present for these services, as the services are all decidedly positive. However, on all other criteria the services do not easily lend themselves to market exchange. They are nonexcludable and nonrival, and thus require some government involvement if markets are to be established. Further, the task faced by the government agencies would be formidable and expensive due to the difficulty of defining and measuring (and monitoring) the services or the compliance with any scheme established for protection and marketing.
Consider, for example, water purification and flood mitigation in the context of wetland mitigation. Wetland protection is one avenue for preserving services such as water purification and flood mitigation. Lack of excludability from the benefits of wetlands led to government involvement in wetland protection. Federal, state, and local governments have responded with both subsidies (e.g., the federal Wetlands Reserve Program) and regulation (e.g., the no-net-loss policy of the federal Clean Water Act). Regarding the no-net-loss policy, difficulties in defining wetlands have led to failures to comply with the policy and to expensive court cases over the extent of federal control (Adler, 1999). Difficulties in measuring and monitoring the functions provided by a wetland have led to uncertainty about whether constructed wetlands are sufficiently mitigating natural wetland loss (Randall and Taylor, 2000).27 The complex administrative tasks of inspecting each wetland proposed for conversion and monitoring compliance with the policy, plus the burdens imposed on developers who must understand the regulations and pursue a cost-effective path to compliance, result in high transaction costs. The WRP incentive program is also not without its difficulties, as it also faces the problems of definition and measurement, and the expenses of monitoring.
We mention some of the difficulties with market exchange of ecosystem services not to discourage government involvement in helping to establish such market or market-like exchange, but rather to highlight the need for adequately funding whatever program is instituted, and thus also to note the importance of verifying beforehand that the benefits of a government program are worth the costs. Ecosystem goods and services with fair to poor potential for market
27 The approach used to compensate for the difference between the lost wetland and substitute wetland has been to use roughly estimated mitigation ratios specifying how many acres of constructed wetlands are needed per acre of natural wetland loss.
5/31/06 Ecosystem Goods and Services 32
exchange indicated in Table 7 will require more intensive government involvement and expense to establish and sustain market or market-like exchange mechanisms.
Conclusions This paper has attempted to define ecosystem goods and services, describe why they are of
economic value to people, briefly explain how to quantify that economic value, and examine the prospects for provision and marketing of ecosystem goods and services. We stress that ecosystem goods and services are those that arise “naturally” from natural capital, with little human input. Given the growing scarcity and recognition of the importance of ecosystem services to maintain our quality of life, ecosystem system goods and services will likely rise in value over time. The only exception might be if humans find a way to reproduce the services provided by ecosystems at costs lower than the opportunity cost of protecting the natural capital upon which ecosystem services depend. Ecosystem services improve human well being by either directly affecting our utility or indirectly as inputs to producing other goods or services of value to humans. The direct effects on human well being can be monetized using stated preference techniques such as contingent valuation and conjoint or replacement costs (see Table 3). The indirect effects on human well being can be quantified by production function or replacement cost methods.
Generally the rising scarcity and value for ecosystem services will make it profitable for individual owners of natural capital to protect that capital so as to market ecosystem services. This is particularly true for ecosystem goods and services from which the owner can exclude non-payers and therefore fully capture the revenues associated with supplying ecosystem services. However, many ecosystem services are non-excludable and non-rival. For these ecosystem services (like biodiversity) it will be difficult for private competitive markets to emerge that will efficiently supply them. With non-excludable and non-rival ecosystem services, if benefit-cost analysis suggests the benefits of protecting the natural capital outweigh the costs, public financing through taxes may be necessary to ensure an optimal protection of the natural capital upon which an efficient supply of that ecosystem service can be provided. The paper surveys several such public markets in which the government pays individual landowners or other governments for ecosystem services.
Today we stand at the dawn of a new era in ecological economics. There is growing appreciation for the role ecosystem services play in maintaining the functioning of the planet upon which all human life depends. While human prowess will likely provide partial substitutes for some ecosystem goods and services that are inputs into the production function, the likelihood of providing substitutes for those ecosystem services that enter the utility function directly is much less. The main question before society and policy makers today is whether the creativity and cleverness that threatens the natural capital upon which ecosystem goods and services depend can be harnessed to design institutions and incentive mechanisms to maintain natural capital and ecosystem goods and services into the future. The growing awareness of the importance of ecosystem goods and services not only among scientists but also among policy makers offers hope that effective policies will be forthcoming quickly enough so as to not render this question moot.
5/31/06 Ecosystem Goods and Services 33
References Adler, J. H. 1999. Wetlands, waterfowl, and the menace of Mr. Wilson: Commerce clause
jurisprudence and the limits of federal wetland regulation. Environmental Law 29(1): 41-54.
Alcamo, J., Ash, N. J., Butler, C. D., Callicott, J. B., Capistrano, D., Carpenter, S. R., et al. 2003. Ecosystems and human well-being: a framework for assessment. Washington, D. C.: Island Press.
Blackman, A. 2006. How well has Columbia's wastewater discharge fee program worked and why? Resources(161): 16-19.
Boulding, K. E. 1966. The economics of the coming spaceship earth. In H. Jarrett (Ed.), Environmental quality in a growing economy, pp. 3-14. Baltimore, MD: Johns Hopkins University Press.
Boyd, J. W., & Banzhaf, H. S. 2005, Ecosystem services and government: the need for a new way of judging nature's value. Resources, 158, 16-19.
Brown, T. C. 2000. Economic issues for watersheds supplying drinking water. In G. E. Dissmeyer (Ed.), Drinking water from forests and grasslands: A systhesis of the scientific literature, pp. 42-51. Asheville, NC: Southern Research Station, U.S. Forest Service.
Brown, T. C. In press. Trends in water market activity and price in the western U.S. Water Resource Research.
Brown, T. C., & Binkley, D. 1994. Effect of management on water quality in North American forests. General Technical Report RM-248. Fort Collins, CO: Rocky Mountain Forest and Range Experiment Station.
Brown, T. C., Brown, D., & Binkely, D. 1993. Laws and programs for controlling nonpoint source pollution in forest areas. Water Resources Bulletin 29(1): 1-13.
Brown, T. C., Hobbins, M. T., & Ramirez, J. A. 2005. The source of water supply in the United States. Discussion Paper DP-05-1, RMRS-4851. Fort Collins, CO: Rocky Mountain Research Station (http://www.fs.fed.us/rm/value/docs/source_watersupply_unitedstates.pdf).
Cain, C., & Lovejoy, S. 2004. History and outlook for farm bill conservation programs. Choices 19(4): 37-42.
Champ, P. A., Boyle, K. J., & Brown, T. C. (Eds.). 2003. A primer on nonmarket valuation. Boston, MA: Kluwer Academic Publishers.
Choi, I. 2006. Global climate change and the use of economic approaches: the ideal design features of domestic greenhouse gas emissions trading with an analysis of the European Union's CO2 emissions trading directive and the climate stewardship act. Natural Resources Journal 45(4): 865-952.
Coase, R. H. 1960. The problem of social cost. Journal of Law and Economics 3: 1-44.
Costanza, R., d'Arge, R., de Groot, R., Farber, S., Grasso, M., Hannon, B., et al. 1997. The value of the world's ecosystem services and natural capital. Nature 387: 253-260.

5/31/06 Ecosystem Goods and Services 34
Daily, G. C. 1997. Introduction: what are ecosystem services? In G. C. Daily (Ed.), Natures services: societal dependence on natural ecosystems, pp. 1-10. Washington, D.C.: Island Press.
Daily, G. C., & Ellison, K. 2002. The new economy of nature: the quest to make conservation profitable. Washington, D. C.: Island Press.
de Groot, R. S., Wilson, M. A., & Boumans, R. M. J. 2002. A typology for the classification, description and valuation of ecosystem functions, goods and services. Ecological Economics 41(3): 393-408.
England, R. W. 2000. Natural capital and the theory of economic growth. Ecological Economics 34: 425-431.
Freeman, A. M., III. 2003. Economic valuation: what and why. In P. A. Champ & K. J. Boyle & T. C. Brown (Eds.), A Primer on Non-market Valuation, pp. 1-25. Norwell, MA: Kluwer Academic Publishers.
Georgescu-Roegen, N. 1971. The entropy law and the economic process. Cambridge, MA: Harvard University Press.
Godal, O., & Klaassen, G. 2006. Carbon trading across sources and periods constrained by the Marrakesh Accords. Journal of Environmental Economics and Management 51(3): 308-322.
Graham, R. T., editor. 2003. Hayman Fire case study. General Technical Report RMRS-GTR-114. Ogden, UT: Rocky Mountain Research Station, U.S. Forest Service.
Hanak, E. 2005. Stopping the drain: third-party responses to California's water market. Contemporary Economic Policy 23(1): 59-77.
Hanemann, W. M. 1991. Willingness to pay and willingness to accept: how much can they differ? American Economic Review 81(3): 635-647.
Heal, G. M., Barbier, E. B., Boyle, K. J., Covich, A. P., Gloss, S. P., Hershner, C. H., et al. 2005. Valuing ecosystem services: toward better environmental decision-making. Washington, D. C.: National Academy Press.
Herfindahl, O. C., & Kneese, A. V. 1974. Economic theory of natural resources. Columbus, OH: Merrill Publishing.
Howe, C. W., & Goemans, C. 2003. Water transfers and their impacts: lessons from three Colorado water markets. Journal of the American Water Resources Association 39(5): 1055-1065.
Hubacek, K., & van der Bergh, J. C. J. M. 2006. Changing concepts of 'land' in economic theory: from single to multi-disciplinary approaches. Ecological Economics 56: 5-27.
Jenkins, M., Scherr, S. J., & Inbar, M. 2004. Markets for biodiversity services: potential roles and challenges. Environment 46(6): 32-42.
Kneese, A. V., & Bower, B. T. 1979. Environmental quality & residuals management: report of a research program on economic, technological, and institutional aspects. Washington, D. C.: Resources for the Future.
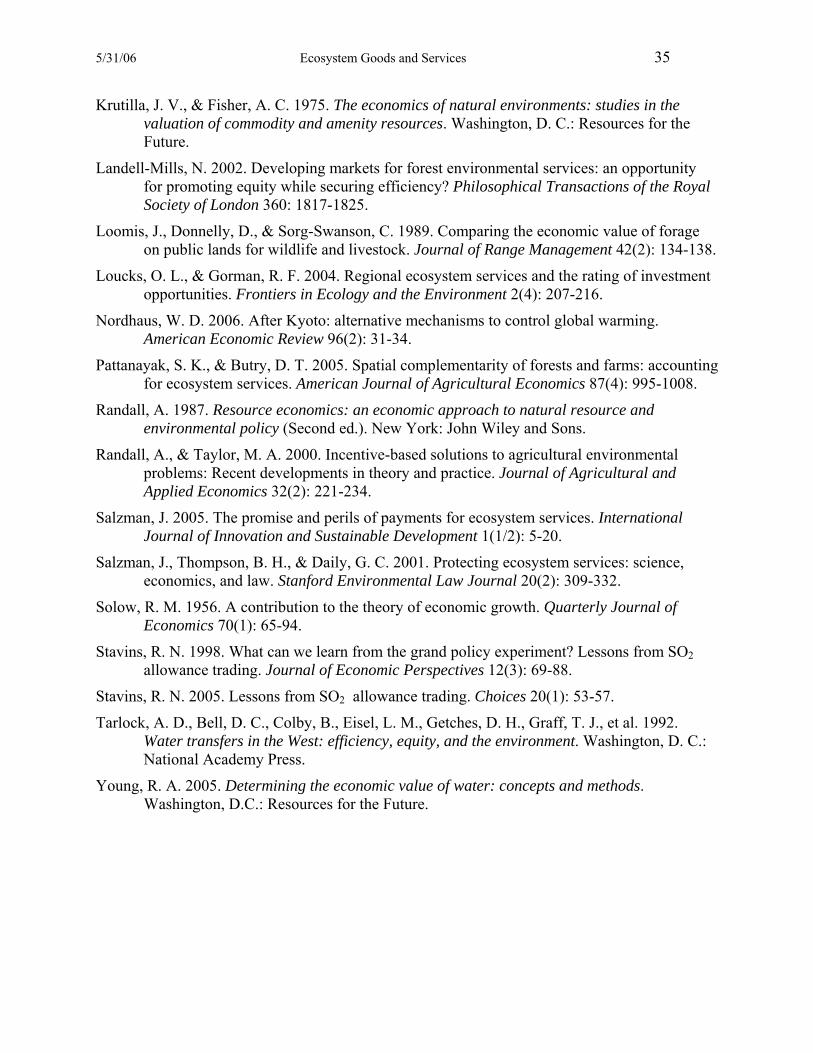
5/31/06 Ecosystem Goods and Services 35
Krutilla, J. V., & Fisher, A. C. 1975. The economics of natural environments: studies in the valuation of commodity and amenity resources. Washington, D. C.: Resources for the Future.
Landell-Mills, N. 2002. Developing markets for forest environmental services: an opportunity for promoting equity while securing efficiency? Philosophical Transactions of the Royal Society of London 360: 1817-1825.
Loomis, J., Donnelly, D., & Sorg-Swanson, C. 1989. Comparing the economic value of forage on public lands for wildlife and livestock. Journal of Range Management 42(2): 134-138.
Loucks, O. L., & Gorman, R. F. 2004. Regional ecosystem services and the rating of investment opportunities. Frontiers in Ecology and the Environment 2(4): 207-216.
Nordhaus, W. D. 2006. After Kyoto: alternative mechanisms to control global warming. American Economic Review 96(2): 31-34.
Pattanayak, S. K., & Butry, D. T. 2005. Spatial complementarity of forests and farms: accounting for ecosystem services. American Journal of Agricultural Economics 87(4): 995-1008.
Randall, A. 1987. Resource economics: an economic approach to natural resource and environmental policy (Second ed.). New York: John Wiley and Sons.
Randall, A., & Taylor, M. A. 2000. Incentive-based solutions to agricultural environmental problems: Recent developments in theory and practice. Journal of Agricultural and Applied Economics 32(2): 221-234.
Salzman, J. 2005. The promise and perils of payments for ecosystem services. International Journal of Innovation and Sustainable Development 1(1/2): 5-20.
Salzman, J., Thompson, B. H., & Daily, G. C. 2001. Protecting ecosystem services: science, economics, and law. Stanford Environmental Law Journal 20(2): 309-332.
Solow, R. M. 1956. A contribution to the theory of economic growth. Quarterly Journal of Economics 70(1): 65-94.
Stavins, R. N. 1998. What can we learn from the grand policy experiment? Lessons from SO2 allowance trading. Journal of Economic Perspectives 12(3): 69-88.
Stavins, R. N. 2005. Lessons from SO2 allowance trading. Choices 20(1): 53-57.
Tarlock, A. D., Bell, D. C., Colby, B., Eisel, L. M., Getches, D. H., Graff, T. J., et al. 1992. Water transfers in the West: efficiency, equity, and the environment. Washington, D. C.: National Academy Press.
Young, R. A. 2005. Determining the economic value of water: concepts and methods. Washington, D.C.: Resources for the Future.
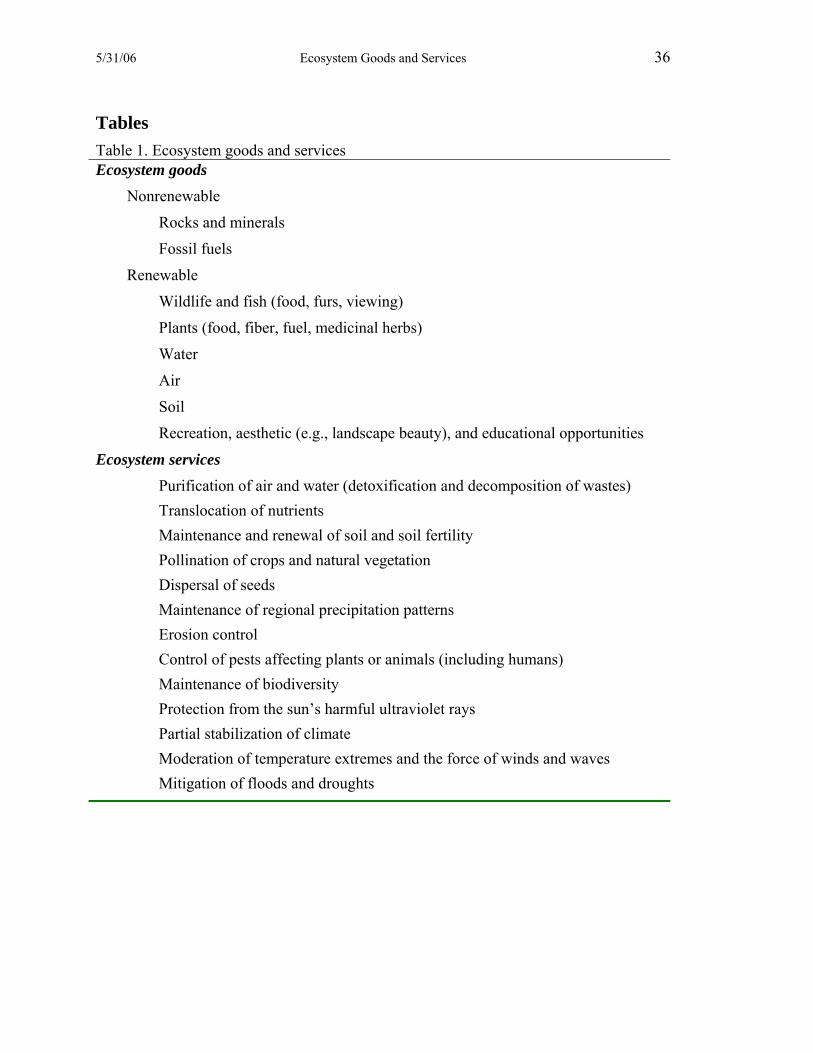
5/31/06 Ecosystem Goods and Services 36
Tables Table 1. Ecosystem goods and services Ecosystem goods Nonrenewable Rocks and minerals Fossil fuels Renewable Wildlife and fish (food, furs, viewing) Plants (food, fiber, fuel, medicinal herbs) Water Air Soil Recreation, aesthetic (e.g., landscape beauty), and educational opportunities
Ecosystem services Purification of air and water (detoxification and decomposition of wastes) Translocation of nutrients Maintenance and renewal of soil and soil fertility Pollination of crops and natural vegetation Dispersal of seeds Maintenance of regional precipitation patterns Erosion control Control of pests affecting plants or animals (including humans) Maintenance of biodiversity Protection from the sun’s harmful ultraviolet rays Partial stabilization of climate Moderation of temperature extremes and the force of winds and waves Mitigation of floods and droughts
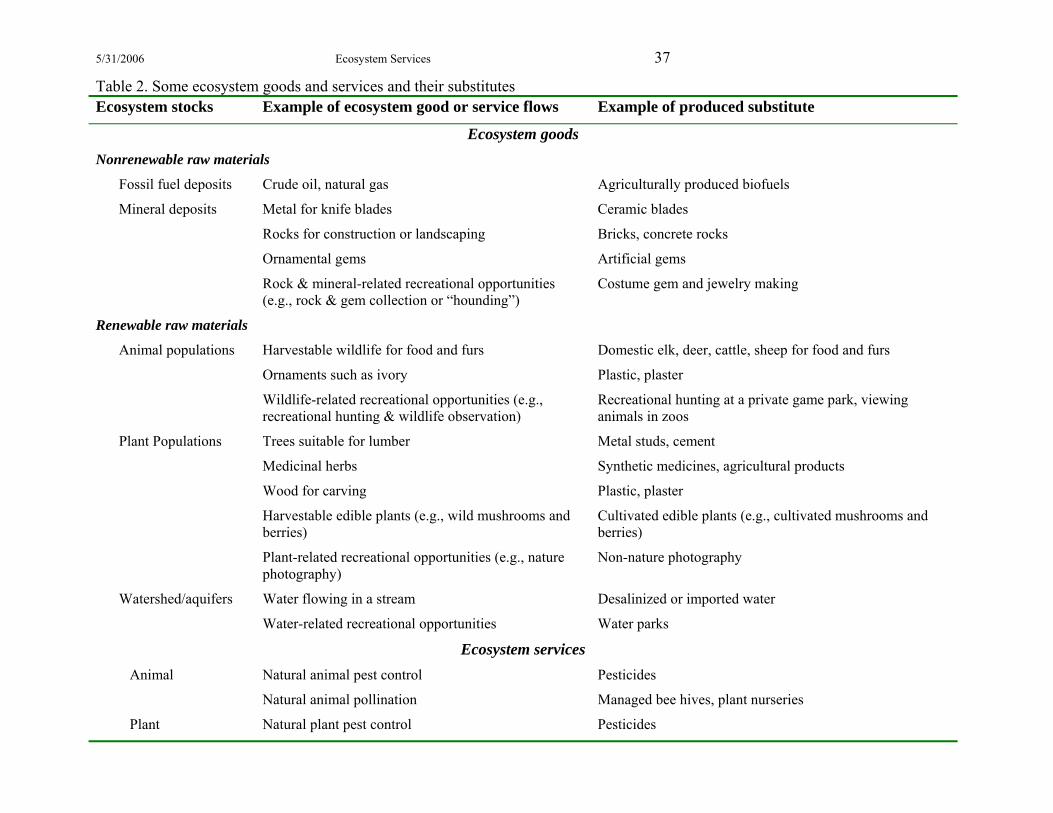
5/31/2006 Ecosystem Services 37
Table 2. Some ecosystem goods and services and their substitutes Ecosystem stocks Example of ecosystem good or service flows Example of produced substitute
Ecosystem goods Nonrenewable raw materials
Fossil fuel deposits Crude oil, natural gas Agriculturally produced biofuels
Mineral deposits Metal for knife blades Ceramic blades
Rocks for construction or landscaping Bricks, concrete rocks
Ornamental gems Artificial gems
Rock & mineral-related recreational opportunities (e.g., rock & gem collection or “hounding”)
Costume gem and jewelry making
Renewable raw materials
Animal populations Harvestable wildlife for food and furs Domestic elk, deer, cattle, sheep for food and furs
Ornaments such as ivory Plastic, plaster
Wildlife-related recreational opportunities (e.g., recreational hunting & wildlife observation)
Recreational hunting at a private game park, viewing animals in zoos
Plant Populations Trees suitable for lumber Metal studs, cement
Medicinal herbs Synthetic medicines, agricultural products
Wood for carving Plastic, plaster
Harvestable edible plants (e.g., wild mushrooms and berries)
Cultivated edible plants (e.g., cultivated mushrooms and berries)
Plant-related recreational opportunities (e.g., nature photography)
Non-nature photography
Watershed/aquifers Water flowing in a stream Desalinized or imported water
Water-related recreational opportunities Water parks
Ecosystem services Animal Natural animal pest control Pesticides
Natural animal pollination Managed bee hives, plant nurseries
Plant Natural plant pest control Pesticides
5/31/2006 Ecosystem Goods and Services 38
Natural plant pollination Plant nurseries
Climate Maintenance of regional precipitation patterns Water importation and irrigation
Temperature maintenance via carbon storage Indoor air conditioning
Soil and water Maintenance of soil fertility Artificial fertilizers
Natural Fertilization Artificial fertilizers
Erosion control Water treatment, dredging
Soil storage of water for later release Dams and reservoirs
Waste assimilation Water treatment facilities
Airshed UV protection Sunblock, sunglasses, clothing
Air purification Air purifiers
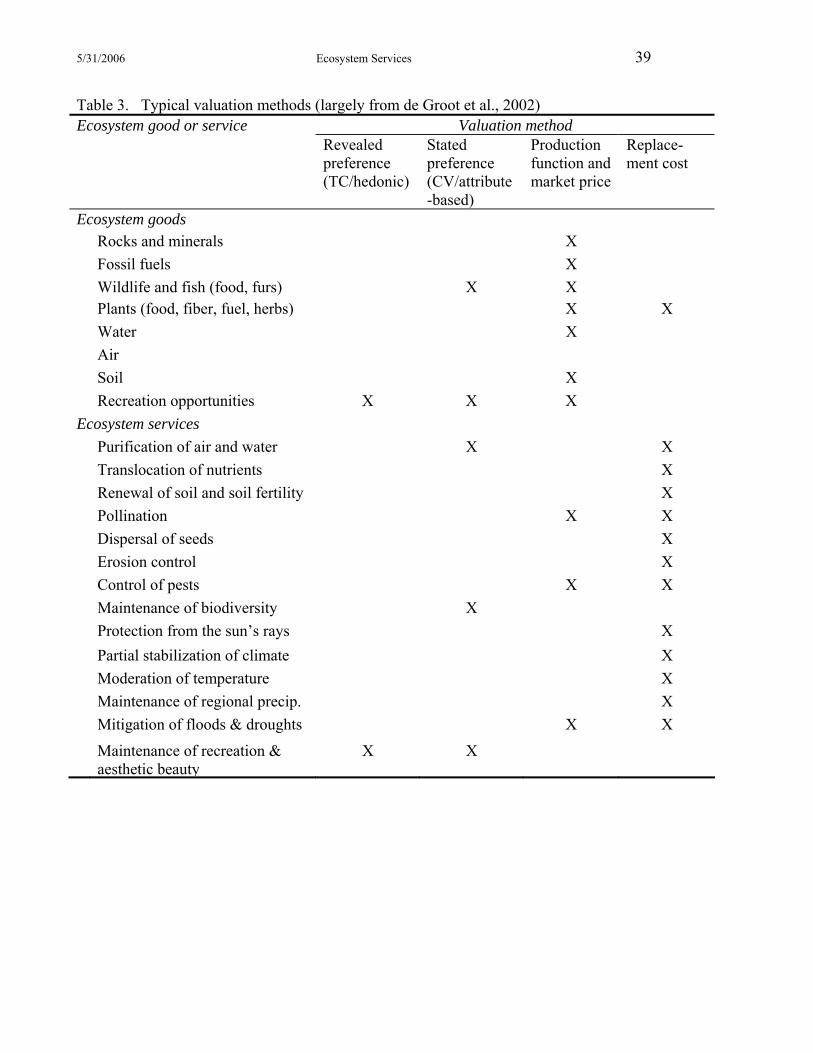
5/31/2006 Ecosystem Services 39
Table 3. Typical valuation methods (largely from de Groot et al., 2002) Ecosystem good or service Valuation method
Revealed preference (TC/hedonic)
Stated preference (CV/attribute-based)
Production function and market price
Replace-ment cost
Ecosystem goods Rocks and minerals X Fossil fuels X Wildlife and fish (food, furs) X X Plants (food, fiber, fuel, herbs) X X Water X Air Soil X Recreation opportunities X X X Ecosystem services Purification of air and water X X Translocation of nutrients X Renewal of soil and soil fertility X Pollination X X Dispersal of seeds X Erosion control X Control of pests X X Maintenance of biodiversity X Protection from the sun’s rays X Partial stabilization of climate X Moderation of temperature X Maintenance of regional precip. X Mitigation of floods & droughts X X
Maintenance of recreation & aesthetic beauty
X X
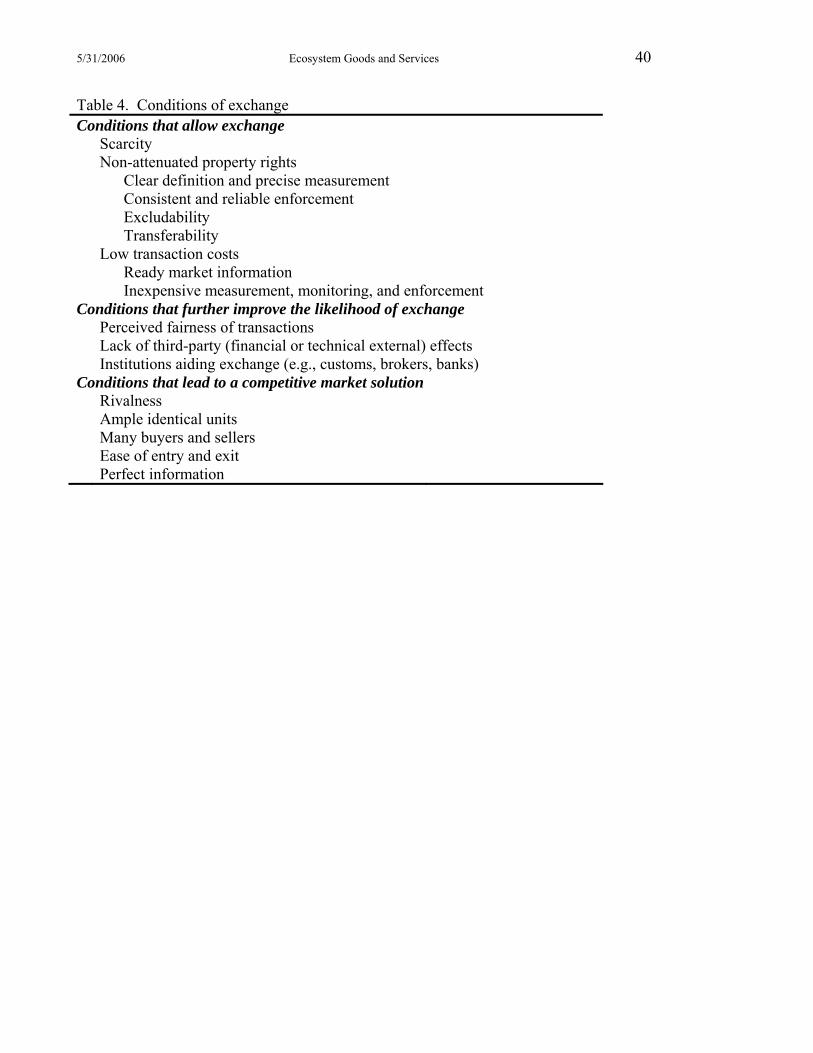
5/31/2006 Ecosystem Goods and Services 40
Table 4. Conditions of exchange Conditions that allow exchange Scarcity Non-attenuated property rights Clear definition and precise measurement Consistent and reliable enforcement Excludability Transferability Low transaction costs Ready market information Inexpensive measurement, monitoring, and enforcement Conditions that further improve the likelihood of exchange Perceived fairness of transactions Lack of third-party (financial or technical external) effects Institutions aiding exchange (e.g., customs, brokers, banks) Conditions that lead to a competitive market solution Rivalness Ample identical units Many buyers and sellers Ease of entry and exit Perfect information
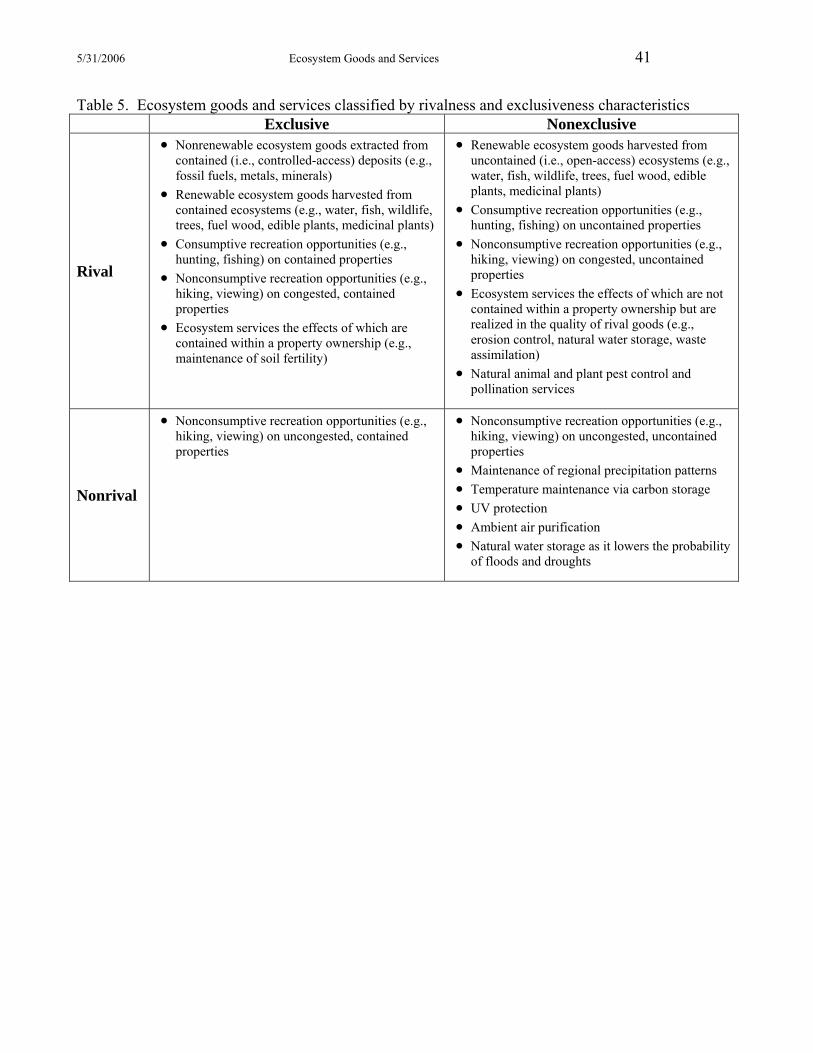
5/31/2006 Ecosystem Goods and Services 41
Table 5. Ecosystem goods and services classified by rivalness and exclusiveness characteristics Exclusive Nonexclusive
Rival
• Nonrenewable ecosystem goods extracted from contained (i.e., controlled-access) deposits (e.g., fossil fuels, metals, minerals)
• Renewable ecosystem goods harvested from contained ecosystems (e.g., water, fish, wildlife, trees, fuel wood, edible plants, medicinal plants)
• Consumptive recreation opportunities (e.g., hunting, fishing) on contained properties
• Nonconsumptive recreation opportunities (e.g., hiking, viewing) on congested, contained properties
• Ecosystem services the effects of which are contained within a property ownership (e.g., maintenance of soil fertility)
• Renewable ecosystem goods harvested from uncontained (i.e., open-access) ecosystems (e.g., water, fish, wildlife, trees, fuel wood, edible plants, medicinal plants)
• Consumptive recreation opportunities (e.g., hunting, fishing) on uncontained properties
• Nonconsumptive recreation opportunities (e.g., hiking, viewing) on congested, uncontained properties
• Ecosystem services the effects of which are not contained within a property ownership but are realized in the quality of rival goods (e.g., erosion control, natural water storage, waste assimilation)
• Natural animal and plant pest control and pollination services
Nonrival
• Nonconsumptive recreation opportunities (e.g., hiking, viewing) on uncongested, contained properties
• Nonconsumptive recreation opportunities (e.g., hiking, viewing) on uncongested, uncontained properties
• Maintenance of regional precipitation patterns • Temperature maintenance via carbon storage • UV protection • Ambient air purification • Natural water storage as it lowers the probability
of floods and droughts
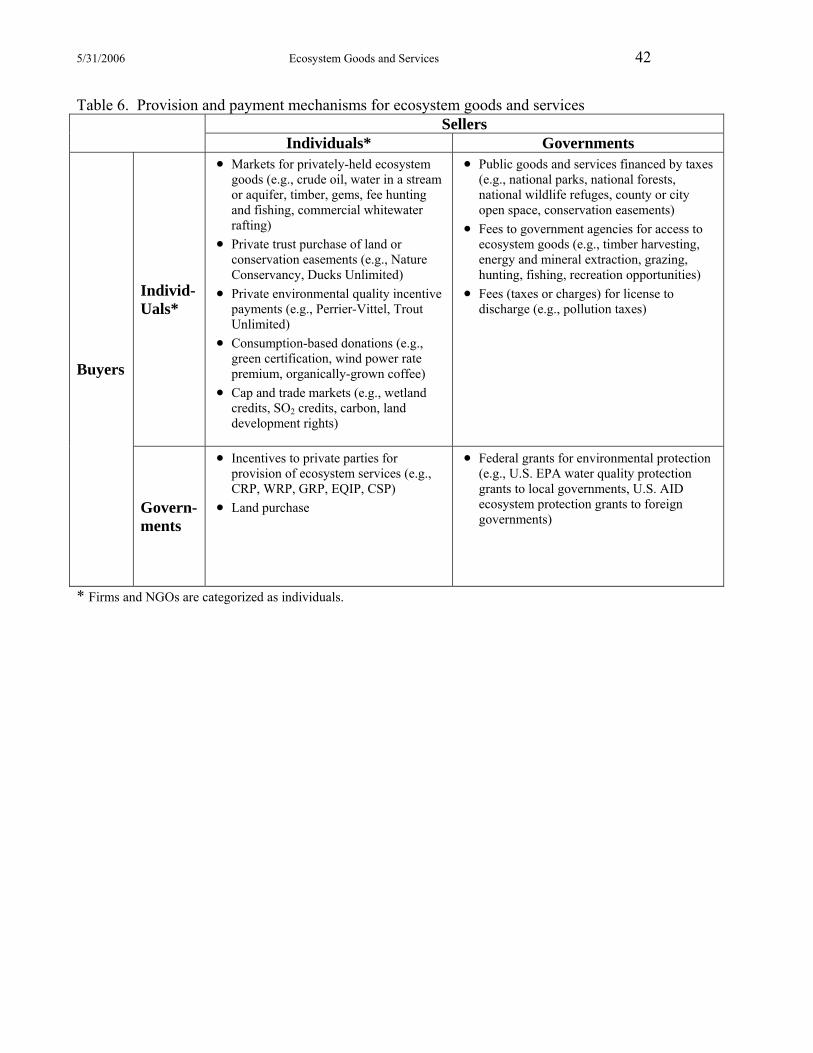
5/31/2006 Ecosystem Goods and Services 42
Table 6. Provision and payment mechanisms for ecosystem goods and services Sellers Individuals* Governments
Individ- Uals*
• Markets for privately-held ecosystem goods (e.g., crude oil, water in a stream or aquifer, timber, gems, fee hunting and fishing, commercial whitewater rafting)
• Private trust purchase of land or conservation easements (e.g., Nature Conservancy, Ducks Unlimited)
• Private environmental quality incentive payments (e.g., Perrier-Vittel, Trout Unlimited)
• Consumption-based donations (e.g., green certification, wind power rate premium, organically-grown coffee)
• Cap and trade markets (e.g., wetland credits, SO2 credits, carbon, land development rights)
• Public goods and services financed by taxes (e.g., national parks, national forests, national wildlife refuges, county or city open space, conservation easements)
• Fees to government agencies for access to ecosystem goods (e.g., timber harvesting, energy and mineral extraction, grazing, hunting, fishing, recreation opportunities)
• Fees (taxes or charges) for license to discharge (e.g., pollution taxes)
Buyers
Govern-ments
• Incentives to private parties for provision of ecosystem services (e.g., CRP, WRP, GRP, EQIP, CSP)
• Land purchase
• Federal grants for environmental protection (e.g., U.S. EPA water quality protection grants to local governments, U.S. AID ecosystem protection grants to foreign governments)
* Firms and NGOs are categorized as individuals.
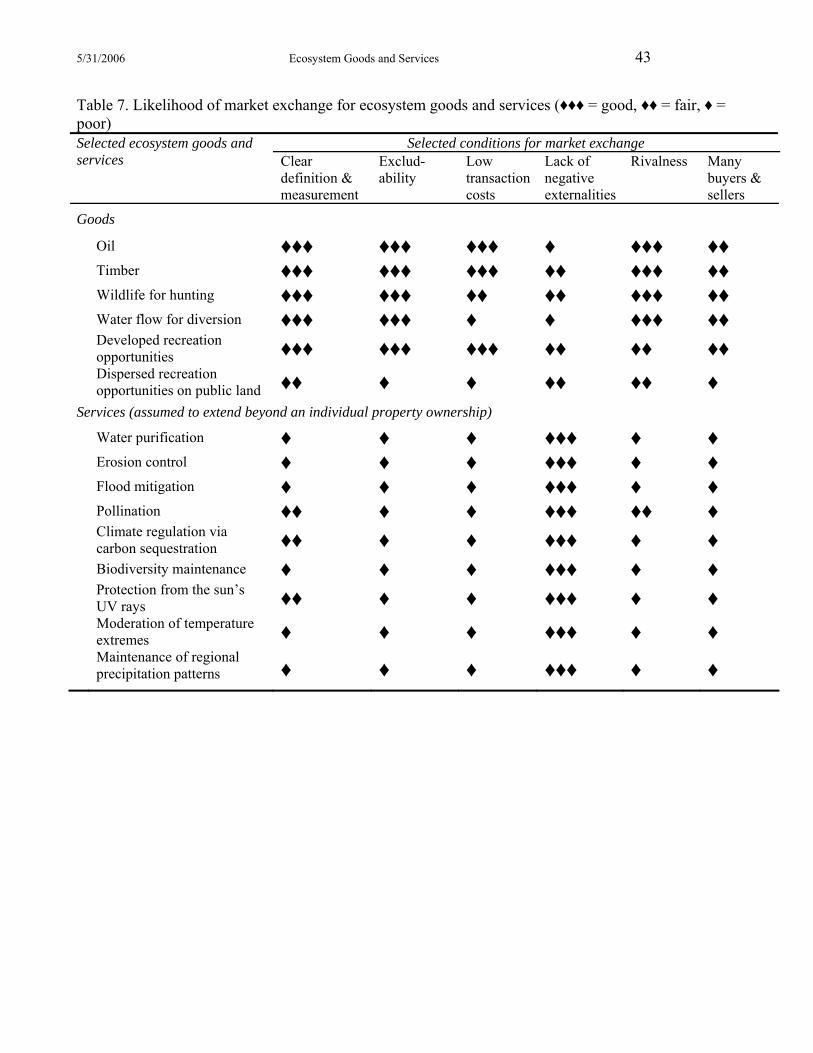
5/31/2006 Ecosystem Goods and Services 43
Table 7. Likelihood of market exchange for ecosystem goods and services (♦♦♦ = good, ♦♦ = fair, ♦ = poor)
Selected conditions for market exchange Selected ecosystem goods and services Clear
definition & measurement
Exclud-ability
Low transaction costs
Lack of negative externalities
Rivalness Many buyers & sellers
Goods
Oil ♦♦♦ ♦♦♦ ♦♦♦ ♦ ♦♦♦ ♦♦ Timber ♦♦♦ ♦♦♦ ♦♦♦ ♦♦ ♦♦♦ ♦♦ Wildlife for hunting ♦♦♦ ♦♦♦ ♦♦ ♦♦ ♦♦♦ ♦♦ Water flow for diversion ♦♦♦ ♦♦♦ ♦ ♦ ♦♦♦ ♦♦ Developed recreation
opportunities ♦♦♦ ♦♦♦ ♦♦♦ ♦♦ ♦♦ ♦♦ Dispersed recreation
opportunities on public land ♦♦ ♦ ♦ ♦♦ ♦♦ ♦ Services (assumed to extend beyond an individual property ownership)
Water purification ♦ ♦ ♦ ♦♦♦ ♦ ♦ Erosion control ♦ ♦ ♦ ♦♦♦ ♦ ♦ Flood mitigation ♦ ♦ ♦ ♦♦♦ ♦ ♦ Pollination ♦♦ ♦ ♦ ♦♦♦ ♦♦ ♦ Climate regulation via
carbon sequestration ♦♦ ♦ ♦ ♦♦♦ ♦ ♦ Biodiversity maintenance ♦ ♦ ♦ ♦♦♦ ♦ ♦ Protection from the sun’s
UV rays ♦♦ ♦ ♦ ♦♦♦ ♦ ♦ Moderation of temperature
extremes ♦ ♦ ♦ ♦♦♦ ♦ ♦
Maintenance of regional precipitation patterns ♦ ♦ ♦ ♦♦♦ ♦ ♦
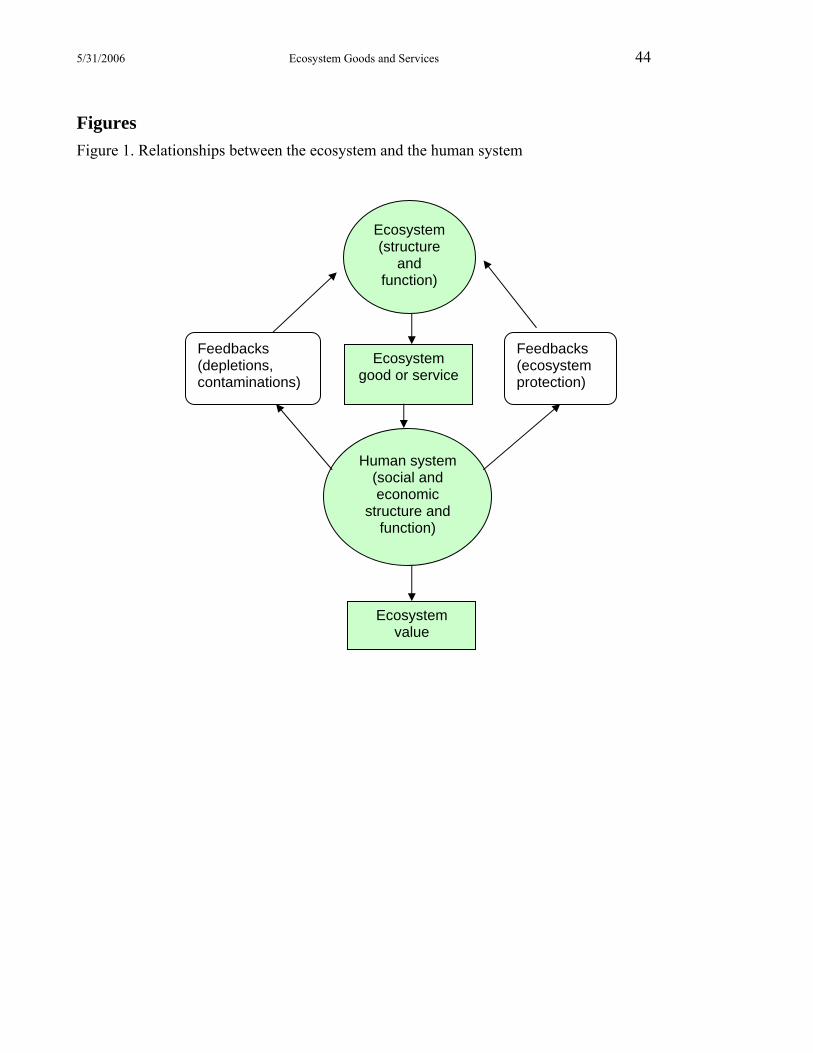
5/31/2006 Ecosystem Goods and Services 44
Figures Figure 1. Relationships between the ecosystem and the human system
Ecosystem good or service
Ecosystem (structure
and function)
Human system (social and economic
structure and function)
Ecosystem value
Feedbacks (ecosystem protection)
Feedbacks (depletions, contaminations)
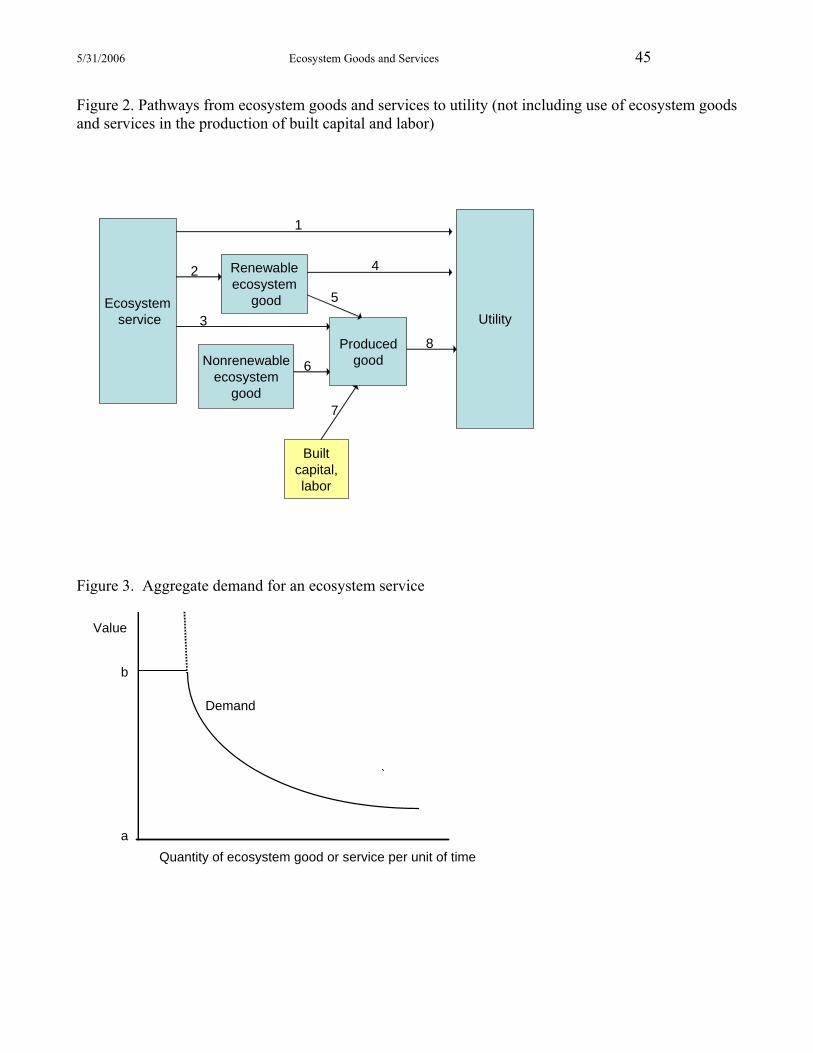
5/31/2006 Ecosystem Goods and Services 45
Figure 2. Pathways from ecosystem goods and services to utility (not including use of ecosystem goods and services in the production of built capital and labor)
Ecosystemservice
Renewableecosystem
goodUtility
ProducedgoodNonrenewable
ecosystemgood
Builtcapital,labor
1
42
5
3
8
6
7
Figure 3. Aggregate demand for an ecosystem service
a
b
Demand
Quantity of ecosystem good or service per unit of time
Value
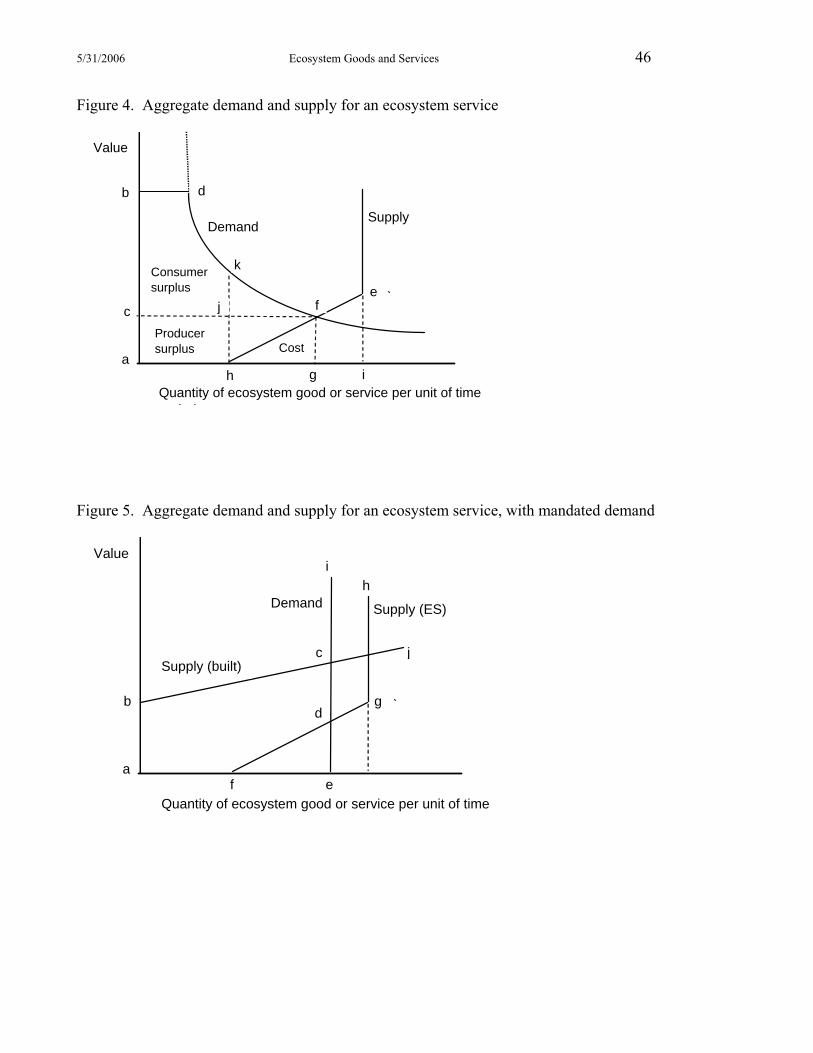
5/31/2006 Ecosystem Goods and Services 46
Figure 4. Aggregate demand and supply for an ecosystem service
a
c
b
e
d
f
gh i
DemandSupply
Consumersurplus
Producer surplus Cost
Quantity of ecosystem good or service per unit of time i d
Value
k
j
Figure 5. Aggregate demand and supply for an ecosystem service, with mandated demand
a
b
c
e
d
f
Demand Supply (ES)
Quantity of ecosystem good or service per unit of time
Value
Supply (built)
g
ih
j
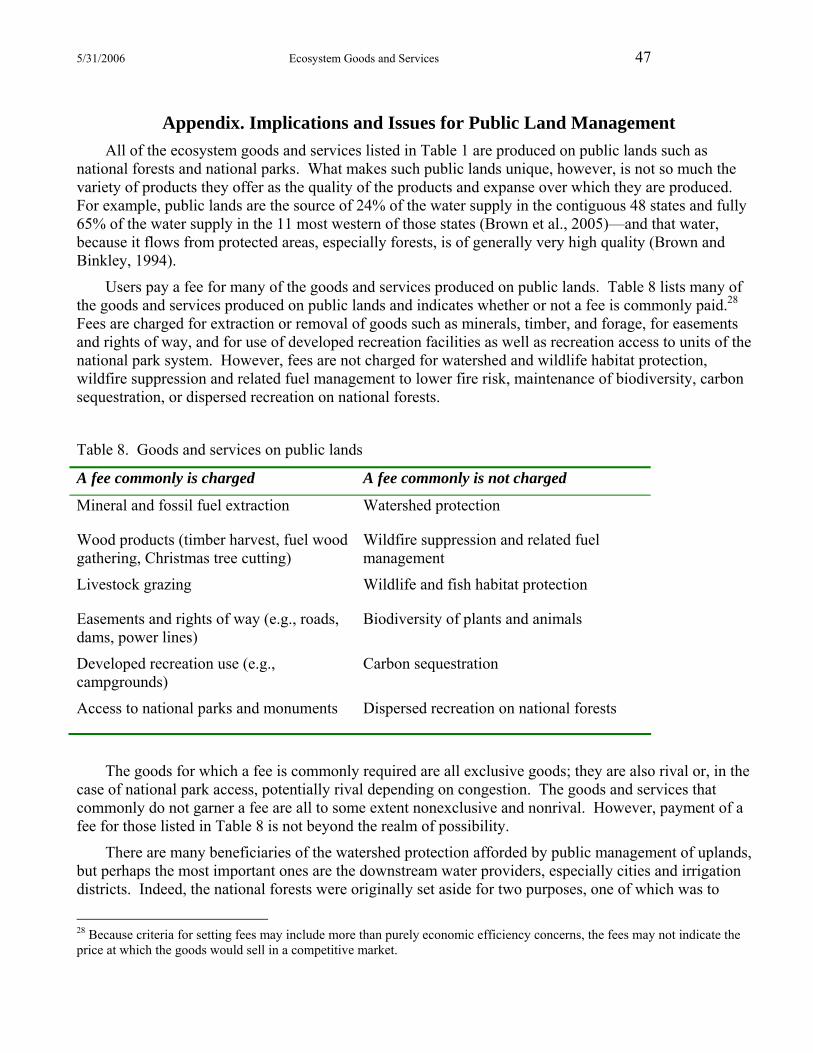
5/31/2006 Ecosystem Goods and Services 47
Appendix. Implications and Issues for Public Land Management All of the ecosystem goods and services listed in Table 1 are produced on public lands such as
national forests and national parks. What makes such public lands unique, however, is not so much the variety of products they offer as the quality of the products and expanse over which they are produced. For example, public lands are the source of 24% of the water supply in the contiguous 48 states and fully 65% of the water supply in the 11 most western of those states (Brown et al., 2005)—and that water, because it flows from protected areas, especially forests, is of generally very high quality (Brown and Binkley, 1994).
Users pay a fee for many of the goods and services produced on public lands. Table 8 lists many of the goods and services produced on public lands and indicates whether or not a fee is commonly paid.28 Fees are charged for extraction or removal of goods such as minerals, timber, and forage, for easements and rights of way, and for use of developed recreation facilities as well as recreation access to units of the national park system. However, fees are not charged for watershed and wildlife habitat protection, wildfire suppression and related fuel management to lower fire risk, maintenance of biodiversity, carbon sequestration, or dispersed recreation on national forests.
Table 8. Goods and services on public lands
A fee commonly is charged A fee commonly is not charged
Mineral and fossil fuel extraction Watershed protection
Wood products (timber harvest, fuel wood gathering, Christmas tree cutting)
Wildfire suppression and related fuel management
Livestock grazing Wildlife and fish habitat protection
Easements and rights of way (e.g., roads, dams, power lines)
Biodiversity of plants and animals
Developed recreation use (e.g., campgrounds)
Carbon sequestration
Access to national parks and monuments Dispersed recreation on national forests
The goods for which a fee is commonly required are all exclusive goods; they are also rival or, in the case of national park access, potentially rival depending on congestion. The goods and services that commonly do not garner a fee are all to some extent nonexclusive and nonrival. However, payment of a fee for those listed in Table 8 is not beyond the realm of possibility.
There are many beneficiaries of the watershed protection afforded by public management of uplands, but perhaps the most important ones are the downstream water providers, especially cities and irrigation districts. Indeed, the national forests were originally set aside for two purposes, one of which was to
28 Because criteria for setting fees may include more than purely economic efficiency concerns, the fees may not indicate the price at which the goods would sell in a competitive market.
5/31/2006 Ecosystem Goods and Services 48
provide for “favorable conditions of water flow,” which essentially is protection of watersheds to maintain the quality and moderate the timing of runoff. Water providers benefit from watershed protection via lower levels of sediment in their reservoirs, pipes, and canals and via lower water treatment costs (Brown, 2000). Although laws typically do not provide for charging downstream water users for the water leaving national forests or other public lands, these water users have a real interest in the management of the watersheds where their water supplies originate. In situations where the public land management agency lacks sufficient funds to adequately protect the watershed—by for example thinning fuels so as to lower the risk of catastrophic wildfire, or managing disturbances such as road cuts so as to limit erosion—the downstream water users may find it to their advantage to form partnerships to assist the public agency with its watershed protection efforts.
Many thousands of houses and other structures are found on private land adjacent to public land, especially in the West. Owners of these properties benefit from public land management efforts to suppress wildfires or to manage fuels so as to lower the chance of wildfire damages. The presence of structures on adjacent private land has raised the cost of fire and fuels management, as wildfires that could once have been left to burn are now more likely to be suppressed. To the extent that fire and fuels management costs are higher than they would be without the adjacent structures, these efforts are essentially a government subsidy to the homeowners. Further, the land management agencies may not have sufficient funding to do all of the fuels management that would protect the adjacent private land to the extent that the landowners would prefer. Thus, opportunities for a private-public partnership exist.
There are also many beneficiaries of wildlife and fish habitat protection on public lands, but perhaps the most notable ones are the hunters and anglers on those lands. Hunting and fishing permits are administered and sold by states, not federal land management agencies, but the states rely on the agencies to maintain the habitat that provides many of the hunting and fishing opportunities, especially in western states with ample public land. The land management agencies regularly make decisions that affect habitat quality as well as the numbers of fish and game animals. For example, numbers of deer and elk reflect overstory management, fire suppression decisions, and the administration of livestock grazing permits (Loomis et al., 1989). Thus the states have an interest in the management of the public lands and benefit monetarily from management that favors hunted and fished species. Again, opportunities exist for partnerships.
Although the agencies charge for use of developed recreation facilities, they do not, except for the Park Service via its entrance fee, tend to charge for dispersed recreation, such as hiking or camping on undeveloped lands. Access points are numerous, so that dispersed recreation is nonexclusive, and the recreationists who use these lands are a diverse, unorganized group, making negotiations difficult to arrange. The agencies could require a permit to recreate, but enforcement would be problematic and expensive.
Protection of biodiversity and sequestering of carbon differ from the aforementioned services in that the beneficiaries of these two services are widespread, including potentially all U.S. citizens and beyond. Thus, these services are probably best provided via taxes of the general population.29
29 One may ask why carbon sequestered on public land could not be sold as credits to entities needing to mitigate carbon emissions under the carbon limits of the Kyoto protocol. Such an arrangement requires a careful analysis, which would, among other things, consider the question of whether vegetation that is already mandated for protection should be eligible for carbon credit.